From: Dieter Eckels Date: January 9, 2015 Subject ... To: Jeff Fulcher, City of Phoenix Public Works...
44
1 To: Jeff Fulcher, City of Phoenix Public Works Department From: Dieter Eckels Date: January 9, 2015 Subject: Residential Characterization Preliminary Findings Since 2008, eight of the ten largest cities in the country (including Phoenix) have begun comprehensive waste characterization studies. These world class cities have used the results to: Increase recycling revenue by diverting more commodities into the recycling stream, Save money on tip fees by reducing the quantity of materials heading to the landfill, Reduce the contamination in recycling loads through targeted education campaigns, Save money by optimizing their collections, processing, and transfer operations, and Develop local recycling markets and create new job in the recycling industry. Increasing waste diversion is a high priority for the City of Phoenix: in early 2013, Mayor Stanton announced his goal to achieve a 40 percent landfill diversion rate by 2020. An important first step on the path to meeting this goal and increasing waste diversion is a well-informed analysis of the composition of Phoenix’s residential waste stream. The 2014 City of Phoenix Residential Waste Characterization Study will collect composition and quantity data that will help guide policy formation and program implementation as the city moves toward its goal of 40 percent diversion by 2020. This study is an update to the previous Phoenix waste characterization study completed in 2003. This memo summarizes the field work and key findings for the first season of this work, which occurred in August 2014. This study characterizes samples from the following two substreams: Residential Garbage – Garbage generated by single family residences located within the City of Phoenix. City collection vehicles collect these materials at the curb or in the alley.
Transcript of From: Dieter Eckels Date: January 9, 2015 Subject ... To: Jeff Fulcher, City of Phoenix Public Works...

1
To: Jeff Fulcher, City of Phoenix Public Works Department
From: Dieter Eckels
Date: January 9, 2015
Subject: Residential Characterization Preliminary Findings
Since 2008, eight of the ten largest cities in the country (including Phoenix) have begun comprehensive waste
characterization studies. These world class cities have used the results to:
Increase recycling revenue by diverting more commodities into the recycling stream,
Save money on tip fees by reducing the quantity of materials heading to the landfill,
Reduce the contamination in recycling loads through targeted education campaigns,
Save money by optimizing their collections, processing, and transfer operations, and
Develop local recycling markets and create new job in the recycling industry.
Increasing waste diversion is a high priority for the City of Phoenix: in early 2013, Mayor Stanton announced
his goal to achieve a 40 percent landfill diversion rate by 2020. An important first step on the path to meeting
this goal and increasing waste diversion is a well-informed analysis of the composition of Phoenix’s residential
waste stream.
The 2014 City of Phoenix Residential Waste Characterization Study will collect composition and quantity data
that will help guide policy formation and program implementation as the city moves toward its goal of 40
percent diversion by 2020. This study is an update to the previous Phoenix waste characterization study
completed in 2003.
This memo summarizes the field work and key findings for the first season of this work, which occurred in
August 2014.
This study characterizes samples from the following two substreams:
Residential Garbage – Garbage generated by single family residences located within the City of
Phoenix. City collection vehicles collect these materials at the curb or in the alley.

2
Residential Recycling – Recycling generated by single family residences located within the City of
Phoenix. City collection vehicles collect these materials at the curb or in the alley.
For the first season of this study (August 2014), the field crew intended to collect and sort 130 garbage and
100 recycling samples over two weeks. Samples were approximately evenly allocated among sampling days
and the 10 bid areas. Field work began on Monday 8/18 and wrapped up on Friday 8/29. Prior to beginning
field work, the project team coordinated with the Public Works Department (PWD) staff to randomly select
routes for sampling and to ensure plans were in place to direct the pre-selected routes to the appropriate tip
location for sampling and sorting. The field crew spent the week of 8/18 collecting and sorting samples at the
North Gateway Transfer Station (NGTS) and the week of 8/25 at the 27th Avenue Transfer Station (27th Ave.).
The sample goals and actual samples collected are shown in Table 1. The largest deviation from sample goals
occurred on Tuesday 8/19, when sampling activities were cancelled around 9:00am due to torrential rains and
regional flooding which delayed or postponed collections due to roadway closures leading to the transfer
station. This weather resulted in consistently low Tuesday sample counts across all bid areas. The field crew
collected additional samples for the rest of the August study period to meet the overall sampling targets.
Table 1. Season One Sampling Goals and Actual Sample Counts
The field crew hand sorted all samples into 84 material types, and weighed the sorted materials. The target
weight for a garbage sample was 200 pounds and for a recycling sample it was 125 pounds. The average
garbage sample weighed 218 pounds and the average recycling sample weighed 130 pounds. In 2003 the
Substream Bid Area Goal Actual Goal Actual Goal Actual Goal Actual Goal Actual Goal Actual
Garbage A 3 3 2 3 3 3 2 1 3 2 13 12
Garbage B 3 3 3 0 2 3 3 3 2 3 13 12
Garbage C 3 3 2 0 3 3 2 3 3 3 13 12
Garbage D 2 3 3 3 3 3 3 3 2 3 13 15
Garbage E 3 3 2 3 3 3 2 3 3 2 13 14
Garbage F 2 3 3 2 2 3 3 3 3 2 13 13
Garbage G 3 3 2 3 3 3 2 3 3 1 13 13
Garbage H 3 3 3 2 2 3 3 2 2 3 13 13
Garbage I 3 3 2 1 3 3 2 3 3 3 13 13
Garbage J 2 2 3 2 3 3 3 3 2 3 13 13
Garbage Subtotal 27 29 25 19 27 30 25 27 26 25 130 130
Recycle A 2 2 2 2 2 3 2 2 2 2 10 11
Recycle B 2 2 2 0 2 2 2 2 2 2 10 8
Recycle C 2 2 2 0 2 2 2 3 2 3 10 10
Recycle D 2 2 2 3 2 2 2 3 2 2 10 12
Recycle E 2 2 2 2 2 3 2 2 2 2 10 11
Recycle F 2 2 2 2 2 2 2 3 2 2 10 11
Recycle G 2 2 2 2 2 2 2 2 2 2 10 10
Recycle H 2 3 2 2 2 2 2 3 2 1 10 11
Recycle I 2 2 2 0 2 2 2 2 2 3 10 9
Recycle J 2 2 2 0 2 1 2 2 2 3 10 8
Recycling Subtotal 20 21 20 13 20 21 20 24 20 22 100 101
Total 47 50 45 32 47 51 45 51 46 47 230 231
Monday Tuesday Wednesday Thursday Friday Total

3
average garbage sample weight was 228 pounds. The 2003 study did not include any recycling samples. The
list of material types and definitions used for this study is included in Appendix A. Material Definitions.
Cascadia analyzed the data from August’s field work to estimate the composition of residential garbage and
recycling citywide, as well as for each bid area. To quantify diversion opportunities, the project team grouped
material types according to their recoverability, using four recoverability groups:
Curbside Recycle – Materials for which recycling technologies, programs, and markets are well
developed, readily available, and currently utilized. These materials are accepted in the current
curbside program.
All Compostables – Organic materials typically accepted for use in commercial compost or digestion
systems.
Other Recoverable – Materials for which recycling technologies, programs, and markets exist, but are
either not well developed or not currently utilized. Examples include grocery/merchandise bags, and
batteries. Third parties frequently recycle these materials through drop-off recycling programs.
Non-recoverable – Materials that are not readily recyclable or face other market-related barriers.
Example problem materials include garbage bags, disposable diapers, and treated wood.
Each material type was assigned to one of the recoverability groups based on the definitions listed above.
Appendix A. Material Definitions shows how material types are categorized into each recoverability group.
Detailed composition tables for each substream, bid area, and citywide are presented in Appendix B.
Detailed Composition Tables.
The composition of residential garbage at the citywide level is summarized in Figure 1 and Table 2. This
composition data is based on 130 hand sorted samples. Tables in this section aggregate the 84 material types
included in field sorting into 25 condensed material categories designed to showcase the curbside recyclables
and compostable materials remaining in the garbage and to make the tables more readable when comparing
the results between bid areas. Many, but not all, materials in the construction and demolition (C&D) category
are included in the Other Recoverable group; because of this the purple slice of the pie in Figure 1 is greater
than the sum of the purple rows in Table 2. Key findings for the citywide residential garbage substream
include:
Nearly two-thirds (65.3%) of the residential garbage consists of material that can be diverted
through standard recycling and composting programs.
Compostable yard waste (30.1%, 117,746 tons) and food waste (14.5%, 56,466 tons) are the two
most prevalent disposed materials. Combined they account for more than 174,000 tons of
material disposed annually and make up nearly half of disposed residential garbage.

4
About 57,500 tons of material that could be recycled through the existing curbside collection
program is being disposed annually. This is approximately 15% of disposed residential garbage.
Table 2. Citywide Garbage Summary Composition, Summer 2014
Figure 1. Citywide Garbage Recoverability, Summer 2014
Compostable yard waste and food waste are the two most prevalent disposed materials in every bid area (and
citywide). Among the bid areas, these materials combined range from nearly 39% of residential garbage in
area G to approximately 53% of residential garbage in area E. Compostable paper is the third most prevalent
material in the residential garbage everywhere except areas E, G, and H. Other recyclable paper is the third
Material % Est. Tons
Paper 14.2% 55,485Newspaper 1.4% 5,345Unwaxed OCC / Kraft paper 1.4% 5,286Other recyclable paper 4.8% 18,823Compostable paper 6.0% 23,238Other paper 0.7% 2,791
Plastic 10.0% 38,972PET (#1) plastic 1.3% 4,882HDPE (#2) plastic 0.5% 2,048Other recyclable plastic (#3-#7 containers) 2.2% 8,545Compostable plastic 0.0% 47Clean plastic film (grocery sacks) 1.4% 5,567Other plastic film (trash bags and food wrappers) 2.9% 11,515Expanded Polystyrene 0.7% 2,823Other plastic 0.9% 3,545
Glass 2.2% 8,494Recyclable glass 1.3% 5,165Other glass 0.9% 3,329
Metal 2.9% 11,178Aluminum cans 0.3% 1,143Tin/steel food cans 0.7% 2,679Other recyclable metals 0.9% 3,576Other metals 1.0% 3,780
Organic 47.1% 183,885Compostable yard waste 30.1% 117,746Food waste 14.5% 56,466Non-compostable organic 2.5% 9,673
Construction and demolition waste* 4.8% 18,633
Household hazardous waste 0.8% 2,970
Other materials 18.2% 70,931
Subtotal Curbside Recycle 14.7% 57,493
Subtotal All Compostable 50.6% 197,497
Total 100.0% 390,548
*
Citywide
Many, but not all, materials in the C&D category are included in the Other Recoverable
group.
Curbside Recycle Compostable
Other Recoverable Non-recoverable
Key:
Curbside Recycle, 57,493
Tons,14.7%
All Compostables, 197,497 Tons,
50.6%
Other Recoverable, 40,123 Tons,
10.3%
Non-recoverable, 95,434 Tons,
24.4%

5
most prevalent material in E and H; non-compostable organics is the third most prevalent material in area G.
Table 3 summarizes the summer sort composition by bid area.
Table 3. Garbage Summary Composition by Bid Area, Summer 2014
As shown in Table 4, more than 60% of residential disposed garbage can be diverted through standard
recycling and composting programs in every bid area. Between 13% and 20% of the residential garbage is
recyclable in every bid area and more than 44% is compostable in every bid area.
Bid Area Composition CitywideMaterial A B C D E F G H I J Composition
Paper 11.9% 12.1% 14.9% 14.0% 11.1% 14.9% 14.6% 19.1% 16.5% 15.3% 14.2%Newspaper 1.0% 1.0% 1.7% 1.4% 0.9% 1.1% 2.1% 1.6% 1.5% 1.3% 1.4%Unwaxed OCC / Kraft paper 1.4% 1.3% 1.5% 1.4% 1.2% 1.2% 0.9% 1.9% 1.5% 1.2% 1.4%Other recyclable paper 3.5% 4.0% 4.7% 4.0% 4.2% 5.0% 5.7% 8.3% 4.3% 5.0% 4.8%Compostable paper 5.2% 5.2% 6.4% 6.6% 4.1% 6.8% 5.3% 6.2% 8.6% 6.9% 6.0%Other paper 0.7% 0.6% 0.6% 0.7% 0.6% 0.8% 0.6% 1.2% 0.6% 0.8% 0.7%
Plastic 12.6% 8.8% 8.4% 9.1% 8.7% 11.9% 10.1% 11.4% 9.5% 9.0% 10.0%PET (#1) plastic 1.3% 1.2% 1.1% 1.2% 1.0% 1.5% 1.3% 1.6% 1.1% 1.2% 1.3%HDPE (#2) plastic 0.6% 0.4% 0.3% 0.6% 0.4% 0.5% 0.6% 0.6% 0.6% 0.5% 0.5%Other recyclable plastic 2.0% 2.1% 1.7% 2.3% 2.4% 2.9% 2.9% 1.9% 1.8% 1.9% 2.2%Compostable plastic 0.0% 0.1% 0.0% 0.0% 0.0% 0.0% 0.0% 0.0% 0.0% 0.0% 0.0%Clean plastic film (grocery sacks) 1.7% 1.2% 1.1% 1.3% 1.1% 1.4% 1.7% 2.1% 1.4% 1.2% 1.4%Other plastic film 4.8% 2.5% 2.6% 2.5% 2.1% 4.2% 2.0% 3.0% 3.0% 2.8% 2.9%Expanded Polystyrene 1.1% 0.4% 0.6% 0.6% 0.7% 0.7% 0.7% 1.1% 0.6% 0.5% 0.7%Other plastic 1.0% 1.0% 1.0% 0.6% 1.0% 0.7% 0.9% 1.1% 0.9% 0.8% 0.9%
Glass 2.2% 1.5% 1.5% 2.1% 2.1% 2.9% 1.9% 2.7% 2.0% 3.4% 2.2%Recyclable glass 1.3% 1.1% 0.8% 1.3% 1.1% 1.8% 1.1% 1.9% 1.1% 2.0% 1.3%Other glass 0.9% 0.4% 0.7% 0.8% 1.1% 1.1% 0.8% 0.7% 0.9% 1.3% 0.9%
Metal 2.4% 2.2% 4.9% 2.9% 1.9% 2.6% 1.6% 3.2% 3.5% 4.5% 2.9%Aluminum cans 0.3% 0.4% 0.2% 0.3% 0.2% 0.3% 0.2% 0.4% 0.3% 0.4% 0.3%Tin/steel food cans 0.9% 0.5% 0.5% 0.6% 0.6% 0.8% 0.6% 1.1% 0.5% 0.6% 0.7%Other recyclable metals 0.7% 0.5% 0.6% 1.1% 0.9% 0.7% 0.6% 1.0% 1.7% 2.2% 0.9%Other metals 0.5% 0.7% 3.6% 0.9% 0.2% 0.7% 0.3% 0.6% 1.0% 1.4% 1.0%
Organic 50.2% 48.8% 46.2% 45.1% 52.7% 47.6% 44.7% 42.6% 44.7% 45.7% 47.1%Compostable yard waste 32.0% 35.5% 29.2% 29.0% 42.3% 27.4% 25.2% 24.8% 21.8% 28.3% 30.1%Food waste 13.5% 12.8% 16.1% 13.3% 10.2% 18.5% 13.6% 17.1% 17.2% 15.0% 14.5%Non-compostable organic 4.8% 0.4% 0.8% 2.8% 0.2% 1.7% 5.9% 0.7% 5.7% 2.4% 2.5%
Construction and demolition waste 7.4% 5.6% 5.2% 3.4% 6.1% 2.5% 5.9% 3.0% 2.6% 3.5% 4.8%
Household hazardous waste 0.6% 1.0% 0.9% 0.9% 0.5% 0.9% 0.4% 1.3% 0.8% 0.5% 0.8%
Other materials 12.7% 20.1% 18.0% 22.6% 16.9% 16.8% 20.8% 16.8% 20.4% 18.2% 18.2%
Subtotal Curbside Recycle 13.1% 12.5% 13.1% 14.0% 13.0% 15.8% 15.9% 20.4% 14.5% 16.4% 14.7%
Subtotal Compostable 50.7% 53.7% 51.7% 48.8% 56.7% 52.7% 44.2% 48.1% 47.6% 50.3% 50.6%
Total 100.0% 100.0% 100.0% 100.0% 100.0% 100.0% 100.0% 100.0% 100.0% 100.0% 100.0%
Key: Curbside Recycle Compostable Non-recoverableOther Recoverable

6
Table 4. Garbage Recoverability by Bid Area, Summer 2014
Working with PWD staff, Cascadia designed the material list used in the current study to be comparable to the
material list used in the 2003 study. Results in this section aggregate the 84 material types used in the 2014
study into a condensed list of 22 materials that nearly match the 2003 study and showcase the curbside
recyclables and compostable materials in the garbage. The aggregations are shown in Appendix A. Material
Definitions. The totals and subtotals shown in this section are slightly different than those in other sections
because of the aggregations necessary to accommodate the differences between the 2003 and 2014 material
lists.1
Based on PWD provided tonnage information, the total quantity of garbage has decreased by approximately
10% since 2003 from nearly 435,000 tons to nearly 391,000 tons. The proportion of most recyclable or
compostable materials also decreased between the 2003 and 2014 studies; exceptions include compostable
paper, PET (#1) plastic, and compostable yard waste, all of which increased between studies. This information
is detailed in Table 5.
Compared to 2003, both the quantity of recyclable materials in the garbage and the proportion of garbage
that is recyclable have decreased. In 2003, recyclables were nearly 19% of the garbage; in 2014, recyclables
(as defined for this comparison) are nearly 13% of the garbage.
The quantity of compostables in the residential garbage decreased from nearly 215,000 tons in 2003 to
approximately 197,000 tons in 2014. This is due primarily to the overall reduction in garbage tonnage
between the two studies, as the proportion of compostables in the garbage increased slightly from 2003 to
1 The 2014 material list is designed to reflect the range of recyclable and compostable items currently of interest to PWD. Some of the material types in the 2014 list didn’t exist in 2003 (compostable plastic) and some 2014 material types were a subset of another material type in 2003 (mixed rigid plastics). The 2014 material types compostable plastic and mixed rigid plastics are included in the material category other plastic to make the 2003 and 2014 compositions more directly comparable.
Bid Area Composition CitywideCategory A B C D E F G H I J Composition
Recyclable 13.1% 12.5% 13.1% 14.0% 13.0% 15.8% 15.9% 20.4% 14.5% 16.4% 14.7%Recyclable papers 6.0% 6.3% 7.9% 6.8% 6.4% 7.3% 8.7% 11.8% 7.3% 7.5% 7.5%Recyclable plastics 4.0% 3.7% 3.1% 4.0% 3.9% 4.8% 4.8% 4.1% 3.5% 3.7% 4.0%Recyclable glass 1.3% 1.1% 0.8% 1.3% 1.1% 1.8% 1.1% 1.9% 1.1% 2.0% 1.3%Recyclable metals 1.9% 1.4% 1.3% 1.9% 1.7% 1.9% 1.3% 2.5% 2.5% 3.2% 1.9%
Compostable 50.7% 53.7% 51.7% 48.8% 56.7% 52.7% 44.2% 48.1% 47.6% 50.3% 50.6%Compostable paper 5.2% 5.2% 6.4% 6.6% 4.1% 6.8% 5.3% 6.2% 8.6% 6.9% 6.0%Compostable plastic 0.0% 0.1% 0.0% 0.0% 0.0% 0.0% 0.0% 0.0% 0.0% 0.0% 0.0%Compostable yard waste 32.0% 35.5% 29.2% 29.0% 42.3% 27.4% 25.2% 24.8% 21.8% 28.3% 30.1%Food waste 13.5% 12.8% 16.1% 13.3% 10.2% 18.5% 13.6% 17.1% 17.2% 15.0% 14.5%
Other 36.3% 33.8% 35.2% 37.2% 30.3% 31.5% 39.9% 31.5% 37.9% 33.3% 34.7%
Total 100.0% 100.0% 100.0% 100.0% 100.0% 100.0% 100.0% 100.0% 100.0% 100.0% 100.0%
Key: Curbside Recycle Compostable Non-recoverableOther Recoverable

7
2014 (from 49.4% to 50.6%). See Table 6 for the comparison of the citywide garbage recoverability between
study years.
Table 5. Citywide Garbage Summary Comparison, Summer 2014 and 2003
Material
2014
Comp.
2014
Est. Tons
2003
Comp.
2003
Est. Tons
Paper 14.2% 55,485 18.3% 79,412Newspaper 1.4% 5,345 2.7% 11,729Unwaxed OCC / Kraft paper 1.4% 5,286 2.9% 12,597Other recyclable paper 4.8% 18,823 6.7% 29,152Compostable paper 6.0% 23,238 4.5% 19,682Other paper 0.7% 2,791 1.4% 6,253
Plastic 10.0% 38,972 8.3% 36,176PET (#1) plastic 1.3% 4,882 0.7% 3,041HDPE (#2) plastic 0.5% 2,048 0.7% 2,931Clean plastic film (grocery sacks) 1.4% 5,567 0.9% 3,909Other plastic film 2.9% 11,515 2.5% 10,742Expanded polystyrene 0.7% 2,823 0.5% 2,061Other plastic 3.1% 12,137 3.1% 13,491
Glass 2.2% 8,494 2.5% 10,693Recyclable glass 1.3% 5,165 2.2% 9,616Other glass 0.9% 3,329 0.2% 1,076
Metal 2.9% 11,178 4.4% 18,994Aluminum cans 0.3% 1,143 0.5% 2,052Tin/steel food cans 0.7% 2,679 1.0% 4,414Other recyclable metals 0.9% 3,576 1.2% 5,382Other metals 1.0% 3,780 1.6% 7,146
Organic 44.6% 174,212 44.9% 195,176Compostable yard waste 30.1% 117,746 28.1% 122,258Food waste 14.5% 56,466 16.8% 72,918
Construction and demolition waste 4.8% 18,633 7.3% 31,614
Household hazardous waste 0.8% 2,970 0.4% 1,683
Other materials 20.6% 80,604 14.0% 61,035
Subtotal Curbside Recycle 12.5% 48,948 18.6% 80,914
Subtotal All Compostable 50.6% 197,451 49.4% 214,858
Total 100.0% 390,548 100.0% 434,783
Citywide
Curbside Recycle Compostable
Other Recoverable Non-recoverable
Key:

8
Table 6. Citywide Garbage Recoverability, Summer 2014 and 2003
While in the field, the garbage sort crew noted loads that contained items too large or bulky for a Material
Recovery Facility (MRF) to handle (appliances, furniture, tires, large stumps, concrete, etc.). The type of
material and the number of items spotted were noted for all sampled loads. Of the 130 loads sampled in
August 2014, four loads contained bulky items (3% of loads). There was one load from area A, one from area
C, one from area H, and one from area J. The loads from areas A and H each contained one tire. The load from
area C contained a large microwave and the load from area J contained a dishwasher.
Category
2014
Comp.
2014
Est. Tons
2003
Comp.
2003
Est. Tons
Recyclable 12.5% 48,948 18.6% 80,914Recyclable papers 7.5% 29,455 12.3% 53,478Recyclable plastics 1.8% 6,930 1.4% 5,971Recyclable glass 1.3% 5,165 2.2% 9,616Recyclable metals 1.9% 7,398 2.7% 11,848
Compostable 50.6% 197,451 49.4% 214,858Compostable paper 6.0% 23,238 4.5% 19,682Compostable yard waste 30.1% 117,746 28.1% 122,258Food waste 14.5% 56,466 16.8% 72,918
Other 36.9% 144,149 32.0% 139,011
Total 100.0% 390,548 100.0% 434,783
Citywide
Key: Curbside Recycle Compostable
Other Recoverable Non-recoverable

9
The recycling composition data is based on 101 hand
sorted samples. Tables in this section aggregate the 84
material types using during field sorting into 21 condensed
material categories designed to showcase the acceptable
and contaminant materials in the recycling substream and
to make the tables more readable when comparing the
results between bid areas. Many, but not all, materials in
the construction and demolition (C&D) category are
included in the Other Recoverable group; because of this
the purple slice of the pie in Figure 2 is greater than the
sum of the purple rows in Table 7.
More than three quarters (80,435 tons) of the recycling
substream is Curbside Recycle, mostly recyclable paper
(55,307 tons). The composition of residential recycling at
the citywide level is summarized by recoverability group in
Figure 2. Approximately 21% of the recycling substream is
contaminants, materials that should not be in the recycling bin. Citywide, the five most prevalent
contaminant material types are:
Non-distinct fines, (2.7%, 2,734 tons). This is material smaller than 2" in diameter including dirt,
broken glass, bottle caps, loose shredded paper, and small pieces of food.
Textiles, (2.5%, 2,582 tons). This includes items mostly made of natural or synthetic fabrics such as
pants, shirts, bed sheets, curtains, and towels. This does not include leather items.
Other plastic film, (1.8%, 1,863 tons). This does not include grocery bags or trash bags. It includes
most other plastic film such as chip bags, candy wrappers, frozen food bags, shower curtains, and
inflatable mattresses.
Purchased food, (1.5%, 1,523 tons). This includes most home food waste such as peels, bones, and
unconsumed edible food.
Compostable/food soiled paper, (1.5%, 1,515 tons). This includes paper towels, paper plates,
waxed paper, tissues, and other food service/food soiled paper products without a plastic coating.
The citywide recycling composition is summarized in Table 7. More detail on the recycling contamination is
available in the Recycling Contamination section below.
Curbside Recycle, 80,435
Tons,78.9%
All Compostables,
4,272 Tons,4.2%
Other Recoverable, 5,829 Tons,
5.7%
Non-recoverable, 11,346 Tons,
11.1%
Figure 2. Citywide Recycling Recoverability, Summer 2014

10
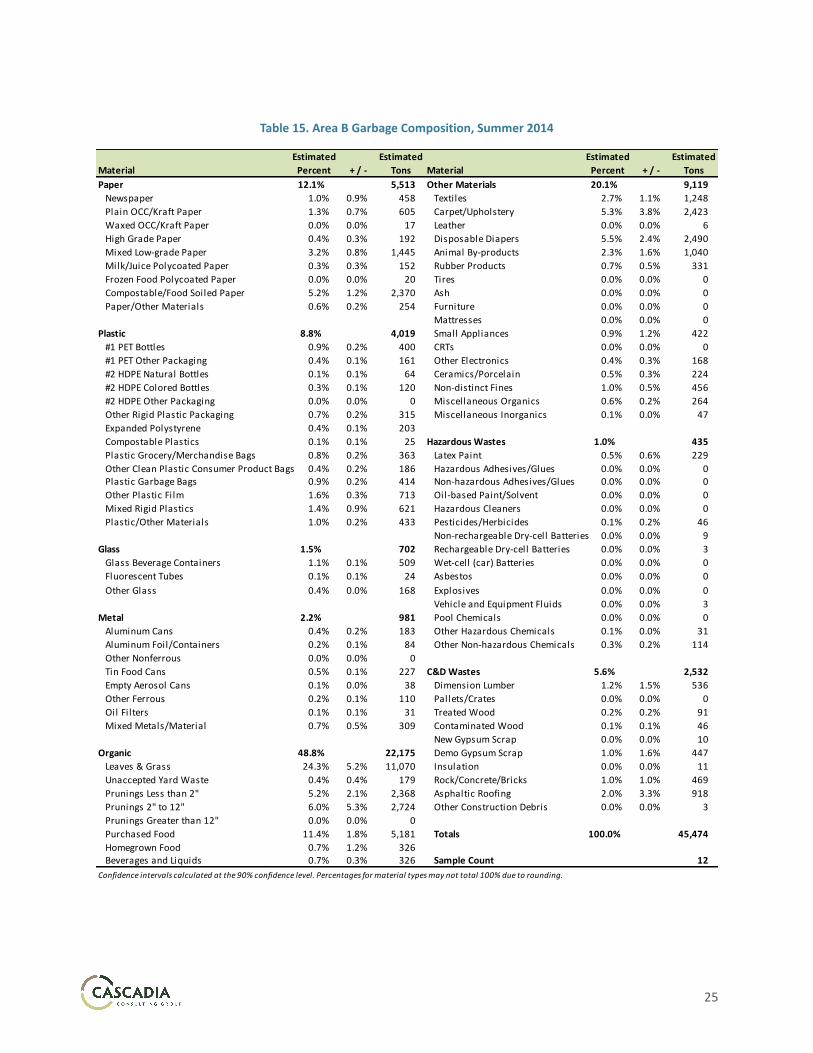
Table 7. Citywide Recycling Summary Composition, Summer 2014
Table 8 summarizes the summer sort composition by bid area. Other recyclable paper and unwaxed
OCC/Kraft paper are the two most prevalent materials in every bid area (and citywide) except area D (other
recyclable paper and newspaper are the two most prevalent in D). Among the bid areas, the top two
materials combined range from approximately 38% of recycling composition in area G to nearly 51% of
recycling composition in area C. Newspaper is the third most prevalent material everywhere except in areas A
D, G, and H. Recyclable glass (areas A and G), unwaxed OCC/kraft paper (area D), and PET (#1) (area H) plastic
(area H) are the third most prevalent materials in those areas.
Material % Est. Tons
Paper 57.1% 58,202Newspaper 9.9% 10,041Unwaxed OCC / Kraft paper 19.4% 19,754Other recyclable paper 25.0% 25,512Other paper 2.8% 2,895
Plastic 17.4% 17,758PET (#1) plastic 5.3% 5,442HDPE (#2) plastic 3.7% 3,734Other recyclable plastic 3.7% 3,763Clean plastic film (grocery sacks) 0.9% 896Other plastic film 2.2% 2,208Expanded Polystyrene 0.6% 657Other plastic 1.0% 1,057
Glass 8.6% 8,760Recyclable glass 8.2% 8,383Other glass 0.4% 377
Metal 4.2% 4,308Aluminum cans 1.0% 1,060Tin/steel food cans 1.5% 1,512Other recyclable metals 1.2% 1,234Other metals 0.5% 502
Organic 2.7% 2,792
Construction and demolition waste* 1.4% 1,423
Household hazardous waste 0.2% 199
Other materials 8.3% 8,440
Subtotal Curbside Recycle 78.9% 80,435
Subtotal Contaminants 21.1% 21,447
Total 100.0% 101,882
*
Citywide
Many, but not all, materials in the C&D category are included in the
Other Recoverable group.
Curbside Recycle Compostable
Other Recoverable Non-recoverable
Key:

11
Table 8. Recycling Summary Composition by Bid Area, Summer 2014
Citywide, the recycling contamination rate is approximately 21%. As shown in Table 9, the contamination rate
ranges from less than 16% in area J to nearly one third (32.1%) in area A. Table 9 also summarizes the five
most prevalent contaminant material types in each bid area and citywide. Non-distinct fines and textiles are
the only material types in the top five in every bid area; citywide, they are the two most prevalent
contaminants. Other film is in the top five in eight of the ten bid areas and citywide. Carpet/upholstery,
disposable diapers, and contaminated wood each were in the top five in one bid area (areas E, G, and I
respectively). The top five contaminants comprise between 45% and 62% of the total contamination in each
bid area and citywide.
Bid Area Composition CitywideMaterial A B C D E F G H I J Composition
Paper 48.0% 59.5% 63.8% 62.0% 54.4% 59.9% 45.7% 54.1% 56.2% 63.0% 57.1%Newspaper 6.2% 9.8% 9.5% 18.3% 10.2% 14.0% 4.8% 5.7% 9.7% 9.4% 9.9%Unwaxed OCC / Kraft paper 18.4% 20.0% 19.6% 14.5% 15.1% 17.6% 18.5% 24.1% 20.4% 26.2% 19.4%Other recyclable paper 20.7% 27.1% 31.0% 25.9% 27.0% 26.3% 19.6% 21.3% 24.1% 23.9% 25.0%Other paper 2.7% 2.7% 3.7% 3.3% 2.2% 2.1% 2.9% 3.0% 2.1% 3.4% 2.8%
Plastic 17.7% 19.1% 15.9% 14.3% 15.8% 16.7% 21.1% 22.6% 15.9% 16.1% 17.4%PET (#1) plastic 5.3% 6.3% 5.0% 4.1% 4.5% 5.4% 6.5% 6.4% 4.6% 5.5% 5.3%HDPE (#2) plastic 4.0% 4.6% 2.9% 2.6% 3.3% 3.1% 4.9% 4.9% 3.5% 3.4% 3.7%Other recyclable plastic 3.2% 4.1% 2.8% 4.2% 4.1% 3.9% 3.9% 4.0% 3.7% 3.5% 3.7%Clean plastic film (grocery sacks) 0.9% 1.0% 0.7% 0.6% 0.7% 1.2% 1.3% 0.9% 0.8% 0.8% 0.9%Other plastic film 2.7% 1.8% 2.5% 1.5% 2.0% 2.0% 2.9% 2.5% 1.8% 2.0% 2.2%Expanded Polystyrene 0.8% 0.5% 0.6% 0.7% 0.8% 0.4% 0.7% 0.8% 0.5% 0.6% 0.6%Other plastic 0.8% 0.9% 1.5% 0.6% 0.4% 0.6% 0.9% 3.1% 1.0% 0.4% 1.0%
Glass 6.7% 8.0% 7.4% 10.3% 9.5% 10.5% 10.2% 6.0% 9.7% 8.8% 8.6%Recyclable glass 6.2% 7.9% 7.3% 9.8% 8.2% 10.1% 9.9% 5.7% 9.2% 8.7% 8.2%Other glass 0.5% 0.1% 0.1% 0.5% 1.3% 0.4% 0.3% 0.3% 0.4% 0.1% 0.4%
Metal 4.1% 4.6% 4.4% 3.8% 4.0% 3.5% 4.4% 4.1% 5.5% 4.0% 4.2%Aluminum cans 0.7% 1.0% 1.3% 1.0% 0.8% 1.3% 0.6% 0.9% 1.4% 1.3% 1.0%Tin/steel food cans 1.4% 1.6% 1.4% 1.4% 1.8% 1.2% 1.5% 1.7% 1.1% 2.0% 1.5%Other recyclable metals 1.7% 1.3% 1.0% 0.6% 0.9% 0.7% 2.0% 1.2% 2.3% 0.7% 1.2%Other metals 0.2% 0.8% 0.7% 0.8% 0.5% 0.3% 0.4% 0.3% 0.7% 0.0% 0.5%
Organic 6.7% 1.2% 1.1% 3.2% 4.0% 1.4% 5.3% 2.0% 2.3% 1.4% 2.7%
Construction and demolition waste 3.8% 0.9% 1.0% 0.4% 2.1% 0.6% 1.1% 0.5% 2.9% 0.7% 1.4%
Household hazardous waste 0.4% 0.1% 0.1% 0.1% 0.1% 0.0% 0.4% 0.2% 0.1% 0.6% 0.2%
Other materials 12.6% 6.7% 6.4% 5.9% 10.0% 7.3% 11.8% 10.7% 7.4% 5.5% 8.3%
Subtotal Curbside Recycle 67.9% 83.6% 81.7% 82.4% 75.8% 83.5% 72.1% 75.9% 79.9% 84.6% 78.9%
Subtotal Contaminants 32.1% 16.4% 18.3% 17.6% 24.2% 16.5% 27.9% 24.1% 20.1% 15.4% 21.1%
Total 100.0% 100.0% 100.0% 100.0% 100.0% 100.0% 100.0% 100.0% 100.0% 100.0% 100.0%
Key: Curbside Recycle Compostable Non-recoverableOther Recoverable

12
Table 9. Acceptable and Contaminant Materials in the Recycling by Bid Area, Summer 2014
The five most prevalent contaminants in each bid area and citywide are shown in Table 10.
Table 10. Top Five Contaminants by Bid Area, Summer 2014
Bid Area Composition CitywideA B C D E F G H I J Composition
Recyclable 67.9% 83.6% 81.7% 82.4% 75.8% 83.5% 72.1% 75.9% 79.9% 84.6% 78.9%Recyclable papers 45.3% 56.9% 60.1% 58.7% 52.2% 57.8% 42.8% 51.1% 54.2% 59.6% 54.3%Recyclable plastics 12.5% 15.0% 10.6% 10.9% 11.9% 12.4% 15.2% 15.3% 11.8% 12.4% 12.7%Recyclable glass 6.2% 7.9% 7.3% 9.8% 8.2% 10.1% 9.9% 5.7% 9.2% 8.7% 8.2%Recyclable metals 3.8% 3.8% 3.7% 3.0% 3.5% 3.2% 4.1% 3.8% 4.7% 3.9% 3.7%
Common Contaminants
Non-distinct fines 4.1% 2.1% 1.2% 2.4% 3.6% 2.8% 4.4% 3.0% 2.5% 1.6% 2.7%Textiles 3.4% 2.0% 3.7% 1.5% 2.1% 2.0% 2.6% 2.8% 2.0% 3.0% 2.5%
Leaves & grass 3.1% 2.0%Other plastic film 2.2% 1.5% 2.2% 1.6% 2.4% 2.2% 1.5% 1.7% 1.8%Purchased food 2.2% 1.8% 1.6% 3.6% 1.5% 1.5%Other electronics 1.9% 1.7%Compostable/food soiled paper 1.8% 1.4% 1.1% 2.1% 2.2% 1.5%
Paper/other materials 2.4% 1.9% 1.2%Plastic/other materials 1.5% 3.1%Carpet/upholstery 1.6%Disposable diapers 2.6%Contaminated wood 1.6%Sum of Top Five Contaminants 15.0% 9.3% 11.0% 9.0% 10.9% 9.2% 15.6% 13.2% 9.0% 9.6% 10.0%
All Other Contaminants 17.1% 7.1% 7.3% 8.6% 13.3% 7.3% 12.3% 10.9% 11.1% 5.8% 11.0%
Total Contaminants 32.1% 16.4% 18.3% 17.6% 24.2% 16.5% 27.9% 24.1% 20.1% 15.4% 21.1%
Total Composition 100.0% 100.0% 100.0% 100.0% 100.0% 100.0% 100.0% 100.0% 100.0% 100.0% 100.0%
Key: Curbside Recycle Compostable Non-recoverableOther Recoverable
Rank A B C D
#1 Non-distinct Fines, 4.1% Non-distinct Fines, 2.1% Textiles, 3.7% Non-distinct Fines, 2.4%#2 Textiles, 3.4% Textiles, 2% Paper/Other Materials, 2.4% Paper/Other Materials, 1.9%#3 Leaves & Grass, 3.1% Other Electronics, 1.9% Other Film, 2.2% Purchased Food, 1.8%#4 Other Film, 2.2% Compostable/Food Soiled Paper, 1.8% Plastic/Other Materials, 1.5% Textiles, 1.5%#5 Purchased Food, 2.2% Other Film, 1.5% Non-distinct Fines, 1.2% Compostable/Food Soiled Paper, 1.4%
Bid Area Top Five Contaminants and Composition
Rank E F G H
#1 Non-distinct Fines, 3.6% Non-distinct Fines, 2.8% Non-distinct Fines, 4.4% Plastic/Other Materials, 3.1%#2 Textiles, 2.1% Textiles, 2% Purchased Food, 3.6% Non-distinct Fines, 3%#3 Leaves & Grass, 2% Other Electronics, 1.7% Disposable Diapers, 2.6% Textiles, 2.8%#4 Carpet/Upholstery, 1.6% Other Film, 1.6% Textiles, 2.6% Other Film, 2.2%#5 Purchased Food, 1.6% Compostable/Food Soiled Paper, 1.1% Other Film, 2.4% Compostable/Food Soiled Paper, 2.1%
Bid Area Top Five Contaminants and Composition
Rank I J Citywide
#1 Non-distinct Fines, 2.5% Textiles, 3% Non-distinct Fines, 2.7%#2 Textiles, 2% Compostable/Food Soiled Paper, 2.2% Textiles, 2.5%#3 Contaminated Wood, 1.6% Other Film, 1.7% Other Plastic Film, 1.8%#4 Other Film, 1.5% Non-distinct Fines, 1.6% Purchased Food, 1.5%#5 Purchased Food, 1.5% Paper/Other Materials, 1.2% Compostable/Food Soiled Paper, 1.5%
Bid Area Top Five Contaminants and Composition

13
1. NEWSPAPER: Printed newsprint. Advertising “slicks” (glossy paper) are included in this category if found mixed with newspaper; otherwise, ad slicks are included with mixed low grade paper.
2. PLAIN OCC/KRAFT PAPER: Old unwaxed/uncoated corrugated container boxes and Kraft paper, and brown paper bags.
3. WAXED OCC/KRAFT PAPER: Old waxed/coated corrugated container boxes and Kraft paper, and brown paper bags.
4. HIGH GRADE PAPER: White or lightly colored sulfite/sulfate bond, copy papers, envelopes, and continuous-feed sulfite/sulfate/ground wood computer printouts and forms of all types. This is a combination of the 2003 types office paper and computer paper.
5. MIXED LOW GRADE PAPER: Low-grade, potentially recyclable papers, including junk mail, magazines, colored papers, bleached Kraft, boxboard, mailing tubes, carbonless copy paper, paperback books, paper egg creates, and telephone directories. This is a combination of the 2003 types mixed low grade and phone books.
6. MILK/JUICE POLYCOATED PAPER: Bleached polycoated milk, ice cream, and aseptic juice containers.
7. FROZEN FOOD POLYCOATED PAPER: Bleached and unbleached polycoated frozen/refrigerator packaging, excluding polycoated milk/ice cream/aseptic containers.
8. COMPOSTABLE/FOOD SOILED PAPER: Paper towels, paper plates, waxed paper, tissues, and other paper products without a plastic coating. The items may be food soiled.
9. PAPER/OTHER MATERIALS: Predominantly paper with other materials attached (e.g. orange juice cans and spiral notebooks) and other hard to recycle paper items such as carbon copy paper, hardcover books, and photographs. This is a combination of the 2003 types paper/other materials and other papers.
10. #1 PET BOTTLES: Polyethylene terephthalate bottles. A bottle has a neck and a mouth narrower than the base. Items may bear a #1 when labeled for recycling. This is approximately the same as the 2003 type PET pop and liquor bottles.
11. #1 PET OTHER PACKAGING: All non-bottle PET plastic packaging including tubs, jars, tray, and clamshells. This includes single use PET plastic cups. Items may bear a #1 when labeled for recycling. This is a combination of the 2003 types other PET bottles and the PET items in other rigid packaging.
12. #2 HDPE NATURAL BOTTLES: High-density polyethylene translucent bottles, often containing milk, juice, and beverage containers. A bottle has a neck and a mouth narrower than the base. Items may bear a #2 when labeled for recycling. This is approximately the same as the 2003 type HDPE milk and juice bottles.
13. #2 HDPE COLORED BOTTLES: High-density polyethylene colored or pigmented bottles. A bottle has a neck and a mouth narrower than the base. Examples include laundry detergent bottles and some gallon juice jugs. Items may bear a #2 when labeled for recycling. This is approximately the same as the 2003 type other HDPE bottles.

14
14. #2 HDPE OTHER PACKAGING: All non-bottle HDPE plastic packaging including tubs, jars, tray, and clamshells. An example is a ground coffee tub. Items may bear a #2 when labeled for recycling. This is a combination of the 2003 types HDPE jars and tubs and the HDPE items in other rigid packaging.
15. OTHER RIGID PLASTIC PACKAGING: Plastic bottles, jars, tubs, trays, clamshells, and other packaging not classified in the above-defined PET or HDPE categories; includes plastic packaging labeled #3-#7, unknown or unlabeled plastic packaging, and dual labeled plastic packaging but excludes all expanded polystyrene items and items labeled compostable. Examples include some shampoo bottles, dairy tubs, and single use plastic cups. This is a combination of the 2003 types other plastic bottles, jars, and tubs and other rigid packaging.
16. EXPANDED POLYSTYRENE: Includes packaging and finished products made of expanded polystyrene. Examples include packing peanuts, clamshells, trays, and packing blocks. Does not include rigid Styrofoam insulation.
17. COMPOSTABLE PLASTICS: Packaging made from compostable materials such as corn or potatoes, with the words “compostable” on the product. This is a new type.
18. PLASTIC GROCERY/MERCHANDISE BAGS: Plastic shopping bags used to contain merchandise to transport from the place of purchase, given out by the store with the purchase. Does not include dry cleaner bags. This does include grocery and merchandise bags reused for other purposes such as small trash bags. This is a new type.
19. OTHER CLEAN PLASTIC CONSUMER PRODUCT BAGS: Bread, produce, and dry cleaner plastic film bags. These are usually transparent and made of a single layer of film. Also includes Zip-Loc bags.
20. PLASTIC GARBAGE BAGS: Plastic garbage bags. This does not include single use shopping bags reused as garbage bags.
21. OTHER PLASTIC FILM: All other film items, including film packaging not defined elsewhere, plastic sheeting, photographic negatives, and shower curtains. This includes multi-layer and opaque food packaging such as chip bags, candy bar wrappers, frozen food bags, etc.
22. MIXED RIGID PLASTICS: Plastic products intended for long term use or for to be reused multiple times. Examples include toys, milk crates, plastic pallets, plastic pipes, and buckets. Includes fiberglass resin products and materials.
23. PLASTIC/OTHER MATERIALS: Predominately plastic with other materials attached such as disposable razors, pens, lighters, toothbrushes, hoses, and 3-ring binders.
24. GLASS BEVERAGE CONTAINERS: Includes any color pop, liquor, wine, juice, beer, and food bottles, jars, and containers. This is a combination of the 2003 clear, green, and brown beverage container types and the 2003 container glass type.
25. FLUORESCENT TUBES: Fluorescent light tubes and compact fluorescent bulbs.
26. OTHER GLASS: Window glass, light bulbs (except fluorescent tubes), mirrors, glassware, and any other glass item that does not fit into a category above.
27. ALUMINUM CANS: Aluminum beverage cans (UBC) and bi-metal cans made mostly of aluminum. This does not include aluminum food containers or cat food containers.

15
28. ALUMINUM FOIL/CONTAINERS: All other aluminum food containers, trays, and foil. This type includes cat food containers.
29. OTHER NONFERROUS: Metals not derived from iron, to which a magnet will not adhere, and which are not significantly contaminated with other metals or materials, including metal products and scrap such as window frames and cookware. This is a combination of the 2003 types other nonferrous and other aluminum.
30. TIN FOOD CANS: Tinned steel food containers, including bi-metal cans mostly of steel. Does not include paint cans or other types of steel cans.
31. EMPTY AEROSOL CANS: Empty, mixed material/metal aerosol cans. (Aerosols that still contain product are sorted according to that material—for instance, solvent-based paint.)
32. OTHER FERROUS: Ferrous and alloyed ferrous scrap metals to which a magnet adheres and which are not significantly contaminated with other metals or materials. Stainless steel is included in this material type. This includes empty and punctured tanks for liquid and gaseous fuels.
33. OIL FILTERS: Metal oil filters used in cars and other automobiles.
34. MIXED METALS/MATERIALS: Motors, insulated wire, and finished products containing a mixture of metals, or metals and other materials, whose weight is derived significantly from the metal portion of its construction.
35. LEAVES AND GRASS: Grass clippings, leaves, and weeds.
36. UNACCEPTED YARD WASTE: Oleander, palm fronds, pyracantha, and creosote. This is a new type.
37. PRUNINGS LESS THAN 2”: Cut prunings, 2" or less in diameter, from bushes, shrubs, and trees. This may include some prunings with fruit attached if the weight of the pruning exceeds the weight of the fruit. This is a new type.
38. PRUNINGS 2” TO 12”: Cut prunings, between 2" and 12” in diameter, from bushes, shrubs, and trees. This may include some prunings with fruit attached if the weight of the pruning exceeds the weight of the fruit. This is a new type.
39. PRUNINGS GREATER THAN 12”: Cut prunings, 12" or more in diameter, from bushes, shrubs, and trees. This may include some prunings with fruit attached if the weight of the pruning exceeds the weight of the fruit. This is a new type.
40. PURCHASED FOOD: Food wastes and scraps, including bone, rinds, etc. Excludes the weight of food containers, except when container weight is not appreciable compared to the food inside.
41. HOMEGROWN FOOD: Fruits and vegetables grown at home. Large quantities of the same fruit or vegetable lacking PLU stickers or other grocery store marking are considered homegrown fruits and vegetables. This may include some prunings with fruit attached if the weight of the fruit exceeds the weight of the prunings. This is a new type.
42. BEVERAGES AND FOOD LIQUIDS: Bottled water, soda, and other edible liquids such as pickle juice. This does not include the moisture content of solid foods. This is a new type.

16
43. TEXTILES: Clothing, rags, and accessories made of natural and synthetic textiles such as cotton, wool, silk, woven nylon, rayon, polyester, and other materials. Examples include pants, shirts, fabric purses, bed sheets, non-leather shoes, and towels.
44. CARPET/UPHOLSTERY: Floor coverings and other furnishings made entirely of natural or synthetic fibers. Carpet is a general category of flooring applications consisting of various natural or synthetic fibers bonded to some type of backing material. Other examples include carpet padding, area rugs, curtains, pillows, and cushions.
45. LEATHER: Finished products or scraps of leather. Examples include leather purses, leather shoes, and baseball gloves.
46. DISPOSABLE DIAPERS: Disposable baby diapers and adult protective undergarments.
47. ANIMAL BY-PRODUCTS: Animal carcasses and wastes. This includes animal feces and kitty litter.
48. RUBBER PRODUCTS: Finished products and scrap materials made of rubber, such as bath mats, inner tubes, rubber hoses, and foam rubber (except carpet padding).
49. TIRES: Vehicle tires of all types.
50. ASH: Fireplace, burn barrel, or fire pit ash.
51. FURNITURE: Mixed-material furniture such as upholstered chairs. Items made wholly of a single material will be sorted based on the material type (wood furniture is sorted as treated wood, a metal desk is sorted as other ferrous).
52. MATTRESSES: Mattresses and box springs of any kind. Include memory foam, coil, stuffed, and futon mattresses.
53. SMALL APPLIANCES: Small electric appliances such as toasters, microwave ovens, power tools, curling irons, and light fixtures.
54. CRT’S: Computer monitors and television sets containing a cathode ray tube (CRT). This is a combination of the 2003 types computer monitors and televisions.
55. OTHER ELECTRONICS: Item with some circuitry not categorized elsewhere including cell phones, answering machines, electronic toys, stereos, radios, tape decks, other audio/visual equipment, VCRs, DVD players, computer processors, mice, keyboards, disk drives, monitors and TV’s that do not contain cathode ray tubes, printers, scanners, gaming systems, tablet computers, e-readers, and laptops. This is a combination of the 2003 types audio/visual equipment and other computer equipment.
56. CERAMICS/PORCELAIN: Finished ceramic or porcelain products such as dishware, toilets, etc.
57. NONDISTINCT FINES: Contains mixed fines smaller than 2" in diameter including dirt and other small materials. This is a combination of the 2003 types nondistinct fines and sand/soil/dirt.
58. MISCELLANEOUS ORGANICS: Wax, modeling clay, bar soap, cigarette butts, and other organic materials not classified elsewhere.
59. MISCELLANEOUS INORGANICS: Other non-combustible, inorganic materials not classified elsewhere.
60. DIMENSION LUMBER: Clean milled lumber.

17
61. PALLETS/CRATES: Untreated wood pallets, crates, and other packaging lumber/panel board. This is a combination of the 2003 types pallets and crates.
62. TREATED WOOD: Lumber and wood products that have been painted or treated so as to render them difficult to compost. This includes plywood, other engineered woods, furniture made wholly of wood, and painted pallets and crates.
63. CONTAMINATED WOOD: Lumber and wood products contaminated with other wastes in such a way that they cannot easily be separated, but consisting primarily (over 50 percent) of wood. Often adhered to concrete or other contaminants that would not compost easily. This includes plywood and other engineered woods.
64. NEW GYPSUM SCRAP: New gypsum wallboard scrap.
65. DEMO GYPSUM SCRAP: Used or demolition gypsum wallboard scrap.
66. INSULATION: Fiberglass building and mechanical insulation, batt or rigid. Includes rigid Styrofoam insulation panels.
67. ROCK/CONCRETE/BRICKS: Includes rock gravel larger than 2" diameter, Portland cement mixtures (set or unset), and fired-clay bricks.
68. ASPHALTIC ROOFING: Asphalt shingles, tarpaper of built-up roofing.
69. OTHER CONSTRUCTION DEBRIS: Construction debris (other than wood), which cannot be classified into other component categories, and mixed fine building material scraps.
70. LATEX PAINTS: Water-based paints and similar products.
71. HAZARDOUS ADHESIVES/GLUES: Oil/resin/volatile solvent-based glues and adhesives, including epoxy, rubber cement, two-part glues and sealers, and auto body fillers.
72. NON-HAZARDOUS ADHESIVES/GLUES: Water-based glues, caulking compounds, grouts, and spackle.
73. OIL-BASED PAINT/SOLVENT: Solvent-based paints, varnishes, and similar products. Various solvents, including chlorinated and flammable solvents, paint strippers, solvents contaminated with other products such as paints, degreasers and some other cleaners if the primary ingredient is (or was) a solvent, or alcohol such as methanol and isopropanol.
74. HAZARDOUS CLEANERS: Various acids and bases whose primary purpose is to clean surfaces, unclog drains, or perform other actions.
75. PESTICIDES/HERBICIDES: Variety of poisons whose purpose is to discourage or kill pests, weeds, or microorganisms. Fungicides and wood preservatives, such as pentachlorophenol, are also included.
76. NON-RECHARGABLE DRY-CELL BATTERIES: Dry-cell batteries of various sizes and types as commonly used in households that are not intended to be re-charged and re-used. This is a new type created by splitting the 2003 type dry cell batteries.
77. RECHARGABLE DRY-CELL BATTERIES: Dry-cell batteries of various sizes and types as commonly used in households that are intended to be re-charged and re-used. This is a new type created by splitting the 2003 type dry cell batteries.
78. WET-CELL BATTERIES: Wet-cell batteries of various sizes and types as commonly used in automobiles.

18
79. ASBESTOS: Asbestos and asbestos-containing wastes (if this is the primary hazard associated with these wastes).
80. EXPLOSIVES: Gunpowder, unspent ammunition, picric acid, and other potentially explosive chemicals. This includes full or partly full tanks for liquid and gaseous fuels.
81. VEHICLE AND EQUIPMENT FLUIDS: Containers with fluids used in vehicles or engines, including antifreeze, brake fluid, motor oil, gasoline, and diesel fuel. This is a combination of the 2003 types gasoline/kerosene and motor oil/diesel oil.
82. POOL CHEMICALS: Chemicals in liquid or powder form used to maintain swimming pools. This is a new type, probably included in the hazardous cleaners type in 2003.
83. OTHER HAZARDOUS CHEMICALS: Other hazardous wastes that do not fit into the above categories, including unidentifiable materials and medical wastes such as I.V. tubing and patient drapes (Medical wastes that could be considered a bio-hazard were excluded from the sorts.).
84. OTHER NON-HAZARDOUS CHEMICALS: Non-hazardous soaps, cleaners, medicines, cosmetics, fire extinguishers, and other household chemicals.
19
Table 11. Material Types Organized by Recoverability
Curbside Recycle Other Recoverable Non-recoverableNewspaper Plastic Grocery/Merchandise Bags Paper/Other Materials
Plain OCC/Kraft Paper Other Clean Plastic Consumer Product Bags Expanded Polystyrene
High Grade Paper Fluorescent Tubes Plastic Garbage Bags
Mixed Low-grade Paper Oil Filters Other Plastic Film
Milk/Juice Polycoated Paper Mixed Metals/Material Plastic/Other Materials
Frozen Food Polycoated Paper Prunings Greater than 12" Other Glass
#1 PET Bottles Textiles Unaccepted Yard Waste
#1 PET Other Packaging Leather Carpet/Upholstery
#2 HDPE Natural Bottles Tires Disposable Diapers
#2 HDPE Colored Bottles Mattresses Animal By-products
#2 HDPE Other Packaging CRTs Rubber Products
Other Rigid Plastic Packaging Other Electronics Ash
Mixed Rigid Plastics Ceramics/Porcelain Furniture
Glass Beverage Containers Dimension Lumber Small Appliances
Aluminum Cans Pallets/Crates Non-distinct Fines
Aluminum Foil/Containers New Gypsum Scrap Miscellaneous Organics
Other Nonferrous Demo Gypsum Scrap Miscellaneous Inorganics
Tin Food Cans Rock/Concrete/Bricks Treated Wood
Empty Aerosol Cans Asphaltic Roofing Contaminated Wood
Other Ferrous Non-rechargeable Dry-cell Batteries Insulation
Rechargeable Dry-cell Batteries Other Construction Debris
Compostable Wet-cell (car) Batteries Latex Paint
Waxed OCC/Kraft Paper Hazardous Adhesives/Glues
Compostable/Food Soiled Paper Non-hazardous Adhesives/Glues
Compostable Plastics Oil-based Paint/Solvent
Leaves & Grass Hazardous Cleaners
Prunings Less than 2" Pesticides/Herbicides
Prunings 2" to 12" Asbestos
Purchased Food Explosives
Homegrown Food Vehicle and Equipment Fluids
Beverages and Liquids Pool Chemicals
Other Hazardous Chemicals
Other Non-hazardous Chemicals

20
Table 12. 2014 vs. 2003 Comparison Categories
2014 Material Types Comparison Category 2003 Material TypesNewspaper Newspaper Newspaper
Plain OCC/Kraft Paper Unwaxed OCC / Kraft paper Plain OCC/Kraft
High Grade Paper Office PaperMixed Low-grade Paper Computer Paper
Milk/Juice Polycoated Paper Mixed Low GradeFrozen Food Polycoated Paper Phone Books
Milk/Juice/PolycoatWaxed OCC/Kraft Paper
Compostable/Food Soiled PaperWaxed OCC/KraftFrozen Food PolycoatsPaper/Other MaterialsOther Paper
#1 PET Bottles #1 Pop & Liquor#1 PET Other Packaging #1 Other Bottles
#2 HDPE Natural Bottles #2 Milk & Juice#2 HDPE Colored Bottles #2 Other Bottles
#2 HDPE Other Packaging #2 Jars & Tubs
Expanded Polystyrene Expanded polystyrene Expanded Polystyrene
Plastic Grocery/Merchandise BagsOther Clean Plastic Consumer Product Bags
Plastic Garbage Bags Garbage BagsOther Plastic Film Other Plastic Film
Other Rigid Plastic Packaging Other Rigid PackagingCompostable Plastics Other Bottles, Jars & Tubs
Mixed Rigid Plastics Plastic ProductsPlastic/Other Materials
Clear Beverage/LiquidGreen Beverage/LiquidBrown Beverage/LiquidContainer Glass
Fluorescent Tubes Fluorescent TubesOther Glass Other Glass
Aluminum Cans Aluminum cans Aluminum Beverage Cans
Tin Food Cans Tin/steel food cans Tinned Food Cans
Aluminum Foil/Containers Alum. Foil/ContainersOther Nonferrous Other Aluminum
Empty Aerosol Cans Empty Aerosol CansOther Ferrous Other Ferrous
Oil Filters Other NonferrousMixed Metals/Material Motor Oil filters
Mixed Metals/MaterialLeaves & Grass Leaves & Grass
Prunings Less than 2" PruningsPrunings 2" to 12"
Purchased FoodHomegrown Food
Beverages and Liquids
Paper/Other Materials Other paper
PET (#1) plastic
HDPE (#2) plastic
Recyclable glassGlass Beverage Containers
Other glass
Compostable yard waste
Food waste Food Wastes
Other plastic film
Other plastic
Other recyclable metals
Other metals
Other recyclable paper
Compostable paper Compostable Soiled
Clean plastic film (grocery sacks) Grocery/Store/Bread Bags

21
Table 12. 2014 vs. 2003 Comparison Categories, contd.
2014 Material Types Comparison Category 2003 Material TypesDimension Lumber Pallets
Pallets/Crates Crates/BoxesTreated Wood Dimension Lumber
Contaminated Wood Other Untreated WoodNew Gypsum Scrap Treated Wood
Demo Gypsum Scrap Contaminated WoodInsulation New Gypsum Scrap
Rock/Concrete/Bricks Demo Gypsum ScrapAsphaltic Roofing Fiberglass Insulation
Other Construction Debris Rock/Concrete/BricksAsphaltic RoofingOther Construction DebrisSand/Soil/Dirt
Latex Paint Latex PaintHazardous Adhesives/Glues Hazardous Glue/Adhesives
Non-hazardous Adhesives/Glues Non-hazardous GluesOil-based Paint/Solvent Oil-based Paint/Thinners
Hazardous Cleaners Hazardous CleanersPesticides/Herbicides Pesticides/Herbicides
Non-rechargeable Dry-cell Batteries Dry-cell BatteriesRechargeable Dry-cell Batteries Wet-cell Batteries
Wet-cell (car) Batteries Gasoline/KeroseneAsbestos Motor Oil/Diesel Oil
Explosives AsbestosVehicle and Equipment Fluids Explosives
Pool Chemicals Other HazardousOther Hazardous Chemicals Other Non-hazardous
Other Non-hazardous ChemicalsUnaccepted Yard Waste Textiles/Clothing
Prunings Greater than 12" Carpet/UpholsteryTextiles Leather
Carpet/Upholstery Disposable DiapersLeather Animal By-products
Disposable Diapers Rubber ProductsAnimal By-products Tires
Rubber Products AshTires FurnitureAsh Mattresses
Furniture Small AppliancesMattresses Audio/Visual Equipment
Small Appliances Computer Monitors
CRTs Television Sets
Other Electronics Other Computer EquipmentCeramics/Porcelain Ceramics/China
Non-distinct Fines Non-distinct FinesMiscellaneous Organics Misc. Organics
Miscellaneous Inorganics Misc. Inorganics
Construction and demolition waste
Household hazardous waste
Other materials

22

23
Table 13. Citywide Garbage Composition, Summer 2014
Estimated Estimated Estimated Estimated
Material Percent + / - Tons Material Percent + / - Tons
Paper 14.2% 55,485 Other Materials 70,931
Newspaper 1.4% 0.2% 5,345 Textiles 2.9% 0.7% 11,219
Plain OCC/Kraft Paper 1.4% 0.2% 5,286 Carpet/Upholstery 2.1% 0.7% 8,334
Waxed OCC/Kraft Paper 0.0% 0.0% 191 Leather 0.1% 0.1% 457
High Grade Paper 0.5% 0.1% 1,910 Disposable Diapers 3.8% 0.5% 14,668
Mixed Low-grade Paper 3.9% 0.4% 15,400 Animal By-products 3.0% 0.6% 11,852
Milk/Juice Polycoated Paper 0.2% 0.0% 691 Rubber Products 0.6% 0.1% 2,441
Frozen Food Polycoated Paper 0.2% 0.0% 823 Tires 0.2% 0.2% 645
Compostable/Food Soiled Paper 5.9% 0.4% 23,047 Ash 0.0% 0.0% 26
Paper/Other Materials 0.7% 0.1% 2,791 Furniture 0.0% 0.0% 71
Mattresses 0.0% 0.0% 0
Plastic 38,972 Small Appliances 0.8% 0.4% 3,057
#1 PET Bottles 1.0% 0.1% 3,759 CRTs 0.0% 0.0% 0
#1 PET Other Packaging 0.3% 0.0% 1,123 Other Electronics 0.9% 0.4% 3,342
#2 HDPE Natural Bottles 0.2% 0.0% 951 Ceramics/Porcelain 0.4% 0.1% 1,594
#2 HDPE Colored Bottles 0.3% 0.0% 1,002 Non-distinct Fines 2.0% 0.4% 7,847
#2 HDPE Other Packaging 0.0% 0.0% 95 Miscellaneous Organics 1.2% 0.2% 4,528
Other Rigid Plastic Packaging 0.8% 0.1% 3,294 Miscellaneous Inorganics 0.2% 0.1% 851
Expanded Polystyrene 0.7% 0.1% 2,823
Compostable Plastics 0.0% 0.0% 47 Hazardous Wastes 2,970
Plastic Grocery/Merchandise Bags 1.0% 0.1% 3,936 Latex Paint 0.2% 0.1% 586
Other Clean Plastic Consumer Product Bags 0.4% 0.1% 1,631 Hazardous Adhesives/Glues 0.0% 0.0% 14Plastic Garbage Bags 1.0% 0.1% 4,093 Non-hazardous Adhesives/Glues 0.0% 0.0% 13
Other Plastic Film 1.9% 0.5% 7,422 Oil-based Paint/Solvent 0.0% 0.0% 0
Mixed Rigid Plastics 1.3% 0.3% 5,251 Hazardous Cleaners 0.0% 0.0% 10
Plastic/Other Materials 0.9% 0.1% 3,545 Pesticides/Herbicides 0.0% 0.0% 96
Non-rechargeable Dry-cell Batteries 0.1% 0.0% 199
Glass 2.2% 8,494 Rechargeable Dry-cell Batteries 0.0% 0.0% 52
Glass Beverage Containers 1.3% 0.0% 5,165 Wet-cell (car) Batteries 0.0% 0.0% 30
Fluorescent Tubes 0.0% 0.0% 39 Asbestos 0.0% 0.0% 0
Other Glass 0.8% 0.0% 3,290 Explosives 0.0% 0.0% 45
Vehicle and Equipment Fluids 0.0% 0.0% 55
Metal 11,178 Pool Chemicals 0.0% 0.0% 2
Aluminum Cans 0.3% 0.0% 1,143 Other Hazardous Chemicals 0.2% 0.1% 742
Aluminum Foil/Containers 0.2% 0.0% 813 Other Non-hazardous Chemicals 0.3% 0.0% 1,126
Other Nonferrous 0.1% 0.1% 444
Tin Food Cans 0.7% 0.1% 2,679 C&D Wastes 18,633
Empty Aerosol Cans 0.1% 0.0% 446 Dimension Lumber 0.6% 0.3% 2,429
Other Ferrous 0.5% 0.2% 1,872 Pallets/Crates 0.1% 0.2% 491
Oil Filters 0.0% 0.0% 84 Treated Wood 0.9% 0.4% 3,437
Mixed Metals/Material 0.9% 0.5% 3,696 Contaminated Wood 0.9% 0.3% 3,323
New Gypsum Scrap 0.0% 0.0% 144
Organic 183,885 Demo Gypsum Scrap 0.3% 0.3% 1,079
Leaves & Grass 22.5% 2.5% 87,848 Insulation 0.0% 0.0% 19
Unaccepted Yard Waste 1.9% 1.0% 7,468 Rock/Concrete/Bricks 1.4% 0.5% 5,389
Prunings Less than 2" 6.1% 0.9% 23,793 Asphaltic Roofing 0.4% 0.4% 1,463
Prunings 2" to 12" 1.6% 0.7% 6,105 Other Construction Debris 0.2% 0.1% 859
Prunings Greater than 12" 0.6% 0.6% 2,205
Purchased Food 13.5% 0.9% 52,741 Totals 390,548
Homegrown Food 0.5% 0.4% 1,913Beverages and Liquids 0.5% 0.1% 1,811 Sample Count 130
Confidence intervals calculated at the 90% confidence level. Percentages for material types may not total 100% due to rounding.
18.2%
0.8%
100.0%
4.8%
10.0%
2.9%
47.1%

24
Table 14. Area A Garbage Composition, Summer 2014
Estimated Estimated Estimated Estimated
Material Percent + / - Tons Material Percent + / - Tons
Paper 11.9% 5,953 Other Materials 6,358
Newspaper 1.0% 0.5% 515 Textiles 2.3% 0.5% 1,157
Plain OCC/Kraft Paper 1.4% 0.6% 710 Carpet/Upholstery 1.1% 0.9% 574
Waxed OCC/Kraft Paper 0.0% 0.0% 0 Leather 0.4% 0.4% 193
High Grade Paper 0.2% 0.1% 79 Disposable Diapers 4.1% 1.3% 2,048
Mixed Low-grade Paper 3.1% 0.7% 1,559 Animal By-products 0.3% 0.2% 166
Milk/Juice Polycoated Paper 0.1% 0.0% 31 Rubber Products 0.6% 0.4% 304
Frozen Food Polycoated Paper 0.2% 0.1% 89 Tires 0.0% 0.0% 0
Compostable/Food Soiled Paper 5.2% 1.4% 2,613 Ash 0.0% 0.0% 0
Paper/Other Materials 0.7% 0.2% 357 Furniture 0.0% 0.0% 0
Mattresses 0.0% 0.0% 0
Plastic 6,310 Small Appliances 0.2% 0.3% 94
#1 PET Bottles 1.2% 0.3% 586 CRTs 0.0% 0.0% 0
#1 PET Other Packaging 0.2% 0.1% 86 Other Electronics 0.8% 1.0% 421
#2 HDPE Natural Bottles 0.3% 0.2% 151 Ceramics/Porcelain 0.4% 0.3% 198
#2 HDPE Colored Bottles 0.3% 0.1% 128 Non-distinct Fines 1.0% 0.3% 514
#2 HDPE Other Packaging 0.0% 0.0% 23 Miscellaneous Organics 1.3% 0.5% 644
Other Rigid Plastic Packaging 1.0% 0.2% 481 Miscellaneous Inorganics 0.1% 0.1% 46
Expanded Polystyrene 1.1% 0.2% 543
Compostable Plastics 0.0% 0.0% 0 Hazardous Wastes 301
Plastic Grocery/Merchandise Bags 1.4% 0.2% 705 Latex Paint 0.0% 0.1% 22
Other Clean Plastic Consumer Product Bags 0.3% 0.1% 167 Hazardous Adhesives/Glues 0.0% 0.0% 0Plastic Garbage Bags 1.1% 0.3% 548 Non-hazardous Adhesives/Glues 0.0% 0.0% 0
Other Plastic Film 3.7% 3.3% 1,865 Oil-based Paint/Solvent 0.0% 0.0% 0
Mixed Rigid Plastics 1.1% 0.4% 530 Hazardous Cleaners 0.0% 0.0% 1
Plastic/Other Materials 1.0% 0.3% 494 Pesticides/Herbicides 0.0% 0.0% 6
Non-rechargeable Dry-cell Batteries 0.0% 0.0% 6
Glass 2.2% 1,110 Rechargeable Dry-cell Batteries 0.0% 0.0% 1
Glass Beverage Containers 1.3% 0.2% 644 Wet-cell (car) Batteries 0.0% 0.0% 0
Fluorescent Tubes 0.0% 0.1% 0 Asbestos 0.0% 0.0% 0
Other Glass 0.9% 0.0% 466 Explosives 0.1% 0.1% 26
Vehicle and Equipment Fluids 0.1% 0.1% 37
Metal 1,193 Pool Chemicals 0.0% 0.0% 0
Aluminum Cans 0.3% 0.1% 130 Other Hazardous Chemicals 0.2% 0.2% 88
Aluminum Foil/Containers 0.2% 0.0% 80 Other Non-hazardous Chemicals 0.2% 0.0% 114
Other Nonferrous 0.1% 0.1% 27
Tin Food Cans 0.9% 0.2% 436 C&D Wastes 3,711
Empty Aerosol Cans 0.1% 0.0% 44 Dimension Lumber 0.9% 1.1% 450
Other Ferrous 0.4% 0.2% 217 Pallets/Crates 0.0% 0.0% 0
Oil Filters 0.0% 0.0% 0 Treated Wood 3.1% 3.1% 1,577
Mixed Metals/Material 0.5% 0.3% 259 Contaminated Wood 1.6% 1.7% 825
New Gypsum Scrap 0.0% 0.0% 2
Organic 25,176 Demo Gypsum Scrap 0.1% 0.1% 49
Leaves & Grass 27.9% 9.1% 13,978 Insulation 0.0% 0.0% 0
Unaccepted Yard Waste 2.4% 1.9% 1,219 Rock/Concrete/Bricks 0.8% 0.9% 420
Prunings Less than 2" 4.1% 2.6% 2,030 Asphaltic Roofing 0.5% 0.8% 254
Prunings 2" to 12" 0.1% 0.1% 29 Other Construction Debris 0.3% 0.4% 134
Prunings Greater than 12" 2.3% 3.9% 1,174
Purchased Food 13.0% 2.9% 6,522 Totals 50,112
Homegrown Food 0.0% 0.0% 0Beverages and Liquids 0.4% 0.3% 225 Sample Count 12
Confidence intervals calculated at the 90% confidence level. Percentages for material types may not total 100% due to rounding.
12.7%
0.6%
100.0%
7.4%
12.6%
2.4%
50.2%
25
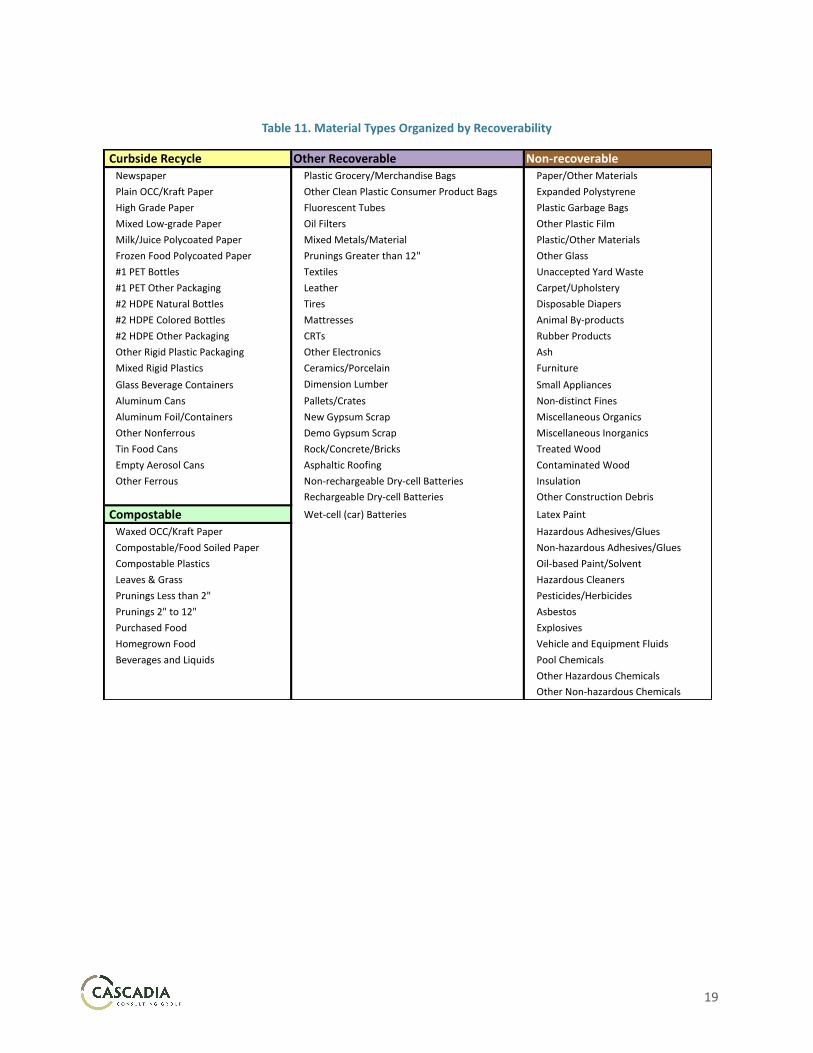
Table 15. Area B Garbage Composition, Summer 2014
Estimated Estimated Estimated Estimated
Material Percent + / - Tons Material Percent + / - Tons
Paper 12.1% 5,513 Other Materials 9,119
Newspaper 1.0% 0.9% 458 Textiles 2.7% 1.1% 1,248
Plain OCC/Kraft Paper 1.3% 0.7% 605 Carpet/Upholstery 5.3% 3.8% 2,423
Waxed OCC/Kraft Paper 0.0% 0.0% 17 Leather 0.0% 0.0% 6
High Grade Paper 0.4% 0.3% 192 Disposable Diapers 5.5% 2.4% 2,490
Mixed Low-grade Paper 3.2% 0.8% 1,445 Animal By-products 2.3% 1.6% 1,040
Milk/Juice Polycoated Paper 0.3% 0.3% 152 Rubber Products 0.7% 0.5% 331
Frozen Food Polycoated Paper 0.0% 0.0% 20 Tires 0.0% 0.0% 0
Compostable/Food Soiled Paper 5.2% 1.2% 2,370 Ash 0.0% 0.0% 0
Paper/Other Materials 0.6% 0.2% 254 Furniture 0.0% 0.0% 0
Mattresses 0.0% 0.0% 0
Plastic 4,019 Small Appliances 0.9% 1.2% 422
#1 PET Bottles 0.9% 0.2% 400 CRTs 0.0% 0.0% 0
#1 PET Other Packaging 0.4% 0.1% 161 Other Electronics 0.4% 0.3% 168
#2 HDPE Natural Bottles 0.1% 0.1% 64 Ceramics/Porcelain 0.5% 0.3% 224
#2 HDPE Colored Bottles 0.3% 0.1% 120 Non-distinct Fines 1.0% 0.5% 456
#2 HDPE Other Packaging 0.0% 0.0% 0 Miscellaneous Organics 0.6% 0.2% 264
Other Rigid Plastic Packaging 0.7% 0.2% 315 Miscellaneous Inorganics 0.1% 0.0% 47
Expanded Polystyrene 0.4% 0.1% 203
Compostable Plastics 0.1% 0.1% 25 Hazardous Wastes 435
Plastic Grocery/Merchandise Bags 0.8% 0.2% 363 Latex Paint 0.5% 0.6% 229
Other Clean Plastic Consumer Product Bags 0.4% 0.2% 186 Hazardous Adhesives/Glues 0.0% 0.0% 0Plastic Garbage Bags 0.9% 0.2% 414 Non-hazardous Adhesives/Glues 0.0% 0.0% 0
Other Plastic Film 1.6% 0.3% 713 Oil-based Paint/Solvent 0.0% 0.0% 0
Mixed Rigid Plastics 1.4% 0.9% 621 Hazardous Cleaners 0.0% 0.0% 0
Plastic/Other Materials 1.0% 0.2% 433 Pesticides/Herbicides 0.1% 0.2% 46
Non-rechargeable Dry-cell Batteries 0.0% 0.0% 9
Glass 1.5% 702 Rechargeable Dry-cell Batteries 0.0% 0.0% 3
Glass Beverage Containers 1.1% 0.1% 509 Wet-cell (car) Batteries 0.0% 0.0% 0
Fluorescent Tubes 0.1% 0.1% 24 Asbestos 0.0% 0.0% 0
Other Glass 0.4% 0.0% 168 Explosives 0.0% 0.0% 0
Vehicle and Equipment Fluids 0.0% 0.0% 3
Metal 981 Pool Chemicals 0.0% 0.0% 0
Aluminum Cans 0.4% 0.2% 183 Other Hazardous Chemicals 0.1% 0.0% 31
Aluminum Foil/Containers 0.2% 0.1% 84 Other Non-hazardous Chemicals 0.3% 0.2% 114
Other Nonferrous 0.0% 0.0% 0
Tin Food Cans 0.5% 0.1% 227 C&D Wastes 2,532
Empty Aerosol Cans 0.1% 0.0% 38 Dimension Lumber 1.2% 1.5% 536
Other Ferrous 0.2% 0.1% 110 Pallets/Crates 0.0% 0.0% 0
Oil Filters 0.1% 0.1% 31 Treated Wood 0.2% 0.2% 91
Mixed Metals/Material 0.7% 0.5% 309 Contaminated Wood 0.1% 0.1% 46
New Gypsum Scrap 0.0% 0.0% 10
Organic 22,175 Demo Gypsum Scrap 1.0% 1.6% 447
Leaves & Grass 24.3% 5.2% 11,070 Insulation 0.0% 0.0% 11
Unaccepted Yard Waste 0.4% 0.4% 179 Rock/Concrete/Bricks 1.0% 1.0% 469
Prunings Less than 2" 5.2% 2.1% 2,368 Asphaltic Roofing 2.0% 3.3% 918
Prunings 2" to 12" 6.0% 5.3% 2,724 Other Construction Debris 0.0% 0.0% 3
Prunings Greater than 12" 0.0% 0.0% 0
Purchased Food 11.4% 1.8% 5,181 Totals 45,474
Homegrown Food 0.7% 1.2% 326Beverages and Liquids 0.7% 0.3% 326 Sample Count 12
Confidence intervals calculated at the 90% confidence level. Percentages for material types may not total 100% due to rounding.
20.1%
1.0%
100.0%
5.6%
8.8%
2.2%
48.8%

26
Table 16. Area C Garbage Composition, Summer 2014
Estimated Estimated Estimated Estimated
Material Percent + / - Tons Material Percent + / - Tons
Paper 14.9% 6,269 Other Materials 7,558
Newspaper 1.7% 0.6% 719 Textiles 1.2% 0.4% 492
Plain OCC/Kraft Paper 1.5% 0.5% 622 Carpet/Upholstery 1.3% 1.0% 563
Waxed OCC/Kraft Paper 0.1% 0.1% 26 Leather 0.1% 0.1% 32
High Grade Paper 1.1% 0.5% 464 Disposable Diapers 2.3% 1.3% 958
Mixed Low-grade Paper 3.1% 1.3% 1,312 Animal By-products 3.5% 2.4% 1,458
Milk/Juice Polycoated Paper 0.2% 0.1% 71 Rubber Products 1.0% 0.7% 428
Frozen Food Polycoated Paper 0.3% 0.1% 129 Tires 0.0% 0.0% 0
Compostable/Food Soiled Paper 6.3% 0.8% 2,668 Ash 0.0% 0.0% 0
Paper/Other Materials 0.6% 0.2% 258 Furniture 0.1% 0.2% 45
Mattresses 0.0% 0.0% 0
Plastic 3,523 Small Appliances 1.1% 1.5% 460
#1 PET Bottles 0.8% 0.2% 315 CRTs 0.0% 0.0% 0
#1 PET Other Packaging 0.3% 0.1% 146 Other Electronics 2.9% 3.2% 1,233
#2 HDPE Natural Bottles 0.1% 0.1% 53 Ceramics/Porcelain 0.3% 0.2% 120
#2 HDPE Colored Bottles 0.2% 0.1% 86 Non-distinct Fines 2.9% 1.5% 1,218
#2 HDPE Other Packaging 0.0% 0.0% 4 Miscellaneous Organics 1.1% 0.6% 463
Other Rigid Plastic Packaging 0.9% 0.1% 365 Miscellaneous Inorganics 0.2% 0.1% 90
Expanded Polystyrene 0.6% 0.2% 259
Compostable Plastics 0.0% 0.0% 0 Hazardous Wastes 379
Plastic Grocery/Merchandise Bags 0.8% 0.1% 339 Latex Paint 0.1% 0.1% 57
Other Clean Plastic Consumer Product Bags 0.3% 0.1% 128 Hazardous Adhesives/Glues 0.0% 0.0% 0Plastic Garbage Bags 1.0% 0.3% 413 Non-hazardous Adhesives/Glues 0.0% 0.0% 0
Other Plastic Film 1.6% 0.3% 669 Oil-based Paint/Solvent 0.0% 0.0% 0
Mixed Rigid Plastics 0.8% 0.3% 330 Hazardous Cleaners 0.0% 0.0% 0
Plastic/Other Materials 1.0% 0.3% 417 Pesticides/Herbicides 0.0% 0.1% 19
Non-rechargeable Dry-cell Batteries 0.2% 0.3% 87
Glass 1.5% 645 Rechargeable Dry-cell Batteries 0.0% 0.0% 0
Glass Beverage Containers 0.8% 0.1% 342 Wet-cell (car) Batteries 0.0% 0.0% 0
Fluorescent Tubes 0.0% 0.1% 4 Asbestos 0.0% 0.0% 0
Other Glass 0.7% 0.0% 299 Explosives 0.0% 0.0% 0
Vehicle and Equipment Fluids 0.0% 0.0% 12
Metal 2,045 Pool Chemicals 0.0% 0.0% 0
Aluminum Cans 0.2% 0.1% 95 Other Hazardous Chemicals 0.0% 0.0% 11
Aluminum Foil/Containers 0.2% 0.1% 79 Other Non-hazardous Chemicals 0.5% 0.2% 193
Other Nonferrous 0.0% 0.0% 13
Tin Food Cans 0.5% 0.2% 209 C&D Wastes 2,207
Empty Aerosol Cans 0.1% 0.1% 36 Dimension Lumber 1.2% 1.2% 490
Other Ferrous 0.3% 0.1% 116 Pallets/Crates 0.8% 1.4% 350
Oil Filters 0.0% 0.0% 0 Treated Wood 0.1% 0.1% 41
Mixed Metals/Material 3.6% 4.3% 1,497 Contaminated Wood 0.1% 0.0% 34
New Gypsum Scrap 0.0% 0.0% 3
Organic 19,408 Demo Gypsum Scrap 0.9% 1.4% 369
Leaves & Grass 16.3% 7.3% 6,869 Insulation 0.0% 0.0% 0
Unaccepted Yard Waste 0.8% 0.8% 353 Rock/Concrete/Bricks 1.2% 1.1% 485
Prunings Less than 2" 11.5% 3.2% 4,855 Asphaltic Roofing 0.5% 0.6% 221
Prunings 2" to 12" 1.3% 1.5% 567 Other Construction Debris 0.5% 0.7% 215
Prunings Greater than 12" 0.0% 0.0% 0
Purchased Food 13.7% 3.3% 5,767 Totals 42,034
Homegrown Food 2.2% 3.7% 930Beverages and Liquids 0.2% 0.1% 68 Sample Count 12
Confidence intervals calculated at the 90% confidence level. Percentages for material types may not total 100% due to rounding.
18.0%
0.9%
100.0%
5.2%
8.4%
4.9%
46.2%

27
Table 17. Area D Garbage Composition, Summer 2014
Estimated Estimated Estimated Estimated
Material Percent + / - Tons Material Percent + / - Tons
Paper 14.0% 5,579 Other Materials 8,990
Newspaper 1.4% 0.6% 554 Textiles 2.8% 1.6% 1,108
Plain OCC/Kraft Paper 1.4% 0.7% 561 Carpet/Upholstery 6.1% 5.1% 2,447
Waxed OCC/Kraft Paper 0.0% 0.1% 18 Leather 0.1% 0.1% 27
High Grade Paper 0.6% 0.6% 239 Disposable Diapers 3.5% 1.1% 1,398
Mixed Low-grade Paper 3.0% 0.8% 1,201 Animal By-products 4.2% 3.1% 1,666
Milk/Juice Polycoated Paper 0.1% 0.1% 50 Rubber Products 0.5% 0.2% 191
Frozen Food Polycoated Paper 0.2% 0.1% 95 Tires 0.1% 0.2% 46
Compostable/Food Soiled Paper 6.5% 1.6% 2,592 Ash 0.0% 0.0% 0
Paper/Other Materials 0.7% 0.1% 268 Furniture 0.0% 0.0% 0
Mattresses 0.0% 0.0% 0
Plastic 3,630 Small Appliances 0.8% 0.9% 307
#1 PET Bottles 0.9% 0.3% 367 CRTs 0.0% 0.0% 0
#1 PET Other Packaging 0.2% 0.1% 91 Other Electronics 0.3% 0.2% 114
#2 HDPE Natural Bottles 0.3% 0.1% 110 Ceramics/Porcelain 0.1% 0.1% 45
#2 HDPE Colored Bottles 0.3% 0.1% 123 Non-distinct Fines 1.7% 0.8% 692
#2 HDPE Other Packaging 0.0% 0.0% 7 Miscellaneous Organics 1.4% 0.7% 550
Other Rigid Plastic Packaging 0.9% 0.2% 342 Miscellaneous Inorganics 1.0% 1.2% 399
Expanded Polystyrene 0.6% 0.2% 254
Compostable Plastics 0.0% 0.0% 0 Hazardous Wastes 346
Plastic Grocery/Merchandise Bags 0.9% 0.2% 361 Latex Paint 0.3% 0.4% 124
Other Clean Plastic Consumer Product Bags 0.4% 0.1% 154 Hazardous Adhesives/Glues 0.0% 0.0% 0Plastic Garbage Bags 1.1% 0.3% 434 Non-hazardous Adhesives/Glues 0.0% 0.0% 0
Other Plastic Film 1.4% 0.2% 569 Oil-based Paint/Solvent 0.0% 0.0% 0
Mixed Rigid Plastics 1.4% 0.6% 563 Hazardous Cleaners 0.0% 0.0% 0
Plastic/Other Materials 0.6% 0.2% 255 Pesticides/Herbicides 0.0% 0.0% 0
Non-rechargeable Dry-cell Batteries 0.0% 0.0% 19
Glass 2.1% 821 Rechargeable Dry-cell Batteries 0.0% 0.0% 0
Glass Beverage Containers 1.3% 0.1% 505 Wet-cell (car) Batteries 0.0% 0.0% 0
Fluorescent Tubes 0.0% 0.1% 0 Asbestos 0.0% 0.0% 0
Other Glass 0.8% 0.0% 315 Explosives 0.0% 0.0% 0
Vehicle and Equipment Fluids 0.0% 0.0% 0
Metal 1,150 Pool Chemicals 0.0% 0.0% 0
Aluminum Cans 0.3% 0.1% 104 Other Hazardous Chemicals 0.3% 0.3% 100
Aluminum Foil/Containers 0.2% 0.1% 86 Other Non-hazardous Chemicals 0.3% 0.1% 101
Other Nonferrous 0.2% 0.2% 81
Tin Food Cans 0.6% 0.2% 244 C&D Wastes 1,351
Empty Aerosol Cans 0.1% 0.0% 27 Dimension Lumber 0.2% 0.1% 78
Other Ferrous 0.6% 0.3% 231 Pallets/Crates 0.0% 0.0% 0
Oil Filters 0.0% 0.1% 14 Treated Wood 1.1% 0.9% 427
Mixed Metals/Material 0.9% 0.6% 361 Contaminated Wood 0.8% 0.4% 315
New Gypsum Scrap 0.0% 0.0% 1
Organic 17,937 Demo Gypsum Scrap 0.0% 0.0% 0
Leaves & Grass 26.8% 8.1% 10,684 Insulation 0.0% 0.0% 2
Unaccepted Yard Waste 1.3% 1.5% 522 Rock/Concrete/Bricks 0.8% 0.6% 303
Prunings Less than 2" 2.2% 1.2% 858 Asphaltic Roofing 0.0% 0.0% 9
Prunings 2" to 12" 0.0% 0.0% 0 Other Construction Debris 0.5% 0.5% 217
Prunings Greater than 12" 1.5% 2.4% 593
Purchased Food 12.6% 3.2% 5,026 Totals 39,803
Homegrown Food 0.0% 0.0% 0Beverages and Liquids 0.6% 0.4% 254 Sample Count 15
Confidence intervals calculated at the 90% confidence level. Percentages for material types may not total 100% due to rounding.
22.6%
0.9%
100.0%
3.4%
9.1%
2.9%
45.1%

28
Table 18. Area E Garbage Composition, Summer 2014
Estimated Estimated Estimated Estimated
Material Percent + / - Tons Material Percent + / - Tons
Paper 11.1% 4,855 Other Materials 7,381
Newspaper 0.9% 0.4% 413 Textiles 5.5% 2.7% 2,385
Plain OCC/Kraft Paper 1.2% 0.6% 545 Carpet/Upholstery 1.0% 0.6% 423
Waxed OCC/Kraft Paper 0.0% 0.0% 6 Leather 0.1% 0.1% 28
High Grade Paper 0.6% 0.4% 250 Disposable Diapers 3.1% 1.1% 1,360
Mixed Low-grade Paper 3.4% 0.9% 1,481 Animal By-products 2.3% 1.7% 995
Milk/Juice Polycoated Paper 0.1% 0.1% 41 Rubber Products 0.5% 0.3% 207
Frozen Food Polycoated Paper 0.1% 0.1% 60 Tires 0.6% 0.9% 250
Compostable/Food Soiled Paper 4.1% 0.8% 1,804 Ash 0.1% 0.1% 26
Paper/Other Materials 0.6% 0.1% 255 Furniture 0.0% 0.0% 0
Mattresses 0.0% 0.0% 0
Plastic 3,786 Small Appliances 0.5% 0.7% 236
#1 PET Bottles 0.9% 0.2% 374 CRTs 0.0% 0.0% 0
#1 PET Other Packaging 0.2% 0.1% 71 Other Electronics 0.9% 1.3% 389
#2 HDPE Natural Bottles 0.2% 0.1% 96 Ceramics/Porcelain 0.6% 0.5% 255
#2 HDPE Colored Bottles 0.2% 0.1% 90 Non-distinct Fines 0.9% 0.3% 385
#2 HDPE Other Packaging 0.0% 0.0% 6 Miscellaneous Organics 0.9% 0.4% 405
Other Rigid Plastic Packaging 0.5% 0.2% 227 Miscellaneous Inorganics 0.1% 0.0% 38
Expanded Polystyrene 0.7% 0.2% 289
Compostable Plastics 0.0% 0.0% 0 Hazardous Wastes 237
Plastic Grocery/Merchandise Bags 0.8% 0.2% 351 Latex Paint 0.0% 0.0% 8
Other Clean Plastic Consumer Product Bags 0.3% 0.1% 113 Hazardous Adhesives/Glues 0.0% 0.0% 0Plastic Garbage Bags 0.7% 0.1% 314 Non-hazardous Adhesives/Glues 0.0% 0.0% 2
Other Plastic Film 1.4% 0.4% 608 Oil-based Paint/Solvent 0.0% 0.0% 0
Mixed Rigid Plastics 1.9% 1.7% 831 Hazardous Cleaners 0.0% 0.0% 0
Plastic/Other Materials 1.0% 0.4% 416 Pesticides/Herbicides 0.0% 0.1% 18
Non-rechargeable Dry-cell Batteries 0.0% 0.0% 10
Glass 2.1% 922 Rechargeable Dry-cell Batteries 0.0% 0.0% 18
Glass Beverage Containers 1.1% 0.1% 463 Wet-cell (car) Batteries 0.0% 0.0% 0
Fluorescent Tubes 0.0% 0.1% 1 Asbestos 0.0% 0.0% 0
Other Glass 1.0% 0.0% 457 Explosives 0.0% 0.1% 15
Vehicle and Equipment Fluids 0.0% 0.0% 0
Metal 814 Pool Chemicals 0.0% 0.0% 0
Aluminum Cans 0.2% 0.1% 86 Other Hazardous Chemicals 0.1% 0.2% 61
Aluminum Foil/Containers 0.2% 0.0% 85 Other Non-hazardous Chemicals 0.2% 0.1% 103
Other Nonferrous 0.0% 0.0% 0
Tin Food Cans 0.6% 0.2% 280 C&D Wastes 2,650
Empty Aerosol Cans 0.1% 0.0% 45 Dimension Lumber 1.0% 1.3% 433
Other Ferrous 0.6% 0.4% 247 Pallets/Crates 0.0% 0.0% 0
Oil Filters 0.0% 0.0% 0 Treated Wood 0.4% 0.5% 185
Mixed Metals/Material 0.2% 0.1% 71 Contaminated Wood 1.4% 0.6% 614
New Gypsum Scrap 0.0% 0.0% 9
Organic 22,990 Demo Gypsum Scrap 0.3% 0.6% 147
Leaves & Grass 34.7% 9.4% 15,125 Insulation 0.0% 0.0% 0
Unaccepted Yard Waste 0.2% 0.2% 81 Rock/Concrete/Bricks 2.5% 2.2% 1,070
Prunings Less than 2" 5.4% 2.2% 2,377 Asphaltic Roofing 0.0% 0.0% 0
Prunings 2" to 12" 2.2% 2.0% 961 Other Construction Debris 0.4% 0.6% 191
Prunings Greater than 12" 0.0% 0.0% 0
Purchased Food 9.7% 1.9% 4,249 Totals 43,632
Homegrown Food 0.0% 0.0% 0Beverages and Liquids 0.5% 0.2% 197 Sample Count 14
Confidence intervals calculated at the 90% confidence level. Percentages for material types may not total 100% due to rounding.
16.9%
0.5%
100.0%
6.1%
8.7%
1.9%
52.7%

29
Table 19. Area F Garbage Composition, Summer 2014
Estimated Estimated Estimated Estimated
Material Percent + / - Tons Material Percent + / - Tons
Paper 14.9% 4,785 Other Materials 5,410Newspaper 1.1% 0.4% 340 Textiles 2.9% 2.1% 941Plain OCC/Kraft Paper 1.2% 0.4% 378 Carpet/Upholstery 1.5% 1.5% 496Waxed OCC/Kraft Paper 0.0% 0.0% 10 Leather 0.2% 0.2% 72High Grade Paper 0.1% 0.1% 37 Disposable Diapers 3.0% 1.4% 968Mixed Low-grade Paper 4.3% 1.3% 1,400 Animal By-products 4.5% 1.9% 1,452Milk/Juice Polycoated Paper 0.2% 0.1% 75 Rubber Products 0.3% 0.2% 88Frozen Food Polycoated Paper 0.3% 0.1% 107 Tires 0.0% 0.0% 0Compostable/Food Soiled Paper 6.7% 1.0% 2,169 Ash 0.0% 0.0% 0Paper/Other Materials 0.8% 0.3% 269 Furniture 0.0% 0.0% 5
Mattresses 0.0% 0.0% 0Plastic 3,839 Small Appliances 1.0% 1.0% 314
#1 PET Bottles 1.0% 0.2% 336 CRTs 0.0% 0.0% 0#1 PET Other Packaging 0.4% 0.1% 141 Other Electronics 0.7% 1.0% 222#2 HDPE Natural Bottles 0.2% 0.1% 73 Ceramics/Porcelain 0.2% 0.1% 50#2 HDPE Colored Bottles 0.2% 0.1% 72 Non-distinct Fines 1.5% 0.4% 497#2 HDPE Other Packaging 0.1% 0.0% 17 Miscellaneous Organics 0.8% 0.2% 248Other Rigid Plastic Packaging 1.1% 0.1% 365 Miscellaneous Inorganics 0.2% 0.1% 58Expanded Polystyrene 0.7% 0.2% 239Compostable Plastics 0.0% 0.0% 0 Hazardous Wastes 283Plastic Grocery/Merchandise Bags 0.9% 0.2% 291 Latex Paint 0.3% 0.4% 99Other Clean Plastic Consumer Product Bags 0.5% 0.1% 173 Hazardous Adhesives/Glues 0.0% 0.1% 13Plastic Garbage Bags 1.5% 0.7% 481 Non-hazardous Adhesives/Glues 0.0% 0.0% 0Other Plastic Film 2.7% 1.5% 860 Oil-based Paint/Solvent 0.0% 0.0% 0Mixed Rigid Plastics 1.7% 0.8% 557 Hazardous Cleaners 0.0% 0.0% 1Plastic/Other Materials 0.7% 0.1% 233 Pesticides/Herbicides 0.0% 0.0% 0
Non-rechargeable Dry-cell Batteries 0.0% 0.0% 8Glass 2.9% 934 Rechargeable Dry-cell Batteries 0.0% 0.0% 0
Glass Beverage Containers 1.8% 0.1% 589 Wet-cell (car) Batteries 0.0% 0.0% 0Fluorescent Tubes 0.0% 0.1% 0 Asbestos 0.0% 0.0% 0
Other Glass 1.1% 0.0% 345 Explosives 0.0% 0.0% 0Vehicle and Equipment Fluids 0.0% 0.0% 0
Metal 830 Pool Chemicals 0.0% 0.0% 0Aluminum Cans 0.3% 0.1% 113 Other Hazardous Chemicals 0.2% 0.1% 56Aluminum Foil/Containers 0.2% 0.0% 75 Other Non-hazardous Chemicals 0.3% 0.1% 106Other Nonferrous 0.0% 0.0% 9Tin Food Cans 0.8% 0.3% 257 C&D Wastes 790Empty Aerosol Cans 0.1% 0.1% 48 Dimension Lumber 0.1% 0.1% 28Other Ferrous 0.3% 0.2% 97 Pallets/Crates 0.0% 0.0% 0Oil Filters 0.0% 0.0% 6 Treated Wood 0.0% 0.0% 10Mixed Metals/Material 0.7% 0.4% 225 Contaminated Wood 0.6% 0.5% 188
New Gypsum Scrap 0.0% 0.1% 10Organic 15,340 Demo Gypsum Scrap 0.0% 0.0% 0
Leaves & Grass 16.1% 6.9% 5,194 Insulation 0.0% 0.0% 0Unaccepted Yard Waste 1.7% 1.2% 545 Rock/Concrete/Bricks 1.7% 1.9% 536Prunings Less than 2" 9.7% 3.5% 3,110 Asphaltic Roofing 0.0% 0.0% 0Prunings 2" to 12" 1.6% 1.4% 520 Other Construction Debris 0.1% 0.1% 19Prunings Greater than 12" 0.0% 0.0% 0Purchased Food 18.1% 2.8% 5,833 Totals 32,210Homegrown Food 0.0% 0.0% 0Beverages and Liquids 0.4% 0.2% 137 Sample Count 13
Confidence intervals calculated at the 90% confidence level. Percentages for material types may not total 100% due to rounding.
16.8%
0.9%
100.0%
2.5%
11.9%
2.6%
47.6%

30
Table 20. Area G Garbage Composition, Summer 2014
Estimated Estimated Estimated Estimated
Material Percent + / - Tons Material Percent + / - Tons
Paper 14.6% 6,263 Other Materials 8,886
Newspaper 2.1% 1.4% 913 Textiles 4.9% 4.6% 2,104
Plain OCC/Kraft Paper 0.9% 0.3% 389 Carpet/Upholstery 0.7% 0.8% 307
Waxed OCC/Kraft Paper 0.1% 0.2% 53 Leather 0.1% 0.1% 45
High Grade Paper 0.2% 0.2% 105 Disposable Diapers 4.1% 1.5% 1,773
Mixed Low-grade Paper 5.1% 1.0% 2,192 Animal By-products 2.7% 2.0% 1,161
Milk/Juice Polycoated Paper 0.1% 0.1% 43 Rubber Products 0.5% 0.3% 215
Frozen Food Polycoated Paper 0.2% 0.1% 84 Tires 0.0% 0.0% 0
Compostable/Food Soiled Paper 5.2% 1.3% 2,208 Ash 0.0% 0.0% 0
Paper/Other Materials 0.6% 0.2% 278 Furniture 0.0% 0.1% 21
Mattresses 0.0% 0.0% 0
Plastic 4,305 Small Appliances 1.0% 1.3% 428
#1 PET Bottles 1.0% 0.3% 425 CRTs 0.0% 0.0% 0
#1 PET Other Packaging 0.3% 0.1% 115 Other Electronics 0.4% 0.4% 173
#2 HDPE Natural Bottles 0.4% 0.2% 153 Ceramics/Porcelain 0.7% 0.5% 304
#2 HDPE Colored Bottles 0.2% 0.1% 94 Non-distinct Fines 4.2% 3.3% 1,785
#2 HDPE Other Packaging 0.0% 0.0% 7 Miscellaneous Organics 1.2% 0.8% 523
Other Rigid Plastic Packaging 0.8% 0.3% 335 Miscellaneous Inorganics 0.1% 0.0% 46
Expanded Polystyrene 0.7% 0.3% 307
Compostable Plastics 0.0% 0.0% 7 Hazardous Wastes 158
Plastic Grocery/Merchandise Bags 1.1% 0.4% 469 Latex Paint 0.0% 0.1% 15
Other Clean Plastic Consumer Product Bags 0.6% 0.2% 240 Hazardous Adhesives/Glues 0.0% 0.0% 0Plastic Garbage Bags 1.0% 0.2% 417 Non-hazardous Adhesives/Glues 0.0% 0.0% 0
Other Plastic Film 1.1% 0.2% 452 Oil-based Paint/Solvent 0.0% 0.0% 0
Mixed Rigid Plastics 2.1% 1.9% 904 Hazardous Cleaners 0.0% 0.0% 8
Plastic/Other Materials 0.9% 0.4% 379 Pesticides/Herbicides 0.0% 0.0% 5
Non-rechargeable Dry-cell Batteries 0.1% 0.0% 25
Glass 1.9% 817 Rechargeable Dry-cell Batteries 0.0% 0.0% 0
Glass Beverage Containers 1.1% 0.2% 482 Wet-cell (car) Batteries 0.0% 0.0% 0
Fluorescent Tubes 0.0% 0.1% 0 Asbestos 0.0% 0.0% 0
Other Glass 0.8% 0.0% 334 Explosives 0.0% 0.0% 0
Vehicle and Equipment Fluids 0.0% 0.0% 0
Metal 687 Pool Chemicals 0.0% 0.0% 0
Aluminum Cans 0.2% 0.1% 83 Other Hazardous Chemicals 0.1% 0.0% 31
Aluminum Foil/Containers 0.2% 0.1% 65 Other Non-hazardous Chemicals 0.2% 0.1% 74
Other Nonferrous 0.1% 0.1% 32
Tin Food Cans 0.6% 0.2% 255 C&D Wastes 2,512
Empty Aerosol Cans 0.1% 0.1% 48 Dimension Lumber 0.2% 0.2% 86
Other Ferrous 0.2% 0.2% 93 Pallets/Crates 0.3% 0.5% 141
Oil Filters 0.0% 0.0% 0 Treated Wood 1.2% 1.1% 518
Mixed Metals/Material 0.3% 0.1% 110 Contaminated Wood 1.2% 0.6% 509
New Gypsum Scrap 0.0% 0.0% 0
Organic 19,127 Demo Gypsum Scrap 0.0% 0.0% 4
Leaves & Grass 17.6% 7.8% 7,525 Insulation 0.0% 0.0% 3
Unaccepted Yard Waste 5.9% 8.8% 2,513 Rock/Concrete/Bricks 2.9% 3.0% 1,232
Prunings Less than 2" 7.2% 3.7% 3,092 Asphaltic Roofing 0.0% 0.1% 16
Prunings 2" to 12" 0.4% 0.4% 163 Other Construction Debris 0.0% 0.0% 3
Prunings Greater than 12" 0.0% 0.0% 0
Purchased Food 13.3% 3.5% 5,688 Totals 42,755
Homegrown Food 0.0% 0.0% 0Beverages and Liquids 0.3% 0.2% 145 Sample Count 13
Confidence intervals calculated at the 90% confidence level. Percentages for material types may not total 100% due to rounding.
20.8%
0.4%
100.0%
5.9%
10.1%
1.6%
44.7%

31
Table 21. Area H Garbage Composition, Summer 2014
Estimated Estimated Estimated Estimated
Material Percent + / - Tons Material Percent + / - Tons
Paper 19.1% 7,483 Other Materials 6,568
Newspaper 1.6% 0.8% 639 Textiles 2.2% 0.9% 871
Plain OCC/Kraft Paper 1.9% 0.7% 733 Carpet/Upholstery 0.4% 0.3% 152
Waxed OCC/Kraft Paper 0.0% 0.1% 13 Leather 0.0% 0.0% 17
High Grade Paper 0.4% 0.3% 157 Disposable Diapers 4.8% 1.4% 1,881
Mixed Low-grade Paper 7.4% 2.9% 2,888 Animal By-products 3.9% 2.3% 1,537
Milk/Juice Polycoated Paper 0.2% 0.1% 90 Rubber Products 0.7% 0.3% 277
Frozen Food Polycoated Paper 0.3% 0.1% 110 Tires 0.9% 1.5% 350
Compostable/Food Soiled Paper 6.1% 1.4% 2,402 Ash 0.0% 0.0% 0
Paper/Other Materials 1.2% 0.4% 452 Furniture 0.0% 0.0% 0
Mattresses 0.0% 0.0% 0
Plastic 4,465 Small Appliances 0.3% 0.6% 136
#1 PET Bottles 1.2% 0.2% 488 CRTs 0.0% 0.0% 0
#1 PET Other Packaging 0.3% 0.1% 128 Other Electronics 0.2% 0.1% 69
#2 HDPE Natural Bottles 0.3% 0.1% 130 Ceramics/Porcelain 0.3% 0.4% 122
#2 HDPE Colored Bottles 0.3% 0.1% 99 Non-distinct Fines 1.6% 0.4% 615
#2 HDPE Other Packaging 0.1% 0.0% 23 Miscellaneous Organics 1.3% 0.5% 496
Other Rigid Plastic Packaging 1.0% 0.2% 393 Miscellaneous Inorganics 0.1% 0.0% 46
Expanded Polystyrene 1.1% 0.2% 429
Compostable Plastics 0.0% 0.0% 0 Hazardous Wastes 489
Plastic Grocery/Merchandise Bags 1.5% 0.2% 597 Latex Paint 0.0% 0.0% 0
Other Clean Plastic Consumer Product Bags 0.5% 0.2% 213 Hazardous Adhesives/Glues 0.0% 0.0% 1Plastic Garbage Bags 1.2% 0.2% 467 Non-hazardous Adhesives/Glues 0.0% 0.0% 0
Other Plastic Film 1.8% 0.4% 708 Oil-based Paint/Solvent 0.0% 0.0% 0
Mixed Rigid Plastics 0.9% 0.4% 355 Hazardous Cleaners 0.0% 0.0% 0
Plastic/Other Materials 1.1% 0.3% 433 Pesticides/Herbicides 0.0% 0.0% 1
Non-rechargeable Dry-cell Batteries 0.0% 0.0% 16
Glass 2.7% 1,043 Rechargeable Dry-cell Batteries 0.0% 0.0% 11
Glass Beverage Containers 1.9% 0.1% 754 Wet-cell (car) Batteries 0.1% 0.1% 30
Fluorescent Tubes 0.0% 0.1% 0 Asbestos 0.0% 0.0% 0
Other Glass 0.7% 0.0% 290 Explosives 0.0% 0.0% 0
Vehicle and Equipment Fluids 0.0% 0.0% 0
Metal 1,235 Pool Chemicals 0.0% 0.0% 0
Aluminum Cans 0.4% 0.2% 170 Other Hazardous Chemicals 0.8% 1.0% 308
Aluminum Foil/Containers 0.3% 0.1% 105 Other Non-hazardous Chemicals 0.3% 0.1% 121
Other Nonferrous 0.2% 0.2% 90
Tin Food Cans 1.1% 0.4% 443 C&D Wastes 1,182
Empty Aerosol Cans 0.2% 0.1% 84 Dimension Lumber 0.5% 0.6% 192
Other Ferrous 0.3% 0.2% 102 Pallets/Crates 0.0% 0.0% 0
Oil Filters 0.1% 0.1% 21 Treated Wood 0.3% 0.4% 103
Mixed Metals/Material 0.6% 0.7% 221 Contaminated Wood 1.4% 1.3% 563
New Gypsum Scrap 0.2% 0.2% 77
Organic 16,662 Demo Gypsum Scrap 0.1% 0.1% 31
Leaves & Grass 19.4% 6.4% 7,598 Insulation 0.0% 0.0% 1
Unaccepted Yard Waste 0.7% 1.0% 272 Rock/Concrete/Bricks 0.4% 0.3% 141
Prunings Less than 2" 3.4% 1.6% 1,348 Asphaltic Roofing 0.0% 0.0% 0
Prunings 2" to 12" 1.9% 2.8% 753 Other Construction Debris 0.2% 0.2% 74
Prunings Greater than 12" 0.0% 0.0% 0
Purchased Food 16.7% 3.4% 6,550 Totals 39,129
Homegrown Food 0.0% 0.0% 0Beverages and Liquids 0.4% 0.2% 141 Sample Count 13
Confidence intervals calculated at the 90% confidence level. Percentages for material types may not total 100% due to rounding.
16.8%
1.3%
100.0%
3.0%
11.4%
3.2%
42.6%

32
Table 22. Area I Garbage Composition, Summer 2014
Estimated Estimated Estimated Estimated
Material Percent + / - Tons Material Percent + / - Tons
Paper 16.5% 4,399 Other Materials 5,436
Newspaper 1.5% 0.5% 413 Textiles 1.7% 1.0% 445
Plain OCC/Kraft Paper 1.5% 0.9% 395 Carpet/Upholstery 1.7% 2.3% 446
Waxed OCC/Kraft Paper 0.1% 0.1% 20 Leather 0.0% 0.0% 8
High Grade Paper 0.8% 0.3% 202 Disposable Diapers 2.7% 1.0% 711
Mixed Low-grade Paper 2.9% 0.9% 768 Animal By-products 4.3% 1.6% 1,153
Milk/Juice Polycoated Paper 0.4% 0.3% 105 Rubber Products 0.7% 0.7% 197
Frozen Food Polycoated Paper 0.3% 0.1% 73 Tires 0.0% 0.0% 0
Compostable/Food Soiled Paper 8.5% 1.4% 2,260 Ash 0.0% 0.0% 0
Paper/Other Materials 0.6% 0.1% 163 Furniture 0.0% 0.0% 0
Mattresses 0.0% 0.0% 0
Plastic 2,520 Small Appliances 2.4% 3.1% 633
#1 PET Bottles 0.8% 0.1% 215 CRTs 0.0% 0.0% 0
#1 PET Other Packaging 0.3% 0.1% 83 Other Electronics 1.8% 1.5% 486
#2 HDPE Natural Bottles 0.2% 0.1% 54 Ceramics/Porcelain 0.3% 0.3% 88
#2 HDPE Colored Bottles 0.4% 0.1% 99 Non-distinct Fines 2.8% 1.5% 758
#2 HDPE Other Packaging 0.0% 0.0% 5 Miscellaneous Organics 1.8% 1.0% 487
Other Rigid Plastic Packaging 0.8% 0.3% 205 Miscellaneous Inorganics 0.1% 0.0% 24
Expanded Polystyrene 0.6% 0.2% 155
Compostable Plastics 0.0% 0.1% 9 Hazardous Wastes 201
Plastic Grocery/Merchandise Bags 0.9% 0.2% 235 Latex Paint 0.1% 0.1% 23
Other Clean Plastic Consumer Product Bags 0.6% 0.3% 151 Hazardous Adhesives/Glues 0.0% 0.0% 0Plastic Garbage Bags 1.1% 0.2% 302 Non-hazardous Adhesives/Glues 0.0% 0.1% 10
Other Plastic Film 1.8% 0.3% 487 Oil-based Paint/Solvent 0.0% 0.0% 0
Mixed Rigid Plastics 1.0% 0.4% 269 Hazardous Cleaners 0.0% 0.0% 0
Plastic/Other Materials 0.9% 0.2% 249 Pesticides/Herbicides 0.0% 0.0% 0
Non-rechargeable Dry-cell Batteries 0.1% 0.0% 15
Glass 2.0% 535 Rechargeable Dry-cell Batteries 0.1% 0.1% 16
Glass Beverage Containers 1.1% 0.1% 296 Wet-cell (car) Batteries 0.0% 0.0% 0
Fluorescent Tubes 0.0% 0.1% 7 Asbestos 0.0% 0.0% 0
Other Glass 0.9% 0.0% 232 Explosives 0.0% 0.0% 4
Vehicle and Equipment Fluids 0.0% 0.0% 0
Metal 937 Pool Chemicals 0.0% 0.0% 2
Aluminum Cans 0.3% 0.2% 78 Other Hazardous Chemicals 0.1% 0.1% 24
Aluminum Foil/Containers 0.3% 0.1% 75 Other Non-hazardous Chemicals 0.4% 0.2% 107
Other Nonferrous 0.1% 0.1% 23
Tin Food Cans 0.5% 0.2% 144 C&D Wastes 704
Empty Aerosol Cans 0.1% 0.0% 34 Dimension Lumber 0.1% 0.1% 14
Other Ferrous 1.2% 1.3% 325 Pallets/Crates 0.0% 0.0% 0
Oil Filters 0.0% 0.1% 12 Treated Wood 0.0% 0.0% 1
Mixed Metals/Material 0.9% 1.0% 246 Contaminated Wood 0.3% 0.3% 83
New Gypsum Scrap 0.1% 0.2% 31
Organic 11,923 Demo Gypsum Scrap 0.1% 0.2% 32
Leaves & Grass 15.8% 7.0% 4,206 Insulation 0.0% 0.0% 1
Unaccepted Yard Waste 4.1% 2.4% 1,093 Rock/Concrete/Bricks 2.0% 1.1% 530
Prunings Less than 2" 5.5% 2.8% 1,479 Asphaltic Roofing 0.0% 0.1% 11
Prunings 2" to 12" 0.5% 0.5% 120 Other Construction Debris 0.0% 0.0% 0
Prunings Greater than 12" 1.6% 2.7% 438
Purchased Food 16.0% 3.3% 4,254 Totals 26,654
Homegrown Food 0.6% 1.0% 158Beverages and Liquids 0.7% 0.4% 175 Sample Count 13
Confidence intervals calculated at the 90% confidence level. Percentages for material types may not total 100% due to rounding.
20.4%
0.8%
100.0%
2.6%
9.5%
3.5%
44.7%

33
Table 23. Area J Garbage Composition, Summer 2014
Estimated Estimated Estimated Estimated
Material Percent + / - Tons Material Percent + / - Tons
Paper 15.3% 4,385 Other Materials 5,224
Newspaper 1.3% 0.5% 382 Textiles 1.6% 0.4% 468
Plain OCC/Kraft Paper 1.2% 0.6% 349 Carpet/Upholstery 1.8% 1.7% 504
Waxed OCC/Kraft Paper 0.1% 0.1% 28 Leather 0.1% 0.1% 29
High Grade Paper 0.6% 0.4% 185 Disposable Diapers 3.8% 2.2% 1,080
Mixed Low-grade Paper 4.0% 1.3% 1,155 Animal By-products 4.3% 2.6% 1,225
Milk/Juice Polycoated Paper 0.1% 0.1% 31 Rubber Products 0.7% 0.6% 203
Frozen Food Polycoated Paper 0.2% 0.1% 55 Tires 0.0% 0.0% 0
Compostable/Food Soiled Paper 6.8% 1.4% 1,962 Ash 0.0% 0.0% 0
Paper/Other Materials 0.8% 0.2% 237 Furniture 0.0% 0.0% 0
Mattresses 0.0% 0.0% 0
Plastic 2,576 Small Appliances 0.1% 0.1% 27
#1 PET Bottles 0.9% 0.1% 253 CRTs 0.0% 0.0% 0
#1 PET Other Packaging 0.4% 0.2% 101 Other Electronics 0.2% 0.2% 67
#2 HDPE Natural Bottles 0.2% 0.1% 66 Ceramics/Porcelain 0.7% 0.8% 189
#2 HDPE Colored Bottles 0.3% 0.1% 89 Non-distinct Fines 3.2% 1.3% 929
#2 HDPE Other Packaging 0.0% 0.0% 1 Miscellaneous Organics 1.6% 1.2% 448
Other Rigid Plastic Packaging 0.9% 0.3% 265 Miscellaneous Inorganics 0.2% 0.1% 57
Expanded Polystyrene 0.5% 0.1% 144
Compostable Plastics 0.0% 0.0% 5 Hazardous Wastes 143
Plastic Grocery/Merchandise Bags 0.8% 0.1% 225 Latex Paint 0.0% 0.0% 8
Other Clean Plastic Consumer Product Bags 0.4% 0.2% 106 Hazardous Adhesives/Glues 0.0% 0.0% 0Plastic Garbage Bags 1.1% 0.2% 303 Non-hazardous Adhesives/Glues 0.0% 0.0% 0
Other Plastic Film 1.7% 0.4% 491 Oil-based Paint/Solvent 0.0% 0.0% 0
Mixed Rigid Plastics 1.0% 0.5% 290 Hazardous Cleaners 0.0% 0.0% 0
Plastic/Other Materials 0.8% 0.2% 237 Pesticides/Herbicides 0.0% 0.0% 0
Non-rechargeable Dry-cell Batteries 0.0% 0.0% 4
Glass 3.4% 966 Rechargeable Dry-cell Batteries 0.0% 0.0% 3
Glass Beverage Containers 2.0% 0.1% 580 Wet-cell (car) Batteries 0.0% 0.0% 0
Fluorescent Tubes 0.0% 0.1% 3 Asbestos 0.0% 0.0% 0
Other Glass 1.3% 0.0% 384 Explosives 0.0% 0.0% 0
Vehicle and Equipment Fluids 0.0% 0.0% 2
Metal 1,308 Pool Chemicals 0.0% 0.0% 0
Aluminum Cans 0.4% 0.1% 103 Other Hazardous Chemicals 0.1% 0.1% 32
Aluminum Foil/Containers 0.3% 0.1% 80 Other Non-hazardous Chemicals 0.3% 0.2% 93
Other Nonferrous 0.6% 0.8% 169
Tin Food Cans 0.6% 0.3% 183 C&D Wastes 996
Empty Aerosol Cans 0.1% 0.1% 41 Dimension Lumber 0.4% 0.5% 124
Other Ferrous 1.2% 1.4% 336 Pallets/Crates 0.0% 0.0% 0
Oil Filters 0.0% 0.0% 0 Treated Wood 1.7% 1.7% 485
Mixed Metals/Material 1.4% 0.9% 397 Contaminated Wood 0.5% 0.4% 145
New Gypsum Scrap 0.0% 0.0% 0
Organic 13,147 Demo Gypsum Scrap 0.0% 0.0% 0
Leaves & Grass 19.5% 6.6% 5,598 Insulation 0.0% 0.0% 0
Unaccepted Yard Waste 2.4% 1.3% 692 Rock/Concrete/Bricks 0.7% 0.7% 203
Prunings Less than 2" 7.9% 3.6% 2,275 Asphaltic Roofing 0.1% 0.1% 34
Prunings 2" to 12" 0.9% 0.8% 268 Other Construction Debris 0.0% 0.0% 4
Prunings Greater than 12" 0.0% 0.0% 0
Purchased Food 12.8% 3.2% 3,671 Totals 28,746
Homegrown Food 1.7% 2.0% 500Beverages and Liquids 0.5% 0.3% 143 Sample Count 13
Confidence intervals calculated at the 90% confidence level. Percentages for material types may not total 100% due to rounding.
18.2%
0.5%
100.0%
3.5%
9.0%
4.5%
45.7%
34
Table 24. Citywide Recycling Composition, Summer 2014
Estimated Estimated Estimated Estimated
Material Percent + / - Tons Material Percent + / - Tons
Paper 57.1% 58,202 Other Materials 8,440
Newspaper 9.9% 0.9% 10,041 Textiles 2.5% 0.4% 2,582
Plain OCC/Kraft Paper 19.4% 1.5% 19,754 Carpet/Upholstery 0.4% 0.4% 364
Waxed OCC/Kraft Paper 0.0% 0.1% 45 Leather 0.1% 0.1% 60
High Grade Paper 1.0% 0.3% 996 Disposable Diapers 0.6% 0.2% 572
Mixed Low-grade Paper 23.6% 1.2% 24,085 Animal By-products 0.0% 0.0% 22
Milk/Juice Polycoated Paper 0.4% 0.0% 382 Rubber Products 0.3% 0.1% 334
Frozen Food Polycoated Paper 0.0% 0.0% 49 Tires 0.1% 0.1% 89
Compostable/Food Soiled Paper 1.5% 0.3% 1,515 Ash 0.0% 0.0% 0
Paper/Other Materials 1.3% 0.3% 1,335 Furniture 0.1% 0.1% 136
Mattresses 0.0% 0.0% 0
Plastic 17,758 Small Appliances 0.0% 0.0% 44
#1 PET Bottles 4.5% 0.3% 4,569 CRTs 0.0% 0.0% 0
#1 PET Other Packaging 0.9% 0.1% 874 Other Electronics 1.0% 0.3% 1,024
#2 HDPE Natural Bottles 1.9% 0.1% 1,924 Ceramics/Porcelain 0.1% 0.1% 150
#2 HDPE Colored Bottles 1.5% 0.1% 1,531 Non-distinct Fines 2.7% 0.4% 2,734
#2 HDPE Other Packaging 0.3% 0.1% 280 Miscellaneous Organics 0.2% 0.1% 166
Other Rigid Plastic Packaging 1.7% 0.2% 1,685 Miscellaneous Inorganics 0.2% 0.1% 162
Expanded Polystyrene 0.6% 0.1% 657
Compostable Plastics 0.0% 0.0% 1 Hazardous Wastes 199
Plastic Grocery/Merchandise Bags 0.7% 0.1% 731 Latex Paint 0.0% 0.0% 30
Other Clean Plastic Consumer Product Bags 0.2% 0.1% 165 Hazardous Adhesives/Glues 0.0% 0.0% 1Plastic Garbage Bags 0.3% 0.0% 345 Non-hazardous Adhesives/Glues 0.0% 0.0% 2
Other Plastic Film 1.8% 0.2% 1,863 Oil-based Paint/Solvent 0.0% 0.0% 2
Mixed Rigid Plastics 2.0% 0.3% 2,078 Hazardous Cleaners 0.0% 0.1% 48
Plastic/Other Materials 1.0% 0.3% 1,056 Pesticides/Herbicides 0.0% 0.0% 6
Non-rechargeable Dry-cell Batteries 0.0% 0.0% 41
Glass 8.6% 8,760 Rechargeable Dry-cell Batteries 0.0% 0.0% 3
Glass Beverage Containers 8.2% 0.1% 8,383 Wet-cell (car) Batteries 0.0% 0.0% 0
Fluorescent Tubes 0.0% 0.1% 38 Asbestos 0.0% 0.0% 0
Other Glass 0.3% 0.1% 339 Explosives 0.0% 0.0% 0
Vehicle and Equipment Fluids 0.0% 0.0% 7
Metal 4,308 Pool Chemicals 0.0% 0.0% 0
Aluminum Cans 1.0% 0.1% 1,060 Other Hazardous Chemicals 0.0% 0.0% 13
Aluminum Foil/Containers 0.1% 0.0% 108 Other Non-hazardous Chemicals 0.0% 0.0% 48
Other Nonferrous 0.2% 0.0% 168
Tin Food Cans 1.5% 0.1% 1,512 C&D Wastes 1,423
Empty Aerosol Cans 0.2% 0.1% 184 Dimension Lumber 0.0% 0.0% 15
Other Ferrous 0.8% 0.2% 774 Pallets/Crates 0.0% 0.0% 0
Oil Filters 0.0% 0.0% 11 Treated Wood 0.3% 0.1% 286
Mixed Metals/Material 0.5% 0.2% 491 Contaminated Wood 0.5% 0.3% 546
New Gypsum Scrap 0.0% 0.0% 1
Organic 2,792 Demo Gypsum Scrap 0.0% 0.0% 4
Leaves & Grass 0.7% 0.4% 723 Insulation 0.0% 0.0% 11
Unaccepted Yard Waste 0.1% 0.0% 59 Rock/Concrete/Bricks 0.2% 0.1% 181
Prunings Less than 2" 0.0% 0.0% 18 Asphaltic Roofing 0.2% 0.3% 222
Prunings 2" to 12" 0.1% 0.1% 66 Other Construction Debris 0.2% 0.1% 158
Prunings Greater than 12" 0.0% 0.0% 21
Purchased Food 1.5% 0.3% 1,523 Totals 101,882
Homegrown Food 0.0% 0.0% 46Beverages and Liquids 0.3% 0.1% 335 Sample Count 101
Confidence intervals calculated at the 90% confidence level. Percentages for material types may not total 100% due to rounding.
8.3%
0.2%
100.0%
1.4%
17.4%
4.2%
2.7%

35
Table 25. Area A Recycling Composition, Summer 2014
Estimated Estimated Estimated Estimated
Material Percent + / - Tons Material Percent + / - Tons
Paper 48.0% 5,160 Other Materials 1,354
Newspaper 6.2% 3.2% 670 Textiles 3.4% 1.3% 366
Plain OCC/Kraft Paper 18.4% 3.5% 1,975 Carpet/Upholstery 0.3% 0.5% 35
Waxed OCC/Kraft Paper 0.0% 0.1% 4 Leather 0.0% 0.0% 0
High Grade Paper 1.1% 0.7% 119 Disposable Diapers 0.9% 0.4% 93
Mixed Low-grade Paper 19.3% 2.6% 2,072 Animal By-products 0.0% 0.1% 5
Milk/Juice Polycoated Paper 0.3% 0.2% 31 Rubber Products 0.9% 0.9% 93
Frozen Food Polycoated Paper 0.1% 0.1% 5 Tires 0.0% 0.0% 0
Compostable/Food Soiled Paper 1.3% 0.3% 137 Ash 0.0% 0.0% 0
Paper/Other Materials 1.4% 0.4% 146 Furniture 0.0% 0.0% 0
Mattresses 0.0% 0.0% 0
Plastic 1,907 Small Appliances 0.2% 0.3% 22
#1 PET Bottles 4.7% 0.7% 504 CRTs 0.0% 0.0% 0
#1 PET Other Packaging 0.6% 0.2% 62 Other Electronics 1.9% 1.4% 205
#2 HDPE Natural Bottles 2.2% 0.4% 240 Ceramics/Porcelain 0.2% 0.2% 26
#2 HDPE Colored Bottles 1.6% 0.5% 176 Non-distinct Fines 4.1% 2.1% 443
#2 HDPE Other Packaging 0.2% 0.1% 18 Miscellaneous Organics 0.5% 0.4% 55
Other Rigid Plastic Packaging 1.6% 0.4% 172 Miscellaneous Inorganics 0.1% 0.1% 13
Expanded Polystyrene 0.8% 0.2% 91
Compostable Plastics 0.0% 0.0% 0 Hazardous Wastes 43
Plastic Grocery/Merchandise Bags 0.8% 0.2% 89 Latex Paint 0.3% 0.4% 30
Other Clean Plastic Consumer Product Bags0.1% 0.1% 8 Hazardous Adhesives/Glues 0.0% 0.0% 0Plastic Garbage Bags 0.4% 0.2% 46 Non-hazardous Adhesives/Glues 0.0% 0.0% 0
Other Plastic Film 2.2% 0.7% 241 Oil-based Paint/Solvent 0.0% 0.0% 0
Mixed Rigid Plastics 1.6% 0.8% 173 Hazardous Cleaners 0.0% 0.0% 0
Plastic/Other Materials 0.8% 0.4% 88 Pesticides/Herbicides 0.0% 0.0% 0
Non-rechargeable Dry-cell Batteries 0.1% 0.0% 6
Glass 6.7% 724 Rechargeable Dry-cell Batteries 0.0% 0.0% 1
Glass Beverage Containers 6.2% 0.4% 672 Wet-cell (car) Batteries 0.0% 0.0% 0
Fluorescent Tubes 0.0% 0.5% 0 Asbestos 0.0% 0.0% 0
Other Glass 0.5% 0.1% 53 Explosives 0.0% 0.0% 0
Vehicle and Equipment Fluids 0.0% 0.0% 0
Metal 436 Pool Chemicals 0.0% 0.0% 0
Aluminum Cans 0.7% 0.2% 77 Other Hazardous Chemicals 0.0% 0.0% 0
Aluminum Foil/Containers 0.2% 0.1% 18 Other Non-hazardous Chemicals 0.1% 0.0% 6
Other Nonferrous 0.3% 0.2% 35
Tin Food Cans 1.4% 0.5% 152 C&D Wastes 410
Empty Aerosol Cans 0.2% 0.1% 19 Dimension Lumber 0.0% 0.0% 0
Other Ferrous 1.0% 0.9% 111 Pallets/Crates 0.0% 0.0% 0
Oil Filters 0.1% 0.2% 11 Treated Wood 0.7% 0.8% 72
Mixed Metals/Material 0.1% 0.1% 14 Contaminated Wood 0.5% 0.6% 52
New Gypsum Scrap 0.0% 0.0% 0
Organic 721 Demo Gypsum Scrap 0.0% 0.0% 0
Leaves & Grass 3.1% 3.4% 334 Insulation 0.0% 0.1% 3
Unaccepted Yard Waste 0.3% 0.4% 29 Rock/Concrete/Bricks 0.8% 0.9% 87
Prunings Less than 2" 0.0% 0.0% 1 Asphaltic Roofing 1.8% 2.9% 193
Prunings 2" to 12" 0.5% 0.9% 58 Other Construction Debris 0.0% 0.0% 3
Prunings Greater than 12" 0.0% 0.0% 0
Purchased Food 2.2% 0.8% 233 Totals 10,756
Homegrown Food 0.0% 0.0% 1
Beverages and Liquids 0.6% 0.4% 65 Sample Count 11
Confidence intervals calculated at the 90% confidence level. Percentages for material types may not total 100% due to rounding.
12.6%
0.4%
100.0%
3.8%
17.7%
4.1%
6.7%

36
Table 26. Area B Recycling Composition, Summer 2014
Estimated Estimated Estimated Estimated
Material Percent + / - Tons Material Percent + / - Tons
Paper 59.5% 6,712 Other Materials 753
Newspaper 9.8% 2.4% 1,101 Textiles 2.0% 1.2% 220
Plain OCC/Kraft Paper 20.0% 6.1% 2,254 Carpet/Upholstery 0.0% 0.0% 0
Waxed OCC/Kraft Paper 0.0% 0.0% 0 Leather 0.0% 0.0% 0
High Grade Paper 1.4% 1.1% 156 Disposable Diapers 0.2% 0.1% 18
Mixed Low-grade Paper 25.4% 3.5% 2,868 Animal By-products 0.0% 0.0% 0
Milk/Juice Polycoated Paper 0.2% 0.1% 28 Rubber Products 0.1% 0.1% 14
Frozen Food Polycoated Paper 0.0% 0.1% 5 Tires 0.2% 0.3% 20
Compostable/Food Soiled Paper 1.8% 1.2% 206 Ash 0.0% 0.0% 0
Paper/Other Materials 0.8% 0.2% 95 Furniture 0.0% 0.0% 0
Mattresses 0.0% 0.0% 0
Plastic 2,152 Small Appliances 0.0% 0.0% 0
#1 PET Bottles 5.5% 1.1% 618 CRTs 0.0% 0.0% 0
#1 PET Other Packaging 0.8% 0.2% 94 Other Electronics 1.9% 1.5% 216
#2 HDPE Natural Bottles 2.5% 0.6% 286 Ceramics/Porcelain 0.1% 0.1% 9
#2 HDPE Colored Bottles 1.9% 0.6% 212 Non-distinct Fines 2.1% 1.1% 237
#2 HDPE Other Packaging 0.2% 0.2% 20 Miscellaneous Organics 0.2% 0.2% 19
Other Rigid Plastic Packaging 2.0% 0.6% 225 Miscellaneous Inorganics 0.0% 0.0% 1
Expanded Polystyrene 0.5% 0.1% 54
Compostable Plastics 0.0% 0.0% 0 Hazardous Wastes 6
Plastic Grocery/Merchandise Bags 0.8% 0.2% 88 Latex Paint 0.0% 0.0% 0
Other Clean Plastic Consumer Product Bags0.2% 0.1% 21 Hazardous Adhesives/Glues 0.0% 0.0% 0Plastic Garbage Bags 0.3% 0.1% 30 Non-hazardous Adhesives/Glues 0.0% 0.0% 0
Other Plastic Film 1.5% 0.3% 173 Oil-based Paint/Solvent 0.0% 0.0% 0
Mixed Rigid Plastics 2.1% 1.3% 232 Hazardous Cleaners 0.0% 0.0% 0
Plastic/Other Materials 0.9% 0.3% 98 Pesticides/Herbicides 0.0% 0.0% 0
Non-rechargeable Dry-cell Batteries 0.0% 0.1% 5
Glass 8.0% 907 Rechargeable Dry-cell Batteries 0.0% 0.0% 1
Glass Beverage Containers 7.9% 0.6% 896 Wet-cell (car) Batteries 0.0% 0.0% 0
Fluorescent Tubes 0.0% 0.6% 0 Asbestos 0.0% 0.0% 0
Other Glass 0.1% 0.2% 11 Explosives 0.0% 0.0% 0
Vehicle and Equipment Fluids 0.0% 0.0% 0
Metal 518 Pool Chemicals 0.0% 0.0% 0
Aluminum Cans 1.0% 0.2% 109 Other Hazardous Chemicals 0.0% 0.0% 0
Aluminum Foil/Containers 0.1% 0.1% 14 Other Non-hazardous Chemicals 0.0% 0.0% 1
Other Nonferrous 0.2% 0.3% 22
Tin Food Cans 1.6% 0.4% 175 C&D Wastes 98
Empty Aerosol Cans 0.1% 0.1% 10 Dimension Lumber 0.0% 0.0% 0
Other Ferrous 0.9% 0.9% 98 Pallets/Crates 0.0% 0.0% 0
Oil Filters 0.0% 0.0% 0 Treated Wood 0.3% 0.2% 29
Mixed Metals/Material 0.8% 0.7% 90 Contaminated Wood 0.4% 0.5% 44
New Gypsum Scrap 0.0% 0.0% 0
Organic 130 Demo Gypsum Scrap 0.0% 0.1% 4
Leaves & Grass 0.1% 0.2% 14 Insulation 0.0% 0.0% 0
Unaccepted Yard Waste 0.0% 0.0% 3 Rock/Concrete/Bricks 0.0% 0.0% 0
Prunings Less than 2" 0.0% 0.0% 3 Asphaltic Roofing 0.0% 0.0% 0
Prunings 2" to 12" 0.0% 0.0% 0 Other Construction Debris 0.2% 0.3% 21
Prunings Greater than 12" 0.0% 0.0% 0
Purchased Food 0.7% 0.4% 76 Totals 11,277
Homegrown Food 0.0% 0.0% 0
Beverages and Liquids 0.3% 0.3% 34 Sample Count 8
Confidence intervals calculated at the 90% confidence level. Percentages for material types may not total 100% due to rounding.
6.7%
0.1%
100.0%
0.9%
19.1%
4.6%
1.2%

37
Table 27. Area C Recycling Composition, Summer 2014
Estimated Estimated Estimated Estimated
Material Percent + / - Tons Material Percent + / - Tons
Paper 63.8% 9,103 Other Materials 906
Newspaper 9.5% 1.6% 1,352 Textiles 3.7% 1.4% 525
Plain OCC/Kraft Paper 19.6% 4.0% 2,802 Carpet/Upholstery 0.0% 0.0% 0
Waxed OCC/Kraft Paper 0.2% 0.4% 35 Leather 0.0% 0.0% 1
High Grade Paper 1.6% 1.3% 221 Disposable Diapers 0.0% 0.0% 3
Mixed Low-grade Paper 28.9% 4.8% 4,120 Animal By-products 0.0% 0.0% 0
Milk/Juice Polycoated Paper 0.5% 0.1% 75 Rubber Products 0.4% 0.3% 55
Frozen Food Polycoated Paper 0.0% 0.0% 4 Tires 0.0% 0.0% 0
Compostable/Food Soiled Paper 1.1% 0.5% 154 Ash 0.0% 0.0% 0
Paper/Other Materials 2.4% 1.7% 341 Furniture 0.0% 0.0% 0
Mattresses 0.0% 0.0% 0
Plastic 2,275 Small Appliances 0.0% 0.0% 0
#1 PET Bottles 4.3% 0.8% 612 CRTs 0.0% 0.0% 0
#1 PET Other Packaging 0.7% 0.3% 103 Other Electronics 0.9% 0.8% 127
#2 HDPE Natural Bottles 1.6% 0.3% 222 Ceramics/Porcelain 0.1% 0.1% 11
#2 HDPE Colored Bottles 1.2% 0.3% 166 Non-distinct Fines 1.2% 0.5% 176
#2 HDPE Other Packaging 0.1% 0.1% 21 Miscellaneous Organics 0.0% 0.0% 3
Other Rigid Plastic Packaging 1.4% 0.3% 196 Miscellaneous Inorganics 0.0% 0.1% 7
Expanded Polystyrene 0.6% 0.4% 89
Compostable Plastics 0.0% 0.0% 1 Hazardous Wastes 13
Plastic Grocery/Merchandise Bags 0.5% 0.1% 71 Latex Paint 0.0% 0.0% 0
Other Clean Plastic Consumer Product Bags 0.2% 0.1% 27 Hazardous Adhesives/Glues 0.0% 0.0% 0Plastic Garbage Bags 0.3% 0.1% 40 Non-hazardous Adhesives/Glues 0.0% 0.0% 0
Other Plastic Film 2.2% 0.5% 318 Oil-based Paint/Solvent 0.0% 0.0% 0
Mixed Rigid Plastics 1.4% 0.4% 197 Hazardous Cleaners 0.0% 0.0% 0
Plastic/Other Materials 1.5% 0.8% 212 Pesticides/Herbicides 0.0% 0.0% 0
Non-rechargeable Dry-cell Batteries 0.1% 0.1% 9
Glass 7.4% 1,049 Rechargeable Dry-cell Batteries 0.0% 0.0% 1
Glass Beverage Containers 7.3% 0.3% 1,040 Wet-cell (car) Batteries 0.0% 0.0% 0
Fluorescent Tubes 0.0% 0.3% 0 Asbestos 0.0% 0.0% 0
Other Glass 0.1% 0.1% 9 Explosives 0.0% 0.0% 0
Vehicle and Equipment Fluids 0.0% 0.0% 0
Metal 625 Pool Chemicals 0.0% 0.0% 0
Aluminum Cans 1.3% 0.3% 182 Other Hazardous Chemicals 0.0% 0.0% 0
Aluminum Foil/Containers 0.1% 0.0% 10 Other Non-hazardous Chemicals 0.0% 0.0% 4
Other Nonferrous 0.0% 0.0% 4
Tin Food Cans 1.4% 0.5% 199 C&D Wastes 146
Empty Aerosol Cans 0.2% 0.2% 23 Dimension Lumber 0.0% 0.0% 0
Other Ferrous 0.8% 0.6% 112 Pallets/Crates 0.0% 0.0% 0
Oil Filters 0.0% 0.0% 0 Treated Wood 0.1% 0.1% 10
Mixed Metals/Material 0.7% 1.0% 95 Contaminated Wood 0.5% 0.5% 70
New Gypsum Scrap 0.0% 0.0% 1
Organic 152 Demo Gypsum Scrap 0.0% 0.0% 0
Leaves & Grass 0.0% 0.1% 6 Insulation 0.0% 0.0% 0
Unaccepted Yard Waste 0.1% 0.1% 11 Rock/Concrete/Bricks 0.2% 0.3% 29
Prunings Less than 2" 0.0% 0.0% 0 Asphaltic Roofing 0.0% 0.0% 0
Prunings 2" to 12" 0.0% 0.0% 0 Other Construction Debris 0.3% 0.3% 37
Prunings Greater than 12" 0.0% 0.0% 0
Purchased Food 0.8% 0.6% 119 Totals 14,270
Homegrown Food 0.0% 0.0% 0Beverages and Liquids 0.1% 0.1% 17 Sample Count 10
Confidence intervals calculated at the 90% confidence level. Percentages for material types may not total 100% due to rounding.
6.4%
0.1%
100.0%
1.0%
15.9%
4.4%
1.1%

38
Table 28. Area D Recycling Composition, Summer 2014
Estimated Estimated Estimated Estimated
Material Percent + / - Tons Material Percent + / - Tons
Paper 62.0% 6,463 Other Materials 611
Newspaper 18.3% 4.0% 1,911 Textiles 1.5% 0.8% 158
Plain OCC/Kraft Paper 14.5% 3.5% 1,515 Carpet/Upholstery 0.0% 0.0% 0
Waxed OCC/Kraft Paper 0.0% 0.0% 0 Leather 0.0% 0.0% 1
High Grade Paper 0.7% 0.4% 71 Disposable Diapers 0.3% 0.2% 31
Mixed Low-grade Paper 24.7% 3.9% 2,574 Animal By-products 0.0% 0.1% 4
Milk/Juice Polycoated Paper 0.5% 0.2% 50 Rubber Products 0.2% 0.1% 22
Frozen Food Polycoated Paper 0.0% 0.0% 2 Tires 0.0% 0.0% 0
Compostable/Food Soiled Paper 1.4% 0.8% 147 Ash 0.0% 0.0% 0
Paper/Other Materials 1.9% 1.4% 194 Furniture 0.2% 0.3% 19
Mattresses 0.0% 0.0% 0
Plastic 1,491 Small Appliances 0.2% 0.3% 21
#1 PET Bottles 3.5% 0.9% 367 CRTs 0.0% 0.0% 0
#1 PET Other Packaging 0.6% 0.2% 59 Other Electronics 0.4% 0.4% 39
#2 HDPE Natural Bottles 1.3% 0.4% 136 Ceramics/Porcelain 0.3% 0.4% 27
#2 HDPE Colored Bottles 1.1% 0.3% 119 Non-distinct Fines 2.4% 1.1% 246
#2 HDPE Other Packaging 0.1% 0.1% 15 Miscellaneous Organics 0.0% 0.0% 1
Other Rigid Plastic Packaging 1.9% 0.8% 194 Miscellaneous Inorganics 0.4% 0.5% 42
Expanded Polystyrene 0.7% 0.3% 73
Compostable Plastics 0.0% 0.0% 0 Hazardous Wastes 16
Plastic Grocery/Merchandise Bags 0.6% 0.2% 59 Latex Paint 0.0% 0.0% 0
Other Clean Plastic Consumer Product Bags 0.1% 0.1% 8 Hazardous Adhesives/Glues 0.0% 0.0% 0Plastic Garbage Bags 0.3% 0.1% 35 Non-hazardous Adhesives/Glues 0.0% 0.0% 0
Other Plastic Film 1.2% 0.4% 126 Oil-based Paint/Solvent 0.0% 0.0% 0
Mixed Rigid Plastics 2.3% 1.2% 243 Hazardous Cleaners 0.0% 0.0% 0
Plastic/Other Materials 0.6% 0.2% 57 Pesticides/Herbicides 0.1% 0.1% 6
Non-rechargeable Dry-cell Batteries 0.0% 0.0% 1
Glass 10.3% 1,071 Rechargeable Dry-cell Batteries 0.0% 0.0% 0
Glass Beverage Containers 9.8% 0.4% 1,021 Wet-cell (car) Batteries 0.0% 0.0% 0
Fluorescent Tubes 0.0% 0.3% 0 Asbestos 0.0% 0.0% 0
Other Glass 0.5% 0.1% 50 Explosives 0.0% 0.0% 0
Vehicle and Equipment Fluids 0.0% 0.0% 0
Metal 395 Pool Chemicals 0.0% 0.0% 0
Aluminum Cans 1.0% 0.3% 101 Other Hazardous Chemicals 0.0% 0.0% 0
Aluminum Foil/Containers 0.1% 0.0% 9 Other Non-hazardous Chemicals 0.1% 0.1% 8
Other Nonferrous 0.2% 0.1% 18
Tin Food Cans 1.4% 0.3% 143 C&D Wastes 41
Empty Aerosol Cans 0.1% 0.1% 15 Dimension Lumber 0.0% 0.0% 0
Other Ferrous 0.2% 0.1% 22 Pallets/Crates 0.0% 0.0% 0
Oil Filters 0.0% 0.0% 0 Treated Wood 0.2% 0.2% 24
Mixed Metals/Material 0.8% 0.7% 87 Contaminated Wood 0.0% 0.1% 4
New Gypsum Scrap 0.0% 0.0% 0
Organic 333 Demo Gypsum Scrap 0.0% 0.0% 0
Leaves & Grass 0.8% 1.1% 86 Insulation 0.0% 0.0% 0
Unaccepted Yard Waste 0.0% 0.1% 5 Rock/Concrete/Bricks 0.0% 0.0% 0
Prunings Less than 2" 0.1% 0.1% 6 Asphaltic Roofing 0.0% 0.0% 0
Prunings 2" to 12" 0.0% 0.0% 0 Other Construction Debris 0.1% 0.2% 12
Prunings Greater than 12" 0.0% 0.0% 0
Purchased Food 1.8% 1.2% 192 Totals 10,421
Homegrown Food 0.1% 0.1% 7Beverages and Liquids 0.4% 0.3% 39 Sample Count 12
Confidence intervals calculated at the 90% confidence level. Percentages for material types may not total 100% due to rounding.
5.9%
0.1%
100.0%
0.4%
14.3%
3.8%
3.2%

39
Table 29. Area E Recycling Composition, Summer 2014
Estimated Estimated Estimated Estimated
Material Percent + / - Tons Material Percent + / - Tons
Paper 54.4% 4,808 Other Materials 885
Newspaper 10.2% 3.1% 897 Textiles 2.1% 1.1% 182
Plain OCC/Kraft Paper 15.1% 3.0% 1,331 Carpet/Upholstery 1.6% 2.7% 146
Waxed OCC/Kraft Paper 0.0% 0.0% 0 Leather 0.0% 0.0% 2
High Grade Paper 1.2% 0.6% 106 Disposable Diapers 0.6% 0.7% 55
Mixed Low-grade Paper 25.4% 3.5% 2,247 Animal By-products 0.0% 0.0% 0
Milk/Juice Polycoated Paper 0.3% 0.2% 25 Rubber Products 0.1% 0.1% 11
Frozen Food Polycoated Paper 0.1% 0.1% 6 Tires 0.0% 0.0% 0
Compostable/Food Soiled Paper 1.4% 0.4% 119 Ash 0.0% 0.0% 0
Paper/Other Materials 0.9% 0.5% 76 Furniture 1.3% 1.7% 118
Mattresses 0.0% 0.0% 0
Plastic 1,400 Small Appliances 0.0% 0.0% 0
#1 PET Bottles 3.9% 0.7% 346 CRTs 0.0% 0.0% 0
#1 PET Other Packaging 0.6% 0.3% 55 Other Electronics 0.2% 0.2% 16
#2 HDPE Natural Bottles 1.7% 0.6% 148 Ceramics/Porcelain 0.1% 0.2% 12
#2 HDPE Colored Bottles 1.5% 0.4% 129 Non-distinct Fines 3.6% 1.0% 322
#2 HDPE Other Packaging 0.1% 0.1% 12 Miscellaneous Organics 0.1% 0.1% 8
Other Rigid Plastic Packaging 1.8% 0.8% 159 Miscellaneous Inorganics 0.2% 0.2% 13
Expanded Polystyrene 0.8% 0.5% 72
Compostable Plastics 0.0% 0.0% 0 Hazardous Wastes 10
Plastic Grocery/Merchandise Bags 0.6% 0.3% 56 Latex Paint 0.0% 0.0% 0
Other Clean Plastic Consumer Product Bags 0.0% 0.1% 4 Hazardous Adhesives/Glues 0.0% 0.0% 0Plastic Garbage Bags 0.4% 0.1% 34 Non-hazardous Adhesives/Glues 0.0% 0.0% 0
Other Plastic Film 1.6% 0.6% 140 Oil-based Paint/Solvent 0.0% 0.0% 0
Mixed Rigid Plastics 2.3% 0.8% 205 Hazardous Cleaners 0.0% 0.0% 0
Plastic/Other Materials 0.4% 0.1% 38 Pesticides/Herbicides 0.0% 0.0% 0
Non-rechargeable Dry-cell Batteries 0.0% 0.0% 2
Glass 9.5% 837 Rechargeable Dry-cell Batteries 0.0% 0.0% 0
Glass Beverage Containers 8.2% 0.6% 724 Wet-cell (car) Batteries 0.0% 0.0% 0
Fluorescent Tubes 0.0% 0.4% 0 Asbestos 0.0% 0.0% 0
Other Glass 1.3% 0.1% 113 Explosives 0.0% 0.0% 0
Vehicle and Equipment Fluids 0.0% 0.0% 0
Metal 356 Pool Chemicals 0.0% 0.0% 0
Aluminum Cans 0.8% 0.2% 75 Other Hazardous Chemicals 0.0% 0.0% 1
Aluminum Foil/Containers 0.1% 0.1% 11 Other Non-hazardous Chemicals 0.1% 0.1% 7
Other Nonferrous 0.1% 0.1% 11
Tin Food Cans 1.8% 0.3% 162 C&D Wastes 189
Empty Aerosol Cans 0.1% 0.1% 10 Dimension Lumber 0.0% 0.0% 0
Other Ferrous 0.5% 0.2% 44 Pallets/Crates 0.0% 0.0% 0
Oil Filters 0.0% 0.0% 0 Treated Wood 0.4% 0.3% 32
Mixed Metals/Material 0.5% 0.4% 43 Contaminated Wood 1.3% 2.0% 118
New Gypsum Scrap 0.0% 0.0% 0
Organic 355 Demo Gypsum Scrap 0.0% 0.0% 0
Leaves & Grass 2.0% 2.0% 173 Insulation 0.0% 0.0% 0
Unaccepted Yard Waste 0.0% 0.0% 1 Rock/Concrete/Bricks 0.4% 0.5% 31
Prunings Less than 2" 0.0% 0.0% 1 Asphaltic Roofing 0.0% 0.0% 0
Prunings 2" to 12" 0.0% 0.0% 1 Other Construction Debris 0.1% 0.1% 7
Prunings Greater than 12" 0.0% 0.0% 0
Purchased Food 1.6% 1.2% 141 Totals 8,841
Homegrown Food 0.3% 0.3% 24Beverages and Liquids 0.2% 0.1% 13 Sample Count 11
Confidence intervals calculated at the 90% confidence level. Percentages for material types may not total 100% due to rounding.
10.0%
0.1%
100.0%
2.1%
15.8%
4.0%
4.0%

40
Table 30. Area F Recycling Composition, Summer 2014
Estimated Estimated Estimated Estimated
Material Percent + / - Tons Material Percent + / - Tons
Paper 59.9% 6,138 Other Materials 750
Newspaper 14.0% 2.2% 1,430 Textiles 2.0% 0.9% 202
Plain OCC/Kraft Paper 17.6% 3.3% 1,798 Carpet/Upholstery 0.0% 0.0% 0
Waxed OCC/Kraft Paper 0.0% 0.0% 0 Leather 0.2% 0.2% 15
High Grade Paper 0.6% 0.3% 60 Disposable Diapers 0.1% 0.1% 11
Mixed Low-grade Paper 25.2% 3.3% 2,585 Animal By-products 0.0% 0.0% 0
Milk/Juice Polycoated Paper 0.4% 0.1% 42 Rubber Products 0.2% 0.2% 16
Frozen Food Polycoated Paper 0.0% 0.0% 4 Tires 0.0% 0.0% 0
Compostable/Food Soiled Paper 1.1% 0.7% 110 Ash 0.0% 0.0% 0
Paper/Other Materials 1.1% 0.4% 110 Furniture 0.0% 0.0% 0
Mattresses 0.0% 0.0% 0
Plastic 1,706 Small Appliances 0.0% 0.0% 0
#1 PET Bottles 4.5% 0.7% 463 CRTs 0.0% 0.0% 0
#1 PET Other Packaging 0.9% 0.3% 94 Other Electronics 1.7% 1.7% 173
#2 HDPE Natural Bottles 1.5% 0.2% 151 Ceramics/Porcelain 0.0% 0.0% 2
#2 HDPE Colored Bottles 1.4% 0.3% 139 Non-distinct Fines 2.8% 0.8% 287
#2 HDPE Other Packaging 0.3% 0.1% 26 Miscellaneous Organics 0.0% 0.0% 5
Other Rigid Plastic Packaging 1.9% 0.3% 191 Miscellaneous Inorganics 0.4% 0.5% 39
Expanded Polystyrene 0.4% 0.2% 45
Compostable Plastics 0.0% 0.0% 0 Hazardous Wastes 4
Plastic Grocery/Merchandise Bags 0.8% 0.2% 78 Latex Paint 0.0% 0.0% 0
Other Clean Plastic Consumer Product Bags 0.5% 0.6% 46 Hazardous Adhesives/Glues 0.0% 0.0% 0Plastic Garbage Bags 0.3% 0.1% 36 Non-hazardous Adhesives/Glues 0.0% 0.0% 0
Other Plastic Film 1.6% 0.5% 168 Oil-based Paint/Solvent 0.0% 0.0% 0
Mixed Rigid Plastics 2.1% 0.8% 211 Hazardous Cleaners 0.0% 0.0% 0
Plastic/Other Materials 0.6% 0.3% 58 Pesticides/Herbicides 0.0% 0.0% 0
Non-rechargeable Dry-cell Batteries 0.0% 0.0% 2
Glass 10.5% 1,078 Rechargeable Dry-cell Batteries 0.0% 0.0% 0
Glass Beverage Containers 10.1% 0.2% 1,035 Wet-cell (car) Batteries 0.0% 0.0% 0
Fluorescent Tubes 0.0% 0.3% 0 Asbestos 0.0% 0.0% 0
Other Glass 0.4% 0.1% 42 Explosives 0.0% 0.0% 0
Vehicle and Equipment Fluids 0.0% 0.0% 0
Metal 357 Pool Chemicals 0.0% 0.0% 0
Aluminum Cans 1.3% 0.3% 134 Other Hazardous Chemicals 0.0% 0.0% 0
Aluminum Foil/Containers 0.1% 0.0% 9 Other Non-hazardous Chemicals 0.0% 0.0% 2
Other Nonferrous 0.1% 0.1% 13
Tin Food Cans 1.2% 0.2% 121 C&D Wastes 66
Empty Aerosol Cans 0.1% 0.1% 15 Dimension Lumber 0.0% 0.0% 0
Other Ferrous 0.3% 0.2% 31 Pallets/Crates 0.0% 0.0% 0
Oil Filters 0.0% 0.0% 0 Treated Wood 0.2% 0.2% 19
Mixed Metals/Material 0.3% 0.3% 34 Contaminated Wood 0.0% 0.0% 2
New Gypsum Scrap 0.0% 0.0% 0
Organic 145 Demo Gypsum Scrap 0.0% 0.0% 0
Leaves & Grass 0.0% 0.0% 0 Insulation 0.1% 0.1% 8
Unaccepted Yard Waste 0.0% 0.0% 0 Rock/Concrete/Bricks 0.1% 0.1% 8
Prunings Less than 2" 0.0% 0.0% 0 Asphaltic Roofing 0.3% 0.4% 27
Prunings 2" to 12" 0.0% 0.0% 0 Other Construction Debris 0.0% 0.0% 2
Prunings Greater than 12" 0.2% 0.3% 17
Purchased Food 1.0% 0.7% 98 Totals 10,244
Homegrown Food 0.0% 0.0% 0Beverages and Liquids 0.3% 0.2% 30 Sample Count 11
Confidence intervals calculated at the 90% confidence level. Percentages for material types may not total 100% due to rounding.
7.3%
0.0%
100.0%
0.6%
16.7%
3.5%
1.4%

41
Table 31. Area G Recycling Composition, Summer 2014
Estimated Estimated Estimated Estimated
Material Percent + / - Tons Material Percent + / - Tons
Paper 45.7% 3,750 Other Materials 969
Newspaper 4.8% 1.9% 391 Textiles 2.6% 0.8% 212
Plain OCC/Kraft Paper 18.5% 3.3% 1,514 Carpet/Upholstery 0.0% 0.0% 1
Waxed OCC/Kraft Paper 0.0% 0.0% 0 Leather 0.0% 0.0% 0
High Grade Paper 0.4% 0.2% 30 Disposable Diapers 2.6% 2.1% 214
Mixed Low-grade Paper 18.8% 2.7% 1,546 Animal By-products 0.1% 0.1% 6
Milk/Juice Polycoated Paper 0.4% 0.2% 31 Rubber Products 0.5% 0.4% 38
Frozen Food Polycoated Paper 0.0% 0.0% 3 Tires 0.0% 0.0% 0
Compostable/Food Soiled Paper 1.7% 0.4% 139 Ash 0.0% 0.0% 0
Paper/Other Materials 1.2% 0.4% 96 Furniture 0.0% 0.0% 0
Mattresses 0.0% 0.0% 0
Plastic 1,727 Small Appliances 0.0% 0.0% 2
#1 PET Bottles 4.8% 0.9% 395 CRTs 0.0% 0.0% 0
#1 PET Other Packaging 1.7% 1.0% 137 Other Electronics 1.1% 0.7% 88
#2 HDPE Natural Bottles 2.8% 0.7% 231 Ceramics/Porcelain 0.1% 0.1% 9
#2 HDPE Colored Bottles 1.8% 0.4% 145 Non-distinct Fines 4.4% 2.7% 361
#2 HDPE Other Packaging 0.3% 0.2% 23 Miscellaneous Organics 0.2% 0.4% 20
Other Rigid Plastic Packaging 1.5% 0.3% 123 Miscellaneous Inorganics 0.2% 0.2% 18
Expanded Polystyrene 0.7% 0.2% 60
Compostable Plastics 0.0% 0.0% 0 Hazardous Wastes 30
Plastic Grocery/Merchandise Bags 1.2% 0.3% 101 Latex Paint 0.0% 0.0% 0
Other Clean Plastic Consumer Product Bags 0.0% 0.1% 4 Hazardous Adhesives/Glues 0.0% 0.0% 1Plastic Garbage Bags 0.5% 0.2% 39 Non-hazardous Adhesives/Glues 0.0% 0.0% 2
Other Plastic Film 2.4% 0.9% 196 Oil-based Paint/Solvent 0.0% 0.0% 2
Mixed Rigid Plastics 2.4% 0.6% 198 Hazardous Cleaners 0.0% 0.0% 0
Plastic/Other Materials 0.9% 0.5% 77 Pesticides/Herbicides 0.0% 0.0% 0
Non-rechargeable Dry-cell Batteries 0.1% 0.2% 10
Glass 10.2% 837 Rechargeable Dry-cell Batteries 0.0% 0.0% 0
Glass Beverage Containers 9.9% 0.7% 815 Wet-cell (car) Batteries 0.0% 0.0% 0
Fluorescent Tubes 0.0% 0.4% 0 Asbestos 0.0% 0.0% 0
Other Glass 0.3% 0.2% 22 Explosives 0.0% 0.0% 0
Vehicle and Equipment Fluids 0.1% 0.1% 7
Metal 364 Pool Chemicals 0.0% 0.0% 0
Aluminum Cans 0.6% 0.3% 50 Other Hazardous Chemicals 0.0% 0.0% 1
Aluminum Foil/Containers 0.1% 0.0% 8 Other Non-hazardous Chemicals 0.1% 0.1% 7
Other Nonferrous 0.2% 0.1% 17
Tin Food Cans 1.5% 0.4% 120 C&D Wastes 94
Empty Aerosol Cans 0.7% 0.9% 57 Dimension Lumber 0.0% 0.0% 0
Other Ferrous 1.0% 0.6% 83 Pallets/Crates 0.0% 0.0% 0
Oil Filters 0.0% 0.0% 0 Treated Wood 0.4% 0.6% 34
Mixed Metals/Material 0.4% 0.5% 29 Contaminated Wood 0.5% 0.5% 40
New Gypsum Scrap 0.0% 0.0% 0
Organic 431 Demo Gypsum Scrap 0.0% 0.0% 0
Leaves & Grass 0.7% 0.6% 57 Insulation 0.0% 0.0% 0
Unaccepted Yard Waste 0.0% 0.0% 1 Rock/Concrete/Bricks 0.2% 0.2% 13
Prunings Less than 2" 0.1% 0.1% 6 Asphaltic Roofing 0.0% 0.0% 2
Prunings 2" to 12" 0.0% 0.0% 0 Other Construction Debris 0.1% 0.1% 5
Prunings Greater than 12" 0.0% 0.0% 0
Purchased Food 3.6% 2.0% 297 Totals 8,203
Homegrown Food 0.0% 0.0% 0Beverages and Liquids 0.9% 0.4% 70 Sample Count 10
Confidence intervals calculated at the 90% confidence level. Percentages for material types may not total 100% due to rounding.
11.8%
0.4%
100.0%
1.1%
21.1%
4.4%
5.3%

42
Table 32. Area H Recycling Composition, Summer 2014
Estimated Estimated Estimated Estimated
Material Percent + / - Tons Material Percent + / - Tons
Paper 54.1% 5,237 Other Materials 1,037
Newspaper 5.7% 2.0% 551 Textiles 2.8% 1.0% 267
Plain OCC/Kraft Paper 24.1% 5.1% 2,336 Carpet/Upholstery 1.9% 3.1% 182
Waxed OCC/Kraft Paper 0.0% 0.0% 0 Leather 0.4% 0.6% 41
High Grade Paper 1.0% 1.2% 100 Disposable Diapers 1.2% 0.6% 115
Mixed Low-grade Paper 19.9% 1.9% 1,932 Animal By-products 0.0% 0.0% 2
Milk/Juice Polycoated Paper 0.3% 0.1% 31 Rubber Products 0.4% 0.4% 39
Frozen Food Polycoated Paper 0.0% 0.0% 0 Tires 0.1% 0.1% 9
Compostable/Food Soiled Paper 2.1% 1.0% 204 Ash 0.0% 0.0% 0
Paper/Other Materials 0.9% 0.4% 84 Furniture 0.0% 0.0% 0
Mattresses 0.0% 0.0% 0
Plastic 2,185 Small Appliances 0.0% 0.0% 0
#1 PET Bottles 5.5% 0.8% 537 CRTs 0.0% 0.0% 0
#1 PET Other Packaging 0.8% 0.2% 79 Other Electronics 0.3% 0.2% 27
#2 HDPE Natural Bottles 2.4% 0.5% 231 Ceramics/Porcelain 0.4% 0.6% 40
#2 HDPE Colored Bottles 2.2% 0.5% 216 Non-distinct Fines 3.0% 1.0% 292
#2 HDPE Other Packaging 0.3% 0.2% 31 Miscellaneous Organics 0.0% 0.0% 1
Other Rigid Plastic Packaging 1.7% 0.5% 160 Miscellaneous Inorganics 0.2% 0.2% 22
Expanded Polystyrene 0.8% 0.1% 77
Compostable Plastics 0.0% 0.0% 0 Hazardous Wastes 15
Plastic Grocery/Merchandise Bags 0.8% 0.1% 74 Latex Paint 0.0% 0.0% 0
Other Clean Plastic Consumer Product Bags 0.1% 0.1% 14 Hazardous Adhesives/Glues 0.0% 0.0% 0Plastic Garbage Bags 0.3% 0.1% 25 Non-hazardous Adhesives/Glues 0.0% 0.0% 0
Other Plastic Film 2.2% 0.5% 213 Oil-based Paint/Solvent 0.0% 0.0% 0
Mixed Rigid Plastics 2.4% 0.7% 229 Hazardous Cleaners 0.0% 0.0% 0
Plastic/Other Materials 3.1% 2.3% 299 Pesticides/Herbicides 0.0% 0.0% 0
Non-rechargeable Dry-cell Batteries 0.0% 0.0% 1
Glass 6.0% 579 Rechargeable Dry-cell Batteries 0.0% 0.0% 1
Glass Beverage Containers 5.7% 0.5% 550 Wet-cell (car) Batteries 0.0% 0.0% 0
Fluorescent Tubes 0.0% 0.5% 0 Asbestos 0.0% 0.0% 0
Other Glass 0.3% 0.2% 29 Explosives 0.0% 0.0% 0
Vehicle and Equipment Fluids 0.0% 0.0% 0
Metal 394 Pool Chemicals 0.0% 0.0% 0
Aluminum Cans 0.9% 0.2% 90 Other Hazardous Chemicals 0.1% 0.1% 8
Aluminum Foil/Containers 0.2% 0.1% 18 Other Non-hazardous Chemicals 0.0% 0.1% 5
Other Nonferrous 0.1% 0.1% 9
Tin Food Cans 1.7% 0.3% 164 C&D Wastes 47
Empty Aerosol Cans 0.1% 0.1% 14 Dimension Lumber 0.0% 0.0% 0
Other Ferrous 0.8% 0.3% 73 Pallets/Crates 0.0% 0.0% 0
Oil Filters 0.0% 0.0% 0 Treated Wood 0.1% 0.1% 11
Mixed Metals/Material 0.3% 0.3% 26 Contaminated Wood 0.1% 0.1% 6
New Gypsum Scrap 0.0% 0.0% 0
Organic 193 Demo Gypsum Scrap 0.0% 0.0% 0
Leaves & Grass 0.0% 0.0% 1 Insulation 0.0% 0.0% 0
Unaccepted Yard Waste 0.1% 0.1% 8 Rock/Concrete/Bricks 0.0% 0.0% 1
Prunings Less than 2" 0.0% 0.0% 0 Asphaltic Roofing 0.0% 0.0% 0
Prunings 2" to 12" 0.0% 0.1% 4 Other Construction Debris 0.3% 0.3% 29
Prunings Greater than 12" 0.0% 0.0% 0
Purchased Food 1.7% 0.7% 160 Totals 9,685
Homegrown Food 0.0% 0.0% 0Beverages and Liquids 0.2% 0.1% 17 Sample Count 11
Confidence intervals calculated at the 90% confidence level. Percentages for material types may not total 100% due to rounding.
10.7%
0.2%
100.0%
0.5%
22.6%
4.1%
2.0%

43
Table 33. Area I Recycling Composition, Summer 2014
Estimated Estimated Estimated Estimated
Material Percent + / - Tons Material Percent + / - Tons
Paper 56.2% 5,203 Other Materials 683
Newspaper 9.7% 4.6% 895 Textiles 2.0% 0.8% 182
Plain OCC/Kraft Paper 20.4% 8.4% 1,888 Carpet/Upholstery 0.0% 0.0% 0
Waxed OCC/Kraft Paper 0.0% 0.0% 0 Leather 0.0% 0.0% 0
High Grade Paper 0.9% 0.7% 85 Disposable Diapers 0.1% 0.1% 11
Mixed Low-grade Paper 22.8% 5.1% 2,110 Animal By-products 0.0% 0.1% 4
Milk/Juice Polycoated Paper 0.3% 0.1% 26 Rubber Products 0.4% 0.7% 41
Frozen Food Polycoated Paper 0.1% 0.1% 10 Tires 0.7% 1.1% 61
Compostable/Food Soiled Paper 1.1% 0.3% 103 Ash 0.0% 0.0% 0
Paper/Other Materials 0.9% 0.8% 87 Furniture 0.0% 0.0% 0
Mattresses 0.0% 0.0% 0
Plastic 1,473 Small Appliances 0.0% 0.0% 0
#1 PET Bottles 3.9% 0.5% 357 CRTs 0.0% 0.0% 0
#1 PET Other Packaging 0.7% 0.2% 68 Other Electronics 1.1% 1.4% 102
#2 HDPE Natural Bottles 1.3% 0.4% 124 Ceramics/Porcelain 0.1% 0.2% 12
#2 HDPE Colored Bottles 1.4% 0.4% 129 Non-distinct Fines 2.5% 1.2% 228
#2 HDPE Other Packaging 0.7% 0.6% 67 Miscellaneous Organics 0.4% 0.6% 38
Other Rigid Plastic Packaging 1.6% 0.3% 147 Miscellaneous Inorganics 0.1% 0.0% 5
Expanded Polystyrene 0.5% 0.2% 46
Compostable Plastics 0.0% 0.0% 0 Hazardous Wastes 14
Plastic Grocery/Merchandise Bags 0.7% 0.2% 60 Latex Paint 0.0% 0.0% 0
Other Clean Plastic Consumer Product Bags 0.2% 0.1% 18 Hazardous Adhesives/Glues 0.0% 0.0% 0Plastic Garbage Bags 0.3% 0.1% 28 Non-hazardous Adhesives/Glues 0.0% 0.0% 0
Other Plastic Film 1.5% 0.3% 140 Oil-based Paint/Solvent 0.0% 0.0% 0
Mixed Rigid Plastics 2.1% 0.7% 196 Hazardous Cleaners 0.0% 0.0% 0
Plastic/Other Materials 1.0% 0.5% 93 Pesticides/Herbicides 0.0% 0.0% 0
Non-rechargeable Dry-cell Batteries 0.0% 0.0% 3
Glass 9.7% 893 Rechargeable Dry-cell Batteries 0.0% 0.0% 0
Glass Beverage Containers 9.2% 0.4% 852 Wet-cell (car) Batteries 0.0% 0.0% 0
Fluorescent Tubes 0.4% 0.4% 38 Asbestos 0.0% 0.0% 0
Other Glass 0.0% 0.6% 4 Explosives 0.0% 0.0% 0
Vehicle and Equipment Fluids 0.0% 0.0% 0
Metal 508 Pool Chemicals 0.0% 0.0% 0
Aluminum Cans 1.4% 0.3% 127 Other Hazardous Chemicals 0.0% 0.0% 2
Aluminum Foil/Containers 0.1% 0.0% 6 Other Non-hazardous Chemicals 0.1% 0.1% 9
Other Nonferrous 0.1% 0.1% 12
Tin Food Cans 1.1% 0.2% 98 C&D Wastes 269
Empty Aerosol Cans 0.1% 0.1% 9 Dimension Lumber 0.2% 0.3% 15
Other Ferrous 2.0% 0.9% 187 Pallets/Crates 0.0% 0.0% 0
Oil Filters 0.0% 0.0% 0 Treated Wood 0.6% 0.6% 54
Mixed Metals/Material 0.7% 0.6% 69 Contaminated Wood 1.6% 2.6% 149
New Gypsum Scrap 0.0% 0.0% 0
Organic 210 Demo Gypsum Scrap 0.0% 0.0% 0
Leaves & Grass 0.2% 0.4% 22 Insulation 0.0% 0.0% 0
Unaccepted Yard Waste 0.0% 0.0% 2 Rock/Concrete/Bricks 0.1% 0.2% 9
Prunings Less than 2" 0.0% 0.0% 0 Asphaltic Roofing 0.0% 0.0% 0
Prunings 2" to 12" 0.0% 0.0% 2 Other Construction Debris 0.5% 0.4% 42
Prunings Greater than 12" 0.0% 0.0% 0
Purchased Food 1.5% 1.3% 138 Totals 9,254
Homegrown Food 0.1% 0.2% 13Beverages and Liquids 0.4% 0.4% 34 Sample Count 9
Confidence intervals calculated at the 90% confidence level. Percentages for material types may not total 100% due to rounding.
7.4%
0.1%
100.0%
2.9%
15.9%
5.5%
2.3%

44
Table 34. Area J Recycling Composition, Summer 2014
Estimated Estimated Estimated Estimated
Material Percent + / - Tons Material Percent + / - Tons
Paper 63.0% 5,625 Other Materials 490
Newspaper 9.4% 3.7% 843 Textiles 3.0% 2.2% 268
Plain OCC/Kraft Paper 26.2% 4.3% 2,340 Carpet/Upholstery 0.0% 0.0% 0
Waxed OCC/Kraft Paper 0.1% 0.1% 5 Leather 0.0% 0.0% 0
High Grade Paper 0.5% 0.4% 49 Disposable Diapers 0.2% 0.3% 22
Mixed Low-grade Paper 22.8% 3.9% 2,032 Animal By-products 0.0% 0.0% 0
Milk/Juice Polycoated Paper 0.5% 0.2% 44 Rubber Products 0.1% 0.1% 6
Frozen Food Polycoated Paper 0.1% 0.1% 10 Tires 0.0% 0.0% 0
Compostable/Food Soiled Paper 2.2% 1.6% 195 Ash 0.0% 0.0% 0
Paper/Other Materials 1.2% 0.3% 106 Furniture 0.0% 0.0% 0
Mattresses 0.0% 0.0% 0
Plastic 1,442 Small Appliances 0.0% 0.0% 0
#1 PET Bottles 4.1% 0.7% 370 CRTs 0.0% 0.0% 0
#1 PET Other Packaging 1.4% 0.9% 123 Other Electronics 0.3% 0.3% 31
#2 HDPE Natural Bottles 1.7% 0.3% 155 Ceramics/Porcelain 0.0% 0.1% 4
#2 HDPE Colored Bottles 1.1% 0.5% 101 Non-distinct Fines 1.6% 0.6% 142
#2 HDPE Other Packaging 0.5% 0.6% 47 Miscellaneous Organics 0.2% 0.2% 17
Other Rigid Plastic Packaging 1.3% 0.5% 117 Miscellaneous Inorganics 0.0% 0.0% 1
Expanded Polystyrene 0.6% 0.3% 49
Compostable Plastics 0.0% 0.0% 0 Hazardous Wastes 50
Plastic Grocery/Merchandise Bags 0.6% 0.2% 55 Latex Paint 0.0% 0.0% 0
Other Clean Plastic Consumer Product Bags 0.2% 0.1% 15 Hazardous Adhesives/Glues 0.0% 0.0% 0Plastic Garbage Bags 0.4% 0.3% 33 Non-hazardous Adhesives/Glues 0.0% 0.0% 0
Other Plastic Film 1.7% 0.4% 148 Oil-based Paint/Solvent 0.0% 0.0% 0
Mixed Rigid Plastics 2.2% 1.3% 194 Hazardous Cleaners 0.5% 0.9% 47
Plastic/Other Materials 0.4% 0.2% 36 Pesticides/Herbicides 0.0% 0.0% 0
Non-rechargeable Dry-cell Batteries 0.0% 0.0% 2
Glass 8.8% 784 Rechargeable Dry-cell Batteries 0.0% 0.0% 0
Glass Beverage Containers 8.7% 0.3% 778 Wet-cell (car) Batteries 0.0% 0.0% 0
Fluorescent Tubes 0.0% 0.5% 0 Asbestos 0.0% 0.0% 0
Other Glass 0.1% 0.6% 6 Explosives 0.0% 0.0% 0
Vehicle and Equipment Fluids 0.0% 0.0% 0
Metal 353 Pool Chemicals 0.0% 0.0% 0
Aluminum Cans 1.3% 0.5% 115 Other Hazardous Chemicals 0.0% 0.0% 1
Aluminum Foil/Containers 0.1% 0.0% 6 Other Non-hazardous Chemicals 0.0% 0.0% 0
Other Nonferrous 0.3% 0.2% 28
Tin Food Cans 2.0% 1.0% 177 C&D Wastes 63
Empty Aerosol Cans 0.1% 0.1% 12 Dimension Lumber 0.0% 0.0% 0
Other Ferrous 0.2% 0.1% 13 Pallets/Crates 0.0% 0.0% 0
Oil Filters 0.0% 0.0% 0 Treated Wood 0.0% 0.0% 1
Mixed Metals/Material 0.0% 0.1% 3 Contaminated Wood 0.7% 0.7% 59
New Gypsum Scrap 0.0% 0.0% 0
Organic 123 Demo Gypsum Scrap 0.0% 0.0% 0
Leaves & Grass 0.3% 0.4% 30 Insulation 0.0% 0.0% 0
Unaccepted Yard Waste 0.0% 0.0% 0 Rock/Concrete/Bricks 0.0% 0.0% 2
Prunings Less than 2" 0.0% 0.0% 1 Asphaltic Roofing 0.0% 0.0% 0
Prunings 2" to 12" 0.0% 0.0% 0 Other Construction Debris 0.0% 0.0% 0
Prunings Greater than 12" 0.0% 0.1% 4
Purchased Food 0.8% 0.6% 70 Totals 8,929
Homegrown Food 0.0% 0.0% 0Beverages and Liquids 0.2% 0.2% 17 Sample Count 8
Confidence intervals calculated at the 90% confidence level. Percentages for material types may not total 100% due to rounding.
5.5%
0.6%
100.0%
0.7%
16.1%
4.0%
1.4%