FRI—UW—80l0 August 1980 FISHERIES RESEARCH …
63
FRI—UW—80l0 August 1980 FISHERIES RESEARCH INSTITUTE College of Fisheries University of Washington Seattle, Washington 98195 SALNONID OUTMIGRATION STUDIES IN HOOD CANAL by Nicholas 3. Bax, Ernest 0. Salo, and Bruce P. Snyder FINAL REPORT, PHASE V January to July 1979 This work was sponsored by the U.S. Navy, and the Washington Sea Grant Program under the National Oceanic and Atmospheric Administration, U.S. Department of Commerce Approved Submitted August 28, 1980 _____________ ________ Robert L. Burgner, Director
Transcript of FRI—UW—80l0 August 1980 FISHERIES RESEARCH …

FRI—UW—80l0August 1980
FISHERIES RESEARCH INSTITUTECollege of Fisheries
University of WashingtonSeattle, Washington 98195
SALNONID OUTMIGRATION STUDIES IN HOOD CANAL
by
Nicholas 3. Bax, Ernest 0. Salo,and Bruce P. Snyder
FINAL REPORT, PHASE V
January to July 1979
This work was sponsored by the U.S. Navy,and the Washington Sea Grant Program under the
National Oceanic and Atmospheric Administration,U.S. Department of Commerce
Approved
Submitted August 28, 1980 _____________ ________
Robert L. Burgner,Director


TABLE OF CONTENTS
Page
1
5
5578
9
999
911111117
17
17263033
37
3741
48
50
54
INTRODUCTION
METHODS AND MATERIALS
Survey Area and Sampling Design . .
Collection of JuvenilesProcessing of SamplesEnvironmental Data Collection
RESULTS AND DISCUSSION
Catch—Per—Unit—EffortEnvironmental ResultsMigration Periods and Peaks
Chum SalmonCoho SalmonChinook SalmonAdult SalmonCutthroat Trout
Factors Affecting Catch—Per—Unit—Effort
Site PreferenceEnvironmental VariablesEffects of Low—Level Pier LightingHatchery Influence
Length—Weight Data
Length DataCondition Factor
SUNMARY
LITERATURE CITED
APPENDICES
atEHW
111

LIST OF TABLES
Table Page
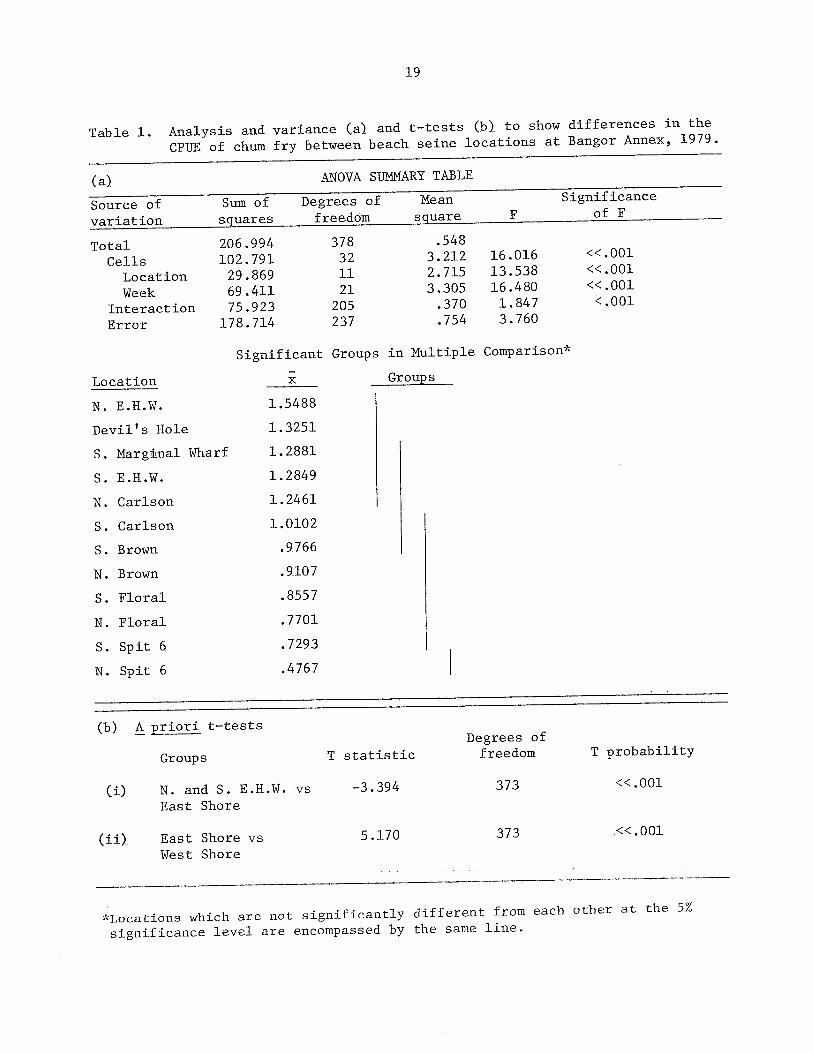
1 Analysis of variance (a) and t—tests (b) to showdifferences in the CPUE of chum fry between beachseine locations at Bangor Annex, 1979 19
2 Analysis of variance to show differences in CPUEof chum fry with the surface townet between (a)all transects and (b) the parallel transects fromApril to July 1979 22
3 Analysis of variance showing changes in the sizeof chum fry caught with the surface townet atBangor Annex from June 11 to July 4, 1979 25
4 Analysis of tidal effects on the CPUE of chum frycaught in 1979 29
5 Linear regression equations describing the effectof measured environmental variables on the CPUE ofchum fry in 1979 . . 31
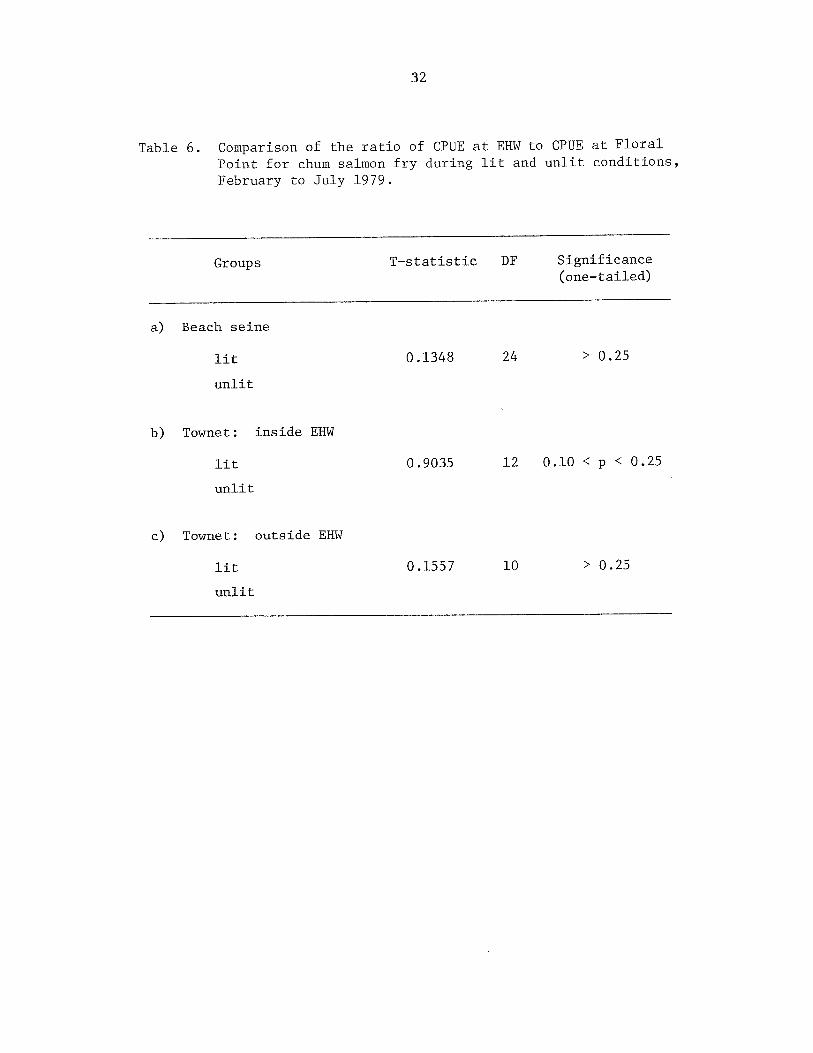
6 Comparison of the ratio of CPUE at EHW to CPUE atFloral Point for chum salmon fry during lit andunlit conditions, February to July 1979 32
7 Migration speed (km/day) of juvenile chum salmonreleased into Hood Canal from Big Beef Creekduring the first 3 days 36
8 Comparison of the weekly mean lengths of chum frycaught with the beach seine at different locationsin Hood Canal, Washington, 1979 39
9 Effect of sampling location, sampling week, andmean size on the condition factor of chum frycaught at Bangor Annex, Hood Canal, 1979 45
AppendixTable
1 Releases of coho and chinook salmon smolts fromQuilcene, Hood Canal, and George Adams fishhatcheries into Hood Canal, 1979 54
2 Weekly release of fin—clipped coho smolts fromthe Big Beef Creek wild outmigration into HoodCanal, Washington, 1979 55
iv
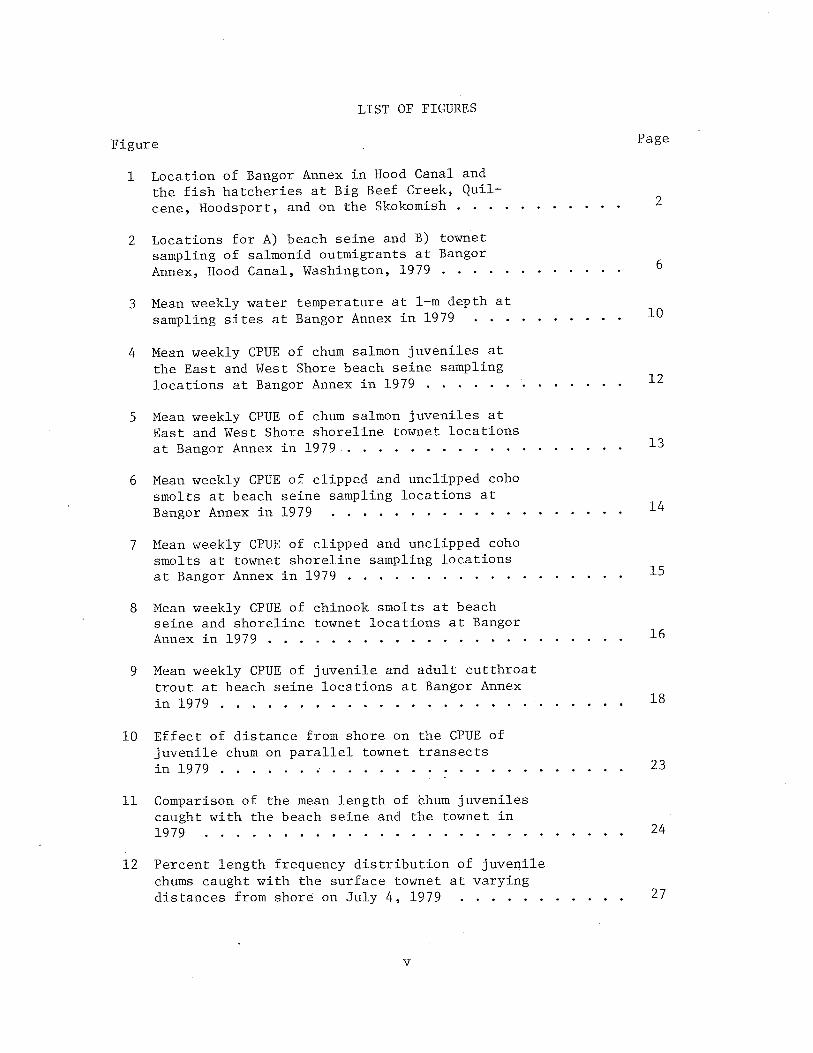
LIST OF FIGURES
Figure Page
1 Location of Bangor Annex in Hood Canal andthe fish hatcheries at Big Beef Creek, Quil—cene, Hoodsport, and on the Skokomish . . . . 2
2 Locations for A) beach seine and B) townetsampling of salmonid outmigrants at BangorAnnex, Hood Canal, Washington, 1979 6
3 Mean weekly water temperature at l—m depth atsampling sites at Bangor Annex in 1979 . . . 10
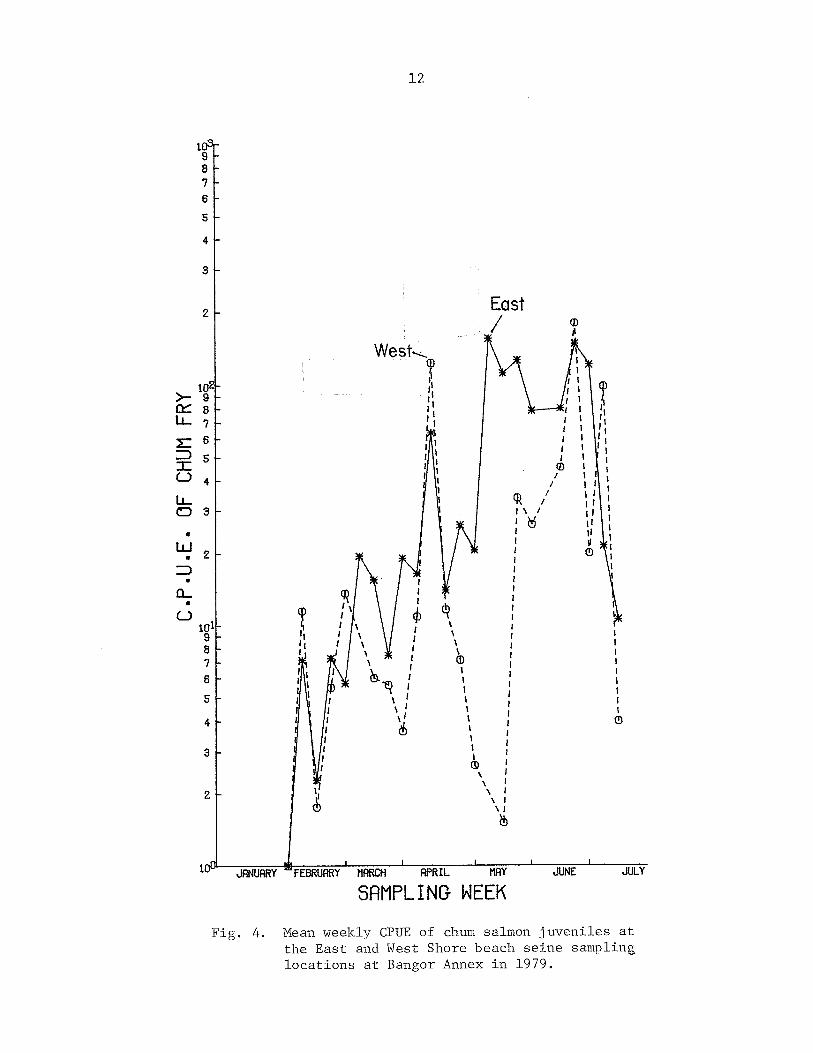
4 Mean weekly CPUE of chum salmon juveniles atthe East and West Shore beach seine samplinglocations at Bangor Annex in 1979 . 12
5 Mean weekly CPUE of chum salmon juveniles atEast and West Shore shoreline townet locationsat Bangor Annex in 1979 . 13
6 Mean weekly CPUE of clipped and unclipped cohosmolts at beach seine sampling locations atBangor Annex in 1979 14
7 Mean weekly CPUE of clipped and unclipped cohosmolts at townet shoreline sampling locationsat Bangor Annex in 1979 15
8 Mean weekly CPUE of chinook smolts at beachseine and shoreline townet locations at BangorAnnex in 1979 16
9 Mean weekly CPUE of juvenile and adult cutthroattrout at beach seine locations at Bangor Annexin 1979 18
10 Effect of distance from shore on the CPUE ofjuvenile chum on parallel townet transectsin 1979 23
11 Comparison of the mean length of chum juvenilescaught with the beach seine and the townet in1979 24
12 Percent length frequency distribution of juvei~ilechums caught with the surface townet at varyingdistances from shore~on July 4, 1979 27
v

Figure Page
13 Percent length frequency distribution of juvenilechums caught with the surface townet along theBangor Annex shoreline on July 4, 1979 28
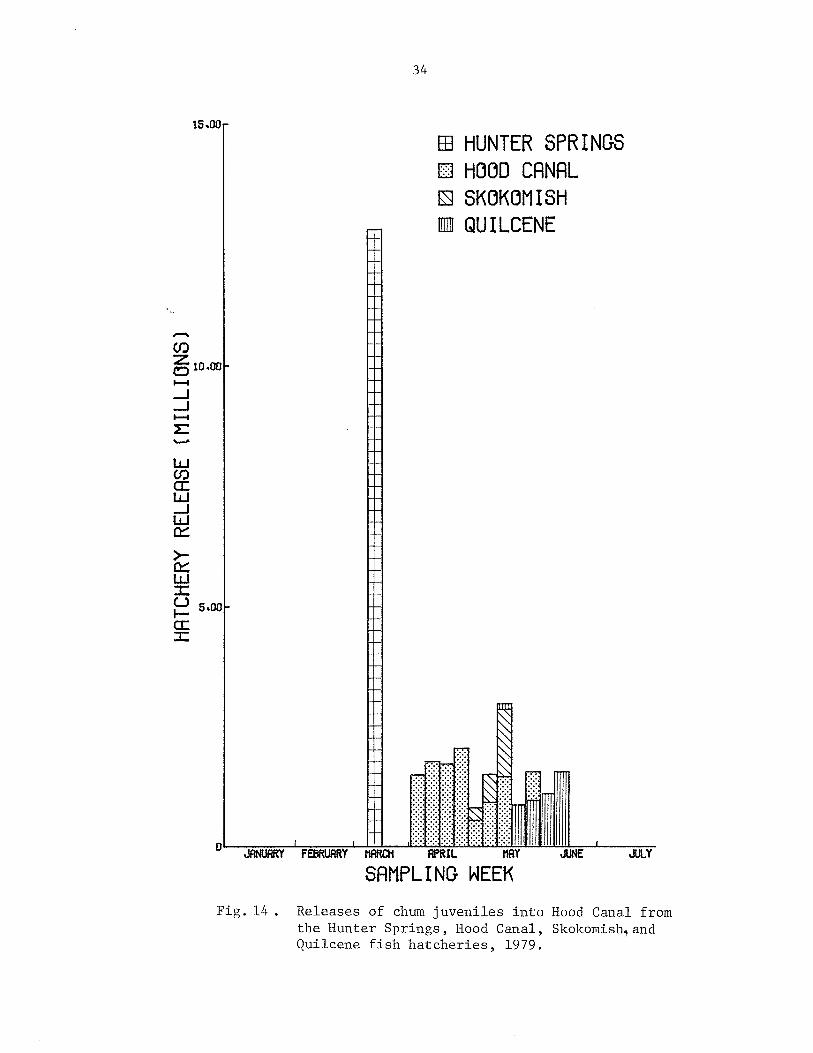
14 Releases of chum juveniles into Hood Canal fromthe Hunter Springs, Hood Canal, Skokomish, andQuilcene fish hatcheries, 1979 . . . 34
15 Comparison of the mean length of chum fry caughtat Floral Point and South Carlson Point with theremaining beach seine locations at Bangor Annexin 1979 40
16 Comparison of the mean length of coho smoltscaught with the beach seine and the townet in 1979 42
17 Comparison of the mean length of chinook smoltscaught with the beach seine and the townet in 1979 43
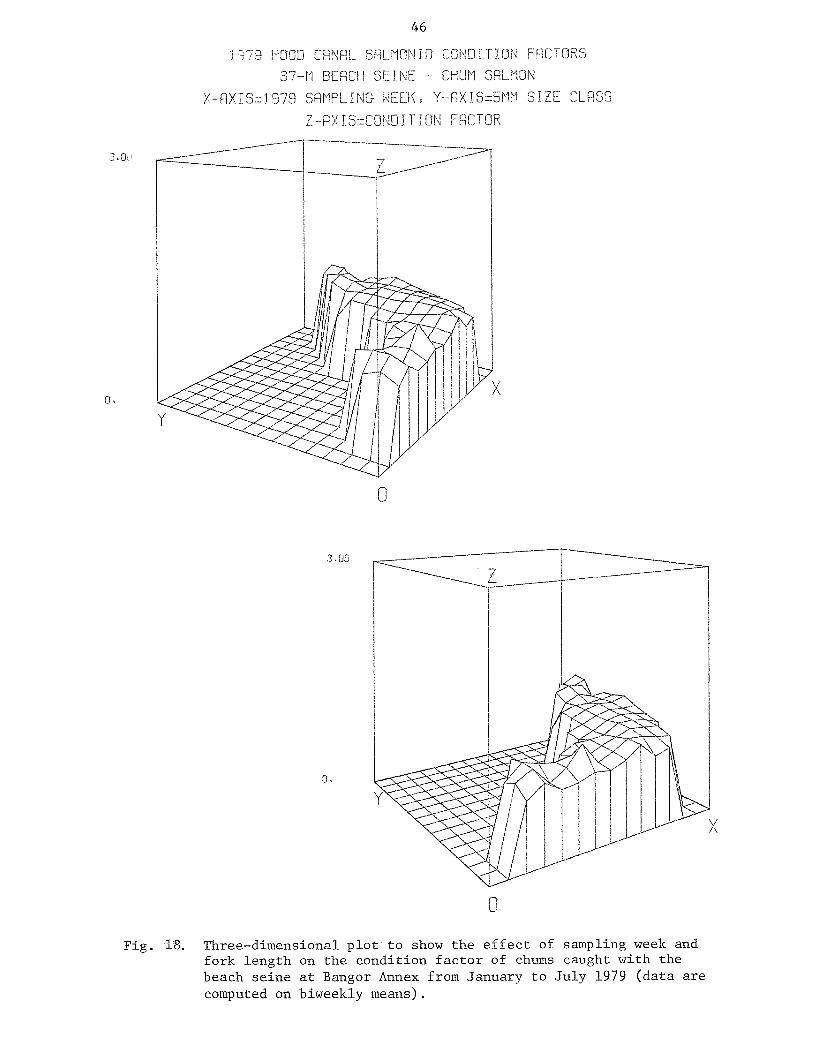
18 Three—dimensional plot to show the effect ofsampling week and fork length on the conditionfactor of chums caught with the beach seine atBangor Annex from January to July 1979 46
19 Three—dimensional plot to show the effect ofsampling week and fork length on the conditionfactor of chums caught with the townet at BangorAnnex from January to July 1979 47
vi

ACKNOWLEDGMENTS
This project was made successful only by the long hours worked bythe people associated with it. The 1979 field crew of Clifford Whitmus,Gary Maxwell, George Holman, Thomas Wildebuer, Sean Cramer, and EddieKudera deserve a special mention for their hard work and cheerful company on our 6.5 month, nocturnal sampling regime. Carol Sisley andLila Stacey transcribed the initial text to a readable form. DorothyBeall and staff were of great service in finalizing the manuscript.
This study was made possible by funding provided by the U.S. Navyand by the Washington Sea Grant Project under the National Oceanic andAtmospheric Administration, U.S. Department of Commerce.
vii


INTRODUCTION
The salmon outmigration studies were initiated in 1975 to monitorthe effects of pier construction and operation on the migratory behavior of juvenile salmon along the U.S. Naval Submarine Base on the eastshore of Hood Canal at Bangor Annex (Fig. 1). The shoreline construction area extends over a 5—km corridor which is a part of the annualmigration route of four species of Pacific salmon and two species ofanadromous trout. These salmonid species comprise both natural andhatchery stock. The chum salmon is the most abundant of the abovespecies, and it is with this species that this report is primarilyconcerned.
Chum salmon stocks in Washington State are currently undergoing amassive enhancement, and Hood Canal is to be managed principally forthe production of this species (Washington State Department of Fisheries 1979). Hood Canal accounts for about 25% of Washington StateDepartment of Fisheries’ (WDF) total chum return (Morrill, in Simenstadand Kinney 1978). Unfortunately, less is known about the biology ofchum salmon than any of the Pacific salmon, and it is in the earlymarine life history that the information is most deficient (Merrell1970; Allen 1974).
Extreme fluctuations in abundance have characterized chum populations, and it is thought that marine survival, especially in the firstfew weeks of marine residence, may be a major cause of these fluctuations (Bakkala 1970). The causes of this mortality are not well documented, but it is known that predation and environmental factors are ofimportance (Wickett 1958; Birman 1959). More evidence on the earlymarine mortality of the pink salmon than of the chum is documented,although some restraint must be used in extrapolating this data(Andrievskaya, in Bakkala 1970; Gallagher personal communication’). Byassuming that chum and pink salmon suffered the same mortality ratesand by comparing adult returns of these two species to Hooknose Creek,British Columbia, Parker (1962) estimated survival in the coastal juvenile stage as 5.4% compared with 56.6% in the pelagic stage and 93.0%in the coastal adult stage. Further experiments by Parker (1968) onBella Coola pink salmon where the juveniles were marked at two pointsalong their marine migration route and the percentage returns of markedadults compared, led Parker to the conclusion: “It is now possible tostate that during the initial period of sea life average daily relativeloss to the population was about 2—4% and during the following 410—dayperiod average daily loss was about 0.4 to 0.8%.” Parker cautions thatthese results are subject to some difficulties in interpretation due tothe possibility of different exploitation (from fishing) of the twomarked groups. Parker felt that the proposed mortalities could be dueto predation by coho smolts on the pinks. Other studies by Blackbourn
‘Gallagher, A. F., College of Fisheries, University of Washington,Seattle.

2
Fig. 1. Location of Bangor Annex in Hood Canal and the fishhatcheries at Big Beef Creek, Quilcene, Hoodsport,(Hood Canal hatchery) and on the Skokomish (Skokomish,George Adams and Hunter Springs hatcheries).

3
(1976) on Fraser River pinks have implicated environmental variablesincluding river discharge, solar radiation, and the timing and initialsize of pinks, as well as the catch—per—unit—effort (CPUE) of coho inthe area. In fact, Blackbourn explained more than 90% of the variancein the survival of the pinks using groups of three of these factors.Gilhousen (1962), trying to explain Vernon’s earlier work (Vernon 1958),where temperature was found to be the most important factor in explaining variations in survival of Fraser River pinks, suggested that highertemperatures led to the earlier offshore movement of the pinks and soincreased the chances of predation on them. Gilhousen goes on to saythat “conditions in the marine environment have been so variable thatvariations in fry abundance have had a secondary effect on totalsurvival.”
It is this extreme variability in marine survival of the economically important chum populations and the possible effects of construction and/or operational activities of the U.S. Naval Submarine Basethat prompted this study. Earlier work by Heiser and Finn (1970) hadshown buildups of migratory pink and chum juveniles at bulkheaded areasin Puget Sound. These juveniles later moved offshore, leading to an“observed increase in predation by coho salmon smolts and cutthroattrout,” although no experiments were conducted to confirm this. Otherauthors have suggested that the movement away from the protective structures (vegetational or man—made) of the nearshore environment leads toan increased level of predation in salmon (Gilhousen 1962) and otherspecies (Major 1977, Cooper and Crowder 1979, Hobson 1979). A factorstudied closely in 1979, and described in detail in Prinslow et al.(1980), is the effect of the pier lighting on the migrating chum. Ithas been shown by Hoar et al. (1957) that lights attract chum salmonjuveniles while in freshwater, and it is probable that this photoposi—tivity continues in the marine environment (Gosho 1976; Salo 1976; Saloet al. 1977; Prinslow et al. 1979). Bakshtanskii (1970), studying theeffects of the 24—hour illumination of the Arctic day on the predationof pink and red salmon, asserted that the predators (salmon, trout, andsalmon juveniles in the river, cod and herring juveniles in the sea) donot lose contact with the schooling juveniles and are able to completely annihilate them. If the juvenile chum are forced offshore aroundthe piers and away from the structural protection of the nearshoreenvironment or are attracted to the pier lighting, it is possible thatthe predation upon them might be increased, due either to the decreasein shelter or to an increase in numbers of predators attracted to thepiers or pier lighting.
This study and the pier lighting study mentioned above were concerned principally with the chum salmon juveniles routinely passingthrough the Bangor Annex shoreline. In addition, chum juveniles fromBig Beef Creek hatchery were marked with fluorescent pigment and released from Big Beef Creek or at the Bangor Annex area to estimatetheir immediate marine mortality, migration patterns and reaction tothe lighted piers. During the week of the marking studies each month

4
the outmigration study crew worked on the mark—recapture project. Theresults of the marking studies are presented in Prinslow et al. (1980)and Salo et al. (1980).
The objectives of the 1979 outmigration study were:
1. To continue collecting baseline data on juvenile salmon migrating past the Bangor Annex, and to determine for each species theirrelative abundance, their origins (i.e., hatchery or stream), the timing of their migration, and their distribution.
2. To investigate the effects of the newly constructed shorelinefacilities on the distribution of salmonids in the Bangor Annex area,and to compare this with previous years’ data when large—scale waterfront construction was occurring. Emphasis in 1979 was on the effectsof pier lighting at Explosives Handling Wharf (EHW), in particular itseffect on the predator—prey relationships in the area.
3. To monitor some of the environmental variables to which theoutmigrants were exposed. Variables measured were water temperature,weather, and tidal conditions. The variations in the CPUE with measured environmental variables were examined to explain gear avoidance orhabitat preference.
4. To notify the U.S. Navy of any aberrant behavior of salmonidsduring the monitoring program, including that due to the wharves andtrestles.

5
METHODS AND MATERIALS
Big Beef Creek, Fisheries Research Station of the College of Fisheries, University of Washington, was used as the base for field operations. The R/V Tenas, H/V Narwhal, and attendant skiffs used in thesampling operations were based at Seabeck.
Survey Area and Sampling Design
The area of Hood Canal sampled was bounded by the north and southboundaries of the Naval Submarine Base at Bangor Annex on the eastshore and the area opposite this on the west shore (Fig. 1). Withinthis area sites were chosen such that contrasts could be made betweensites affected and unaffected by the construction and operational activities of the base, and between sites on the east and the west shores(Fig. 2). Townet transects at varying distances from shore were usedto assess the offshore distribution of the juveniles.
A floating beach seine and townet were used to assess the abundance of juvenile salmonids in the nearshore and offshore areas, respectively. Sampling transects with the surface townet were arranged tocover the majority of the offshore distribution of the juvenile salmon—ids as depicted in previous years (Bax et al. 1979). No attempt wasmade to estimate the midwater distribution of the juvenile salmonids,previous studies by Stober and Salo (1973) having shown that the majority of the juvenile chum (the species of principal concern) are to beexpected in the top 3 m of the water column.
No surveys were conducted on the 1 week per month when mark—recapture experiments were in progress, although some of the incidentalcatch data during this week were used. All surveys were conducted atnight so that any effects of pier lighting on the distribution of juvenile salmonids could be measured. In addition it has been found thatnighttime sampling leads to lower variation in the catches when compared with daytime sampling, perhaps because the juveniles do notalways school at night (Schreiner 1977, Bax et al. 1978).
Collection of Juveniles
The preliminary sampling of the nearshore environment in Januarywas accomplished using a 10—rn x 2—m beach seine with bag of 6—mmstretch mesh. With one man wearing waders, waist—deep in the water,and another on the shore, they seined a transect 30 m long and parallelto the shore. The maximum depth of the transect was 1.5 m.
In February when full—scale sampling began, a 37—rn beach seinewith 18—rn, 3—cm stretch mesh wings and a 0.6—rn x 2.4—m x 2.3—4 bag of6—mm stretch mesh was used instead of the 10—rn beach seine (Schreiner

6
KEYShoreline TransectsOffshore Transects: 1976 -77Offshore Transects: 1978Offshore Transects 1978-79
Fig. 2. Locations for A) beachseine and B) townetsampling of salmonidoutmigrants at BangorAnnex, Hood Canal,Washington, 1979.
KEY• Original 1975 siteso Sites added in 1976• Sites added in 1977A Sites added in 1979
+Hood Canal A
Is Hole
Pier
]rlson Point
Nautical Miles
O 1/2
B
H--H
-- HT
Hood Canal
Refit Pier
Hole
Pier
//
/
;arlson Point

7
1977). The 37—rn beach seine was used until the end of sampling inJuly. The seine was set from an outboard skiff 30 m from, and parallelto, the shore. Two men on a rope at either end of the seine pulled thenet toward the shore as swiftly as possible without submerging thefloats. At 10 m from the shore the wings of the net were pulled together, thus funnelling the catch into the bag. Each set took from 3 to 31/2 mm from the start of laying out the net to the time that the bagwas brought up onto the beach. Delays caused by catching the net onunderwater obstructions or by exceptionally strong currents were notedon the data sheets. The seine was operated as a floating seine, afloating net having proven most effective for the nearshore collectionof all juvenile chum salmon size classes (Schreiner 1977).
Offshore sampling was conducted using a surface trawl towed between two boats, the R/V Tenas, an 11.6—rn vessel and the M/V Narwhal, a7.9—rn motor whaler. The mouth opening of the net measured 6.1 m wideby 3 m deep. Stretch mesh sizes ranged from 76 mm at the mouth to 5 mmat the bag (Schreiner 1977). The wings of the net were spread vertically by 3.75—cm diameter galvanized pipes, which were connected with ashort nylon bridle to single warps leading to each vessel. The net wastowed at between 1.5 and 2.0 knots with the tidal flow, but the speedwas adjusted slightly during each tow, under different tide and weatherconditions to keep the ends of the headrope just breaking the surfaceof the water. Tows were of 10—mm duration, excepting one tow insidethe EHW which was of a 2—mm duration. At the end of each tow twocrewmen in an outboard skiff pursed the cod—end of the net and removedall fish and debris. This technique allowed continuous sampling of theoffshore transect pattern. It was arranged in 1979 that there was somedistance between each transect when the net would be towed with thecod—end open. This procedure allowed the net to be cleared betweentows and, more importantly, ensured that the individual transectscovered the same area on each survey, regardless of tide, wind, orcurrent conditions.
Processing of Samples
Salmonids caught in the beach seine were sorted and preserved immediately upon capture. Townet captures were transported to the deckof the R/V Tenas in 20—liter plastic buckets.
Subsarnples of no greater than 100 chum were taken from each haul,and preserved immediately in 10% buffered seawater formalin. The remaining chum were counted and released. Other salmonids caught weremeasured (fork length) to the nearest 5 mm and released. Likely predators (salmonid and nonsalmonid), or subsamples of no more than five,were preserved. Large predators were injected in the stomach with asolution of formalin prior to bottling. The results of the predatorstomach analysis are presented in Salo et al. (1980).

8
The preserved chum were retained for 7 days before weighing andmeasuring them. It was determined by prior experimentation that afterthis period individual variations in shrinkage and weight gain due tothe preservation technique were minimized (Salo et al. 1980).
Environmental Data Collection
In 1979 water temperature, weather and sea conditions were theonly measured environmental variables. As sampling was at night, waterclarity and salinities (measured by a refractometer) could not be takenas had been done in previous years (Bax et al. 1978). Temperatureswere taken at 1 m depth with a mercury glass thermometer after eachbeach seine set and after each tow. Weather and sea conditions wererecorded at each site.

9
RESULTS AND DISCUSSION
Catch—Per—Unit—Effort
Catch—per—unit—effort (CPUE) computed for each salmonid species wasof the form:
CPUE = C./E..] 3
where C is the number of fish caught in the interval j and E~ is theeffort during the same interval. One unit of effort was established asbeing a 10—mm haul with the surface townet or one retrieval of the 37—rnbeach seine set 30 m from shore. The CPUE for the two gears were notequivalent quantitatively. The townet transect within the subbay of theEHW was of only 2—mm duration. To compare the catches on this transectwith other transects, the catches were multiplied by 5. As juvenilescould often be seen ahead of the purseline at the end of a tow, i.e.,yet to fall back into the cod—end, the multiplication factor of 5 mighthave resulted in an underestimate of relative population abundance,especially for the larger juveniles.
For data presentation, we arranged the CPUE over a week becausedaily sampling was inconsistent with regard to pier lighting conditions.Weekly sampling was consistent in this regard.
The CPUE data for chum salmon with both gears were found to belognormally distributed. Consequently, a logarithmic transformation wasused, where the dependent variable (D.V.):
D.V. = log~~ (CPUE + 1)
Environmental Results
The water temperature at 1 m depth was measured upon completion ofbeach seine and townet hauls. The temperature was stable at about 8°Cuntil mid—March, when it started rising and continued rising throughoutthe sampling season (Fig. 3). Seasonal trends in salinity, dissolvedoxygen, and water visibility were described for previous years by Bax etal. (1978), and Bax, Salo, and Snyder (1979).
Migration Periods and Peaks
Chum Salmon
Chum salmon juveniles were the predominant species of salmon captured in 1979. Similar trends were found on both shores and with bothgear types, and they will be considered together.

C-)
Li
F-9
ILk::LiaLiF
>--J
LiLi
a:Li
~1f1R~H flPRIL
SflMPLING~ WEEF~
Fig. 3. Mean weekly water temperature at 1—rn depth atsampling sites at Bangor Annex in 1979.
10
15 -
12
Beach Seine
I/ ... I
•0 ~ I.‘ I
Townet
3
~iRNURRY ~E5RURRYI I
tiflY JUNE JULY

11
From early February to March, several small peaks in abundanceoccurred (Figs. 4 and 5). Subsequent to the initiation of hatcheryreleases, two larger peaks in mid—April and mid—June were noticed.Catches did not decline as rapidly, or to the same extent, following apeak in abundance on the east shore as they did on the west shore(Fig. 4). It is difficult to say whether this higher abundance is dueto juveniles from subsequent and smaller hatchery releases utilizingpredominantly the eastshore epibenthic zone during this period or due tothe piers or pier lighting on the east shore concentrating the chumjuveniles in the areas sampled by the beach seine creating an artificially high measure of abundance (Prinslow et al. 1979).
Coho Salmon
Coho salmon smolts were the second most abundant salmonid caught in1979 (pink salmon do not regularly spawn in Hood Canal in even years).The coho smolts caught were checked for adipose fin clips. There was aminor peak of unclipped coho in mid—March and a large peak of bothclipped and townet catches of unclipped coho in late May (Fig. 6 and 7).The first peak of clipped coho is thought to have originated from BigBeef Creek. The peak of clipped coho in late May was one week earlierfor beach seine catches than for townet catches — 1 and 2 weeks afterpeak outmigration from Big Beef Creek, respectively (McComas, personalcommunication2). Townet catches of coho smolts decreased after thispeak in late May, while beach seine catches continued to rise until theend of sampling in July.
Chinook Salmon
Very few chinook salmon smolts were caught until May (Fig. 8).There were two peaks in abundance — one in mid—May consisting mainly ofbeach seine captures, and one in early June comprising townet and beachseine captures. There was no evidence of the increasing abundance inJuly noticed in previous years (Bax et al. 1979). Hatchery release datadata need to be examined before this can be explained.
Adult Salmon
As our sampling gear is designed for capturing juvenile salmon, fewadult salmon are retained. No adult salmon were caught with the townet.Three adult coho and one adult chinook were caught with the beach seine.
2R. Lynne McComas, Big Beef Creek Field Research Facility of theUniversity of Washington, Seattle, Washington.
12
876
5
4
3
2 East
876
5
4
>-
IL
C~)
U
a
I~Ja
a
a
C)
3
I/
2
//
I
876
5
4
‘I‘I
I ~
‘I
3
‘2
SflMPLING WEEK
Fig. 4. Mean weekly CPUE of chum salmon juveniles atthe East and West Shore beach seine samplinglocations at Bangor Annex in 1979.

13
>-
C-)
IL
a
Ua
a
0~a
C~)
SflMPLING WEEK
Fig. 5. Mean weekly CPUE of chum salmon juveniles at Eastand West Shore shoreline tcnmet locations atBangor Annex in 1979.
8765
4
3
2
8785
4
FEast
3
2
876
5
4
Isp’
I’
3
2

(1)
-JD
ci)
=CC-)
LL~C
a
Lia
a
a
C-)
SflMPLINO~ WEEK
Fig. 6~. Mean weekly CPUE of clipped and unclipped coho smoltsat beach seine sampling locations at Bangor Annex in1979.
14
9
8
7
S
5
4
3
2
Unmarked Coho
Coho
JULY

15
U)F--J
U)
DC-)
U
a
Lia
a
a
C-)
SflMPLIN~ NEEK
Clipped Coho
Fig. 7. Mean weekly CPUE of clipped and unclipped coho smolts attownet shoreline sampling locations at Bangor Annex in1979.
2
9
8
UnmarkedCoho
.7
S
5
4
3
2
/® I’

16
(I)I—-JCD
(ID
CDCD2:
C)
I-ID
a
wa
a
Qa
C)
Fig.
SRMPLING WEEK
8. Mean weekly CPUE of chinook smolts at beach seineand shoreline townet locations at Bangor Annexin 1979.
9
8
7
S
5
4
3
2
9I’
Beach Seine
Town e t

17
Cutthroat Trout
Coastal cutthroat trout adults and juveniles were caught throughoutthe sampling season (Fig. 9). Only 3 juveniles were caught with thetownet and 22 juveniles and 22 adults with the beach seine.
Factors Affecting Catch—Per—Unit—Effort
Site Preference
To investigate any effects of the construction and operation ofNaval facilities on the migrating chum juveniles a comparison was madebetween the catches at different sampling locations in the area. Thedistribution of the juveniles was compared with previous years’ data andany anomalies or trends found.
Data collected with the 37—rn beach seine from February to July andwith the surface townet from April to July were used to compare CPUE ofchum juveniles between sampling sites. For earlier dates, recapturesfrom both the 37—rn beach seine and the townet were too few for statistical analysis. For both gear types, data from all sites were enteredinto a fixed effects analysis of variance, where the logarithmicallytransformed catch data were the dependent variable, and sampling location and sampling week were the independent variables. Additionally, apriori t—tests were run to find differences in east/west shore distribution and the effects of the EHW on east shore distribution.
Nearshore. Significant differences in CPUE were found amongst thebeach seine locations (Table la). Only one site, north Spit 6, wasfound to be significantly different (in this case lower) from all othersites when tested with a Student—Newman—Keuls (SNK) multiple comparisonprocedure. North Spit 6, a site with a steep, exposed beach, has consistently had a lower CPUE than the other beach seine sites in previousyears. On the east shore the sampling locations at Floral Point, northof the major base facilities, had a CPUE lower than all other east shoresites except for south Carlson Point. The decreasing catches north ofthe major base facilities from 1976 to 1979 relative to the east shoremean have been discussed in Salo et al. (1980). The decline cannot beexplained by either an increased offshore movement of the juvenile chumor their crossing over to the west shore. The a priori t—test showedthat the CPUE at north and south EHW was higher than the east shore ingeneral (Table lb). From these data and that of the multiple comparison, it appears that the east shore sites close to the major base facilities had a CPUE higher than those farther away. The high catches atDevil’s Hole and the EHW may be explained by the extensive littoral zonein these areas. Other studies have shown an attraction of young chumsalmon to sheltered nursery areas during their first 2—4 weeks in themarine environment (Allen 1974; Cooney et al. 1978). The high CPUE atSouth Marginal Wharf, which has a limited littoral zone shows that thisis not the only factor operating. Another hypothesis is that the chum

18
C
=F—F-
C-)
Ca
wa
a
ci~a
(-)
SflMPLtN~ WEEK
Fig. 9 . Mean weekly CPUE of juvenile and adult cutthroat trout at beach seine locations atBangor Annex in 1979.
9
7
6
5
4
3
2
tIRY
19
Table 1. Analysis and variance (a) and t—tests (b)~ to show differences in theCPUE of chum fry between beach seine locations at Bangor Annex, 1979.
(a) ANOVA SUMMARY TABLE
Source of Sum of Degrees of Mean Significancevariation squares freedOm square F of F
Total 206.994 378 .548Cells 102.791 32 3.212 16.016 <<.001
Location 29.869 11 2.715 13.538 <<.001Week 69.411 21 3.305 16.480 <<.001
Interaction 75.923 205 .370 1.847 <.001Error 178.714 237 .754 3.760
Significant Groups in Multiple Comparison*
Location x Groups
N. E.H.W. 1.5488
Devil’s Hole 1.3251
S. Marginal Wharf 1.2881
S. E.H.W. 1.2849
N. Carlson 1.2461
S. Carlson 1.0102
S. Brown .9766
N. Brown .9107
S. Floral .8557
N. Floral .7701
S. Spit 6 .729.3
N. Spit 6 .4767
(b). A priori t—testsDegrees of
Groups T statistic freedom T probability
(i) N. and S. E.H.W. vs —3.394 373 <<.001East Shore
(ii) East Shore vs 5.170 373 <<.001West Shore
-~
*Locations which are not significantly different from eachsignificance level are encompassed by the same line.
other at the 5%

20
juveniles would be attracted to the piers which might serve a protectionfrom predation as they “limit the maneuverability and avenues ofapproach for all species of predators” (Major 1977). The lack of a pierin the close vicinity of the Devil’s Hole area means that protectionfrom predation is also not the sole factor operating on site selection.It is most probable that a complex of factors is operating on the sitepreferences of the juvenile chum salmon. As Matthews and Hill (1979)stated:
“The influence of any variable upon habitat selection dependsupon the entire milieu of conditions at a particular time andorganisms seldom select habitat in response to single factors.
The a priori t—tests showed that the nearshore CPUE was higher onthe east than on the west shore (Table lb). From 1975 to 1978 there wasno significant difference between beach seine catches on the east andwest shores, although the vast majority of chum juveniles entering HoodCanal come from hatcheries and rivers on the west shore (Salo et al.1980). The cause of the higher beach seine catches on the east shorethan on the west shore in 1979 is uncertain. It cannot be entirely explained by diel variations, as the nighttime catches in 1977 do not showa difference between shores (Bax et al. 1978). It is not due to the additional east shore beach site in 1979 — North EHW which had the highestCPUE of all beach seine sites — as this site was excluded from the analysis. Possibly the changes on the east shore since 1977 — constructionof degaussing wharf, lights operational at EHW and the Refit Pier —
caused this change in distribution, but we have no direct evidence forthis.
The higher catch on the east shore in 1979 is unlikely to be causedby a redistribution of juveniles from the west shore to the east shorein the vicinity of Bangor Annex. Our offshore distribution data showfew juveniles being found in the middle of the Canal; additionally datafrom the 1977 Hoodsport mark—recapture study (Whitmus and Olsen 1979)show an immediate crossing to the east shore by approximately half ofthe juveniles. Differences in the length—weight relationships anddifferences in peaks of abundance between the juveniles caught on theeast and the west shores at Bangor Annex suggest that the juveniles onthe two shores remain distinct after an initial crossing soon afterrelease from the hatcheries. Therefore, the higher catch on the eastshore in 1979 is most likely due to a localized redistribution of thejuveniles at night on the east shore perhaps caused by pier lighting,leading to an increased probability of their capture with the beachseine. Schreiner (1977) speculated that the high spring runoff in HoodCanal may result in salinity gradients from the east to the west shoreto which the juveniles could respond. Thus, east—west distribution mayalso be a function of environmental variables.

21
Offshore. The CPUE of chum was higher on the east than the westshore, as has been found in all previous years. The implications ofthis are discussed above. Significant differences were found in theCPUE at different locations (Table 2a). The transect inside the EHW hada higher CPUE than any other east shore transect. The attraction of thepier may be partly due to its structural protection from predators(Major 1977), or to the always present low level lighting (Prinslow etal. 1980). The catch at the Service Pier was higher than the remainingeast shore locations, an effect perhaps mediated by the pier and/or itslighting and its proximity to shore. The remaining east shoreline transects were not different from one another. The importance of these observations in regard to forced offshore movement of the chum juvenilesis discussed later in this section.
There was a decline in the abundance of chum with increasing distance from shore in the Carlson Spit area unaffected by wharves (Fig. 10).The decline was highly significant (Table 2b), the first transect (75 mfrom shore) having a higher catch than the remaining five transects.
The similarity in the offshore distribution of the chum between1978 and 1979 (Bax et al. 1979) is surprising in one regard: the datain 1978 were collected during the day, while the 1979 data were collected at night. There is no indication of the nocturnal offshore movementsuggested in 1977 by the smaller daytime beach seine catches as comparedwith the nighttime catches (Bax et al. 1978). It is possible that thejuveniles utilizing the epibenthic habitat during the day do move of f—shore at night but only into the area within 100 m of shore. The juveniles utilizing the pelagic zone do not appear to move farther offshoreat night.
As discussed previously, the catch of chum juveniles with the tow—net did not decrease around the perimeter of the piers, although thesetransects were far enough from shore (up to 400 m) that a decrease wasto be expected. The catch was higher for the transect inside EHW thanfor all other transects. Thus, we conclude that there was an offshoremovement of the juvenile chum around the piers and also a buildup ofjuveniles inside the perimeter of the one wharf studied, perhaps due tolights. Before it can be accepted that this response of offshore movement may lead to increased predation on chum — as suggested by Gilhousen(1962) and Heiser and Finn (1970) for nearshore migrants — it must beshown that those chum captured around the wharves came, at least inpart, from the nearshore zone.
The chum caught in the nearshore zone with the beach seine have amean size smaller than those caught simultaneously with the townet inthe pelagic zone (Fig. 11). After this initial increase in size withincreasing distance from shore, there is no further increase until over300 m from shore when again there is an increase in mean size (Table 3a).The townet transects along the east shore vary from 75 in from shore, onunobstructed shorelines, to 400 m from shore around the Refit Pier.

22
Table 2. Analysis of variance to show differences in CPUE of chum frywith the surface townet between (a) all transects and (b) theparallel transects from April to July 1979.
a) Shoreline transects 1979ANOVA summary table
~yj~~Thignificance
variatiofl~, squares edon square F~
Total 166.932 280 .596Cells 122.826 26 4.724 25.996 <<.001
Location 26.669 15 1.778 9.754 <<.001Week 99.200 11 9.108 49.626 <<.001
Error 18.172 100 .182Interaction 25.933 154 .168 .927 .667
Significant groups in multiple comparisofl*
Location ______ Groups
Inside EHW 1.9496 IService Pier 1.5258S. Carison Pt. (75 m) 1.3107S. Carison Pt. (125 m) 1.1397Marginal Wharf 1.1331S. Carison Pt. (160 m) 1.0322Outside EHW .9759Spit 6 — Spit 5 .9671S. Floral Pt. .9567Spit 5 — Spit 4 .9343S. Carison Pt. (225 m) .9318S. Carison Pt. (300 m) .9303Spit 4 — Brown Pt. .8749S. Carison Pt. (550 m) .8136Delta Pier .8117Spit 4 .7343
b) Parallel tows 1979ANOVA summary table
Source of Sum of Degrees of Meanvariation squares freedom sq~uare F Significance
Total 16,355.894 95Location 4,651.578 5 930.316 7.15 p < .0005Error 11,704.317 90 130.048
Significant groups in multiple comparison*
Distance from shore (m) 75 125 160 300 225 55036.74 26.41 23.83 19.47 17.50 16.09
Groups
*LocatiOns which are not significantly different from each other at the 5%significance level are encompassed by the same line.

100
90
~8O MAY70
60
50
40
~30
20
(0 __________________________
~0 ~ ~ (80 240 300 360 420 480 540OIS1RNCE FROM SHORE (Ill
100
~S0
~80
~70
~60
~50
40
100
~sO
~80
~70
~S0
~50
~0 60 (20 180 240 300 360 420 480 540 600OESORCt FROM SHORE (Ml
23
0 APRIL
420 480 540 600
100
~80
70
~60
~50
~40
JUNE
0 50 120 150 240 300 360 420 480 540 8000(STRNCE FROM SHORE (Ml
JULY
60 121) 180 240 300 360 42)) 480 540 600OISTRNCE FROM SHORE (H)
~979
Fig. 10. Effect of distance from shore on the CPUEof juvenile chum on parallel townet transectsin 1979.

24
=
LU-J
D
LU
Fig. 11. Comparison of the mean length of chum juvenilescaught with the beach seine and the townet in1979.
Townet
110
99
88
88
55.
44
33
22~
11
Beach Seine
J~RY FEBRUARY ~MRRGH RPRIL t~Y
SAMPLING WEEK%JULY

25
Table 3. Analysis of variance showing changes in the size of chumfry caught with the surface townet at Bangor Annex fromJune 11 to July 4, 1979.
Significant
South RefitCarlson Pier
81.52 80.71
Parallel TransectsANOVA Summary Table
Degrees
a)
b)
Source of Sum of of Mean Signifi—variation squares freedom square F cance
Total 656041.019 2402
Cells 142769.519 8 17847.190 84.378 <<.001
Location 2733.035 5 546.607 2.584 .025
Week 140572.781 3 46857.594 221.546 <<.001
Two—way interaction 10106.339 15 673.756 3.186 <.001
Error 503165.161 2379 211.503
Significant groups in multiple comparison*
Distance from shore (m) 160 225 75 125 300 550
~ 80.96 81.08 81.53 81.64 81.88 84.44Groups
Shoreline TransectsANOVA Summary Table
DegreesSource of Sum of of Mean Signifi—variation squares freedom square F cance
Total 632975.244 2912
Cells 78030.182 9 8760.020 47.583 <<.001
Location 25235.069 6 4205.845 23.082 <<.001
Week 61149.630 3 20383.210 111.867 <<.001
Two—way interaction 29087.982 17 1711.058 9.391 <.001
Error 525857.080 2886 182.210
Location
groups in multiple comparisons*
Service South Inside OutsidePier Floral E.H.W. E.H.W.
x 79.01 76.28 75.68 75.53
Groups ________________________________________* Locations not significantly different from each other (p = .05) are
underlined.
MarginalWharf75.51

26
Along these transects the mean size would be expected to be constant orincreasing slightly offshore around the piers. A two—way analysis ofvariance, with the lengths of chum fry as the dependent variable andsampling transect and week as the independent variables (Table 3b) wasrun using only weeks with catches of at least 25 chum juveniles pertransect. Two distinct groups of transects were distinguishable. Thethree transects at the south of the base, from King’s Spit to the RefitPier, had a larger mean size of chum than the four transects at thenorth of the base from Marginal Wharf to Floral Point. Length frequencydistributions of the catches showed the decrease in the mean size at thenorth of the base to be due to an increased number of smaller fish,while the range of sizes remained the same. An example of these datafor July 4 is given in Figs. 12 and 13. This decrease in mean size wasstill evident at Floral Point after the major wharves had been passed.Apparently some chum in the nearshore environment moved offshore whenthey encountered shoreline structures and did not pass through thetrestles. Although at the EHW in 1979, we found no significant predation (Salo et al. 1980), such an offshore movement would be expected toincrease the availability of the juveniles to predators.
Environmental Variables
The effect of environmental factors — tidal direction, tide height,water temperature (recorded as the deviation from the weekly mean temperature for all sampling sites), sea state (measured on the Beaufortscale), wind direction, weather conditions (measured on a scale from 0to 6 corresponding to clear and sunny, through hail and snow), and thetime of year (sampling week) — on the catches of chum juveniles with thetownet and with the beach seine was investigated. Data from February toJuly were used in the analyses. The beach seine and townet data weretreated separately, as it was thought that environmental factors mightaffect the efficiency of these gears or affect the chum juveniles in theareas sampled by these gears differently.
Initially, the effect of tidal direction, a nominal variable, wastested by a t—test. No significant differences in CPUE were found forthe townet data (Table 4). For the beach seine data it appeared thattidal direction influenced catches at sites with a northern exposure butnot at sites with a southern exposure. Tidal direction on catches havenot been consistent over the 5—year study. No effects were found on1978 catches (Bax et al. 1979), while in 1977 there appeared to be astrong influence of tidal direction on catch, although the data needs tobe reexamined to account for did sampling variation (Bax et al. 1978).The 1979 beach seine data were separated by tide stage before entry intothe multiple regression analyses.
A backward elimination procedure was used in these regressions.This procedure enters all variables into the equation on the first step,and then removes variables one at a time until the best regression fit

27
FOR[~ LENGTH IN MMFig. 12. Percent length frequency distribution of juvenile chums
caught with the surface townet at varying distances fromshore on July 4, 1979.
2(1
15
10
S
SOUTH CARLSON (75M)
II
_A A
SOUTH CARLSON (125M)
5.
(1 I I A Af”~~\ J’~-~\A/\ AR N\ r”M ~JM ~ A A
20
15
10
C—)~20
G:is
-JciFcDF—
LL
1-20
~l5L~J(JIG
LLJ~U--
20
15
10
S
5
SOUTH CRRLSON (160M)
I ~ A A A
SOUTH CRRLSON (225M)
I I A ,J\ nJ\ fr”4 r’~ A A
SOUTH CRRLSON (300M)
I I A A .~ A..
SOUTH CRRLSON (55DM)20
15
10
5
I I A~ R~ ~‘O 25 50 75 100 125 150 175

28
SOUTH CARLSON (75M)
Fig. 13. Percent length frequency distribution ofwith the surface townet along the BangorJuly 4, 1979.
juvenile chums caughtAnnex shoreline on
20 -
15 -
10
5
20
15
10
5
I .‘..‘.~..— ——AA A A A A
C~)H-
C-)
SERVICE PIER
b ,,,~ JV~A\~ ~4 A
20
15
10
5-Ja:H-20
F—’5
REFIT PIER
~ AARMA~ A A A R AA A
10LL
H
LUC-)ct~LUCL
10
MARGINAL WHARF
5.
c I A A A I
20INSIDE EaHsNi
15-
~. A I—J
r
l0
15
10
5
OUTSIDE E.H.N
~ A~N~1\f’-~MRA, AA AA20 SOUTH FLORAL
I i A A ~ M ~ A25 50 75 100 125 150 175
FORIK LFNO~TH IN MM

29
Table 4. Analysis of tidal effects on the CPUE of chum fry caught in1979.
Number ofVariable cases Mean T—statistic Significance
Surface townet
Ebb 192 .753— .75 .453
Flood 139 .815
Beach seine — northern exposure
Ebb 59 .9952.69 .008
Flood 54 .618
Beach seine — southern exposure
Ebb 58 .703—1.26 .211
Flood 53 .860

30
is found. This procedure has less theoretical deficiencies than theforward inclusion method (Mantel, in Zar 1974). The exception to thiswas the sampling week which was always the last variable to be eliminated, if necessary, to prevent seasonal trends in CPUE affecting thechoice of variables.
The variable explaining most of the variability in CPUE trends wassampling week. The other variables remaining in the equations are tideheight and weather conditions (Table 5). There has been little consistency from year to year in the apparent effect of environmental variables on catch data.
Chum salmon juveniles have been shown in other studies to respondto changing environmental conditions such as temperature (Bessey 1972),salinity (Houston 1957, Baggerman 1960, Mclnerney 1964), photoperiod(Hoar et al. 1957, Kobayashi 1960, McDonald 1960, Kobayashi and Sasaki1965) under laboratory conditions but, there is little evidence available in the literature on any effect of environmental variables on thedistribution of chum juveniles under natural conditions, with the exception of photoperiod. It must also be considered whether any change incatch correlated with an environmental variable is due to a change inthe distribution, a change in the catchability of the chum, or alternatively, due to a change in the gear efficiency of the net. As Reynolds(1977) suggests:
“where netting . . . is used in fish sampling studies an artifact might be introduced by a possible effect of temperatureon . . . ability to escape from an area being netted.”
Variables such as weather conditions, sea state, or light could beadversely affecting the catch efficiency of the net, leading to significant relationships between catch and environmental variables. Moredetailed analysis of the 5 years of data may show some consistent factors. Tidal effects especially require further investigation which willbe reported in Bax (Ph.D. Dissertation in preparation).
Effects of Low—Level Pier Lighting at EHW
The effects of the low—level pier lighting at EHW on the distribution of chum was studied in 1979 (see Prinslow et al. 1980 for details). Briefly, a ratio of the catches of chum at EHW with the catchesat Floral Point was formed. This eliminated the effect of weekly variations in juvenile abundance from the data. The ratio when no low—levellighting was present was then compared with the ratio when low—levellighting was present to find any increase in abundance at EHW associatedwith the low—level lighting. No increase was found in either the beachseine or townet catches (Table 6).

Ta
ble
5.
Lin
ea
rre
gre
ssio
ne
qu
atio
ns
de
scrib
ing
the
eff
ect
of
me
asu
red
en
viro
nm
en
tal
va
ria
ble
son
the
CPU
Eo
fch
umfr
yin
19
79
.
Va
ria
ble
inP
art
ial
reg
ressio
nS
ign
ific
an
ce
Ove
rall
Ove
rall
Ove
rall
eq
ua
tio
nco
eff
icie
nt
Fo
fF
Co
nsta
nt
R2F
sig
nific
an
ce
Su
rfa
ce
tow
ne
t
Wee
k.7
40
35
0.2
05
<<
.00
1
Tid
eh
eig
ht
.02
24
.17
0<
<.0
42
—1
.29
5.5
69
12
2.6
82
<<
.00
1
Win
d.0
32
2.6
05
.10
8
Be
ach
se
ine
—eb
btid
e
Wee
k.4
71
26
.43
5<
<.0
01
We
ath
er
—.1
77
3.4
41
.06
6.5
58
.25
81
6.1
07
<<
.00
1
Tid
eh
eig
ht
.08
61
.67
8.1
97
Be
ach
se
ine
—flo
od
tid
e
Wee
k.5
27
41
.94
1<
K.0
01
Sea
sta
te—
.20
82
.49
9.1
17
.34
4.3
59
20
.71
6<
<.0
01
Tid
eh
eig
ht
.14
06
.24
7.0
14
32
Table 6. Comparison of the ratio of CPUE at EHW to CPUE at FloralPoint for chum salmon fry during lit and unlit conditions,February to July 1979.
Groups T—statistic DF Significance(one—tailed)
a) Beach seine
lit 0.1348 24 > 0.25
unlit
b) Townet: inside EHW
lit 0.9035 12 0.10 < p < 0.25
unlit
c) Townet: outside EHW
lit 0.1557 10 > 0.25
unlit

33
Hatchery Influence
Chum Salmon. In 1979 the nearshore and offshore abundance of chumjuveniles on the east and west sides of Hood Canal underwent similarchanges and so will be dealt with together.
After early peaks in abundance, attributable to natural production,two major peaks in abundance were observed, in mid—April and frommid—Nay to early July (Figs. 4 and 5). With the exception of an early,and relatively large release from the Hunter Springs hatchery, hatcheryreleases in 1979 were fairly uniform from mid—April to late June(Fig. 14). This makes analysis of the speed of migration of individualreleases difficult. The first of the two major peaks occurred 1 weekafter the first hatchery release from the Hood Canal hatchery and 4weeks after the large early release from the Hunter Springs hatchery.Previous years’ data (Bax et al. 1978; Bax et al. 1979) and mark—recapture data in 1979 (Salo et al. 1980) make it appear unlikely that themigration speed of the chum juveniles would be slow enough so early inthe season for the peak to have resulted from the Hunter Springs release. While the Hunter Springs chum were smaller at time of releasethan the remaining hatchery—reared chum released into Hood Canal in1979, they were no smaller than chum released at the same time in previous years, so we would not expect their size to have caused such alarge change in migration speed. At the same time, the Hood Canalhatchery releases which were from 1.5—2.0 million/week for four consecutive weeks do not explain the dramatic rise in abundance over only1 week. The lack of a large increase in abundance of chum juveniles atBangor Annex in the first 2 weeks following the release of 12.8 millionjuveniles from Hunter Springs hatchery suggests that the behavior ofthose juveniles was abnormal as manifested by changed migration timingand/or disproportionately high early marine mortality.
At the end of the sampling season the abundance of chum juvenilesdropped 2 weeks after the final releases of chum fry from the Quilcenehatchery.
Coho Salmon. The peaks in abundance of coho salmon smolts atBangor Annex can often be related to hatchery releases and the out—migration of adipose fin—clipped smolts from Big Beef Creek and otherstreams in Hood Canal.
After a small increase in abundance in mid—March before hatcheryreleases, abundance increased again in late April as indicated bycatches in the beach seine for the nearshore zone and in mid—May as indicated by the townet catches further offshore (Figs. 6 and 7). Thisincrease followed hatchery releases from the Hood Canal, Quilcene, andGeorge Adams fish hatcheries (Appendix Table 1). At the same time theabundance of Big Beef Creek smolts (thought to comprise the initial peakof fin—clipped smolts) increased, peaking one and two weeks after peakoutmigration from Big Beef Creek in the beach seine and townet catches,
34
15.00
~ HUNTER SPRINGS~: HOOD CRNflL
~ SfcOfcOMISH111111 QUILCENE
(I)
10.00
-J-JI,
wC,)0:w-J
>-
UJ
C-)I-.
__- 1rILi~1
L. JRNURRY FE8RIJRRY MARCH APRLL MRY JUNE JULY
SAMPLING WEEI~Fig. 14 . Releases of chum juveniles into Hood Canal from
the Hunter Springs, Hood Canal, Skokomish, andQuilcene fish hatcheries, 1979.

35
respectively (Appendix Table 2). The majority of the Big Beef Creeksmolts passed through the Bangor Annex area rapidly as evinced by thetransitory increase in abundance there.
The first peak of unclipped coho smolts in the offshore area,thought to be of hatchery origin, was in early June two weeks after alarge release from the George Adams fish hatchery. Abundance in thenearshore zone peaked one week later. The second major peak, in earlyJuly in the offshore area, followed one week after a release from theHood Canal fish hatchery. Nearshore abundance had yet to peak again atthe end of sampling in mid—July.
There is yearly variation in the migration speed of the coho smoltsmigrating from Big Beef Creek. In 1977, peak abundance of Big BeefCreek coho at Bangor Annex followed one week after peak outmigrationfrom Big Beef Creek (Bax et al. 1978). In 1978 the delay increased tothree weeks (Bax et al. 1979), and in 1979 decreased back down to 1—2weeks, as mentioned above. The slower migration speed in 1978 was notrestricted to the coho smolts from Big Beef Creek. Data from mark—recapture studies on Big Beef Creek hatchery—reared chum salmon showedthat their migration speed was slower in 1978 than in 1977 or 1979(Table 7, data from Salo et al. 1980). As yet we do not know the causeof these annual variations in migration speed common to Big Beef Creekchum and coho. Furthermore, we do not know whether to attribute thechanges to yearly fluctuations of unknown cause or to an odd/even (orother) yearly cycle effect. Closer examination of the 1976 catch datain relation to hatchery releases may answer the latter question forchum. Similar annual changes in migratory behavior have been observedfor chum salmon in Prince William Sound (Cooney, personal communication)3, although the data were confounded because the measurements wereof different stocks in the two years studied.
Chinook Salmon. The number of chinook salmon smolts caught was nothigh, despite large hatchery releases. This may have been due to gearavoidance by these larger fish, or differing migration strategies between the salmonid species. Miller et al. (1977) found that whereas afloating beach seine was most effective for chum, a sinking seine wasmost effective for chinook.
The three peaks in the catches, early to mid—May, late May and mid—June (Fig. 8) reflected hatchery releases from the Hood Canal and GeorgeAdams fish hatcheries occurring from 2—5 weeks before the peaks incatches at Bangor (Appendix Table 1). The releases from the Quilcenefish hatchery in late June to early July may not have been fully detected because sampling ceased shortly thereafter. Some of the variationin time taken to reach the Bangor Annex from time of release may be
3R. Ted Cooney, Institute of Marine Science, University of Alaska,Fairbanks, Alaska, 99701.

36
Table 7. Migration speed (km/day) of juvenile chum salmonreleased into Hood Canal from Big Beef Creek duringthe first 3 days. (Data from Salo et al. 1980).
1977 1978 1979
February 12 4 9
March 14 4 14
April — — 7
May 9* — —
June 4* — 4
*Released from Hoodsport.

37
explained by the size of the smolts. The first group, which took 4—5weeks to reach Bangor Annex, were 223/lb when released and were intercepted chiefly with the beach seine. The second group was 100/lb whenreleased from the Hood Canal hatchery and took only two weeks to reachthe sampling area, where they were intercepted with both beach seine andtownet. The third group may have been comprised of both George Adamsand Quilcene releases so the above interpretation is not possible.
Length—Weight Data
Length Data
The length data in 1979 were found to be normally distributed withhomogenous variances and thus suitable for parametric statisticaltesting. Due to the number of data records involved, weekly meanlengths at each site for each gear were used in the majority of analyses. To test the specific hypothesis of the offshore movement by near—shore—oriented juveniles, length frequency data from days of high fishabundance were analyzed. The results of this analysis have been presented previously under “Site Preference — Offshore” in this report.
Chum Salmon. The mean length of chum salmon juveniles caught withthe beach seine and townet started rising from 35—40 mm in early Aprilas hatchery—reared juveniles first started arriving at Bangor (Fig. 11).By the end of the season, in July, the juveniles mean length was about90 mm. Overall, the mean size of townet—caught chum was higher thanthat of beach—seine—caught chum (.02 < p < .05); although at the beginning and end of the sampling season their mean lengths were similar.
The higher overall mean length of chum juveniles caught offshorewith the townet than those caught in the nearshore zone with the beachseine agrees with data from previous studies. Most authors have found adistinct size range at which chum fry move offshore. Allen (1974) founda “definite movement offshore” when the juveniles were approximately 75mm. Sano and Kobayashi (1952) found that offshore movement occurredwhen the juveniles were between 70 and 100 mm, and Sano (1966) foundjuveniles in a different area not moving offshore until 100—120 mm inlength. This offshore movement has sometimes been recorded as accompanying a distinct change in maximum size of prey organisms taken by thechum as they moved offshore at 50—60 mm in length (Okada and Taniguchi1972). Other authors have found definite behavioral changes, the juveniles responding to danger by diving deeper offshore instead of scattering across the surface as they had in the nursery areas (Cooney et al.1978). In contrast to this distinct offshore movement, the movementoffshore in Hood Canal as seen in this study and by Gerke and Kaczynski(1972) is a gradual process occurring at no distinct size range or timeof year, although few chum are caught offshore until early May, when adramatic change in food selection to pelagic prey organisms occurs.

38
After this time many of the chum juveniles caught with the beach seinehave been feeding on pelagic organisms. It has been suggested (Salo etal. 1980) that the pelagially feeding juveniles might return to thenearshore area for its structural protection from predators. The lackof a distinct size at which juveniles move offshore may be due to thepredominance of hatchery juveniles in Hood Canal. The hatcheries release juveniles of a larger initial size on entry into salt water as theseason progresses, and if the offshore movement is dependent upon thetime spent in the nearshore zone, as well as size, then it would be expected that the mean size at which offshore movement occurs would increase correspondingly as the season advances.
The weekly mean length of chum caught at individual locations wasdetermined to find any effects of locality on fish size. A two—wayfixed effects analysis of variance with the independent variables, sampling week and sampling location was run so that any locality effectswould be examined independent of time of year. For the beach seinesamples, of all sites sampled, three — south Carison and south and northFloral Points — had higher mean lengths than at the remaining sites(Table 8 and Fig. 15). Additionally, juveniles of a smaller mean lengthwere caught at west shore sites than at comparable sites on the eastshore.
The trend for juveniles larger than the overall mean size to becaught at the sites on the exposed spits on the east shore has not beennoticed in previous years; however, the converse, that is, juveniles ofa smaller size than the overall mean being found in the sheltered ‘nurs—ery” areas at Devil’s Hole and at EHW, was noticed in 1978 (Bax et al.1979). The nocturnal sampling shedule may have also effected thistrend. It would be informative to reanalyze the 1977 length data separately for night and daytime sampling.
The difference in juvenile characteristics — length, conditionfactor, and time of arrival at the Bangor Annex area — between chumsampled on east and west shores has been noticed in previous years. Ithas been suggested (Salo et al. 1980) that the east and west shoregroups are distinct from early on in their outmigration from Hood Canal,even though the majority enter Hood Canal from hatcheries and rivers onthe west shore and some cross over before reaching Bangor Annex.Whitmus and Olsen (1979) found that approximately half of the markedjuveniles released from the Hood Canal fish hatchery in 1977 crossedimmediately to the east shore.
The mean length of chum caught with the townet did not vary betweenlocations when the whole season’s data were considered. As discussedabove, when individual days’ data were examined differences were foundwith an increase in mean size at more than 300 m from shore and a decrease in mean size offshore around the piers and wharves of the Base(Table 3). The different results from the two methods of analysis reflect that a large number of zero catches entered into the former

39
Table 8. A comparison of the weekly mean lengths of chum fry caught withthe beach seine at different locations in Hood Canal, Washington,1979.
Sum of Degrees of MeanSource of variation squares freedom square f Significance
Total 65197.016 161
Cells 61566.582 30 2052.219 74.052 < .001
Location 1105.853 11 100.532 3.628 < .001Week 58704.401 19 3089.705 111.488 < .001
Error 3630.434 131 27.713
Significant groups in multiple comparisons*
Location x Groups
S. Carlson 68.96
N. Floral 66.04
S. Floral 65.57
Devil’s Hole 60.76
N. Carlson 60.69
S. EHW 59.94
S. Marginal 59.90
S. Spit 6 58.58
N. Brown 58.40
N. Spit 6 56.34
S. Brown 55.50
N. EHW 54.82
*Locations not significantly different from each other (p = .05) arecovered by the same line.

O
-J
0U-
2:a:LU
40
110q:3
Floral andSo. Carison Pts.
99
68-
77
68
55
44
33
22
11
\Remaining Sites
I - I
‘~ JRNURRY FEBRURRY MRRCK ~lPRIL ti~Y JUNE JULY
SAMPLING NEEK
Fig. 15. Comparison of the mean length of chum fry caughtat Floral Point and South Carison Point withthe remaining beach seine locations at BangorAnnex in 1979.

4]-
analysis, as often no fish were caught on many of the transects. Additionally, the method does not take the sample size of the catch intoaccount, leading to a disproportionate contribution to the overall datafrom small samples and far fewer degrees of freedom than would be present if the data from the individual fish were used.
Coho Salmon. There were insufficient length data on coho smolts toanalyze location effects, so only overall trends will be discussed.
The same trends were apparent in beach seine and townet catches(Fig. 16). The mean length dropped from about 150 mm in early April toless than 100 mm by early July. The decreasing size of captured cohosmolts over the sampling season cannot be explained by any change in thesize of smolts released from the hatcheries (Appendix Table 1). It ispossible that it reflects the natural outmigration of coho smolts fromthe rivers of Hood Canal. For example, at Big Beef Creek, the largestsmolts migrate down the river first (Appendix Table 2); however, thereis no subsequent increase near the end of the outmigration as is alsoseen at Big Beef Creek.
The similarity of size of coho smolts caught with the beach seineand with the townet (Fig. 16) contrasts with the higher mean length oftownet—caught chum as compared with beach seine—caught chum (Fig. 11).This similarity in mean length is in spite of the difference in migration timing found between the coho smolts caught with the beach seineand townet (Figs. 6 and 7). These data may be somewhat compromised bythe size of the coho smolts approaching the upper range of size selectivity of the townet, of which we have no estimate.
Chinook Salmon. Length data on chinook salmon smolts are limitedto overall weekly trends. The size of the chinook smolts rose from75 mm in late May to 90—115 mm by early July (Fig. 17). Such an increase in size was not found with the hatchery releases over the sameperiod of time (Appendix Table 1), 50 may indicate growth in the marineenvironment.
Condition Factor
Length and weight data were used to compute the condition factor ofthe smolts according to the equation
Condition Factor of = Mean weight 5mm increment group lo~5—mm increment group i1 (Length~)3
n
The mean condition factors for each 5—mm increment size class, at eachlocation, for each week, were computed and used in the analyses.

160’
144
~‘128
•~—‘ 112
Li-J
U-
2:a:Li
80
64
32
18
42
— .— — c
/Townet
Beach Seine
-I.JRNURRY ft8~JRRY t~RDi RPRIL
SAMPLINGIiRY ,JUNE
WEEkI., JULY
Fig. 16. Comparison of the mean length of coho smoltscaught with the beach seine and the townetin 1979.

43
150
135
120 Beach Seine
‘-‘los. //
~590. o~V
La~i LA~_I is “Townet
~60
IL
~30~
15
JRNL1f~RY FE6RU~RY IIRRCH R?REL IIRY JUNE %IULY
SAMPLING NEEK
Fig. 17. Comparison of the mean length of chinook smoltscaught with the beach seine and the townet in1979.

44
The use of this length—weight relationship to describe a fish’scondition assumes that the heavier the fish at a given length, the“better” its condition. The difficulties in this assumption as discussed by Abbasov and Polyakov (1978) are that the condition factordescribes not only differences in the immediate life history of thefish, but also racial and age characteristics, degree of fullness ofintestines, state of gonads, and other features. In our particular instance differences in the “condition” of the fish that we hope to attribute to local habitat differences or preferences may be confounded by differences in racial origins, size or hatchery rearing techniques. Theuse of the three—way analysis of variance in these analyses takes intoaccount some of the above problems of racial origins, rearing practices,and size differences, by standardizing condition factor with regard tolength and week before analyzing location effects.
In use of this (Fulton’s) condition factor the exponent in the equation is fixed at 3. This is most likely not the true case (Schreiner1977); however, the difficulties in defining standard conditions andthus obtaining the exact exponent required for the allometric conditionfactor are severe. Ricker (1975, p. 209) does state, however, that:
“Fultons’ condition factor can also be used to compare fishof approximately the same length no matter what the value ofb (the exponent).”
Chum Salmon. As the data from the townet and the beach seineshowed the same trends, they will be considered together.
No sampling location had a significant effect on the condition factor of fish sampled by either gear (Table 9). For both gears there wasan increase in condition factor of chum over the sampling season and anincrease with size at any one time (Table 9 and Figs. 18 and 19).
Results of the conditions factor analysis have been varible overthe duration of this study. In all years there has been an increase incondition factor over the season, although in 1977 there was a drop atthe end of the season. The change in condition factor with size at anyone point in the season was noted in 1978, but in the opposite direction. The increasing condition factor as the season progresses suggeststhat conditions are better for chum growth later in the season. Such anincrease in condition factor was not found for chum juveniles held infreshwater at Big Beef Creek (Whitmus, personal communication4).
4Cliff J. ~4hitmus, Big Beef Creek Field Research Facility of theUniversity of Washington, Seattle, Washington.

45
Table 9. Effect of sampling location, sampling week, and mean size on thecondition factor of chum fry caught at Bangor Annex, Hood Canal,1979.
a) Beach seine
ANOVA Summary Table
Sum of Degress of MeanSource of variation squares freedom square f Significance
Total 29.852 1171
Cells 7.033 49 .144 7.057 .001
Location .321 11 .029 1.436 .151
Week 2.983 19 .157 7.719 .001
Size group .810 19 .043 2.097 .004
Error 22.819 1122 .020
b) Townet
ANOVA Summary Table
Sum of Degrees of MeanSource of variation squares freedom square f Significance
Total 19.074 1125
Cells 3.911 49 .080 5.665 .001
Location .292 15 .019 1.382 .148
Week .827 9 .092 6.520 .001
Size group 1.712 25 .068 4.860 .001
Error 15.162 1076 .014
46
~379 HOOD CANAL SALMONID CONDITION PACTOES37—M SEACH SEINE — CHUM SALMON
X-AXIS~i979 SAMPLINO NEEK~ Y-AXIS=5MM SIZE CLASSZ4~XESzCONDITION EACTOC
x
Fig. l~8. Three—dimensional plot to show the effect of sampling week andfork length on the condition factor of chums caught with thebeach seine at Bangor Annex from January to July 1979 (data arecomputed on biweekly means).
3~O~
0
3 00
x
0

4/
Fig. 19. Three—dimensional plot to show the effect of sampling week andfork length on the condition factor of chums caught with thetownet at Bangor Annex from January to July 1979 (data arecomputed on biweekly means).
SURFACE TONNET — CHUM SALMON1979 HOOD CANAL SALMONID CONDITION FACTORS
X—PXIS~1979 SAMPLING NEEK~ Y—PXIS=SMM SIZE CLASSZ—FIXIS=CONDITION FACTOR
:3.00
0.x
0
3.00
0.
x
U

48
SUMMARY
1. Juvenile salmonids were monitored as they migrated along the Bangorshoreline on Hood Canal, site of the construction of four pier facilities for the U.S. Navy’s Submarine Base. Floating beach seineswere used from January through July and a surface townet from February through July in 1979, as the fifth season of a five—yearprogram.
2. Chum salmon juveniles were the predominant salmonid species captured with peak catches in mid—April and mid—June. Additionally,there were consistently high catches with the beach seine on theeast shore from April to June. These peak catches were thought toconsist of juveniles of principally hatchery origin.
3. Coho salmon smolts were the second most abundant salmonid captured,with a peak in late May. After this time catches with the townetdecreased, while beach seine catches continued to increase untilthe end of the sampling period.
4. Few chinook salmon smolts were caught until May. There were twopeaks in recaptures, mid—May and early June, the earlier one beingnoticed mainly in beach seine sampling, the later one by both geartypes.
5. Significant differences in CPUE of chum juveniles between siteswere identified by beach seine. Sites near the wharves, especiallyEHW, had higher catch than sites at the north, and perhaps at thesouth of the Base. The extensive littoral zones at EHW and Devil’sHole may have also increased catches in these areas. Beach seinecatches were higher on the east than the west shore, whereas from1975 to 1978 no difference was identified, which may be due to theconstructed wharves and new security lighting systems.
6. For the townet sampling, it was found that the transect inside EHWhad a higher catch than all the others, and the transect past theService Pier was second. In the absence of piers, catches decreaserapidly with increasing distance from shore. The large catches offshore around the piers suggest forced offshore migration by thejuvenile chum, the smaller of which come from the more protectednearsh ore environment.
7. The effect of environmental factors, tidal direction, tide height,water temperature, sea state, wind direction, weather condition andsampling week on the CPUE of chum juveniles was examined. Samplingweek explained a large amount of the variation in catches. Tideheight and weather conditions showed a significant relationshipwith chum catches, but explained only a small amount of thevariation.

49
8. A yearly variation in the migration speed of coho salmon smoltsfrom Big Beef Creek was noted. This paralleled the variationsfound for chum juveniles over the same 3—year period, with migration speed slower in 1978 than in 1977 or 1979.
9. Larger chum juveniles were caught with the townet than with thebeach seine. The size of the juveniles caught in the pelagic zonedid not increase further until more than 300 m from shore. Largerjuveniles were caught with the beach seine at the more exposedsites than at the sheltered sites. The difference in length—weightcharacteristics of the juveniles caught on the east versus the westshore supports the hypothesis of little intermixing of the juveniles between the two shores, after an initial dispersal.

50
LITERATURE CITED
Abbasov, G. S., and G. D. Polyakov. 1978. Evaluation of feeding conditions and the biological state of a fish population by means ofthe condition factor. J. Ichthyol. 18(3):404—417.
Allen, B. 1974. Early marine life history of Big Qualicum River chumsalmon. Pages 137—148 in D. R. Hardin, ed. Proc. 1974 N.E. Pac.pink and chum salmon workshop. Dep. Environ. Fish., Vancouver,B.C.
Baggerman, B. 1960. Salinity preference, thyroid activity and theseaward migration of four species of Pacific salmon (Onco—rhynchus). J. Fish. Res. Board Can. 17(3):295—322.
Bakkala, R. C. 1970. Synopsis of biological data on the chum salmon(Oncorhynchus keta). FAO Species synopsis. No. 41., Circ. 315.
Bakshtanskii, E. L. 1970. Downstream migrations of pink and red salmon and causes of their delay in the streams of the Kola Peninsula. Trudy vsesoyuznogo naucho—issled—ovatel’skogo InstitutaMorskogo Rybnogo Khozyaistoa i Okeanograf ii, Moscow 74:129—143.
Bax, N. J., E. 0. Salo, B. P. Snyder, C. A. Simenstad and W. J. Kinney.1978. Salmonid outmigration studies in Hood Canal. Univ.Washington, Fish. Res. Inst. Final Report, Phase III, FRI—UW—7819.128 pp.
Bax, N. J., E. 0. Salo, and B. P. Snyder. 1979. Salmonid outmigrationstudies in Hood Canal. Univ. Washington, Fish. Res. Inst. FinalReport, Phase IV, FRI—UW—7921. 89 pp.
Bessey, R. F. 1972. Behavioral responses of juvenile salmon in amoving thermal gradient. M.S. Thesis, Univ. Washington, Seattle.50 pp.
Birman, I. B. 1959. More about the influence of the Kurio—shio on thedynamics of abundance of salmon. Vop. Ikhtiol. 13:16—18. (Fish.Res. Board Can. Transl. Series No. 269.)
Blackbourn, D. J. 1976. Correlation analysis of factors related tothe marine growth and survival of Fraser River pink salmon. Pages198—199 in G. K. Gunstrom, ed. Proc. 1976 N.E. Pac. pink and chumsalmon workshop. Alaska Dep. Fish Game, Juneau, Alaska.
Cooney, R. T., D. Urquhart, R. Nevg, J. Hilsinger, R. Clasby and0. Barnard. 1978. Some aspects of the carrying capacity ofPrince William Sound, Alaska for hatchery released pink and chumsalmon fry. Alaska Sea Grant Rep. AKU—T—78—006. 48 pp.

51
Cooper, W. E., and L. B. Crowder. 1979. Patterns of predation insimple and complex environments. Pages 257—267 in R. H. Stroudand H. C. Clepper, eds. Predator—prey systems in fisheriesmanagement. Sport Fishing Inst., Washington, D.C.
Gerke, R. J., and V. W. Kaczynski. 1972. Food of juvenile pink andchum salmon in Puget Sound. Washington State Dep. Fish., Tech.Rep. No. 10. 27 pp.
Gilhousen, P. 1962. Marine factors affecting survival of Fraser Riverpink salmon. Pages 105—109 in N. J. Wilimovsky, ed. Syinpos. onpink salmon. H. R. MacMillan lectures in fish., Univ. BritishColumbia, Vancouver.
Gosho, M. E. 1976. The food and feeding habits of juvenile pinksalmon in the estuaries of Kodiak Island, Alaska. M.S. Thesis,Univ. Washington, Seattle.
Heiser, D. W., and E. L. Finn. 1970. Observations of juvenile chumand pink salmon in marine and bulkheaded areas. Washington StateDep. Fish., Mgmt. and Res. Div., Suppi. Prog. Rep., Puget Soundstream studies. 28 pp.
Hoar, W. S., M. H. A. Keenleyside, and R. C. Goodall. 1957. Reactionsof juvenile Pacific salmon to light. J. Fish. Res. Board Can.14(6):815—83O.
Hobson, E. H. 1979. Interactions between piscivorous fishes and theirprey. Pages 231—242 in R. H. Stroud and H. C. Clepper, eds.Predator—prey systems in fisheries management. Sport FishingInst., Washington, D.C.
Houston, A. H. 1957. Responses of juvenile chum, pink and coho salmonto sharp seawater gradients. Canad. J. Zool. 35:371—383.
Kobayashi, T. 1960. An ecological study on the salmon fry, Oncorhyn—chus keta. VI. Note on the feeding activity of chum salmon fry.Nikon Suisan Gakkai—Shi 26(6):577—580.
Kobayashi, T. and M. Sasaki. 1965. Experiments using air bubbles andthe light to deflect migrating chum salmon fry, Oncorhynchus keta(Walbaum). Sci. Rep., Hokkaido Salmon Hatchery 19:33—42.
McDonald, J. 1960. The behavior of Pacific salmon during their downstream migration to freshwater and saltwater nursery areas. J.Fish. Res. Board Can. 17(5):655—676.
Mclnerney, J. E. 1964. Salinity preference: An orientation mechanismin salmon migration. J. Fish. Res. Board Can. 21(5):995—1018.

52
Major, P. F. 1977. Predator—prey interactions in schooling periodsduring periods of twilight: A study of silverside Pranesusinsularum in Hawaii. U.S. Nat’l Mar. Fish. Serv. 75(2):415—426.
Matthews, W. J., and L. C. Hill. 1979. Influence of physico—chemicalfactors on habitat selection by red shiners, Notropis lutrensisCopeia 1979(1):70—81.
Merrell, T. R. 1970. Alaska’s fishery resources — the chums. U.S.Fish Wildl. Serv., Fish. Leafl. 632.
Miller, B. S., B. B. McCain, R. C. Wingert, S. F. Borton, K. V. Pierce,and 0. T. Griggs. 1977. Puget Sound interim studies: Ecologicaland disease studies of demersel fishes in Puget Sound near metro—operated sewage treatment plants and in the Ouwamish River — dataanalysis. Univ. Washington, Fish. Res. Inst. Final ReportFRI—UW—7721. 164 pp.
Okada, S., and A. Taniguchi. 1972. Size relationship between salmonjuveniles in inshore waters and their prey animals. Bull. Fac.Fish. Hokkaido Univ. 22:30—36.
Parker, R. R. 1962. Estimation of ocean mortality rates for Pacificsalmon. J. Fish. Res. Board Can. 19(4):561—589.
Parker, R. R. 1968. Marine mortality schedules of pink salmon of theBella Coola River, central British Columbia. J. Fish. Res. BoardCan. 25:757—794.
Prinslow, T. E., E. 0. Salo, and B. P. Snyder. 1979. Studies of behavioral effects of a lighted and an unlighted wharf on outmigratingsalmonids — March—April 1978. Univ. Washington, Fish. Res. Inst.Final Rep. FRI—UW—7920. 35 pp.
Prinslow, T. E., C. J. Whitmus, J. J. Dawson, N. J. Bax, B. P. Snyderand E. 0. Salo. 1980. Effects of wharf lighting on outmigratingsalmonids, 1979. Univ. Washington, Fish. Res. Inst. Final ReportFRI—UW—8007. 137 pp.
Reynolds, W. W. 1977. Temperature as a proximate factor in orientation behavior. J. Fish Res. Board Can. 34:734—739.
Ricker, W. W. 1975. Computation and interpretation of biological statistics of fish populations. Fish. Res. Board Can. Bull. 191.382 pp.
Salo, M. E. 1976. Annotated bibliography on the effects of light onsalmonids with reference to Bangor Annex area. Special Report toDep. Navy. May 1976. Univ. Washington, Fish. Res. Inst. 89 pp.

53
Salo, 14. E., E. 0. Salo, and B. P. Snyder. 1977. A preliminary studyof the effects of pier lighting on fishes. Univ. Washington,Fish. Res. Inst. Final Report FRI-UW—7810. 17 pp.
Salo, E. 0., N. J. Bax, T. E. Prinslow, C. J. Whitmus, B. P. Snyder,and C. A. Simenstad. 1980. Studies of the outmigration of juvenile chum salmon from Hood Canal, Washington with emphasis on theeffects of construction of naval installations. Univ. Washington,Fish. Res. Inst. Final Report FRI—UW—8006. 159 pp.
Sano, S., and T. Kobayashi. 1952. An ecological study of the salmonfry (Oncorhynchus keta). The migration and growth of the fry inthe marking experiment. Sci. Rep., Hokkaido Fish Hatchery8(2):71.
Schreiner, J. U. 1977. Salmonid outmigration studies in Hood Canal,Washington. M.S. Thesis, Univ. Washington, Seattle. 91 pp.
Simenstad, C. A., and W. J. Kinney. 1978. Trophic relationships ofoutmigrating chum salmon in Hood Canal, Washington, 1977. Univ.Washington, Fish. Res. Inst. Final Report FRI—UW—7810. 75 pp.
Stober, J., and E. 0. Salo. 1973. Ecological studies of the proposedKiket Island nuclear power site. Univ. Washington, Fish. Res.Inst. Final Report FRI—UW—7304. 537 pp.
Vernon, E. H. 1958. An examination of factors affecting the abundanceof pink salmon in the Fraser River. mt. Pac. Salmon Fish. Comm.,Prog. Rep.
Washington State Department of Fisheries. 1979. A proposal for long—range Puget Sound salmon resource management. Washington Dep.Fish., Harvest Div., Olympia. 17 pp.
Whitmus, C. J., and S. Olsen. 1979. The migratory behavior of juvenilechum salmon released in 1977 from Hood Canal hatchery at Hoodsport,Washington. Univ. Washington, Fish. Res. Inst. Final ReportFRI—UW—7916. 46 pp.
Wickett, W. P. 1958. Review of certain environmental factors affecting the production of pink and chum salmon. J. Fish. Res. BoardCan. 15(5):11O3—1126.
Zar, J. H. 1974. Biostatistical Analysis. Prentice—Hall, Inc.,Englewood Cliffs, N.J. 620 pp.

Ap
pe
nd
ixT
ab
le1
.R
ele
ase
so
fco
hoan
dch
ino
ok
salm
on
sm
olts
fro
mQ
uilc
en
e,
Hoo
dC
an
al,
an
dG
eo
rge
Ada
ms
fish
ha
tch
erie
sin
toH
ood
Ca
na
l,1
97
9.
Qu
ilce
ne
Fis
hH
atc
he
ry(U
SFW
S)
Da
teo
fF
ish
*N
umbe
rre
lea
se
sp
ecie
sre
lea
se
d
Ma
rch
25C
oho
20
9,0
00
Ap
ril
22C
oho
17
2,7
00
May
6C
oho
40
6,0
00
May
20C
oho
24
,61
1
Jun
e24
FCS
65
9,1
47
Ju
ly1
FCS
55
7,7
10
Hoo
dC
an
al
Fis
h
Da
teo
fF
ish
*re
lea
se
sp
ecie
s
Fe
b.
22S
/FC
S
Ap
ril
12FC
S
May
18FC
S
Jun
e29
Coh
o
Ha
tch
ery
(WD
F)
Num
ber
rele
ase
d
30
2,0
03
49
,95
2
1,5
74
,00
0
47
7,9
90
*FC
S—
Fa
llch
ino
ok
salm
on
S/F
CS
—S
prin
gan
dfa
llch
ino
ok
salm
on
Fis
h!l
b
810
19—
480
20 18
Ge
org
e
Da
teo
fre
lea
se
May
14
May
30
Fis
h/lb
13 223
100
Ada
ms
Fis
hH
atc
he
ry(W
DF)
,
Fis
h*
Num
ber
sp
ecie
sre
lea
se
dF
ish
/lb
Coh
o9
36
,05
130
FCS
18
5,3
99
120
98 97
15
U,

55
Appendix Table 2. Weekly release of fin—clipped coho smolts from the BigBeef Creek wild outmigration into Hood Canal, Washington,1979.*
Total tag Mean length ofWeek release tag release (nim)
Prior to April 15 0
April 16 — 22 0
April 23 — 29 2,049 125
April 30 — May 6 9,150 110
May 7 — 13 10,050 102
May 14 — 20 6,852 99
May 21 — 27 3,389 99
May 28 — June 3 913 104
June 4 — 10 250 110
June 11 — 17 70 112
Total released 41,723
*Data from R. Lynne McComas, University of Washington, and David Siler,Washington State Department of Fisheries, Olympia, Washington.