Farley Reeves Principal Reese Education Center Frenship ISD Rosita Williams Assistant Principal.
Upload
hoangthuanCategory
view
216download
0
FRENSHIP INDEPENDENT SCHOOL DISTRICT
Lubbock and Hockley Counties Cities of Wolfforth and Lubbock
State of Texas, USA 79382
2012-2013 Official Budget
September 1, 2012 – August 31, 2013
Issued by:
Dr. David Vroonland Greg Cartwright, CTSBO, CPA Superintendent Chief Financial Officer
Available online at www.frenship.us

MISSION STATEMENT
Frenship ISD’s mission is to educate and develop all students by providing a foundation to empower them to reach their maximum potential and realize their opportunity of choice. We believe:
people are our most important resource, passion for learning is essential for success, commitment to excellence results in creating a premier environment for our
students, each student has an opportunity to reach his or her potential, and character is essential to the development of leadership.
For these reasons, the district puts our students first. Frenship ISD is a community-centered district, grounded in our history and our achievements, and is respectful of our culture.
Frenship has a Vision
Seek Perfection - Capture Excellence
Page 1
Frenship Independent School District
BOARD OF TRUSTEES Brad Draper President David Miller Vice President Scott Stockton Secretary Kelley Grimes Member Kyle Rogers Member Troy Vanderburg Member Jolyn Wilkins Member ADMINISTRATIVE OFFICIALS Dr. David Vroonland Superintendent of Schools Darryl Flusche Asst. Superintendent – Curriculum and Instruction Michelle McCord Asst. Superintendent – Administrative Services Greg Cartwright Chief Financial Officer Tim Williams Executive Director - Operations Joe Barnett Director of Technology Cindi Cobb Director of Curriculum Brad Davis Director of Athletics Rhonda Dillard Director of Human Resources Danny Miller Director of Student Services Kim Parker Director of Special Education Andy Penney Director of Public Relations Courtney Reeves Director of Business Services
Page 2

Frenship Independent School District Consultants and Advisors
General Counsel Underwood Law Firm, P.C. 1111 West Loop 289 Lubbock, Texas 79416 Auditors Davis Kinard & Co, P.C. 400 Pine Street Abilene, Texas 79601 Financial Advisor FirstSouthwest 325 N. St. Paul Street, Suite 800 Dallas, Texas 75201 Bond Counsel McCall, Parkhurst, & Horton L.L.P. 717 N. Harwood Street, Suite 900 Dallas, Texas 75201 Depository Bank City Bank 5219 City Bank Parkway Lubbock, Texas 79407
Page 3

Frenship Independent School District
2012-2013 Budget Table of Contents
Introductory Section Mission Statement ................................................................................................ 1 Board of Trustees / Administrative Officials .......................................................... 2 Consultants and Advisors ..................................................................................... 3 Executive Summary
Budget Presentation ................................................................................ 10 Facts about Frenship ISD ........................................................................ 11 Budget Process ....................................................................................... 12 Budget Calendar ...................................................................................... 13 Strategic Plan .......................................................................................... 14 Financial Structure and Basis of Accounting ............................................ 15 Combined Funds ..................................................................................... 16 General Fund ........................................................................................... 17 Student Nutrition Fund ............................................................................. 20 Debt Service Fund ................................................................................... 21 Property Tax Values and Tax Rates ........................................................ 22 Tax Rate Impact on Homeowners ........................................................... 24 Student Enrollment .................................................................................. 25 Staffing ..................................................................................................... 26 Financial Integrity Rating System of Texas (FIRST) ................................ 27 Future Budget Years ................................................................................ 27 Budget Contact ........................................................................................ 28 Acknowledgment ..................................................................................... 28
Organizational Section Frenship ISD History .......................................................................................... 30 Frenship ISD Facts ............................................................................................. 32 School Districts in Lubbock County .................................................................... 35 Frenship ISD District Boundaries ........................................................................ 36 Frenship ISD Campus Listings ........................................................................... 38 Frenship ISD School Calendar 2012-2013 ......................................................... 39 Board of Trustees ............................................................................................... 40 Organizational Chart ........................................................................................... 41 Financial Policies / Basis of Accounting ............................................................. 42 Account Code Structure ..................................................................................... 52 Strategic Plan ..................................................................................................... 61 Budget Policies / Process ................................................................................... 67 Budget Calendar 2012-2013 .............................................................................. 78
Page 4

Frenship Independent School District
2012-2013 Budget Table of Contents - Continued
Financial Section Introduction ......................................................................................................... 80
Combined Governmental Funds ......................................................................... 81 General Fund ...................................................................................................... 82 Revenue and Expenditure Assumptions .................................................. 82 Statement of Revenues and Expenditures ............................................... 84 Expenditures by Major Object .................................................................. 87 Revenues and Expenditures by Function by Object ................................ 88 Major Changes 2012-2013 ...................................................................... 91 Student Nutrition Fund ........................................................................................ 92 Revenue and Expenditure Assumptions .................................................. 92 Statement of Revenues and Expenditures ............................................... 93 Debt Services Fund ............................................................................................ 94 Revenue and Expenditure Assumptions .................................................. 95 Statement of Revenues and Expenditures ............................................... 97 Outstanding General Obligation Debt Schedule ...................................... 98 Debt Amortization Schedule .................................................................... 99 Capital Projects Funds ..................................................................................... 100 Overview ................................................................................................ 100 2007 Bond Program ............................................................................... 101 District Bond Sales ................................................................................ 102 2012-2013 Projects ................................................................................ 103 Other Special Revenue Funds Overview .......................................................... 113 Other Special Revenue Funds – Statement of Revenues and Expenditures ... 115 Informational Section Taxable Value History and Projections ............................................................. 117 Tax Collections and Tax Rate History .............................................................. 118 Top Ten Taxpayers .......................................................................................... 119 Tax Rate Impact to District’s Taxpayers ........................................................... 120 Student Enrollment Summary ........................................................................... 121 Student Enrollment Projections ........................................................................ 122 Staffing ............................................................................................................. 123 Future Years Budget Assumptions ................................................................... 124 Future Years Budget – General Fund ............................................................... 125 Future Years Budget – Student Nutrition and Debt Service Funds ................... 126
Page 5

Frenship Independent School District
2012-2013 Budget Table of Contents - Continued
Buildings – Square Footage and Opening Dates .............................................. 127 Campus Budget and Performance Information ................................................ 128 Frenship High School ............................................................................ 128 Reese Education Center ........................................................................ 129 Frenship Middle School ......................................................................... 130 Terra Vista Middle School ...................................................................... 131 Heritage Middle School .......................................................................... 132 North Ridge Elementary School ............................................................. 133 Crestview Elementary School ................................................................ 134 Westwind Elementary School ................................................................ 135 Willow Bend Elementary School ............................................................ 136 Bennett Elementary School ................................................................... 137 Oak Ridge Elementary School ............................................................... 138 Benchmark – Comparison to State ................................................................... 139 Benchmark – Comparison to Regional Peer Districts ....................................... 140 Benchmark – Comparison to State Peer Districts ............................................. 141 Academic Assessment and Accountability ....................................................... 142 Accomplishments ............................................................................................. 153 Glossary of Terms ............................................................................................ 159
Page 6

Frenship Independent School District
2012-2013 Budget List of Tables
Introductory Section Table 1: Student Ethnicity Percentages ........................................................... 12 Table 2: Combined Funds – Statement of Revenues and Expenditures ......... 16 Table 3: General Fund – Statement of Revenues and Expenditures ............... 18 Table 4: General Fund Major Changes for 2012-2013 .................................... 19 Table 5: Student Nutrition Fund – Statement of Revenues and Expenditures . 20 Table 6: Debt Service Fund – Statement of Revenues and Expenditures ....... 21 Table 7: Taxable Value Projections ................................................................. 22 Table 8: Tax Rate History ................................................................................ 23 Table 9: Tax Rate Impact on District’s Taxpayers ........................................... 24 Table 10: Student Enrollment History & Projections .......................................... 25 Table 11: Staffing History .................................................................................. 26 Table 12: Future Budget Projections – General Fund ....................................... 28 Organizational Section Table 13: Total Enrollment by Campus and Grade ............................................ 33 Table 14: Student Ethnicity Percentages ........................................................... 34 Table 15: 2012-2013 Budget Calendar .............................................................. 78 Financial Section Table 16: Combined Funds – Statement of Revenues and Expenditures ......... 81 Table 17: General Fund – Statement of Revenues ........................................... 84 Table 18: General Fund – Statement of Expenditures – By Function ................ 85 Table 19: General Fund – Statement of Expenditures – By Object ................... 86 Table 20: General Fund – Expenditures by Major Object .................................. 87 Table 21: General Fund – By Function By Object ............................................. 88 Table 22: General Fund Major Changes for 2012-2013 .................................... 91 Table 23: Student Nutrition Fund – Statement of Revenues and Expenditures . 93 Table 24: Debt Service Fund – Statement of Revenues and Expenditures ....... 97 Table 25: Aggregate Debt Service - Graph ....................................................... 98 Table 26: Debt Amortization Schedule .............................................................. 99 Table 27: 2007 Bond Program ......................................................................... 101 Table 28: Schedule of Bond Sales .................................................................. 102 Table 29: Capital Projects Schedule for 2012-2013 ........................................ 103 Table 30: Capital Projects – New North Elementary Fund .............................. 104 Table 31: Capital Projects – Heritage Middle School Fund ............................. 105 Table 32: Capital Projects – Elementary Schools Renovation Fund ................ 106 Table 33: Capital Projects – Maintenance Projects Fund ................................ 107
Page 7

List of Tables - Continued Table 34: Capital Projects – Frenship High School Renovations Fund ........... 108 Table 35: Capital Projects – Technology Projects Fund .................................. 109 Table 36: Capital Projects – Transportation / Maintenance Facilities Fund ..... 110 Table 37: Capital Projects – Casey Administration Building Fund ................... 111 Table 38: Capital Projects – New South Elementary Fund .............................. 112 Table 39: Special Revenue Funds – Statement of Revenues & Expenditures 115
Informational Section Table 40: Taxable Value History and Future Projections ................................. 117 Table 41: Taxable Value Projections - Graph .................................................. 117 Table 42: Property Tax Levies and Collections ............................................... 118 Table 43: Tax Rate History - Graph ................................................................. 118 Table 44: 2012 Top Ten Taxpayers ................................................................. 119 Table 45: Tax Rate Impact to District’s Taxpayers .......................................... 120 Table 46: Property Tax History ........................................................................ 120 Table 47: Student Enrollment Summary .......................................................... 121 Table 48: Staffing History ................................................................................ 123 Table 49: Future Years Budget Projections – General Fund ........................... 125 Table 50: Future Years Budget Projections – Student Nutrition & Debt Svc. . 126 Table 51: District Buildings – Square Footages and Opening Dates ............... 127 Table 52: Benchmark – AEIS Comparison to State ......................................... 139 Table 53: Benchmark – AEIS Comparison to Regional Peer Districts ............. 140 Table 54: Benchmark – AEIS Comparison to State Peer Districts ................... 141 Table 55: TAKS 2011 – District to State Comparison ...................................... 142 Table 56 TAKS Results 2010-2011 ................................................................ 143 Table 57: TAKS 10th Grade 2012 – District to State Comparison .................... 143 Table 58: STAAR Results 2012 – 5th Grade .................................................... 144 Table 59: STAAR Results 2012 – 8th Grade .................................................... 144 Table 60: STAAR Results 2012 - EOC ............................................................ 145 Table 61: TELPAS Results K-2 ....................................................................... 146 Table 62: TELPAS Results 3 - 12 .................................................................... 146 Table 63: TPRI Results 2011-2012 ................................................................. 147 Table 64: National Merit Award History ........................................................... 148 Table 65: SAT History 2005-2012 ................................................................... 149 Table 66: ACT History 2005-2012 ................................................................... 149 Table 67: Graduation Rates ............................................................................ 150 Table 68: Completion Rates Comparison – District to Region to State ........... 151 Table 69: Student to Teacher Ratios – Science and Social Studies ................ 152
Page 8

FRENSHIP INDEPENDENT SCHOOL DISTRICT
INTRODUCTORY SECTION
Page 9

Frenship Independent School District
Executive Summary We are pleased to present the 2012-2013 budget book for Frenship Independent School District. This budget represents the revenue and spending plan for the District for the 2012-2013 fiscal year which begins September 1, 2012 and ends August 31, 2013. It has been prepared in accordance with state regulations and local policies. The budget includes the three major funds requiring Board approval for the fiscal year – General Fund, Student Nutrition Fund, and Debt Service Fund. The budget also includes other Special Revenue Funds and Capital Projects Funds that do not require a legally adopted budget. The budget is developed per the Board policies CE (Legal and Local) which stipulate that the “Superintendent shall prepare, or cause to be prepared, a proposed budget covering all estimated revenue and expenditures of the District for the following year.” The Texas Education Agency, which exercises oversight of Texas School District financial affairs, requires a legally adopted budget for the General Fund, Food Services Fund, and the Debt Service Fund. The 2012-2013 budget presentation for Frenship Independent School District is to provide quality, useful information to its citizens concerning the District’s financial plan for educational programs and services for the coming 2012-2013 fiscal year. It is prepared in a manner to help our citizens, staff, and Board of Trustees understand how resources are allocated and the goals the District’s desires to achieve. The budget book is organized to present the information in a user-friendly format that meets the criteria set forth in the Meritorious Budget Award program administered by the Association of School Business Officials (ASBO) organization. The budget book contains the following sections:
• Introductory Section - reflects the key, important information within the budget book. This section gives the reader an insight to the remainder of the budget book. Includes a liftable executive summary section that highlights and summarizes the key components within the budget book.
• Organizational Section - provides the framework for the budget development
as well as the District’s organizational and financial structure. Contains detail information on the budget process and policies, account code structure, and District financial policies and procedures.
Page 10
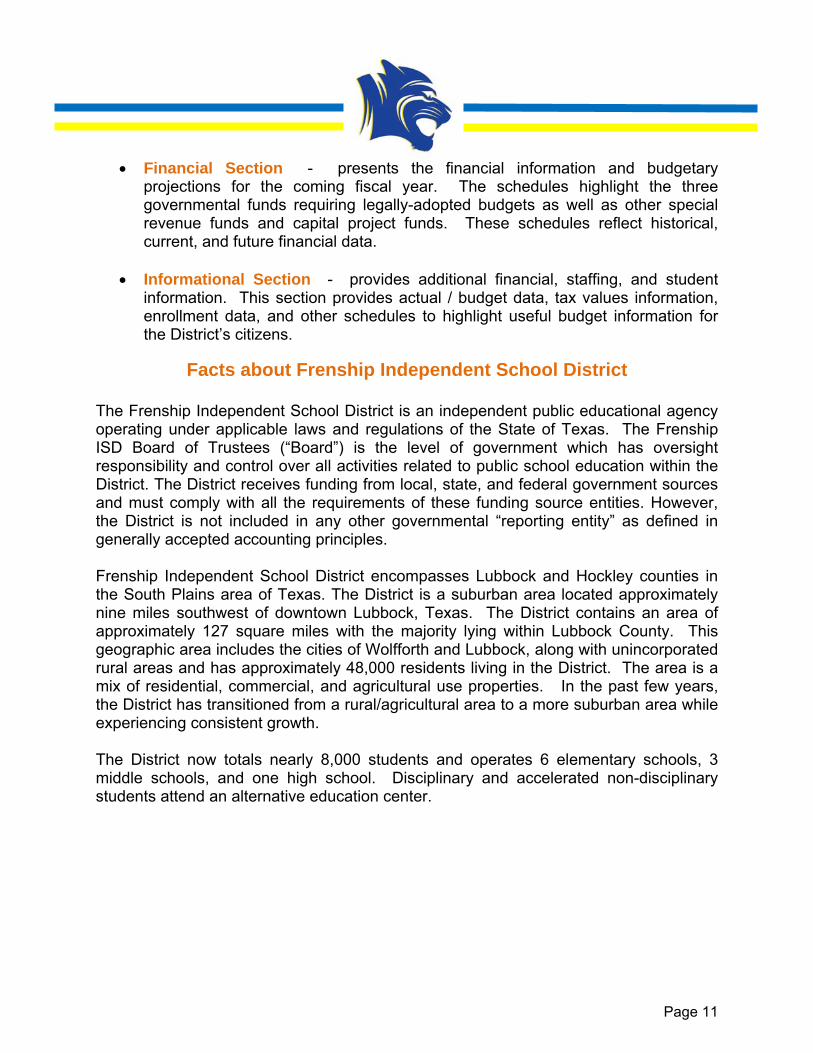
• Financial Section - presents the financial information and budgetary
projections for the coming fiscal year. The schedules highlight the three governmental funds requiring legally-adopted budgets as well as other special revenue funds and capital project funds. These schedules reflect historical, current, and future financial data.
• Informational Section - provides additional financial, staffing, and student
information. This section provides actual / budget data, tax values information, enrollment data, and other schedules to highlight useful budget information for the District’s citizens.
Facts about Frenship Independent School District
The Frenship Independent School District is an independent public educational agency operating under applicable laws and regulations of the State of Texas. The Frenship ISD Board of Trustees (“Board”) is the level of government which has oversight responsibility and control over all activities related to public school education within the District. The District receives funding from local, state, and federal government sources and must comply with all the requirements of these funding source entities. However, the District is not included in any other governmental “reporting entity” as defined in generally accepted accounting principles. Frenship Independent School District encompasses Lubbock and Hockley counties in the South Plains area of Texas. The District is a suburban area located approximately nine miles southwest of downtown Lubbock, Texas. The District contains an area of approximately 127 square miles with the majority lying within Lubbock County. This geographic area includes the cities of Wolfforth and Lubbock, along with unincorporated rural areas and has approximately 48,000 residents living in the District. The area is a mix of residential, commercial, and agricultural use properties. In the past few years, the District has transitioned from a rural/agricultural area to a more suburban area while experiencing consistent growth. The District now totals nearly 8,000 students and operates 6 elementary schools, 3 middle schools, and one high school. Disciplinary and accelerated non-disciplinary students attend an alternative education center.
Page 11

Table 1 Frenship Independent School District
Student Ethnicity Percentages
2006-07 2007-08 2008-09 2009-10 2010-11
Anglo 61% 61% 60% 59% 55%
Hispanic 31% 31% 31% 32% 36%
African American 5% 5% 6% 6% 4%
Other 3% 3% 3% 3% 5% Under the state accountability rating system instituted by the Texas Education Agency, school districts and school campuses are rated as either Exemplary, Recognized, Acceptable, or Unacceptable. These ratings are frozen in place for 2011-12 as the state transitions to a revised rating system. For 2010-2011, the District was rated as “Recognized” while the District’s campuses received the following ratings: Elementary Schools Secondary Schools Bennett Exemplary Frenship Middle Recognized Crestview Exemplary Terra Vista Middle Recognized North Ridge Exemplary Heritage Middle N/A Oak Ridge Exemplary Reese Alternative Center N/A Westwind Recognized Frenship High School Acceptable Willow Bend Recognized
Budget Process
The overall budget process has rules and laws that must be met as set by the State of Texas. The Texas Education Code Sections 44.002-44.006 establish the legal basis for school district budget development. Along with these legal requirements, the District also follows a standard process to develop each fiscal year’s budget. The budgeting process is comprised of five major phases: planning, preparation, adoption, implementation, and evaluation. The budgetary process begins with sound planning. Planning defines the goals and objectives of campuses and the school district and develops programs to attain those goals and objectives. Once these programs and plans have been established, budgetary resource allocations are made to support them. Budgetary resource allocations are the preparation phase of budgeting. The allocations cannot be made, however, until plans and programs have been established.
Page 12

The adoption stage of the budget process occurs in the month of August each year, prior to the start of the fiscal year on September 1st. The Board of Trustees has the responsibility of adopting the budget before setting the tax rate to support the budget. A public hearing for the budget and the proposed tax rate must occur before official legal adoption by the Board of Trustees. After adoption, the implementation of the budget is performed by the Business Office, with the cooperation of other District administrators. Implementation also includes establishing controls over revenues and expenditures, budget amendments, and informational reporting on the budget. Finally, the budget is evaluated for its effectiveness in attaining goals and objectives. Evaluation typically involves an examination of: how funds were expended, what outcomes resulted from the expenditure of funds, and to what degree these outcomes achieved the objectives stated during the planning phase. This evaluation phase is important in determining the following year’s budgetary allocations. The evaluation culminates in the performance of the annual audit performed by an independent CPA. The audit results must be reviewed and approved by the Board and sent to State by the end of January each year. In summary, budget preparation is not a one-time exercise to determine how a school district will allocate funds. Rather, school district budget preparation is part of a continuous cycle of planning and evaluation to achieve district goals. The preparation, adoption and revision of the budget are the result of a process covering the entire year. The following is the budget calendar for the 2012-2013 fiscal year.
• Budget Planning November - January
• Budget Preparation February – June
• Board Adoption August (includes Board of Trustee review in July & August)
• Budget Evaluation September – August
• Audited Financial Statements December
A comprehensive budget calendar is included in the Organizational Section of this document.
Page 13

Strategic Plan
Frenship ISD initiated a Strategic Planning process in April 2010 to provide focused, purposeful planning to direct the District’s efforts over the next 5 years and beyond. The District is currently in a 3-year process to implement the strategic action plans approved by the Board of Trustees. A comprehensive review and discussion of the District’s strategic goals and action plan detail is included in the Organizational Section of this budget book. Below is a summary of the key goals from the strategic plan. Teaching and Learning
Develop challenging, engaging, and diverse learning experiences so all students are successful.
• Establish collaborative professional development processes that engage students in an applied learning environment
• Incorporate FISD Graduate Profile in all content planning and delivery of instruction
Funding and Finance
Maximize financial resources to provide students with the necessary tools to reach their maximum potential.
• Develop a plan to find sources of revenue outside the Maintenance and Operating (M&O) budget
• Develop a plan to find savings inside the Maintenance and Operating (M&O) budget
Staff
Create a systematic approach to recruit and retain superior teachers/staff to elevate student success.
• Develop a proactive retention plan to include a competitive compensation plan and innovative recruitment strategies
• Implement a comprehensive professional development plan that addresses the specific needs of a diverse staff
Facilities
Provide facilities based upon the needs of students to ensure management of growth while elevating student success.
• Establish a comprehensive high school development plan based upon the needs and demographics of our district
• Define the district’s role in community access to facilities • Establish a comprehensive district-wide plan to ensure facility equity
Page 14

Communications
Effective communication practices will be implemented which will result in increased stakeholder involvement and support of the FISD vision and mission.
• Develop a plan at the district and campus levels to define and standardize internal communication methods.
• Identify and establish effective, targeted external communication approaches that will increase involvement and support among all stakeholder groups, including those groups who are traditionally under-represented
Financial Structure, Accounting Basis, and Account Code Structure The District maintains approximately 25 separate funds to account for its operations and special programs. Each fund varies in purpose. All funds, including campus and student activity funds, are accounted for on a district level basis. The fund accounting system defines each fund by fiscal period and a self-balancing set of accounts including assets, liabilities, fund equity, revenues and expenditures. There are five major Governmental fund groups that include the General Fund, Student Nutrition Fund, Debt Service Fund, Special Revenue Funds, and Capital Projects Funds. Accounting records are maintained in accordance with generally accepted accounting principles (GAAP). Budgetary controls, which employ encumbering purchase orders to reserve commitments to the budget, include periodic amendments to ensure compliance with state law. The budget worksheets throughout this document will be summarized at the fund, function and major object levels. The actual general ledger is made up of hundreds of detailed line items that are the building blocks of this document. In fact, the State of Texas mandates the account code structure used by all public school districts. The account code defines transaction detail. The account code will tell the reader what was generally purchased, which campus made the purchase, the purpose of the purchase and the major source of funds used. A detailed review of the account code structure is included in the Organizational Section of this document.
Page 15

The 2012-2013 combined budget of Frenship ISD includes three major funds to be legally approved by the Board of Trustees - General fund, Student Nutrition fund, and Debt Service fund. The following schedule presents a comparison of revenues and expenditures for these Governmental funds.
Student Debt
General Nutrition Service
DESCRIPTION Fund Fund Fund Total
REVENUES
5700 Local 27,785,000$ 1,451,731$ 12,027,789$ 41,264,520$
5800 State 23,196,100 19,016 505,898 23,721,014
5900 Federal 520,000 1,632,945 - 2,152,945
TOTAL REVENUE 51,501,100 3,103,692 12,533,687 67,138,479
EXPENDITURES11 Instruction 29,243,711$ -$ -$ 29,243,711$ 12 Instruction Resources & Media Services 814,309 - - 814,309 13 Curriculum Development & Staff Development 596,085 - - 596,085 21 Instructional Leadership 1,301,515 - - 1,301,515 23 School Leadership 3,323,825 - - 3,323,825 31 Guidance and Counseling 1,505,714 - - 1,505,714 33 Health Services 594,222 - - 594,222 34 Pupil Transportation 1,812,950 - - 1,812,950 35 Food Services - 3,423,370 - 3,423,370 36 Co-curricular / Extra-curricular Activities 2,403,773 - - 2,403,773 41 General Administration 1,944,939 - - 1,944,939 51 Plant Maintenance & Operations 7,386,062 - - 7,386,062 52 Security & Monitoring Services 434,332 - - 434,332 53 Data Processing Services 1,003,963 - - 1,003,963 61 Community Services 26,200 - - 26,200 71 Debt Service - - 11,977,819 11,977,819 81 Capital Outlay - - - - 95 Payments to JJAEP 10,000 - - 10,000 99 Appraisal Services 385,000 - - 385,000
TOTAL EXPENDITURES 52,786,600 3,423,370 11,977,819 68,187,789
NET REVENUE OVER (UNDER) (1,285,500)$ (319,678)$ 555,868$ (1,049,310)$
OTHER SOURCES7900 Other Sources -$ -$ -$ -$ 8900 Other Uses - - - -
NET SOURCES OVER (UNDER) -$ -$ -$ -$
NET REVENUE/SOURCES OVER/UNDER (1,285,500)$ (319,678)$ 555,868$ (1,049,310)$
BEGINNING FUND BALANCE 15,570,603$ 896,340$ 5,307,731$ 21,774,674$
ENDING FUND BALANCE - UNAUDITED 14,285,103$ 576,662$ 5,863,599$ 20,725,364$
Statement of Revenues and Expenditures (Budget)2012-2013
Table 2Frenship Independent School District
Combined Funds
Page 16

Frenship Independent School District General Fund
The General Fund is commonly referred to as the “Operating Fund” or the “Local Maintenance and Operations” Fund or “Local M&O” Fund. Local assessed tax revenue and state aid encompass the majority of the revenues received for this fund. The District pays its general operating expenditures (staff payroll, utilities, supplies, contracts, travel, etc.) through this fund. General Fund revenue is budgeted to decrease $908 thousand or 1.7% versus 2011-12. Despite an increase in enrollment and increasing property values, District revenue will be down. The state public education funding reduction enforced by the 82nd Texas Legislature for the 2011-2013 biennium causes this reduction in revenue. When comparing to the expected revenues from previous funding laws, the District received $3.0 million less in 2011-2012 and estimates receiving $4.4 million less in 2012-2013. General Fund expenditures are budgeted to increase by $506 thousand or 1.0% versus 2011-2012. Due to the end of the Federal Education Jobs funding, around $1.2 million of staff payroll will now be included in the General Fund budget. This large increase is offset by a reduction in teacher and staff positions managed through attrition and allowing class sizes to slightly increase. This offset totals approximately $800 thousand. The District’s General Fund balance is estimated to increase by $130 thousand in 2011-12 but decrease by $1.3 million in 2012-2013. Since fund balance is a sign of fiscal health, the District’s goal is to maintain at least a 20% ratio of fund balance to annual operating expenditures. At the end of the 2012-2013 fiscal year, the fund balance is estimated to be $14.3 million or 27% of expenditures – well above the 20% goal.
Page 17

2008-09 2009-10 2010-11 2011-12 2012-13Audited Audited Audited Unaudited AdoptedActual Actual Actual Totals Budget % LY
Local Revenue 23,735,542 24,757,755 26,362,451 26,898,823 27,785,000 3.3State Revenue 23,742,181 24,615,855 25,704,818 24,720,412 23,196,100 (6.2)Federal Revenue 332,562 383,748 475,302 790,000 520,000 (34.2)
TOTAL REVENUES 47,810,285 49,757,358 52,542,571 52,409,235 51,501,100 (1.7)
11 Instruction 26,564,792 26,708,447 28,571,137 28,762,689 29,243,711 1.712 Instruction Resources & Media Services 712,658 701,265 740,328 727,107 814,309 12.013 Curriculum Development & Staff Development 1,341,807 1,417,774 707,518 810,644 596,085 (26.5)21 Instructional Leadership 1,084,409 1,226,480 1,205,630 1,256,524 1,301,515 3.623 School Leadership 2,725,423 2,908,052 3,155,529 3,331,902 3,323,825 (0.2)31 Guidance and Counseling 1,253,264 1,385,890 1,388,378 1,455,308 1,505,714 3.533 Health Services 472,688 533,693 521,464 573,295 594,222 3.734 Pupil Transportation 1,619,250 1,731,837 1,814,360 1,773,100 1,812,950 2.236 Co-curricular / Extra-curricular Activities 2,185,622 2,181,596 2,890,791 2,437,979 2,403,773 (1.4)41 General Administration 1,742,414 1,790,883 1,955,910 1,968,687 1,944,939 (1.2)51 Plant Maintenance & Operations 6,320,620 7,071,148 7,275,215 7,186,495 7,386,062 2.852 Security & Monitoring Services 425,401 483,729 420,350 442,831 434,332 (1.9)53 Data Processing Services 831,631 900,052 949,376 1,164,672 1,003,963 (13.8)61 Community Services 14,964 13,890 16,706 26,780 26,200 (2.2)71 Debt Service 0 0 0 0 0 n/a81 Facilities Acquisition & Construction 77,377 18,017 18,443 2,147 0 n/a95 Payments to JJAEP 31,671 11,730 0 0 10,000 n/a99 Other Governmental Charges 361,687 398,212 380,873 360,000 385,000 6.9
TOTAL EXPENDITURES 47,765,678 49,482,695 52,012,008 52,280,160 52,786,600 1.0
NET REVENUE OVER (UNDER) 44,607 274,663 530,563 129,075 (1,285,500)
OTHER SOURCES (USES) 15,000 0 1,791,017 0 0
NET REVENUE/SOURCES OVER (UNDER) 59,607 274,663 2,321,580 129,075 (1,285,500)
BEGINNING FUND BALANCE 12,785,678 12,845,285 13,119,948 15,441,528 15,570,603
ENDING FUND BALANCE 12,845,285 13,119,948 15,441,528 15,570,603 14,285,103
Statement of Revenues and Expenditures - By FunctionYears 2009 through 2013
General Fund
Table 3Frenship Independent School District
Page 18

REVENU State Ai Property Federal Miscella EXPEND Payroll f Position Salary In One-tim Capital O Other In The aboexpenditreductioFederal Approximfor 2012
UE
d Funding
y Value and
Program D
aneous Rev
DITURES
from expirin
Reduction
ncrease an
e Technolo
Outlay
ncrease – U
ove reflects tures – for n in the sEducation
mately $1.32-2013.
FrensGe
2
Decrease
d Tax Levy
Decrease –
venue – Loc
ng Federal
via Attritio
d higher be
ogy project
Utilities, Sup
the major 2012-2013
second yea Jobs fund
3 million in
Tship Indepeeneral Fun2012-2013
Increase
SHARS / E
cal, State &
Fund Progr
n
enefits cost
expiring
pplies, etc.
changes in3 versus 20ar of the lding, a deffund balanc
Table 4 endent Sc
nd – Major versus 201
Incr To
(
ERATE
& Federal
ram
n the Gener011-2012. egislative bficit budgetce reserves
hool DistriChanges11-2012
rease (Deco Fund Ba(in thousan
($1,633
$1,065
($280
($60
($1,100
$1,000
($600
$200
$100
($100
ral Fund bu Due to thbiennium at is showns may be u
ict
crease) lance nds)
3)
5
0)
0)
0)
0
0)
0
0
0)
udget – bote additionaand the ex
n for the 20used to bala
h revenuesal State funxpiration of012-2013 yance the bu
s and nding f the year.
udget
Page 19

The Student Nutrition Fund accounts for the operation of the District's cafeteria meal program. The 2012-2013 budget totals $3,423,370, a 20.5% increaseto last year. This increase reflects a higher priority by the Student Nutrition contracted service company to promote more flavorful and healthy choices forthe students. Also driving the increase is $350 thousand for new kitchen and cafeteria equipment as part of a renovation of the High School dining facilities.
Meal prices for 2012-2013 will increase 5 cents due to federal program requirements. The District meets or exceeds the mandated nutritional requirementsset by state and federal agencies.
2008-09 2009-10 2010-11 2011-12 2012-13Audited Audited Audited Unaudited Adopted % LYActual Actual Actual Actual Budget 12-13
LOCAL REVENUE
School Meals 1,305,619 1,413,465 1,433,788 1,425,364 1,446,731 1.5Other 3,087 3,422 4,305 10,435 5,000 (52.1)
Total Local 1,308,706 1,416,887 1,438,093 1,435,799 1,451,731 1.1
STATE REVENUE
State Matching Funds 13,250 19,016 18,728 17,962 19,016 5.9
Total State 13,250 19,016 18,728 17,962 19,016 5.9
FEDERAL REVENUE
Federal Meal Reimbursement - Breakfast 288,677 300,865 334,498 343,477 332,725 (3.1)Federal Meal Reimbursement - Lunch 976,850 1,123,261 1,118,497 1,126,267 1,143,450 1.5Federal Commodities 142,297 170,662 217,047 180,000 156,770 (12.9)
Total Federal 1,407,824 1,594,788 1,670,042 1,649,744 1,632,945 (1.0)
TOTAL REVENUE 2,729,780 3,030,691 3,126,863 3,103,505 3,103,692 0.0
EXPENDITURES
Payroll Costs 0 0 0 0 0 n/aProfessional & Contract Services 2,385,875 2,834,109 2,658,850 2,615,561 2,859,100 9.3Supplies & Materials 229,478 178,637 225,732 187,505 177,270 (5.5)Other Operating Expenses 31,803 30,595 18,287 37,570 37,000 (1.5)Capital Outlay 1,674 0 0 0 350,000 n/a
TOTAL EXPENDITURES 2,648,830 3,043,341 2,902,869 2,840,636 3,423,370 20.5
NET REVENUE OVER (UNDER) EXPENDITURES 80,950 (12,650) 223,994 262,869 (319,678)
BEGINNING FUND BALANCE 354,045 434,995 422,346 646,340 909,209
ENDING FUND BALANCE 434,995 422,346 646,340 909,209 589,531
Student Nutrition Fund
Table 5Frenship Independent School District
Statement of Revenue and ExpendituresYears 2009 through 2013
Page 20
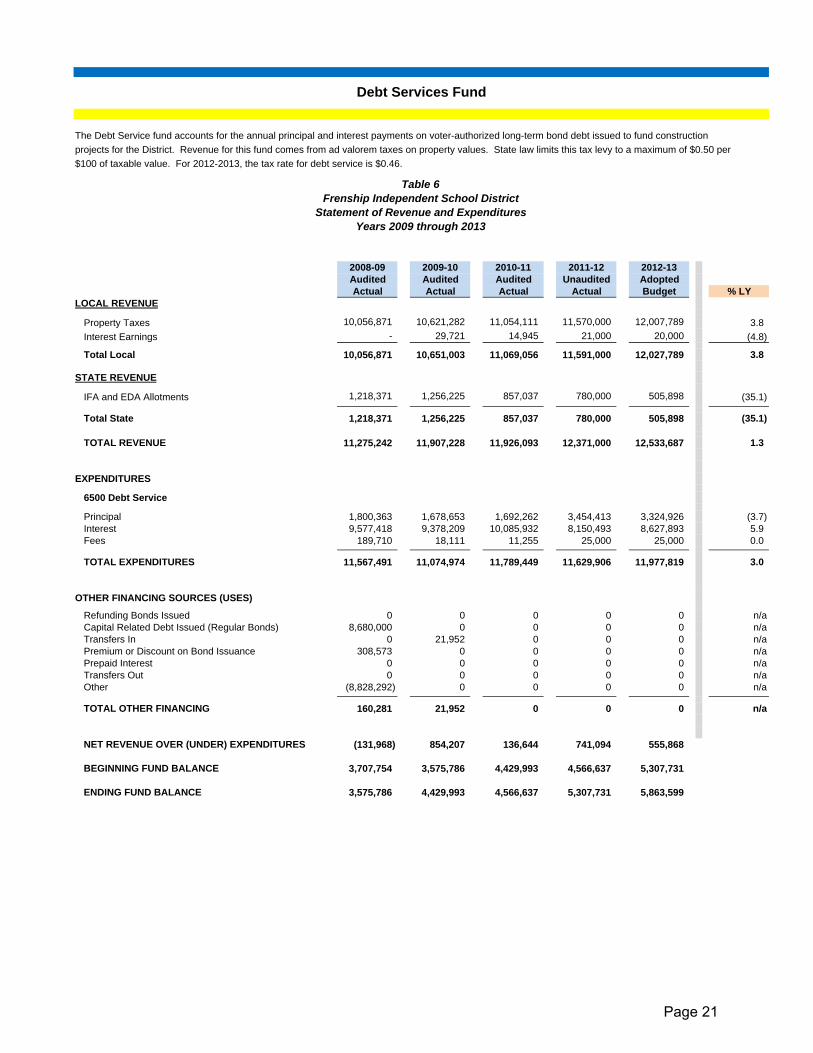
The Debt Service fund accounts for the annual principal and interest payments on voter-authorized long-term bond debt issued to fund constructionprojects for the District. Revenue for this fund comes from ad valorem taxes on property values. State law limits this tax levy to a maximum of $0.50 per$100 of taxable value. For 2012-2013, the tax rate for debt service is $0.46.
2008-09 2009-10 2010-11 2011-12 2012-13Audited Audited Audited Unaudited AdoptedActual Actual Actual Actual Budget % LY
LOCAL REVENUE
Property Taxes 10,056,871 10,621,282 11,054,111 11,570,000 12,007,789 3.8Interest Earnings - 29,721 14,945 21,000 20,000 (4.8)
Total Local 10,056,871 10,651,003 11,069,056 11,591,000 12,027,789 3.8
STATE REVENUE
IFA and EDA Allotments 1,218,371 1,256,225 857,037 780,000 505,898 (35.1)
Total State 1,218,371 1,256,225 857,037 780,000 505,898 (35.1)
TOTAL REVENUE 11,275,242 11,907,228 11,926,093 12,371,000 12,533,687 1.3
EXPENDITURES
6500 Debt Service
Principal 1,800,363 1,678,653 1,692,262 3,454,413 3,324,926 (3.7)Interest 9,577,418 9,378,209 10,085,932 8,150,493 8,627,893 5.9Fees 189,710 18,111 11,255 25,000 25,000 0.0
TOTAL EXPENDITURES 11,567,491 11,074,974 11,789,449 11,629,906 11,977,819 3.0
OTHER FINANCING SOURCES (USES)
Refunding Bonds Issued 0 0 0 0 0 n/aCapital Related Debt Issued (Regular Bonds) 8,680,000 0 0 0 0 n/aTransfers In 0 21,952 0 0 0 n/aPremium or Discount on Bond Issuance 308,573 0 0 0 0 n/aPrepaid Interest 0 0 0 0 0 n/aTransfers Out 0 0 0 0 0 n/aOther (8,828,292) 0 0 0 0 n/a
TOTAL OTHER FINANCING 160,281 21,952 0 0 0 n/a
NET REVENUE OVER (UNDER) EXPENDITURES (131,968) 854,207 136,644 741,094 555,868
BEGINNING FUND BALANCE 3,707,754 3,575,786 4,429,993 4,566,637 5,307,731
ENDING FUND BALANCE 3,575,786 4,429,993 4,566,637 5,307,731 5,863,599
Debt Services Fund
Frenship Independent School DistrictStatement of Revenue and Expenditures
Years 2009 through 2013
Table 6
Page 21

Frenship Independent School District
Taxable Values and Tax Rate On January 1 each year the property values are rendered for appraisal. The appraisal process is conducted by the Lubbock County Appraisal District (LCAD). Properties are required to be appraised at 100% of market value. A ten percent appraisal cap controls runaway property value growth. The LCAD submits preliminary values to the school district by May 1. These values are usually a conservative estimate of the final certified values that are provided by July 25th. The preliminary values are good estimates upon which to base the tax levies for the operating and debt service budgets. Once the certified values are received by the district, the tax rate adoption and budgeting process can be completed for the new fiscal year.
Table 7 Taxable Value Projections
For budget purposes, the tax levy is computed from the Net Taxable Value at a 99% collection rate. The actual taxes to be collected on the Freeze Taxable Values are added back. The Freeze Taxable Value is the property values of citizens over 65 years old. Their tax levy is frozen when they turn 65 and can never rise any higher no matter what happens to property values or tax rates. The combination of the Net Taxable Value levy and the levy on Frozen Values equals the Total Levy for the year.
Page 22

Every homeowner receives a state mandated homestead exemption of $15,000 to reduce the amount of taxes owed. An additional exemption is provided for those 65 years and older. Their tax levy is frozen at the amount when they receive the exemption and can never go up even as their home value or tax rate increases. The State of Texas places limits on how much tax rates can increase over the previous year’s rate. Each taxing entity must calculate its rollback rate. This is the maximum rate that can be adopted before an automatic rollback election takes place. If a rate is adopted that is higher than the rollback rate, the voters have an opportunity to affirm the proposed higher rate through an election or roll it back to the rollback rate. The rollback rate is the amount of state and local revenue (on a per pupil basis) for the prior year divided by the new year’s taxable values. The Maintenance and Operations (M&O) tax rate supports the major educational and operational programs of the District for such expenses as staff salaries, utilities, supplies, materials, equipment, etc. The M&O rate for 2012-2013 is $1.04. The Debt Service rate tax rate supports payments of principal and interest for the debt authorized by the voters. The total amount of debt service payable each year less any state aid is divided by the taxable property values to determine the rate. For 2012-2013, the debt service (I&S) rate is $0.46.
Table 8
Page 23
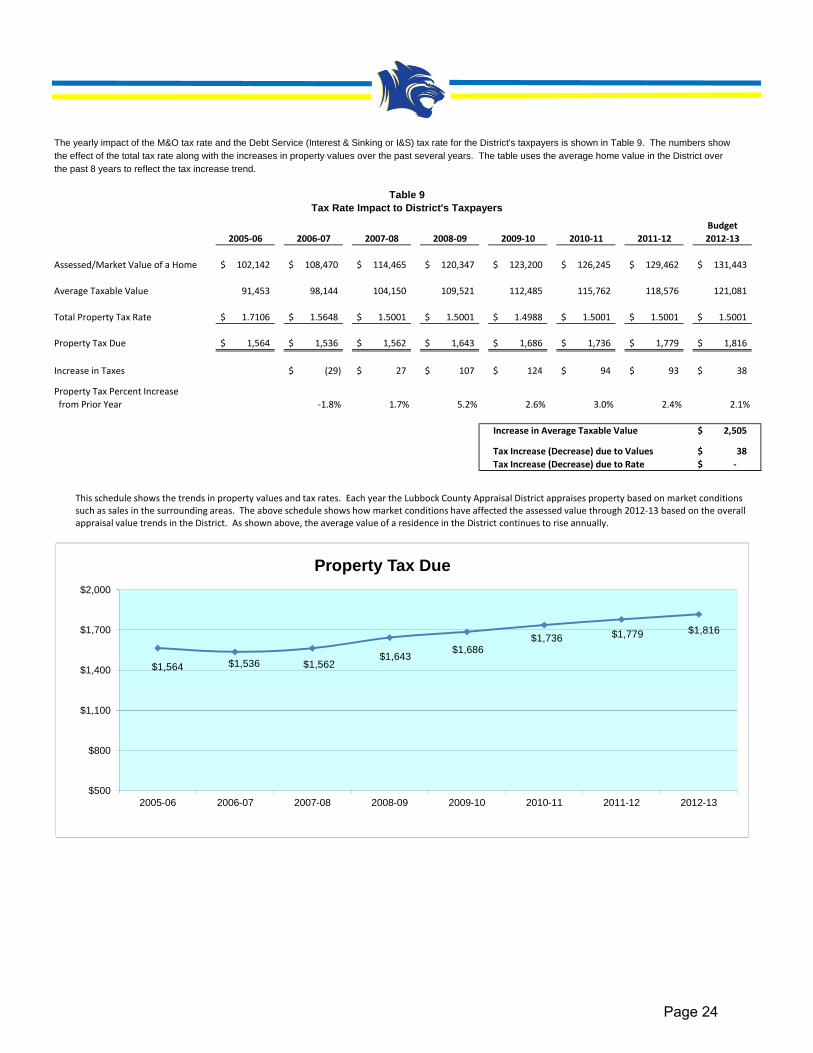
The yearly impact of the M&O tax rate and the Debt Service (Interest & Sinking or I&S) tax rate for the District's taxpayers is shown in Table 9. The numbers showthe effect of the total tax rate along with the increases in property values over the past several years. The table uses the average home value in the District overthe past 8 years to reflect the tax increase trend.
Budget2005‐06 2006‐07 2007‐08 2008‐09 2009‐10 2010‐11 2011‐12 2012‐13
Assessed/Market Value of a Home 102,142$ 108,470$ 114,465$ 120,347$ 123,200$ 126,245$ 129,462$ 131,443$
Average Taxable Value 91,453 98,144 104,150 109,521 112,485 115,762 118,576 121,081
Total Property Tax Rate 1.7106$ 1.5648$ 1.5001$ 1.5001$ 1.4988$ 1.5001$ 1.5001$ 1.5001$
Property Tax Due 1,564$ 1,536$ 1,562$ 1,643$ 1,686$ 1,736$ 1,779$ 1,816$
Increase in Taxes (29)$ 27$ 107$ 124$ 94$ 93$ 38$
Property Tax Percent Increase from Prior Year ‐1.8% 1.7% 5.2% 2.6% 3.0% 2.4% 2.1%
Increase in Average Taxable Value 2,505$
Tax Increase (Decrease) due to Values 38$ Tax Increase (Decrease) due to Rate ‐$
Table 9Tax Rate Impact to District's Taxpayers
This schedule shows the trends in property values and tax rates. Each year the Lubbock County Appraisal District appraises property based on market conditions such as sales in the surrounding areas. The above schedule shows how market conditions have affected the assessed value through 2012‐13 based on the overall appraisal value trends in the District. As shown above, the average value of a residence in the District continues to rise annually.
$1,564 $1,536 $1,562$1,643
$1,686$1,736 $1,779 $1,816
$500
$800
$1,100
$1,400
$1,700
$2,000
2005-06 2006-07 2007-08 2008-09 2009-10 2010-11 2011-12 2012-13
Property Tax Due
Page 24

Frenship Independent School District Enrollment Growth
Student enrollment numbers for Frenship Independent School District continue to increase each year, though at lower percent increases than 4 to 5 years ago. Total K-12 enrollment has increased from 6,580 in 2008 to 7,768 in 2013, an increase of 1,188 or 18%. Annual enrollment increases have ranged from 160 to 400 students over the past six years. This growth occurs throughout the district. This previous enrollment growth along with a demographers estimate that the District will continue to experience 3.5% annual growth over the next 5 years places pressure on our physical building capacities. A new elementary school is planned to open in Fall 2014 to help alleviate this growth pressure. Projects for a high school configuration and another elementary school are currently in the planning phase.
Table 10 Student Enrollment History & Projections PEIMS Membership Totals
4,000
5,000
6,000
7,000
8,000
9,000
10,000
11,000
07/08 08/09 09/10 10/11 11/12 12/13 13/14 14/15 15/16
Enrollment 6,580 6,919 7,200 7,412 7,577 7,768 8,007 8,246 8,485 ADA 6,319 6,662 6,924 7,145 7,352 7,481 7,711 7,941 8,171 WADA 7,714 8,067 8,398 8,672 8,411 8,971 9,245 9,520 9,800
Gray highlight represents preliminary estimates made in August 2012.
Page 25

A significant portion of the annual operating budget is dedicated to staffing and the related salary and benefits costs (approx.80%). To effectively control operating costs of the District, on-going monitoring must be performed for all staffing areas. Statelaws place restrictions on classroom staffing for the kindergarten through 4th grade levels to a 22:1 ratio. To go above this ratio level, the District would need to obtain approved waivers from the state's Education commissioner. At the secondary levelalong with grade 5, the District strives to maintain a 25;1 ratio, though certain classes may exceed this level or be much lower.
2008-09 2009-10 2010-11 2011-12 2012-13
Teachers 510 541 546 545 532(Classroom, Interventionists, Special Programs)
Professional Support 79 91 92 89 91(Directors, Counselors, Librarians, Campus Office Staff,Central Office Staff)
School Leadership 28 28 29 31 31(Principals, Asst. Principals)
Central Administration 10 9 8 7 7(Superintendent, Asst. Superintendents, Cabinet-LevelPositions)
Aides 90 100 99 103 101
Auxiliary 149 167 172 173 172
Total Staff (Fall Snapshot) 866 934 945 948 934
Student Enrollment (Total Membership - Fall Snapshot) 6,919 7,200 7,412 7,577 7,7683.8 4.1 2.9 2.2 2.5
Staffing RatiosTeaching Staff 13.6 13.3 13.6 13.9 14.6Total Staff 8.0 7.7 7.8 8.0 8.3
Table 11
Staffing HistoryFrenship Independent School District
StaffingFrenship Independent School District
Page 26

Financial Integrity Rating System of Texas (FIRST)
Senate Bill (SB) 218 of the 77th Legislature (2001) authorized the implementation of a financial accountability rating system, which is officially referred to as School FIRST. The primary goal of School FIRST is to improve the management of school district financial resources. School FIRST was developed in consultation with the Comptroller of Public Accounts, and its development also benefited from the many comments that were received from school district and regional education service center personnel. The School FIRST rating is based upon an analysis of staff and student data reported for the school year and actual financial data. Frenship ISD received a rating of Superior Achievement under the School Financial Integrity Rating System of Texas (FIRST), which is the highest rating possible. Each school district must hold an announced public meeting to distribute the financial management report that explains the district’s performance under each of the 20 indicators and the district’s rating. Each district is encouraged to provide additional information in the financial management performance report that is beneficial to taxpayers by noting special circumstances.
Future Budget Years
Budgeted revenue for local taxes and state aid in 2011-12 and 2012-13 are based on the funding laws enacted in Senate Bill 1 from the 82nd Texas Legislature. For this revenue in years 2013-14, 2014-15, and 2015-16, the Senate Bill 1 laws are assumed to remain in place. More changes in the public education funding laws are highly possible from the Texas legislature in 2013. Enrollment numbers reflect the projections shown in our demographer’s report in summer 2012. The attendance rate of 96.3% is the historical average for the District and is used to calculate the annual Average Daily Attendance (ADA) number. This number is a major driver in determining the amount of state funding for each fiscal year. The Maintenance and Operations (M&O) tax rate is assumed to remain at $1.04 per $100 of taxable value. No current plans to hold a Tax Ratification Election (TRE) to increase the rate up to the maximum of $1.17. Salary increases are assumed to be 1.5% per year along with non-payroll expenditure increases of 1% per year. Additions to teaching and administrative staff are included to maintain current student-to-teacher ratios as the District grows in student enrollment. With the planned opening of a new elementary school in Fall 2014-15, additional staff and operations costs are included in 2014-15 and 2015-16. Budget projections are planned to include an effort to maintain a strong, healthy fund balance reserve of at least 20% of operating expenditures to preserve financial and cash flow stability.
Page 27

Table 12
Future Budget Projections (In Millions)
General Fund
Audited Unaudited Adopted Estimate Estimate Estimate
2010-11 2011-12 2012-13 2013-14 2014-15 2015-16
Total State / Local Revenue 48.2 48.3 47.9 49.4 50.8 52.3
% Increase 0.2 (0.8) 3.0 3.0 2.9
Other Revenues 6.2 4.1 3.6 3.7 3.8 3.9
General Fund Revenues 54.3 52.4 51.5 53.0 54.6 56.2
% Increase 5.1 (3.5) (1.7) 3.0 2.9 2.9
General Fund Expenditures 52.0 52.3 52.8 53.9 55.0 56.1
% Increase 1.1 0.5 1.0 2.0 2.0 2.0
Net Revenue Over (Under) 2.3 0.1 (1.3) (.8) (.3) .1
Beginning Fund Balance 13.1 15.4 15.6 14.3 13.5 13.1
Ending Fund Balance 15.4 15.6 14.3 13.5 13.1 13.2
As % of Expenditures 29.7% 29.8% 27.1% 25.0% 23.9% 23.6%
Budget Contact Individuals who have questions regarding this budget document should contact Greg Cartwright, CTSBO, CPA, Chief Financial Officer for Frenship Independent School District at 806-866-0963 or via email at [email protected]. Budgeting a school district’s revenues and expenditures is a challenging process, especially in times of reduced funding from the state. However, we believe the budget document demonstrates reasonable and prudent effort to provide the needs of the students, families, and community members. It is our goal to provide the best possible education for our students, while being good stewards of the taxpayers’ dollars. We appreciate the support from the Frenship School Board of Trustees for developing, implementing, and maintaining an excellent education program for the children of our school district. Dr. David Vroonland Greg Cartwright, CTSBO, CPA Superintendent Chief Financial Officer
Page 28

FRENSHIP INDEPENDENT SCHOOL DISTRICT
ORGANIZATIONAL SECTION
Page 29

The land where Wolfforth lies was originally owned by C.W. Post. Mr. Post, also the founder of Post, Texas and the creator of Post cereals, sold the land in the early 1900s for the high price of $2.00 an acre to E.L. Steck and family.
It's documented that the first school in the area was in operation in 1917. Instruction was offered in the first seven grades and all grades were taught by the same teacher, Mrs. Otto Sims.
At that same time, a new four classroom school building was constructed in Wolfforth. The enrollment grew so much in the 1920s that a second teacher was hired. By 1929, Wolfforth school enrollment reached 125.
The original school would house Frenship students until additions were made to the original building in 1950. That year, a new high school, the current junior high building, was built at a cost of $150,000.
One year later in 1918, a major change occurred in the community - the laying of railroad track by the Santa Fe Railroad. This helped locate the community that is now known as Wolfforth because a major railroad switch was laid here exactly 12 miles from the downtown depot station in Lubbock.
As the railroad established and people moved to the area for employment, population around the community quickly grew. In the year 1923, the Santa Fe railroad decided to name this up-and-coming community "Wolfforth," named after longtime cowboy and area resident George C. Wolffarth. Mr. Wolffarth was a huge help to Santa Fe in establishing the railroad through the area 5 years before.
But the communities' first ordeal would quickly arise. When the local Post Office was established later in 1923, problems arose with the spelling of the newly founded Wolfforth. The town was misspelled incorrectly by both the Post Office and the Santa Fe Railroad. Because the Post Office name had begun to spread with mail delivery, their spelling became official. The "a" in Wolfforth became an "o."
The beginning of the 1950s saw numerous changes for the city and school district. In 1950, Wolfforth was officially incorporated as a city, giving the city their first official mayor, M.E. Casey. Incorporation helped structure local city offices including the volunteer fire department.
History of Frenship Independent School District
In the 1930s the community of Wolfforth was still considered a small agricultural community, and surrounding Wolfforth were similar setups. In 1935, Lubbock County School Superintendent Joseph Griggs consolidated the Wolfforth school with three surrounding schools - Hurlwood, Foster, and Carlisle. The consolidation of the 4 schools is where the name Frenship was born.
The consolidation quickly expanded the number of students. In Frenship's first school year in 1935, the enrollment grew to 250 students along with 16 teachers. The first graduating class from Frenship (shown above) included 13 graduates. And a teacher's salary in 1935 was $60 a month. The Frenship school district built a new building in 1936 to accommodate the expansion in enrollment. The building built in 1936 is where the current Middle School is located in downtown Wolfforth.
Page 30

In 1952, Frenship built their first elementary school, Casey Elementary, named after the city's first mayor. The cost of the construction topped $152,000. Two years later in 1954, Reese Elementary was constructed north of downtown.
Major changes began for FISD in the 1980s. Superintendent J. Weldon Bennett retired from his position as Superintendent of Frenship after more than 25 years of service. Dr. Paul Whitten became the new Superintendent and quickly noticed changes within the geographic boundaries of the district. A construction boom had begun, meaning rapid growth was in Frenship's future.
Big plans for the district remain on the horizon. Already in the works are new homes, more industry, and new schools to bear the name Frenship.
The district has grown so much that outsiders are calling the town of Wolfforth, Frenship - something some of the traditionalists of the area don't want to see happen. But even though some want us to remember there are differences between Wolfforth and Frenship, some say the two now go hand in hand.
History of Frenship Independent School District (Cont.)
The District continues to grow in the West and Southwest areas of Lubbock county. For the 2012-13 school year, the District will include almost 8,000 students residing in 6 elementary schools, 3 middle schools, an alternative education center, and one high school (A detailed list of campuses is included on page 10). The district's third middle school (named Heritage Middle School) opened in August of 2011. A seventh elementary school is scheduled to open in Fall 2014.
Adding to the fluidity of the Frenship ISD campus were not only migrant families and their children, but the families moving in and out of the Reese Air Force base, located in the northern part of the district.
The 1970s were a time for the Frenship district to level out in growth. FISD saw about a 1% growth per year during that time. Class sizes remained small, teachers knew their students and families well, and times for the district remained constant, giving administrators an opportunity to balance budgets with little headache. It was also a time during which the teacher supply list remained short and sweet.
To accommodate for the growth, the current high school building was built and opened in 1981. North Ridge Elementary opened its doors in 1985 and Crestview Elementary soon followed in 1989. Two more schools were built in the 1990s, Bennett Intermediate in 1991 and Westwind Elementary in 1995. Also in 1997, the Reese Education Center opened as well.
And as the century changed and the district entered the 21st century, Frenship continued to see expansions in enrollment. FISD's enrollment reached more than 7,000 students, and the expansion led to three more campuses, Willow Bend Elementary and Terra Vista Middle School which opened in 2006, and Oak Ridge Elementary which opened in 2009.
The community settled in as a small town community with small growth through the 1950s and into the 1960s. Paving of the city streets started in 1962, new businesses were popping up locally, and the school district numbers saw small growth as well.
Page 31

Frenship Independent School District
District Facts Legal Autonomy / Independence The Frenship Independent School District is an independent public educational agency operating under applicable laws and regulations of the State of Texas. The Frenship ISD Board of Trustees (“Board”) is the level of government which has oversight responsibility and control over all activities related to public school education within the District. The District receives funding from local, state, and federal government sources and must comply with all the requirements of these funding source entities. However, the District is not included in any other governmental “reporting entity” as defined in generally accepted accounting principles. The seven member Board serves a three-year term in office without compensation. On a rotating basis, two or three places are filled during annual elections held on the regular election day in May. Vacancies may be filled by appointment until the next election. Candidates must be qualified voters of the District. Regular Board meetings are scheduled the third Monday of each month and are held at the Frenship ISD Administration Building located at 501 7th Street, Wolfforth, Texas. Special meetings and work sessions are scheduled as needed and announced in compliance with public notice requirements. The Board has final control over local school matters limited only by the state legislature, by the courts, and by the will of the people as expressed in School Board elections. Board decisions are based on a majority vote of those present. In general, the Board adopts policies, sets direction for curriculum, employs the Superintendent, and oversees the operations of the District and its schools. Besides general Board business, Trustees are charged with numerous statutory regulations including calling trustee and other school elections and canvassing the results, organizing the Board and electing its officers. The Board is also responsible for setting the tax rate, setting salary schedules, acting as a board of appeals in personnel and student matters, confirming recommendations for textbook adoptions, and for adopting and amending the annual budget. Frenship Independent School District encompasses Lubbock and Hockley counties in the South Plains area of Texas. The District is a suburban area located approximately nine miles southwest of downtown Lubbock, Texas. The District contains an area of approximately 127 square miles with the majority lying within Lubbock County. This geographic area includes the cities of Wolfforth and Lubbock, along with unincorporated rural areas and has approximately 48,000 residents living in the District. The area is a mix of residential, commercial, and agricultural use properties. In the past few years, the District has transitioned from a rural/agricultural area to a more suburban area while experiencing consistent growth.
Page 32

Significant Facts about Frenship Independent School District The District provides educational services to all children within its designated boundaries. These services include pre-kindergarten through 12th grade. For 2012-2013, the District is composed of the following campuses:
Campuses Capacity Elementary Schools 6 4,600 Middle Schools 3 2,700 Alternative Center 1 120 High School 1 2,500 Total 11 9,920
Table 13
Total Enrollment by Campus and Grade
North WillowTotals Ridge Crestview Westwind Bend Bennett Oak Ridge
SPED 38 0 0 0 0 38 0E Chd 29 0 1 0 0 21 7Pre K 168 35 0 44 52 37 0KG 704 153 104 123 100 117 1071st 629 122 88 100 104 122 932nd 634 132 81 114 89 119 993rd 630 118 99 110 96 104 1034th 624 142 86 100 78 114 1045th 608 125 91 95 98 111 88
TOTAL 4,064 827 550 686 617 783 601
Frenship Terra ReeseTotals Middle Vista Heritage Alternative
6th 676 214 201 259 27th 600 173 187 237 38th 594 174 179 237 4
TOTAL 1,870 561 567 733 9
Frenship ReeseTotals High Alternative
9th 590 580 1010th 529 512 1711th 479 457 2212th 464 434 30TOTAL 2,062 1,983 79
SECONDARYTOTAL 3,932
DISTRICTTOTAL 7,996
ELEMENTARY
SECONDARY
Page 33

Table 14 Frenship Independent School District
Student Ethnicity Percentages
2006-07 2007-08 2008-09 2009-10 2010-11
Anglo 61% 61% 60% 59% 55%
Hispanic 31% 31% 31% 32% 36%
African American 5% 5% 6% 6% 4%
Other 3% 3% 3% 3% 5% Under the state accountability rating system instituted by the Texas Education Agency, school districts and school campuses are rated as either Exemplary, Recognized, Acceptable, or Unacceptable. For 2010-2011, the District was rated as “Recognized” while the District’s campuses received the following ratings: Elementary Schools Secondary Schools Bennett Exemplary Frenship Middle Recognized Crestview Exemplary Terra Vista Middle Recognized North Ridge Exemplary Reese Alternative Center N/A Oak Ridge Exemplary Frenship High School Acceptable Westwind Recognized Willow Bend Recognized
Page 34

Frenship Independent School District
Source: www.lubbockmap.com
School Districts in Lubbock County
Page 35

Frenship ISD Elementary Map
Page 36

Frenship ISD Middle School Map
Page 37

101 Donald Preston Dr. 6020 81st street 6302 11th PlaceWolfforth, Texas 79382 Lubbock, Texas 79382 Lubbock, Texas 79416
Michelle Elliott, Principal Stacy Davis, Principal Cheryl Booher, Principal806-866-4443 806-794-3661 806-793-6686
6514 68th Street 6401 43rd Street 8816 13th StreetLubbock, Texas 79407 Lubbock, Texas 79407 Lubbock, Texas 79416
Doug Smith, Principal Todd Newberry, Principal Kathy Dawson, Principal806-794-5200 806-799-3731 806-796-0090
Frenship Middle School Terra Vista Middle School Heritage Middle School500 Main Street 1111 Upland Avenue 6110 73rd StreetWolfforth, Texas 79382 Lubbock, Texas 79416 Lubbock, Texas 79424
Jerry Jerabek, Principal Brent Lowrey, Principal Greg Hernandez, Principal806-866-4464 806-796-0076 806-794-9400
9421 West 4th Street 902 North Dowden RoadLubbock, Texas 79416 Wolfforth, Texas 79382
Farley Reeves, Principal Kim Spicer, Principal806-885-4910 806-866-4440
Frenship Independent School DistrictCampus Listing
Secondary Schools
Elementary Schools
Reese Center Frenship High School
Bennett Elementary Crestview Elementary Northridge Elementary
Oak Ridge Elementary Westwind Elementary Willow Bend Elementary
Page 38

BOARD APPROVED - 2-20-12
S M T W T F S S M T W T F S
1 2 3 4 1 2 3 4 5
5 6 7 8 9 10 11 August 21 Middle School - Meet the Teachers 6 7 [8 9 10 11 12
12 13 14 15 16 17 18 August 23 Elementary School - Meet the Teachers 13 14 15 16 17 18 19
19 20 21 22 23 24 25 August 27 1st Day of School 20 21 22 23 24 25 26
26 [27 28 29 30 31 September 10 FHS Open House 27 28 29 30 31
October 5 End of 1st Six Weeks
October 9 Elementary Parent Conferences
November 9 End of 2nd Six Weeks
S M T W T F S November 20 District Early Dismissal S M T W T F S
1 December 21 District Early Dismissal 1 2
2 3 4 5 6 7 8 December 21 End of 3rd Six Weeks 3 4 5 6 7 8 9
9 10 11 12 13 14 15 February 15 End of 4th Six Weeks 10 11 12 13 14 15 16
16 17 18 19 20 21 22 April 12 End of 5th Six Weeks 17 18 19 20 21 22 23
23 24 25 26 27 28 29 May 6-17 End of Course Exam Window 24 25 26 27 28
30 May 24 High School Graduation
May 29-30 District Early Dismissal
May 30 End of 6th Six Weeks
S M T W T F S S M T W T F S
1 2 3 4 5 6 1 2
7 8 9 10 11 12 13 September 3 Labor Day 3 4S 5 6 7 8 9
14 15 16 17 18 19 20 November 21-23 Thanksgiving Break 10 11 12 13 14 15 16
21 22 23 24 25 26 27 December 24 - January 4 Winter Break 17 18 19 20 21 22 23
28 29 30 31 March 11-15 Spring Break 24 25 26 27 28 29 30
March 29 Weather Day 31
May 27 Memorial Day
May 31 Weather Day
S M T W T F S S M T W T F S
1 2 3 1S 2S 3S 4S 5 6
4 5 6 7 8 9 10 7 8 9 10 11 12 13
11 12 13 14 15 16 17 14 15 16 17 18 19 20
18 19 20 21 22 23 24 21 22S 23S 24S 25S 26 27
25 26 27 28 29 30 August 8-9 First Year Teacher Orientation 28 29 30
August 10 PDAS Orientation
August 13 New Teacher Orientation
August 14-17, 20-24 Staff Development
S M T W T F S November 12 Staff Development/Early Release S M T W T F S
1 1 2 3 4
2 3 4 5 6 7 8 5 6E 7E 8E 9E 10E 11
9 10 11 12 13 14 15 Elementary School 8:00 a.m. - 3:15 p.m. 12 13E 14E 15E 16E 17E 18
16 17 18 19 20 21] 22 Middle School 7:50 a.m. - 3:10 p.m. 19 20 21 22 23 24G 25
23 24 25 26 27 28 29 High School 8:26 a.m. - 3:30 p.m. 26 27 28 29 30] 31
30 31 Reese 8:00 a.m. - 3:30 p.m.
LEGEND: S M T W T F S
1st Year Teacher Orientation New Teacher Orientation Holidays 1
Staff Development/Early Release Staff Development/Student Holiday Weather Day-Holiday 2 3 4 5 6 7 8
Early Release - Elementary Early Release - High School Early Release - District Wide 9 10 11 12 13 14 15
S STAAR Testing Dates [ Beginning of Semester ] End of Semester 16 17 18 19 20 21 22
E End of Course Exams G High School Graduation 23/30 24 25 26 27 28 29
September 2012 February 2013
August 2012 January 2013
October 8, January 7, January 21, February 18
STUDENT HOLIDAYS
OTHER STAFF DEVELOPMENT DAYS
STAFF DEVELOPMENT/STUDENT HOLIDAYS
IMPORTANT DATES
June 2013
October 2012 March 2013
November 2012 April 2013
December 2012 May 2013
SCHOOL HOURS
Page 39

Frenship Independent School DistrictBoard of Trustees & Superintendent
Brad Draper David Miller Scott Stockton Kelley Grimes
"Team of Eight"
Kyle Rogers Jolyn WilkinsTroy Vanderburg Dr. David Vroonland
PresidentTerm expires 2013
Vice President SecretaryTerm expires 2015 Term expires 2014 Term expires 2015
Roofing Engineer Construction Executive Agriculture Director Marketing Executive
Term expires 2014 Term expires 2015Term expires 2013Account Manager AttorneyBanking Executive Superintendent
Page 40
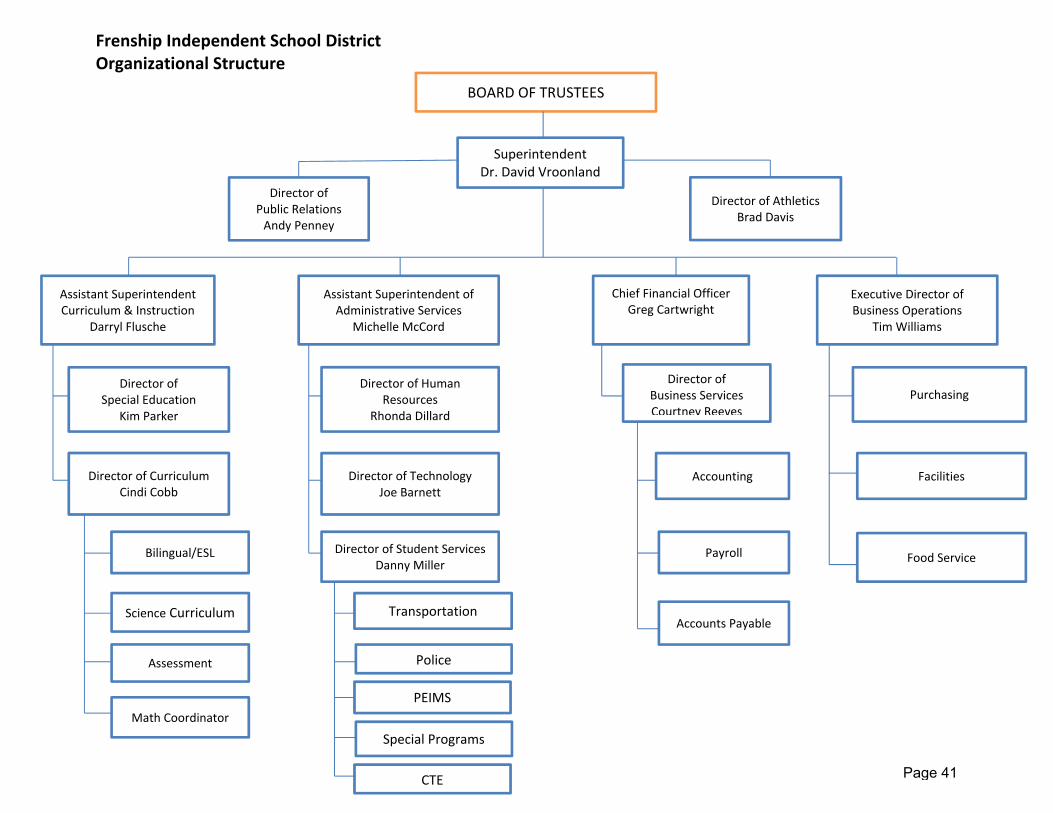
Frenship Independent School District Organizational Structure
BOARD OF TRUSTEES
Superintendent Dr. David Vroonland
Director of Public Relations Andy Penney
Director of Athletics Brad Davis
Assistant Superintendent Curriculum & Instruction
Darryl Flusche
Assistant Superintendent of Administrative Services
Michelle McCord
Chief Financial Officer Greg Cartwright
Executive Director of Business Operations
Tim Williams
Director of Special Education
Kim Parker
Director of Curriculum Cindi Cobb
Bilingual/ESL
Science Curriculum
Assessment
Math Coordinator
Director of Human Resources
Rhonda Dillard
Director of Technology Joe Barnett
Director of Student Services Danny Miller
Transportation
Police
PEIMS
Special Programs
CTE
Director ofBusiness Services Courtney Reeves
Accounting
Payroll
Accounts Payable
Purchasing
Facilities
Food Service
Page 41

Financiathrough constitutAgency’accountgenerallAccount(FASB) A summ Generalsystem presentsoperatiorelated requirempreparedschedulelegal com Fund AcAll fundsbalance set of aliabilitiesfor the accorda Accoungeneral and longexcluded Central are on aand fiduoffice.
al and budgthe Financ
te minimums intent ining and rey acceptedting Standafor account
mary of the s
lly Acceptis kept in
s fairly andons in such
legal and ments and gd in confores and/or nmpliance re
ccounting s of Frenshsheet. A fu
ccounts recs and residpurpose once with sp
nt Groups capital assg-term debd from the a
Accountinan organizauciary fund
FrenFinan
geting princcial Accou
m budgetinn prescribineporting syd accountinards Boardting treatme
state mand
ed Accounn accordand with full dh a manner
contractugenerally acrmity with narrative exesponsibilit
- The accohip ISD areund is defincording casual equities
of carrying pecial regul
- The accets and ge
bt of fiduciaaccount gro
ng - Accounation-wide bd types are
nship Indepcial Policie
iples and pntability Reg, account
ng these rystem of ing principl (GASB) aents not sp
ated princip
nting Princnce with gdisclosure tr to determal provisioccepted acgenerally axplanationsies and acc
ounting sys accountedned as a fissh and oths or balanc
on specifations, rest
counting syneral long-t
ary funds aoups as det
nting for funbasis coverie the acco
pendent Sces / Basis
policies adoesource Guting, auditinules is to independenes (GAAP
and the Finecified in G
ples and po
ciples (GAgenerally athe funds a
mine and deons. Whencounting praccepted as are attachcountabilitie
stem is orgad for and inscal and acer financia
ces, and chfic activitiestrictions, or
ystem provterm debt o
are accounttailed in the
nds of the Fing all fundsunting resp
chool Distrof Accoun
opted by theuide (FASRng, and rep
cause thent school ) establish
nancial AccGASB prono
olicies that
AAP) – Theaccepted aand activitieemonstratenever conflrinciples, thaccounting hed as neces.
anized and ncluded on ccounting el resourcesanges thers or attain
r limitations
ides accouof governmeted for throe Account C
Frenship Ins and accoponsibility
rict nting
e Texas EdRG) are ofporting reqe budgetingdistricts to
hed by thecounting Stouncement
Frenship IS
e Frenship accounting es and res complianclicts exist he financial
principles, cessary to s
operated othe end-of-
entity with as, together rein, which ning certain.
unt groups ental fundsough thoseCode sectio
ndependentount groups
of the Dis
ucation Agfficial rules uirements. g and finao conform e Governmtandards Bs.
SD follows a
ISD accouprinciples
ults of finace with fina
between statementsand addit
satisfy or re
on a fund b-year comba self-balanwith all reare segregn objective
to accouns. Capital ase funds andon.
t School Dis. Governmstrict’s busi
ency and The
ancial with
ental Board
are:
nting and
ancial ance-legal s are tional eport
basis. bined ncing lated
gated es in
nt for ssets d are
strict ental ness
Page 42

Capital assets ainclude infrastru
Deprecithey areDepreciaactivities Budgetaapplied revenuerevenuebudgetinpurpose BudgetaFrenshipexpenditreportedFund an To contraccountevidence Approprevaluateencumb
Assets - are recorde
land, builucture, work
• Are n• Have
more• Can
label,Group
iation - Dee either ineation of caps; and the s
ary Basis in budget
es in PEIMSes that areng, recordines.
ary Controp ISD, astures autho
d in the finand Student
rol budgeteing. Encume showing b
riations laped. An adjurances in th
F
Capital assed at their dings, imp
ks of art and
not consume a useful l. be controll and be reps of like ite
preciation oxhaustible pital assetsstatement o
of Accounting, recorS informatioe collectiblng, and rep
ol/Encumbs adopted,orized in thancial stateNutrition Fu
ed fund commbrances abinding com
pse at yeaustment is mhe current y
Financial P
sets are acestimated
provementsd historical
ed as a resife of at le
lable, identasonably aems may b
of capital aor are infra
s should beof changes
nting - Therding and on. Under e beyond
porting thro
rance Acc, is recordhe budget ments. By und must be
mmitments,are documemmitments
ar end. At made to theyear and fin
Policies - C
ccounted fofair value
s other thtreasures,
sult of use. ast one ye
tified by a accounted fe included
assets is ovastructure ae reported iin fiduciary
e budgetaryreporting
the budget60 days
ugh PEIMS
counting -ded in thare contro
State law, e included
, the accouented by cfor goods o
that time e fund balanancial repo
Continued
or at historat the time
han buildinfurniture an
ear and a p
permanenfor through in the inven
ver their estassets usinin the gove
y net assets
y basis of foundation
tary basis, are to be
S and for ta
The officiahe generalolled in theonly the Gein the offici
unting systecontracts, por services.
each outsance for theorts.
rical cost. De received.ngs, vehiclend equipme
per unit co
nt or assiga fiscal inv
ntory syste
timated useng the modernment-wids.
accountingn school pearned an
e treated cax rollback
al school Di ledger.
e accountineneral Funial budget.
em employpurchase o.
standing ee value of
Donated ca Capital ases, machinent that:
ost of $5,00
ned numbeventory sysm.
eful lives undified approde stateme
g is consistprogram (F
nd material consistentlyrate calcul
istrict budgRevenues ng records d, Debt Se
s encumbrorders, or o
encumbrancthe outstan
apital ssets nery,
00 or
er or stem.
nless oach. ent of
tently FSP) FSP
y for ation
get of and and
rvice
ance other
ce is nding
Page 43

UniformmandatoAgency double uniforml AccounrecognitApplicataccount Monies openingrevenue Expendione accaccount Fund Eassets (designat Types o The follFrenship
• G
(1
m Classificory accounFinancial Aentry systey used thro
nting Alterntion of retion of alting period t
collected in budget en
es in the acc
itures/expecounting peed for as ex
quity and other creditted fund ba
of Funds
owing typep Independ
Government
1) The Genrequired revenue operatingoperation
F
cations ant classificaAccountingem and d
oughout the
natives - Tlatively miternatives to accounti
n advance ntries are rcounting pe
nses for inriod are noxpenditures
Other Cret); contribut
alance; and
es of fundent School
tal Funds
neral Fundto be acc
include locg revenue. n of the sch
Financial P
nd Terminotions and t Resource istribution
e budgeting
The accouninor amouin accoun
ng period.
and the prrecorded aeriod to whi
nsurance aot allocated s/expenses
edits - Funted capital; unreserve
ds are useDistrict:
d - to accocounted focal property
Expendithools and th
Policies - C
ology – FterminologyGuide. Geof related , accountin
nting systeunts of centing meth
roperty tax as deferredch they app
and similar between o
s of the peri
d equity is net assetsd, undesign
ed by state
ount for ar in anoth
y taxes, intetures includhe District.
Continued
Frenship ISy prescribeeneral ledg
payroll exng and finan
em allows fertain revehods is c
levy record revenues.ply.
services eor among aiod of acqu
compriseds; reserved nated fund
e and loca
all financialer fund. erest on fude all cost
SD uses thed in the Teger accountxpenses wncial report
for certain enues andconsistently
ded in the s. They are
extending occounting pisition.
d of investmfund balanbalance.
al governm
l resourcesThe princind investmts necessa
he fund coexas Educts prescribi
with payrolling system
flexibility ind expendituy applied
school Dist recognize
over more periods, bu
ments in cace; unreser
ments, inclu
s except tipal source
ments, and ory for the
odes, ation ing a l are .
n the ures. from
trict's ed as
than ut are
apital rved,
uding
hose es of other daily
Page 44
(2
Bb
2) Debt Serthe paymfunds areare beingyears. T
Budgeted fuy the Board
Specsourcgoverexpen Capitthe afinancorgangenercapita
# F 211 E224 ID225 ID244 V255 E263 Ti410 In429 O461 A499 O
F
rvice Fundsment of, gee required g accumula
The primary
unds used ind of Trustee
ial Revenuces (other rnments ornditure for s
tal Projectscquisition oced by pronizations, oral obligatial projects f
und Name
SEA Title I PDEA Part B FDEA Part B Pocational EdSEA Title II,itle III, Part A
nstructional MOther State S
ctivity FundsOther Local S
Financial P
s - to accoeneral longif they are
ated for priny source of
n operationes are listed
e Funds - tthan trust r for majorspecific pur
Funds - toor construcoprietary fuor other gon bond pfund.
Part A Formula Preschool ducation Bas Part A Train
A English LaMaterials All
Special Reves Special Reve
Policies - C
ount for the-term debt
e legally mancipal and revenue for
n but not incd below:
to account for individu
r capital prrposes.
o account fction of majunds or ingovernmenproceeds s
sic Grant ning and Re
anguage Acqotment
enue Funds
enue Funds
Continued
e accumulaprincipal a
andated aninterest par this fund i
cluded in th
for the prouals, privatrojects) tha
for financiajor capital f trust fundts). Capita
should be
ecruitment quisition
ation of resand interesnd/or if finaayments mais local prop
he legally a
oceeds of ste organiza
at are lega
l resourcesfacilities (ods for indival outlays accounted
ources for,st. Debt seancial resouaturing in fuperty taxes
pproved bu
specific reveations, or olly restricte
s to be usether than tviduals, prfinanced
for throug
and rvice
urces uture .
udget
enue other ed to
ed for hose rivate from gh a
Page 45

• P
(1
(2
• F
(1
Proprietary F
1) Enterprisusers foenterpris
• Thth
• Dechcopa
• Lasebere
• Thtode
2) Internal Sto other componeInternal spredominreported
Fiduciary Fu
1) Trust andin a trusother gotherefore
F
Funds
se Funds - or goods ose funds if a
he activity ie net revenebt that isharges and omponent uayments - isaws or regervices, ince recoveredevenues. he pricing p recover it
ebt service)
Service Funfunds, dep
ent units, oservice funnant particas an ente
unds
d Agency Fstee capacovernmentae cannot be
Financial P
to report anor servicesany one of t
is financed nues from fes secured
the full faitunit - even s not payabgulations rluding capid with fees
policies of tts costs, in).
nds - to reppartments, oor to otherds should
cipant in therprise fund
Funds - to ity or as a
al units, ae used to su
Policies – C
ny activity fs. Activitiesthe followin
with debt ees and chby a pledgth and credif that gove
ble solely frrequire thatal costs (s
s and charg
he activity ncluding ca
port any acor agenciesgovernmenbe used onhe activity..
account foran agent fond/or othe
upport the g
Continued
for which a s are req
ng criteria is
that is secuharges of thge of net
dit of a relaternment is rom fees anat the actsuch as depges, rather
establish feapital costs
ctivity that ps of the prnts, on a cnly if the re Otherwise
r assets heor individuaer funds. Tgovernment
fee is charuired to b
s met.
ured solelyhe activity.
revenues ted primarynot expecte
nd charges ivity's costpreciation othan with t
ees and ch(such as
provides gorimary govecost-reimbueporting gove, the acti
eld by a goals, privateTrust and t's own pro
rged to extebe reported
y by a pledg
from fees y governmeed to makeof the activ
ts of provor debt servtaxes or si
arges desigdepreciatio
oods or servernment anursement bvernment isivity should
vernmentae organizat
agency fgrams.
ernal d as
ge of
and ent or e any vity. viding vice), milar
gned on or
vices nd its basis. s the d be
l unit tions, funds
Page 46

Number Frenshipby law establish Reporti A clear proprietaboth thefunds arof the gogovernmgovernm Valuatio Capital ancillaryfor use. acquisiti Depreci Capital inexhauassets expensefund stastateme Reporti A clear liabilitiesproprietagovernm
r of Funds
p ISD mainor contrac
hed by the
ng Capital
distinctionary and fidue governmere reported overnmenta
mental fundment-wide s
on of Capit
assets arey charges n
Donated cion plus anc
iation of C
assets are stible or arsuch as l
es are repoatement of nt of chang
ng of Long
distinction s. Long-terary funds a
ment-wide s
F
tains the nuct. Funds Texas Edu
Assets
n is made uciary fundsent-wide aonly in the
al unit are gds but arestatement o
tal Assets
e reported necessary tcapital assecillary charg
apital Asse
depreciatere infrastruland and orted in the
revenues, ges in fiduc
g-Term Lia
is made rm liabilitie
are reportedstatement o
Financial P
umber of fucomply w
cation Age
between s. Capital and fund fin
e statementgeneral cap reported
of net assets
at historicto place the
ets are recoges, if any.
ets
ed over theucture asse
land improe governme
expendituriary net ass
abilities
between fues directly d in the proof net assets
Policies - C
unds necesswith the pr
ncy.
general caassets of prnancial stat of fiduciarpital assetsin the govs.
cal cost. The asset intoorded at the
eir estimateets using thovements ent-wide stres, and csets.
und long-terelated to
prietary funs.
Continued
sary to carrroperly def
apital asseroprietary futements. Cry net asses. They arevernmental
he cost of o its intendeir estimate
ed useful livhe modifiedare not d
atement ofhanges in
erm liabilitieo and expnd stateme
ry on its funfined code
ets and caunds shouldCapital assets. All othee not reportl activities
f a capital ded locationed fair valu
ves unless d approachdepreciatedf activities; fund net a
es and gepected to nt of net as
nctions reque structures
apital assetd be reportets of fidu
er capital asted as assecolumn in
asset incln and conde at the tim
they are eh. Inexhausd. Depreci
the proprieassets; and
neral long-be paid
ssets and in
uired s as
ts of ed in ciary ssets ets in n the
udes dition me of
either stible ation etary d the
-term from n the
Page 47

Long-terreportedliabilitiesbe repornet asse Accrual The modis utilize
(1) Gabau
(2) P
futhe
(3) F
ao
(4) T
re Budgeta An annu The acc Budgetainformatlegally aboth theactual in
rm liabilitiesd in the stats of the govrted in the ets.
l Basis of G
dified accrud in measu
Governmentccrual basiecome avccounting pn-matured
Proprietary fund net asshe accountxpenses ar
Fiduciary fund the accrf defined be
Transfers aeceivable a
ary Contro
ual budget i
counting sys
ary compation for theadopted ane original anflows, outfl
F
s directly retement of fivernmentalgovernmen
Governme
ual basis of uring financ
tal fund revis. Revenu
vailable anperiod in winterest on
fund statemsets are recting periodre recogniz
nds are reprual basis oenefit pens
are recognand payable
ol and Bud
s adopted
stem provid
rison schee general funual budgend the finalows, and b
Financial P
elated to anduciary netl entity are ntal activitie
nt Accoun
f accountingial position
venues andues are recnd measurwhich the fu
general lon
ments net acognized ond in whiched in the pe
ported usinof accountinsion plans a
ized in the arise.
getary Rep
by Frenship
des the bas
edules areund and foet. The bul appropria
balances, st
Policies - C
nd expectet assets. Alnot reporte
es column i
nting
g or accruaand operat
d expenditucognized inrable. Exund liability ng-term de
assets and n the accruah they are eriod incurr
ng the econng, except fand certain
he account
porting
p ISD Board
sis for appro
presentedor each maudgetary coated budgettated on the
Continued
d to be pail other un-med in goverin the gove
al basis of ating results
ures are re the accou
xpendituresis incurredbt, which is
revenues, al basis. Re
earned ared, if meas
nomic resofor the recopost emplo
ting period
d of Truste
opriate bud
d as requajor specialomparison sts for the ree governme
id from fidumatured gernmental fuernment-wid
accounting, s.
ecognized onting perio
s are recod, if measurs recognize
expenses evenues arand becomsurable.
urces meaognition of coyment hea
d in which
es.
getary cont
uired with revenue fschedule iseporting peent's budge
uciary fundseneral long-unds but shde stateme
as appropr
on the modod in which ognized in rable, exced when due
and changre recogniz
me measur
surement fcertain liabi
althcare pla
h the inter
trol.
supplemenfund that hs prepared eriod as weetary basis.
s are -term hould ent of
riate,
dified they the
ept of e.
es in ed in able;
focus ilities ns.
rfund
ntary has a
with ell as
Page 48

The budother sostances circumstDistrict b Transfe Transferbasic fin
dget is conources equ
require thetances surrbudget doc
er, Revenue
rs are classnancial state
a) Procereven
b) GoveExpeclasschara
c) Proprare corgan
d) The slevel expen
F
nsidered toals apprope District torounding thuments.
e, Expendi
sified separements.
eeds of gennues and ex
ernmental nditures aified by fu
acter, and p
rietary fundlassified in nizations, fu
statement oof detail re
nditures, an
Financial P
be balancriations and
o adopt a buhe decision
iture, and E
rately from
neral long-txpenditures
fund reveare classifiund, functiprincipal cla
d revenues essentially
unctions, or
of activities equired in nd changes
Policies - C
ced when td other useudget that
n are repor
Expense A
revenues a
term debt is in the gov
enues are ed by funion (or pr
asses of obj
are reporty the same r activities.
presents gthe govern
s in fund ba
Continued
the sum ofes for eachis not balan
rted to the
Account Cl
and expend
issues are vernmental
classifiednd and srogram), ojects.
ted by majomanner as
governmentnmental funalance at a
f estimatedh fund. Whnced, full dBoard of T
assificatio
ditures or e
classified sfund financ
d by fundource. Ex
organization
or sources,s those of s
tal activitiesnd statememinimum b
d revenueshenever circdisclosure oTrustees an
on
expenses in
separately cial stateme
d and soupenditures
n unit, act
, and expesimilar busi
s at least ant of reven
by function.
and cum-
of the nd in
n the
from ents.
urce. are
tivity,
nses ness
at the nues,
Page 49

SIGNIFI The follodevelop Cash M The Dist Specific
• • •
• Investm The BoinvestmeamendeobligatiocertificatacceptaGovernm The maifinancialinvestmematuritieshall befinancial A quarteInvestmcomplianinvestme
ICANT FINA
owing finanment of the
anagemen
trict’s cash
ally: Ensure proEnsure adeMaximize liquidity; Minimize b
ment Policie
oard of Trent of its f
ed by the lons of the tes of dnces and pment Code.
in goal of thl returns went policy.es do not ee diversifiel institutions
erly and anent Policience audit ent policy a
F
ANCIAL PO
ncial policiee annual bu
nt
manageme
oper collateequate balainterest ea
bank charge
es
rustees hafunds as degislature U. S. Tre
deposit, republic funds.
he investmewithin curre Assets o
exceed oneed in terms to reduce
nnual inveses and sub
of managas well as a
Financial P
OLICIES A
es and procudget.
ent goals a
eralization oances to coarnings wh
es.
as adoptedefined in thin 1997). T
easury, theepurchase s investme
ent programent marketof the Diste year froms of inves
e risk of loss
stment repobmitted to ement con
a review of t
Policies - C
AND PROC
cedures of t
re safety, li
of deposits;over cash dhile, at the
d a writtenhe Public FThis policy
e State of agreemen
ent pools as
m is to ensut conditionstrict shall the time ostment insts.
ort is prepathe Board
ntrols on ithe monthly
Continued
EDURES
the District
quidity and
isbursemensame time
n investmeFunds Inve
y authorizeTexas, or
nts, comms permitted
ure its safes in accorbe investe
of purchasetruments,
ared in accod. The Disinvestmentsy reports se
t significant
d yield.
nt needs; e, maximiz
ent policy estment Acs the Distr
r certain Umercial pad by Chapt
ety, as well rdance wited in instre. The invematurity s
ordance witrict’s audis and adhent to the b
tly influence
zing safety
regardingct of 1995 rict to inve
U. S. Agenaper, baner 2256, T
as to maxih the Distruments wstment porcheduling,
ith the Distitors perforherence tooard.
e the
and
the (and
est in ncies, nkers Texas
mize trict’s hose rtfolio
and
trict’s rm a
o the
Page 50
Debt AdDebt Seprimarilyexplicit limit on t Chapterdemonsservice “new devaluation In demoaccount service. issued, a All princyear. Opermits paymen The Disand “AASchool Fratings a Fund Ba Fund baunderstadevelop as one creating The resapproprifund baportion rperiods.resource
dministratiervice is a y financed bbonded indthe incurren
r 45 of thtrate to theon a propo
ebt” of the n before bo
onstrating thState allo
Once the pa district m
cipal and inOn February
the collectts are due.
trict presenAA” with FiFund Guaraare “Aa3” b
alance Lev
alance is theands the ima balancein which a no need to
served fundiation or tha
alance is crepresents Assigned es.
Fon major area
by the saledebtednessnce of debt
he Texas e Texas Attoosed issue district, fro
onds may b
he ability to otments whprospectiveay levy an
nterest payy 1st of etion of a la
ntly carries itch, Inc. antee proviy Moody’s
vels
e excess ofmportance d budget in
anticipated o utilize the
d balance at has beencomposed
that portiofund balan
Financial P
a of cost de of generals limitation, t.
Education orney Geneof bonds, t
om a tax lebe issued.
pay debt shich effectie ability to punlimited ta
yments areeach year,arge major
the highesHowever, ded by the and “AA-“ b
f assets ovof maintain
n each fiscarevenues eDistrict’s “s
is that porn legally seof assignen of fund bnces repre
Policies - C
due to the l obligation although a
Code, aseral that it htogether wievied at a
service at a vely reduc
pay such taxax to pay de
e due Febroutstandin
rity of taxe
st rating of “these ratinState of Te
by Fitch.
ver liabilitiesning an adal year. Thequal or exsavings acc
rtion of funegregated foed and unabalance thasent tentat
Continued
District’s b bonds. Ua tax rate
s amendehas the prosith debt serrate of $0.
rate of $0.ce the distx has beenebt service
ruary 15th ng taxes bes levied b
“AAA” with ngs are baexas. The d
s in a goverdequate funhe District dxceed anticcount,” or fu
nd balanceor specific passigned pat is availabtive plans f
building pronder state test effecti
d, requiresspective abrvice on oth50 per $10
50, a districtrict’s local n shown and.
and Augusbecome debefore the
Moody’s Iased upon district’s cu
rnmental fund balancedefines a bcipated expund balanc
e that is nopurposes. Tportions. Tble for budfor future u
ogram, whiclaw, there vely impos
s a districbility to pay her outstan00 of asse
ct may takeshare of
d the bonds
st 15th of linquent, wlong term
nvestor Sethe Permarrent under
und. The Die and strivealanced bupenditures
ce.
ot availableThe unrese
The unassigdgeting in fuuse of fina
ch is is no
ses a
ct to debt
nding ssed
e into debt
s are
each which
debt
rvice anent rlying
strict es to udget
thus
e for erved gned uture
ancial
Page 51

Frenship Independent School District Account Code Structure
Section 44.007 of the Texas Education Code (Code or TEC) requires that a standard school district fiscal accounting system be adopted by each school district. The system must meet at least the minimum requirements prescribed by the State Board of Education and also be subject to review and comment by the state auditor. Additionally, the accounting system must conform to Generally Accepted Accounting Principles (GAAP). This section further requires that a report be provided at the time that the school district budget is filed, showing financial information sufficient to enable the state board of education to monitor the funding process and to determine educational system costs by school district, campus and program. The Texas Education Code, Section 44.008, requires each school district to have an annual independent audit conducted that meets the minimum requirements of the state board of education, subject to review and comment by the state auditor. The annual audit must include the performance of certain audit procedures for the purpose of reviewing the accuracy of the fiscal information provided by the district through the Public Education Information Management System (PEIMS). The audit procedures are to be adequate to detect material errors in the school district’s fiscal data to be reported through the PEIMS system for the fiscal period under audit. A major purpose of the following accounting code structure is to establish the standard school district fiscal accounting system required by law. Although certain codes within the overview may be used at local option, the sequence of the codes within the structure, and the funds and chart of accounts, are to be uniformly used by all school districts in accordance with generally accepted accounting principles. Basic System Expenditure Code Structure Fund Code It is a mandatory three digit code used for all financial transactions to identify the fund group and specific funds. Within the code, the first digit refers to the fund group and the second and third digits specify the fund. Function Code It is a mandatory two digit code which identifies the purpose of the transaction. The first digit identifies the major service area and the second digit refers to the specific function within the area.
Page 52

Object Code It is a mandatory four digit code identifying the nature and object of an account, a transaction, or a source. The first digit identifies the type of account or transaction, the second digit identifies the major area and the third and fourth digits provide further sub-classifications. Sub-Object Code It is an optional code to provide special accountability for specifics programs or areas. Organization Code It is a mandatory three digit code to identify the campus or facility. Fiscal Year Code It is a mandatory single digit code to identify the specific fiscal year of the transaction or the project year. Program Intent Code It is a mandatory two digit code to designate transactions or services to specific programs provided to students.
Page 53

Function Codes
11 Instruction This function is used for activities that deal directly with the interaction between teachers and students. Teaching may be provided for students in a school classroom, in another location such as a home or hospital, and in other learning situations. It may also be provided through some other approved medium such as television, radio, telephone, telecommunications, multimedia and correspondence. This function includes expenditures / expenses for direct classroom instruction and other activities that deliver, enhance or direct the delivery of learning situations to students. 12 Instructional Resources & Media Services This function is used for expenditures/expenses that are directly and exclusively used for resource centers, establishing and maintaining libraries and other major facilities dealing with educational resources and media. 13 Curriculum Development & Instructional Staff Development This function is used for expenditures/expenses that are directly and exclusively used to aid instructional staff in planning, developing and evaluating the process of providing learning experiences for students. Expenditures and expenses include in-service training and other staff development for instructional or instructional-related personnel (Functions 11, 12 and 13) of the school district. This function also includes expenditures and expenses related to research and development activities that investigate, experiment, and/or follow-through with the development of new or modified instructional methods, techniques, procedures, services, etc. 21 Instructional Leadership This function is used for expenditures/expenses that are directly used for managing, directing, supervising, and providing leadership for staff who provide general and specific instructional services. 23 School Leadership This function is used for expenditures/expenses that are used to direct and manage a school campus. They include the activities performed by the principal, assistant principals and other assistants while they:
• Supervise all operations of the campus. • Evaluate staff members of the campus. • Assign duties to staff members maintaining the records of the students on the
campus. • Coordinate school instructional activities with those of the entire school district.
Page 54

31 Guidance, Counseling & Evaluation Services This function is used for expenditures/expenses that are directly and exclusively used for assessing and testing students' abilities, aptitudes and interests; counseling students with respect to career and educational opportunities and helping them establish realistic goals. This function includes costs of psychological services, identification of individual characteristics, testing, educational counseling, student evaluation and occupational counseling.for State reporting purposes Indicates a code that may be used at location option 32 Social Work Services This function is used for expenditures/expenses that are directly and exclusively used for activities such as:
• Investigating and diagnosing student social needs arising out of the home, school or community.
• Casework and group work services for the child, parent or both. • Interpreting the social needs of students for other staff members. • Promoting modification of the circumstances surrounding the individual student
which are related to his or her social needs. (This includes referrals to and interaction with other governmental agencies.)
33 Health Services This function is used for expenditures/expenses that are directly and exclusively used for providing physical health services which are not direct instruction. This includes activities that provide students with appropriate medical, dental and nursing services. 34 Student (Pupil) Transportation This function is used for expenditures/expenses that are incurred for transporting students to and from school. Expenditures/expenses for regular bus routes to and from school are to be recorded using Program Intent Code 99 (Undistributed), and Organization Code 999 (Undistributed) or Organization Code 998 (Unallocated, Local Option). Expenditures/expenses for transportation specifically and exclusively for purposes of transporting students relating to enhanced program intents such as Career and Technology and Services to Students with Disabilities (Special Education), etc., are to be recorded in Function 34 with the appropriate program intent codes. 35 Food Services This function is used for food service operation expenditures/expenses, including the cost of food, labor, and other expenditures/expenses necessary for the preparation, transportation and storage of food to provide to students and staff. Expenditures/expenses are used directly and exclusively for supervision and maintenance of a food service operation.
Page 55

36 Co-curricular / Extracurricular Activities This function is used for expenditures/expenses for school-sponsored activities during or after the school day that are not essential to the delivery of services for Function 11, the Function code 20 series or other Function code 30 series. These activities are generally designed to provide students with experiences such as motivation and the enjoyment and improvement of skills in either a competitive or noncompetitive setting. These activities include student groups such as Future Farmers of America (FFA), National Honor Society, etc. Co-curricular activities are those activities that are not essential to instruction but enhance the curriculum and include University Interscholastic League competition such as one-act plays, speech, debate, band, etc. Activities are those that do not enhance the instructional program, including athletics, that normally involve competition between schools (and frequently involve offsetting gate receipts or fees such as football, baseball, volleyball, track and tennis). Also included are related activities (such as pom squad and cheerleading) that exist because of athletics. 41 General Administration This function is for expenditures that are for purposes of managing or governing the school district as an overall entity. This function covers multiple activities that are not directly and exclusively used for costs applicable to specific functions. General administration is an indirect cost applicable to other expenditure functions of a school district. Program Intent Code 99 is to be used for all expenditures for Function 41. The organization codes specified in the 700 organization code group are the only organization codes to be used with Function 41 costs and may not be used in any other function, other than specific costs in Function 53 (Data Processing) that relate to the functions of the business office. 51 Plant Maintenance & Operations This function is used for expenditures/expenses for activities to keep the physical plant and grounds open, clean, comfortable and in effective working condition and state of repair. This function is used to record expenditures/expenses for the maintenance and operation of the physical plant and grounds. This function also includes expenditures/expenses associated with warehousing and receiving services. 52 Security and Monitoring Services This function is used for expenditures/expenses that are for activities to keep student and staff surroundings safe, whether in transit to or from school, on a campus or participating in school-sponsored events at another location.
Page 56

53 Data Processing Services This function is for expenditures/expenses for data processing services, whether in-house or contracted. Examples of Function 53 costs are costs for computer facility management, computer processing, systems development, analysis and design, and those interfacing costs associated with general types of technical assistance to data users. Specific types of applications include attendance accounting, grade reporting, financial accounting and human resources/personnel. Personal Computers (PC's) that are stand alone are to be charged to the appropriate function. Peripherals including terminals and printers are to be charged to the appropriate function. Costs associated with mainframe, minicomputers and networked or stand-alone microcomputers that provide services to multiple functions are to be recorded here. For data processing expenditures associated with business office functions such as accounting and payroll, Organization Code 750 is to be used. 61 Community Services This function is used for expenditures that are for activities or purposes other than regular public education and adult basic education services. These types of expenditures are used for services or activities relating to the whole community or some segment of the community. This includes providing resources to non-public schools, institutions of higher education, and any proprietary types of services incurred for outside entities in the community. 71 Debt Service This function is used for expenditures that are for the retirement of recurring bond, capital lease principal, and other debt, related debt service fees, and for all debt interest. Note principal for short-term loans (one year or less in duration) is to be recorded in the liability account 2122, Notes Payable Current Year. 81 Facilities Acquisition & Construction This function is used by school districts for expenditures that are for acquiring, equipping, and/or making additions to real property and sites, including lease and capital lease transactions. 99 Tax Appraisal and Collection This function is used to report administrative functions not required to be reported in function 41. The fees for property appraisal are paid from this function.
Page 57

Account Code Structure Revenue Object Codes Local 5711 Taxes, Current Year Levy 5712 Taxes, Prior Years 5716 Rollback Taxes 5718 Prior Year Refunds 5711-5719 Penalties, Interest and Other Tax Revenues 5742 Interest Income 5743 Facility Rental 5744 Revenue from Foundations, Other Non-Profit Organizations, Gifts & Bequests 5748 Parking Permits 5749 Miscellaneous Revenue State 5811 Per Capita Funds 5812 Foundation School Program Act Entitlements 5819 Other Foundation School Program Act Revenues 5829 State Program Revenues Distributed by TEA 5831 TRS On Behalf Benefits 5832 TRS Supplemental Compensation 5869 Other Federal 5919 Federal Revenues Distributed Other than State or Federal Entities 5921 School Breakfast Program 5922 National School Lunch Program 5923 USDA Donated Commodities 5928 Federal Revenue Distributed by Texas Education Agency 5932 Medicaid Administrative Claiming Program (MAC) 5949 Federal Revenues Distributed Directly from the Federal Government
Page 58

Expenditure Object Codes 6100 Payroll Costs 6112 Salaries or Wages for Substitute Teachers 6118 Extra Duty – Professional 6119 Professional Salaries 6121 Extra Duty / Overtime – Support 6125 Hourly Personnel 6129 Paraprofessional Personnel 6131 Contract Buyouts 6141 Social Security / Medicare 6142 Group Health & Life Insurance 6143 Workmen's Compensation 6144 TRS On Behalf 6145 Unemployment Compensation 6146 Teacher Retirement 6148 Other Payroll Benefits 6200 Professional & Contracted Services 6211 Legal Services 6212 Audit Services 6213 Tax Appraisal & Collection 6219 Professional Services 6222 Student Tuition - Public Schools 6239 Education Service Center Services 6249 Maintenance & Repair 6255 Water 6256 Telephone 6257 Electricity 6258 Gas 6259 Utilities 6269 Rentals - Operating Leases 6299 Miscellaneous Contracted Services 6300 Supplies & Materials 6311 Fuel 6315 Janitorial Supplies 6316 Vehicle & Transportation Supplies 6319 Maintenance & Facilities Supplies 6321 Textbooks 6329 Reading Materials & Library Books 6339 Testing Materials 6396 Postage 6399 General Supplies (including software licenses)
Page 59

6400 Other Operating Costs 6411 Travel (including conference fees & registrations, rental cars) 6412 Student Travel 6419 Board Travel 6429 Insurance & Bonding Costs 6439 Election Costs 6494 Bus Transportation (field trips) 6495 Membership dues / fees 6499 Misc Expenses 6500 Debt Service 6511 Bond Principal 6512 Capital Lease Principal 6519 Debt Principal 6521 Interest on Bonds 6522 Capital Lease Interest 6523 Interest on Debt 6529 Interest Expenditures / Expenses 6599 Other Debt Service Fees 6600 Capital Equipment 6619 Land Purchase & Improvement 6629 Building Purchase, Construction or Improvements 6631 Vehicles 6639 Furniture & Equipment $5,000 and greater 6649 Equipment less than $5,000
Page 60

Frenship Independent School District Strategic Planning Process
Frenship ISD initiated a Strategic Planning process in April 2010 to provide focused, purposeful planning to direct the District’s efforts over the next 5 years and beyond. The initial step began with a meeting of the Superintendent and the School Board of Trustees along with two external facilitators of Strategic Planning. At this meeting, the Board developed and approved the District’s Beliefs statement and Vision statement. Next, a committee of 35 members consisting of community members and District staff developed action plans. These plans are concentrated within 5 main strategic objectives which are:
1. Teaching and Learning 2. Funding and Finance 3. Staff 4. Facilities 5. Communications
Within each of these main objectives, the committee established two to three strategies to achieve the main objective goal. The next step involved the appointment of action teams to create plans for each of the sub-strategies. Community members, teachers, parents, and administrators worked together to create specific action plans for each strategy and to detail to a step-by-step level and provide a budget for the plans. The specific action plans and individual action items within each of the 5 main strategic objectives are shown on the following pages.
Page 61

Frenship Independent School District
Strategic Planning Process Objectives and Strategies Teaching and Learning 1. Develop challenging, engaging, and diverse learning experiences so all students are
successful 1.1 Establish collaborative professional development processes that engage
students in an applied learning environment
1.1.1. Increase teacher’s capacity to work as a member of a high performing collaborative team.
1.1.2. Provide current professional development opportunities that emphasize applied and engaged learning.
1.2 Incorporate FISD Graduate Profile in all content planning and delivery of
instruction
1.2.1. Design experiences to build effective communicators. 1.2.2. Incorporate and refine programs to produce responsible citizens. 1.2.3. Create a culture of exploration and discovery to foster passionate learning.
Funding and Finance 2. Maximize financial resources to provide students with the necessary tools to reach
their maximum potential. 2.1 Develop a plan to find sources of revenue outside the Maintenance and
Operating (M&O) budget
2.1.1. Expand the current Frenship Leadership Foundation to include a Frenship Alumni division to assist with district funding needs.
2.1.2. Offer corporations/companies/individuals the opportunity to purchase naming rights and/or advertise their product in Frenship ISD.
Page 62

Strategic Planning Process - Continued 2.2 Develop a plan to find savings inside the Maintenance and Operating (M&O)
budget
2.2.1. Evaluate staffing practices in order to maximize efficiency without compromising academic integrity.
2.2.2. Involve principals, teachers, students, and community members in a plan to decrease energy expenditures across the district.
2.2.3. Conduct an in-depth analysis of the per student costs of all programs in order to develop guidelines for program spending.
Staff 3. Create a systematic approach to recruit and retain superior teachers/staff to elevate
student success 3.1 Develop a proactive retention plan to include a competitive compensation plan
and innovative recruitment strategies
3.1.1. Develop and implement a plan to annually determine why employees remain with or leave FISD.
3.1.2. Develop a plan to achieve and maintain a teacher turnover rate at the state average or less.
3.2 Implement a comprehensive professional development plan that addresses the
specific needs of a diverse staff
3.2.1. Evaluate and improve the district’s methods for implementing staff development
Facilities 4. Provide facilities based upon the needs of students to ensure management of
growth while elevating student success 4.1 Establish a comprehensive high school development plan based upon the needs
and demographics of our district
4.1.1. Form a long-range planning committee that will consider potential high school facility options and determine the most fiscally sound and efficient solution to meet future student educational and capacity needs.
Page 63

Strategic Planning Process - Continued
4.1.2. Research and evaluate high school facility options to meet future growth needs, including all benefits and difficulties confronting the development of those options.
4.2 Define the district’s role in community access to facilities
4.2.1. Develop an online marketing and reservation platform for usage of
facilities. 4.2.2. Evaluate the availability of district land for additional practice facilities to
accommodate Frenship Youth Leagues. 4.3 Establish a comprehensive district-wide plan to ensure facility equity
4.3.1. Establish and utilize a “Book of Standards” for facilities. 4.3.2. Implement a process to coordinate flow of grants, donations, and PTA
contributions to the district. Communications 5. Effective communication practices will be implemented which will result in increased
stakeholder involvement and support of the FISD vision and mission 5.1 Develop a plan at the district and campus levels to define and standardize
internal communication methods
5.1.1. Collect and disseminate information via various platforms from one standardized source.
5.1.2. Educate incoming and current staff of Frenship’s achievements, history, traditions, and unique programs to raise informed FISD ambassadors, strengthen district ownership and enhance employee morale.
5.2 Identify and establish effective, targeted external communication approaches
that will increase involvement and support among all stakeholder groups, including those groups who are traditionally under-represented
5.2.1. Use multiple and appropriate methods of communication to reach all
stakeholders. 5.2.2. Develop communication procedures to ensure appropriate parties are
informed in an accurate and timely manner.
Page 64

Frenship Independent School District Strategic Planning Calendar
Year 1 (2011-2012) 1.1.1 Increase teacher’s capacity to work as a member of a high performing
collaborative team. 1.1.2 Provide current professional development opportunities that emphasize applied
and engaged learning. 1.2.1 Design experiences to build effective communicators. 1.2.2 Incorporate and refine programs to produce responsible citizens. 1.2.3 Create a culture of exploration and discovery to foster passionate learning. 2.2.1 Evaluate staffing practices in order to maximize efficiency without compromising
academic integrity. 2.2.3 Conduct an in-depth analysis of the per student costs of all programs in order to
develop guidelines for program spending. 3.1.1 Develop and implement a plan to annually determine why employees remain with
or leave FISD. 4.1.1 Form a long-range planning committee that will consider potential high school
facility options and determine the most fiscally sound and efficient solution to meet future student educational and capacity needs.
4.1.2 Research and evaluate high school facility options to meet future growth needs,
including all benefits and difficulties confronting the development of those options.
4.2.1 Develop an online marketing and reservation platform for usage of facilities. 4.2.2 Evaluate the availability of district land for additional practice facilities to
accommodate Frenship Youth Leagues. 4.3.1 Establish and utilize a “Book of Standards” for facilities.
Page 65

Strategic Planning Calendar - Continued Year 2 (2012-2013) 2.1.1 Expand the current Frenship Foundation to include a Frenship Alumni division to
assist with district funding needs. 2.1.2 Offer corporations/companies/individuals the opportunity to purchase naming
rights and/or advertise the product in Frenship.
2.2.2 Involve principals, teachers, students, and community members in a plan to decrease energy expenditures across the district.
3.1.2 Develop a plan to achieve and maintain a teacher turnover rate at the state
average or less. 5.1.1 Collect and disseminate information via various platforms from one standardized
source. 5.1.2 Educate incoming and current staff of Frenship’s achievements, history,
traditions, and unique programs to raise informed FISD ambassadors, strengthen district ownership, and enhance employee morale.
Year 3 (2013-2014) 3.2.1 Evaluate and improve the district’s methods for implementing staff development. 4.3.2 Implement a process to coordinate flow of grants, donations, and PTA
contributions to the district. 5.2.1 Use multiple and appropriate methods of communication to reach all
stakeholders. 5.2.2 Develop communication procedures to ensure appropriate parties are informed in
an accurate and timely manner.
Page 66
The Starequirem Legal RSectionsfor budglegal req
• Tththp
• T
E • T
Tdm
• N
aa
• T
Amd
• T
TEA hafollows:
• Tn
ate, the Texments for sc
Requiremens 44.002 thget developquirement f
The Superinhe budget the board orocess and
The district Education, c
The PresideTrustees, gi
istrict budgmeeting.
No funds mdopted buddopt supple
The budget Accounting modified ac
istrict’s aud
The budget
s develope
The budget o later than
Frensh
xas Educatchool distric
nts hrough 44.0pment in Tfrom the cod
ntendent is to be prepa
of trustees d define rela
budget mcurrently Au
ent of the Boving ten da
get. Any tax
may be expdget. The ementary e
must be pPrinciples)
ccrual basisdited financ
must be leg
ed addition
must be adn August 31
hip IndepBudg
tion Agencyct budgets.
006 of the Texas schoode.
the budgeared. TEA and the suated roles a
must be preugust 20.
oard of Truays public xpayer in th
pended in aBoard doe
emergency
prepared in) and stats, which is
cial stateme
gally adopte
al requirem
dopted by t1.
endent Sget Polic
y (TEA), an
Texas Educol districts.
t officer forrecommen
uperintendeand respons
epared by
stees mustnotice in a
he district m
any mannees have thbudgets to
n accordante guidelines the sam
ents.
ed before t
ments for s
the board o
School Dicies
nd each lo
cation CodeThe follow
r the Districnds an inteent be takesibilities.
a date se
t call a puba newspapemay be pre
er other thahe authority
cover unfo
nce with GAes. The be basis of
he adoption
school distr
of trustees,
strict
cal district
e establishwing items
ct and preperactive appen to estab
et by the S
lic meetinger, for the sent and p
an as provy to amendoreseen exp
AAP (Genebudget is pf accountin
n of the tax
rict budget
inclusive o
formulate
the legal bsummarize
pares or caproach betwblish the bu
State Boar
of the Boaadoption oarticipate in
vided for ind the budgpenditures.
erally Acceprepared ong used in
x rate.
preparatio
of amendm
legal
basis e the
uses ween udget
rd of
ard of of the n the
n the et or
epted on a n the
on as
ents,
Page 67

• M
a
• Bmaleb
• T
Esymrea
• Tarefi
LOCAL ANNUACE (LEG Authori The Distin aid of County v The Distagent, sand perfany claimlaw. TexS.W.2d
Minutes fromny amendm
Budgets for must be incnd approve
egal level oefore excee
The officiallEducation Inystem guid
must be repeported by mount.
The annual mounts onequirementles its Annu
DISTRICTAL OPERATGAL)
zed Expen
trict shall nf any individv. Perry, 53
trict shall nservant, or cformed in wm against tx. Const. A983 (Comm
Bu
m district bments to the
the Generaluded in theed at least of control meding a fun
y adopted nformation delines. Rorted by fufund, func
financial an the scht for filing thual Financia
REQUIRETING BUDG
nditures
ot lend its cdual, assoc37 S.W.2d 8
ot grant ancontractor a
whole or in he District rt. III, Sec.
m. App. 193
udget Pol
oard meetie budget.
al Fund, Stue official diat the fund
mandates. Anctional exp
budget mManageme
Revenues, ond, object, tion, object
and compliahedule comhe amendeal and Com
EMENTS GET
credit or griation, or co89 (Tex. Ci
y extra comafter servicpart. Nor sunder any a53; Harling
32)
icies - Co
ings will be
udent Nutristrict budged and functA school dispenditure ca
ust be fileent System)other sourcfiscal yeart, organizat
ance reportmparing bued budget wmpliance rep
ratuitously gorporation. iv. App.—H
mpensationce has beenhall the Disagreement gen Indep.
ontinued
e used by T
tion Fund aet. These btion levels strict must ategory in t
d with TEA) by the datces, other , and amoution, fiscal
t should reudget andwith TEA is port.
grant publicTex. Const
Houston [1st
, fee, or alln rendered strict pay oror contractSch. Dist.
TEA to rec
and the Debbudgets muto comply amend thehe total dis
A through te prescribeuses, and
unt. Expenyear, prog
flect the am actual asatisfied w
c money ort. Art. III, Set Dist.] 197
owance to or a contrar authorize t made withv. C.H. Pag
cord adoptio
bt Service Fust be prepwith the st
e official bustrict budget
PEIMS (Ped in the an
fund baladitures musram intent,
mended buamounts. when the di
r things of vec. 52; Braz
76, no writ)
a public offact enteredthe payme
hout authorge and Bro
on of
Fund pared tate’s udget t.
Public nnual nces st be , and
udget The
strict
value zoria
fficer, d into ent of rity of o., 48
Page 68
The statfor salartime to pyear becpaid out Local fudesignatpurchasschool sacquisitiultimate of the pu No publthe budg Use of DExcept anot enteresourcerenovatiEducatio The Boelectione11.169 CommitA contrcommitmor both o
1. Re
2. Isfu
te and counries of profpay such sacome availat of funds ot
unds from Dted for a sing appliansites; for bion of schooption to p
ublic schoo
ic funds of get adopted
District Reas provideder into an es for the on of impon Code 11
ard may neer for or
tment of Cract for thement of theof the follow
Retains to xpiration ofs conditioneunds for pa
Bu
nty availablfessional cealaries, wheable. Loansther than th
District taxespecific purnces and subuying, buool buildingpurchase [sls to be det
the Districtd by the Bo
sources d by Educaagreementprovision
rovements 1.168
not use staagainst any
urrent Reve acquisitio District’s c
wing provis
the Boardf each budged on a beyment of th
udget Pol
le funds disertified stafen salaries s for payinghose for the
es, tuition rpose may upplies; for ilding, repa
gs and sitesee CHG]; atermined by
t may be spoard. Educa
ation Code t authorizin
of materiato real p
ate or locay candidate
venue on, includicurrent reveions:
d the contiget period dest efforts ahe contract.
icies - Co
sbursed to ff and for inbecome du
g professione current ye
fees, otherbe used fothe payme
airing, and s by leasinand for othey the Board
pent in any ation Code 4
45.109(a-1)ng the useals or laboroperty no
al funds ore, measure
ng lease, enue only,
inuing righduring the tattempt by Local Gov
ontinued
the Districtnterest on ue before snal certified
ear. Educa
r local souor salaries
ent of insura renting sc
ng through er purposesd. Education
manner oth44.006(a)
) and (a-2) of Districtor for the t owned o
r other rese, or politic
of real oprovided th
ht to termierm of the the Board v’t Code 27
t shall be umoney bor
school fundsd staff salation code 4
rces, and of any per
ance premichool buildannual pay
s necessaryn Code 45.
her than as
) [see CX], t employee
design, cor leased
sources of cal party. E
r personalhe contract
nate the ccontract. to obtain a
71.903
used exclusrrowed on ss for the curies may no
45.105(b).
state fundsrsonnel anums; for bu
dings, incluyments wity in the con105(c)
s provided f
the Board es, propertyconstructionby the Dis
the DistriEducation C
property t contains e
contract at
and approp
sively short
urrent ot be
s not d for uying uding th an nduct
for in
shall y, or n, or strict.
ct to Code
is a either
t the
priate
Page 69

Fiscal YThe Boaeach ye Budget The Supall estimyear. Ed DeadlinThe proEducatiodate). E The adodate esCode 44 Public MAfter themeetingtaxpaye44.004(a The meeCode 55 PublishThe BoaproposeDistrict. PresidencirculatioThe notbefore th
Year ard may dear. Educati
Preparatioperintenden
mated revenducation Co
nes posed budon, current
Education C
opted budgtablished i
4.005; 19 TA
Meeting e proposed for the pr of the Disa), (f)
eting must 51.041, 551
hed Notice ard Presid
ed tax rate If no daily
nt shall proon in the cice shall behe date of t
Bu
termine if tion Code 44
on nt shall prepnue and proode 44.002
get shall bly August 2ode 44.002
et must ben the Fina
TAC 109.1(a
d budget haurpose of
strict may b
comply wit1.043
ent shall ameeting in y, weekly, ovide for pucounty in we publishedthe hearing
udget Pol
he District’s4.0011
pare, or cauoposed exp
e prepared20 (June 12(a); 19 TAC
e filed with ancial Accoa)
as been preadopting a
be present
h the notice
also provida daily, weor biweek
ublication owhich the Dd not earlie.
icies - Co
s fiscal yea
use to be ppenditures
d on or befo9 if the DiC 109.1(a),
the Texas ountability S
epared, thea budget fand particip
e requireme
e for publieekly, or bly newspapof notice in
District’s ceer than the
ontinued
ar begins on
repared, a of the Dist
ore a date istrict uses, 109.41
EducationSystem Re
e Board Prfor the sucpate in the
ents of the
ication of i-weekly neper is pub
n at least ontral admin30th day o
n July 1 or
proposed btrict for the
set by the a July 1 f
n Agency oesource Gu
resident shcceeding fimeeting. E
Open Mee
notice of tewspaper pblished in tone newspanistrative oor later tha
September
budget cove following f
State Boafiscal year
on or beforeuide. Educ
all call a Biscal year. Education C
etings Act. G
the budget published inthe Districtaper of genffice is locan the tenth
r 1 of
ering fiscal
ard of start
e the ation
Board Any
Code
Gov’t
and n the , the neral ated.
h day
Page 70

Form ofThe pubpropose The notprescrib If the DPUBLIScomply entitled enjoin tsubstant PublicaConcurrthe Distrsite or, office. The budand info
123456
Educatio Budget The Boaat the myear in w(g)
f Notice blished noted tax rate m
ice is not ved by the c
District haHED NOTIwas not into an injun
the collectitially all of i
tion of Notrently with trict shall poif the Distr
dget summarmation rel. Instruction. Instruction. Central ad. District op. Debt serv. Any other
on Code 44
Adoption ard shall ad
meeting callewhich the f
Bu
ice of the must meet t
valid if it docomptroller.
s not comICE or the n good faithnction restraion of taxeits tax bills.
tice the publicatost a summrict has no
ary must inating to pern; nal supportdministratioperations; vice; and r category d
4.0041
dopt a budged for that fiscal year c
udget Pol
public meethe size, fo
oes not sub.
mplied withFORM OF
h, a personaining the ces must bEducation
tion of noticmary of the
Internet W
clude a comr student an
t; on;
designated
get to covepurpose ancovered by
icies - Co
eting to disrmat, and c
bstantially c
h the pubF NOTICE dn who owncollection obe filed be
Code 44.0
ce of the buproposed b
Web site, in
mparison tond aggrega
by the Com
r all expendnd before thy the budge
ontinued
scuss and acontent req
conform to
blished notdescribed ans taxable of taxes by efore the d004(b)–(e)
udget undebudget on n the Distri
o the previoate spendin
mmissioner
ditures for he adoptionet begins. E
adopt the buirements d
o the langua
tice requirabove, , anproperty inthe Distric
date the D
er Educatiothe Districtict’s centra
ous year’s ag on:
r.
the succeen of the taxEducation C
budget anddictated by
age and fo
ements innd the failun the Distrct. An actioDistrict del
n Code 44t’s Internet al administr
actual spen
eding fiscal x rate for theCode 44.00
d the y law.
ormat
the re to ict is on to ivers
.004, Web
rative
nding
year e tax
04(f)–
Page 71

PublicaOn finalInternet must pro The Disannivers Educatio Budget The Bosupplem Copies accorda Educatio ANNUACE (LOC Fiscal YThe Dist Budget Budget effectiveimplemeprogramas inputBudget month’s
tion of Adol approval Web site a
ominently d
trict shall msary of the d
on Code 39
Amendmeard shall h
mentary eme
of any amnce with St
on Code 44
AL OPERATCAL)
Year trict shall op
Planning planning sh
ely reflects ent them. I
m goals, andt from the Dplanning aactivities.
Bu
opted Budof the buda copy of t
display the e
maintain thedate the bu
9.084
ents have the aergency bu
mendment otate Board
4.006
TING BUDG
perate on a
hall be an ithe Districn the budg
d alternativeDistrict- andnd evaluat
udget Pol
dget get by the the budget electronic li
e adopted udget was a
authority toudget to cov
or supplemrules.
GET
a fiscal year
ntegral parct’s programget plannines for achied campus-lion are con
icies - Co
Board, theadopted b
ink to the a
budget on adopted.
o amend thver necessa
mentary bud
r beginning
rt of overall ms and actng processeving progrevel plannintinuous pr
ontinued
e District sby the Boaradopted bud
the Distric
he approveary unfores
dget must
g Septembe
program pivities and , general e
ram goals sing and derocesses a
shall post ord. The Disdget.
t’s Web sit
ed budget seen expen
be prepar
er 1 and end
planning soprovides t
educationashall be concision-maknd shall be
on the Diststrict’s Web
te until the
or to adoses.
red and file
ding Augus
o that the buhe resourcl goals, spnsidered, asking commite a part of
trict’s b site
third
opt a
ed in
st 31.
udget ces to pecific s well ttees. each
Page 72

Budget The annconduct
1
2
3
4
AuthoriThe adoin accorproceduor desigbudget. Budget The Boafunctionresource Objectiv
The objFinancia
Performadministstated ebudgetin(GASB) Stateme
Meeting nual public med as follow
. The Boapersons won the she
. Prior to thspeakers.
. Speakersin the pro
. No officerfrom spea
zed Expenopted budgerdance wit
ures. The exgnee who s
Amendmeard shall amal spendines.
ves of Bud
jectives of al Accounta
ance evalutrators accoexplicitly inng and fina
recognizeent No. 1 (S
Bu
meeting to ws:
rd Presidewho desire eet provide
he beginnin.
shall confiposed budg
r or employakers at the
nditures et providesh state lawxpenditure hall ensure
ents mend the bng categor
dgeting
budgetingability Syste
uation alloountable fon state lawancial repoes its impSection 100
udget Pol
discuss the
nt shall reto speak o
ed.
ng of the m
ne their remget and/or t
yee of the De meeting.
s authority tw, Board pof funds sh
e that funds
budget wheries or inc
g are outliem Resourc
ows citizensor their actiws and coorting. Thortance w.177):
icies - Co
e proposed
quest at thon the prop
meeting, the
marks to thethe tax rate
District shal
to expend fpolicy, andhall be undes are expen
en a changcreasing re
ned by thce Guide.
s and taxons. Becaunstitutions, e Governm
with these
ontinued
budget and
he beginninposed budg
e Board m
e appropriae.
l be require
funds for th the Distrier the direcnded in acc
e is made evenue obj
e Texas E
xpayers to use accoun it is cons
mental Accobjectives
d tax rate s
ng of the mget and/or
ay establis
ation of fund
ed to respo
he purposect’s approv
ction of the cordance w
increasing ject accou
Education
hold policntability to csidered a
counting Stin its GA
shall be
meeting thtax rate sig
sh time limi
ds as conta
ond to ques
es indicatedved purchaSuperinten
with the ado
any one ounts and o
Agency in
cy makers citizens oftecornerston
tandards BASB Conc
at all gn up
ts for
ained
stions
d and asing ndent opted
of the other
n the
and en is
ne of Board cepts
Page 73

• F
re • F
udre
• F
s
Meetingrecognizlocal pub
They inc
• B
• Bm
• P
a Note: Adistricts approprithe balapay for cbe in ac
Financial repevenues we
Financial resed in accemonstrateequirement
Financial reervice effor
these obzing accounblic sector
clude requir
Be balanced
Be preparedmandates an
Provide a bccomplishm
lthough theto ensure liate for som
anced budgcurrent servcordance w
Bu
porting shoere sufficien
eporting shocordance we compliants.
porting shorts, costs an
bjectives rentability. Obudgets.
rements tha
d so that cu
d in accornd requirem
asis for thements.
e objectiveong-term fi
me school dget objectivevices during
with applica
udget Pol
ould provident to pay fo
ould demowith the ennce with
ould providnd accomp
equires budOften these
at budgets
urrent reven
rdance withments.
e evaluatio
of balanceiscal healthdistricts ovee may be mg certain peble state an
icies - Co
e informatioor current-ye
nstrate whntity’s legal
other fin
de informatlishments o
dget prepae concepts
should:
nues are su
h all applic
on of a gov
ed budgetsh, variationser short-termmet througeriods. Sucnd local fun
ontinued
on to determear service
hether resolly adoptedance-relate
ion to assiof the gove
aration to have been
ufficient to p
cable feder
vernment’s
s is generas of this objm periods ah the use och uses of nd balance
mine wheths.
ources wered budget. ed legal
st users inrnmental en
include sen mandate
pay for curre
ral, state,
service eff
ally applicaective whicare availabof fund balfund balanpolicies.
her current-
e obtained It should
or contra
n assessingntity.
everal concd for state
ent service
and local
forts, costs
able to all ch are consble. For exalance reserce reserves
-year
and also
ctual
g the
cepts e and
s.
legal
s and
school sidered ample, rves to s must
Page 74

Budget The budAdoption The budobjectiveobjectiveallocatiopreparatand prog The buEvaluatioutcomeachievedimportanpreparatfunds. Rplanning The budcampus the onepreparesrevenuebetweenprojecteadministallotmen Staffing level eaenrollmeDistrict’sinstructio BudgetsbudgetsFinanciaThis inccosts.
Developmdgeting pron, Impleme
dgetary proes of campes. Once th
ons are mtion phase grams have
dget is evon typicalles resulted d the objent in determtion is not Rather, schg and evalu
dget proceemployee
who shous prelimina
e assumptin secondard enrollmetrator prepant is design
requests aach year. ent growths operationonal and no
s for non-ca are revie
al Officer isludes estim
Bument Proce
ocess is cntation, and
ocess beginpuses; the shese progra
made to sof budgeti
e been esta
valuated foly involvesfrom the e
ctives statemining the fa one-timehool distric
uation to ac
ess emphawho has b
uld budget ary revenueons, the cry and eleents to geares a detaed to cover
and salary The review. Since pa
nal budget, on-instructio
ampus orgaewed by ths responsibmates of sta
udget Polss
comprised d Evaluatio
ns with soschool distrams and plaupport theng. The all
ablished.
or its effes an examexpenditureed during following yee exercise tct budget hieve distric
sizes accobeen given
for the exe estimatescampuses mentary le
enerate a ailed budger non-payro
and benefw process ayroll-relate
careful coonal positio
anizations ahe respectible for compate funding
icies - Co
of five maon
und planniict developans have bem. Budgeocations ca
ectiveness mination of e of funds, the plannin
ear's budgeto determinpreparationct goals.
ountability. the authori
xpenditure. s by Februreceive al
evels. Thesbudget suet based ooll related e
it increasesfor new
ed costs considerationons.
are determiive pyramipiling all pe, taxable v
ontinued
ajor phase
ng. Plannips programsbeen establetary resouannot be m
in attaininhow fund
and to whang phase. etary allocane how a sn is part o
As a genity to initiat The Distr
uary of eacllotments pse allotmenm for eacn specific gxpenses.
s are calcustaff is co
comprise an is given
ined on a jud head ofertinent budvalues, tax
es: Plannin
ng definess to attain tished, budgurce alloca
made, howe
ng goals ads were eat degree tThis evalu
ations. In suschool distrof a contin
eral rule, e expenditurict’s businch year. Bper studennts are much campusgoals and
ulated at thontingent upproximateto each re
ustified neef each aredget data arates, and
g, Prepara
the goals those goalsgetary resoations areever, until p
and objectxpended, these outcouation phasummary, burict will allonuous cycl
the designure decisio
ness office Based on tnt differentultiplied by
s. The camobjectives.
he central oupon proje
ely 80% ofequest for
ed basis. Tea. The Cand projectprojected u
ation,
and s and ource the plans
tives. what
omes se is udget ocate le of
nated ons is
staff hese iated
y the mpus The
office ected f the both
hese Chief tions. utility
Page 75

Capital proceedand equexisting funds on Each mproceedduring thcustodiaprojectecapital p Budget PrincipaHoweveBoard ois appro AdoptedThe offiPEIMS the annu MonthlyThe disTrustees Annual The finaaudited A Budge
improvemeds and relatuipping of s
facilities. Tn an annua
major constrds. Howevehe annual al services, d and incl
projects mu
Amendmeals and proger, any transf Trustees. ved by the
d Budget cially adop(Public Eduual system
y Reportingstrict’s finans on a mon
Audit al stage of financial st
et Process
Bu
ents are buted interestschool facilThe Board l basis.
ruction coner, the impbudgets foetc.) assocuded in thst be includ
ents gram manasfer of fund At the lasBoard of T
pted districtucation Infoguidelines.
g ncial statemthly basis.
the budgeatements p
Calendar fo
udget Pol
udgeted on t are accoulities, to pu
of Trustee
ntract is appact of capr all other f
ciated with ce general ded in the d
gers may rds that modt meeting o
Trustees.
t budget, aormation M.
ments and
et cycle is part of whic
or 2012-201
icies - Co
a project bunted for inurchase sches does no
pproved bapital projectfunds. Futucapital impfund budg
debt service
equest the difies an expof the fiscal
as amendeManagemen
d investmen
the approvh includes
13 is shown
ontinued
basis spann separate hool sites, ot formally
ased on ext fund budure operatinrovements
get. Repayme fund proje
transfer of penditure fu year, a for
ed, must bnt System)
nts are pr
val by the budget to a
n on page 7
nning multipfunds for tand to renadopt the
xisting avaigets must ng costs (sand new fa
ment of boections.
f available bunction is armal final am
be filed witby the dat
resented to
Board of Tactual comp
78.
ple years. Bthe construnovate or ree capital pr
ilability of bbe consid
staffing, utilacilities muonds issued
budgeted fuapproved bymended bu
h TEA throte prescribe
o the Boar
Trustees oparisons.
Bond ction epair roject
bond dered lities, st be d for
unds. y the
udget
ough ed in
rd of
f the
Page 76

ManageTypicallyrespons CampusRequisit All activthrough All purcsystem appropri PurchasapproveRequisitalso rec The PupurchasrequesteThe Purvendor. Upon reservices EncumbAll purchappropri An encuappropri
Man
ement Procy, principalible for dist
s principaltions for the
vities involvthe Human
hases of gwith approiate accoun
se Requisited by the cations for Speive additio
rchasing Aing laws aed from a lerchase Req
eceipt of ts, cuts a che
brance Conhases of goiate encum
umbrance iation which
agement
cess ls are resptrict wide bu
s and pre purchase
ving payron Resource
goods and opriate appnt charged.
ions are inampus princpecial Reveonal approv
Agent revieare being cegally qualifquisition is
he invoiceeck, and clo
ntrol oods and sbrance con
is an oblih reserves
t Process
ponsible foudgets.
rogram maof goods a
oll costs, ss and Payr
services aroval contr
nitially entecipal or proenue Fundval by the a
ews the Pcomplied wfied vendorthen conve
, Accountsoses the Pu
ervices arentrols to ens
gation in ta part of th
s and Enc
or campus
anagers aand services
salaries anroll departm
re processrols to ensu
red at the ogram manas, technoloppropriate
Purchase Rwith and thar. Account erted to a
s Payable urchase Or
e processedsure the av
the form oat budget li
cumbranc
budgets a
are authors.
nd employements.
ed throughure the leg
campus oager submiogy or expeprogram m
Requisition at the goocodes are Purchase O
verifies thrder.
d through tvailability of
of a Purchine item.
ce Contro
and program
ized to s
ee benefits
h the financgal purpose
or departmeitting the reenditures e
manager.
to verify ods and sealso checkOrder and
he receipt
he financiafunds.
hase Orde
ol
m manage
submit Pur
s, are con
cial manage is met a
ent level anequest. Purexceeding $
that approervices are ked at this le
forwarded
of the goo
al system w
r charged
ers are
rchase
ntrolled
gement nd the
nd are rchase $5,000
opriate being
evel. to the
ods or
with the
to an
Page 77

COMPLETIONACTIVITY RESPONSIBILITY DATE
1 Review of budget process and responsibilities with Chief Financial Officer Nov 2011Principals in ILT meeting
2 Review of 2012-13 budget process with Board of Trustees Chief Financial Officer Dec 2011in Board Workshop meeting
3 Meet individually with Campus Principals to begin developing Assistant Superintendent Jan 2012staffing needs Chief Financial Officer
4 Complete Staffing plan for district for 2012-2013 Assistant Superintendent Feb 2012Chief Financial Officer
5 Budget forms distributed by principals to site-based Campus Principals Mar 2012committees and department heads
6 Principals / Departments Heads meet with Business Chief Financial Officer Mar 2012Services to review preliminary budgets
7 Site-based budget recommendations due in to Principals/Directors Apr 2012Business Services
8 Evaluation of District staffing, facility, and other Central Office Administration May 2012budgetary needs
9 Review of campus/department budget proposals in Chief Financial Officer Jun 2012Board Workshop meeting Central Office Administration
10 Compile Preliminary Budget for 2012-2013 Business Services Jun 2012
11 Present Proposed Salary Schedule to Board Chief Financial Officer Jul 2012
12 Present Preliminary Budget to Board Chief Financial Officer Jul 2012
13 Present Certified Tax Appraisal to Board Chief Financial Officer Aug 2012
14 Present Proposed Budget to Board and Proposed Tax Rates Superintendent Aug 2012Chief Financial Officer
15 Publish "Notice of Public Meeting to Discuss Budget and Chief Financial Officer Aug 2012Proposed Tax Rate"
16 Public Hearing on Proposed Budget and Tax Rates Board of Trustees Aug 2012
17 Adoption of budget for 2012-13 Board of Trustees Aug 2012
18 Adoption of Ordinance to Levy Tax Rates for 2012-2013 Board of Trustees Aug 2012
19 Distribute copies of budgets to campuses Business Services Sep 2012
20 Distribute budget book to Board of Trustees Chief Financial Officer Nov 2012
21 Amendments to 2012-2013 budget Board of Trustees As NeededChief Financial Officer
Budget & Tax Rate Preparation / AdoptionFrenship Independent School District
Table 15
Page 78

FRENSHIP INDEPENDENT SCHOOL DISTRICT
FINANCIAL SECTION
Page 79

Frenship Independent School District Financial Section Overview
This financial section provides fiscal information regarding the various funds of the District. By law, the School Board of Trustees for Frenship ISD must approve annual expenditure budgets for the General Fund, Student Nutrition Fund, and Debt Service Fund. These three funds make up the Governmental Funds. All other funds include proprietary funds, fiduciary funds, special revenue funds, and capital project funds. In this section, a pyramid approach is presented by beginning with a Combined Statement of Revenues and Expenditures for all three Governmental funds together followed by schedules providing financial information for each of the funds. The District’s budget is organized into the following fund categories: General Fund Used to pay for salaries and benefits of District staff, classroom resources, utilities, maintenance, custodial work, grounds upkeep, transportation, etc. Mainly to pay for the general operations of the District’s facilities and staff. Student Nutrition Fund Used for the operation of the District’s program to provide meals to the District’s students. These operations are provided through a management and operations contract with Aramark Food Services. Debt Service Fund Used to pay the annual principal and interest requirements resulting from the sale of bonds by the District with approval from the District’s voters via a bond election. These bonds are sold to fund the construction of instructional buildings, other facilities, technology needs, and general maintenance projects. Special Revenue Funds Used to account for the proceeds of specific revenue sources such as federal programs or state programs. These funds are related to specific programmatic expenditures with detailed restrictions. An Other Funds schedule is included in this financial section to reflect the budgets for these funds.
Page 80

Student Debt
General Nutrition Service
DESCRIPTION Fund Fund Fund Total
REVENUES
5700 Local 27,785,000$ 1,451,731$ 12,027,789$ 41,264,520$
5800 State 23,196,100 19,016 505,898 23,721,014
5900 Federal 520,000 1,632,945 - 2,152,945
TOTAL REVENUE 51,501,100 3,103,692 12,533,687 67,138,479
EXPENDITURES11 Instruction 29,243,711$ -$ -$ 29,243,711$ 12 Instruction Resources & Media Services 814,309 - - 814,309 13 Curriculum Development & Staff Development 596,085 - - 596,085 21 Instructional Leadership 1,301,515 - - 1,301,515 23 School Leadership 3,323,825 - - 3,323,825 31 Guidance and Counseling 1,505,714 - - 1,505,714 33 Health Services 594,222 - - 594,222 34 Pupil Transportation 1,812,950 - - 1,812,950 35 Food Services - 3,423,370 - 3,423,370 36 Co-curricular / Extra-curricular Activities 2,403,773 - - 2,403,773 41 General Administration 1,944,939 - - 1,944,939 51 Plant Maintenance & Operations 7,386,062 - - 7,386,062 52 Security & Monitoring Services 434,332 - - 434,332 53 Data Processing Services 1,003,963 - - 1,003,963 61 Community Services 26,200 - - 26,200 71 Debt Service - - 11,977,819 11,977,819 81 Capital Outlay - - - - 95 Payments to JJAEP 10,000 - - 10,000 99 Appraisal Services 385,000 - - 385,000
TOTAL EXPENDITURES 52,786,600 3,423,370 11,977,819 68,187,789
NET REVENUE OVER (UNDER) (1,285,500)$ (319,678)$ 555,868$ (1,049,310)$
OTHER SOURCES7900 Other Sources -$ -$ -$ -$ 8900 Other Uses - - - -
NET SOURCES OVER (UNDER) -$ -$ -$ -$
NET REVENUE/SOURCES OVER/UNDER (1,285,500)$ (319,678)$ 555,868$ (1,049,310)$
BEGINNING FUND BALANCE 15,570,603$ 896,340$ 5,307,731$ 21,774,674$
ENDING FUND BALANCE - UNAUDITED 14,285,103$ 576,662$ 5,863,599$ 20,725,364$
Statement of Revenues and Expenditures (Budget)2012-2013
Combined Funds
Table 16Frenship Independent School District
Page 81

Frenship Independent School District
General Fund Revenue Assumptions
• Overall funding from local property taxes and state aid are driven by student enrollment since the funds are provided on a $ per student attendance basis. Enrollment growth the past 4 years have ranged from 3% up to 6.5%. For 2012-2013 and the next two years, enrollment is projected to grow in the 3% to 3.5% range.
• Senate Bill 1 from the 2011 legislative session will reduce state funding for
both years of the biennium. In the first year, all state districts are reduced across the board by 7% which is a $3.5 million reduction for the District. For the second year of the biennium, all districts are reduced by 2% while Districts still receiving additional state aid through the target revenue system, established in 2006, receive further reductions. For the District, this second year reduction is $4.4 million – for a total reduction of $7.4 million for the biennium.
• The taxable value growth rate in the District during the past three years was
5%, 3.3% and 5.7%, respectively. For 2012-2013, the rate is 4.7% with projected growth of 4% for the next two years.
• The tax rate for Maintenance and Operations (M&O) is at $1.04 per $100 of
taxable value which is the maximum allowed by the state without voter approval, just Board approval.
• Tax rate increases above the $1.04 are permitted with voter approval of a Tax
Ratification Election (TRE). The maximum M&O rate allowed with voter approval is an additional 13 cents per $100 of taxable value, or a rate of $1.17.
• No TRE has ever been held by the District and a TRE is not proposed for the
2012-2013 budget year.
• A tax collection rate of 99% is used to project the collection from the local tax levy for the 2012 tax year.
• Due to the continued economic slowdown and the proposed Federal Reserve
fiscal program, interest rates are expected to remain very low through 2014-2015. Therefore, investment earnings by the District on operating funds and bond funds will remain minimal.
Page 82

Expenditure Assumptions
• Due to the state funding reductions in the current biennium, staffing levels and positions will be continually monitored and reviewed. The District strives to make any required staffing adjustments through attrition rather than a reduction in force (RIF) programs.
• The District continues to consider the Strategic Plan’s objectives and action plans
when developing each year’s expenditures budget. The 2012-2013 fiscal year represents the second year of the three year strategic plan implementation.
• To help offset the state funding reductions and the end of the Federal Education
Jobs Grant program, the District reviewed and adjusted classroom sizes at both the secondary and elementary grade levels. A minimal number of class size waivers are expected to be submitted to the Texas Education commissioner for the 2012-2013 school year.
• The District will maintain its current non-payroll campus allocation amounts
based on student enrollment. These per student allocation amounts still reflect a 15% reduction made in the 2011-2012 fiscal year.
• The District will participate in the First Care Health Insurance program for its
employees. Contributions by the District for premiums are $255 per month per employee on the plan.
Page 83

2008-09 2009-10 2010-11 2011-12 2012-13Audited Audited Audited Unaudited Adopted % LYActual Actual Actual Totals Budget 12-13
LOCAL REVENUE
Local Taxes (Current Year - 98%) 22,186,716 23,596,041 24,579,552 25,620,000 26,745,000 4.4Local Taxes, Prior Years 220,507 244,729 208,859 280,000 250,000 (10.7)Local Tax Penalties & Interest 202,192 227,200 218,801 260,000 230,000 (11.5)Tuition and Fees 30,569 31,285 79,260 30,000 30,000 0.0Gate Receipts & Ath. Event Entry Fees 195,221 186,830 228,996 190,481 120,000 (37.0)Misc. Local Revenues 468,466 225,564 389,617 290,000 200,000 (31.0)Earning from Investments 259,761 107,916 126,774 115,000 125,000 8.7Rents and Building Use Fees 50,071 52,830 46,818 42,000 45,000 7.1Gifts and Bequests 104,642 67,519 412,956 48,342 40,000 (17.3)Insurance Recovery 17,397 17,841 70,818 23,000 0 n/a
Total Local 23,735,542 24,757,755 26,362,451 26,898,823 27,785,000 3.3
STATE REVENUE
Per Capita Apportionment - ASF 1,630,191 801,200 2,291,938 1,768,200 3,078,350 74.1Foundation School Fund 20,003,140 21,564,413 21,080,729 20,763,475 17,820,750 (14.2)TRS On-behalf Payments 2,083,868 2,242,810 2,325,120 2,181,737 2,290,000 5.0Alternative Education Program 6,475 6,771 7,031 7,000 7,000 0.0Other State Funds: 18,508 661 0 0 0 n/a
Total State 23,742,181 24,615,855 25,704,818 24,720,412 23,196,100 (6.2)
FEDERAL REVENUE
Stimulus - Available School Fund 0 0 0 0 0 n/aStimulus - NOGA 0 0 0 0 0 n/aIndirect Cost 63,827 80,747 109,112 100,000 110,000 10.0Other Revenues 200,401 186,115 259,659 515,000 300,000 (41.7)E-Rate Program 68,334 116,886 106,531 175,000 110,000 (37.1)
Total Federal 332,562 383,748 475,302 790,000 520,000 (34.2)
Sale of Property
TOTAL REVENUE 47,810,285 49,757,358 52,542,571 52,409,235 51,501,100 (1.7)
Statement of RevenuesYears 2008 through 2012
General Fund
Table 17Frenship Independent School District
Page 84

2008-09 2009-10 2010-11 2011-12 2012-13Audited Audited Audited Unaudited Adopted % LYActual Actual Actual Totals Budget 12-13
EXPENDITURES BY FUNCTION
11 Instruction 26,564,792 26,708,447 28,571,137 28,762,689 29,243,711 1.712 Instruction Resources & Media Services 712,658 701,265 740,328 727,107 814,309 12.013 Curriculum Development & Staff Development 1,341,807 1,417,774 707,518 810,644 596,085 (26.5)21 Instructional Leadership 1,084,409 1,226,480 1,205,630 1,256,524 1,301,515 3.623 School Leadership 2,725,423 2,908,052 3,155,529 3,331,902 3,323,825 (0.2)31 Guidance and Counseling 1,253,264 1,385,890 1,388,378 1,455,308 1,505,714 3.533 Health Services 472,688 533,693 521,464 573,295 594,222 3.734 Pupil Transportation 1,619,250 1,731,837 1,814,360 1,773,100 1,812,950 2.236 Co-curricular / Extra-curricular Activities 2,185,622 2,181,596 2,890,791 2,437,979 2,403,773 (1.4)41 General Administration 1,742,414 1,790,883 1,955,910 1,968,687 1,944,939 (1.2)51 Plant Maintenance & Operations 6,320,620 7,071,148 7,275,215 7,186,495 7,386,062 2.852 Security & Monitoring Services 425,401 483,729 420,350 442,831 434,332 (1.9)53 Data Processing Services 831,631 900,052 949,376 1,164,672 1,003,963 (13.8)61 Community Services 14,964 13,890 16,706 26,780 26,200 (2.2)71 Debt Service 0 0 0 0 0 n/a81 Facilities Acquisition & Construction 77,377 18,017 18,443 2,147 0 n/a95 Payments to JJAEP 31,671 11,730 0 0 10,000 n/a99 Other Governmental Charges 361,687 398,212 380,873 360,000 385,000 6.9
TOTAL EXPENDITURES 47,765,678 49,482,695 52,012,008 52,280,160 52,786,600 1.0
Statement of Expenditures - By FunctionYears 2009 through 2013
General Fund
Table 18Frenship Independent School District
Page 85

2008-09 2009-10 2010-11 2011-12 2012-13Audited Audited Audited Unaudited Adopted % LYActual Actual Actual Totals Budget 12-13
EXPENDITURES BY OBJECT
Payroll Costs 37,680,911 39,774,387 41,321,022 41,988,234 42,670,000 1.6Professional & Contracted Services 5,525,425 5,939,978 5,956,487 5,962,363 6,062,548 1.7Supplies & Materials 2,958,988 2,351,378 2,693,776 2,911,526 2,658,905 (8.7)Other Operating Expenses 1,273,173 1,190,164 1,146,924 1,365,366 1,380,147 1.1Debt Service 0 0 0 0 0 n/aCapital Outlay 327,181 226,788 893,799 52,671 15,000 (71.5)
TOTAL EXPENDITURES 47,765,678 49,482,695 52,012,008 52,280,160 52,786,600 1.0
OTHER SOURCES
Sale of Property 15,000 0 1,791,017 0 0 n/aTransfers In (Out) 0 0 0 0 0 n/a
TOTAL OTHER 15,000 0 1,791,017 0 0 n/a
NET REVENUE OVER (UNDER) EXPENDITURES 59,607 274,663 2,321,580 129,075 (1,285,500)
BEGINNING FUND BALANCE 12,910,670 12,845,285 13,119,948 15,441,528 15,570,603
ENDING FUND BALANCE 12,970,277 13,119,948 15,441,528 15,570,603 14,285,103
Statement of Expenditures - By ObjectYears 2009 through 2013
General Fund
Table 19Frenship Independent School District
Page 86

2011-12 2012-13Unaudited % Approved %
Totals of Total Budget of Total $ %
Payroll & Benefits 41,988,234$ 80.3 42,670,000$ 80.8 681,766$ 1.6 Contracted Services 5,962,363 11.4 6,062,548 11.5 100,185 1.7 Supplies 2,911,526 5.6 2,658,905 5.0 (252,621) (8.7) Other Operating Expenses 1,365,366 2.6 1,380,147 2.6 14,781 1.1 Capital Outlay 52,671 0.1 15,000 0.0 (37,671) (71.5)
TOTAL 52,280,160$ 100.0 52,786,600$ 100.0 506,440$ 1.0
General Fund (100-199)
B(W) LY
Expenditures by Major Object
General Fund
Table 20Frenship Independent School District
Payroll & Benefits81%
Contracted Services11%
Supplies5%
Travel & Miscellaneous3% Fixed Assets
0%
Expenditures by Major Object
Page 87

2008-09 2009-10 2010-11 2011-12 2012-13Audited Audited Audited Unaudited AdoptedActual Actual Actual Totals Budget
5700 LocalProperty Taxes 22,609,415$ 24,067,970$ 25,007,212$ 26,160,000$ 27,225,000$ Tuition and Fees 30,569 31,285 79,260 30,000 30,000 Interest Earnings 259,761 107,916 126,774 115,000 125,000 Other Revenues 835,797 550,584 1,149,205 593,823 405,000
Total 23,735,542 24,757,755 26,362,451 26,898,823 27,785,000
5800 StatePer Capita & Foundation School Program 21,633,331$ 22,365,613$ 23,372,667$ 22,531,675$ 20,899,100$ Other State Revenues 24,982 7,432 7,031 7,000 7,000 State TRS On-Behalf 2,083,868 2,242,810 2,325,120 2,181,737 2,290,000
Total 23,742,181 24,615,855 25,704,818 24,720,412 23,196,100
5900 FederalStabilization Funds (SFSF) -$ -$ -$ -$ -$ Indirect Costs on Federal Programs 63,827 80,747 109,112 100,000 110,000 Other Federal Revenues 200,401 186,115 259,659 515,000 300,000 ERATE 68,334 116,886 106,531 175,000 110,000
Total 332,562 383,748 475,302 790,000 520,000
Total Revenues 47,810,285 49,757,358 52,542,571 52,409,235 51,501,100
6100 Payroll Costs 24,687,987$ 25,336,172$ 27,076,749$ 26,927,392$ 27,543,023$ 6200 Purchased & Contracted Services 389,118 408,126 438,876 507,346 500,952 6300 Supplies & Materials 1,299,672 850,018 967,893 1,213,038 1,093,619 6400 Other Operating Expenses 115,301 77,648 87,619 91,174 106,117 6600 Capital Outlay 72,714 36,483 - 23,739 -
TOTAL - 11 INSTRUCTION 26,564,792 26,708,447 28,571,137 28,762,689 29,243,711
6100 Payroll Costs 530,528$ 572,410$ 604,919$ 615,734$ 704,289$ 6200 Purchased & Contracted Services 1,185 762 595 2,643 755 6300 Supplies & Materials 180,912 127,173 132,143 105,830 106,565 6400 Other Operating Expenses 33 920 2,671 1,400 2,700 6600 Capital Outlay - - - 1,500 -
TOTAL - 12 INSTRUCTIONAL RESOURCES & MEDIA 712,658 701,265 740,328 727,107 814,309
6100 Payroll Costs 1,159,853$ 1,276,082$ 551,600$ 664,407$ 439,917$ 6200 Purchased & Contracted Services 68,697 60,234 79,091 54,572 61,350 6300 Supplies & Materials 5,845 10,732 18,353 10,846 10,090 6400 Other Operating Expenses 107,412 70,726 58,474 80,819 84,728 6600 Capital Outlay - - - - -
TOTAL 13 - CURRICULUM & INSTR. STAFF DEV. 1,341,807 1,417,774 707,518 810,644 596,085
6100 Payroll Costs 949,680$ 1,064,653$ 1,077,610$ 1,138,849$ 1,172,853$ 6200 Purchased & Contracted Services 46,817 58,391 37,420 24,112 25,230 6300 Supplies & Materials 40,004 36,870 46,292 41,189 38,306 6400 Other Operating Expenses 47,908 66,566 44,308 52,374 65,126 6600 Capital Outlay - - - - -
TOTAL 21 - INSTRUCTIONAL LEADERSHIP 1,084,409 1,226,480 1,205,630 1,256,524 1,301,515
General Fund (100-199)
Table 21Frenship Independent School District
Statement of Revenue and Expenditures
Five-Year View including 2012-2013By Function By Object
Expenditures
Revenues
FUNCTION 11 - INSTRUCTION
FUNCTION 12 - INSTRUCTIONAL RESOURCES & MEDIA
FUNCTION 13 - CURRICULUM & INSTRUCTIONAL STAFF DEV.
FUNCTION 21 - INSTRUCTIONAL LEADERSHIP
Page 88

2008-09 2009-10 2010-11 2011-12 2012-13Audited Audited Audited Unaudited AdoptedActual Actual Actual Totals Budget
General Fund (100-199)
Table 21Frenship Independent School District
Statement of Revenue and Expenditures
Five-Year View including 2012-2013By Function By Object
6100 Payroll Costs 2,537,377$ 2,815,471$ 3,051,987$ 3,223,003$ 3,204,268$ 6200 Purchased & Contracted Services 8,298 9,260 8,383 8,337 8,123 6300 Supplies & Materials 76,677 46,867 56,948 54,132 59,154 6400 Other Operating Expenses 103,071 36,454 38,211 46,430 52,280 6600 Capital Outlay - - - - -
TOTAL 23 - SCHOOL LEADERSHIP 2,725,423 2,908,052 3,155,529 3,331,902 3,323,825
6100 Payroll Costs 1,215,822$ 1,338,126$ 1,329,820$ 1,349,684$ 1,392,784$ 6200 Purchased & Contracted Services 1,799 1,764 1,199 40,024 36,885 6300 Supplies & Materials 22,590 37,875 44,584 43,081 51,650 6400 Other Operating Expenses 13,053 8,125 12,775 22,519 24,395 6600 Capital Outlay - - - - -
TOTAL 31 - GUIDANCE, COUNSELING & EVAL. 1,253,264 1,385,890 1,388,378 1,455,308 1,505,714
6100 Payroll Costs 439,237$ 503,283$ 493,899$ 546,617$ 566,947$ 6200 Purchased & Contracted Services 8,095 10,443 4,845 7,195 10,280 6300 Supplies & Materials 21,266 14,922 16,435 12,498 14,150 6400 Other Operating Expenses 4,090 5,045 6,285 6,985 2,845 6600 Capital Outlay - - - - -
TOTAL 33 - HEALTH SERVICES 472,688 533,693 521,464 573,295 594,222
6100 Payroll Costs 6,900$ 1,209$ -$ -$ -$ 6200 Purchased & Contracted Services 1,456,695 1,549,687 1,575,368 1,533,100 1,562,950 6300 Supplies & Materials 155,655 180,941 237,492 240,000 250,000 6400 Other Operating Expenses - - 1,500 - - 6600 Capital Outlay - - - - -
TOTAL 34 - PUPIL TRANSPORTATION 1,619,250 1,731,837 1,814,360 1,773,100 1,812,950
6100 Payroll Costs 755,058$ 789,234$ 861,527$ 1,092,348$ 1,087,608$ 6200 Purchased & Contracted Services 435,391 470,139 393,646 391,445 374,980 6300 Supplies & Materials 411,600 351,593 393,903 318,570 315,881 6400 Other Operating Expenses 540,602 535,315 481,883 635,616 625,304 6600 Capital Outlay 42,971 35,315 759,832 - -
TOTAL 36 - COCURRICULAR ACTIVITIES 2,185,622 2,181,596 2,890,791 2,437,979 2,403,773
6100 Payroll Costs 1,224,950$ 1,370,066$ 1,469,563$ 1,472,739$ 1,504,019$ 6200 Purchased & Contracted Services 364,447 254,083 338,735 345,222 312,800 6300 Supplies & Materials 48,395 44,669 54,747 40,297 41,145 6400 Other Operating Expenses 104,622 122,065 92,865 104,632 85,975 6600 Capital Outlay - - - 5,797 1,000
TOTAL 41 - GENERAL ADMINISTRATION 1,742,414 1,790,883 1,955,910 1,968,687 1,944,939
6100 Payroll Costs 3,365,309$ 3,832,357$ 3,933,125$ 4,048,070$ 4,163,362$ 6200 Purchased & Contracted Services 1,963,223 2,310,589 2,288,615 2,283,505 2,329,505 6300 Supplies & Materials 621,738 568,060 613,378 546,420 582,695 6400 Other Operating Expenses 218,446 253,153 306,568 308,500 310,500 6600 Capital Outlay 151,903 106,989 133,529 - -
TOTAL - FACILITIES MAINTENANCE 6,320,619 7,071,148 7,275,215 7,186,495 7,386,062
FUNCTION 41 - GENERAL ADMINISTRATION
FUNCTION 51 - FACILITIES MAINTENANCE & OPS.
FUNCTION 23 - SCHOOL LEADERSHIP
FUNCTION 31 - GUIDANCE, COUNSELING & EVALUATION
FUNCTION 33 - HEALTH SERVICES
FUNCTION 34 - PUPIL TRANSPORTATION
FUNCTION 36 - COCURRICULAR ACTIVITIES
Page 89

2008-09 2009-10 2010-11 2011-12 2012-13Audited Audited Audited Unaudited AdoptedActual Actual Actual Totals Budget
General Fund (100-199)
Table 21Frenship Independent School District
Statement of Revenue and Expenditures
Five-Year View including 2012-2013By Function By Object
6100 Payroll Costs 333,809$ 362,231$ 356,118$ 392,744$ 383,332$ 6200 Purchased & Contracted Services 45,338 38,983 30,546 23,753 21,136 6300 Supplies & Materials 40,434 27,553 27,914 19,357 22,139 6400 Other Operating Expenses 5,820 6,962 5,772 6,977 7,725 6600 Capital Outlay - 48,000 - - -
TOTAL - SECURITY & MONITORING 425,401 483,729 420,350 442,831 434,332
6100 Payroll Costs 456,663$ 495,075$ 496,105$ 514,500$ 507,598$ 6200 Purchased & Contracted Services 330,923 343,837 362,553 355,379 397,602 6300 Supplies & Materials 32,845 54,105 83,694 266,268 73,511 6400 Other Operating Expenses 11,200 7,035 7,024 6,890 11,252 6600 Capital Outlay - - - 21,635 14,000
TOTAL - MANAGEMENT INFORMATION SYSTEMS 831,631 900,052 949,376 1,164,672 1,003,963
6100 Payroll Costs -$ -$ -$ -$ -$ 6200 Purchased & Contracted Services 12,042 13,739 15,739 25,730 25,000 6300 Supplies & Materials 1,309 - - - - 6400 Other Operating Expenses 1,613 151 967 1,050 1,200 6600 Capital Outlay - - - - -
TOTAL - COMMUNITY SERVICES 14,964 13,890 16,706 26,780 26,200
6100 Payroll Costs 17,784$ 18,017$ 18,443$ 2,147$ -$ 6200 Purchased & Contracted Services - - - - - 6300 Supplies & Materials - - - - - 6400 Other Operating Expenses - - - - - 6600 Capital Outlay 59,593 - - - -
TOTAL - FACILITY ACQUISITION & CONSTRUCTION 77,377 18,017 18,443 2,147 -
6100 Payroll Costs -$ -$ -$ -$ -$ 6200 Purchased & Contracted Services 31,671 11,730 - - 10,000 6300 Supplies & Materials - - - - - 6400 Other Operating Expenses - - - - - 6600 Capital Outlay - - - - -
TOTAL - PAYMENTS TO JUVENILE JUSTICE 31,671 11,730 - - 10,000
6100 Payroll Costs -$ -$ -$ -$ -$ 6200 Purchased & Contracted Services 361,687 398,212 380,873 360,000 385,000 6300 Supplies & Materials - - - - - 6400 Other Operating Expenses - - - - - 6600 Capital Outlay - - - - -
TOTAL - OTHER GOVERNMENTAL CHARGES 361,687 398,212 380,873 360,000 385,000
Total Expenditures 47,765,677 49,482,695 52,012,008 52,280,160 52,786,600
Excess (Deficit) 44,608 274,663 530,563 129,075 (1,285,500)
7911 Capital Related Debt Issued - - - - - 7912 Sale of Real and Personal Property 15,000 - 1,791,017 - - 7915 Transfers In - - - - - 7916 Premium or Discount on Issuance of Bonds - - - - - 7917 Prepaid Interest - - - - - 8949 Payment to Refunded Bond Escrow Agent - - - - -
Total 15,000 - 1,791,017 - -
NET SOURCES OVER / (UNDER) 59,608 274,663 2,321,580 129,075 (1,285,500)
Beginning Fund Balance - September 1 12,910,670 12,845,285 13,119,948 15,441,528 15,570,603
Ending Fund Balance - August 31 12,970,278$ 13,119,948$ 15,441,528$ 15,570,603$ 14,285,103$
FUNCTION 61 - COMMUNITY SERVICES
FUNCTION 81 - FACILITY ACQUISITION & CONSTRUCTION
FUNCTION 95 - PAYMENTS TO JUVENILE JUSTICE
Other Sources (Uses)
FUNCTION 52 - SECURITY & MONITORING
FUNCTION 53 - MANAGEMENT INFORMATION SYSTEMS
FUNCTION 99 - OTHER GOVERNMENTAL CHARGES
Page 90

REVENU State Ai Property Federal Miscella EXPEND Payroll f Position Salary In One-tim Capital O Other In The aboexpenditreductioFederal Approximfor 2012
UE
d Funding
y Value and
Program D
aneous Rev
DITURES
from expirin
Reduction
ncrease an
e Technolo
Outlay
ncrease – U
ove reflects tures – for n in the sEducation
mately $1.32-2013.
FrenshGen
20
Decrease
d Tax Levy
Decrease –
venue – Loc
ng Federal
via Attritio
d higher be
ogy project
Utilities, Sup
the major 2012-2013
second yea Jobs fund
3 million in
Tip Indepe
neral Fund12-2013 v
Increase
SHARS / E
cal, State &
Fund Progr
n
enefits cost
expiring
pplies, etc.
changes in3 versus 20ar of the lding, a deffund balanc
Table 22 endent Scd – Majorversus 20
Incr To
(
ERATE
& Federal
ram
n the Gener011-2012. egislative bficit budgetce reserves
chool Disr Change011-2012
rease (Deco Fund Ba(in thousan
($1,633
$1,065
($280
($60
($1,100
$1,000
($600
$200
$100
($100
ral Fund bu Due to thbiennium at is showns may be u
strict es
crease) lance nds)
3)
5
0)
0)
0)
0
0)
0
0
0)
udget – bote additionaand the ex
n for the 20used to bala
h revenuesal State funxpiration of012-2013 yance the bu
s and nding f the year.
udget
Page 91

The emwithout participaschool program RevenuSales ofof revenmatchin ExpendFood anmonitoreadjusted Additionand repsupplies The 201capital o2013 ref
phasis of tthe fiscal
ation and eyear. The
m.
ue f meals andnue includeg funds.
ditures nd labor (ed on a mod each sum
nal expenseairs on equ
s, purchase
12-2013 exoutlay for foflect small i
Frensh
the Food Ssupport fr
expenses wfund bala
d a’ la cartee 50% fro
including bonthly basis
mmer as wel
es incurred uipment, re and mainte
xpendituresood servicencreases v
ip IndepeStudent
Services prorom the Gwill allow t
ance contin
e items repom USDA
benefits) res. Labor is rll as throug
by the Fooeplacementenance of t
s budget toes equipmeversus last y
endent ScNutrition
ogram is toeneral Funthe operatinues to be
resent 49%federal rei
epresents reviewed ash attrition.
od Services of equipmtechnology,
otals $3,42ent. Breakfyear.
chool Disn Fund
o provide and. Monthion to reale invested
% of total reimburseme
94% of exs meals pe
s Departmement, small
, and admin
23,370, whfast and lu
strict
a nutritionahly monitoize a margin improv
evenue. Addent, and 1.
xpenses. Br labor hou
nt include awares and
nistrative ov
hich includench meal p
l meal progring of stuginal profit
vements to
ditional sou.0% from
Both areasr and staffi
all maintend miscellanverhead fee
es $350,00prices for 2
gram udent t this o the
urces state
s are ng is
ance eous es.
00 in 2012-
Page 92

2008-09 2009-10 2010-11 2011-12 2012-13Audited Audited Audited Unaudited Adopted % LYActual Actual Actual Actual Budget 12-13
LOCAL REVENUE
School Meals 1,305,619 1,413,465 1,433,788 1,425,364 1,446,731 1.5Other 3,087 3,422 4,305 10,435 5,000 (52.1)
Total Local 1,308,706 1,416,887 1,438,093 1,435,799 1,451,731 1.1
STATE REVENUE
State Matching Funds 13,250 19,016 18,728 17,962 19,016 5.9
Total State 13,250 19,016 18,728 17,962 19,016 5.9
FEDERAL REVENUE
Federal Meal Reimbursement - Breakfast 288,677 300,865 334,498 343,477 332,725 (3.1)Federal Meal Reimbursement - Lunch 976,850 1,123,261 1,118,497 1,126,267 1,143,450 1.5Federal Commodities 142,297 170,662 217,047 180,000 156,770 (12.9)
Total Federal 1,407,824 1,594,788 1,670,042 1,649,744 1,632,945 (1.0)
TOTAL REVENUE 2,729,780 3,030,691 3,126,863 3,103,505 3,103,692 0.0
EXPENDITURES
Payroll Costs 0 0 0 0 0 n/aProfessional & Contract Services 2,385,875 2,834,109 2,658,850 2,615,561 2,859,100 9.3Supplies & Materials 229,478 178,637 225,732 187,505 177,270 (5.5)Other Operating Expenses 31,803 30,595 18,287 37,570 37,000 (1.5)Capital Outlay 1,674 0 0 0 350,000 n/a
TOTAL EXPENDITURES 2,648,830 3,043,341 2,902,869 2,840,636 3,423,370 20.5
NET REVENUE OVER (UNDER) EXPENDITURES 80,950 (12,650) 223,994 262,869 (319,678)
BEGINNING FUND BALANCE 354,045 434,995 422,346 646,340 909,209
ENDING FUND BALANCE 434,995 422,346 646,340 909,209 589,531
Table 23Frenship Independent School District
Statement of Revenue and ExpendituresYears 2009 through 2013
Student Nutrition Fund
Page 93

Over thea need fund con A schoosubject tCode (Tcontrol, for debtseparatefund theInterest is calculcertified TEC 45Generalbonds, ttax levieissued. Governmtaxes le$0.50 tademons$0.50 tathe distrof the tapaymen Once tha district
e past 10 yto conduct nstruction p
ol district isto voter app
TEC) 45.00that must
t issues ane bank accoe debt payand Sinkinated basedby the Lub
.003(1), as that it hastogether wited at a rat In additio
ment Codeevied to payax rate testrate its ab
ax rate to anrict, as certax year fivet for the bo
e prospectit may levy a
Frensh
years and inbond elec
projects.
s authorizeproval of a 3(b)(1). A be used tond other loount must b
yments basng – I&S taxd on the schbbock Centr
s amended,s the prospth debt servte of $0.50on, taxes le Chapter 1y debt servst as appliebility to comn amount eified by a ree years aftnds is due.
ive ability toa tax to pay
ip IndepeDebt S
n the near fctions to au
ed to issuepropositiondebt servic
o account foong-term debe kept for sed on thex rate) is aheduled deral Appraisa
, requires apective abilvice on oth
0 per $100evied to pa1207 are nvice on suced to subs
mply with thqual to 90%egistered pter the curr.
o pay such y the annua
endent ScService Fu
future, the uthorize new
e bonds ann submittedce fund is aor general ebts for wthis fund a scheduledpproved bybt requiremal District.
a district toity to pay d
her outstand0 of assessay refundinot subject ch bonds asequent isshe $0.50 th% of projectprofessionarent tax ye
tax has beal debt serv
chool Disund
District hasw bond deb
nd levy tax to the votea governmlong-term dhich a tax nd a separd maturitiesy the Boardments and th
o demonstrdebt servicding "new dsed valuating bonds ito the $0.5
are includedsues of “nereshold taxted future tal appraiserar or the t
een shown vice.
strict
s and will cbt and issu
xes for payers under Tental fund, debt princip
has beenrate tax rates. The de
d of Trusteehe taxable
rate to the ce on a prodebt" of theon before ssued purs50 tax rated in the caew debt.” x rate test axable valu, anticipateax year in
and the bo
ontinue to ue the bond
yment of bTexas Educ
with budgepal and inte
n dedicatede is assesseebt tax ratees annuallyproperty va
Texas Attooposed issue district, frobonds ma
suant to Te test; howealculation o
A district by applying
ue of propeed for the ea
which the
onds are iss
have ds to
onds ation etary erest
d. A ed to e (or y and alues
orney ue of om a y be
Texas ever,
of the may
g the rty in arlier final
sued,
Page 94

The DisRatings,state badistrict a In May $112.5 mis planne Revenu The primfrom levis $0.46governinleaving t Other sAllotmeninvestme The Exdistricts cent of dduring thlevied an
strict's bond, by virtue o
acking to loare Aa3 by
2007, the million has ed to be so
ue
mary sourcvying the Int per $100
ng debt taxthe District
sources of nt (EDA) pent earning
isting Debtto produce
debt servicehe previousnd collected
Deb
C(P
Debt L Interes Balanc
ds are rateof the Permcal school Moody's In
District’s vobeen sold
old in early 2
ce of reventerest and Sof taxable vx rates limiwith $0.04
revenue aprogram angs from fund
t Allotmente a guarante tax levy. Is State biend taxes for
bt Service
omputationPer $100 of imit
st & Sinkingce
ed AAA by manent Schdistrict’s devestor Serv
oters passewhich leav
2013.
ue for the Sinking (I&value, whicit a school per $100 ta
are state fnd the Instd cash bala
t (EDA) is teed yield iIn general, nnium, the dthe payme
e Fund - C
n of Legal Dassessed v
g Tax Rate
Moody's Ihool Fund oebt issues. vices and A
ed a $128 ves $15.5 m
debt servicS) tax rate.ch is the sa
district to axable ava
funds provtructional F
ances.
provided n State anda district’s district (1) mnt of princip
Continue
Debt Limit valuation)
$0.5000$0.4600$0.0400
nvestor Seof the State The unde
AA- by Fitch
million bonmillion rem
ce fund is . For the Dame rate in
a maximuilable for fu
vided as pFacilities (I
for existind local revebonds are made paympal and inte
d
00 00 00
ervices ande of Texas erlying credh Ratings.
nd electionaining auth
an ad valoDistrict in 20n 2011-12. m tax rate
uture bond s
part of theIFA) progra
g debt issenue per seligible for
ments on suerest on suc
d AAA by which prov
dit ratings o
n. Of this thorization w
orem tax ra012-13, this
The state e of $0.50, sales.
e Existing am, along
sued by scstudent for the allotme
uch bonds och bonds.
Fitch vides of the
total, which
aised s rate laws thus
Debt with
chool each
ent if, or (2)
Page 95

The Instdollar amprincipainstructioCommisThese fuDistricts Expend The expand inteapproximand Aug
tructional Fmount per l and intereonal facilit
ssioner of Eunds are a with the lo
ditures
penditures ferest requirmately $11gust of each
Deb
Facilities Alstudent in
est on eligibties. To reEducation ballocated towest amou
from the Derements fro.5 to $12.0h year.
bt Service
lotment (IFState and
ble bonds ueceive an before issui
school disunts will rec
ebt Service om existing0 million an
e Fund - C
FA) guarantd local fundused to con
IFA, a sing the bonstricts baseeive fundin
fund consisg bond debnnually. T
Continue
tees each ds for eachnstruct, acqschool disnds to be ped upon prong first.
st mainly ofbt. Curren
The paymen
d
school disth cent of taquire, renovstrict must paid with Stoperty wea
f the semi-antly, these nts are ma
trict a specax effort tovate, or imp
apply to tate assista
alth per stud
annual prinpayments
ade in Febr
cified o pay prove
the ance. dent.
ncipal total
ruary
Page 96

2008-09 2009-10 2010-11 2011-12 2012-13Audited Audited Audited Unaudited AdoptedActual Actual Actual Actual Budget % LY
LOCAL REVENUE
Property Taxes 10,056,871 10,621,282 11,054,111 11,570,000 12,007,789 3.8Interest Earnings - 29,721 14,945 21,000 20,000 (4.8)
Total Local 10,056,871 10,651,003 11,069,056 11,591,000 12,027,789 3.8
STATE REVENUE
IFA and EDA Allotments 1,218,371 1,256,225 857,037 780,000 505,898 (35.1)
Total State 1,218,371 1,256,225 857,037 780,000 505,898 (35.1)
TOTAL REVENUE 11,275,242 11,907,228 11,926,093 12,371,000 12,533,687 1.3
EXPENDITURES
6500 Debt Service
Principal 1,800,363 1,678,653 1,692,262 3,454,413 3,324,926 (3.7)Interest 9,577,418 9,378,209 10,085,932 8,150,493 8,627,893 5.9Fees 189,710 18,111 11,255 25,000 25,000 0.0
TOTAL EXPENDITURES 11,567,491 11,074,974 11,789,449 11,629,906 11,977,819 3.0
OTHER FINANCING SOURCES (USES)
Refunding Bonds Issued 0 0 0 0 0 n/aCapital Related Debt Issued (Regular Bonds) 8,680,000 0 0 0 0 n/aTransfers In 0 21,952 0 0 0 n/aPremium or Discount on Bond Issuance 308,573 0 0 0 0 n/aPrepaid Interest 0 0 0 0 0 n/aTransfers Out 0 0 0 0 0 n/aOther (8,828,292) 0 0 0 0 n/a
TOTAL OTHER FINANCING 160,281 21,952 0 0 0 n/a
NET REVENUE OVER (UNDER) EXPENDITURES (131,968) 854,207 136,644 741,094 555,868
BEGINNING FUND BALANCE 3,707,754 3,575,786 4,429,993 4,566,637 5,307,731
ENDING FUND BALANCE 3,575,786 4,429,993 4,566,637 5,307,731 5,863,599
Debt Services Fund
Frenship Independent School DistrictStatement of Revenue and Expenditures
Years 2009 through 2013
Table 24
Page 97

Debt Services Fund
The following table reflects the District's Outstanding General Obligation Debt:
Table 25Frenship Independent School District
Aggregate Debt ServicePrincipal and Interest
0
2,000,000
4,000,000
6,000,000
8,000,000
10,000,000
12,000,000
14,000,000
16,000,000
Aggregate Deb
t Service
Interest
Principal
Page 98
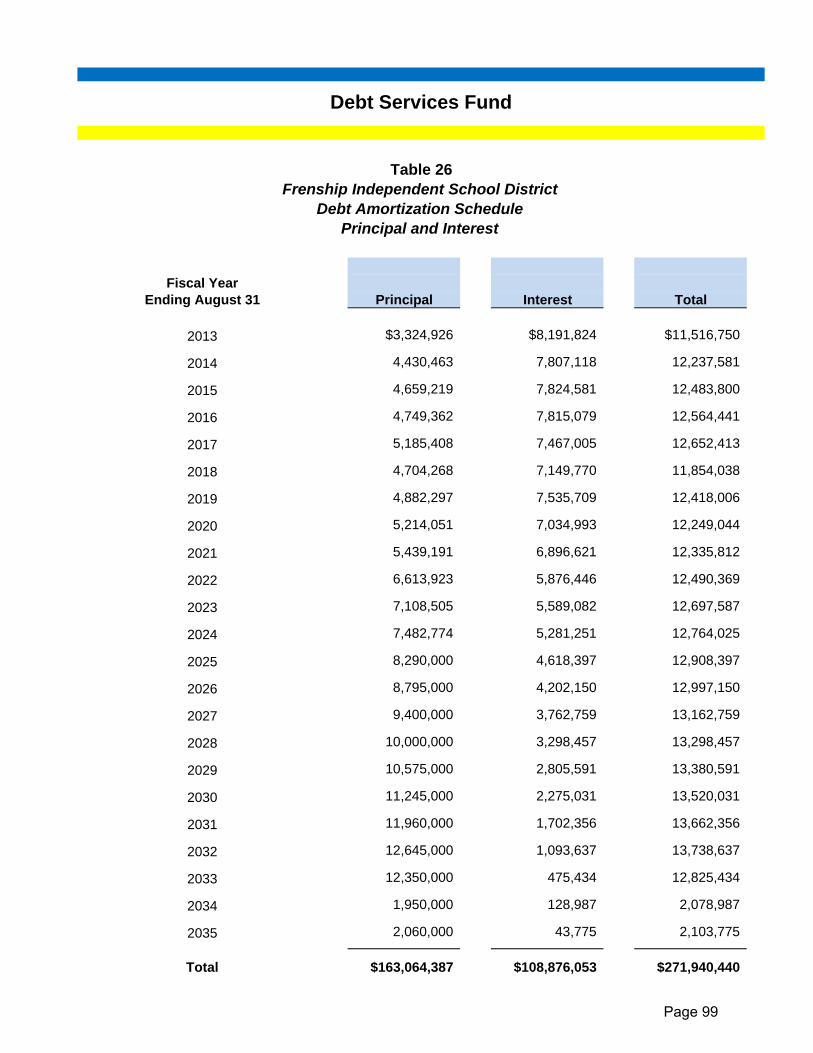
Fiscal YearEnding August 31 Principal Interest Total
2013 $3,324,926 $8,191,824 $11,516,750
2014 4,430,463 7,807,118 12,237,581
2015 4,659,219 7,824,581 12,483,800
2016 4,749,362 7,815,079 12,564,441
2017 5,185,408 7,467,005 12,652,413
2018 4,704,268 7,149,770 11,854,038
2019 4,882,297 7,535,709 12,418,006
2020 5,214,051 7,034,993 12,249,044
2021 5,439,191 6,896,621 12,335,812
2022 6,613,923 5,876,446 12,490,369
2023 7,108,505 5,589,082 12,697,587
2024 7,482,774 5,281,251 12,764,025
2025 8,290,000 4,618,397 12,908,397
2026 8,795,000 4,202,150 12,997,150
2027 9,400,000 3,762,759 13,162,759
2028 10,000,000 3,298,457 13,298,457
2029 10,575,000 2,805,591 13,380,591
2030 11,245,000 2,275,031 13,520,031
2031 11,960,000 1,702,356 13,662,356
2032 12,645,000 1,093,637 13,738,637
2033 12,350,000 475,434 12,825,434
2034 1,950,000 128,987 2,078,987
2035 2,060,000 43,775 2,103,775
Total $163,064,387 $108,876,053 $271,940,440
Debt Services Fund
Table 26Frenship Independent School District
Debt Amortization SchedulePrincipal and Interest
Page 99

Frenship Independent School District Capital Projects Fund Overview
Capital Projects Funds are used to account for the proceeds of General Obligation bonds, related interest earnings, expenditures of these funds for the construction and equipping of school facilities, to purchase school land sites, and renovations or repair of existing facilities. Projects are determined and prioritized through School Board and staff review along with input from the community. Enrollment and program additions / changes are major considerations in identifying and prioritizing District needs. Once all high-priority projects are identified, a bond election is held to obtain the community’s approval / authorization for the District to sell bonds to fund the projects’ construction. Capital projects are defined as a project that is distinguishable from other tasks or work being performed, has a schedule with a definitive beginning and ending, does not occur routinely, and results in a capital improvement or acquisition. The capital project budgets are prepared on a project basis. Each major construction contract is approved based on existing availability of bond proceeds and/or authorized but not yet sold bonds. However, the impact of the Capital Projects Fund’s projects must be considered when developing the annual budgets for all other funds. Future operating costs (staffing, utilities, etc.) must be projected and included in future budgets. Repayment of bonds issued to fund these capital projects must be included in the Debt Service Fund projections.
Page 100

The most recent bond authorization election was approved by voters in May 2007 for a total of $127,990,000. This bond package addressed enrollment growth with a new middle school and 2 new elementary schools, improved athletic facilities including an indoor practice facility, technology needs, and maintenance needs. A schedule of the 2007 projects included in the authorization follows:
Table 27 Frenship Independent School District
2007 Bond Program Schedule of Capital Projects
2 elementary schools $34.4 million 1 middle school $24.7 million Campus Additions and Renovations $13.8 million Classrooms, security entrances, parking Frenship High School Renovations $25.2 million New science wing of classrooms / labs Career / Tech building Performing Arts Center New gymnasium Reese Education Center Renovation $0.7 million Casey Administration Building $3.6 million Maintenance & Transportation Facility Expansions $1.4 million Athletic Complex Additions / Renovations $10.4 million Indoor Practice Facility Pave stadium parking lot Field Turf on football field Press Box expansion New locker rooms and concessions Expanded training and workout facilities Vocational Agricultural Facility $1.6 million Future Sites Land Acquisition $0.9 million Technology $4.5 million Maintenance of Buildings $6.8 million Total Projects: $128 million
Page 101
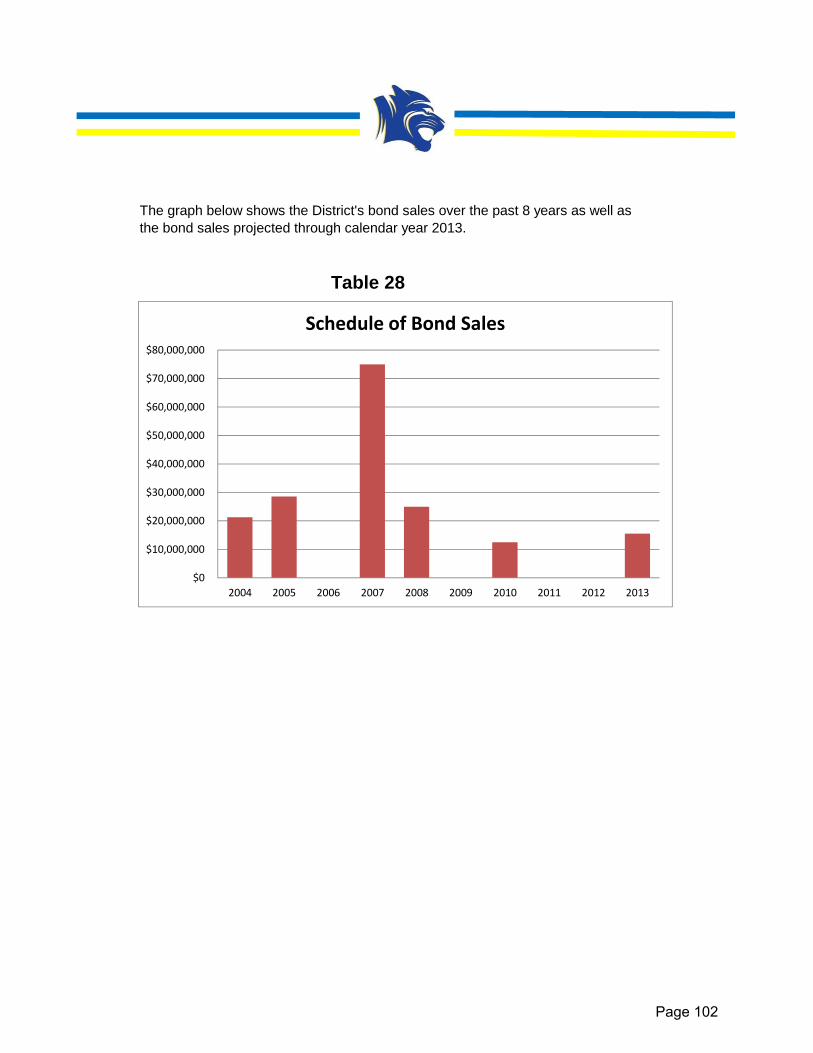
The graph below shows the District's bond sales over the past 8 years as well asthe bond sales projected through calendar year 2013.
Table 28
$0
$10,000,000
$20,000,000
$30,000,000
$40,000,000
$50,000,000
$60,000,000
$70,000,000
$80,000,000
2004 2005 2006 2007 2008 2009 2010 2011 2012 2013
Schedule of Bond Sales
Page 102

Table 29 Frenship Independent School District
Capital Projects Schedule For Fiscal Year 2012-2013
Elementary Schools North Elementary $9.9 million Middle Schools Heritage Middle School – Project Completion $0.1 million Frenship High School / Athletics Facilities $2.8 million Cafeteria Expansion Track Renovation Baseball / Softball Renovations Casey Administration Building – Project Completion $0.1 million Maintenance of Buildings $1.0 million Total Projects: $13.9 million
Page 103

2011-12 2012-13Unaudited Adopted
Totals Budget % to LYREVENUE
Property Taxes 0 0 n/aTuition and Fees 0 0 n/aInterest Earnings 21,605 0 n/aOther Revenues 0 0 n/a
Total Local Revenue 21,605 0 n/a
EXPENDITURES
Function 81 - Facility Acq. & Constr.Payroll Costs 0 0 n/aPurchased & Contracted Services 0 0 n/aSupplies & Materials 0 0 n/aOther Operating Expenses 0 0 n/aCapital Outlay 864,260 9,900,000 1,045.5
Total - 81 Facility Acq. & Constr. 864,260 9,900,000 1,045.5
Total Expenditures 864,260 9,900,000 1,045.5
Excess / (Deficit) (842,655) (9,900,000)
New North Elementary Fund (671)
2012-2013 Adopted BudgetStatement of Revenue and Expenditures
Table 30Frenship Independent School District
Page 104

2011-12 2012-13Unaudited Adopted
Totals Budget % to LYREVENUE
Property Taxes 0 0 n/aTuition and Fees 0 0 n/aInterest Earnings 0 0 n/aOther Revenues 0 0 n/a
Total Local Revenue 0 0 n/a
EXPENDITURES
Function 81 - Facility Acq. & Constr.Payroll Costs 0 0 n/aPurchased & Contracted Services 0 0 n/aSupplies & Materials 0 0 n/aOther Operating Expenses 0 0 n/aCapital Outlay 1,821,975 100,000 (94.5)
Total - 81 Facility Acq. & Constr. 1,821,975 100,000 (94.5)
Total Expenditures 1,821,975 100,000 (94.5)
Excess / (Deficit) (1,821,975) (100,000)
Heritage Middle School Fund (672)
2012-2013 Adopted BudgetStatement of Revenue and Expenditures
Table 31Frenship Independent School District
Page 105

2011-12 2012-13Unaudited Adopted
Totals Budget % to LYREVENUE
Property Taxes 0 0 n/aTuition and Fees 0 0 n/aInterest Earnings 0 0 n/aOther Revenues 0 0 n/a
Total Local Revenue 0 0 n/a
EXPENDITURES
Function 81 - Facility Acq. & Constr.Payroll Costs 0 0 n/aPurchased & Contracted Services 0 0 n/aSupplies & Materials 0 0 n/aOther Operating Expenses 0 0 n/aCapital Outlay 6,232 0 n/a
Total - 81 Facility Acq. & Constr. 6,232 0 n/a
Total Expenditures 6,232 0
Excess / (Deficit) (6,232) 0
Elementary Renovations Fund (673)
2012-2013 Adopted BudgetStatement of Revenue and Expenditures
Table 32Frenship Independent School District
Page 106

2011-12 2012-13Unaudited Adopted
Totals Budget % to LYREVENUE
Property Taxes 0 0 n/aTuition and Fees 0 0 n/aInterest Earnings 0 0 n/aOther Revenues 0 0 n/a
Total Local Revenue 0 0 n/a
EXPENDITURES
Function 81 - Facility Acq. & Constr.Payroll Costs 0 0 n/aPurchased & Contracted Services 66,900 0 n/aSupplies & Materials 0 0 n/aOther Operating Expenses 0 0 n/aCapital Outlay 2,550 1,000,000 39,115.7
Total - 81 Facility Acq. & Constr. 69,450 1,000,000 1,339.9
Total Expenditures 69,450 1,000,000 1,339.9
Excess / (Deficit) (69,450) (1,000,000)
Maintenance Projects - 2007 Bond Fund (674)
2012-2013 Adopted BudgetStatement of Revenue and Expenditures
Table 33Frenship Independent School District
Page 107
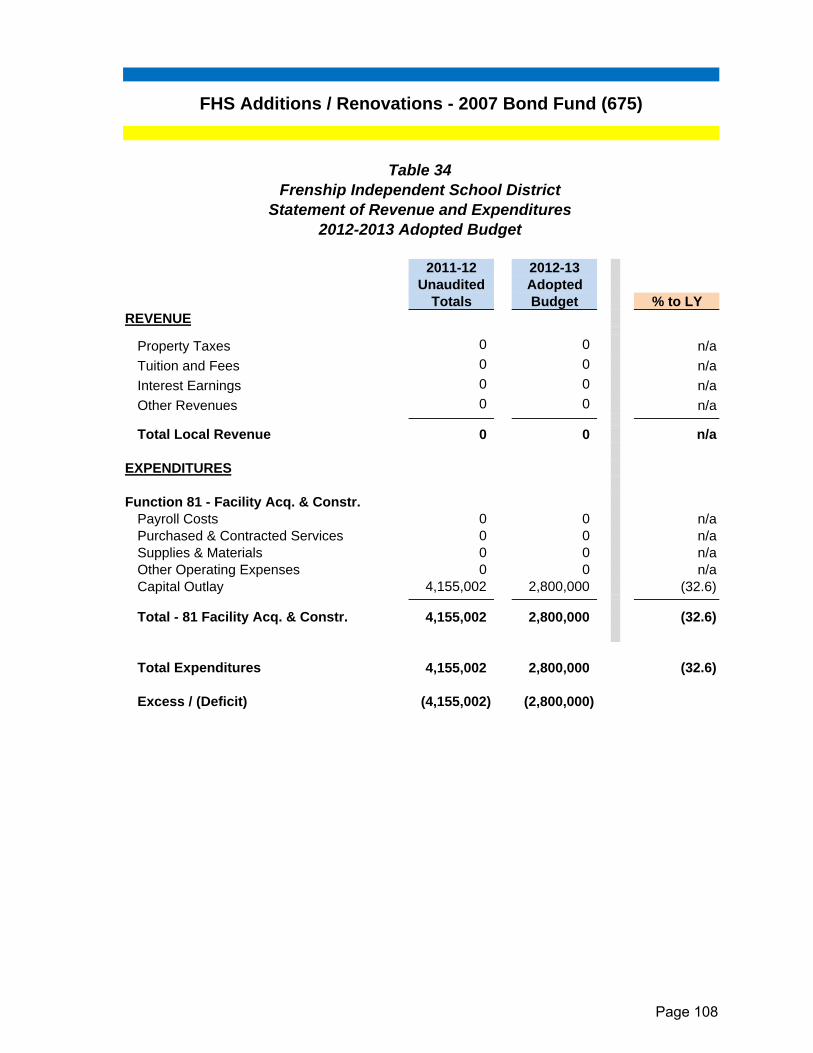
2011-12 2012-13Unaudited Adopted
Totals Budget % to LYREVENUE
Property Taxes 0 0 n/aTuition and Fees 0 0 n/aInterest Earnings 0 0 n/aOther Revenues 0 0 n/a
Total Local Revenue 0 0 n/a
EXPENDITURES
Function 81 - Facility Acq. & Constr.Payroll Costs 0 0 n/aPurchased & Contracted Services 0 0 n/aSupplies & Materials 0 0 n/aOther Operating Expenses 0 0 n/aCapital Outlay 4,155,002 2,800,000 (32.6)
Total - 81 Facility Acq. & Constr. 4,155,002 2,800,000 (32.6)
Total Expenditures 4,155,002 2,800,000 (32.6)
Excess / (Deficit) (4,155,002) (2,800,000)
FHS Additions / Renovations - 2007 Bond Fund (675)
2012-2013 Adopted BudgetStatement of Revenue and Expenditures
Table 34Frenship Independent School District
Page 108

2011-12 2012-13Unaudited Adopted
Totals Budget % to LYREVENUE
Property Taxes 0 0 n/aTuition and Fees 0 0 n/aInterest Earnings 0 0 n/aOther Revenues 0 0 n/a
Total Local Revenue 0 0 n/a
EXPENDITURES
Function 81 - Facility Acq. & Constr.Payroll Costs 0 0 n/aPurchased & Contracted Services 0 0 n/aSupplies & Materials 0 0 n/aOther Operating Expenses 0 0 n/aCapital Outlay 271,389 0 (100.0)
Total - 81 Facility Acq. & Constr. 271,389 0 (100.0)
Total Expenditures 271,389 0 (100.0)
Excess / (Deficit) (271,389) 0
Technology Projects - 2007 Bond Fund (676)
2012-2013 Adopted BudgetStatement of Revenue and Expenditures
Table 35Frenship Independent School District
Page 109

2011-12 2012-13Unaudited Adopted
Totals Budget % to LYREVENUE
Property Taxes 0 0 n/aTuition and Fees 0 0 n/aInterest Earnings 0 0 n/aOther Revenues 0 0 n/a
Total Local Revenue 0 0 n/a
EXPENDITURES
Function 81 - Facility Acq. & Constr.Payroll Costs 0 0 n/aPurchased & Contracted Services 0 0 n/aSupplies & Materials 0 0 n/aOther Operating Expenses 0 0 n/aCapital Outlay 470,200 20,000 (95.7)
Total - 81 Facility Acq. & Constr. 470,200 20,000 (95.7)
Total Expenditures 470,200 20,000 (95.7)
Excess / (Deficit) (470,200) (20,000)
Transportation / Maintenance Facilities Fund (677)
2012-2013 Adopted BudgetStatement of Revenue and Expenditures
Table 36Frenship Independent School District
Page 110

2011-12 2012-13Unaudited Adopted
Totals Budget % to LYREVENUE
Property Taxes 0 0 n/aTuition and Fees 0 0 n/aInterest Earnings 0 0 n/aOther Revenues 0 0 n/a
Total Local Revenue 0 0 n/a
EXPENDITURES
Function 81 - Facility Acq. & Constr.Payroll Costs 0 0 n/aPurchased & Contracted Services 0 0 n/aSupplies & Materials 0 0 n/aOther Operating Expenses 0 0 n/aCapital Outlay 29,500 120,000 n/a
Total - 81 Facility Acq. & Constr. 29,500 120,000 n/a
Total Expenditures 29,500 120,000 n/a
Excess / (Deficit) (29,500) (120,000)
Casey Administration Building Fund (678)
2012-2013 Adopted BudgetStatement of Revenue and Expenditures
Table 37Frenship Independent School District
Page 111

2011-12 2012-13Unaudited Adopted
Totals Budget % to LYREVENUE
Property Taxes 0 0 n/aTuition and Fees 0 0 n/aInterest Earnings 0 0 n/aOther Revenues 0 0 n/a
Total Local Revenue 0 0 n/a
EXPENDITURES
Function 81 - Facility Acq. & Constr.Payroll Costs 0 0 n/aPurchased & Contracted Services 0 0 n/aSupplies & Materials 0 0 n/aOther Operating Expenses 0 0 n/aCapital Outlay 0 0 n/a
Total - 81 Facility Acq. & Constr. 0 0 n/a
Total Expenditures 0 0 n/a
Excess / (Deficit) 0 0
New South Elementary Fund (679)
2012-2013 Adopted BudgetStatement of Revenue and Expenditures
Table 38Frenship Independent School District
Page 112

Frenship Independent School District Other Funds Overview
Program Descriptions Fund 211 ESEA, Title I, Part A - Improving Basic Programs This fund classification is to be used to account, on a project basis, for funds allocated to local educational agencies to enable schools to provide opportunities for children served to acquire the knowledge and skills contained in the challenging State content standards and to meet the challenging State performance standards developed for all children. Note: This fund code is also used for ESEA Title I, Part D, Subpart 2 - LEA programs with locally operated correctional facilities. Fund 224 IDEA - Part B, Formula This fund classification is to be used to account, on a project basis, for funds granted to operate educational programs for children with disabilities. Fund 225 IDEA - Part B, Preschool This fund classification is to be used to account, on a project basis, for funds granted for preschool children with disabilities. Fund 244 Career and Technical - Basic Grant This fund classification is to be used to account, on a project basis, for funds granted to provide Career and Technical education to develop new and/or improve Career and Technical education programs for paid and unpaid employment. Full participation in the basic grant is from individuals who are members of special populations, at 1) a limited number of campuses (sites) or 2) a limited number of program areas. Fund 255 ESEA, Title II, Part A - Teacher & Principal Training & Recruiting This fund classification is to be used to provide financial assistance to increase student academic achievement through improving teacher and principal quality and increasing the number of highly qualified teachers in classrooms and highly qualified principals and assistant principals in schools. Fund 263 Title III, Part A - English Language Acquisition & Enhancement This fund classification is to be used to account, on a project basis, for funds granted to improve the education of limited English proficient children, by assisting the children to learn English and meet challenging State academic content and student academic achievement standards.
Page 113

Other Funds - Continued Fund 410 Instructional Materials Allotment This fund classification is to be allocated by the District to account for textbook needs, instructional materials needs, as well as technology needs. The funds for this allotment are determined by the Texas Education Agency and distributed on a two-year (biennial) basis. Fund 461 Campus Activity This fund classification is to be used to account for transactions related to a principal's activity fund that benefits students. Monies generated in these funds are not subject to recall by the school district’s Board of Trustees into the General Fund. Fund 499 Other Local This fund classification is used to account for local education grants such as Frenship Foundation for Leadership teacher grants or Lubbock Area Foundation teacher grants.
Page 114

ESEA Title I IDEA B IDEA B Vocational ESEA Title II Title III Principal's OtherPart A Formula Preschool Basic Grant Part A English Acq. Fund Local Total
211 224 225 244 255 263 461 499 Funds
REVENUE Local Sources 0 0 0 0 0 0 131,435 8,074 139,509State Sources 0 0 0 0 0 0 0 0 0Federal Sources 999,994 1,041,383 18,818 68,035 186,178 23,834 0 0 2,338,242 Total Revenue 999,994 1,041,383 18,818 68,035 186,178 23,834 131,435 8,074 2,477,751
EXPENDITURES
Function 11 Payroll Costs 810,711 847,567 18,818 0 64,574 6,000 0 0 1,747,670Instruction Purchased & Contracted Svcs 0 39,512 0 4,763 0 0 3,110 0 47,385
Supplies & Materials 166,283 5,630 0 41,501 0 0 3,000 8,074 224,488Other Operating Expenses 0 0 0 0 0 0 6,890 0 6,890Capital Outlay 0 0 0 10,000 0 0 0 0 10,000 Total - 11 976,994 892,709 18,818 56,264 64,574 6,000 13,000 8,074 2,036,433
Function 13 Payroll Costs 0 0 0 0 54,604 0 0 0 54,604Curriculum Purchased & Contracted Svcs 0 0 0 0 7,500 8,945 0 0 16,445
Supplies & Materials 0 0 0 0 32,500 3,500 0 0 36,000Other Operating Expenses 1,000 4,912 0 11,771 27,000 5,389 0 0 50,072Capital Outlay 0 0 0 0 0 0 0 0 0
Total - 13 1,000 4,912 0 11,771 121,604 17,834 0 0 157,121
Function 21 Payroll Costs 0 38,989 0 0 0 0 0 0 38,989Instr. Leadership Purchased & Contracted Svcs 10,000 0 0 0 0 0 0 0 10,000
Supplies & Materials 2,000 0 0 0 0 0 0 0 2,000Other Operating Expenses 0 0 0 0 0 0 0 0 0Capital Outlay 0 0 0 0 0 0 0 0 0
Total - 21 12,000 38,989 0 0 0 0 0 0 50,989
Function 23 Payroll Costs 0 0 0 0 0 0 0 0 0School Admin. Purchased & Contracted Svcs 0 0 0 0 0 0 0 0 0
Supplies & Materials 0 0 0 0 0 0 3,900 0 3,900Other Operating Expenses 0 0 0 0 0 0 34,381 0 34,381Capital Outlay 0 0 0 0 0 0 0 0 0
Total - 23 0 0 0 0 0 0 38,281 0 38,281
Function 31 Payroll Costs 0 104,773 0 0 0 0 0 0 104,773Counseling Purchased & Contracted Svcs 0 0 0 0 0 0 0 0 0
Supplies & Materials 0 0 0 0 0 0 0 0 0Other Operating Expenses 0 0 0 0 0 0 0 0 0Capital Outlay 0 0 0 0 0 0 0 0 0
Total - 31 0 104,773 0 0 0 0 0 0 104,773
Function 33 Payroll Costs 0 0 0 0 0 0 0 0Health Services Purchased & Contracted Svcs 0 0 0 0 0 0 0 0 0
Total - 33 0 0 0 0 0 0 0 0 0
Function 36 Payroll Costs 0 0 0 0 0 0 0 0 0Extracurricular Purchased & Contracted Svcs 0 0 0 0 0 0 0 0 0
Supplies & Materials 0 0 0 0 0 0 76,921 0 76,921Other Operating Expenses 0 0 0 0 0 0 3,233 0 3,233Capital Outlay 0 0 0 0 0 0 0 0 0
Total - 36 0 0 0 0 0 0 80,154 0 80,154
Function 61 Payroll Costs 0 0 0 0 0 0 0 0 0Community Svcs Purchased & Contracted Svcs 0 0 0 0 0 0 0 0 0
Supplies & Materials 0 0 0 0 0 0 0 0 0Other Operating Expenses 10,000 0 0 0 0 0 0 0 10,000Capital Outlay 0 0 0 0 0 0 0 0 0
Total - 61 10,000 0 0 0 0 0 0 0 10,000
Total Expenditures 999,994 1,041,383 18,818 68,035 186,178 23,834 131,435 8,074 2,477,751
Excess / (Deficit) 0 0 0 0 0 0 0 0 0
Special Revenue Funds
2012-2013 BudgetStatement of Revenue and Expenditures
Table 39
Page 115

FRENSHIP INDEPENDENT SCHOOL DISTRICT
INFORMATIONAL SECTION
Page 116

Certified %Tax Year as of Jan 1 Taxable Value Change
2000 727,461,499 10.82001 801,080,664 10.12002 897,025,268 12.02003 1,019,385,234 13.62004 1,106,662,207 8.62005 1,341,799,710 21.22006 1,529,625,268 14.02007 1,740,013,292 13.82008 1,948,898,856 12.02009 2,195,849,461 12.72010 2,306,627,139 5.02011 2,383,627,671 3.32012 2,519,283,884 5.72013 2,637,614,619 4.72014 2,743,119,204 4.02015 2,852,843,972 4.02016 2,966,957,731 4.0
= Projected Values
Table 40
Taxable Value History and Future ProjectionsFrenship Independent School District
Table 41Taxable Value Projections
0.0
0.5
1.0
1.5
2.0
2.5
3.0
3.5
2000 2001 2002 2003 2004 2005 2006 2007 2008 2009 2010 2011 2012 2013 2014 2015 2016
Values in
Billions
Tax Year
Page 117

Fiscal M&O I&S Total Taxable Total Current TotalYear Rate* Rate* Tax Rate Values Levy Collections % Collections %
2003 1.41110 0.23050 1.64160 1,019,385,234 16,734,228 16,240,542 97.0 16,469,176 98.4
2004 1.41110 0.21950 1.63060 1,106,662,207 18,881,941 18,568,069 98.3 18,884,254 100.0
2005 1.41110 0.26950 1.68060 1,341,799,710 22,550,286 21,917,047 97.2 22,300,302 98.9
2006 1.41110 0.29950 1.71060 1,529,625,268 26,165,770 25,654,687 98.0 26,018,016 99.4
2007 1.29120 0.27360 1.56480 1,740,013,292 27,227,727 26,584,115 97.6 26,943,654 99.0
2008 1.04000 0.46000 1.50000 1,948,898,856 29,234,457 28,774,818 98.4 29,185,753 99.8
2009 1.04000 0.46000 1.50000 2,195,849,461 32,553,962 32,007,788 98.3 32,362,442 99.4
2010 1.04005 0.45870 1.49875 2,306,627,139 34,446,029 34,011,319 98.7 34,393,800 99.8
2011 1.04005 0.46000 1.50005 2,383,627,671 35,963,755 35,377,037 98.4 35,747,764 99.4
2012 1.04005 0.46000 1.50005 2,519,283,884 37,498,562 36,929,937 98.5 37,385,725 99.7
* Per $100 of Taxable Values
Table 42Frenship Independent School District
Property Tax Levies & CollectionsLast 10 Years
Table 43
0.00
0.200.400.60
0.801.00
1.201.40
1.601.80
2003 2004 2005 2006 2007 2008 2009 2010 2011 2012
1.41 1.41 1.41 1.41 1.291.04 1.04 1.04 1.04 1.04
0.23 0.22 0.27 0.300.27
0.46 0.46 0.46 0.46 0.46
Tax Rate HistoryPer $100 Taxable Value
M&O I&S
Page 118

TaxTaxpayer Category Assessment
1 Canyon Hub Holdings L.P. Retail Center 21,370,509
2 RR IL Care Group L.P. Senior Living 17,835,363
3 Wal Mart Real Estate Business Trust Retail Stores 16,500,000
4 RR AL Care Group L.P. Assisted Living 13,853,862
5 MC Ashton Pointe L.C. Apartments 13,200,000
6 EDR Lubbock L.P. Apartments 12,742,663
7 Golden Spread Electric Coop Utilities 12,587,500
8 Dakota Arms Apartments 11,371,911
9 Scott Manufacturing Inc. Industrial 10,037,408
10 Sagewood Properties L.L.C. Apartments 9,896,132
Table 44
2012 Top Ten TaxpayersFrenship Independent School District
Page 119

Budget2005‐06 2006‐07 2007‐08 2008‐09 2009‐10 2010‐11 2011‐12 2012‐13
Assessed/Market Value of a Home 102,142$ 108,470$ 114,465$ 120,347$ 123,200$ 126,245$ 129,462$ 131,443$
Average Taxable Value 91,453 98,144 104,150 109,521 112,485 115,762 118,576 121,081
Total Property Tax Rate 1.7106$ 1.5648$ 1.5001$ 1.5001$ 1.4988$ 1.5001$ 1.5001$ 1.5001$
Property Tax Due 1,564$ 1,536$ 1,562$ 1,643$ 1,686$ 1,736$ 1,779$ 1,816$
Increase in Taxes (29)$ 27$ 107$ 124$ 94$ 93$ 38$
Property Tax Percent Increase from Prior Year ‐1.8% 1.7% 5.2% 2.6% 3.0% 2.4% 2.1%
Increase in Average Taxable Value 2,505$
Tax Increase (Decrease) due to Values 38$ Tax Increase (Decrease) due to Rate ‐$
Table 45Tax Rate Impact to District's Taxpayers
This schedule shows the trends in property values and tax rates. Each year the Lubbock County Appraisal District appraises property based on market conditions such as sales in the surrounding areas. The above schedule shows how market conditions have affected the assessed value through 2012‐13 based on the overall appraisal value trends in the District. As shown above, the average value of a residence in the District continues to rise annually.
$1,564 $1,536 $1,562$1,643
$1,686$1,736 $1,779 $1,816
$500
$800
$1,100
$1,400
$1,700
$2,000
2005-06 2006-07 2007-08 2008-09 2009-10 2010-11 2011-12 2012-13
Table 46Property Tax History
Page 120

2007-08 2008-09 2009-10 2010-11 2011-12 Projected Chg vs. LY
North Ridge Elementary 777 771 772 775 796 771 (25)Crestview Elementary 780 825 472 481 508 493 (15)Westwind Elementary 588 636 655 695 665 655 (10)Willow Bend Elementary 533 533 543 562 566 586 20Bennett Elementary 809 874 788 765 767 743 (24)Oak Ridge Elementary - - 520 542 563 571 8 ELEMENTARY TOTAL 3,487 3,639 3,749 3,821 3,865 3,819 (46) % Change 7.9% 4.4% 3.0% 1.9% 1.2% -1.2%
Frenship Middle School 788 800 842 890 566 535 (31)Terra Vista Middle School 687 750 754 821 555 579 24Heritage Middle School 664 765 101Frenship High School 1,506 1,624 1,751 1,795 1,842 1,985 143
Reese Alternative Center 112 106 104 85 85 85 0
SECONDARY TOTAL 3,093 3,280 3,450 3,591 3,712 3,949 237
% Change 5.2% 6.0% 5.2% 4.1% 3.4% 6.4%
TOTAL ENROLLMENT 6,580 6,919 7,200 7,412 7,577 7,768 191
# Increase (Decrease) 408 339 281 213 165 191 % Change 6.6% 5.2% 4.1% 3.0% 2.2% 2.5%
Average Daily Attendance 6,319 6,662 6,924 7,145 7,352 7,481 129 % of Enrollment 96.0% 96.3% 96.2% 96.4% 97.0% 96.3%
# Increase (Decrease) 394 343 262 221 207 129 % Change 6.6% 5.4% 3.9% 3.2% 2.9% 1.7%
Table 47
2012-13Total Year Avg. - PEIMS Summer Collection
Student Enrollment Summary(Based on PEIMS Days Membership)
Frenship Independent School District
Page 121

Summer PEIMS Data
2007 - 08 2008 - 09 2009 - 10 2010 - 11 2011 - 12 2012 - 13 2013 - 14 2014-15 2015-16
Enrollment (Days Membership) 6,580 6,919 7,202 7,412 7,576 7,768 8,007 8,246 8,485% Chg 5.2 4.1 2.9 2.2 2.5 3.1 3.0 2.9
Total Refined ADA 6,319 6,662 6,924 7,145 7,352 7,481 7,711 7,941 8,171% Chg 5.4 3.9 3.2 2.9 1.7 3.1 3.0 2.9
Ratio to Enrollment 96.0 96.3 96.1 96.4 97.0 96.3 96.3 96.3 96.3
Hold 96.3% ratesteady in future years
Weighted ADA 7,714 8,067 8,398 8,672 8,411 8,971 9,245 9,520 9,800% Chg 4.6 4.1 3.3 (3.0) 6.7 3.1 3.0 2.9
Increase versus ADA 22.1 21.1 21.3 21.4 14.4 19.9 19.9 19.9 19.9
The Enrollment (Days Membership) projections use the District's demographer report as a basis for the percent increases over the next 4 years.Average Daily Attendance (ADA) is calculated from the Enrollment number using a historical average attendance rate of 96.3%. The WeightedADA is calculated by a gross-up of the ADA numbers using a projected gross-up percent obtained from the State Funding Template.
Actual Results Projected
Frenship ISDStudent Projections for Long-Range Planning
Page 122

A significant portion of the annual operating budget is dedicated to staffing and the related salary and benefits costs (approximately 80%).To effectively control operating costs of the District, on-going monitoring must be performed for all staffing areas. State laws placerestrictions on classroom staffing for the kindergarten through 4th grade levels to a 22:1 ratio. To go above this ratio level, the Districtwould need to obtain approved waivers from the state's Education commissioner. At the secondary level along with grade 5, the Districtstrives to maintain a 25;1 ratio, though certain classes may exceed this level or be lower.
2008-09 2009-10 2010-11 2011-12 2012-13
Teachers 510 541 546 545 532(Classroom, Interventionists, Special Programs)
Professional Support 79 91 92 89 91(Directors, Counselors, Librarians, Campus Office Staff,Central Office Staff)
School Leadership 28 28 29 31 31(Principals, Asst. Principals)
Central Administration 10 9 8 7 7(Superintendent, Asst. Superintendents, Cabinet-LevelPositions)
Aides 90 100 99 103 101
Auxiliary 149 167 172 173 172
Total Staff (Fall Snapshot) 866 934 945 948 934
Student Enrollment (Total Membership - Fall Snapshot) 6,919 7,200 7,412 7,577 7,7683.8 4.1 2.9 2.2 2.5
Student-to-Staff RatiosTeaching Staff 13.6 13.3 13.6 13.9 14.6Total Staff 8.0 7.7 7.8 8.0 8.3
Table 48
Staffing HistoryFrenship Independent School District
StaffingFrenship Independent School District
Page 123

Frenship Independent School District Long-Range Projection Assumptions
• Budgeted revenue for local taxes and state aid in 2011-12 and 2012-13 are
based on the funding laws enacted in Senate Bill 1 from the 82nd Texas Legislature. For this revenue in years 2013-14, 2014-15, and 2015-16, the Senate Bill 1 laws are assumed to remain in place. More changes in the public education funding laws are highly possible from the Texas legislature in 2013.
• Enrollment numbers reflect the projections shown in our demographer’s report in
summer 2012. The attendance rate of 96.3% is the historical average for the District and is used to calculate the annual Average Daily Attendance (ADA) number. This number is a major driver in determining the amount of state funding for each fiscal year.
• The Maintenance and Operations (M&O) tax rate is assumed to remain at $1.04
per $100 of taxable value. No current plans to hold a Tax Ratification Election (TRE) to increase the rate up to the maximum of $1.17.
• Salary increases are assumed to be 1.5% per year along with non-payroll
expenditure increases of 1% per year. Additions to teaching and administrative staff are included to maintain current student-to-teacher ratios as the District grows in student enrollment.
• With the planned opening of a new elementary school in Fall 2014-15, additional
staff and operations costs are included in 2014-15 and 2015-16.
• Budget projections are planned to include an effort to maintain a strong, healthy fund balance reserve of at least 20% of operating expenditures to preserve financial and cash flow stability.
Page 124

Audited Unaudited Adopted Estimate Estimate Estimate2010-11 2011-12 2012-13 2013-14 2014-15 2015-16
Enrollment - Membership 7,412 7,577 7,768 8,007 8,246 8,485 % Increase to LY 2.2 2.5 3.1 3.0 2.9
ADA 7,145 7,352 7,481 7,711 7,941 8,171 Attendance Rate % 96.4 97.0 96.3 96.3 96.3 96.3 # change 221 207 129 230 230 230 % Increase to LY 3.2 2.9 1.8 3.1 3.0 2.9
M&O Tax Rate 1.0401 1.0401 1.0401 1.0401 1.0401 1.0401
M&O Compressed Tax Rate 0.9407 0.9407 0.9407 0.9407 0.9407 0.9407
Total State / Local Revenue (Prior Law) 48.2 51.3 52.3 53.9 55.5 57.1 % change 6.5 1.9 3.0 3.0 2.9
State Funding Reduction (3.0) (4.4) (4.5) (4.6) (4.8)
Total State / Local Revenue per Template 48.2 48.3 47.9 49.4 50.8 52.3 % Increase 0.2 (0.8) 3.0 3.0 2.9
Other Revenues 6.2 4.1 3.6 3.7 3.8 3.9
General Fund Revenues 54.3 52.4 51.5 53.0 54.6 56.2 % Increase 5.1 (3.5) (1.7) 3.0 2.9 2.9
General Fund Expenditures 52.0 52.3 52.8 53.9 55.0 56.1 % Increase 1.1 0.5 1.0 2.0 2.0 2.0
Net Increase (Decrease) in Fund Balance 2.3 0.1 (1.3) (.8) (.3) .1
Beginning Fund Balance 13.1 15.4 15.6 14.3 13.5 13.1
Ending Fund Balance 15.4 15.6 14.3 13.5 13.1 13.2
As % of Expenditures 29.7% 29.8% 27.1% 25.0% 23.9% 23.6%
Table 49Frenship Independent School District
Future Years Budget ProjectionsThrough Fiscal Year 2015 / 2016
($ in Millions)
General Fund
Page 125

Audited Unaudited Adopted Estimate Estimate Estimate2010-11 2011-12 2012-13 2013-14 2014-15 2015-16
Revenues5700 Local
Food Service Activity 1,433,788$ 1,430,000$ 1,446,731$ 1,504,600$ 1,564,784$ 1,627,376$ Interest Earnings 4,305 12,000 5,000 5,500 6,000 6,500
Total 1,438,093 1,442,000 1,451,731 1,510,100 1,570,784 1,633,876
5800 State 18,728 19,000 19,016 19,000 19,000 19,000
5900 Federal NSLP Breakfast Reimbursements 334,498$ 365,000$ 332,725$ 342,707$ 352,988$ 363,578$ NSLP Lunch Reimbursements 1,118,497 1,190,000 1,143,450 1,177,754 1,213,086 1,249,479 USDA Donated Commodities 217,047 170,000 156,770 170,000 175,000 180,000
Total 1,670,042 1,725,000 1,632,945 1,690,460 1,741,074 1,793,056
Total Revenues 3,126,863 3,186,000 3,103,692 3,219,560 3,330,858 3,445,932
Expenditures6200 Purchased & Contracted Services 2,658,850$ 2,720,000$ 2,859,100$ 2,916,282$ 2,974,608$ 3,034,100$ 6300 Supplies & Materials 225,732 180,000 177,270 180,815 184,432 188,120 6400 Other Operating Expense 18,287 36,000 37,000 37,740 38,495 39,265 6600 Capital Outlay - - 350,000 - 200,000 50,000
Total Expenditures 2,902,869 2,936,000 3,423,370 3,134,837 3,397,534 3,311,485
Excess (Deficit) 223,994 250,000 (319,678) 84,723 (66,676) 134,447
Beginning Fund Balance - September 1 422,346$ 646,340 896,340 576,662 661,385 594,709
Ending Fund Balance - August 31 646,340$ 896,340 576,662 661,385 594,709 729,156
Audited Unaudited Adopted Estimate Estimate Estimate2010-11 2011-12 2012-13 2013-14 2014-15 2015-16
Revenues5700 Local
Property Taxes 11,054,111$ 11,570,000$ 12,007,789$ 12,000,000$ 12,000,000$ 12,000,000$ Interest Earnings 14,945 21,000 20,000 22,000 24,000 26,000
Total 11,069,056 11,591,000 12,027,789 12,022,000 12,024,000 12,026,000
5800 State IFA and EDA Allotments 857,037 780,000 505,898 450,000 300,000 150,000
Total Revenues 11,926,093 12,371,000 12,533,687 12,472,000 12,324,000 12,176,000
6500 Debt Service Principal 1,692,262 3,454,413 3,324,926 4,430,463 4,659,219 4,749,362 Interest 10,085,932 8,150,493 8,627,893 8,397,687 8,415,150 8,067,548 Fees 11,255 25,000 25,000 25,000 25,000 25,000
Total Expenditures 11,789,449 11,629,906 11,977,819 12,853,150 13,099,369 12,841,910
Excess (Deficit) 136,644 741,094 555,868 (381,150) (775,369) (665,910)
Beginning Fund Balance - September 1 4,429,993 4,566,637$ 5,307,731$ 5,863,599$ 5,482,449$ 4,707,080$
Ending Fund Balance - August 31 4,566,637$ 5,307,731$ 5,863,599$ 5,482,449$ 4,707,080$ 4,041,170$
Debt Services Fund
Expenditures
Student Nutrition Fund
Table 50Frenship Independent School District
Future Years Budget ProjectionsThrough Fiscal Year 2015 / 2016
Student Nutrition Fund and Debt Service Fund
Page 126

Initial Number Of TotalYear of Building Portable Portable Building/Service Sq. Ft. Classrooms Sq. Ft. Portable Sq. Ft.
Elementary CampusesNorth Ridge 1985 112,969 4 4,800 117,769Crestview 1989 93,240 2 4,560 97,800Bennett 1990 131,671 4 5,220 136,891Westwind 1995 105,535 0 0 105,535Willow Bend 2006 98,650 0 0 98,650Oak Ridge 2009 108,000 0 0 108,000Total Elementary (6) 650,065 10 14,580 664,645
Secondary CampusesFrenship Middle School 1936 184,563 0 0 184,563Terra Vista Middle School 2006 159,910 0 0 159,910Heritage Middle School 2011 159,858 0 0 159,858Frenship High School 1982 516,454 0 0 516,454Total Secondary (4) 1,020,785 0 0 1,020,785
Alternative CampusReese Education Center 1954 46,097 1 1,862 47,959
Total Instructional (11) 1,716,947 11 16,442 1,733,389
Other BuildingsCasey Professional 1952 83,734 0 0 83,734Transportation Facility 1983 10,362 0 0 10,362Central Distribution Center 1986 5,000 0 0 5,000Maintenance Facility 2010 14,945 0 0 14,945Voc Ag Animal Pens 2010 11,589 0 0 11,589Voc Ag Show Pavilion 2010 18,750 0 0 18,750Performing Arts Center 2012 48,000 0 0 48,000Total Other Buildings (7) 192,380 0 0 192,380
Total District (17) 1,909,327 11 16,442 1,925,769
Table 51
District Buildings - Square Footage and Opening DateFrenship Independent School District
Page 127

Kim Spicer, Principal
902 North Dowden RoadWolfforth, Texas 79382
806-866-4440
2008-09 2009-10 2010-11 2011-12 2012-13
Enrollment 1,647 1,781 1,824 1,885 1,967(PEIMS Membership)
Student / Teacher Ratio 12.8 13.4 13.5 13.9 14.6
Staff FTEsProfessional
Teachers 128.4 133.4 135.0 135.8 134.6Campus Administration 7.0 7.0 7.0 7.0 7.0Professional Support 12.7 11.6 12.5 12.7 13.0
SupportEducational Aides 6.7 7.0 5.0 9.0 9.6
Total 154.8 159.0 159.5 164.5 164.2
2008-09 2009-10 2010-11 2011-12 2012-13Audited Audited Audited Unaudited Budget
Expenditures (All Funds)By Object
Payroll 6100 8,488,188 9,117,450 9,764,326 9,666,328 9,642,820Contracted Services 6200 1,125,248 1,346,012 1,278,173 1,136,233 1,066,584Supplies & Materials 6300 1,387,255 1,091,360 1,132,790 895,953 891,450Other Operating Costs 6400 555,154 603,110 599,604 555,820 550,474
Total Maint. & Operations 11,555,846 12,157,931 12,774,893 12,254,334 12,151,328Capital Outlay 6600 12,548,296 12,722,407 10,228,355 3,837,989 1,832,000
Total Campus 24,104,142 24,880,339 23,003,248 16,092,323 13,983,328
By ProgramRegular Education 11 5,359,155 5,485,654 5,533,008 5,438,830 5,575,952Gifted & Talented 21 8,210 2,560 4,384 1,835 2,146Career & Technology 22 1,960,324 1,981,265 2,006,229 1,751,786 1,610,213Special Education 23 506,628 466,764 480,477 464,115 473,162Accelerated Education 24,30 97,186 80,157 88,879 80,730 67,452Bilingual / ESL 25 760 1,567 1,512 3,282 2,280Athletics 91 1,245,287 1,398,230 1,526,976 1,365,298 1,277,536Other Education 26,28,29,31,99 2,378,298 2,741,734 3,133,428 3,148,459 3,142,587
Total Maint. & Operations 11,555,846 12,157,931 12,774,893 12,254,334 12,151,328Capital Outlay 6600 12,548,296 12,722,407 10,228,355 3,837,989 1,832,000
Total Campus 24,104,142 24,880,339 23,003,248 16,092,323 13,983,328
Per Student Cost 7,016 6,826 7,004 6,501 6,178(excluding Capital Outlay)
2008 2009 ** 2010 ** 2011 2012TAKS Assessment Results
Reading 97% 96% 97% 95% n/aMath 85% 87% 86% 86% n/aWriting n/a n/a n/a n/a n/aSocial Studies 96% 97% 98% 97% n/aScience 87% 88% 91% 91% n/a
School Rating Recognized Recognized Recognized Academically Academically (With TPM) Acceptable Acceptable
** 2009 & 2010 uses "Met Standard",excludes TPM
Frenship High School
Page 128

Farley Reeves, Principal
9421 West 4th StreetLubbock, Texas 79416
806-885-4910
2008-09 2009-10 2010-11 2011-12 2012-13
Enrollment 109 102 85 80 92(PEIMS Membership)
Student / Teacher Ratio 7.4 5.4 6.1 5.4 7.1
Staff FTEsProfessional
Teachers 14.8 18.8 14.0 14.9 13.0Campus Administration 2.0 2.0 3.0 2.0 2.0Professional Support 2.2 2.9 1.0 0.0 0.3
SupportEducational Aides 6.0 5.0 5.0 5.0 3.0
Total 25.0 28.7 23.0 21.9 18.3
2008-09 2009-10 2010-11 2011-12 2012-13Audited Audited Audited Unaudited Budget
ExpendituresBy Object
Payroll 6100 1,271,966 1,438,068 1,359,493 1,210,526 1,182,398Contracted Services 6200 98,312 157,432 134,179 105,475 98,241Supplies & Materials 6300 126,737 79,237 31,973 56,283 44,068Other Operating Costs 6400 14,397 14,661 23,911 7,965 15,150
Total Maint. & Operations 1,511,412 1,689,398 1,549,556 1,380,248 1,339,857Capital Outlay 6600 525,849 135,565 12,693 3,650 0
Total Campus 2,037,261 1,824,963 1,562,248 1,383,898 1,339,857
By ProgramRegular Education 11 61,672 73,646 53,474 37,157 26,707Gifted & Talented 21 0 0 0 0 0Career & Technology 22 43,286 85,808 58,830 55,889 54,612Special Education 23 37,245 38,881 52,737 42,457 43,454Accelerated Education 24,30 115,693 672,360 126,003 125,495 94,066Bilingual / ESL 25 542 810 514 0 0Athletics 91 0 0 0 0 0Other Education 26,28,29,99 1,252,973 817,893 1,257,996 1,119,251 1,121,018
Total Maint. & Operations 1,511,412 1,689,398 1,549,556 1,380,248 1,339,857Capital Outlay 6600 525,849 135,565 12,693 3,650 0
Total Campus 2,037,261 1,824,963 1,562,248 1,383,898 1,339,857
Per Student Cost 13,866 16,563 18,230 17,253 14,564(excluding Capital Outlay)
2008 2009 ** 2010 ** 2011 2012TAKS Assessment Results
Reading n/a n/a n/a n/a n/aMath n/a n/a n/a n/a n/aWriting n/a n/a n/a n/a n/aSocial Studies n/a n/a n/a n/a n/aScience n/a n/a n/a n/a n/a
School Rating n/a n/a n/a n/a n/a (With TPM)
** 2009 & 2010 uses "Met Standard",excludes TPM
Reese Education Center
Page 129

Jerry Jerabek, Principal
500 Main StreetWolfforth, Texas 79382
806-866-4464
2008-09 2009-10 2010-11 2011-12 2012-13
Enrollment 799 844 883 562 558(PEIMS Membership)
Student / Teacher Ratio 12.2 12.1 12.3 10.8 12.4
Staff FTEsProfessional
Teachers 65.3 69.5 71.5 51.9 44.9Campus Administration 5.0 3.0 3.0 3.0 3.0Professional Support 5.3 7.2 5.4 4.2 5.3
SupportEducational Aides 8.9 7.5 7.2 8.5 8.5
Total 84.5 87.2 87.1 67.6 61.7
2008-09 2009-10 2010-11 2011-12 2012-13Audited Audited Audited Unaudited Budget
ExpendituresBy Object
Payroll 6100 4,508,834 4,798,089 4,820,769 3,743,837 3,615,420Contracted Services 6200 286,780 282,600 335,621 247,262 263,527Supplies & Materials 6300 328,313 245,169 205,672 169,222 138,650Other Operating Costs 6400 58,367 66,572 59,066 41,646 30,355
Total Maint. & Operations 5,182,294 5,392,429 5,421,127 4,201,968 4,047,952Capital Outlay 6600 3,805,137 959,120 66,905 0 0
Total Campus 8,987,431 6,351,549 5,488,032 4,201,968 4,047,952
By ProgramRegular Education 11 3,419,092 3,534,686 3,444,144 2,484,041 2,152,197Gifted & Talented 21 63,101 57,372 61,113 61,725 60,442Career & Technology 22 819 26,340 20,303 23,029 3,500Special Education 23 375,848 392,948 471,985 372,522 429,621Accelerated Education 24,30 95,092 140,514 137,100 85,243 97,244Bilingual / ESL 25 1,579 4,065 835 683 570Athletics 91 191,245 184,624 164,013 159,332 191,019Other Education 26,28,29,31,99 1,035,518 1,051,881 1,121,635 1,015,392 1,113,359
Total Maint. & Operations 5,182,294 5,392,429 5,421,127 4,201,968 4,047,952Capital Outlay 6600 3,805,137 959,120 66,905 0 0
Total Campus 8,987,431 6,351,549 5,488,032 4,201,968 4,047,952
Per Student Cost 6,486 6,389 6,139 7,477 7,254(excluding Capital Outlay)
2008 2009 ** 2010 ** 2011 2012TAKS Assessment Results
Reading 99% 99% 98% 97% n/aMath 97% 96% 97% 96% n/aWriting 99% 99% 98% 98% n/aSocial Studies 94% 97% 98% 99% n/aScience 78% 91% 94% 94% n/a
School Rating Academically Recognized Exemplary Recognized Recognized (With TPM) Acceptable
** 2009 & 2010 uses "Met Standard",excludes TPM
Frenship Middle School
Page 130

Brent Lowrey, Principal
1111 Upland AvenueLubbock, Texas 79416
806-796-0076
2008-09 2009-10 2010-11 2011-12 2012-13
Enrollment 752 757 813 567 568(PEIMS Membership)
Student / Teacher Ratio 11.7 11.4 12.2 11.6 12.7
Staff FTEsProfessional
Teachers 64.3 66.6 66.5 48.7 44.6Campus Administration 3.0 3.0 3.0 3.0 3.0Professional Support 9.7 10.0 7.9 3.1 4.9
SupportEducational Aides 8.6 8.3 8.5 6.5 6.5
Total 85.6 87.9 85.9 61.3 59.0
2008-09 2009-10 2010-11 2011-12 2012-13Audited Audited Audited Unaudited Budget
ExpendituresBy Object
Payroll 6100 4,260,048 5,132,958 5,229,316 3,948,415 3,437,588Contracted Services 6200 299,634 307,752 326,545 259,613 267,297Supplies & Materials 6300 322,400 209,650 182,368 180,163 138,346Other Operating Costs 6400 81,297 74,881 60,620 25,674 25,035
Total Maint. & Operations 4,963,378 5,725,241 5,798,850 4,413,865 3,868,266Capital Outlay 6600 378,854 100,057 22,592 180 0
Total Campus 5,342,233 5,825,298 5,821,443 4,414,045 3,868,266
By ProgramRegular Education 11 3,085,736 3,552,020 3,602,993 2,700,004 2,068,110Gifted & Talented 21 19,027 8,718 5,775 4,070 4,623Career & Technology 22 943 12,627 13,938 15,827 1,500Special Education 23 394,371 470,350 406,275 334,762 311,029Accelerated Education 24,30 391,157 385,834 360,236 85,641 77,118Bilingual / ESL 25 1,552 4,312 1,046 708 342Athletics 91 183,532 184,414 174,730 154,209 188,045Other Education 26,28,29,31,99 887,061 1,106,965 1,233,857 1,118,644 1,217,499
Total Maint. & Operations 4,963,378 5,725,241 5,798,850 4,413,865 3,868,266Capital Outlay 6600 378,854 100,057 22,592 180 0
Total Campus 5,342,233 5,825,298 5,821,443 4,414,045 3,868,266
Per Student Cost 6,600 7,563 7,133 7,785 6,810(excluding Capital Outlay)
2008 2009 ** 2010 ** 2011 2012TAKS Assessment Results
Reading 97% 96% 92% 96% n/aMath 91% 89% 90% 92% n/aWriting 99% 98% 99% 99% n/aSocial Studies 93% 94% 98% 95% n/aScience 74% 76% 87% 88% n/a
School Rating Academically Academically Exemplary Recognized Recognized (With TPM) Acceptable Acceptable
** 2009 & 2010 uses "Met Standard",excludes TPM
Terra Vista Middle School
Page 131

Greg Hernandez, Principal
6110 73rd StreetLubbock, Texas 79424
806-794-9400
2008-09 2009-10 2010-11 2011-12 2012-13
Enrollment 661 733(PEIMS Membership)
Student / Teacher Ratio 14.3 15.6
Staff FTEsProfessional
Teachers 46.2 47.1Campus Administration 3.0 3.0Professional Support 3.9 5.7
SupportEducational Aides 4.5 3.0
Total 57.6 58.8
2008-09 2009-10 2010-11 2011-12 2012-13Audited Audited Audited Unaudited Budget
ExpendituresBy Object
Payroll 6100 281,943 2,935,649 3,211,329Contracted Services 6200 36,157 211,460 248,961Supplies & Materials 6300 120,365 217,431 159,631Other Operating Costs 6400 6,296 33,442 33,955
Total Maint. & Operations 444,760 3,397,981 3,653,876Capital Outlay 6600 8,377,755 1,821,794 0
Total Campus 8,822,515 5,219,775 3,653,876
By ProgramRegular Education 11 194,097 2,103,599 2,195,675Gifted & Talented 21 0 8,396 5,127Career & Technology 22 0 18,274 1,617Special Education 23 12,071 160,918 145,131Accelerated Education 24,30 5,514 75,063 82,694Bilingual / ESL 25 0 890 570Athletics 91 55,852 151,965 185,058Other Education 26,28,29,31,99 177,226 878,875 1,038,004
Total Maint. & Operations 444,760 3,397,981 3,653,876Capital Outlay 6600 8,377,755 1,821,794 0
Total Campus 8,822,515 5,219,775 3,653,876
Per Student Cost 5,141 4,985(excluding Capital Outlay)
2008 2009 ** 2010 ** 2011 2012TAKS Assessment Results
Reading n/a n/aMath n/a n/aWriting n/a n/aSocial Studies n/a n/aScience n/a n/a
School Rating n/a n/a (With TPM)
Heritage Middle School
Page 132

Cheryl Booher, Principal
6302 11th PlaceLubbock, Texas 79416
806-793-6686
2008-09 2009-10 2010-11 2011-12 2012-13
Enrollment 777 782 794 810 820(PEIMS Membership)
Student / Teacher Ratio 16.0 16.4 16.4 17.6 17.4
Staff FTEsProfessional
Teachers 48.6 47.6 48.5 46.0 47.1Campus Administration 2.0 2.0 2.0 2.0 2.0Professional Support 5.0 5.3 4.7 5.0 4.0
SupportEducational Aides 10.0 9.0 9.0 9.3 10.8
Total 65.6 63.9 64.2 62.3 63.9
2008-09 2009-10 2010-11 2011-12 2012-13Audited Audited Audited Unaudited Budget
ExpendituresBy Object
Payroll 6100 3,113,889 3,166,732 3,195,483 3,054,263 3,203,791Contracted Services 6200 165,854 202,269 178,003 135,079 144,156Supplies & Materials 6300 271,879 162,935 145,709 134,230 105,140Other Operating Costs 6400 34,850 25,367 32,740 13,116 11,980
Total Maint. & Operations 3,586,472 3,557,303 3,551,936 3,336,689 3,465,067Capital Outlay 6600 1,101,871 7,688 16,167 0 0
Total Campus 4,688,343 3,564,991 3,568,102 3,336,689 3,465,067
By ProgramRegular Education 11 2,342,423 2,274,965 2,283,661 2,195,062 2,226,369Gifted & Talented 21 33,642 24,302 26,740 26,457 27,128Career & Technology 22 0 0 0 0 0Special Education 23 188,079 151,877 143,975 143,184 137,895Accelerated Education 24,30 338,713 319,870 331,297 253,781 268,924Bilingual / ESL 25 2,051 1,674 4,335 1,290 5,786Athletics 91 0 0 0 0 0Other Education 26,28,29,32,99 681,565 784,615 761,928 716,915 798,965
Total Maint. & Operations 3,586,472 3,557,303 3,551,936 3,336,689 3,465,067Capital Outlay 6600 1,101,871 7,688 16,167 0 0
Total Campus 4,688,343 3,564,991 3,568,102 3,336,689 3,465,067
Per Student Cost 4,616 4,549 4,473 4,119 4,226(excluding Capital Outlay)
2008 2009 ** 2010 ** 2011 2012TAKS Assessment Results
Reading 97% 99% 98% 98% n/aMath 98% 98% 98% 97% n/aWriting 97% 98% 100% 100% n/aSocial Studies n/a n/a n/a n/a n/aScience 90% 96% 96% 94% n/a
School Rating Recognized Exemplary Exemplary Exemplary Exemplary (With TPM)
** 2009 & 2010 uses "Met Standard",excludes TPM
North Ridge Elementary
Page 133

Stacy Davis, Principal
6020 81st streetLubbock, Texas 79382
806-794-3661
2008-09 2009-10 2010-11 2011-12 2012-13
Enrollment 816 468 482 507 548(PEIMS Membership)
Student / Teacher Ratio 16.4 14.4 14.8 16.4 16.7
Staff FTEsProfessional
Teachers 49.9 32.4 32.6 30.9 32.9Campus Administration 2.0 2.0 2.0 2.0 2.0Professional Support 5.0 4.5 4.4 4.0 3.2
SupportEducational Aides 10.0 9.0 8.9 7.0 5.9
Total 66.9 47.9 47.9 43.9 44.0
2008-09 2009-10 2010-11 2011-12 2012-13Audited Audited Audited Unaudited Budget
ExpendituresBy Object
Payroll 6100 3,206,169 2,309,943 2,385,984 2,300,138 2,185,096Contracted Services 6200 149,091 156,229 151,897 112,184 113,991Supplies & Materials 6300 230,370 101,363 99,400 142,209 65,512Other Operating Costs 6400 24,183 32,856 28,515 11,852 4,992
Total Maint. & Operations 3,609,813 2,600,391 2,665,795 2,566,382 2,369,591Capital Outlay 6600 897,963 8,609 11,084 0 0
Total Campus 4,507,776 2,608,999 2,676,879 2,566,382 2,369,591
By ProgramRegular Education 11 2,381,761 1,623,467 1,677,334 1,628,452 1,544,274Gifted & Talented 21 83,963 21,629 23,874 23,290 23,596Career & Technology 22 0 0 0 0 0Special Education 23 289,830 147,027 166,406 96,523 134,309Accelerated Education 24,30 159,193 112,264 94,108 90,851 59,528Bilingual / ESL 25 895 2,330 1,463 995 1,112Athletics 91 0 0 0 0 0Other Education 26,28,29,99 694,171 693,674 702,609 726,271 606,772
Total Maint. & Operations 3,609,813 2,600,391 2,665,795 2,566,382 2,369,591Capital Outlay 6600 897,963 8,609 11,084 0 0
Total Campus 4,507,776 2,608,999 2,676,879 2,566,382 2,369,591
Per Student Cost 4,424 5,556 5,531 5,062 4,324(excluding Capital Outlay)
2008 2009 ** 2010 ** 2011 2012TAKS Assessment Results
Reading 98% 98% 100% 98% n/aMath 98% 99% 98% 99% n/aWriting 99% 99% 94% 97% n/aSocial Studies n/a n/a n/a n/a n/aScience 98% 98% 97% 100% n/a
School Rating Exemplary Exemplary Exemplary Exemplary Exemplary (With TPM)
** 2009 & 2010 uses "Met Standard",excludes TPM
Crestview Elementary
Page 134

Todd Newberry, Principal
6401 43rd StreetLubbock, Texas 79407
806-799-3731
2008-09 2009-10 2010-11 2011-12 2012-13
Enrollment 664 669 708 701 685(PEIMS Membership)
Student / Teacher Ratio 15.6 15.8 15.9 16.5 17.0
Staff FTEsProfessional
Teachers 42.5 42.4 44.5 42.5 40.3Campus Administration 2.0 2.0 2.0 2.0 2.0Professional Support 5.0 5.7 5.6 4.8 4.6
SupportEducational Aides 10.0 8.8 10.0 10.0 10.0
Total 59.5 58.9 62.1 59.3 56.9
2008-09 2009-10 2010-11 2011-12 2012-13Audited Audited Audited Unaudited Budget
ExpendituresBy Object
Payroll 6100 2,931,305 3,013,155 3,176,707 2,962,279 2,877,247Contracted Services 6200 161,501 162,587 174,505 130,668 129,311Supplies & Materials 6300 349,363 199,663 207,526 140,600 188,068Other Operating Costs 6400 27,888 27,527 28,460 11,700 6,655
Total Maint. & Operations 3,470,057 3,402,932 3,587,198 3,245,247 3,201,281Capital Outlay 6600 665,420 0 17,816 2,583 0
Total Campus 4,135,476 3,402,932 3,605,014 3,247,829 3,201,281
By ProgramRegular Education 11 2,050,660 2,036,766 2,157,342 2,021,286 1,909,301Gifted & Talented 21 24,910 25,607 28,184 27,066 27,124Career & Technology 22 0 0 0 0 0Special Education 23 197,930 184,460 223,424 167,774 212,125Accelerated Education 24,30 453,665 431,809 380,162 208,561 313,979Bilingual / ESL 25 182 3,469 2,820 493 1,596Athletics 91 0 0 0 0 0Other Education 26,28,29,32,99 742,709 720,821 795,265 820,067 737,156
Total Maint. & Operations 3,470,057 3,402,932 3,587,198 3,245,247 3,201,281Capital Outlay 6600 665,420 0 17,816 2,583 0
Total Campus 4,135,476 3,402,932 3,605,014 3,247,829 3,201,281
Per Student Cost 5,226 5,087 5,067 4,629 4,673(excluding Capital Outlay)
2008 2009 ** 2010 ** 2011 2012TAKS Assessment Results
Reading 96% 98% 94% 95% n/aMath 91% 96% 93% 95% n/aWriting 95% 92% 97% 97% n/aSocial Studies n/a n/a n/a n/a n/aScience 89% 91% 89% 89% n/a
School Rating Recognized Exemplary Exemplary Recognized Recognized (With TPM)
** 2009 & 2010 uses "Met Standard",excludes TPM
Westwind Elementary
Page 135

Kathy Dawson, Principal
8816 13th StreetLubbock, Texas 79416
806-796-0090
2008-09 2009-10 2010-11 2011-12 2012-13
Enrollment 559 561 578 606 624(PEIMS Membership)
Student / Teacher Ratio 14.3 13.7 13.4 14.8 15.2
Staff FTEsProfessional
Teachers 39.0 41.0 43.0 41.0 41.0Campus Administration 2.0 2.0 2.0 2.0 2.0Professional Support 5.5 5.7 4.7 4.5 4.2
SupportEducational Aides 11.0 12.0 11.0 9.8 11.0
Total 57.5 60.7 60.7 57.3 58.2
2008-09 2009-10 2010-11 2011-12 2012-13Audited Audited Audited Unaudited Budget
ExpendituresBy Object
Payroll 6100 2,415,629 2,744,918 2,780,775 2,681,282 2,840,451Contracted Services 6200 222,485 242,870 211,862 167,447 156,759Supplies & Materials 6300 277,555 154,564 157,383 118,838 136,684Other Operating Costs 6400 38,547 39,044 34,745 17,872 8,192
Total Maint. & Operations 2,954,216 3,181,395 3,184,766 2,985,438 3,142,086Capital Outlay 6600 6,922 0 15,048 0 0
Total Campus 2,961,138 3,181,395 3,199,813 2,985,438 3,142,086
By ProgramRegular Education 11 1,583,819 1,695,579 1,746,037 1,631,563 1,709,605Gifted & Talented 21 16,727 16,628 17,039 16,445 20,415Career & Technology 22 0 0 0 0 0Special Education 23 212,166 210,746 217,094 193,236 203,509Accelerated Education 24,30 399,014 391,655 404,694 323,838 402,259Bilingual / ESL 25 32,319 25,301 36,300 37,660 50,642Athletics 91 0 0 0 0 0Other Education 26,28,29,32,99 710,170 841,485 763,602 782,697 755,656
Total Maint. & Operations 2,954,216 3,181,395 3,184,766 2,985,438 3,142,086Capital Outlay 6600 6,922 0 15,048 0 0
Total Campus 2,961,138 3,181,395 3,199,813 2,985,438 3,142,086
Per Student Cost 5,285 5,671 5,510 4,926 5,035(excluding Capital Outlay)
2008 2009 ** 2010 ** 2011 2012TAKS Assessment Results
Reading 92% 93% 96% 93% n/aMath 86% 91% 91% 89% n/aWriting 89% 94% 94% 85% n/aSocial Studies n/a n/a n/a n/a n/aScience 68% 89% 90% 90% n/a
School Rating Academically Exemplary Exemplary Recognized Recognized (With TPM) Acceptable
** 2009 & 2010 uses "Met Standard",excludes TPM
Willow Bend Elementary
Page 136

Michelle Elliott, Principal
101 Donald Preston DriveWolfforth, Texas 79382
806-866-4443
2008-09 2009-10 2010-11 2011-12 2012-13
Enrollment 876 811 779 785 780(PEIMS Membership)
Student / Teacher Ratio 15.4 15.2 14.4 15.2 15.8
Staff FTEsProfessional
Teachers 57.0 53.2 54.0 51.5 49.3Campus Administration 3.0 3.0 3.0 3.0 3.0Professional Support 7.8 8.8 8.6 7.4 6.4
SupportEducational Aides 19.0 22.0 23.0 23.0 24.7
Total 86.8 87.0 88.6 84.9 83.4
2008-09 2009-10 2010-11 2011-12 2012-13Audited Audited Audited Unaudited Budget
ExpendituresBy Object
Payroll 6100 3,973,547 3,972,157 4,020,267 3,712,446 3,707,939Contracted Services 6200 202,409 229,809 201,109 171,720 173,148Supplies & Materials 6300 347,244 213,312 175,170 147,290 115,348Other Operating Costs 6400 32,788 26,920 37,054 13,234 8,086
Total Maint. & Operations 4,555,988 4,442,197 4,433,600 4,044,690 4,004,521Capital Outlay 6600 99,182 7,065 48,308 0 0
Total Campus 4,655,170 4,449,262 4,481,908 4,044,690 4,004,521
By ProgramRegular Education 11 2,330,695 2,138,787 2,163,376 2,001,046 2,022,889Gifted & Talented 21 33,100 47,942 50,645 47,337 52,329Career & Technology 22 0 0 0 0 0Special Education 23 893,900 964,661 1,031,923 900,845 802,395Accelerated Education 24,30 373,806 371,828 310,517 208,317 238,394Bilingual / ESL 25 1,573 2,793 2,155 454 1,368Athletics 91 0 0 0 0 0Other Education 26,28,29,32,99 922,914 916,187 874,984 886,691 887,146
Total Maint. & Operations 4,555,988 4,442,197 4,433,600 4,044,690 4,004,521Capital Outlay 6600 99,182 7,065 48,308 0 0
Total Campus 4,655,170 4,449,262 4,481,908 4,044,690 4,004,521
Per Student Cost 5,201 5,477 5,691 5,152 5,134(excluding Capital Outlay)
2008 2009 ** 2010 ** 2011 2012TAKS Assessment Results
Reading 98% 99% 97% 96% n/aMath 95% 96% 95% 97% n/aWriting 99% 96% 93% 91% n/aSocial Studies n/a n/a n/a n/a n/aScience 94% 96% 98% 98% n/a
School Rating Exemplary Exemplary Exemplary Exemplary Exemplary (With TPM)
** 2009 & 2010 uses "Met Standard",excludes TPM
Bennett Elementary
Page 137

Doug Smith, Principal
6514 68th StreetLubbock, Texas 79407
806-794-5200
2008-09 2009-10 2010-11 2011-12 2012-13
Enrollment 0 519 546 564 592(PEIMS Membership)
Student / Teacher Ratio n/a 14.6 15.1 15.3 16.0
Staff FTEsProfessional
Teachers 0.0 35.5 36.2 36.9 37.0Campus Administration 0.0 2.0 2.0 2.0 2.0Professional Support 0.0 5.2 4.4 4.1 3.9
SupportEducational Aides 0.0 10.9 11.0 8.0 8.0
Total 0.0 53.6 53.6 51.0 50.9
2008-09 2009-10 2010-11 2011-12 2012-13Audited Audited Audited Unaudited Budget
ExpendituresBy Object
Payroll 6100 159,635 2,597,332 2,601,346 2,549,213 2,601,556Contracted Services 6200 23,633 175,857 153,077 121,980 126,826Supplies & Materials 6300 137,014 99,378 96,227 114,063 79,082Other Operating Costs 6400 1,678 16,412 27,053 7,198 7,111
Total Maint. & Operations 321,960 2,888,980 2,877,703 2,792,454 2,814,575Capital Outlay 6600 6,724,389 23,201 1,440 0 0
Total Campus 7,046,349 2,912,181 2,879,143 2,792,454 2,814,575
By ProgramRegular Education 11 140,455 1,706,720 1,791,768 1,750,658 1,756,994Gifted & Talented 21 7,465 21,962 24,836 22,838 23,592Career & Technology 22 0 0 0 0 0Special Education 23 22,120 283,159 216,075 206,589 262,277Accelerated Education 24,30 18,619 134,528 144,789 122,823 87,352Bilingual / ESL 25 0 1,320 927 298 2,280Athletics 91 0 0 0 0 0Other Education 26,28,29,99 133,302 741,289 699,308 689,249 682,080
Total Maint. & Operations 321,960 2,888,980 2,877,703 2,792,454 2,814,575Capital Outlay 6600 6,724,389 23,201 1,440 0 0
Total Campus 7,046,349 2,912,181 2,879,143 2,792,454 2,814,575
Per Student Cost n/a 5,566 5,271 4,951 4,754(excluding Capital Outlay)
2008 2009 ** 2010 ** 2011 2012TAKS Assessment Results
Reading n/a n/a 99% 99% n/aMath n/a n/a 99% 98% n/aWriting n/a n/a 100% 99% n/aSocial Studies n/a n/a n/a n/a n/aScience n/a n/a 100% 96% n/a
School Rating n/a n/a Exemplary Exemplary Exemplary (With TPM)
** 2009 & 2010 uses "Met Standard",excludes TPM
Oak Ridge Elementary
Page 138

Frenship Frenship ISD State ISD State
Students 7,492 4,912,385
White 4,080 1,531,757 54.5% 31.2%Hispanic 2,723 2,468,574 36.3% 50.3%African American 299 635,400 4.0% 12.9%Other 390 276,654 5.2% 5.6%
Economically Disadvantaged 2,804 2,909,554 37.4% 59.2%
Career and Technical 1,978 1,032,602 26.4% 21.0%Gifted and Talented 636 379,789 8.5% 7.7%Special Education 559 432,763 7.5% 8.8%Bilingual / ESL 214 796,755 2.9% 16.2%
Staff Teachers 546 334,876 57.8% 50.5% Professional Support Nurses, Librarians, Counselors 91 59,959 9.6% 9.0% Campus Administration Principals, Asst. Principals 29 18,757 3.1% 2.8% Central Administrators 8 6,820 0.8% 1.0%
Educational Aides 98 62,981 10.4% 9.5% Auxiliary Mtc, Food Svcs, Custodial, etc. 172 179,753 18.2% 27.1%
Total Staff 944 663,146
Ratios:Student to Teacher 13.7 14.7Student to Total Staff 7.9 7.4
Teacher to Prof. Support 6.0 5.6Teacher to Campus Admin 18.8 17.9Teacher to Central Admin 68.3 49.1Teacher to Aides 5.6 5.3Teacher to Auxiliary 3.2 1.9
ExpendituresPer Student Expenditures (All Funds)Total Operating 8,079 8,802Instruction 4,431 5,142Campus Administration 424 487Central Administration 246 269Other Operating 2,978 2,904
Table 52
Benchmark Data - AEIS Comparison to StateFrenship Independent School District
Page 139

Regional Peer Districts = Big Spring, Canyon, Dumas, Hereford, Lubbock - Cooper, Plainview, Shallowater
RegionalFrenship Peers Frenship Regional
ISD Avg ISD Peers
Students 7,492 4,694
White 4,080 1,970 54.5% 42.0%Hispanic 2,723 2,437 36.3% 51.9%African American 299 121 4.0% 2.6%Other 390 166 5.2% 3.5%
Economically Disadvantaged 2,804 2,606 37.4% 55.5%
Career and Technical 1,978 26.4% 0.0%Gifted and Talented 636 8.5% 0.0%Special Education 559 7.5% 0.0%Bilingual / ESL 214 2.9% 0.0%
Staff Teachers 546 333 57.8% 51.1% Professional Support Nurses, Librarians, Counselors 91 49 9.6% 7.5% Campus Administration Principals, Asst. Principals 29 20 3.1% 3.1% Central Administrators 8 8 0.8% 1.2%
Educational Aides 98 83 10.4% 12.7% Auxiliary Mtc, Food Svcs, Custodial, etc. 172 159 18.2% 24.4%
Total Staff 944 652
Ratios:Student to Teacher 13.7 14.1Student to Total Staff 7.9 7.2
Teacher to Prof. Support 6.0 6.8Teacher to Campus Admin 18.8 16.7Teacher to Central Admin 68.3 41.6Teacher to Aides 5.6 4.0Teacher to Auxiliary 3.2 2.1
ExpendituresPer Student Expenditures (All Funds)Total Operating 8,079 8,509Instruction 4,431 4,931Campus Administration 424 428Central Administration 246 250Other Operating 2,978 2,900
Frenship Independent School DistrictTable 53
Benchmark Data - AEIS Comparison to Regional Peer Districts
Page 140

State Peer Districts = Angleton, Belton, Burleson, Cedar Hill, Copperas Cove, New Braunfels, New Caney, Sherman, Weatherford
StateFrenship Peers Frenship State
ISD Average ISD Peers
Students 7,492 8,281
White 4,080 4,242 54.5% 51.2%Hispanic 2,723 2,494 36.3% 30.1%African American 299 1,168 4.0% 14.1%Other 390 377 5.2% 4.6%
Economically Disadvantaged 2,804 4,199 37.4% 50.7%
Career and Technical 1,978 26.4% 0.0%Gifted and Talented 636 8.5% 0.0%Special Education 559 7.5% 0.0%Bilingual / ESL 214 2.9% 0.0%
Staff Teachers 546 553 57.8% 49.2% Professional Support Nurses, Librarians, Counselors 91 90 9.6% 8.0% Campus Administration Principals, Asst. Principals 29 32 3.1% 2.8% Central Administrators 8 13 0.8% 1.2%
Educational Aides 98 118 10.4% 10.5% Auxiliary Mtc, Food Svcs, Custodial, etc. 172 317 18.2% 28.2%
Total Staff 944 1,123
Ratios:Student to Teacher 13.7 15.0Student to Total Staff 7.9 7.4
Teacher to Prof. Support 6.0 6.1Teacher to Campus Admin 18.8 17.3Teacher to Central Admin 68.3 42.5Teacher to Aides 5.6 4.7Teacher to Auxiliary 3.2 1.7
ExpendituresPer Student Expenditures (All Funds)Total Operating 8,079 8,146Instruction 4,431 4,674Campus Administration 424 446Central Administration 246 241Other Operating 2,978 2,785
Table 54
Benchmark Data - AEIS Comparison to State Peer DistrictsFrenship Independent School District
Page 141

Academic Assessment & Accountability
Student assessment is one measure to determine the academic progress of each student.
Teachers and administrators use assessment results to determine the degree in which students
have learned the objectives of the curriculum. Frenship ISD shares assessment results with
parents to keep them informed of no only their child’s progress, but also inform them of the
district’s performance compared to region and state averages.
Frenship ISD views student performance as an accountability effort toward state criteria as well
as a responsibility to produce quality results for their businesses and community constituents.
The Texas Education Agency released the 2010-2011 Accountability ratings during Fall 2011.
Frenship ISD received a “Recognized” rating. In addition, student performance met the
Exemplary standard in 19 of the 25 areas used to determine district ratings. The district met
Exemplary performance criteria across all subgroups for Reading / ELA, Writing and Social
Studies. Frenship ISD matched its highest percent passing ever attained for state assessments in
the three content areas for the Spring 2011 TASK administrations: Math (92%), Science (92%)
and Social Studies (97%).
A. Spring 2011 Texas Assessment of Knowledge and Skills (TAKS) Frenship ISD district results
are shown below for the Spring 2011 test administration. The results for Frenship are
compared to state results. In every subject, Frenship student averages have out performed state
averages.
90
84
92
83
95 96 92
96 92
97
65
70
75
80
85
90
95
100
Reading/ELA Math Writing Science Social Studies
STATE
FRENSHIP
Table 55 TAKS Spring 2011 Frenship ISD and State Results
Page 142
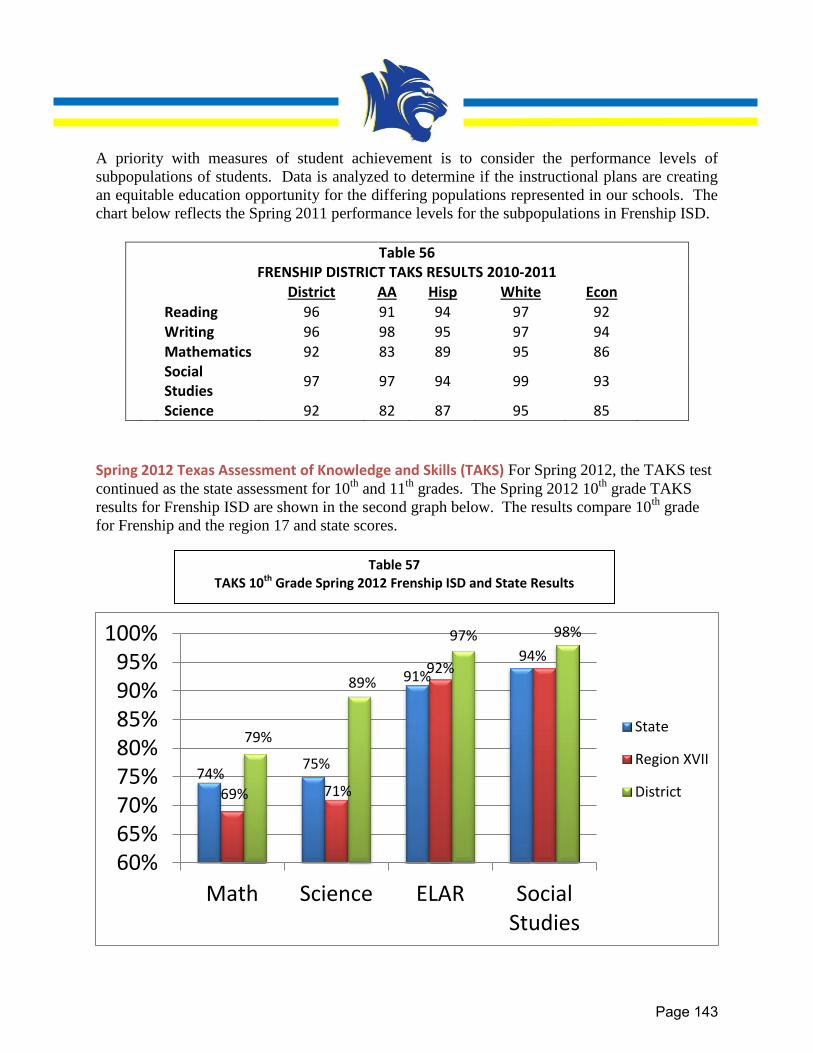
A priority with measures of student achievement is to consider the performance levels of
subpopulations of students. Data is analyzed to determine if the instructional plans are creating
an equitable education opportunity for the differing populations represented in our schools. The
chart below reflects the Spring 2011 performance levels for the subpopulations in Frenship ISD.
Table 56 FRENSHIP DISTRICT TAKS RESULTS 2010-2011
District AA Hisp White Econ
Reading 96 91 94 97 92
Writing 96 98 95 97 94
Mathematics 92 83 89 95 86
Social Studies
97 97 94 99 93
Science 92 82 87 95 85
Spring 2012 Texas Assessment of Knowledge and Skills (TAKS) For Spring 2012, the TAKS test
continued as the state assessment for 10th
and 11th
grades. The Spring 2012 10th
grade TAKS
results for Frenship ISD are shown in the second graph below. The results compare 10th
grade
for Frenship and the region 17 and state scores.
74% 75%
91%
94%
69% 71%
92%
79%
89%
97% 98%
60%65%70%75%80%85%90%95%
100%
Math Science ELAR SocialStudies
State
Region XVII
District
Table 57 TAKS 10th Grade Spring 2012 Frenship ISD and State Results
Page 143

B. State of Texas Assessment of Academic Readiness STAAR The Texas Education Agency
began the new program of state assessments in the Spring of 2012. The state testing
system, State of Texas Assessment of Academic Readiness (STAAR). The STAAR
program at grades 3–8 assesses the same subjects and grades that have been assessed on
TAKS.
Table 58 Frenship 5th Grade STAAR Results - Spring 2012
Table 59 Frenship 8th Grade STAAR Results - Spring 2012
55% 56%
63% 67%
54% 52%
61%
74%
57% 57%
71%
30%
40%
50%
60%
70%
80%
90%
100%
Reading
State
Region XVII
District
Math Social Studies
Science
67% 68% 73%
65% 66% 73% 73% 72%
80%
30%
40%
50%
60%
70%
80%
90%
100%
Reading
State
RegionXVII
Math Science
Page 144

93%
100%
87%
94%
77%
69%
100%
40%
50%
60%
70%
80%
90%
100%
Algebra 1 Geometry WorldGeography
Biology English IReading
English I Writing Algebra 2 (only2 students)
FISD
State
Region
STAAR Grades 9-12 - New assessments for grades 9-12 include twelve end-of-course (EOC)
assessments: Algebra I, geometry, Algebra II, biology, chemistry, physics, English I, English II,
English III, world geography, world history, and U.S. history. The new assessment system
brought increased accountability measures for high school EOC exams. Students are now
required to attain a minimum performance score on each STAAR test or the student is required
to retake the test. For each group of subject area tests (Algebra I, Geometry, and Algebra II for
example) a student must reach a state determined cumulative score for graduation purposes.
The results from the first administration of the EOC exams indicate Frenship student
performance exceeded region and state levels for every exam.
Table 60 Frenship STAAR EOC Results - Spring 2012
Page 145

C. The Texas English Language Proficiency Assessment System (TELPAS) The TELPAS is administered statewide each year to students identified as Limited English
Proficient (LEP). TELPAS assesses students in Reading, Writing, Listening and Speaking. It is
designed to measure annual growth of our second language learners. LEP students in grades 2-12
are required to participate in the TELPAS yearly until they receive an advanced rating. The
following charts show student progress on TELPAS for Frenship ISD grades K-2 and grades 3-
12.
Table 61 Frenship TELPAS Summary Report Grades K-2 Spring 2012
Table 62 Frenship TELPAS Summary Report Grades 3-12 Spring 2012
3% 4% 4% 5% 9% 7%
12% 18% 17%
24%
15%
37%
71% 65%
68%
39%
Listening Speaking Reading Writing
Beginning
Intermediate
7% 8%
15% 15% 16%
23% 19%
22%
29% 30%
24%
45% 48%
39% 42%
18%
Listening Speaking Reading Writing
Beginning
Intermediate
Page 146

D. Texas Primary Reading Inventory (TPRI) The TPRI is a one-on-one instrument designed to be administered by the classroom
teacher. The assessment consists of a screening and an inventory. Screening provides an
easy way to identify students who are likely to experience success in reading so that time
can be spent gathering more detailed information for the student who may be likely to
need instructional intervention. The Inventory engages the student with inviting tasks and
entertaining stories, while giving the teacher an opportunity to gather more data to help
match reading instruction with specific student needs. Frenship administers the TPRI to
students in kindergarten, 1st grade and 2
nd grade. The results for the 2011-2012 TPRI
administrations for beginning of the year and end of the year are shown in the chart
below.
56
17
48
84 80
88
0
10
20
30
40
50
60
70
80
90
100
Kindergarten 1st Grade 2nd Grade
Beginning ofthe Year
End of the Year
Table 63 Frenship TPRI Results 2011- 2012
Page 147

E. PSAT/NMSQT—Preliminary Scholastic Aptitude Test/National Merit Scholarship Qualifying Test
One of the efforts Frenship utilizes to prepare students for college admissions requirements is the
The PSAT®/NMSQT is a co-sponsored program by the College Board and National Merit
Scholarship Corporation. It measures Critical Reading, Math Problem-Solving, and Writing
Skills. This test gives students a chance to enter National Merit Scholarship Corporation
scholarship programs. The following chart represents PSAT Historical Data 2005-10 for
Frenship ISD.
Table 64 National Merit Award History
2008 2011 2012 2013 Hispanic 2 1 1 1 Commended 1 * 4 5 Semifinalist 3 1 1 2 Finalist 0 1 1 0
Page 148

F. SAT—Scholastic Aptitude Test and ACT—American College Test The SAT and ACT are
widely accepted college admissions test. Frenship has two goals related to the annual
assessments of our students. One goal is to increase the number of students who take the
SAT and/or ACT tests. Another goal is to improve the average score for each tested
group of students. The line graphs below are the SAT and ACT Trend Data for Frenship
ISD over the past seven years.
22.5
21
22.1 22 22 21.9
22.2 22.2
19.7 19.3
19.9
20.6 20.8 20.9
19.3
23.1
21.7
22.4 22.7
22.3 22.5
23
18
19
20
21
22
23
24
2005 2006 2007 2008 2009 2010 2011 2012
Table 66 Frenship ISD ACT Trend 2005-2012
District
Hisp
White
1023
1006 1015
1027 985
992
1013 1012
971
956 963
989
969
1001
914
1041
1018 1018
1046
1001 1012
1043
900
950
1000
1050
1100
2005 2006 2007 2008 2009 2010 2011 2012
Table 65 Frenship ISD SAT Trend 2005-2012
District
Hisp
White
Page 149

G. Graduation Rate: Frenship maintains one of the highest graduation rates for schools that
are similar in demographic makeup and size (enrollments from 5,000-10,000 students).
The chart below shows the graduation rate as reported through the Academic Excellence
Indicator System.
Table 67 Graduation Rates
District AA Hisp White Econ SPED
2004 94.3% 83.3% 89.6% 86.0% 88.7% 74.4%
2005 94.7% 100.0% 87.7% 97.5% 89.3% 74.1%
2006 93.8% 87.5% 89.5% 95.0% 91.2% 89.7%
2007 91.7% 78.6% 87.9% 93.6% 84.5% 64.5%
2008 92.2% 82.6% 87.5% 94.8% 81.6% 78.6%
2009 92.9% 77.8% 86.9% 95.9% 85.9% 77.4%
2010 97.6% 92.0% 95.9% 98.6% 96.9% 95.5%
2011 94.6% 100.0% 91.4% 95.8% 92.5% 86.7%
94%
95% 94%
92% 92% 93%
98%
95%
83%
100%
88%
79% 78%
92%
100%
90%
88% 88% 87%
91% 86%
98% 95% 94%
95% 96%
99%
96%
89%
91%
85% 82%
93%
74% 74%
65%
79%
96%
87%
60.00%
65.00%
70.00%
75.00%
80.00%
85.00%
90.00%
95.00%
100.00%
2004 2005 2006 2007 2008 2009 2010 2011
District
AA
Hisp
White
Econ
SPED
Page 150

H. Completion Rate The graph below represents the completion rate as reported through
the Academic Excellence Indicator System. The data indicates the percent of students
who entered Frenship High School as 9th
grade students and completed a graduation
program at Frenship High School or another school.
Table 68
Page 151

I. Student to Teacher Class Size Ratios In addressing the challenges with reduced state
funding, Frenship ISD adjusted student to teacher class size ratios to become more
efficient with the available funds. The charts below show a progression in the areas of
science and social studies for secondary schools. In 2007, Frenship ISD had a lower
student to teacher ratio than the state average. Over the past few years, that ratio has
changed. The class size averages per teacher in Frenship ISD are now higher than the
state average.
Table 69 Student to Teacher Class Size Ratios
Page 152

Frenshipshare thduring tcontribufor the C As partcontribuFrenshipAdditionadded aElementFrenship The “Mircampusproceedand the
p Independhe excitemehe district’stions of pa
CMN.
t of the dted more tp Middle nally, Terraan additionatary donatep High Scho
racle Pennes from J
ds raised wRonald Mc
Frensh
dent Schooent of the sts annual “M
articipating
district’s cothan $1,000School wh
a Vista Midal $2,021.25ed $1,660ool contribu
ies” drive foanuary 30
will stay locacDonald Ho
ip IndepeAccom
l District antudents andMiracle Peschools ac
ontribution,0 each durho raised ddle Schoo5, Heritage.82, Willowuted $1,230
or the Child to Februal going to use in Lubb
endent Scmplishme
nd the Child staff of Fr
ennies” drivcross the S
Frenship ring the ca
the largeol raised $e Middle Scw Bend E0.76.
dren's Miracary 10, 20benefit the
bock.
chool Disents
dren’s Mirarenship I.S.ve. This coouth Plains
ISD. hadampaign. Test campus$3,248.10, chool contrilementary
cle Networ012. Onee CMN at
strict
acle Netwo.D. who raiontribution s helped ra
d seven cThose cams amount North Rid
buted 1,82donated $
rk occurred e-hundred University
ork are proused $20,27along with
aise $31,75
campuses mpuses inclu
at $4,356dge Elemen5.85, Crest$1,484.24,
on all Frenpercent ofMedical Ce
ud to 76.28 h the 59.52
who uded 6.38. ntary tview
and
nship f the enter
Page 153

FrenshipHeritageTexas ATeacherHistory M Wagner Year awteacher AssociatAmericaEducatofinalists. For his rprizes. Hyear. Wscience moving t Frenshipbusinessthe 201Award. the NBE Flusche a varietyMultimecredit bu “We aresays Drasset to her and the natio
p ISD is hoe Middle ScAssociation r of the YeMuseum in
becomes tward. He
organizatition, the T
an Federators. The p
recognitionHe will alsoagner is beteacher.
to Heritage
p Independs technolog1 NationalFlusche re
EA National
is in her 2y of businedia, and Business tec
e extremely . David Vrothe Frenshit is great
onal level.”
Ac
onored to cochool for hof School
ear luncheoAustin.
the first-evewas selections. Th
Texas Clastion of Tepanel also
, Wagner r represent
eginning hisHe taught
e Middle Sc
dent Schoogy and edu Business
eceive this Conferenc
3rd year ofess technoBusiness Inhnology co
proud of Joonland, Frehip district fto see the
ccomplish
ongratulateis recognitiAdministra
on on Frida
er teacher fted by a pose organ
ssroom Teaeachers, aincluded m
eceives a cTexas in ths sixth yeaat Terra Vhool when
ol District cation teacEducationprestigious
ce in New O
f teaching aology coursnformation
ourses.
anet for heenship I.S.for such a loinvaluable
ments – C
e Jeremy Wion as 2012ators. Wagay, October
from Regiopanel of judnizations inachers Assand The Amembers f
cash awardhe National r of service
Vista Middleit opened in
is proud tcher at Fren Associatio
s honor andOrleans on
at Frenship ses includin
Managem
er tremendoD. Superintong time. Wefforts she
ontinued
Wagner, 8th2 Texas Tegner was hr 19 at the
n 17 to windges who nclude thesociation, tAssociationfrom the 20
d, a commeTeacher o
e in Frenshe School fn the fall of
to announcnship High on Secondd award in Friday, Apr
High Schong Animatioent along
ous accomptendent. “JWe share the provides t
h grade scieeacher of thonored duBob Bullo
n the Texasrepresent t
e Texas Sthe Texas n of Texa011 Teach
emorative trof the Year l
ip ISD as afrom 2007 f 2011.
ce that JaSchool, is
dary Teachfront of he
ril 22.
ool. She cuon, Digital with four
plishment wJanet has bhe same seto Frenship
ence teachthe Year byuring the Tck Texas S
s Teacher othe state's
State Teacchapter of
as Professher of the
rophy and olater this scan eighth gto 2011 be
net Fluschthe recipie
her of the er colleague
urrently teaand Interaadditional
with the NBbeen a valuentiments ap recognize
her at y the
Texas State
of the four
chers f the
sional Year
other chool grade efore
he, a ent of Year es at
aches active
dual
BEA,” uable about ed on
Page 154

As FrenhonoredFrenshipefforts in Lara HoScienceher secoYear. Accordinselectedeffectivefollowedtheir firsis award FrenshipselectedselectedSuperintprogramfuture of The groNovemb TASA’s systemicThe potVisionin The insenhancesystem new momodeledclassroo
nship Indepd to annoup High Schn 2012.
olbert, a fou Teacher oond year a
ng to the Sd based onely, classrod. The Roost or secondded to a 9th-
p Independd by the Ted Superintetendents Le
m designed f public edu
oup of selber 8 and co
created thc changes tential chag Institute a
titute is dee capabilitiethrough su
odels of stud after eleom and des
Ac
pendent Scnce the Sc
hool science
urth year Phof the Yearat Frenship
STAT websn evidenceom managokie Sciencd year of te-12th grade
dent Schooexas Assocendents froeadership to sustain
ucation in T
ected Supontinuing th
he Future-that could nges wouland the Tex
esigned to es to lead istained co
udent-centeements of
sign thinking
ccomplish
chool Distrcience Teae teachers
hysics teacr. Kelsey Sp, was nam
ite, the ST of creativ
gement excce Teachereaching, an
teacher wh
ol District Sciation of Som acrossInstitute. Tleaders an
Texas.
perintendenhrough Sep
-Ready Sube created
d support xas High Pe
provide oin times of llaborative
ered schoolf project-bg.
ments – C
rict entersachers Asso
at the Out
cher at FHSSlaughter,
med the ST
TAT Teachevity in the ceeds exper of the Yead the High ho is also S
SuperintendSchool Adm Texas anThese selend expand
nts will meptember 201
perintended on both tthe missio
erformance
pportunitieschange. Itnetwork ams across Tased learn
ontinued
another scociation of tstanding S
S, was namFHS Chem
TAT Rookie
ers of the Yclassroom,
ectations, aar is awardSchool Sc
STAT memb
dent Dr. Dministratorsnd participected admin
their leade
eet for five13.
nts Leadethe local leon of the e Schools C
s for the st increasesmong the pTexas. Thening, actio
chool yearf Texas haScience Te
med the STAmistry teache Science
Year for all where TE
and safety ded to a STience Teacber.
avid Vroons (TASA) tpate in thenistrators aership role
e sessions
rship Institevel and acoriginal Pu
Consortium
selected ads capacity tparticipantse design ofon researc
r, the distrias awardedachers for
AT High Scher who beTeacher o
l categoriesEKS are taproceduresTAT membcher of the
nland has bo join 38 o
e Future-Rare serving
in defining
s beginning
tute to expcross the sublic Educ.
dministratoto transforms as they crf the instituch, the flip
ict is d two
their
chool egins f the
s are aught s are ber in Year
been other eady in a
g the
g on
plore state. ation
rs to m the reate ute is pped
Page 155

FrenshipLeaderstransparwith thei This maAward. three ye AccordinComptrogovernmtransparfinancialsharing more inf Frenshiprecogniz LivestocBailee WTaylor STaylor TJordan S Cotton JBlake CArianna Taylor TBailee W
p Independship Circle rency. Their transpare
arks the th Frenship
ears of the L
ng to their oller Leadements acrorency. Thl books toinformation
formation.
p I.S.D. cozed as 2012
ck Judging TWright Stockton Turner Smith
Judging Teaonners O'Glesby
Turner Wright
Ac
dent Schooas a reci
e Gold Seaency efforts
hird consecis one of oLeadership
website, tership Cirss Texas e organiza
the publicn in a use
ongratulates2 State Cha
Team
am
ccomplish
ol District hipient of thal Award hs.
cutive yearonly 45 schCircle prog
the Comptrcle prograthat strive
ation spotligc, providing
er-friendly fo
s the followampions in
ments – C
as been rehe 2011-20ighlights th
r Frenship hool districtgram’s exis
roller of Pam in De
to meet aghts thoseg clear, coormat that
wing Frenshtheir respe
ontinued
ecognized 012 Gold
hose entitie
I.S.D. hasts in Texastence.
ublic Accoecember 2a high sta local govonsistent p
lets taxpa
hip High Sective FFA e
by the TexSeal Awa
es that are
s received s to receive
ounts launc2009 to rndard for
vernments pictures of ayers easily
School studevents:
xas Comptrrd for finasetting the
the Gold e the awar
ched the Trecognize online finathat open spending,
y drill down
dents who w
roller ancial e bar
Seal rd all
Texas local
ancial their and
n for
were
Page 156

AgriscieBailey B These sIndiana. The Livplaced 1 In AgrisCHAMP The FrequalifiedconsecuFrenshipprogram2013. 2011-20
FVGBSBT
nce Lone SBrashears
students c
estock tea16th.
science, BPIONSHIP in
enship Tiged for post-sutive appeap compiled
m also made
012 District Football Volleyball Girls BasketBoys BaskeSoftball Baseball TOTAL
Ac
Star Proficie
competed a
m of Taylo
Bailey Brasn a row.
ers continuseason playarance at th an overale great stri
3-4A Reco 7-0 10
tball 12tball 14
14 11 68
ccomplish
ency
at the 201
or Stockton
shears and
ed their tray in every he state goll record ofdes in prep
ords – Team0 -4 -2 -0 -0 -3 -9
ments – C
12 Nationa
n, Taylor T
d Blake C
adition of ssport. The
olf tournamef 68-9 in Dparation for
m Sports:
ontinued
al FFA Co
Turner, Bai
Conners w
success inboys’ golf
ent in AustDistrict 3-4Ar its first ye
onvention i
lee Wright
won their
n 2011-201team also
tin. The sixA play. Th
ear of varsit
in Indianap
t, Jordan S
3rd NATIO
2. The To made thex team sporhe Tiger soty play in 2
polis,
Smith
ONAL
igers ir 3rd rts at occer 2012-
Page 157

Congratmedals Texas in Three FcompetitSarahlinOmar HMitchell Since thState Cstudentsjudge is
tulations to at the Texa
n Austin. Fr
Frenship Btion:
nna Guerreraney Garrison
hey were shampionshs are selecallowed to
Ac
Frenship Has State Sorenship Ban
Band mem
ro Flu Alt Alt
selected aship Medals.cted to be r
pick one st
ccomplish
High Schooolo and Ensnd member
mbers were
ute to Saxophoto Saxopho
s Outstandi. This is arecognized tudent as th
ments – C
l Band memsemble conrs earned th
e selected
one one
ing Soloistsa very pres
as "Outstahe Outstand
ontinued
mbers on entest held rehirty one me
as Outst
s, these thstigious hoanding" in ding perfor
earning a reecently at tedals at the
tanding S
hree studeonor as onthe state o
rmer in his r
ecord numbhe Universe competitio
Soloists at
nts will recly a handf
of Texas. Eroom.
ber of ity of on.
t the
ceive ful of Each
Page 158

Glossary of Terms
This glossary contains definitions of terms used in this guide and such additional terms as seems necessary to common understandings concerning financial accounting procedures for schools. Several terms which are not primarily financial accounting terms have been included because of their significance for school financial accounting. Account—A descriptive heading under which are recorded financial transactions that are similar in terms of a given frame of reference, such as purpose, object, or source. Accounting System—The total structure of records and procedures which discover, record, classify, and report information on the financial position and operations of a school district or any of its funds, balanced account groups and organizational components. Accrual Basis—The basis of accounting, under which revenues are recorded when levies are made, and expenditures are recorded as soon as they result in liabilities, regardless of when the revenue is actually received or the payment is actually made. See also Estimated Revenue and Expenditures. Accrue—To record revenues when earned or when levies are made, and to record expenditures as soon they result in liabilities, regardless of when the revenue is actually received or the payment is actually made. Sometimes, the term is used in a restricted sense to denote the recording of revenues earned but not yet due, such as accrued interest on investments and the recording of expenditures which result in liabilities that are payable in another accounting period, such as accrued interest on bonds. Also see Estimated Revenues and Expenditures. ACT— represents American College Testing. ADA—Average Daily Attendance is based on the number of days of instruction in the school year. The aggregate days attendance is divided by the number of days of instruction to compute average daily attendance. ADA is used in the formula to distribute funding to Texas public school districts. Administration—Those activities which have as their purpose the general regulation, direction, and control of the affairs of the local education agency that are system-wide and not confined to one school, subject, or narrow phase of school activity. Ad Valorem Tax—The primary source of local funding for school districts levied against the local tax base. Ad Valorem means according to the value.
Page 159

Glossary of Terms - Continued
AEIS—represents Academic Excellence Indicator System. A system of indicators established by the Legislature and adopted by the State Board of Education to help determine the quality of learning on a campus and in a school district. The indicators include passing rates on the state assessment tests, attendance, graduation rates, dropout rates, and scores on college entrance exams. The state will assess district and school performance compared with state-level standards. AEIS is the foundation for a school district’s accountability rating. Allocation—A part of a lump-sum appropriation which is designated for expenditure by specific organization units and/or for specific purposes, activities, or objects. Appropriation—An authorization granted by a legislative body to make expenditures and to incur obligations for specific purposes. An appropriation is usually limited in amount and as to the time when it may be expended. Assessed Valuation—A valuation set upon real estate or other property by the County Appraisal District to be used as a basis for levying taxes. Audit—A comprehensive review of the manner in which the government's resources were actually utilized. A certified public accountant issues an opinion over the presentation of financial statements, tests the controls over the safekeeping of assets and makes recommendations for improvements for where necessary. Board of Education (School Board of Trustees) —The elected or appointed body which has been created according to State law and vested with responsibilities for educational activities in a given geographical area. These bodies are sometimes called school boards, governing boards, boards of directors, school committees, school trustees, etc. This definition relates to the general term and covers State boards, intermediate administrative unit boards, and local basic administrative unit boards. Bond—A written promise, generally under seal, to pay a specified sum of money called the face value, at a fixed time in the future called the date of maturity, and carrying interest at a fixed rate, usually payable periodically. The difference between a note and a bond is that the latter usually runs for a longer period of time and requires greater legal formality. See also Surety Bond. Bonded Debt—The part of the school district debt which is covered by outstanding bonds of the district. Sometimes called "Funded Debt".
Page 160

Glossary of Terms - Continued
Bonds Authorized and Unissued—Bonds which have been legally authorized but not issued and which can be issued and sold without further authorization. Bonds Issued—Bonds sold. Budget—A plan of financial operation embodying an estimate of proposed expenditures for a given period or purpose and the proposed means of financing them. The budget usually consists of three parts. The first part contains a message from the budget-making authority together with a summary of the proposed expenditures and the means of financing them. The second part is composed of drafts of the appropriation, revenue, and borrowing measures necessary to put the budget into effect. The third part consists of schedules supporting the summary. These schedules show in detail the proposed expenditures and means of financing them together with information as to past years' actual revenues and expenditures and other data used in making the estimates. Budgetary Control—The control management of the business affairs of the school district in accordance with an approved budget with a responsibility to keep expenditures within the authorized amounts. Capital Budget—A plan of proposed capital outlays and the means of financing them for the current fiscal period. It is usually a part of the current budget. If a Capital Program is in operation, it will be the first year thereof. A Capital Program is sometimes referred to as a Capital Budget. Capital Outlays—A plan for capital expenditures to be incurred each year over a fixed period of years to meet capital needs arising from the long term work program or otherwise. It sets forth each project or other contemplated expenditure in which the local education agency is to have a part and specifies the full resources estimated to be available to finance the projected expenditures. Capital Projects Fund—A governmental fund type with budgetary control established to account for projects that are financed by the proceeds from bond issues, or for capital projects otherwise mandated to be so accounted for in this fund. Classification, Function—As applied to expenditures, this term has reference to an activity or service aimed at accomplishing a certain purpose or end; for example, Instructional, School Leadership, Nursing. Classification, Object—As applied to expenditures, this term has reference to an article or service received, for example, payroll costs, purchased and contracted services, materials, and supplies.
Page 161
Glossary of Terms - Continued
CPA—represents Certified Public Accountant. Coding—A system of numbering, or otherwise designating, accounts, entries, invoices, vouchers, etc., in such a manner that the symbol used quickly reveals certain required information. Contracted Services—Labor, material and other costs for services rendered by personnel who are not on the pay-roll of the local education agency. CTSBO—represents Certified Texas School Business Official. Debt—An obligation resulting from the borrowing of money or from the purchase of goods and services. Debts of local education agencies include bonds, warrants and notes, etc. Debt Limit—The maximum amount of gross or net debt which is legally permitted. Debt Service Fund—A governmental fund with budgetary control that accounts for expenditures for the retirement of debt and expenditures for interest on debt, except principal and interest of current loans. See also Cur-rent Loans. Encumbrance Accounting—A system or procedure which involves giving recognition in the accounting budgetary expenditure control records for the issuance of purchase orders, statements, or other commitments chargeable to an appropriation in advance of any liability or payment. Encumbrance—Any commitment of funds against an appropriation. It may be in the form of a purchase order or a contract. Encumbrance accounting is formally integrated into the accounting system for expenditure control purposes. An encumbrance differs from an account payable as follows: an account payable represents a legal liability to pay and results from the goods and/or services requested in a purchase order or contract having been delivered to the District. Until such time as the goods and/or services are delivered, the commitment is referred to as an encumbrance. Equipment—Moveable items used for school operation that are of a non-expendable and mechanical nature, i.e. perform an operation. Typewriters, projectors, vacuum cleaners, accounting machines, computers, lathes, clocks, machinery, and vehicles, etc., are classified as equipment. (Heating and air conditioning systems, lighting fixtures and similar items permanently fixed to or within a building, are considered as part of the building.)
Page 162

Glossary of Terms - Continued
Estimated Revenue—When the accounts are kept on an accrual basis, this term designates the amount of revenue estimated to accrue during a given period regardless of whether or not it will be collected during the period. Existing Debt Allotment (EDA) Program— In 1999, the Legislature added Subchapter B to Chapter 46 of the Texas Education Code (TEC) to create the Existing Debt Allotment (EDA) program. The EDA provides tax rate equalization for local debt service taxes, operates without applications, and has no award cycles. Each school district is guaranteed a specified amount per student in state and local funds for each cent of tax effort to pay the principal of and interest on eligible bonds. Only general obligation bonds are eligible for the program. Payments demonstrating eligibility for the EDA must appear on the debt service schedule contained in the final official statement or bond order. Expenditures—This grouping includes total charges incurred, whether paid or unpaid, for current expense, capital outlay, and debt service. (Transfers between funds, encumbrances, exchanges of cash for other current assets such as the purchase stores and investment of cash in U.S. Bonds, payments of cash in settlement of liabilities already accounted as expenditures, and the repayment of the principal of current loans are not considered as expenditures.) Expense—Charges incurred, whether paid or unpaid, for operation, maintenance, and interest, and other charges which are presumed to benefit the current fiscal period. Legal provisions sometimes make it necessary to treat as expense charges whose benefits extend over future periods. Fiscal Period—Any period at the end of which a local education agency determines its financial position and the results of its operations. The period may be a month, a quarter, or a year, depending upon the scope of operations and requirements for managerial control and reporting. Fiscal Year—A twelve-month period of time to which the annual budget applies and at the end of which a local education agency determines its financial position and the results of its operations. The District's fiscal year is September 1 through August 31. Fixed Assets—Assets of a long-term character which are intended to continue to be held or used, such as land, buildings, machinery, furniture and other equipment.
Page 163

Glossary of Terms - Continued
Foundation School Program (FSP) —A program for the financial support of a basic instructional program for all Texas schoolchildren. Money to support the program comes from the Permanent School Fund, Available School Fund, Foundation School Fund, state general revenue, and local property taxes. The state establishes a foundation level and sets, for each district, a calculated contribution level called the local fund assignment (LFA). The greater a district’s property wealth, the higher the LFA. State aid makes up the difference between the LFA and the foundation level. (See also “Local Fund Assignment”) Currently, the FSP described in the Texas Education Code consists of three parts or tiers. The first tier provides funding for a basic program. The second tier provides a guaranteed-yield system so that school districts have substantially equal access to revenue sufficient to support an accredited program. The third tier equalizes debt service requirements for existing facilities debt. FTE—Full-Time Equivalent measures the extent to which one individual or student occupies a full-time position or provides instruction, e.g., a person who works four hours a day or a student that attends a half of a day represents a .5 FTE. When FTE counts are included in reports they represent the aggregate of all FTE percentages, e.g., if one teacher provides four hours of instruction and four others provide one hour, together they represent one FTE. Fund—An independent fiscal and accounting entity with a self-balancing set of accounts recording cash and/or other resources, together with all related liabilities, obligations, reserves, and equities which are segregated for the purpose of carrying on in accordance with special regulations, restrictions, or limitations. Fund Balance—The excess of assets of a fund over its liabilities and reserves. During the fiscal year prior to closing, it represents the excess of the fund's assets and estimated revenues for the period over its liabilities, reserves and appropriations for the period during the fiscal year prior to closing. GAAP—represents Generally Accepted Accounting Principles. General Fund—A fund group with budgetary control used to show transactions resulting from operations of on-going organizations and activities form a variety of revenue sources for which fund balance is controlled by and retained for the use by the local education agency. The General Fund is used to finance the ordinary operations of a governmental unit except those activities required to be accounted for in another fund. General Obligation Debt—Tax supported bonded debt which is backed by the full faith and credit of the District.
Page 164

Glossary of Terms - Continued
GAAP—represents Generally Accepted Accounting Principles. General Fund—A fund group with budgetary control used to show transactions resulting from operations of on-going organizations and activities form a variety of revenue sources for which fund balance is controlled by and retained for the use by the local education agency. The General Fund is used to finance the ordinary operations of a governmental unit except those activities required to be accounted for in another fund. General Obligation Debt—Tax supported bonded debt which is backed by the full faith and credit of the District. Gift— Money received from a philanthropic foundation, private individual, or private organization for which no repayment or special service to the contributor is expected. Grant—A contribution by one governmental unit to another. The contribution is usually made to aid in the sup-port of specified function (for example, job training), but it is sometimes also for general purposes. Guaranteed Yield — A school finance plan in which the state specifies a revenue yield that it will guarantee in terms of revenue per student per penny of local tax effort. The districts adopt tax rates and levy taxes. The state makes up the difference between what each district levies locally per student and the guaranteed yield per student. High wealth districts may raise all of their guaranteed-yield revenue from local tax sources. In Texas, this is commonly known as Tier Two in the Foundation School Program. Improvements—Buildings, other structures, and other attachments or annexations to land which are intended to remain so attached or annexed, such as sidewalks, trees, drives, tunnels, drains, and sewers. Independent School District (ISD)—The Texas Constitution permits the state Legislature to create school districts. Each district operates its schools and taxes property within the district to support, in part, the schools. The term independent refers to the fact that the school district is not a part of city or county government and has independent budgeting and taxing authority. ISD's are governed by locally elected boards of trustees.
Page 165

Glossary of Terms - Continued
Individuals with Disabilities Education Act (IDEA) —The purposes of the Individuals with Disabilities Education Act (IDEA) are to: (1) ensure that all children with disabilities have available to them a free appropriate public education which emphasizes special education and related services designed to meet their unique needs; (2) ensure that the rights of children with disabilities and their parents or guardians are protected; (3) assist States, localities, educational service agencies and Federal agencies to provide for the education of all children with disabilities; and (4) assess and ensure the effectiveness of efforts to educate children with disabilities. Instruction—The activities dealing directly with the teaching of students or improving the quality of teaching. Instructional Facilities Allotment (IFA)—Granted by House Bill 4 in 1997, this program provides a guaranteed level ($35) of state and local funds per student per penny of tax effort applicable to debt service on eligible bonds. However, there is a limit on funding for each biennium so the District must apply for funding. The applications are ranked based on relative property wealth and funds are awarded up to the dollar limit available. Inventory—A detailed list or record showing quantities, descriptions, values, units of measure, and unit prices of property on hand. Levy—To impose taxes or special assessments. (Noun) The total of taxes special assessments imposed by a governmental unit. Liability—An obligation, based on a past transaction, to convey assets or perform services in the future. M&O Tax Rate—The tax rate calculated to provide the revenues needed to cover Maintenance & Operations (M&O). M&O includes such things as salaries, utilities, and day-to-day operations. Modified Accrual Accounting—A basis of accounting in which expenditures are accrued when incurred and revenues are accounted for when they become measurable and available. National School Lunch Program (NSLP)—A federally-assisted meal program operating in more than 101,000 public and non-profit private schools across the nation. The program was established under the National School Lunch Act, signed by President Harry Truman in 1946.
Page 166

Glossary of Terms - Continued
PEIMS—represents Public Education Information Management System. Personnel, Administration—Personnel on the school payroll who are primarily engaged in activities which have as their purpose the general regulation, direction, and control of the affairs of the school district that are system-wide and not confined to one school, subject, or narrow phase of school activity; for example, superintendent of schools, business manager and accountant. Personnel, Full-Time—School employees who occupy positions the duties of which require them to be on the job on school days, throughout the school year, at least the number of hours the schools in the system are in session. Program—A group of related activities performed by one or more organizational units for the purpose of accomplishing a function or project for which the District is responsible. Program Budget—A budget wherein expenditures are based primarily on programs of work and secondarily on character and object. A program budget is a traditional type of budget between the traditional character and object budget on the one hand, the performance budget on the other. Refined ADA—Refined Average Daily Attendance is based on the number of days of instruction in the school year. The aggregate eligible days attendance is divided by the number of days of instruction to compute the re-fined average daily attendance. See also ADA. Refunding Bonds—Bonds issued to pay off bonds already outstanding. Reserved Fund Balance—The portion of fund equity which is not available for appropriation or which has been legally separated for a specific purposes. Revenue—The yield of taxes, tuition, interest earnings, and other monetary resources that the District collects and receives into the treasury for public use. For those revenues which are recorded on the accrual basis, this term designates additions to assets which (a) do not increase any liability; (b) do not represent the recovery of an expenditure; (c) do not represent contributions of fund capital in enterprise and internal service funds. The same definition applies to those cases where revenue is recorded on the modified accrual or cash basis, except that additions would be partially or entirely to cash. See Receipts, Revenue.
Page 167

Glossary of Terms - Continued
Rollback Tax Rate—A tax rate that exceeds the rollback tax rate will automatically trigger an election to limit school taxes on a date not less than 30 days or more than 90 days after the tax rate is adopted. If the election to limit school taxes is successful, the tax rate the district may impose for the current year is limited to the calculated rollback tax rate. Salary—The total amount regularly paid or stipulated to be paid to an individual, before deductions, for personal services rendered while on the payroll of the school district. Payments for sabbatical leave are also considered as salary. SAT—represents Standardized Achievement Tests. School—A division of the school system consisting of a group of pupils composed of one or more teachers to give instruction of a defined type, and housed in a school plant of one or more buildings. More than one school may be housed in one school plant, as is the case when the elementary and secondary programs are housed in the same school plant. School, Elementary—A school classified as elementary by State and local practice and composed of any span of grades not above grade five. In this District this term includes kindergartens and pre-kindergartens if they are under the control of the local board of education. School, Middle—A separately organized secondary school intermediate between elementary, intermediate, and senior high school. In this District middle schools include grades six through eight. School, Secondary—A secondary school comprises any span of grades beginning with the next grade following the elementary school and ending with grade 12, including middle schools, the different types of high schools, and alternative high schools. Special Revenue Funds—A governmental fund type with budgetary control, used to account for the proceeds of specific revenue sources, other than expendable trusts or for major capital projects, that are legally restricted to expenditures for specified purposes. Tax Base—The total value of all real, personal and mineral property in the District as of January 1st of each year, as certified by the County Appraisal Board. The tax base represents net value after all exemptions.
Page 168

Glossary of Terms - Continued
Taxes—Compulsory charges levied by a governmental unit for the purpose of financing services performed for the common benefit. The term includes licenses and permits. It does not include special assessments. Tax Rate—Total tax rate is set by the Board of Trustees and is made up of two components: maintenance and operating and debt service rates. It is the amount levied for each $100 of assessed valuation. Tax Roll—The official list showing the amount of taxes levied against each taxpayer or property. TEA—represents Texas Education Agency. It is the administrative and regulatory unit for the Texas public education system managed by the commissioner of education. TEA is responsible for implementing public education policies as established by the Legislature, State Board of Education, and commissioner of education. Teacher Retirement System (TRS)—TRS delivers retirement and related benefits authorized by law for members and their beneficiaries. Unassigned Fund Balance—For budget purposes, the unassigned fund balance is that portion of fund equity that is currently available for allocation. WADA—To treat school districts fairly in funding, a Weighted Average Daily Attendance (WADA) is used to measure the extent students are participating in special programs. The concept of WADA in effect converts all of a school district’s students with their different weights to a calculated number of regular students required to raise the same amount of revenue. The greater the number of students eligible for special entitlements, the greater a school district’s WADA will be.
Page 169