Freight: Nebraska’s Connection to the World Economy · What’s your long-term view of...
44
Freight: Nebraska’s Connection to the World Economy
Transcript of Freight: Nebraska’s Connection to the World Economy · What’s your long-term view of...
Freight: Nebraska’s Connection to the World Economy

November 2016
Trade Mission
Macau, China
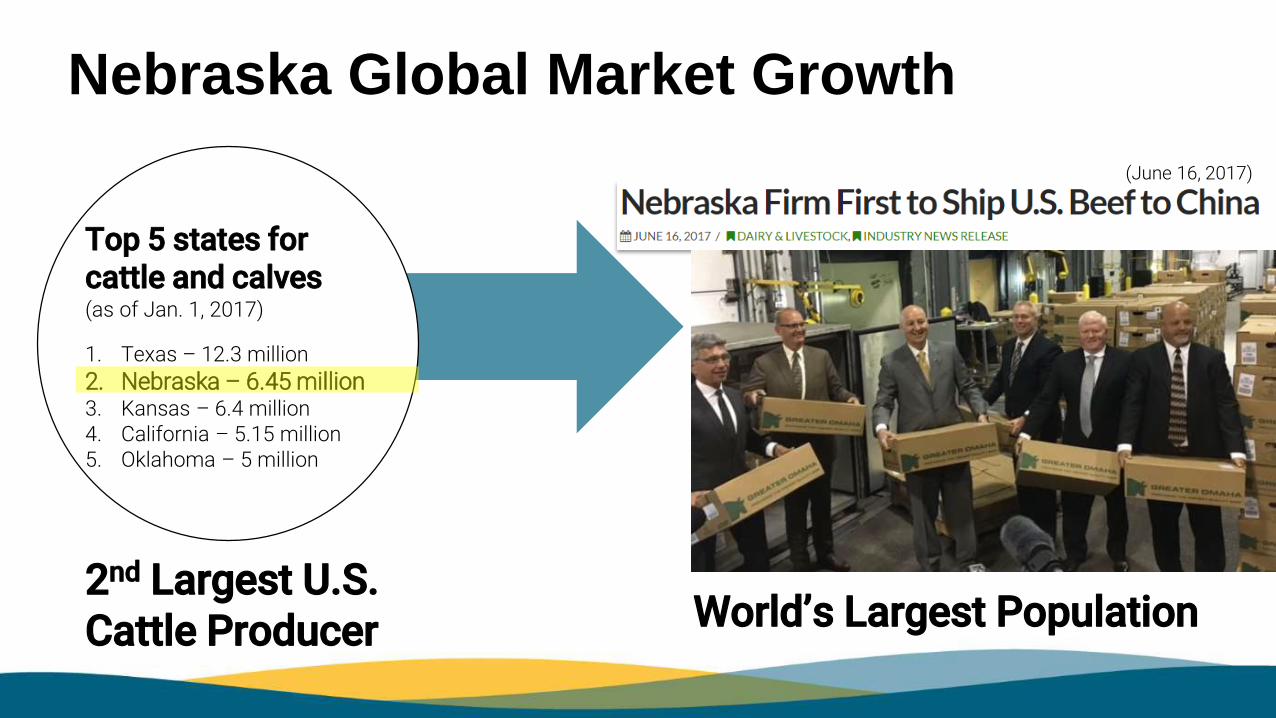
Top 5 states for cattle and calves (as of Jan. 1, 2017)
1. Texas – 12.3 million
2. Nebraska – 6.45 million3. Kansas – 6.4 million4. California – 5.15 million5. Oklahoma – 5 million
Nebraska Global Market Growth
(June 16, 2017)
2nd Largest U.S. Cattle Producer World’s Largest Population
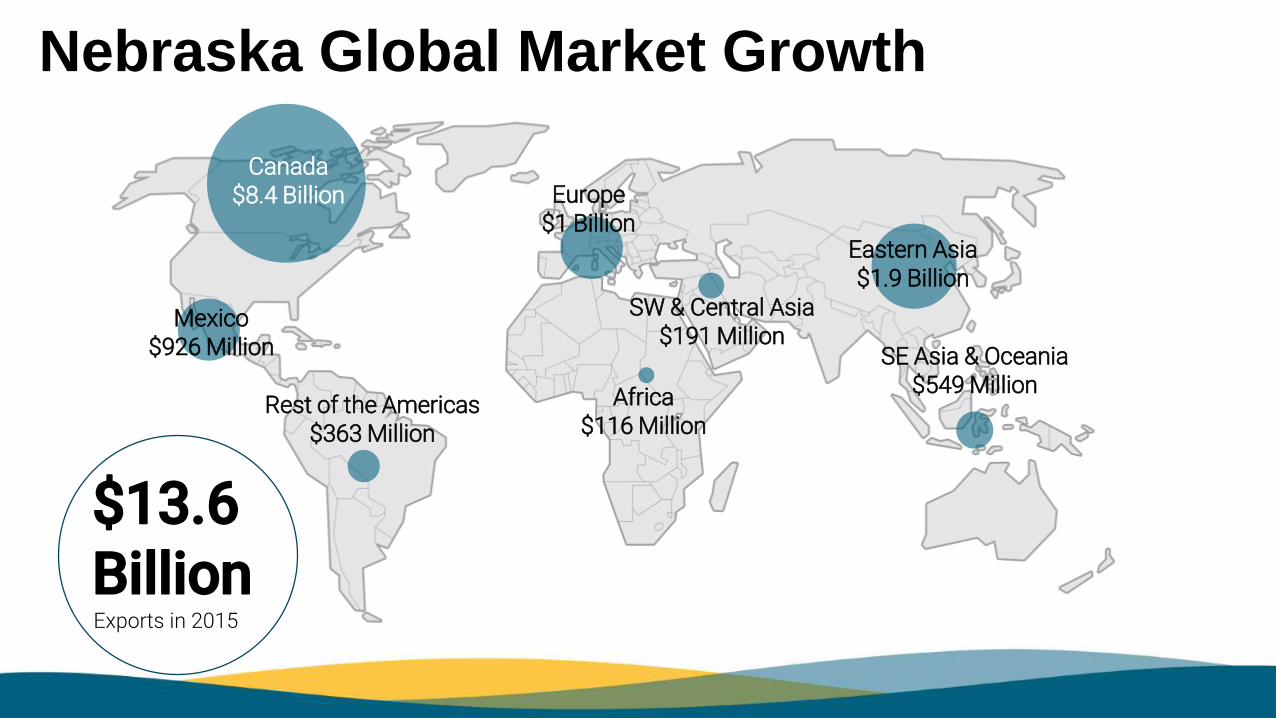
Nebraska Global Market Growth
$13.6BillionExports in 2015
Canada$8.4 Billion
Mexico$926 Million
Rest of the Americas$363 Million
SE Asia & Oceania$549 Million
Europe$1 Billion
Africa$116 Million
SW & Central Asia$191 Million
Eastern Asia$1.9 Billion
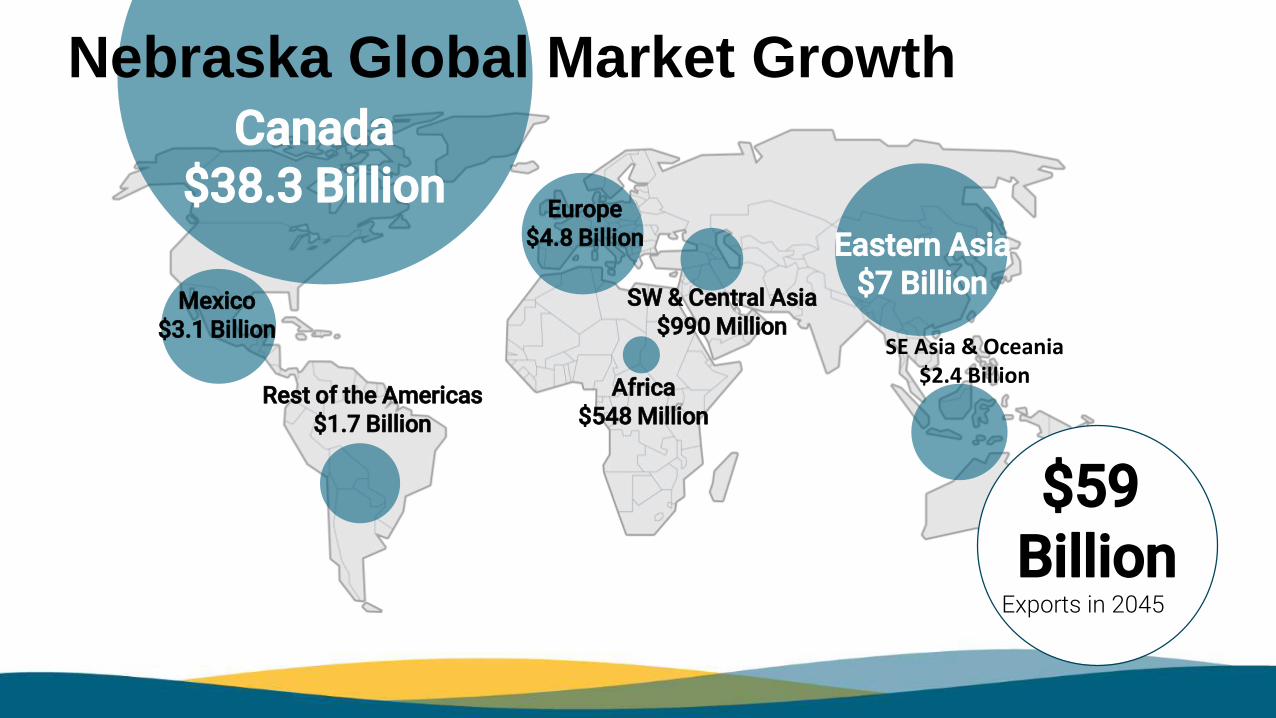
Canada$38.3 Billion
Mexico$3.1 Billion
Rest of the Americas$1.7 Billion
SE Asia & Oceania$2.4 Billion
Europe$4.8 Billion
Africa$548 Million
SW & Central Asia$990 Million
Eastern Asia$7 Billion
$59 Billion
Exports in 2045
Nebraska Global Market Growth
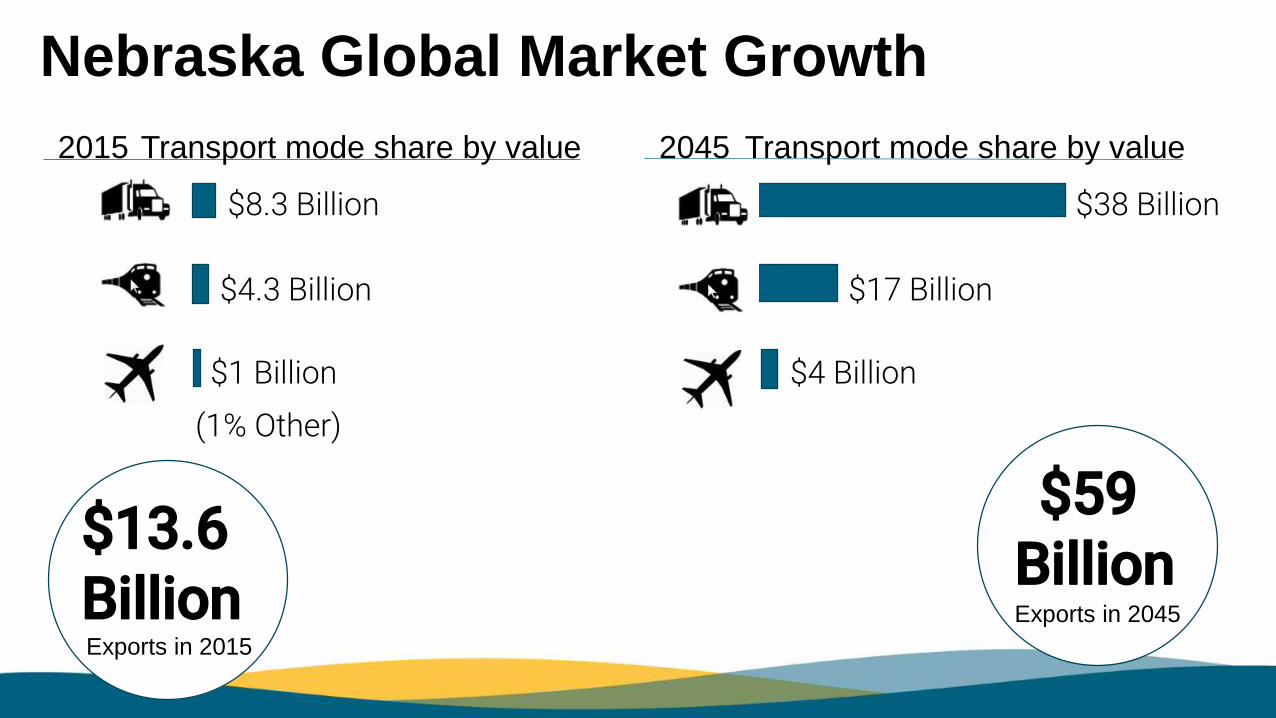
Nebraska Global Market Growth
$13.6BillionExports in 2015
$59 BillionExports in 2045
2015
$8.3 Billion
$4.3 Billion
$1 Billion
2045
$38 Billion
$17 Billion
$4 Billion
(1% Other)
Transport mode share by value Transport mode share by value

Total GDP of
Freight-Dependent
Industries:
$51 Billion
45% of total NE GDP

Courtney Dentlinger, Nebraska Department of Economic Development
Deb Miller, Commissioner, Surface Transportation Board
Craig Stoffel, VP Global Logistics, Werner Enterprises
Transportation Panel
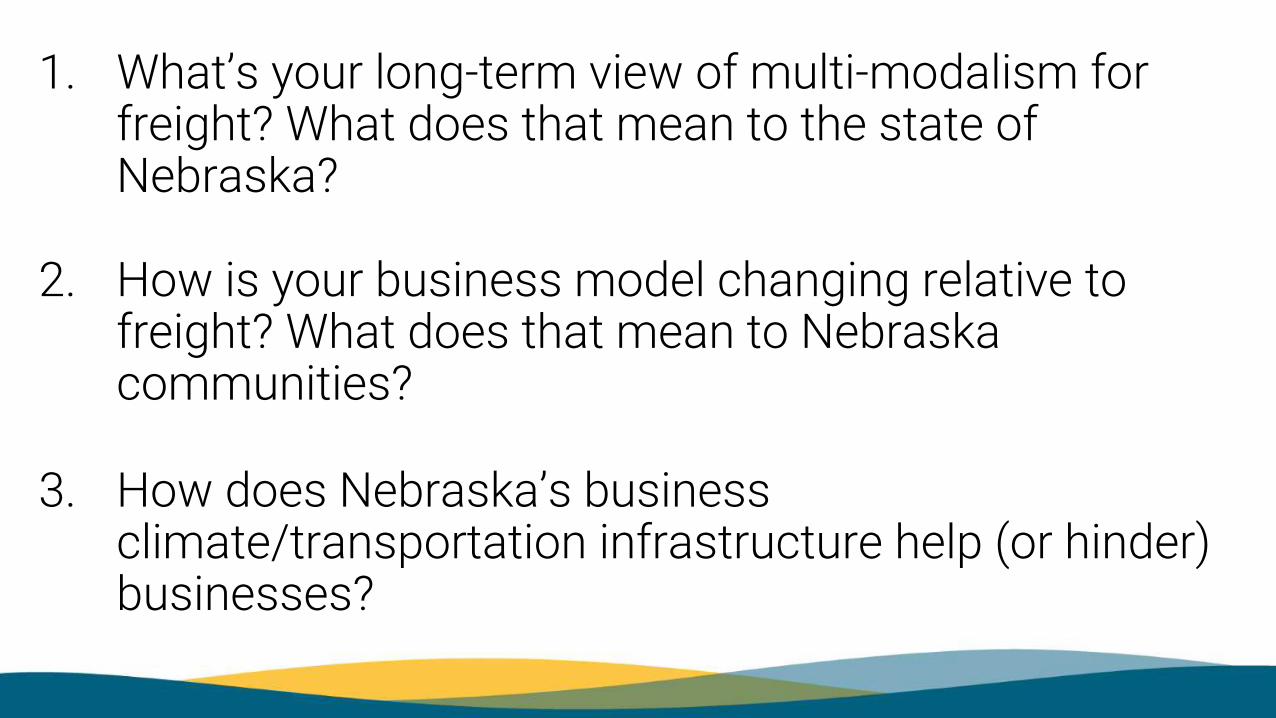
1. What’s your long-term view of multi-modalism for freight? What does that mean to the state of Nebraska?
2. How is your business model changing relative to freight? What does that mean to Nebraska communities?
3. How does Nebraska’s business climate/transportation infrastructure help (or hinder) businesses?

Statewide Freight Transportation Network Optimization Strategy Overview
Rick Langer
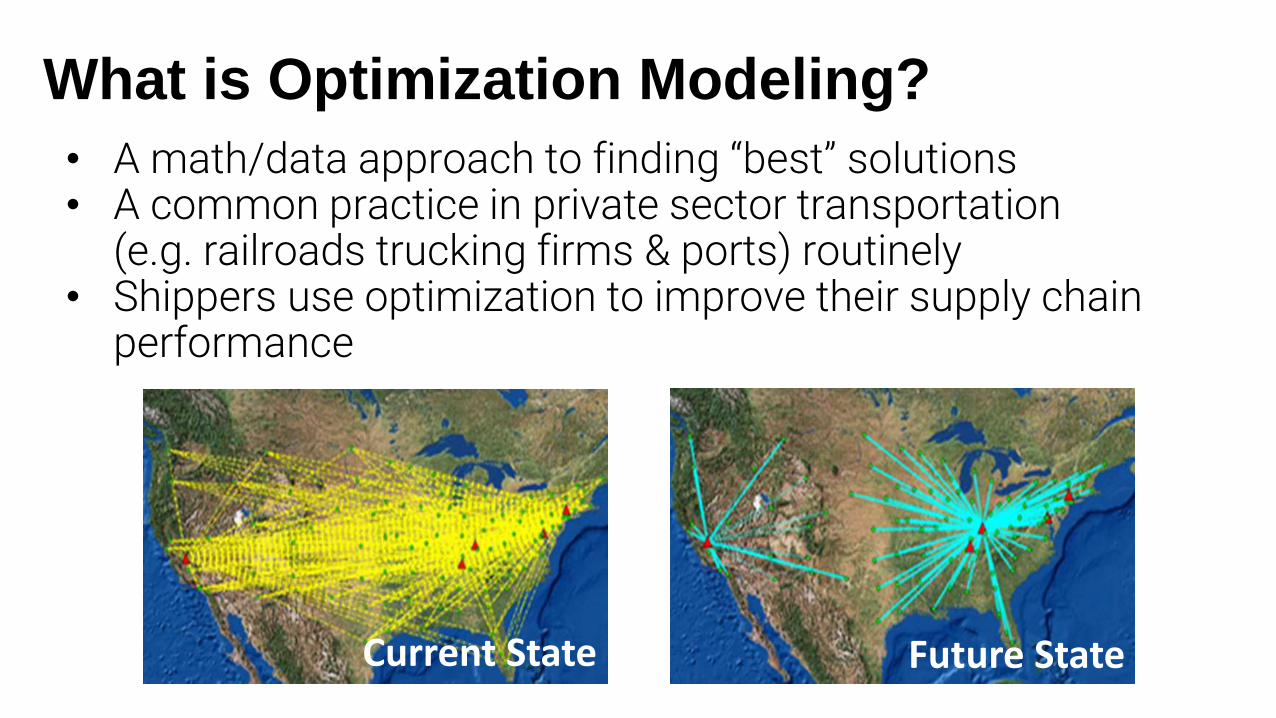
What is Optimization Modeling?
• A math/data approach to finding “best” solutions• A common practice in private sector transportation
(e.g. railroads trucking firms & ports) routinely• Shippers use optimization to improve their supply chain
performance
Current State Future State

Optimization as a Public Sector Tool
• Adds a supply chain perspective to transportation operations/practices
• Public funding is increasingly focused on transparency –optimization is driven by math
• A good match for funding programs that favor public/private approaches
• Supports dual objectives: sound transportation investment and economic development
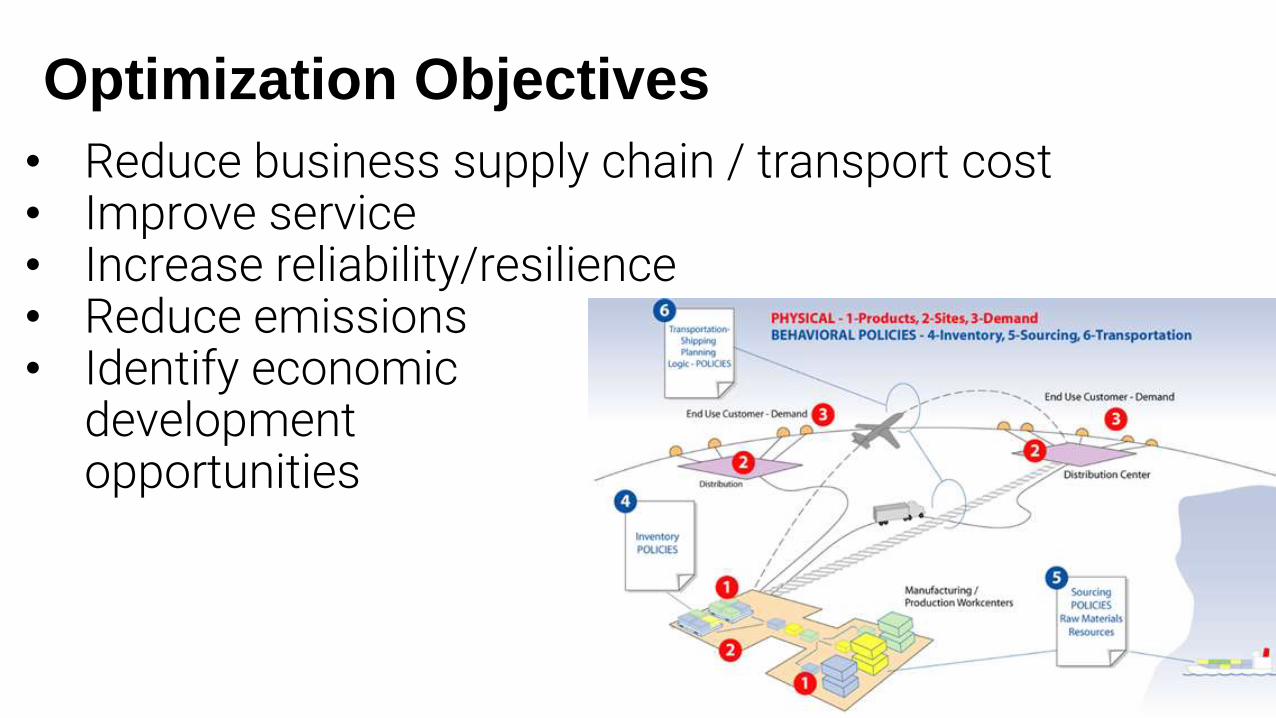
Optimization Objectives
• Reduce business supply chain / transport cost• Improve service• Increase reliability/resilience• Reduce emissions • Identify economic
development opportunities

Applying Optimization in Nebraska
Goal: Identify investment opportunities to lower business transportation costs & promote economic growth.
• NDOT: Test investment scenarios to reduce transport costso Supply chain approach to capacity/access solutions o Quantify multimodal cost saving opportunities (public and private)
• DED: Attract new business developmento Identify industries most suited to Nebraska based on:
1) Transport cost, 2) Speed to market, and 3) Network resiliency.

Data Assessment & Stakeholder Outreach:Seeking the Right Focus
• Private companies look at only their data and see only solutions affecting their supply chain
• Public sector looks high-level (commodity flows) for trade relationships/mode share
• Integrating public flow data with private shipment data enables optimization to identify solutions across all modes, for all users
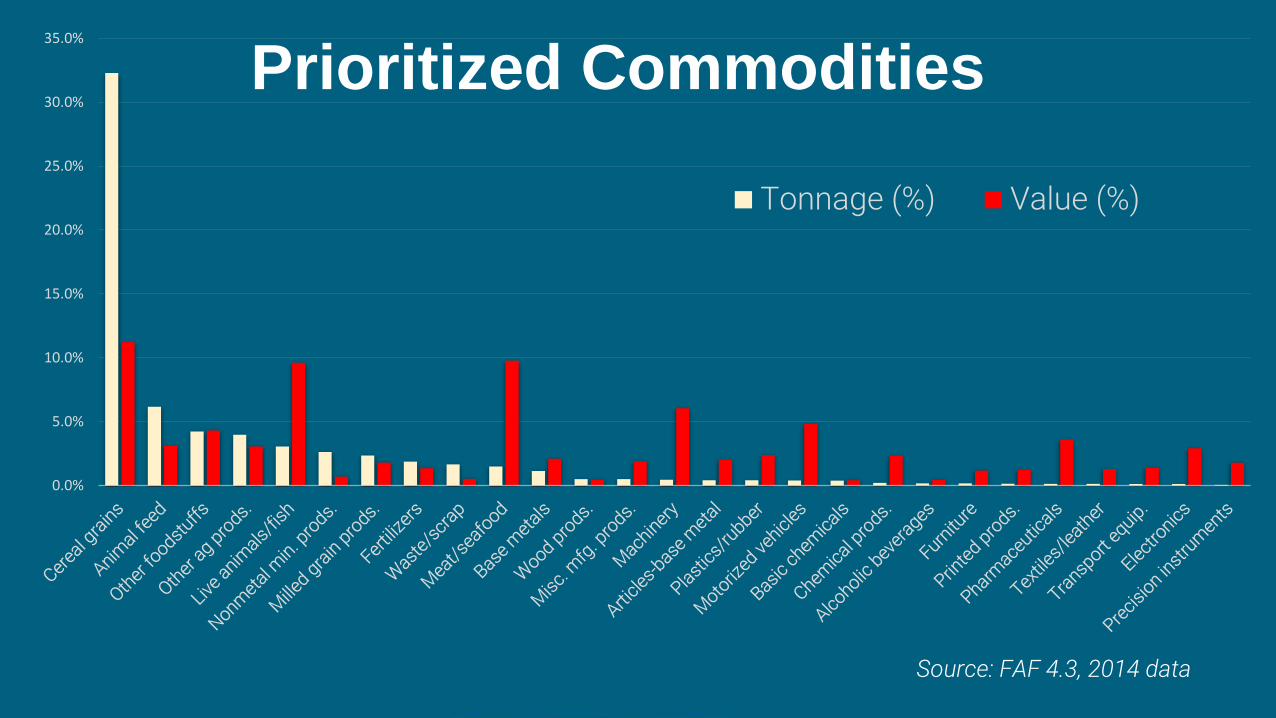
Prioritized Commodities
© 2016 Quetica, LLC. Source: FAF 4.3, 2014 data
0.0%
5.0%
10.0%
15.0%
20.0%
25.0%
30.0%
35.0%
Tonnage (%) Value (%)
Source: FAF 4.3, 2014 data
Prioritized Commodities

Some Import/Export Observations • Ocean freight is critical:
o Over 50% of NE’s ocean freight exports use ports in Louisiana
o Over 18% of NE’s imports use ports in LA/Long Beach
• Prioritized commodities = 92% of total export value
• Ag. Products account for 61% of total export value
• 63% of NE exports go to: Canada, China, Japan, Mexico, and Korea
• 73% of NE imports come from Canada, China, Germany, Mexico, and Japan $-
$1,000
$2,000
$3,000
$4,000
$5,000
$6,000
$7,000
$8,000
Ocean$ Air$ Other$
$M
M
Export Import
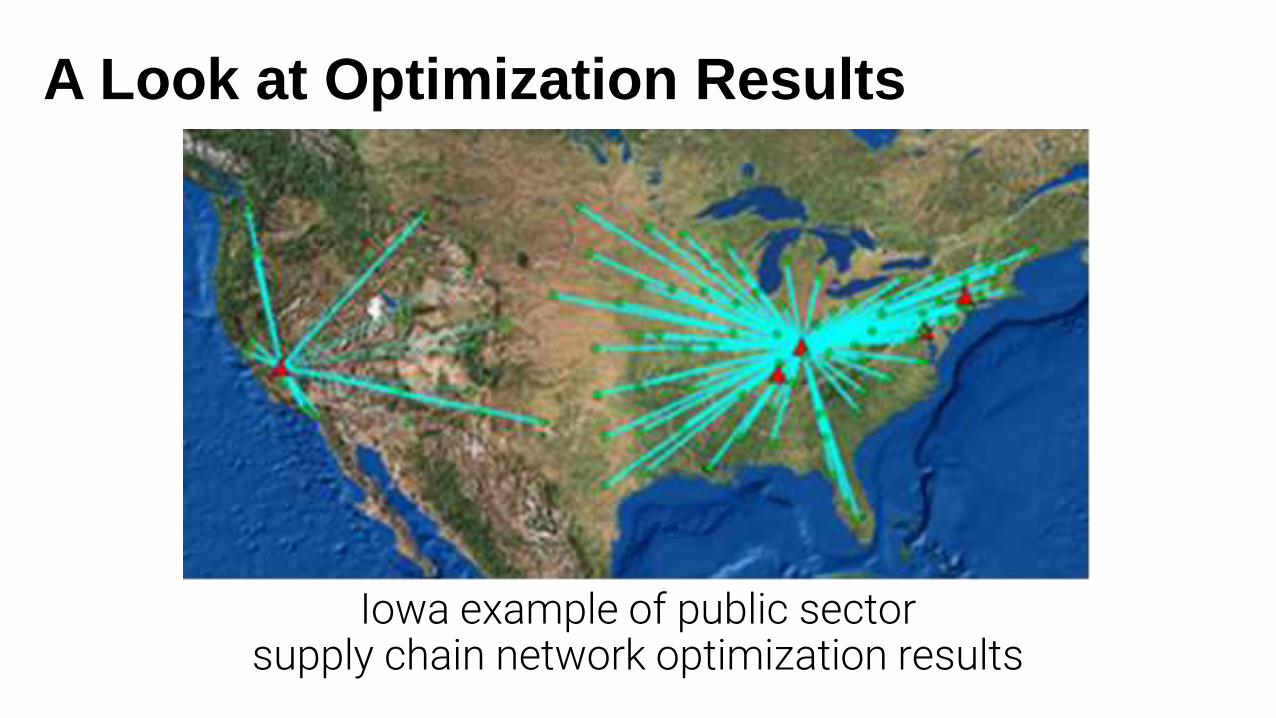
A Look at Optimization Results
Iowa example of public sector supply chain network optimization results
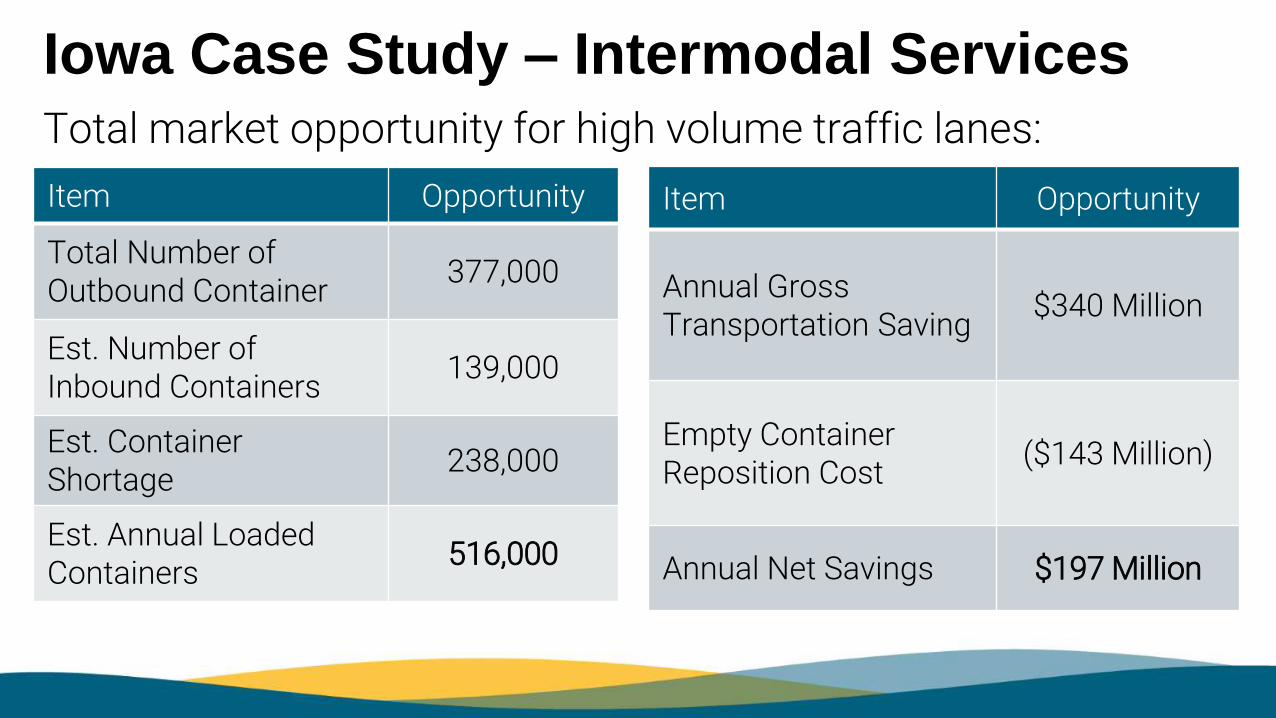
Iowa Case Study – Intermodal Services
Item Opportunity
Total Number of Outbound Container
377,000
Est. Number of Inbound Containers
139,000
Est. Container Shortage
238,000
Est. Annual Loaded Containers
516,000
Item Opportunity
Annual Gross Transportation Saving
$340 Million
Empty Container Reposition Cost
($143 Million)
Annual Net Savings $197 Million
Total market opportunity for high volume traffic lanes:
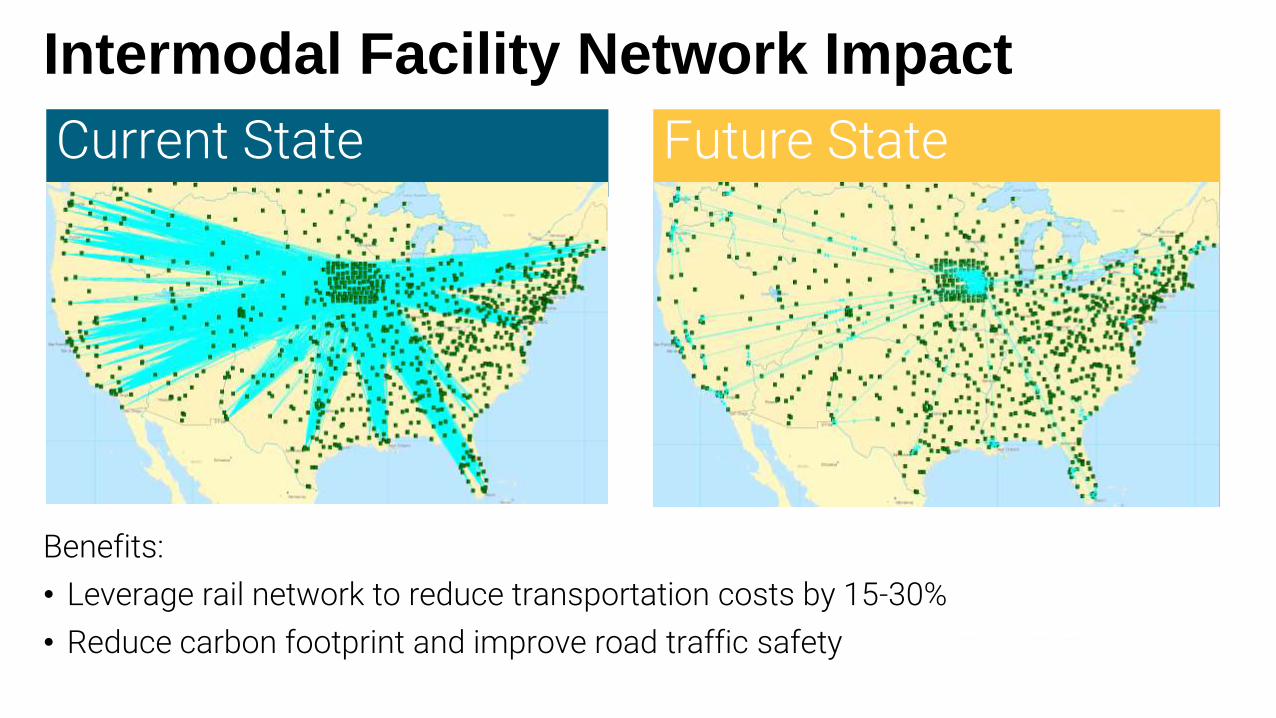
Intermodal Facility Network Impact
Benefits:
• Leverage rail network to reduce transportation costs by 15-30%
• Reduce carbon footprint and improve road traffic safety
Current State Future State
Putting it All Together: Practical Lessons for Site Preparation
Courtney Dunbar
Site Preparedness for Freight ProjectsConnecting Nebraska Communities to the World Economy
Nebraska Governor’s Economic Development Summit
July 13, 2017

Freight and Logistics Industry
Companies utilizing a variety of transportation modes such as truck transport, air service, freight rail, and maritime transport to serve
customers efficiently through coordinated goods movement.
Examples include: E-commerce, manufacturing suppliers, and retail warehousing
Most common sectors: warehousing and distribution
The main crisis in local economic development today is irrelevance.
Rick Weddle, Measurement Radical Marketing

Early Site Selection Considerations

Capturing Freight and Logistics End-UsersDesirable Site Characteristics
• Identified freight and logistics patterns; establishment of market
• Controlled land tracts
• Infrastructure-ready
• Favorable natural environment factors
• Excellent transportation access
• Understood rail service capability and capacities
• Appropriate buffering, staging, and storage opportunity
• Identified permitting timelines
• Zoning and covenant protections
• Incentives suited to both developers and end-users
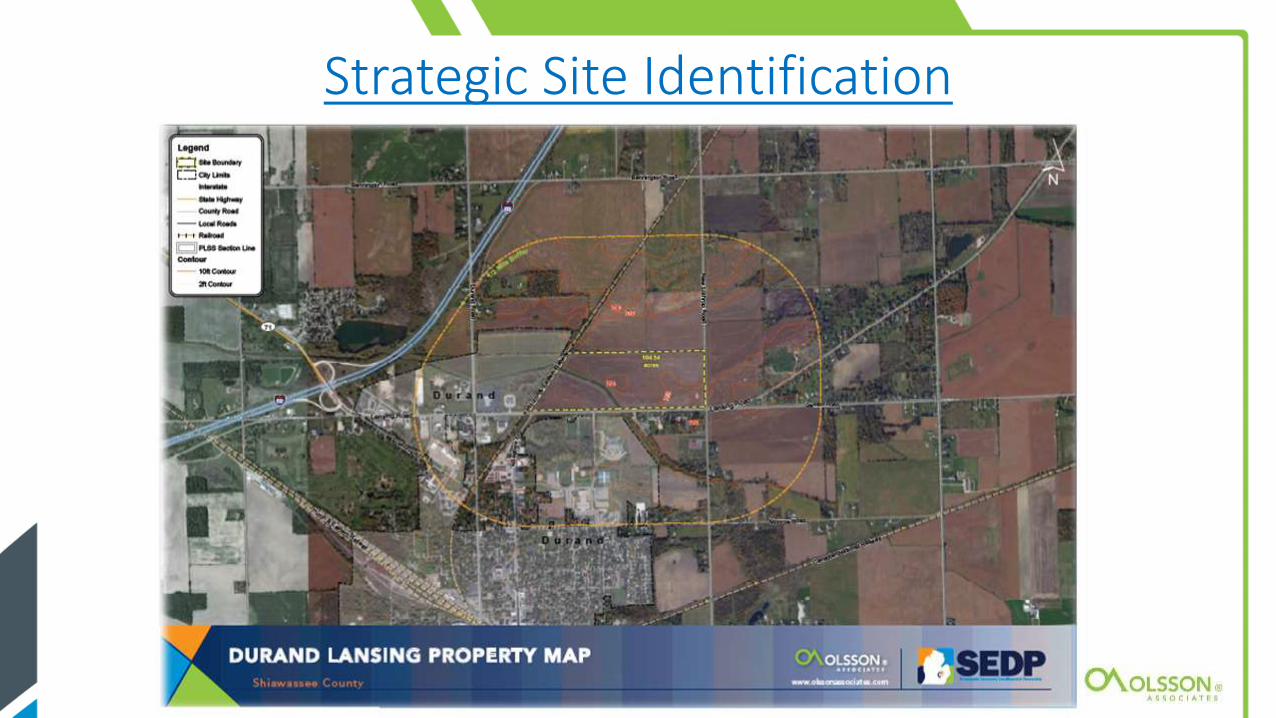
Strategic Site Identification
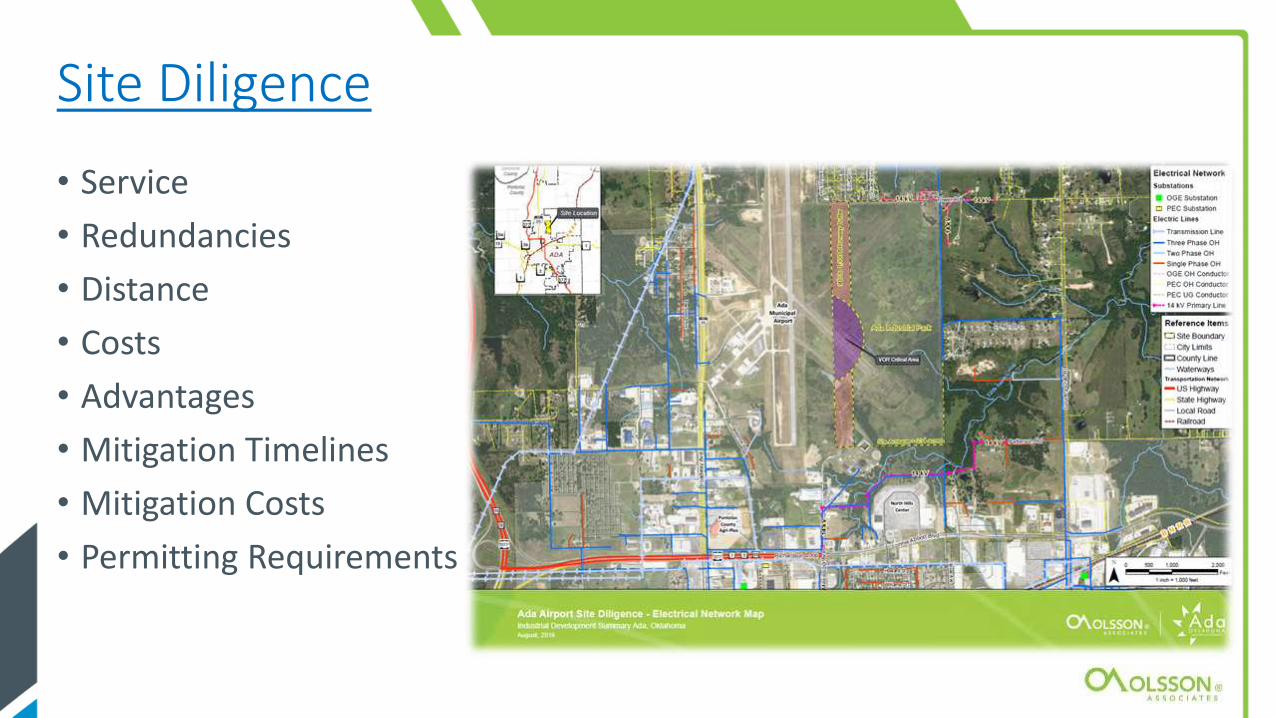
Site Diligence
• Service
• Redundancies
• Distance
• Costs
• Advantages
• Mitigation Timelines
• Mitigation Costs
• Permitting Requirements
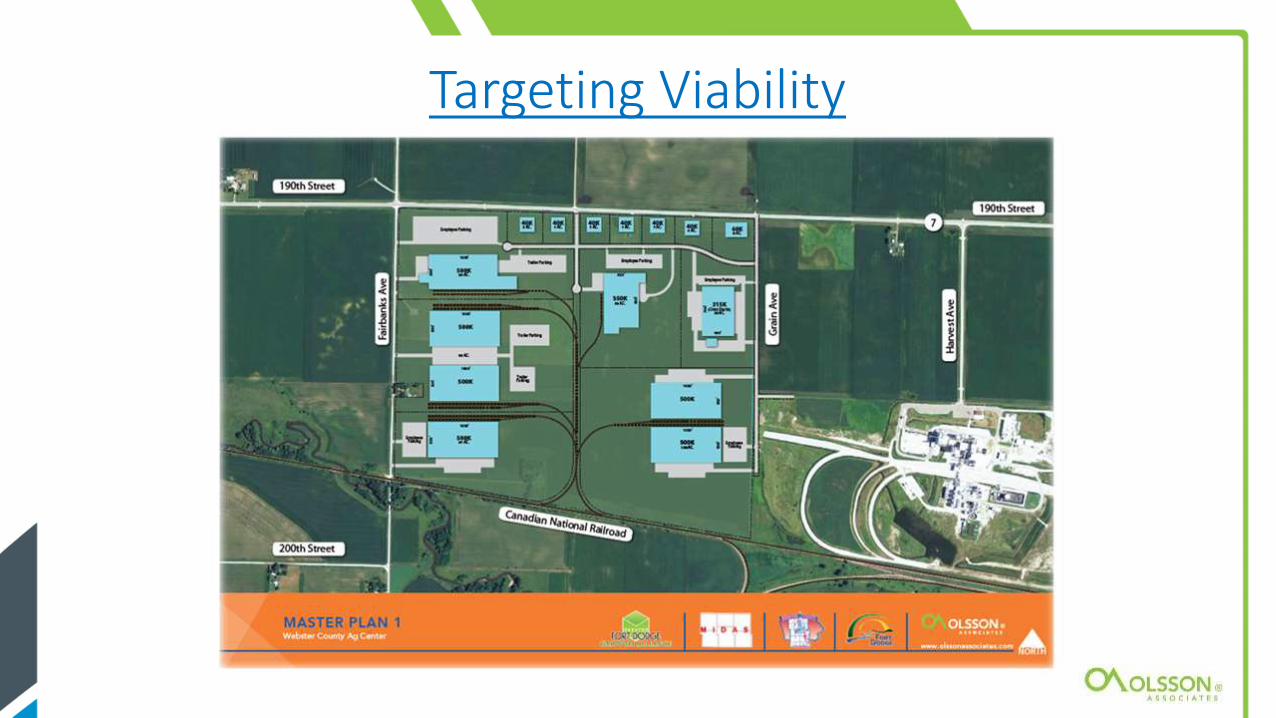
Targeting Viability
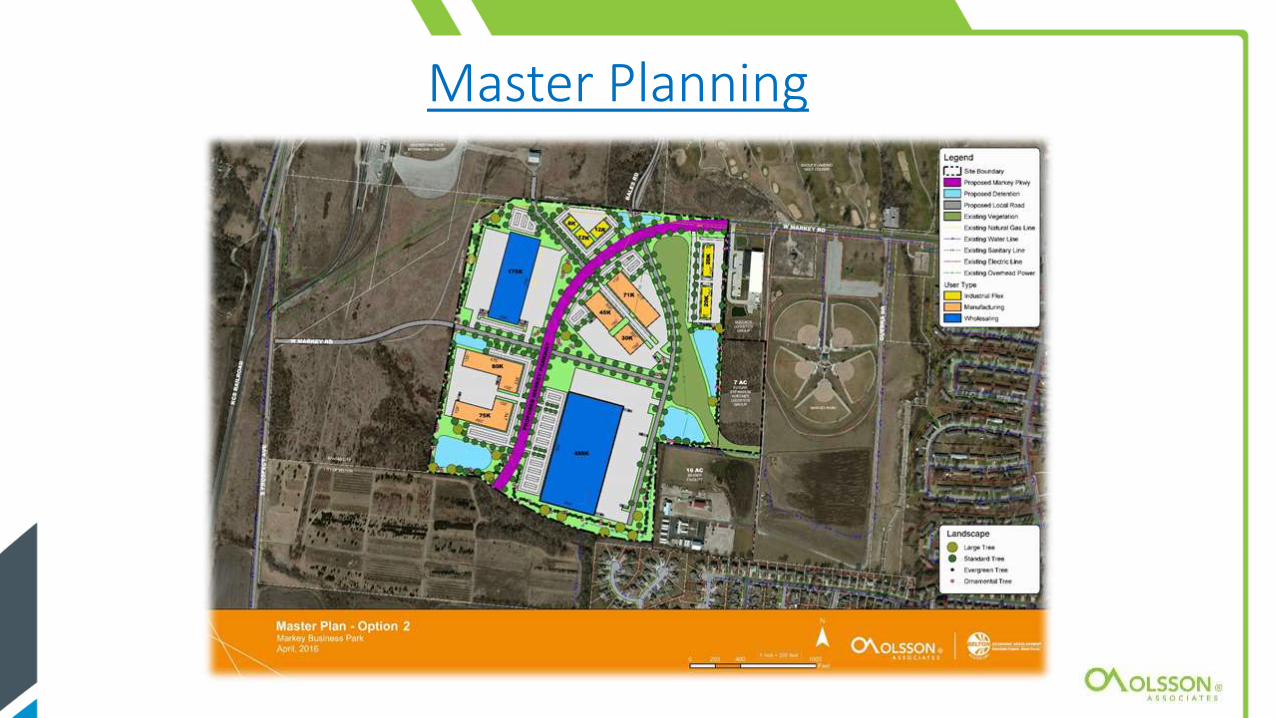
Master Planning
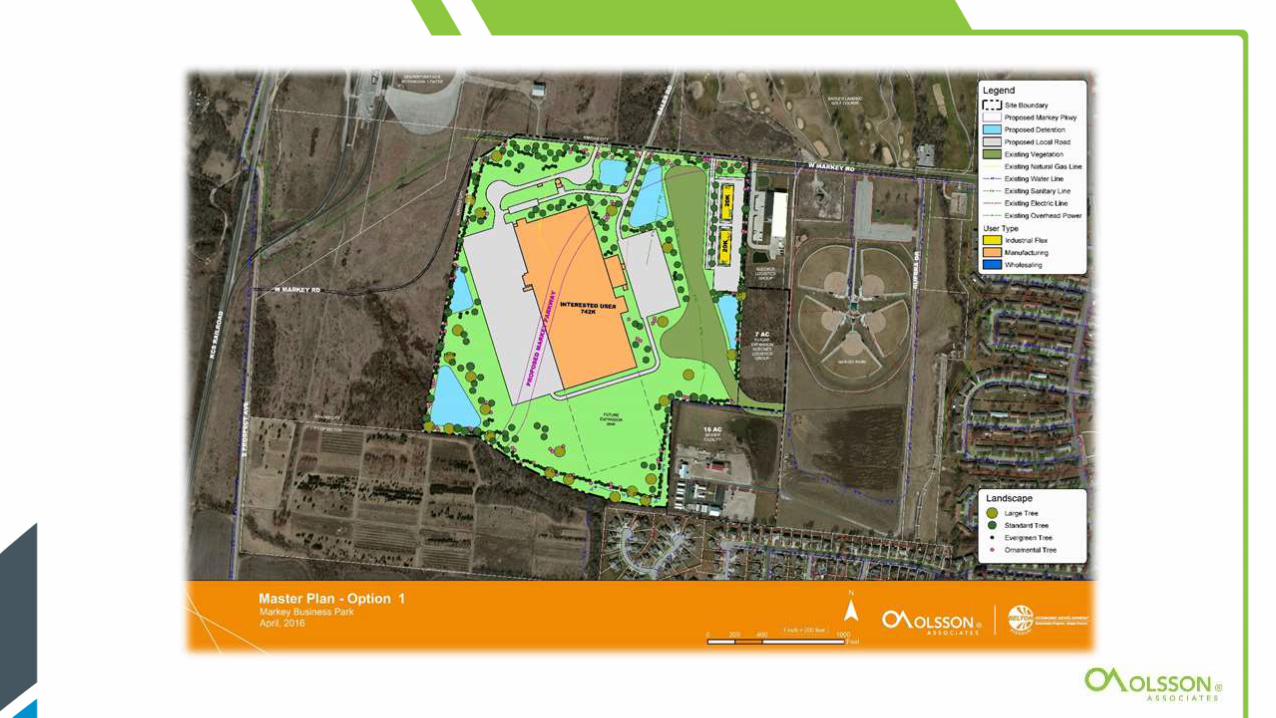


Logical Easement and Access Considerations

Planning, Zoning, and Industrial Development
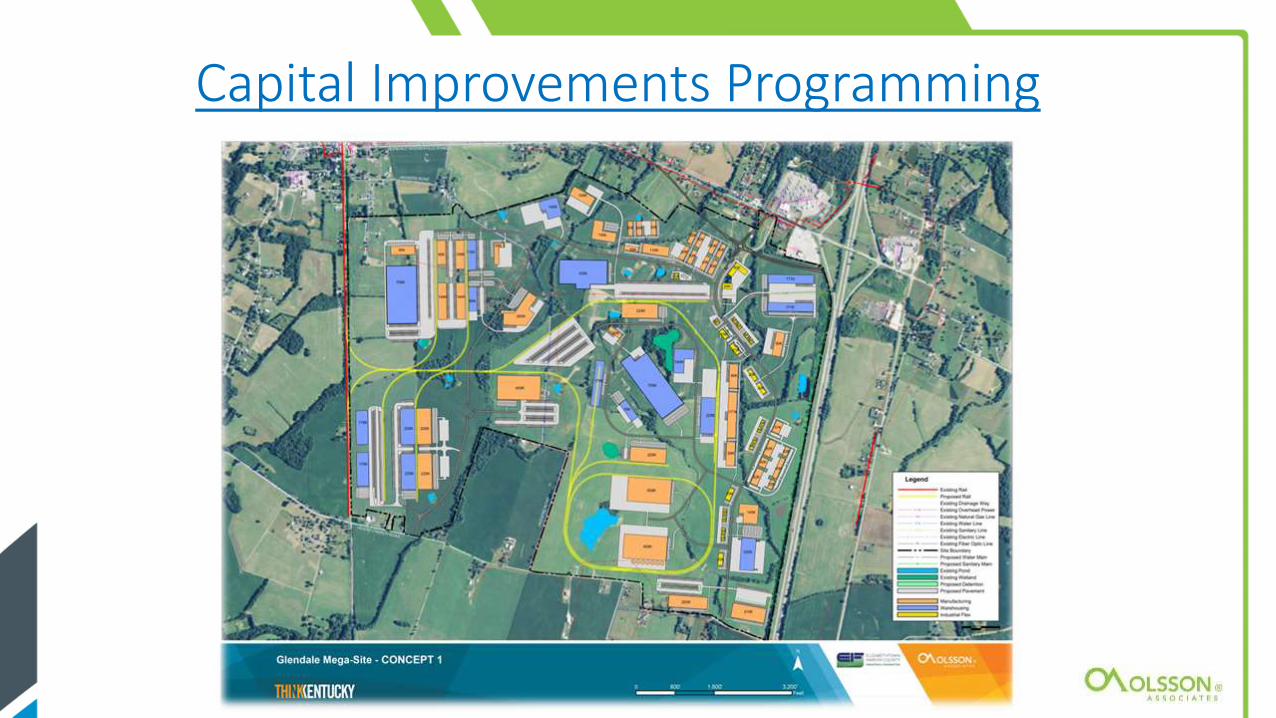
Capital Improvements Programming

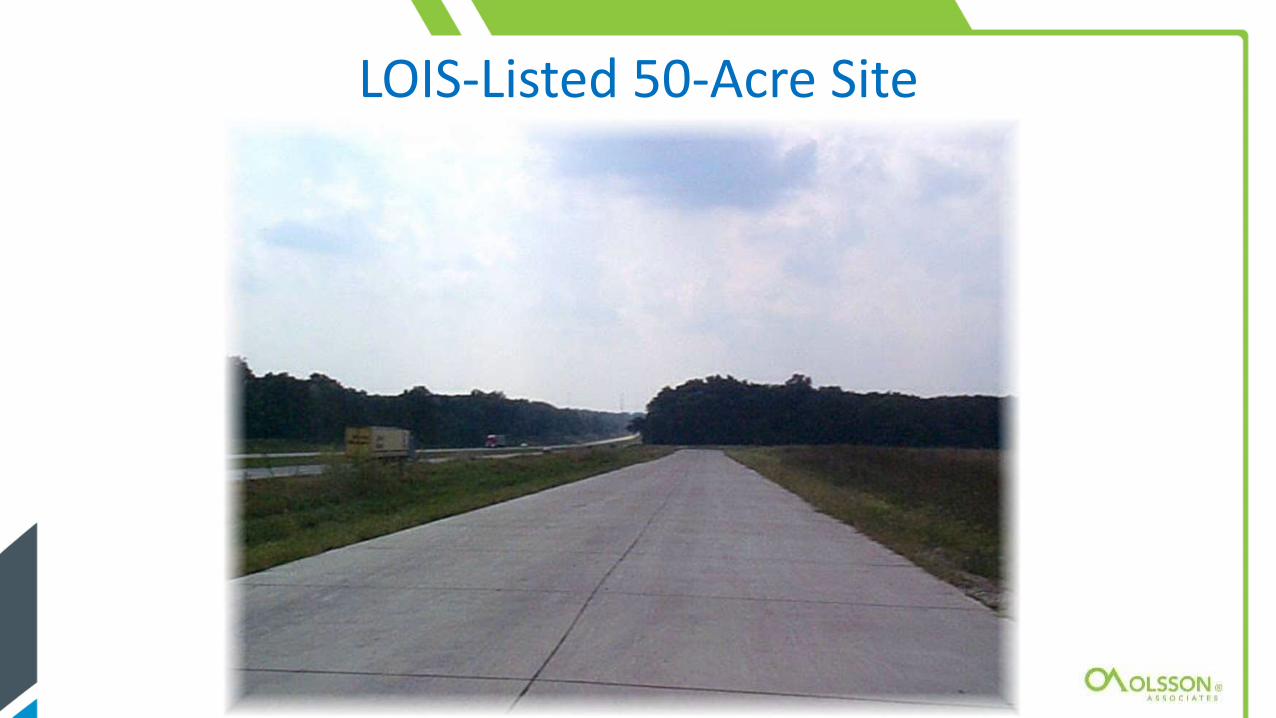
LOIS-Listed 50-Acre Site


Courtney Dunbar CEcD, EDFP, AICP
Industrial Program Leader
Olsson Associates
2111 South 67th Street, Ste. 200
Omaha, NE 68116
402.938.2432
402.201.8822
www.olssonassociates.com
Questions?

Site Preparedness for Freight Project Opportunities
Locate prospective land tracts for development consideration
Complete site diligence assessment
Identify market-based freight and logistics industry targets
Assess viability of development targets to land tract capabilities
Create master plan options aligned to market demand
Align capital improvements to support identified tracts
Ensure incentive and concession allowances are
Package marketing materials to strategically align to targets
Align marketing priorities to address likely end-user verticals