The Impact of hanging irths on Nebraska’s School Aged ... · The Impact of hanging irths on...
11
1 The Impact of Changing Births on Nebraska’s School Aged Children Jerry Deichert 1 Center for Public Affairs Research University of Nebraska at Omaha July 2014 Overview The number of school aged children and subsequently school enrollment is determined in large part on the number of births that occurred to residents of an area during the prior seventeen years. This report will review the number of births in Nebraska between 1946 and 2013 by groups of counties based on metropolitan/non-metropolitan status and the size of the largest community in the county. Using these values, we can estimate the potential number of school-aged children and how this varies among these groups of counties 2 . Figure 1. Births for Nebraska, 1946 to 2013 Source: Vital Statistics Reports, Nebraska Department of Health and Human Services 1 With assistance from Byungwoo Shine Cho, School of Public Administration, UNO. 2 For a map illustrating these areas, see page 10. 20,000 22,000 24,000 26,000 28,000 30,000 32,000 34,000 36,000 1946 1948 1950 1952 1954 1956 1958 1960 1962 1964 1966 1968 1970 1972 1974 1976 1978 1980 1982 1984 1986 1988 1990 1992 1994 1996 1998 2000 2002 2004 2006 2008 2010 2012 Births
Transcript of The Impact of hanging irths on Nebraska’s School Aged ... · The Impact of hanging irths on...

1
The Impact of Changing Births on Nebraska’s School Aged Children
Jerry Deichert1 Center for Public Affairs Research University of Nebraska at Omaha
July 2014
Overview
The number of school aged children and subsequently school enrollment is determined in large part on the number of births that occurred to residents of an area during the prior seventeen years. This report will review the number of births in Nebraska between 1946 and 2013 by groups of counties based on metropolitan/non-metropolitan status and the size of the largest community in the county. Using these values, we can estimate the potential number of school-aged children and how this varies among these groups of counties2.
Figure 1. Births for Nebraska, 1946 to 2013
Source: Vital Statistics Reports, Nebraska Department of Health and Human Services
1 With assistance from Byungwoo Shine Cho, School of Public Administration, UNO. 2 For a map illustrating these areas, see page 10.
20,000
22,000
24,000
26,000
28,000
30,000
32,000
34,000
36,000
19
46
19
48
19
50
19
52
19
54
19
56
19
58
19
60
19
62
19
64
19
66
19
68
19
70
19
72
19
74
19
76
19
78
19
80
19
82
19
84
19
86
19
88
19
90
19
92
19
94
19
96
19
98
20
00
20
02
20
04
20
06
20
08
20
10
20
12
Bir
ths
The Impacts of Changing Births on Nebraska’s School Aged Children
2
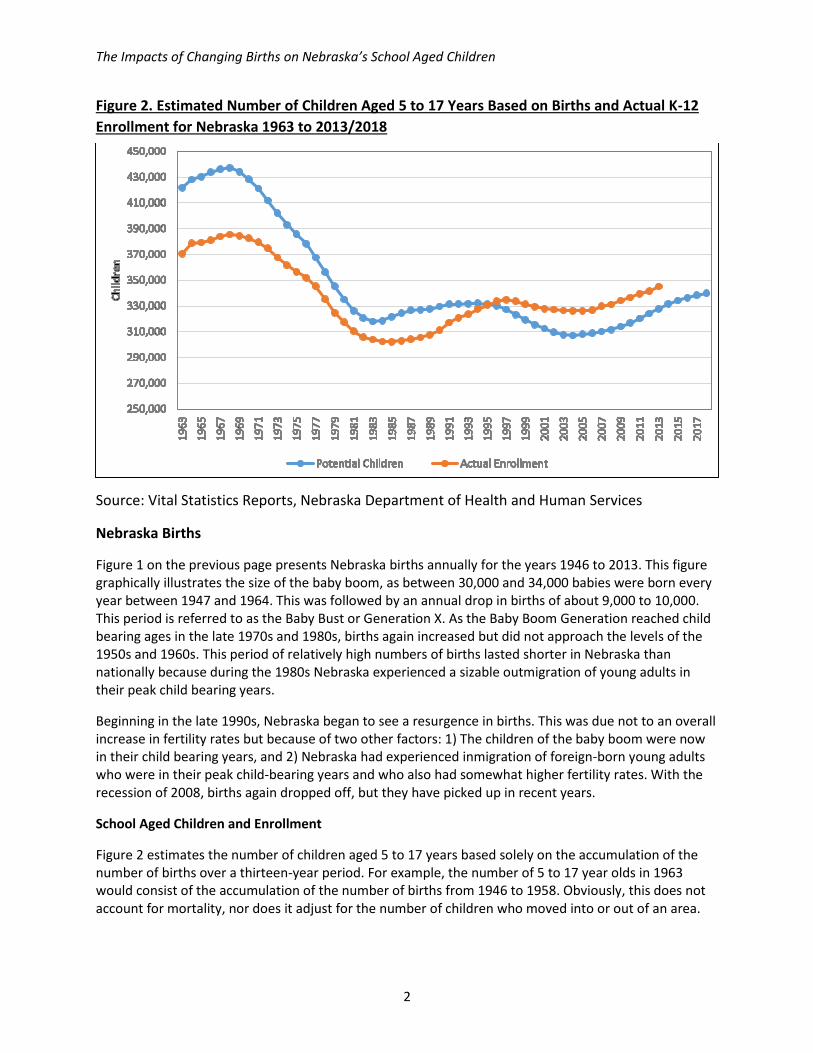
Figure 2. Estimated Number of Children Aged 5 to 17 Years Based on Births and Actual K-12
Enrollment for Nebraska 1963 to 2013/2018
Source: Vital Statistics Reports, Nebraska Department of Health and Human Services
Nebraska Births
Figure 1 on the previous page presents Nebraska births annually for the years 1946 to 2013. This figure graphically illustrates the size of the baby boom, as between 30,000 and 34,000 babies were born every year between 1947 and 1964. This was followed by an annual drop in births of about 9,000 to 10,000. This period is referred to as the Baby Bust or Generation X. As the Baby Boom Generation reached child bearing ages in the late 1970s and 1980s, births again increased but did not approach the levels of the 1950s and 1960s. This period of relatively high numbers of births lasted shorter in Nebraska than nationally because during the 1980s Nebraska experienced a sizable outmigration of young adults in their peak child bearing years.
Beginning in the late 1990s, Nebraska began to see a resurgence in births. This was due not to an overall increase in fertility rates but because of two other factors: 1) The children of the baby boom were now in their child bearing years, and 2) Nebraska had experienced inmigration of foreign-born young adults who were in their peak child-bearing years and who also had somewhat higher fertility rates. With the recession of 2008, births again dropped off, but they have picked up in recent years.
School Aged Children and Enrollment
Figure 2 estimates the number of children aged 5 to 17 years based solely on the accumulation of the number of births over a thirteen-year period. For example, the number of 5 to 17 year olds in 1963 would consist of the accumulation of the number of births from 1946 to 1958. Obviously, this does not account for mortality, nor does it adjust for the number of children who moved into or out of an area.

The Impacts of Changing Births on Nebraska’s School Aged Children
3
Looking at Figure 2, it can be seen the estimated number of school-aged children peaked in 1968 at just over 437,000 children. By 1983, the number had fallen to just under 318,000 children (about a 25 percent decline). The estimated number of children rebounded somewhat in the 1990s but again fell until it reached a low in 2004 of slightly more than 307,000 children. Since 2004, this age group has recorded a slow and steady increase. By 2018, this value will approach 340,000.
The question then becomes, “How is this estimated number of children related to actual enrollment?” To answer this question, we looked at enrollments between 1963 and 2013 and included them in Figure 2. Comparing enrollments to the estimated number of school-aged children, shows the general trends are the same, but until 1995 the estimated number of children was larger than enrollment, and since that time enrollment has been larger. There are likely many reasons for this discrepancy, but we know that prior to the mid-90s, Nebraska had an outmigration of young families. Since then, there has been an inmigration of young families.
Focusing only on the estimated number of school-aged children, it appears that for the next five years Nebraska’s K-12 enrollment could increase an average of about 2,500 students a year. The next sections will look at how this change might be dispersed among the state’s counties.
Births by County
Figures 3 – 5 indicate the number of births for groups of counties based on metropolitan/non-metropolitan status and the size of the largest community in the county.
Figure 3. Births for Nebraska Counties by Metropolitan and Non-metropolitan Status (2013
Definitions), 1946 to 2013
Source: Vital Statistics Reports, Nebraska Department of Health and Human Services
0
5,000
10,000
15,000
20,000
25,000
19
46
19
48
19
50
19
52
19
54
19
56
19
58
19
60
19
62
19
64
19
66
19
68
19
70
19
72
19
74
19
76
19
78
19
80
19
82
19
84
19
86
19
88
19
90
19
92
19
94
19
96
19
98
20
00
20
02
20
04
20
06
20
08
20
10
20
12
Bir
ths
Metropolitan Nonmetropolitan

The Impacts of Changing Births on Nebraska’s School Aged Children
4
Figure 4. Births for Nebraska Counties by Metropolitan Status (2013 Definitions), 1946 to
2013
Source: Vital Statistics Reports, Nebraska Department of Health and Human Services
Figure 5. Births for Nebraska Counties by Non-metropolitan Status (2013 Definitions), 1946 to
2013
Source: Vital Statistics Reports, Nebraska Department of Health and Human Services
0
500
1,000
1,500
2,000
2,500
3,000
3,500
4,000
0
2,000
4,000
6,000
8,000
10,000
12,000
14,000
16,0001
94
6
19
49
19
52
19
55
19
58
19
61
19
64
19
67
19
70
19
73
19
76
19
79
19
82
19
85
19
88
19
91
19
94
19
97
20
00
20
03
20
06
20
09
20
12
Oth
er
Me
tro
po
litan
Bir
ths
Do
ugl
as, L
anca
ste
r, S
arp
y B
irth
s
Douglas, Lancaster, Sarpy Other metropolitan
0
1,000
2,000
3,000
4,000
5,000
6,000
7,000
8,000
19
46
19
48
19
50
19
52
19
54
19
56
19
58
19
60
19
62
19
64
19
66
19
68
19
70
19
72
19
74
19
76
19
78
19
80
19
82
19
84
19
86
19
88
19
90
19
92
19
94
19
96
19
98
20
00
20
02
20
04
20
06
20
08
20
10
20
12
Bir
ths
Micropolitan core Largest city 2,500 to 9,999 Largest city under 2,500

The Impacts of Changing Births on Nebraska’s School Aged Children
5
Figure 3 looks at births for metropolitan and non-metropolitan counties in Nebraska. Up until 1957, non-metropolitan Nebraska had more births than metropolitan Nebraska. Between then and 1980, the trend for the two groups was similar, and the difference was almost the same for each year. After 1980, however, metropolitan Nebraska has experienced a slow and steady increase until the most recent recession, while non-metropolitan Nebraska has experienced a slow and steady decline in the number of births. In 2013, there were 17,507 births to metropolitan residents, compared with 8,587 births to non-metropolitan residents.
Breaking metropolitan Nebraska into two groups (see Figure 4)—Douglas, Lancaster, and Sarpy Counties compared with the remainder of metropolitan counties—shows that nearly all of the growth in the metropolitan counties was in Douglas, Lancaster, and Sarpy Counties. Compared to 1980, these three counties have recorded about 3,000 more births, while the remaining metropolitan counties have about 350 fewer births. In comparing these three counties to the other groups of counties in Figures 4 and 5, it can be seen that they are the only ones with more births in 2013 than in 1980 and nearly as many as the baby boom peak in 1961. In 2013, Douglas, Lancaster, and Sarpy Counties accounted for more than 57 percent of Nebraska’s births.
Figure 5 separates non-metropolitan counties into three groups—micropolitan core (counties with a city of at least 10,000 persons), counties where the largest city was between 2,500 and 9,999 persons, and counties with no city above 2,500 persons. Births in 2013 for each of these groups were significantly below their baby boom peaks and also below their 1980 values. However, the number of births in the micropolitan core counties has remained relatively stable since 1988, and the counties with mid-sized cities have had steady births since the mid-90s. On the other hand, the number of birth in those counties with no city above 2,500 persons has declined steadily.
School Aged Children by County
As shown for the state, births by county group also can be accumulated over a thirteen-year period to get an estimate of the school-aged population. These data are presented in Figures 6-8 on the following page. Figure 6 shows that the estimated number of children based on births increased steadily for metropolitan Nebraska since the mid-80s, with the 2018 projections higher than the peak baby boom year of 1970. With the exception of the period from about 1982 to 1992, non-metropolitan Nebraska had experienced a steady decline in the estimated number of school-aged children. On a positive note, there has been very little change since 2010.
For the metropolitan counties, the strength in the estimated number of school-aged children can be found in Douglas, Lancaster, and Sarpy Counties, as these three counties have shown steady growth since the 1980s, while the remainder of the metropolitan counties has remained relatively flat. The 2018 projection for the state’s three most populous counties is well above their baby boom peak in 1971.
For the non-metropolitan counties in Nebraska, the picture is much less positive, as all three of the county groups have fewer estimated school-aged children currently than they had twenty years ago. The counties with the smallest communities recorded the largest decline. In fact, in 1963, these counties were estimated to have had 85,000 school-aged children, but the projections for 2018 show this dropping to 25,000 children. On a more optimistic outlook, the state’s micropolitan core counties have been experiencing a slight increase in the estimated number of school-aged children since 2004.

The Impacts of Changing Births on Nebraska’s School Aged Children
6
Figure 6. Estimated Number of Children Aged 5 to 17 Years Based on Births for Nebraska Counties by Metropolitan and Non-metropolitan Status (2013 Definitions), 1963 to 2018
Source: Vital Statistics Reports, Nebraska Department of Health and Human Services; calculations by UNO Center for Public Affairs Research
Figure 7. Estimated Number of Children Aged 5 to 17 Years Based on Births for Nebraska Counties by Metropolitan Status (2013 Definitions), 1963 to 2018
Source: Vital Statistics Reports, Nebraska Department of Health and Human Services; calculations by UNO Center for Public Affairs Research
0
50,000
100,000
150,000
200,000
250,000
19
63
19
65
19
67
19
69
19
71
19
73
19
75
19
77
19
79
19
81
19
83
19
85
19
87
19
89
19
91
19
93
19
95
19
97
19
99
20
01
20
03
20
05
20
07
20
09
20
11
20
13
20
15
20
17
Ch
ildre
n
Metropolitan Nonmetropolitan
0
5,000
10,000
15,000
20,000
25,000
30,000
35,000
40,000
45,000
50,000
0
20,000
40,000
60,000
80,000
100,000
120,000
140,000
160,000
180,000
200,000
19
63
19
65
19
67
19
69
19
71
19
73
19
75
19
77
19
79
19
81
19
83
19
85
19
87
19
89
19
91
19
93
19
95
19
97
19
99
20
01
20
03
20
05
20
07
20
09
20
11
20
13
20
15
20
17
Oth
er
Me
tro
po
litan
Ch
ildre
n
Do
ugl
as, L
anca
ste
r, a
nd
Sar
py
Ch
ildre
n
Douglas, Lancaster, Sarpy Other metropolitan

The Impacts of Changing Births on Nebraska’s School Aged Children
7
Figure 8. Estimated Number of Children Aged 5 to 17 Years Based on Births for Nebraska Counties by Non-metropolitan Status (2013 Definitions), 1963 to 2018
Source: Vital Statistics Reports, Nebraska Department of Health and Human Services; calculations by UNO Center for Public Affairs Research
Projections of the Number of Estimated School-Aged Children
Since the number of births are known through 2013, we can project the number of potential school-aged children for the next five years to 2018. Figure 9 presents the change in the number of school-aged children between 2013 and 2018 using the projection technique described earlier. Although not a direct measure of enrollment, these numbers should give an indication of what might be expected in the next five years.
Between 2013 and 2018, based on historical births, we expect the state to add 11,492 school-aged children. Collectively, we project that the state’s thirteen metropolitan counties will add 12,268 school-aged children, while the state’s eighty non-metropolitan counties will have 326 fewer school-aged children. Dividing the metropolitan counties into Douglas, Lancaster, and Sarpy Counties and the remainder of the metropolitan counties, nearly all of the potential growth in enrollment in the next five years will be in the state’s three most populous counties. Together these three counties are projected to have an increase of 11,963 in the number of school-aged children. The remaining metropolitan counties will add 305 children.
For Nebraska’s non-metropolitan counties, the micropolitan core counties will experience an increase of 733 school-aged children. Those counties with the largest city between 2,500 and 9,999 will see a decline of 148 children, while the counties with no city above 2,500 will have a decline of 911 children.
0
10,000
20,000
30,000
40,000
50,000
60,000
70,000
80,000
90,0001
96
3
19
65
19
67
19
69
19
71
19
73
19
75
19
77
19
79
19
81
19
83
19
85
19
87
19
89
19
91
19
93
19
95
19
97
19
99
20
01
20
03
20
05
20
07
20
09
20
11
20
13
20
15
20
17
Ch
ildre
n
Micropolitan core Largest city 2,500 to 9,999 Largest city under 2,500

The Impacts of Changing Births on Nebraska’s School Aged Children
8
Figure 9. Expected Change in the Projected Number of Children Aged 5 to 17 Years Based on
Births for Nebraska Counties by Metropolitan and Non-metropolitan Status (2013
Definitions), 2013 to 2018
Source: Vital Statistics Reports, Nebraska Department of Health and Human Services; calculations by UNO Center for Public Affairs Research
School Membership by Grade
Figures 10-12 show the 2013-2014 membership by grade. This is another method to suggest what may happen to future enrollments in Nebraska schools. Counties with growing enrollments will have lower grades with more students than upper grades, and counties with declining enrollments will have upper grades with more students. Looking at Figure 10, it shows that
Nebraska had more students in lower grades than in upper grades confirming the earlier projections of increasing enrollments for the next five years. A similar pattern existed for Nebraska’s metropolitan counties (Figure 11), again confirming increasing enrollments. The non-metropolitan counties show little change.
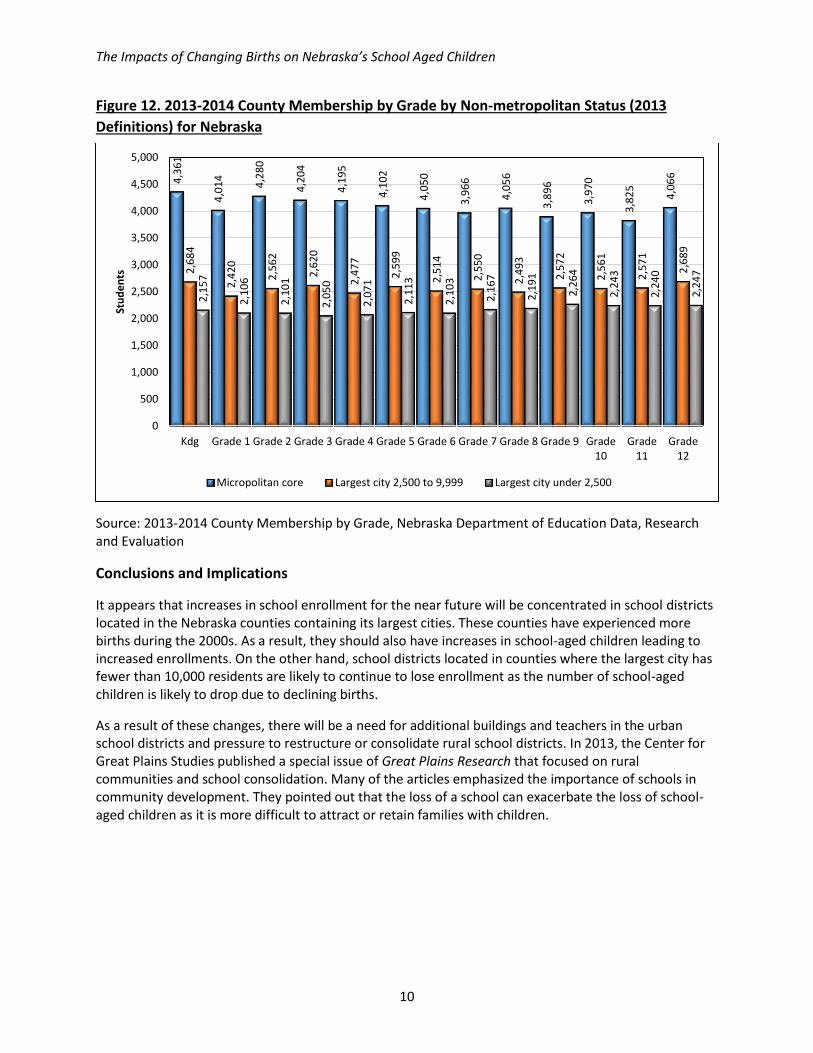
Figure 12 presents the membership information for the three types of non-metropolitan counties. As demonstrated earlier, it shows that the micropolitan counties should have increasing enrollments; counties with the largest city between 2,500 to 9,999 residents should have little change in enrollments; and counties with no city above 2,500 should have declining enrollments.
11,942 12,268 11,963
305
-326
733
-148-911-2,000
0
2,000
4,000
6,000
8,000
10,000
12,000
14,000
Ch
ildre
n

The Impacts of Changing Births on Nebraska’s School Aged Children
9
Figure 10. 2013-2014 Membership by Grade for Nebraska
Source: 2013-2014 County Membership by Grade, Nebraska Department of Education Data, Research and Evaluation
Figure 11. 2013-2014 County Membership by Grade by Metropolitan and Non-metropolitan Status (2013 Definitions) for Nebraska
Source: 2013-2014 County Membership by Grade, Nebraska Department of Education Data, Research and Evaluation
27,000
24,735
26,057
25,74425,911
25,416
25,10724,901
24,777
24,40524,181
23,873
25,258
22,000
22,500
23,000
23,500
24,000
24,500
25,000
25,500
26,000
26,500
27,000
27,500
Kdg Grade 1 Grade 2 Grade 3 Grade 4 Grade 5 Grade 6 Grade 7 Grade 8 Grade 9 Grade10
Grade11
Grade12
Stu
de
nts
17
,79
8
16
,19
5
17
,11
4
16
,87
0
17
,16
8
16
,60
2
16
,44
0
16
,21
8
16
,03
7
15
,67
3
15
,40
7
15
,23
7
16
,25
6
9,2
02
8,5
40
8,9
43
8,8
74
8,7
43
8,8
14
8,6
67
8,6
83
8,7
40
8,7
32
8,7
74
8,6
36
9,0
02
5,000
7,000
9,000
11,000
13,000
15,000
17,000
19,000
Kdg Grade 1 Grade 2 Grade 3 Grade 4 Grade 5 Grade 6 Grade 7 Grade 8 Grade 9 Grade10
Grade11
Grade12
Stu
de
nts
Metropolitan Nonmetropolitan
The Impacts of Changing Births on Nebraska’s School Aged Children
10
Figure 12. 2013-2014 County Membership by Grade by Non-metropolitan Status (2013
Definitions) for Nebraska
Source: 2013-2014 County Membership by Grade, Nebraska Department of Education Data, Research and Evaluation
Conclusions and Implications
It appears that increases in school enrollment for the near future will be concentrated in school districts located in the Nebraska counties containing its largest cities. These counties have experienced more births during the 2000s. As a result, they should also have increases in school-aged children leading to increased enrollments. On the other hand, school districts located in counties where the largest city has fewer than 10,000 residents are likely to continue to lose enrollment as the number of school-aged children is likely to drop due to declining births.
As a result of these changes, there will be a need for additional buildings and teachers in the urban school districts and pressure to restructure or consolidate rural school districts. In 2013, the Center for Great Plains Studies published a special issue of Great Plains Research that focused on rural communities and school consolidation. Many of the articles emphasized the importance of schools in community development. They pointed out that the loss of a school can exacerbate the loss of school-aged children as it is more difficult to attract or retain families with children.
4,3
61
4,0
14
4,2
80
4,2
04
4,1
95
4,1
02
4,0
50
3,9
66
4,0
56
3,8
96
3,9
70
3,8
25
4,0
66
2,6
84
2,4
20
2,5
62
2,6
20
2,4
77
2,5
99
2,5
14
2,5
50
2,4
93
2,5
72
2,5
61
2,5
71
2,6
89
2,1
57
2,1
06
2,1
01
2,0
50
2,0
71
2,1
13
2,1
03
2,1
67
2,1
91
2,2
64
2,2
43
2,2
40
2,2
47
0
500
1,000
1,500
2,000
2,500
3,000
3,500
4,000
4,500
5,000
Kdg Grade 1 Grade 2 Grade 3 Grade 4 Grade 5 Grade 6 Grade 7 Grade 8 Grade 9 Grade10
Grade11
Grade12
Stu
de
nts
Micropolitan core Largest city 2,500 to 9,999 Largest city under 2,500
The Impacts of Changing Births on Nebraska’s School Aged Children
11
Reference Map
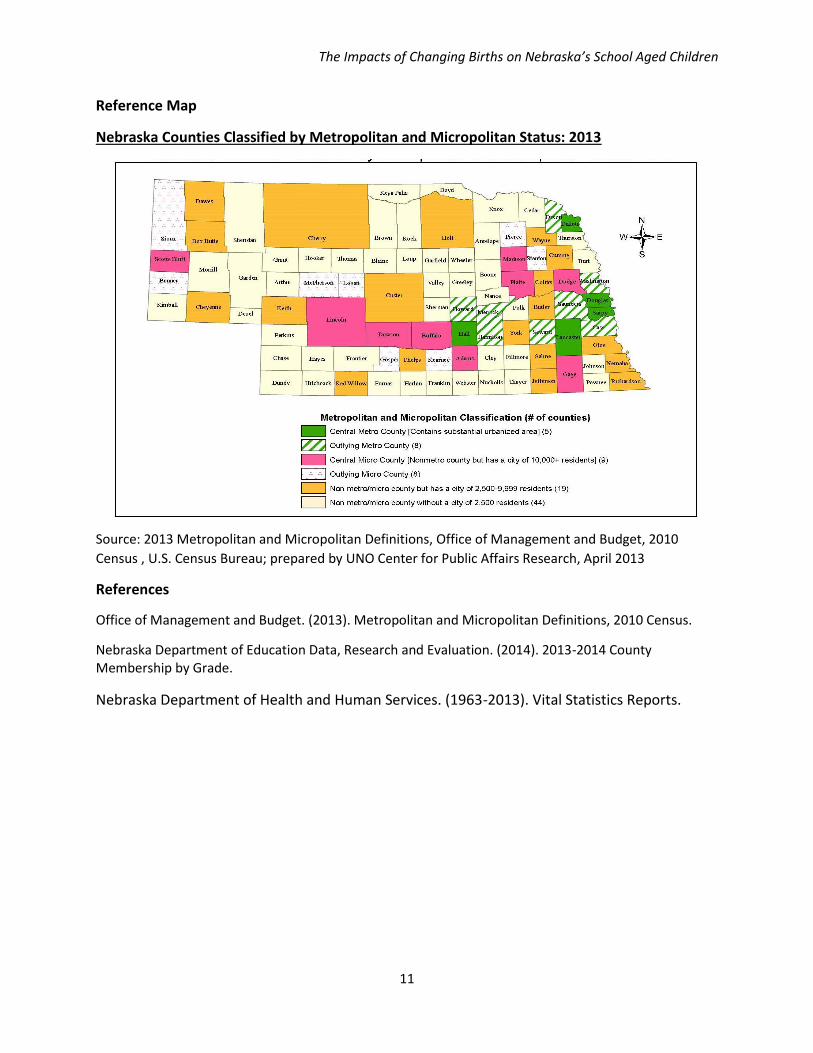
Nebraska Counties Classified by Metropolitan and Micropolitan Status: 2013
Source: 2013 Metropolitan and Micropolitan Definitions, Office of Management and Budget, 2010
Census , U.S. Census Bureau; prepared by UNO Center for Public Affairs Research, April 2013
References
Office of Management and Budget. (2013). Metropolitan and Micropolitan Definitions, 2010 Census.
Nebraska Department of Education Data, Research and Evaluation. (2014). 2013-2014 County Membership by Grade.
Nebraska Department of Health and Human Services. (1963-2013). Vital Statistics Reports.