Freeport-McMoRan Inc. · Freeport-McMoRan Inc. Created Date: 20170124174900Z ...
51
Freeport-McMoRan 1 333 North Central Avenue Phoenix, AZ 85004 Financial Contacts: Media Contact: Kathleen L. Quirk (602) 366-8016 David P. Joint (504) 582-4203 Eric E. Kinneberg (602) 366-7994 Freeport-McMoRan Reports Fourth-Quarter and Year Ended December 31, 2016 Results Net income attributable to common stock totaled $292 million, $0.21 per share, for fourth-quarter 2016. After adjusting for net charges totaling $59 million, $0.04 per share, fourth-quarter 2016 adjusted net income attributable to common stock totaled $351 million, $0.25 per share. Consolidated sales (including volumes from Tenke Fungurume (Tenke) through November 16, 2016) totaled 1.2 billion pounds of copper, 405 thousand ounces of gold and 22 million pounds of molybdenum for fourth-quarter 2016 and 4.65 billion pounds of copper, 1.1 million ounces of gold and 74 million pounds of molybdenum for the year 2016. Consolidated sales for the year 2017 are expected to approximate 4.1 billion pounds of copper, 2.2 million ounces of gold and 92 million pounds of molybdenum, including 1.0 billion pounds of copper, 460 thousand ounces of gold and 23 million pounds of molybdenum for first-quarter 2017. (*) Average realized prices were $2.47 per pound for copper, $1,174 per ounce for gold and $8.27 per pound for molybdenum for fourth-quarter 2016. Average unit net cash costs were $1.20 per pound of copper for fourth-quarter 2016 and $1.26 per pound of copper for the year 2016. Unit net cash costs are expected to average $1.06 per pound of copper for the year 2017. (*) Operating cash flows totaled $1.1 billion (net of $406 million in working capital uses and changes in other tax payments) for fourth-quarter 2016 and $3.7 billion (including $57 million in working capital sources and changes in other tax payments) for the year 2016. Based on current sales volume and cost estimates and assuming average prices of $2.50 per pound for copper, $1,200 per ounce for gold and $7.00 per pound for molybdenum, operating cash flows for the year 2017 are expected to approximate $4.3 billion (including $1.0 billion in working capital sources and changes in other tax payments). (*) Capital expenditures totaled $504 million (including $405 million for mining operations) for fourth-quarter 2016 and $2.8 billion (including $1.6 billion for mining operations) for the year 2016. Capital expenditures for the year 2017 are expected to approximate $1.8 billion. (*) During fourth-quarter 2016, FCX completed $5.2 billion in asset sale transactions, including the sale of its interest in TF Holdings Limited (TFHL), through which FCX held an interest in the Tenke mine, and the sales of the Deepwater Gulf of Mexico (GOM) and onshore California oil and gas properties. During 2016, FCX completed its asset divestment program, which generated $6.6 billion in aggregate proceeds. In November 2016, FCX completed its registered at-the-market (ATM) offering of common stock announced in July 2016, which raised $1.5 billion in gross proceeds through the sale of 116.5 million shares of FCX common stock. At December 31, 2016, consolidated debt totaled $16.0 billion and consolidated cash totaled $4.2 billion, compared with consolidated debt of $20.3 billion and consolidated cash of $177 million at December 31, 2015. FCX had no borrowings and $3.5 billion available under its $3.5 billion revolving credit facility at year-end 2016. (*) Projections for 2017 and forward looking statements in this release assume normal operating levels at PT Freeport Indonesia (PT-FI). Refer to page 8 for discussion of recent regulatory changes in Indonesia, which may impact future results.
Transcript of Freeport-McMoRan Inc. · Freeport-McMoRan Inc. Created Date: 20170124174900Z ...

Freeport-McMoRan 1
333 North Central Avenue Phoenix, AZ 85004 Financial Contacts: Media Contact:Kathleen L. Quirk(602) 366-8016
David P. Joint(504) 582-4203
Eric E. Kinneberg(602) 366-7994
Freeport-McMoRanReports Fourth-Quarter and Year Ended December 31, 2016 Results
Net income attributable to common stock totaled $292 million, $0.21 per share, for fourth-quarter 2016. After adjusting for net charges totaling $59 million, $0.04 per share, fourth-quarter 2016 adjusted net income attributable to common stock totaled $351 million, $0.25 per share.Consolidated sales (including volumes from Tenke Fungurume (Tenke) through November 16, 2016) totaled 1.2 billion pounds of copper, 405 thousand ounces of gold and 22 million pounds of molybdenum for fourth-quarter 2016 and 4.65 billion pounds of copper, 1.1 million ounces of gold and 74 million pounds of molybdenum for the year 2016. Consolidated sales for the year 2017 are expected to approximate 4.1 billion pounds of copper, 2.2 million ounces of gold and 92 million pounds of molybdenum, including 1.0 billion pounds of copper, 460 thousand ounces of gold and 23 million pounds of molybdenum for first-quarter 2017. (*)Average realized prices were $2.47 per pound for copper, $1,174 per ounce for gold and $8.27 per pound for molybdenum for fourth-quarter 2016.Average unit net cash costs were $1.20 per pound of copper for fourth-quarter 2016 and $1.26 per pound of copper for the year 2016. Unit net cash costs are expected to average $1.06 per pound of copper for the year 2017. (*)Operating cash flows totaled $1.1 billion (net of $406 million in working capital uses and changes in other tax payments) for fourth-quarter 2016 and $3.7 billion (including $57 million in working capital sources and changes in other tax payments) for the year 2016. Based on current sales volume and cost estimates and assuming average prices of $2.50 per pound for copper, $1,200 per ounce for gold and $7.00 per pound for molybdenum, operating cash flows for the year 2017 are expected to approximate $4.3 billion (including $1.0 billion in working capital sources and changes in other tax payments). (*)Capital expenditures totaled $504 million (including $405 million for mining operations) for fourth-quarter 2016 and $2.8 billion (including $1.6 billion for mining operations) for the year 2016. Capital expenditures for the year 2017 are expected to approximate $1.8 billion. (*)During fourth-quarter 2016, FCX completed $5.2 billion in asset sale transactions, including the sale of its interest in TF Holdings Limited (TFHL), through which FCX held an interest in the Tenke mine, and the sales of the Deepwater Gulf of Mexico (GOM) and onshore California oil and gas properties. During 2016, FCX completed its asset divestment program, which generated $6.6 billion in aggregate proceeds. In November 2016, FCX completed its registered at-the-market (ATM) offering of common stock announced in July 2016, which raised $1.5 billion in gross proceeds through the sale of 116.5 million shares of FCX common stock.At December 31, 2016, consolidated debt totaled $16.0 billion and consolidated cash totaled $4.2 billion, compared with consolidated debt of $20.3 billion and consolidated cash of $177 million at December 31, 2015. FCX had no borrowings and $3.5 billion available under its $3.5 billion revolving credit facility at year-end 2016.
(*) Projections for 2017 and forward looking statements in this release assume normal operating levels at PT Freeport Indonesia (PT-FI). Refer to page 8 for discussion of recent regulatory changes in Indonesia, which may impact future results.

Freeport-McMoRan 2
PHOENIX, AZ, January 25, 2017 - Freeport-McMoRan Inc. (NYSE: FCX) reported net income attributable to common stock of $292 million ($0.21 per share) for fourth-quarter 2016 and net losses attributable to common stock of $4.2 billion ($3.16 per share) for the year 2016, $4.1 billion ($3.47 per share) for fourth-quarter 2015 and $12.2 billion ($11.31 per share) for the year 2015. FCX’s net income attributable to common stock for fourth-quarter 2016 includes net charges of $59 million ($0.04 per share) primarily reflecting estimated losses on assets held for sale and oil and gas restructuring-related charges, partly offset by a gain on redeemable noncontrolling interest. Fourth-quarter 2015 net loss attributable to common stock included net charges of $4.1 billion ($3.45 per share) primarily for the reduction of the carrying value of oil and gas properties. For further discussion of these amounts and net charges impacting the years 2016 and 2015, refer to the supplemental schedules, "Adjusted Net Income (Loss)," beginning on page IX, which is available on FCX's website, "fcx.com."
Richard C. Adkerson, President and Chief Executive Officer, said, "During 2016, we took aggressive actions in response to market conditions to restore our balance sheet strength. I am pleased to report that we were successful in reducing our net debt by over $8 billion during the year while completing a major expansion at our world class Cerro Verde mine. I am proud of our global team for their accomplishments in "Proving our Mettle." As we enter 2017, we are enthusiastic about opportunities to generate future values for shareholders through our portfolio of high-quality, long-lived copper resources. We remain focused on generating significant cash flows to complete our debt reduction plan and to build long-term values for shareholders."
SUMMARY FINANCIAL DATA
Three Months Ended Years EndedDecember 31, December 31,
2016 2015 2016 2015(in millions, except per share amounts)
Revenuesa,b $ 4,377 $ 3,516 $ 14,830 $ 14,607Operating income (loss)a $ 703 $ (4,097) $ (2,792) $ (13,512)Net income (loss) from continuing operations $ 202 $ (4,090) $ (3,832) $ (12,180)Net (loss) income from discontinued operationsc $ (2) $ (4) $ (193) $ 91Net income (loss) attributable to common stockd,e $ 292 $ (4,081) $ (4,154) $ (12,236)Diluted net income (loss) per share of common stock:
Continuing operations $ 0.22 $ (3.46) $ (2.96) $ (11.32)Discontinued operations (0.01) (0.01) (0.20) 0.01
$ 0.21 $ (3.47) $ (3.16) $ (11.31)
Diluted weighted-average common shares outstanding 1,410 1,177 1,318 1,082Operating cash flowsf $ 1,135 $ 612 $ 3,729 $ 3,220Capital expenditures $ 504 $ 1,298 $ 2,813 $ 6,353At December 31:
Cash and cash equivalents $ 4,245 $ 177 $ 4,245 $ 177Total debt, including current portion $ 16,027 $ 20,324 $ 16,027 $ 20,324
a. For segment financial results, refer to the supplemental schedules, "Business Segments," beginning on page XII, which are available on FCX's website, "fcx.com."
b. Includes favorable (unfavorable) adjustments to provisionally priced concentrate and cathode copper sales recognized in prior periods totaling $129 million ($57 million to net income attributable to common stock from continuing operations or $0.04 per share) in fourth-quarter 2016, $(70) million ($(37) million to net loss attributable to common stock from continuing operations or $(0.03) per share) in fourth-quarter 2015, $5 million ($2 million to net loss attributable to common stock from continuing operations or less than $0.01 per share) for the year 2016 and $(100) million ($(50) million to net loss attributable to common stock from continuing operations or $(0.05) per share) for the year 2015. For further discussion, refer to the supplemental schedule, "Derivative Instruments," beginning on page XI, which is available on FCX's website, "fcx.com."
c. Reflects the results of TFHL through November 16, 2016, and includes charges for allocated interest expense associated with the portion of the FCX term loan that was required to be repaid as a result of the sale of FCX's interest in TFHL. The

Freeport-McMoRan 3
fourth-quarter and year 2016 also include a net charge for the loss on disposal. For a summary of the components of net (loss) income from discontinued operations, refer to supplemental schedules on pages XXVIII to XXXI, which are available on FCX's website, "fcx.com."
d. Includes net charges totaling $59 million ($0.04 per share) in fourth-quarter 2016, $4.1 billion ($3.45 per share) in fourth-quarter 2015, $4.5 billion ($3.39 per share) for the year 2016 and $12.1 billion ($11.22 per share) for the year 2015, which are described in the supplemental schedules, "Adjusted Net Income (Loss)," beginning on page IX, which is available on FCX's website, "fcx.com."
e. FCX defers recognizing profits on intercompany sales until final sales to third parties occur. For a summary of net impacts from changes in these deferrals, refer to the supplemental schedule, "Deferred Profits," on page XII, which is available on FCX's website, "fcx.com."
f. Includes net working capital (uses) sources and changes in other tax payments of $(406) million for fourth-quarter 2016, $31 million for fourth-quarter 2015, $57 million for the year 2016 and $373 million for the year 2015.
DEBT REDUCTION INITIATIVES
During 2016, FCX took actions to restore its balance sheet strength through a combination of asset sale transactions, cash flow from operations and capital market transactions. During the year, FCX completed $6.6 billion in asset sale transactions (including $5.2 billion in fourth-quarter 2016) and $1.5 billion in ATM sales of its common stock. Consolidated debt, net of cash, was reduced by $8.4 billion during the year.
The following table summarizes FCX's completed asset sales (in billions):
CashConsideration a
Oil and gas transactions $ 2.78b,c
TFHL 2.65c
Morenci (13 percent interest) 1.00Timok exploration project in Serbia 0.13
c
Other land sales 0.06Total, excluding contingent consideration $ 6.62
a. Reflects aggregate cash consideration, before purchase price adjustments. b. Includes $2.6 billion for the sales of the Deepwater GOM and onshore California oil and gas properties that were completed
in December 2016. In connection with the Deepwater GOM transaction, FCX also settled a preferred stock obligation at its Plains Offshore Operations Inc. subsidiary for $582 million, which is not reflected in the aggregate cash consideration above.
c. Excludes contingent consideration of up to $527 million, consisting of (i) up to $150 million related to the Deepwater GOM transaction, which is payable to FCX as the buyer realizes future cash flows in connection with a third-party production handling agreement, (ii) up to $150 million related to the onshore California transaction, consisting of $50 million per year for 2018, 2019 and 2020, if the price of Brent crude oil averages over $70 per barrel in that calendar year, (iii) up to $120 million related to the TFHL transaction, consisting of $60 million if the average copper price exceeds $3.50 per pound and $60 million if the average cobalt price exceeds $20 per pound, both for the 24-month period ending December 31, 2019, and (iv) up to $107 million related to the Timok transaction, which is payable to FCX in stages based upon achievement of defined development milestones.
During 2016, FCX agreed to negotiate exclusively with China Molybdenum Co., Ltd. (CMOC) until February 28, 2017, to enter into a definitive agreement to sell its interests in Freeport Cobalt for $100 million and the Kisanfu exploration project in the Democratic Republic of Congo (DRC) for $50 million in separate transactions.
The following table summarizes the change in FCX's consolidated debt, net of cash, during 2016 (in millions):
December 31, 2015(Decrease)Increase December 31, 2016
Total debt $ 20,324 $ (4,297) $ 16,027Less: cash and cash equivalents 177 4,068 4,245
$ 20,147 $ (8,365) $ 11,782

Freeport-McMoRan 4
FCX has a manageable debt maturity schedule, with maturities of $1.2 billion in 2017 and $1.5 billion in 2018 (excluding scheduled amortization of $0.8 billion in 2018 for the Cerro Verde credit facility).
FCX continues to manage production, exploration and administrative costs and capital spending and expects to generate cash flows for further debt reduction during 2017.
FCX has retained a high-quality portfolio of long-lived copper assets positioned to generate long-term values. In addition to debt reduction plans, FCX is pursuing opportunities to enhance net present values, and continues to advance studies for future development of its copper resources, the timing of which will be dependent on market conditions.
SUMMARY OPERATING DATA
Three Months Ended Years EndedDecember 31, December 31,
2016 2015 2016 2015Copper (millions of recoverable pounds)a
Production 1,200 1,122 4,647 4,017Sales, excluding purchases 1,186 1,145 4,651 4,070Average realized price per pound $ 2.47 $ 2.18 $ 2.27 $ 2.42Site production and delivery costs per poundb $ 1.44 $ 1.64 $ 1.44 $ 1.78Unit net cash costs per poundb $ 1.20 $ 1.45 $ 1.26 $ 1.53
Gold (thousands of recoverable ounces)Production 430 350 1,088 1,257Sales, excluding purchases 405 338 1,079 1,247Average realized price per ounce $ 1,174 $ 1,067 $ 1,238 $ 1,129
Molybdenum (millions of recoverable pounds)Production 22 20 80 92Sales, excluding purchases 22 20 74 89Average realized price per pound $ 8.27 $ 6.94 $ 8.33 $ 8.70
Oil EquivalentsSales volumes
Million barrels of oil equivalents (MMBOE) 10.5 c 13.2 47.1 52.6Thousand barrels of oil equivalents per day (MBOE) 114 c 144 128 144
Cash operating margin per BOEd
Realized revenuese $ 39.88 $ 37.49 $ 32.59 $ 43.54Cash production costs (14.62) (16.17) (15.19) (18.59)Cash operating margin $ 25.26 $ 21.32 $ 17.40 $ 24.95
a. Includes production and sales volumes from the Tenke mine through November 16, 2016. Copper sales from Tenke totaled 59 million pounds in fourth-quarter 2016, 117 million pounds in fourth-quarter 2015, 424 million pounds for the year 2016 and 467 million pounds for the year 2015. Average realized copper prices (excluding Tenke) were $2.48 per pound in fourth-quarter 2016, $2.19 per pound in fourth-quarter 2015, $2.28 per pound for the year 2016 and $2.42 per pound for the year 2015.
b. Reflects per pound weighted-average production and delivery costs and unit net cash costs (net of by-product credits) for all copper mines, before net noncash and other costs. Excluding Tenke, mining unit net cash costs averaged $1.21 per pound in fourth-quarter 2016, $1.47 per pound in fourth-quarter 2015, $1.26 per pound for the year 2016 and 1.57 per pound for the year 2015. For reconciliations of per pound unit costs by operating division to production and delivery costs applicable to sales reported in FCX's consolidated financial statements, refer to the supplemental schedules, "Product Revenues and Production Costs," beginning on page XV, which are available on FCX's website, "fcx.com."
c. Includes 8.7 MMBOE (94 MBOE per day) from the Deepwater GOM and onshore California oil and gas properties that were sold in December 2016.
d. Cash operating margin for oil and gas operations reflects realized revenues less cash production costs. Cash production costs exclude accretion and other costs. For reconciliations of realized revenues and cash production costs per BOE to revenues and production and delivery costs reported in FCX's consolidated financial statements, refer to the supplemental

Freeport-McMoRan 5
schedules, “Product Revenues and Production Costs,” beginning on page XV, which are available on FCX's website, “fcx.com.”
e. Includes realized cash gains on oil derivative contracts of $0.57 per BOE in fourth-quarter 2016, $7.76 per BOE in fourth-quarter 2015, $0.13 per BOE for the year 2016 and $7.72 per BOE for the year 2015. FCX does not have any oil and gas derivative contracts in place for future periods.
Consolidated Sales Volumes
Fourth-quarter 2016 copper sales (including sales from Tenke through November 16, 2016) of 1.2 billion pounds were lower than the October 2016 estimate of 1.3 billion pounds principally reflecting lower volumes from PT-FI and the impact of the November 2016 Tenke sale. Excluding the impact associated with the earlier than forecasted completion of the Tenke sale, copper sales volumes were approximately seven percent below the October 2016 estimates, reflecting lower mining and milling rates at PT-FI. Fourth-quarter 2016 copper sales were higher than fourth-quarter 2015 sales of 1.1 billion pounds, primarily reflecting higher volumes from Cerro Verde and PT-FI, partly offset by lower sales from North America primarily associated with reduced mining rates and lower ore grades, and the impact of the November 2016 Tenke sale.
Fourth-quarter 2016 gold sales of 405 thousand ounces were lower than the October 2016 estimate of 590 thousand ounces primarily reflecting lower mining and milling rates at PT-FI, but were higher than fourth-quarter 2015 sales of 338 thousand ounces primarily reflecting higher mining and milling rates and higher ore grades at PT-FI.
Fourth-quarter 2016 molybdenum sales of 22 million pounds were slightly higher than the October 2016 estimate of 21 million pounds and fourth-quarter 2015 sales of 20 million pounds.
Sales volumes for the year 2017 are expected to approximate 4.1 billion pounds of copper, 2.2 million ounces of gold and 92 million pounds of molybdenum, including 1.0 billion pounds of copper, 460 thousand ounces of gold and 23 million pounds of molybdenum in first-quarter 2017. Estimated sales volumes assume the resumption of concentrate exports by PT-FI in February 2017 and the renewal of PT Smelting's export license. For each month of delay in obtaining approval to export, PT-FI's share of production is projected to be reduced by approximately 70 million pounds of copper and 100 thousand ounces of gold. Refer to page 8 for discussion of recent regulatory changes in Indonesia, which may have a significant impact on future results.
Consolidated Unit Costs
Consolidated average unit net cash costs (net of by-product credits) for FCX's copper mines (including Tenke) of $1.20 per pound of copper in fourth-quarter 2016 were lower than unit net cash costs of $1.45 per pound in fourth-quarter 2015, primarily reflecting higher by-product credits and higher sales volumes from Cerro Verde and PT-FI.
Assuming average prices of $1,200 per ounce of gold and $7.00 per pound of molybdenum for 2017 and achievement of current sales volume and cost estimates (including normal operations at PT-FI), consolidated unit net cash costs (net of by-product credits) for copper mines are expected to average $1.06 per pound of copper for the year 2017. The impact of price changes on 2017 consolidated unit net cash costs would approximate $0.025 per pound for each $50 per ounce change in the average price of gold and $0.025 per pound for each $2 per pound change in the average price of molybdenum. Quarterly unit net cash costs vary with fluctuations in sales volumes and realized prices, primarily for gold and molybdenum. MINING OPERATIONS North America Copper Mines. FCX operates seven open-pit copper mines in North America - Morenci, Bagdad, Safford, Sierrita and Miami in Arizona, and Chino and Tyrone in New Mexico. In addition to copper, molybdenum concentrate, gold and silver are also produced by certain of FCX's North America copper mines.
All of the North America mining operations are wholly owned, except for Morenci. FCX records its 72 percent undivided joint venture interest in Morenci using the proportionate consolidation method.
Operating and Development Activities. FCX has significant undeveloped reserves and resources in North America and a portfolio of potential long-term development projects. Future investments will be undertaken based on the results of economic and technical feasibility studies, and market conditions.

Freeport-McMoRan 6
In response to market conditions, beginning in the second half of 2015 FCX took actions to reduce operating and capital costs and adjusted production to reflect market conditions. These operating plans will continue to be reviewed and additional adjustments may be made as market conditions warrant.
Operating Data. Following is summary consolidated operating data for the North America copper mines for the fourth quarters and years ended 2016 and 2015:
Three Months Ended Years EndedDecember 31, December 31,
2016 2015 2016 2015Copper (millions of recoverable pounds)
Production 420 527 1,831 1,947Sales, excluding purchasesa 416 547 1,841 1,988Average realized price per pound $ 2.45 $ 2.22 $ 2.24 $ 2.47
Molybdenum (millions of recoverable pounds)Productionb 8 9 33 37
Unit net cash costs per pound of copperc
Site production and delivery, excluding adjustments $ 1.46 $ 1.49 $ 1.42 $ 1.68By-product credits (0.13) (0.07) (0.12) (0.13)Treatment charges 0.11 0.11 0.11 0.12Unit net cash costs $ 1.44 $ 1.53 $ 1.41 $ 1.67
a. The impact of the May 2016 sale of a 13 percent undivided interest in Morenci was a decrease of 34 million pounds of copper for fourth-quarter 2016, compared with fourth-quarter 2015, and 84 million pounds of copper for the year 2016, compared with the year 2015.
b. Refer to summary operating data on page 4 for FCX's consolidated molybdenum sales, which includes sales of molybdenum produced at the North America copper mines.
c. For a reconciliation of unit net cash costs per pound to production and delivery costs applicable to sales reported in FCX's consolidated financial statements, refer to the supplemental schedules, "Product Revenues and Production Costs," beginning on page XV, which are available on FCX's website, "fcx.com."
North America's consolidated copper sales volumes of 416 million pounds in fourth-quarter 2016 were lower than fourth-quarter 2015 sales of 547 million pounds, primarily reflecting reduced mining rates, lower ore grades and the impact of the May 2016 sale of a portion of FCX's interest in Morenci. North America copper sales are estimated to approximate 1.5 billion pounds for the year 2017, compared with 1.8 billion pounds in 2016.
Average unit net cash costs (net of by-product credits) for the North America copper mines of $1.44 per pound of copper in fourth-quarter 2016 were lower than unit net cash costs of $1.53 per pound in fourth-quarter 2015, primarily reflecting higher by-product credits and cost reduction initiatives.
Average unit net cash costs (net of by-product credits) for the North America copper mines are expected to approximate $1.55 per pound of copper for the year 2017, based on achievement of current sales volume and cost estimates and assuming an average molybdenum price of $7.00 per pound. North America's average unit net cash costs for the year 2017 would change by approximately $0.04 per pound for each $2 per pound change in the average price of molybdenum.
South America Mining. FCX operates two copper mines in South America - Cerro Verde in Peru (in which FCX owns a 53.56 percent interest) and El Abra in Chile (in which FCX owns a 51 percent interest). These operations are consolidated in FCX's financial statements. In addition to copper, the Cerro Verde mine produces molybdenum concentrate and silver.
Operating and Development Activities. The Cerro Verde expansion project commenced operations in September 2015 and achieved capacity operating rates during first-quarter 2016. Cerro Verde's expanded operations benefit from its large-scale, long-lived reserves and cost efficiencies. The project expanded the concentrator facilities from 120,000 metric tons of ore per day to 360,000 metric tons of ore per day and is on track to provide incremental annual production of approximately 600 million pounds of copper and 15 million pounds of

Freeport-McMoRan 7
molybdenum. Cerro Verde's copper production totaled 1.1 billion pounds for the year 2016, compared with 545 million pounds for the year 2015.
In response to market conditions, in the second half of 2015 FCX adjusted operations at its El Abra mine to reduce mining and stacking rates by approximately 50 percent to achieve lower operating and labor costs, defer capital expenditures and extend the life of the existing operations.
FCX continues to evaluate a potential large-scale milling operation at El Abra to process additional sulfide material and to achieve higher recoveries. Exploration results in recent years at El Abra indicate a significant sulfide resource, which could potentially support a major mill project. Future investments will depend on technical studies, economic factors and market conditions.
Operating Data. Following is summary consolidated operating data for the South America mining operations for the fourth quarters and years ended 2016 and 2015:
Three Months Ended Years EndedDecember 31, December 31,
2016 2015 2016 2015Copper (millions of recoverable pounds)
Production 342 284 1,328 869Sales 359 286 1,332 871Average realized price per pound $ 2.50 $ 2.16 $ 2.31 $ 2.38
Molybdenum (millions of recoverable pounds)Productiona 7 2 21 7
Unit net cash costs per pound of copperb
Site production and delivery, excluding adjustments $ 1.35 $ 1.43 $ 1.26 $ 1.60By-product credits (0.10) (0.04) (0.10) (0.05)Treatment charges 0.25 0.21 0.24 0.19Royalty on metals 0.01 0.01 0.01 —Unit net cash costs $ 1.51 $ 1.61 $ 1.41 $ 1.74
a. Refer to summary operating data on page 4 for FCX's consolidated molybdenum sales, which includes sales of molybdenum produced at Cerro Verde.
b. For a reconciliation of unit net cash costs per pound to production and delivery costs applicable to sales reported in FCX's consolidated financial statements, refer to the supplemental schedules, "Product Revenues and Production Costs," beginning on page XV, which are available on FCX's website, "fcx.com."
South America's consolidated copper sales volumes of 359 million pounds in fourth-quarter 2016 were higher than fourth-quarter 2015 sales of 286 million pounds, reflecting Cerro Verde's expanded operations. Sales from South America mining are expected to approximate 1.3 billion pounds of copper for the year 2017, compared with 1.3 billion pounds of copper in 2016.
Average unit net cash costs (net of by-product credits) for South America mining of $1.51 per pound of copper in fourth-quarter 2016 were lower than unit net cash costs of $1.61 per pound in fourth-quarter 2015, primarily reflecting higher copper sales volumes and efficiencies associated with the Cerro Verde expansion and higher by-product credits. Average unit net cash costs (net of by-product credits) for South America mining are expected to approximate $1.61 per pound of copper for the year 2017, based on current sales volume and cost estimates and assuming an average price of $7.00 per pound of molybdenum.

Freeport-McMoRan 8
Indonesia Mining. Through its 90.64 percent owned and consolidated subsidiary PT-FI, FCX's assets include one of the world's largest copper and gold deposits at the Grasberg minerals district in Papua, Indonesia. PT-FI operates a proportionately consolidated joint venture, which produces copper concentrates that contain significant quantities of gold and silver.
Regulatory Matters. PT-FI continues to engage with Indonesian government officials regarding its long-term operating rights under its Contract of Work (COW), and its rights to export concentrate without restriction.
In July 2014, PT-FI and the Indonesian government entered into a Memorandum of Understanding (MOU), in which subject to concluding an agreement to extend PT-FI's operations beyond 2021 on acceptable terms, PT-FI agreed to construct new smelter capacity in Indonesia and to divest an additional 20.64 percent interest in PT-FI at fair market value. PT-FI also agreed to pay higher royalties and to pay export duties until certain smelter development milestones were met. In January 2015, the MOU was extended to July 25, 2015, and it expired on that date. The increased royalty rates, export duties and smelter assurance bond have remained in effect.
In October 2015, the Indonesian government provided a letter of assurance to PT-FI indicating that it would revise regulations allowing it to approve the extension of operations beyond 2021, and provide the same rights and the same level of legal and fiscal certainty provided under its current COW.
In January 2017, the Indonesian government issued new regulations to address exports of unrefined metals, including copper concentrates and anode slimes, and other matters related to the mining sector. The new regulations permit the continuation of copper concentrate exports for a five year period through January 2022, subject to various conditions, including conversion from a contract of work to a special operating license (an IUPK), commitment to completion of smelter construction in five years and payment of export duties to be determined by the Ministry of Finance. In addition, the new regulations enable application for extension of operating rights five years before expiration of the IUPK and require foreign IUPK holders to divest 51 percent to Indonesian interests no later than the tenth year of production. Export licenses would be valid for one-year periods, subject to review every six months, depending on smelter construction progress.
The January 2017 regulations permit the export of anode slimes, which is necessary for PT Smelting (PT-FI’s 25 percent owned copper smelter and refinery located in Gresik, Indonesia) to continue operating. PT Smelting is engaged in discussions with the Indonesian government related to the renewal of its anode slimes export license.
Following the issuance of the January 2017 regulations and discussions with the government, PT-FI advised the Indonesian government that it would convert its COW to an IUPK, subject to obtaining an investment stability agreement providing the same rights and the same level of legal and fiscal certainty enumerated under its COW. PT-FI also committed to constructing a new smelter during a five year timeframe after approval of the extension of its operating rights. The COW would remain in effect until it is replaced by a mutually satisfactory alternative.
PT-FI has requested that concentrate exports be permitted while the new license and stability agreement are negotiated. PT-FI is discussing the applicability of export duties and divestment requirements with the Indonesian government. Under its COW, PT-FI is not required to pay export duties on concentrate or to conduct further divestments.
As of January 25, 2017, PT-FI has not obtained approval to export concentrate. PT-FI has advised the Indonesian government that if it is prohibited from exporting copper concentrate it would be required to reduce production to match available capacity at PT Smelting or approximately 40 percent of PT-FI's capacity (assuming that PT Smelting's export license is approved). Under this scenario, PT-FI would be required to take near-term actions to reduce its workforce, significantly reduce costs and suspend future investments on its underground development projects and new smelter.
Under its COW, PT-FI has rights to export copper concentrate without restriction or payment of export duties. If necessary, PT-FI may consider legal action to enforce its contractual rights should it fail to reach a mutually satisfactory agreement with the Indonesian government.
In January 2017, the Indonesia Tax Court issued a ruling against PT-FI with respect to assessments from the local regional tax authority in Papua, Indonesia, for additional taxes and penalties related to surface water taxes for the period from January 2011 through July 2015 in the amount of $376 million (based on exchange rates at December 31, 2016, and including $227 million in penalties). The aggregate amount of assessments received from August 2015 through December 2016 was an additional $93 million, including penalties. No amounts have been

Freeport-McMoRan 9
recorded at this time for these assessments because PT-FI's COW exempts it from these payments. PT-FI has the right to contest these assessments by appeal to the Indonesia Supreme Court and/or institute dispute resolution proceedings under the COW. Under Indonesian law, payment is required approximately 30 days after written receipt of the ruling. PT-FI expects to challenge this decision and is evaluating its options.
Operating and Development Activities. PT-FI is currently mining the final phase of the Grasberg open pit, which contains high copper and gold ore grades. PT-FI expects to mine high-grade ore over the next several quarters prior to transitioning to the Grasberg Block Cave underground mine during 2018.
PT-FI has several projects in progress in the Grasberg minerals district related to the development of its large-scale, long-lived, high-grade underground ore bodies. In aggregate, these underground ore bodies are expected to produce large-scale quantities of copper and gold following the transition from the Grasberg open pit. From 2017 to 2021, estimated aggregate capital spending on these projects is currently expected to average $1.0 billion per year ($0.8 billion per year net to PT-FI). Considering the long-term nature and size of these projects, actual costs could vary from these estimates. In response to market conditions and Indonesian regulatory uncertainty, the timing of these expenditures continues to be reviewed.
Operating Data. Following is summary consolidated operating data for the Indonesia mining operations for the fourth quarters and years ended 2016 and 2015:
Three Months Ended Years EndedDecember 31, December 31,
2016 2015 2016 2015Copper (millions of recoverable pounds)
Production 369 201 1,063 752Sales 352 195 1,054 744Average realized price per pound $ 2.48 $ 2.14 $ 2.32 $ 2.33
Gold (thousands of recoverable ounces)Production 424 345 1,061 1,232Sales 401 333 1,054 1,224Average realized price per ounce $ 1,174 $ 1,066 $ 1,237 $ 1,129
Unit net cash costs per pound of coppera
Site production and delivery, excluding adjustments $ 1.50 $ 2.40 $ 1.63 $ 2.39Gold and silver credits (1.34) (1.87) (1.30) (1.91)Treatment charges 0.27 0.31 0.28 0.31Export duties 0.09 0.10 0.09 0.15Royalty on metals 0.13 0.15 0.13 0.15Unit net cash costs $ 0.65 $ 1.09 $ 0.83 $ 1.09
a. For a reconciliation of unit net cash costs per pound to production and delivery costs applicable to sales reported in FCX's consolidated financial statements, refer to the supplemental schedules, "Product Revenues and Production Costs," beginning on page XV, which are available on FCX's website, "fcx.com."
Indonesia's consolidated sales of 352 million pounds of copper and 401 thousand ounces of gold in fourth-quarter 2016 were higher than fourth-quarter 2015 sales of 195 million pounds of copper and 333 thousand ounces of gold, primarily reflecting higher ore grades.
Indonesia's fourth-quarter 2016 sales were below October 2016 estimates by approximately 120 million pounds of copper and 190 thousand ounces of gold, principally reflecting lower mining rates in the Grasberg open pit, which affected the timing of its copper and gold production resulting in a deferral of volumes to future periods. Various initiatives are under way to improve productivity levels in the open pit.
At the Grasberg mine, the sequencing of mining areas with varying ore grades causes fluctuations in quarterly and annual production of copper and gold. Consolidated sales volumes from Indonesia mining operations (assuming normal operations, including the resumption of concentrate exports in February 2017 and the renewal of PT Smelting's export license) are expected to approximate 1.3 billion pounds of copper and 2.2 million ounces of

Freeport-McMoRan 10
gold for the year 2017, compared with 1.05 billion pounds of copper and 1.05 million ounces of gold for the year 2016. For each month of delay in obtaining approval to export, PT-FI's share of production is projected to be reduced by approximately 70 million pounds of copper and 100 thousand ounces of gold.
A significant portion of PT-FI's costs are fixed and unit costs vary depending on production volumes and other factors. Indonesia's unit net cash costs (including gold and silver credits) of $0.65 per pound of copper in fourth-quarter 2016 were lower than unit net cash costs of $1.09 per pound in fourth-quarter 2015, primarily reflecting higher sales volumes.
Anticipated higher ore grades from the Grasberg mine are expected to result in lower unit net cash costs in 2017. Assuming an average gold price of $1,200 per ounce for 2017 and achievement of current sales volume and cost estimates (assuming normal operations), unit net cash credits (net of gold and silver credits) for Indonesia mining are expected to approximate $0.03 per pound of copper for the year 2017. Indonesia mining's unit net cash credits for the year 2017 would change by approximately $0.075 per pound for each $50 per ounce change in the average price of gold. Because of the fixed nature of a large portion of Indonesia's costs, unit costs vary from quarter to quarter depending on copper and gold volumes.
Indonesia mining's projected sales volumes are dependent on a number of factors, including operational performance, the timing of shipments and its ability to continue to export copper concentrate.
Africa Mining. In November 2016, FCX completed the sale of its interest in TFHL, through which FCX held an effective 56 percent interest in the Tenke copper and cobalt mining concessions in the Southeast region of the DRC. In accordance with accounting guidelines, the operating results of Africa mining have been separately reported as discontinued operations in FCX’s consolidated statements of operations for all periods presented.
The fourth-quarter 2016 loss on disposal of discontinued operations of $16 million includes a charge of $33 million for FCX's share of the settlement agreement entered into with La Générale des Carrières et des Mines (Gécamines), which is wholly owned by the DRC government, resulting in a resolution of all claims brought by Gécamines against FCX, including the action brought before the International Chamber of Commerce (ICC) International Arbitration Court, related to the sale of FCX's interest in TFHL to CMOC. The parties to the settlement are FCX, CMOC, Lundin Mining Corporation, TFHL, Tenke Fungurume Mining S.A., BHR Newwood Investment Management Limited and Gécamines. Partly offsetting this charge is a gain of $13 million recognized for the fair value of contingent consideration, which in accordance with accounting guidelines will continue to be adjusted through December 31, 2019.
Operating Data. Following is summary consolidated operating data for the Africa mining operations for the fourth quarters and years ended 2016 and 2015:
Three Months Ended Years EndedDecember 31, December 31,
2016a 2015 2016a 2015Copper (millions of recoverable pounds)
Production 69 110 425 449Sales 59 117 424 467Average realized price per poundb $ 2.31 $ 2.13 $ 2.10 $ 2.42
Cobalt (millions of contained pounds)Production 4 10 32 35Sales 4 9 33 35Average realized price per pound $ 8.66 $ 6.47 $ 7.45 $ 8.21
Unit net cash costs per pound of copperc
Site production and delivery, excluding adjustments $ 1.42 $ 1.58 $ 1.58 $ 1.58Cobalt creditsd (0.41) (0.28) (0.39) (0.42)Royalty on metals 0.05 0.05 0.05 0.05Unit net cash costs $ 1.06 $ 1.35 $ 1.24 $ 1.21
a. Includes the results of Tenke through November 16, 2016. b. Includes point-of-sale transportation costs as negotiated in customer contracts.

Freeport-McMoRan 11
c. For a reconciliation of unit net cash costs per pound to production and delivery costs applicable to sales reported in net (loss) income from discontinued operations in FCX's consolidated financial statements, refer to the supplemental schedules, "Product Revenues and Production Costs," beginning on page XV, which are available on FCX's website, "fcx.com."
d. Net of cobalt downstream processing and freight costs.
Molybdenum Mines. FCX has two wholly owned molybdenum mines in North America - the Henderson underground mine and the Climax open-pit mine, both in Colorado. The Henderson and Climax mines produce high-purity, chemical-grade molybdenum concentrate, which is typically further processed into value-added molybdenum chemical products. The majority of molybdenum concentrate produced at the Henderson and Climax mines, as well as from FCX's North and South America copper mines, is processed at FCX's conversion facilities.
Operating and Development Activities. In response to market conditions, the Henderson molybdenum mine operated at reduced rates during 2016, resulting in an approximate 65 percent reduction in its annual production volumes. During 2016, FCX incorporated changes in the commercial pricing structure for its chemical products to enable continuation of chemical-grade production.
Production from the Molybdenum mines totaled 7 million pounds of molybdenum in fourth-quarter 2016, 9 million pounds in fourth-quarter 2015, 26 million pounds in the year 2016 and 48 million pounds in the year 2015. Refer to summary operating data on page 4 for FCX's consolidated molybdenum sales, which includes sales of molybdenum produced at the Molybdenum mines, and from FCX's North and South America copper mines.
Average unit net cash costs for the Molybdenum mines of $8.26 per pound of molybdenum in fourth-quarter 2016 were higher than $7.15 per pound in fourth-quarter 2015, primarily reflecting lower volumes. Based on current sales volume and cost estimates, unit net cash costs for the Molybdenum mines are expected to average approximately $7.75 per pound of molybdenum for the year 2017.
For a reconciliation of unit net cash costs per pound to production and delivery costs applicable to sales reported in FCX's consolidated financial statements, refer to the supplemental schedules, "Product Revenues and Production Costs," beginning on page XV, which are available on FCX's website, "fcx.com."
Mining Exploration Activities. FCX's mining exploration activities are generally associated with its existing mines, focusing on opportunities to expand reserves and resources to support development of additional future production capacity. Exploration results continue to indicate opportunities for significant future potential reserve additions in North and South America. Exploration spending continues to be constrained by market conditions and is expected to approximate $47 million for the year 2017, compared to $44 million in 2016.
Preliminary Recoverable Proven and Probable Mineral Reserves. FCX has significant reserves, resources and future development opportunities within its portfolio of mining assets. FCX's preliminary estimated consolidated recoverable proven and probable reserves from its mines at December 31, 2016, include 86.8 billion pounds of copper, 26.1 million ounces of gold and 2.95 billion pounds of molybdenum, which were determined using long-term average prices of $2.00 per pound for copper, $1,000 per ounce for gold and $10.00 per pound for molybdenum. The preliminary recoverable proven and probable mining reserves presented in the table below represent the estimated metal quantities from which FCX expects to be paid after application of estimated metallurgical recovery rates and smelter recovery rates, where applicable. Recoverable reserve volumes are those which FCX estimates can be economically and legally extracted or produced at the time of the reserve determination.
Preliminary Recoverable Proven and Probable Mineral ReservesEstimated at December 31, 2016
Copper Gold Molybdenum(billion pounds) (million ounces) (billion pounds)
North America 30.4 0.3 2.31South America 29.5 — 0.64Indonesia 26.9 25.8 —
Consolidated basisa 86.8 26.1 2.95
Net equity interestb 70.5 23.7 2.65

Freeport-McMoRan 12
a. Consolidated reserves represent estimated metal quantities after reduction for joint venture partner interests at the Morenci mine in North America and the Grasberg minerals district in Indonesia. Excluded from the table above were FCX’s estimated recoverable proven and probable reserves of 281.8 million ounces of silver, which was determined using a long-term average price of $15 per ounce.
b. Net equity interest reserves represent estimated consolidated metal quantities further reduced for noncontrolling interest ownership. Excluded from the table above were FCX’s estimated recoverable proven and probable reserves of 226.0 million ounces of silver.
The following table summarizes changes in FCX's preliminary estimated consolidated recoverable proven and probable copper, gold and molybdenum reserves during 2016:
Copper Gold Molybdenum(billions of lbs) (millions of ozs) (billions of lbs)
Reserves at December 31, 2015 99.5 27.1 3.05Net additions 0.5 0.1 —Production (4.6) a (1.1) (0.08)Sale of Tenke (6.8) — —Sale of 13 percent undivided interest in Morenci (1.8) — (0.02)Reserves at December 31, 2016 86.8 26.1 2.95
a. Includes copper production of 0.4 billion pounds from the Tenke mine.
In addition to the preliminary consolidated recoverable proven and probable reserves, FCX's preliminary estimated mineralized material (assessed using a long-term average copper price of $2.20 per pound for copper) totaled 102 billion pounds of incremental contained copper as of December 31, 2016. FCX continues to pursue opportunities to convert this material into reserves, future production volumes and cash flow.
OIL AND GAS OPERATIONS In December 2016, FCX completed the sales of the Deepwater GOM and onshore California oil and gas properties for $2.6 billion (before closing adjustments) and contingent consideration. FCX has the right to receive additional proceeds of up to $300 million, including (i) $150 million for contingent payments related to the Deepwater GOM sale, which will be payable to FCX as the buyer realizes future cash flows in connection with a third-party production handling agreement, and (ii) $150 million related to the onshore California sale, which is based on the average price of Brent crude oil for the years 2018, 2019 and 2020. In connection with the Deepwater GOM transaction, FCX also settled a preferred stock obligation at its Plains Offshore Operations Inc. subsidiary for $582 million (at September 30, 2016, this preferred stock obligation was recorded at $774 million on FCX's consolidated balance sheet).
In January 2017, FCX entered into an agreement to sell its property interests in the Madden area for cash consideration of $20 million. The transaction has an effective date of January 1, 2017, and is expected to close in first-quarter 2017. Following the completion of the Madden transaction, FCX’s portfolio of oil and gas assets would include oil and natural gas production onshore in South Louisiana and on the GOM Shelf and oil production offshore California, which had oil and gas sales volumes of 1.5 MMBOE in fourth-quarter 2016.
CASH FLOWS, CASH, DEBT and EQUITY TRANSACTIONS
Operating Cash Flows. FCX generated operating cash flows of $1.1 billion (net of $406 million in working capital uses and changes in other tax payments) in fourth-quarter 2016 and $3.7 billion (including $57 million in working capital sources and changes in other tax payments) for the year 2016.
Based on current sales volume and cost estimates and assuming average prices of $2.50 per pound of copper, $1,200 per ounce of gold and $7.00 per pound of molybdenum, FCX's consolidated operating cash flows are estimated to approximate $4.3 billion for the year 2017 (including $1.0 billion in working capital sources and other tax payments). The impact of price changes during 2017 on operating cash flows would approximate $385 million for each $0.10 per pound change in the average price of copper, $95 million for each $50 per ounce change in the average price of gold and $100 million for each $2 per pound change in the average price of molybdenum. Projections for 2017 assume normal operating levels at PT-FI. Refer to page 8 for discussion of recent regulatory changes in Indonesia, which may have a significant impact on future results.

Freeport-McMoRan 13
Capital Expenditures. Capital expenditures totaled $504 million for fourth-quarter 2016, consisting of $405 million for mining operations (including $285 million for major projects) and $99 million for oil and gas operations. Capital expenditures for the year 2016 totaled $2.8 billion, consisting of $1.6 billion for mining operations (including $1.2 billion for major projects) and $1.2 billion for oil and gas operations.
Capital expenditures are expected to approximate $1.8 billion for the year 2017, including $1.1 billion for major mining projects, primarily related to the development of underground mines by PT-FI. Refer to page 8 for discussion of recent regulatory changes in Indonesia, which may impact future investment in PT-FI's underground development projects.
Cash. Following is a summary of the U.S. and international components of consolidated cash and cash equivalents available to the parent company, net of noncontrolling interests' share, taxes and other costs at December 31, 2016 (in millions):
Cash at domestic companies $ 3,908Cash at international operations 337Total consolidated cash and cash equivalents 4,245Noncontrolling interests' share (95)Cash, net of noncontrolling interests' share 4,150Withholding taxes and other (22)Net cash available $ 4,128
Debt. FCX continues to focus on cost and capital management and cash flow generation from its operations and has taken actions to improve its balance sheet through asset sales, available cash flows and other transactions. Following is a summary of total debt and the related weighted-average interest rates at December 31, 2016 (in billions, except percentages):
Weighted-Average
Interest RateSenior Notes $ 14.4 4.4%Cerro Verde Credit Facility 1.4 2.7%Other FCX debt 0.2 3.1%Total debt $ 16.0 4.2%
During fourth-quarter 2016, FCX repaid the $2.5 billion balance of its Term Loan with proceeds from recent asset sales transactions and purchased $38 million of its senior notes in open-market transactions. Additionally, in December 2016, FCX completed an exchange offer and consent solicitation associated with the Freeport-McMoRan Oil & Gas LLC (FM O&G) senior notes. Holders representing 89 percent of the outstanding FM O&G senior notes tendered their notes and were issued new FCX notes. Each series of newly issued FCX senior notes have an interest rate and maturity date that is identical to the interest rate and maturity date of the applicable series of FM O&G senior notes. The newly issued FCX senior notes are senior unsecured obligations of FCX and rank equally in right of payment with all other existing and future senior unsecured indebtedness of FCX.
At December 31, 2016, FCX had no borrowings, $43 million in letters of credit issued and availability of $3.5 billion under its $3.5 billion revolving credit facility.
FCX's debt maturities, total $1.2 billion in 2017 and $1.5 billion in 2018 (excluding scheduled amortization of $0.8 billion in 2018 for the Cerro Verde credit facility).
Equity. In November 2016, FCX completed its registered ATM offering of common stock announced in July 2016, which raised $1.5 billion in gross proceeds through the sale of 116.5 million shares of FCX common stock. At December 31, 2016, FCX had 1.44 billion common shares outstanding.

Freeport-McMoRan 14
FINANCIAL POLICY FCX intends to continue to seek to strengthen its financial position, with a focus on debt reduction. In December 2015, FCX's common stock dividend was suspended. FCX's Board of Directors will continue to review its financial policy on an ongoing basis.
WEBCAST INFORMATION
A conference call with securities analysts to discuss FCX's fourth-quarter 2016 results is scheduled for today at 10:00 a.m. Eastern Time. The conference call will be broadcast on the Internet along with slides. Interested parties may listen to the conference call live and view the slides by accessing “fcx.com.” A replay of the webcast will be available through Friday, February 24, 2017.
-----------------------------------------------------------------------------------------------------------
FCX is a leading international mining company with headquarters in Phoenix, Arizona. FCX operates large, long-lived, geographically diverse assets with significant proven and probable reserves of copper, gold and molybdenum. FCX is the world's largest publicly traded copper producer.
FCX’s portfolio of assets includes the Grasberg minerals district in Indonesia, one of the world's largest copper and gold deposits; and significant mining operations in the Americas, including the large-scale Morenci minerals district in North America and the Cerro Verde operation in South America. Additional information about FCX is available on FCX's website at "fcx.com."Cautionary Statement and Regulation G Disclosure: This press release contains forward-looking statements in which FCX discusses its potential future performance. Forward-looking statements are all statements other than statements of historical facts, such as projections or expectations relating to ore grades and milling rates, production and sales volumes, unit net cash costs, operating cash flows, capital expenditures, debt reduction initiatives, exploration efforts and results, development and production activities and costs, liquidity, tax rates, the impact of copper, gold and molybdenum price changes, the impact of deferred intercompany profits on earnings, reserve estimates, future dividend payments, and share purchases and sales. The words “anticipates,” “may,” “can,” “plans,” “believes,” “estimates,” “expects,” “projects,” "targets," “intends,” “likely,” “will,” “should,” “to be,” ”potential" and any similar expressions are intended to identify those assertions as forward-looking statements. Under its revolving credit facility, as amended, FCX is not permitted to pay dividends on common stock on or prior to March 31, 2017. The declaration of dividends is at the discretion of FCX's Board of Directors (Board), subject to restrictions under FCX's credit agreements, and will depend on FCX's financial results, cash requirements, future prospects, and other factors deemed relevant by the Board. This press release also includes forward-looking statements regarding mineralized material not included in reserves. The mineralized material described will not qualify as reserves until comprehensive engineering studies establish their feasibility. Accordingly, no assurance can be given that the estimated mineralized material not included in reserves will become proven and probable reserves. FCX cautions readers that forward-looking statements are not guarantees of future performance and actual results may differ materially from those anticipated, projected or assumed in the forward-looking statements. Important factors that can cause FCX's actual results to differ materially from those anticipated in the forward-looking statements include supply of and demand for, and prices of, copper, gold and molybdenum, mine sequencing, production rates, potential effects of cost and capital expenditure reductions and production curtailments on financial results and cash flow, the outcome of FCX's debt reduction initiatives, FCX's ability to secure regulatory approvals, potential inventory adjustments, potential impairment of long-lived mining assets, the outcome of ongoing discussions with the Indonesian government regarding PT Freeport Indonesia's (PT-FI) Contract of Work (COW), the potential effects of violence in Indonesia generally and in the province of Papua, industry risks, regulatory changes, political risks, labor relations, weather- and climate-related risks, environmental risks, litigation results (including the final disposition of the recent unfavorable Indonesian Tax Court ruling relating to surface water taxes) and other factors described in more detail under the heading “Risk Factors” in FCX's Annual Report on Form 10-K for the year ended December 31, 2015, filed with the U.S. Securities and Exchange Commission (SEC) as updated by FCX's subsequent filings with the SEC. With respect to FCX's operations in Indonesia, such factors include whether PT-FI will be able to resume exporting its copper concentrate directly and indirectly through PT Smelting (PT-FI's 25 percent-owned Indonesian smelting unit), which depends upon the satisfactory resolution of complex regulatory matters in Indonesia. PT-FI's inability to export copper concentrate itself and through PT Smelting for any extended period of time would lead to the suspension of all of FCX's production in Indonesia. Investors are cautioned that many of the assumptions upon which FCX's forward-looking statements are based are likely to change after the forward-looking statements are made, including for example commodity prices, which FCX cannot control, and production volumes and costs, some aspects of which FCX may not be able to control. Further, FCX may make changes to its business plans that could affect its results. FCX cautions investors that it does not intend to update forward-looking statements more frequently than quarterly notwithstanding any changes in its assumptions, changes in business plans, actual experience or other changes, and FCX undertakes no obligation to update any forward-looking statements. This press release also contains certain financial measures such as unit net cash costs per pound of copper and molybdenum, oil and gas realized revenues, cash production costs and cash operating margin, which are not recognized under U.S. generally accepted accounting principles. As required by SEC Regulation G, reconciliations of these measures to amounts reported in FCX's consolidated financial statements are in the supplemental schedules of this press release, which are also available on FCX's website, "fcx.com."

I
FREEPORT-McMoRan INC.SELECTED MINING OPERATING DATA
Three Months Ended December 31,Production Sales
COPPER (millions of recoverable pounds) 2016 2015 2016 2015(FCX's net interest in %)
North AmericaMorenci (72%)a 190 246 188 255Bagdad (100%) 38 53 39 56Safford (100%) 57 66 56 66Sierrita (100%) 40 49 39 50Miami (100%) 5 10 6 11Chino (100%) 69 83 69 87Tyrone (100%) 20 19 18 21Other (100%) 1 1 1 1
Total North America 420 527 416 547
South AmericaCerro Verde (53.56%) 293 211 307 209El Abra (51%) 49 73 52 77
Total South America 342 284 359 286
IndonesiaGrasberg (90.64%)b 369 201 352 195
Consolidated - continuing operations 1,131 1,012 1,127c
1,028c
Discontinued operations - Tenke Fungurume (Tenke) (56%)d 69 110 59 117Total 1,200 1,122 1,186 1,145Less noncontrolling interests 225 201 227 204Net 975 921 959 941
Average realized price per pound (continuing operations) $ 2.48 $ 2.19Average realized price per pound (including Tenke) $ 2.47 $ 2.18
GOLD (thousands of recoverable ounces)(FCX's net interest in %)
North America (100%) 6 5 4 5Indonesia (90.64%)b 424 345 401 333
Consolidated 430 350 405 338Less noncontrolling interests 40 32 38 31Net 390 318 367 307
Average realized price per ounce $ 1,174 $ 1,067
MOLYBDENUM (millions of recoverable pounds)(FCX's net interest in %)
Henderson (100%) 3 4 N/A N/AClimax (100%) 4 5 N/A N/ANorth America copper mines (100%)a 8 9 N/A N/ACerro Verde (53.56%) 7 2 N/A N/A
Consolidated 22 20 22 20Less noncontrolling interests 3 1 2 1Net 19 19 20 19
Average realized price per pound $ 8.27 $ 6.94
a. Amounts are net of Morenci's undivided joint venture partner's interest; effective May 31, 2016, FCX's undivided interest in Morenci wasprospectively reduced from 85 percent to 72 percent.
b. Amounts are net of Grasberg's joint venture partner's interest, which varies in accordance with the terms of the joint venture agreement.
c. Consolidated sales volumes exclude purchased copper of 57 million pounds in fourth-quarter 2016 and 29 million pounds in fourth-quarter 2015.
d. On November 16, 2016, FCX completed the sale of its interest in the Tenke mine.

II
FREEPORT-McMoRan INC.SELECTED MINING OPERATING DATA (continued)
Years Ended December 31,Production Sales
COPPER (millions of recoverable pounds) 2016 2015 2016 2015(FCX's net interest in %)
North AmericaMorenci (72%)a 848 902 855 915Bagdad (100%) 177 210 180 222Safford (100%) 230 202 229 198Sierrita (100%) 162 189 162 196Miami (100%) 25 43 27 46Chino (100%) 308 314 308 319Tyrone (100%) 76 84 75 89Other (100%) 5 3 5 3
Total North America 1,831 1,947 1,841 1,988
South AmericaCerro Verde (53.56%) 1,108 545 1,105 544El Abra (51%) 220 324 227 327
Total South America 1,328 869 1,332 871
IndonesiaGrasberg (90.64%)b 1,063 752 1,054 744
Consolidated - continuing operations 4,222 3,568 4,227c
3,603c
Discontinued operations - Tenke (56%)d 425 449 424 467Total 4,647 4,017 4,651 4,070Less noncontrolling interests 909 680 910 688Net 3,738 3,337 3,741 3,382
Average realized price per pound (continuing operations) $ 2.28 $ 2.42Average realized price per pound (including Tenke) $ 2.27 $ 2.42
GOLD (thousands of recoverable ounces)(FCX's net interest in %)
North America (100%) 27 25 25 23Indonesia (90.64%)b 1,061 1,232 1,054 1,224
Consolidated 1,088 1,257 1,079 1,247Less noncontrolling interests 99 115 99 115Net 989 1,142 980 1,132
Average realized price per ounce $ 1,238 $ 1,129
MOLYBDENUM (millions of recoverable pounds)(FCX's net interest in %)
Henderson (100%) 10 25 N/A N/AClimax (100%) 16 23 N/A N/ANorth America (100%)a 33 37 N/A N/ACerro Verde (53.56%) 21 7 N/A N/A
Consolidated 80 92 74 89Less noncontrolling interests 9 3 6 4Net 71 89 68 85
Average realized price per pound $ 8.33 $ 8.70
a. Amounts are net of Morenci's undivided joint venture partner's interest; effective May 31, 2016, FCX's undivided interest in Morenci wasprospectively reduced from 85 percent to 72 percent.
b. Amounts are net of Grasberg's joint venture partner's interest, which varies in accordance with the terms of the joint venture agreement.
c. Consolidated sales volumes exclude purchased copper of 188 million pounds for the year 2016 and 121 million pounds for the year 2015.
d. On November 16, 2016, FCX completed the sale of its interest in the Tenke mine.

III
FREEPORT-McMoRan INC.SELECTED MINING OPERATING DATA (continued)
Three Months Ended December 31, Years Ended December 31,2016 2015 2016 2015
100% North America Copper MinesSolution Extraction/Electrowinning (SX/EW) Operations
Leach ore placed in stockpiles (metric tons per day) 662,700 906,500 739,200 909,900Average copper ore grade (percent) 0.30 0.26 0.31 0.26Copper production (millions of recoverable pounds) 303 326 1,224 1,134
Mill OperationsOre milled (metric tons per day) 302,300 319,300 300,500 312,100Average ore grades (percent):
Copper 0.44 0.50 0.47 0.49Molybdenum 0.03 0.03 0.03 0.03
Copper recovery rate (percent) 83.0 84.8 85.5 85.4Production (millions of recoverable pounds):
Copper 193 244 854 972Molybdenum 8 9 33 37
100% South America MiningSX/EW Operations
Leach ore placed in stockpiles (metric tons per day) 132,400 113,800 151,600 193,900Average copper ore grade (percent) 0.43 0.49 0.41 0.44Copper production (millions of recoverable pounds) 78 100 328 430
Mill OperationsOre milled (metric tons per day) 366,500 240,100 353,400 152,100Average ore grades:
Copper (percent) 0.43 0.47 0.43 0.46Molybdenum (percent) 0.02 0.02 0.02 0.02
Copper recovery rate (percent) 85.1 85.1 85.8 81.5Production (millions of recoverable pounds):
Copper 264 184 1,000 439Molybdenum 7 2 21 7
100% Indonesia MiningOre milled (metric tons per day):a
Grasberg open pit 126,900 108,400 119,700 115,900Deep Ore Zone underground mine 36,000 43,000 38,000 43,700Deep Mill Level Zone (DMLZ) underground mineb 2,500 3,500 4,400 2,900Grasberg Block Cave underground mineb 3,000 — 2,700 —Big Gossan underground mineb 1,500 — 900 —
Total 169,900 154,900 165,700 162,500Average ore grades:
Copper (percent) 1.08 0.75 0.91 0.67Gold (grams per metric ton) 0.97 0.92 0.68 0.79
Recovery rates (percent):Copper 92.0 90.9 91.0 90.4Gold 83.7 84.1 82.2 83.4
Production (recoverable):Copper (millions of pounds) 326 201 1,062 752Gold (thousands of ounces) 397 345 1,061 1,232
100% Africa Mining (Discontinued Operations)c
Ore milled (metric tons per day) 14,100 15,900 15,200 14,900Average ore grades (percent):
Copper 4.53 3.64 4.18 4.00Cobalt 0.42 0.51 0.44 0.43
Copper recovery rate (percent) 93.3 94.0 93.6 94.0Production (millions of pounds):
Copper (recoverable) 69 110 425 449Cobalt (contained) 4 10 32 35
100% Molybdenum MinesOre milled (metric tons per day) 20,000 25,900 18,300 34,800Average molybdenum ore grade (percent) 0.18 0.20 0.21 0.20Molybdenum production (millions of recoverable pounds) 7 9 26 48
a. Amounts represent the approximate average daily throughput processed at PT Freeport Indonesia's (PT-FI) mill facilities from eachproducing mine and from development activities that result in metal production.
b. Targeted production rates once the DMLZ underground mine reaches full capacity are expected to approximate 80,000 metric tons of ore per day in 2021; production from the Grasberg Block Cave underground mine is expected to commence in 2018, and production from the Big Gossan underground mine has restarted.
c. On November 16, 2016, FCX completed the sale of its interest in the Tenke mine.

IV
FREEPORT-McMoRan INC.SELECTED U.S. OIL AND GAS OPERATING DATA
Three Months Ended December 31,Sales Volumes Sales per Day
2016 2015 2016 2015Gulf of Mexico (GOM)a
Oil (thousand barrels or MBbls) 5,436 5,796 59 63Natural gas (million cubic feet or MMcf) 10,370 9,731 113 106Natural gas liquids (NGLs, in MBbls) 42 576 1 6Thousand barrels of oil equivalents (MBOE) 7,207 7,994 78 87Average realized price per BOEb $ 39.75 $ 32.65Cash production costs per BOEb $ 11.38 $ 11.94Capital expenditures (in millions) $ 38 $ 619
CALIFORNIAa
Oil (MBbls) 2,836 3,162 31 34Natural gas (MMcf) 456 490 5 5NGLs (MBbls) 34 38 —
c1
MBOE 2,947 3,282 32 36Average realized price per BOEb $ 42.88 $ 32.44Cash production costs per BOEb $ 22.01 $ 30.53Capital expenditures (in millions) $ 9 $ 18
HAYNESVILLE/MADDEN/OTHERd
Oil (MBbls) 1 38 —c
1Natural gas (MMcf) 2,026 11,317 22 123NGLs (MBbls) — 11 —
c—
c
MBOE 338 1,935 4 21Average realized price per BOEb $ 16.13 $ 13.11Cash production costs per BOEb $ 19.24 $ 9.37Capital expenditures (in millions) $ — $ (1)
TOTAL U.S. OIL AND GAS OPERATIONSOil (MBbls) 8,273 8,996 90 98Natural gas (MMcf) 12,852 21,538 140 234NGLs (MBbls) 76 625 1 7MBOE 10,492
e13,211 114
e144
Cash operating margin per BOE:b
Realized revenue $ 39.88f
$ 37.49f
Less: cash production costs 14.62 16.17Cash operating margin $ 25.26 $ 21.32
Depreciation, depletion and amortization per BOE $ 16.51 $ 25.61Capital expenditures (in millions) $ 99
g$ 518
g
a. In December 2016, FCX completed the sales of the Deepwater GOM and onshore California properties. b. Cash operating margin for oil and gas operations reflects realized revenues less cash production costs. For reconciliations of average
realized price and cash production costs per BOE to revenues and production and delivery costs reported in FCX's consolidated financial statements, refer to the supplemental schedules, “Product Revenues and Production Costs,” beginning on page XV, which are available on FCX's website, “www.fcx.com.”
c. Rounds to less than 1 MBbl per day.d. In July 2016, FCX completed the sale of its Haynesville shale assets. In January 2017, FCX entered into an agreement to sell its interests in
the Madden area, which is expected to close first-quarter 2017.e. Includes sales of 8.7 MMBOE (94 MBOE per day) from the Deepwater GOM and onshore California oil and gas properties that were sold in
December 2016.f. Includes realized cash gains on oil and gas derivative contracts of $0.57 per BOE for fourth-quarter 2016 and $7.76 per BOE for fourth-
quarter 2015. FCX entered into the 2016 contracts as part of the terms to sell the onshore California properties; these contracts were assumed by the buyer at the completion of the sale. The 2015 contracts were managed on a consolidated basis; accordingly, fourth-quarter 2015 average realized prices per BOE by region do not reflect adjustments for crude oil derivative contracts.
g. Consolidated capital expenditures for U.S. oil and gas operations reflect total spending, which includes accrual and other adjustments totaling $52 million for fourth-quarter 2016 and $(118) million for fourth-quarter 2015, that are not specifically allocated to the above regions. Excludes international oil and gas capital expenditures, primarily related to Morocco, totaling $19 million for fourth-quarter 2015.

V
FREEPORT-McMoRan INC.SELECTED U.S. OIL AND GAS OPERATING DATA (continued)
Years Ended December 31,Sales Volumes Sales per Day
2016 2015 2016 2015GOMa
Oil (MBbls) 22,906 22,161 63 61Natural gas (MMcf) 39,004 35,878 107 98NGLs (MBbls) 1,680 2,209 5 6MBOE 31,087 30,350 85 83Average realized price per BOEb $ 34.09 $ 39.81Cash production costs per BOEb $ 12.20 $ 15.46Capital expenditures (in millions) $ 595 $ 2,630
CALIFORNIAa
Oil (MBbls) 11,382 12,935 31 35Natural gas (MMcf) 1,779 2,154 5 6NGLs (MBbls) 138 166 —
c1
MBOE 11,817 13,460 32 37Average realized price per BOEb $ 35.52 $ 39.92Cash production costs per BOEb $ 24.43 $ 30.66Capital expenditures (in millions) $ 31 $ 90
HAYNESVILLE/MADDEN/OTHERd
Oil (MBbls) 83 158 —c
—c
Natural gas (MMcf) 24,302 51,626 66 142NGLs (MBbls) 21 50 —
c—
c
MBOE 4,154 8,812 11 24Average realized price per BOEb $ 12.98 $ 15.77Cash production costs per BOEb $ 11.26 $ 11.02Capital expenditures (in millions) $ 2 $ 28
TOTAL U.S. OIL AND GAS OPERATIONSOil (MBbls) 34,371 35,254 94 96Natural gas (MMcf) 65,085 89,658 178 246NGLs (MBbls) 1,839 2,425 5 7MBOE 47,058 52,622 128 144Cash operating margin per BOE:b
Realized revenue $ 32.59e
$ 43.54e
Less: cash production costs 15.19 18.59Cash operating margin $ 17.40 $ 24.95
Depreciation, depletion and amortization per BOE $ 18.47 $ 34.28Capital expenditures (in millions) $ 1,127
f$ 2,948
f
a. In December 2016, FCX completed the sales of its Deepwater GOM and onshore California properties. b. Cash operating margin for oil and gas operations reflects realized revenues less cash production costs. For reconciliations of average
realized price and cash production costs per BOE to revenues and production and delivery costs reported in FCX's consolidated financial statements, refer to the supplemental schedules, “Product Revenues and Production Costs,” beginning on page XV, which are available on FCX's website, “www.fcx.com.”
c. Rounds to less than 1 MBbl per day.d. In July 2016, FCX completed the sale of its Haynesville shale assets. In January 2017, FCX entered into an agreement to sell its interests in
the Madden area, which is expected to close first-quarter 2017.e. Includes realized cash gains on oil and gas derivative contracts of $0.13 per BOE for the year 2016 and $7.72 per BOE for the year 2015.
FCX entered into the 2016 contracts as part of the terms to sell the onshore California properties; these contracts were assumed by the buyer at the completion of the sale. The 2015 contracts were managed on a consolidated basis; accordingly, the year 2015 average realized prices per BOE by region do not reflect adjustments for crude oil derivative contracts.
f. Consolidated capital expenditures for U.S. oil and gas operations reflect total spending, which includes changes in capital expenditure accruals and other adjustments totaling $499 million for the year ended 2016, and $200 million for the year ended 2015 that are not specifically allocated to the above regions. Excludes international oil and gas capital expenditures totaling $47 million for the year 2016 and $100 million for the year 2015, primarily related to the Morocco oil and gas properties.

VI
FREEPORT-McMoRan INC.CONSOLIDATED STATEMENTS OF OPERATIONS (Unaudited)
Three Months Ended Years EndedDecember 31, December 31,
2016 2015 2016 2015(In Millions, Except Per Share Amounts)
Revenuesa $ 4,377 $ 3,516 $ 14,830 $ 14,607Cost of sales:
Production and deliveryb 2,740 2,831 10,697 10,693Depreciation, depletion and amortization 593 718 2,530 3,240Impairment of oil and gas properties — 3,702 4,317 13,144Metals inventory adjustments 9 184 36 338Total cost of sales 3,342 7,435 17,580 27,415
Selling, general and administrative expenses 199c
137 607c
558Mining exploration and research expenses 18 24 64 107Environmental obligations and shutdown costs 2 17 20 78Net loss (gain) on sales of assets 113
d— (649)
d(39)
Total costs and expenses 3,674 7,613 17,622 28,119Operating income (loss) 703 (4,097) (2,792) (13,512)Interest expense, nete (181) (179) (755) (617)Net (loss) gain on exchanges and early extinguishment of debt (25) — 26 —Other (expense) income, net (5) (1) 49 1Income (loss) from continuing operations before income taxes
and equity in affiliated companies' net earnings (losses) 492 (4,277) (3,472) (14,128)(Provision for) benefit from income taxesf (292) 189 (371) 1,951Equity in affiliated companies' net earnings (losses) 2 (2) 11 (3)Net income (loss) from continuing operations 202 (4,090) (3,832) (12,180)Net (loss) income from discontinued operationsg (2) (4) (193) 91Net income (loss) 200 (4,094) (4,025) (12,089)Net (income) loss attributable to noncontrolling interests:
Continuing operations (81) 34 (227) (27)Discontinued operations (19) (11) (63) (79)
Gain on redemption and preferred dividends attributable toredeemable noncontrolling interest 192 (10) 161 (41)
Net income (loss) attributable to FCX common stockh $ 292 $ (4,081) $ (4,154) $ (12,236)
Basic and diluted net income (loss) per share attributable tocommon stockholders:Continuing operations $ 0.22 $ (3.46) $ (2.96) $ (11.32)Discontinued operations (0.01) (0.01) (0.20) 0.01
$ 0.21 $ (3.47) $ (3.16) $ (11.31)
Weighted-average common shares outstanding:Basic 1,403 1,177 1,318 1,082Diluted 1,410 1,177 1,318 1,082
Dividends declared per share of common stock $ — $ — $ — $ 0.2605
a. Revenues include (i) adjustments to provisionally priced concentrate and cathode copper sales recognized in prior periods, which are summarized in the supplemental schedule, "Derivative Instruments" beginning on page XI, and (ii) net noncash mark-to-market losses associated with oil derivative contracts, which are summarized in the supplemental schedule, "Adjusted Net Income (Loss)," beginning on page IX.
b. Includes net charges (i) at oil and gas operations associated with contract termination costs, drillship settlements/idle rig costs, inventory adjustments, asset impairments and other net charges and (ii) at mining operations for asset retirement/impairment, restructuring and other net charges. Refer to the supplemental schedule, "Adjusted Net Income (Loss)," beginning on page IX for a summary of these charges.
c. Includes restructuring charges at oil and gas operations, which are summarized in the supplemental schedule, "Adjusted Net Income (Loss)," beginning on page IX.
d. Includes gains totaling $183 million for (i) contingent payments associated with the sale of the Deepwater GOM oil and gas properties and (ii) the fair value of contingent consideration associated with the sale of the onshore California oil and gas properties, which in accordance with accounting guidelines will continue to be adjusted through December 31, 2020.
e. Consolidated interest expense, excluding capitalized interest, totaled $207 million in fourth-quarter 2016, $210 million in fourth-quarter 2015, $854 million for the year 2016 and $832 million for the year 2015.
f. Refer to the supplemental schedule, "Income Taxes," on page XI for a summary of FCX's (provision for) benefit from income taxes.g. Reflects the results of TF Holdings Limited (TFHL) through November 16, 2016, and includes charges for allocated interest expense associated with
FCX's term loan that was required to be repaid as a result of the sale of FCX's interest in TFHL. The fourth quarter and year 2016 also include a loss on disposal. For a summary of the components of net (loss) income from discontinued operations, refer to the supplemental schedules on pages XXVIII to XXXI.
h. FCX defers recognizing profits on intercompany sales until final sales to third parties occur. Refer to the supplemental schedule, "Deferred Profits," on page XII for a summary of net impacts from changes in these deferrals.

VII
FREEPORT-McMoRan INC.CONDENSED CONSOLIDATED BALANCE SHEETS (Unaudited)
December 31,2016 2015
(In Millions)ASSETSCurrent assets:
Cash and cash equivalents $ 4,245 $ 177Trade accounts receivable 1,126 645Income and other tax receivables 879 1,332Other accounts receivable 89 152Inventories:
Mill and leach stockpiles 1,338 1,539Materials and supplies, net 1,306 1,575Product 998 961
Other current assets 110 161Held for sale 344 920
Total current assets 10,435 7,462Property, plant, equipment and mine development costs, net 23,219 23,986Oil and gas properties - full cost method:
Subject to amortization, less accumulated amortization 74 2,262Not subject to amortization — 4,831
Long-term mill and leach stockpiles 1,633 1,663Other assets 1,956 1,987Held for sale — 4,386Total assets $ 37,317 $ 46,577
LIABILITIES AND EQUITYCurrent liabilities:
Accounts payable and accrued liabilities $ 2,393 $ 3,232Current portion of debt 1,232 649Current portion of environmental and asset retirement obligations 369 272Accrued income taxes 66 23Held for sale 205 131
Total current liabilities 4,265 4,307Long-term debt, less current portion 14,795 19,675Deferred income taxes 3,768 3,567Environmental and asset retirement obligations, less current portion 3,487 3,714Other liabilities 1,745 1,641Held for sale — 865
Total liabilities 28,060 33,769
Redeemable noncontrolling interest — 764
Equity:FCX stockholders' equity:
Common stock 157 137Capital in excess of par value 26,690 24,283Accumulated deficit (16,540) (12,387)Accumulated other comprehensive loss (548) (503)Common stock held in treasury (3,708) (3,702)
Total FCX stockholders' equity 6,051 7,828Noncontrolling interests 3,206 4,216
Total equity 9,257 12,044Total liabilities and equity $ 37,317 $ 46,577

VIII
FREEPORT-McMoRan INC.CONSOLIDATED STATEMENTS OF CASH FLOWS (Unaudited)
Years Ended December 31,2016 2015
(In Millions)Cash flow from operating activities:
Net loss $ (4,025) $ (12,089)Adjustments to reconcile net loss to net cash provided by operating activities:
Depreciation, depletion and amortization 2,610 3,497Impairment of oil and gas properties 4,317 13,144Non-cash drillship settlements and other contract terminations 689 —Metals inventory adjustments 36 338Asset impairments, inventory adjustments, restructuring and other 134 256Net gain on sales of assets (649) (39)Stock-based compensation 86 85Net charges for environmental and asset retirement obligations, including accretion 191 209Payments for environmental and asset retirement obligations (242) (198)Net gain on exchanges and early extinguishment of debt (26) —Deferred income taxes 239 (2,039)Loss on disposal of discontinued operations 198 —Decrease (increase) in long-term mill and leach stockpiles 10 (212)Net loss (gain) on oil and gas derivative contracts 35 (87)Other, net 69 (18)Changes in working capital and other tax payments, excluding amounts from
dispositions: Accounts receivable (175) 813Inventories 117 379Other current assets 37 97Accounts payable and accrued liabilities (28) (217)Accrued income taxes and changes in other tax payments 106 (699)
Net cash provided by operating activities 3,729 3,220
Cash flow from investing activities:Capital expenditures:
North America copper mines (102) (355)South America (382) (1,722)Indonesia (1,025) (901)Molybdenum mines (2) (13)U.S. oil and gas operations (1,127) (2,948)Other (175) (414)
Proceeds from sales of:Deepwater GOM and onshore California oil and gas properties 2,272 —Interest in TFHL 2,664 —Additional interest in Morenci 996 —Other assets 423 160
Other, net 8 (53)Net cash provided by (used in) investing activities 3,550 (6,246)
Cash flow from financing activities:Proceeds from debt 3,681 8,272Repayments of debt (7,625) (6,677)Net proceeds from sale of common stock 1,515 1,936Cash dividends and distributions paid:
Common stock (6) (605)Noncontrolling interests, including redemption (693) (120)
Stock-based awards net payments, including excess tax benefit (6) (4)Debt financing costs and other, net (32) (16)
Net cash (used in) provided by financing activities (3,166) 2,786Net increase (decrease) in cash and cash equivalents 4,113 (240)(Increase) decrease in cash and cash equivalents in assets held for sale (45) 119Cash and cash equivalents at beginning of year 177 298Cash and cash equivalents at end of year $ 4,245 $ 177

IX
FREEPORT-McMoRan INC.ADJUSTED NET INCOME (LOSS)
Adjusted net income (loss) is intended to provide investors and others with information about FCX's recurring operating performance. This information differs from net income (loss) attributable to common stock determined in accordance with U.S. generally accepted accounting principles (GAAP) and should not be considered in isolation or as a substitute for measures of performance determined in accordance with U.S. GAAP. FCX's adjusted net income (loss) follows, which may not be comparable to similarly titled measures reported by other companies (in millions, except per share amounts).
Three Months Ended December 31,2016 2015
Pre-tax After-tax Per Share Pre-tax After-tax Per ShareNet income (loss) attributable to common stock N/A $ 292 $ 0.21 N/A $ (4,081) $ (3.47)Net noncash mark-to-market losses on oil
derivative contracts $ (41)a $ (41) $ (0.03) $ (102) $ (63) $ (0.05)Impairment of oil and gas properties — — — (3,702) (3,743) (3.18)Other oil and gas (charges) credits:
Drillship settlements/idle rig and contracttermination costs (103) b (103) (0.07) (13) (8) (0.01)
Inventory adjustments, asset impairment andother net credits (charges) 8 8 0.01 (116) (73) (0.06)
Net restructuring charges (47) (47) (0.03) — — —Mining charges:
Metals inventory adjustments (9) (9) (0.01) (184) (118) (0.10)Asset impairment, restructuring and other net
charges (16) (6) — (53) (34) (0.03)Charges for executive retirement benefits — — — (18) (12) (0.01)Adjustments to environmental obligations and
related litigation reserves 5 5 — (7) (5) —Net loss on sales of assets (113)
c(108) (0.08) — — —
Net loss on exchanges and early extinguishment ofdebt (25) (25) (0.02) — — —
Net tax credits N/A 84d
0.06 N/A — —Loss on disposal of discontinued operations (16) e (16) (0.01) — — —Gain on redemption of redeemable noncontrolling interest 199 f 199 0.14 — — —
$ (158) $ (59) $ (0.04) $ (4,195) $ (4,056) $ (3.45)g
Adjusted net income (loss) attributable tocommon stock N/A $ 351 $ 0.25 N/A $ (25) $ (0.02)
a. As part of the terms to sell the onshore California oil and gas properties, FCX entered into derivative contracts for a portion of projected oil sales; these contracts were assumed by the buyer at completion of the sale.
b. Includes $5 million for fair value adjustments of contingent payments related to drillship settlements, which in accordance with accounting guidelines will continue to be adjusted through June 30, 2017.
c. Primarily reflects estimated losses associated with the potential Freeport Cobalt and Kisanfu transactions. Also includes gains totaling $183 million for contingent consideration associated with the oil and gas transactions, including (i) $150 million for contingent payments related to the Deepwater GOM sale, which is payable to FCX as the buyer realizes future cash flows in connection with a third-party production handling agreement, and (ii) $33 million for the fair value of the potential $150 million in contingent consideration related to the onshore California sale, which in accordance with accounting guidelines will continue to be adjusted through December 31, 2020.
d. For further discussion of net tax credits impacting fourth-quarter 2016, refer to "Income Taxes," on page XI.e. Primarily reflects a charge of $33 million associated with the settlement agreement entered into with La Générale des Carrières et des Mines
(Gécamines) resulting in a resolution of all claims brought by Gécamines against FCX, partly offset by a gain of $13 million for the fair value of the potential $120 million in contingent consideration, which in accordance with accounting guidelines will continue to be adjusted through December 31, 2019.
f. Represents a gain on the settlement of FCX's preferred stock obligation at its Plains Offshore Operations Inc. subsidiary. g. Per share amounts do not foot down because of rounding.

X
FREEPORT-McMoRan INC.ADJUSTED NET INCOME (LOSS) (continued)
Years Ended December 31,2016 2015
Pre-tax After-tax Per Share Pre-tax After-tax Per ShareNet loss attributable to common stock N/A $ (4,154) $ (3.16) N/A $ (12,236) $ (11.31)Net noncash mark-to-market losses on oil
derivative contracts $ (41)a $ (41) $ (0.03) $ (319) $ (198) $ (0.18)Impairment of oil and gas properties (4,317) (4,317) (3.28) (13,144) (11,598) (10.72)Other oil and gas charges:
Drillship settlements/idle rig and contracttermination costs (926)b (926) (0.70) (26) (16) (0.01)
Inventory adjustments, asset impairment andother net charges (111) (111) (0.08) (162) (101) (0.10)
Net restructuring charges (85) (85) (0.06) — — —Mining net charges:
Metals inventory adjustments (36) (36) (0.03) (338) (217) (0.20)Asset retirement/impairment, restructuring and
other net charges (33) (14) (0.01) (145) (90) (0.08)Charges for executive retirement benefits — — — (18) (12) (0.01)Adjustments to environmental obligations and
related litigation reserves 16 16 0.01 (43) (28) (0.03)Net gain on sales of assets 649
c649 0.49 39 25 0.02
Net gain on exchanges and early extinguishment ofdebt 26 26 0.02 — — —
Gain on shareholder derivative litigation settlement — — — 92 92 0.09Net tax credits N/A 374
d0.28 N/A — —
Loss on disposal of discontinued operations (198)e
(198) (0.15) — — —Gain on redemption of redeemable noncontrolling interest 199 f 199 0.15 — — —
$ (4,857) $ (4,464) $ (3.39) $(14,064) $ (12,143) $ (11.22)
Adjusted net income (loss) attributable to common stock N/A $ 310 $ 0.23 N/A $ (93) $ (0.09)
a. As part of the terms to sell the onshore California oil and gas properties, FCX entered into derivative contracts for a portion of projected oil sales; these contracts were assumed by the buyer at completion of the sale.
b. Includes $23 million for the fair value of contingent payments related to drillship settlements, which in accordance with accounting guidelines will continue to be adjusted through June 30, 2017.
c. Primarily reflects gains associated with the Morenci and Timok transactions, partly offset by estimated losses associated with the potential Freeport Cobalt and Kisanfu transactions. Also includes gains totaling $183 million for contingent consideration associated with the oil and gas transactions, including (i) $150 million for contingent payments related to the Deepwater GOM sale, which is payable to FCX as the buyer realizes future cash flows in connection with a third-party production handling agreement and (ii) $33 million for the fair value of the potential $150 million in contingent consideration related to the onshore California sale, which in accordance with accounting guidelines will continue to be adjusted through December 31, 2020.
d. For further discussion of the net tax credits impacting the year 2016, refer to "Income Taxes," on page XI.e. Includes (i) a charge of $33 million associated with the settlement agreement entered into with Gécamines resulting in a resolution of all
claims brought by Gécamines against FCX, and (ii) a gain of $13 million for the fair value of the potential $120 million in contingent consideration, which in accordance with accounting guidelines will continue to be adjusted through December 31, 2019.
f. Represents a gain on the settlement of FCX's preferred stock obligation at its Plains Offshore Operations Inc. subsidiary.

XI
FREEPORT-McMoRan INC.INCOME TAXES
Following is a summary of the approximate amounts used in the calculation of FCX's consolidated income tax (provision) benefit for the fourth quarters and years ended 2016 and 2015 (in millions, except percentages):
Three Months Ended December 31,2016 2015
Income Tax Income TaxIncome Effective (Provision) Income Effective (Provision)(Loss)a Tax Rate Benefit (Loss)a Tax Rate Benefit
U.S. $ (249) 26% $ 65b
$ (593) 48% $ 285South America 211 48% (102)
c(116) 24% 28
Indonesia 514 45% (230) 103 49% (50)Impairment of oil and gas properties — N/A — (3,702) 37% 1,387Valuation allowance, netd — N/A — — N/A (1,428)Eliminations and other 16 N/A (24) 31 N/A (46)Rate adjustmente — N/A (1) — N/A 13Continuing operations $ 492 59% $ (292) $ (4,277) 4% $ 189
Years Ended December 31,2016 2015
Income Tax Income TaxIncome Effective (Provision) Income Effective (Provision)(Loss)a Tax Rate Benefit (Loss)a Tax Rate Benefit
U.S. $ (865) 41% $ 357b
$ (1,626)f
44% $ 720South America 501 43% (216)
c(40) (10)% (4)
Indonesia 1,058 42% (442) 430 45% (195)Impairment of oil and gas properties (4,317) 38% 1,632 (13,144) 37% 4,884Valuation allowance, netd — N/A (1,632) — N/A (3,338)Eliminations and other 151 N/A (70) 252 N/A (116)Continuing operations $ (3,472) (11)%
g$ (371) $ (14,128) 14% $ 1,951
a. Represents income (loss) from continuing operations by geographic location before income taxes and equity in affiliated companies' net earnings (losses).
b. Includes net tax credits of $67 million in fourth-quarter 2016 and $357 million for the year 2016 associated with alternative minimum tax credits, changes to valuation allowances and net operating loss carryback claims.
c. Includes a net tax credit of $13 million ($17 million net of noncontrolling interests) related to changes in Peruvian tax rules.d. As a result of the impairment to U.S. oil and gas properties, FCX recorded tax charges to establish valuation allowances against U.S.
federal and state deferred tax assets that will not generate a future benefit. e. In accordance with applicable accounting rules, FCX adjusts its interim provision for income taxes equal to its consolidated tax rate. f. Includes a gain of $92 million related to net proceeds received from insurance carriers and other third parties related to the shareholder
derivative litigation settlement for which there was no related tax provision.g. The consolidated effective income tax rate is a function of the combined effective tax rates for the jurisdictions in which FCX operates.
Accordingly, variations in the relative proportions of jurisdictional income result in fluctuations to FCX's consolidated effective income tax rate. Assuming achievement of current sales volume and cost estimates and average prices of $2.50 per pound for copper, $1,200 per ounce for gold and $7.00 per pound for molybdenum, FCX estimates its consolidated effective tax rate for the year 2017 will approximate 46 percent and would decrease with higher prices.
DERIVATIVE INSTRUMENTS
Provisional Pricing. For the year 2016, FCX's mined copper (excluding volumes from Tenke) was sold 58 percent in concentrate, 21 percent as cathode and 21 percent as rod from North America operations. Under the long-established structure of sales agreements prevalent in the industry, copper contained in concentrates and cathodes is provisionally priced at the time of shipment. The provisional prices are finalized in a contractually specified future month (generally one to four months from the shipment date) primarily based on quoted monthly average spot copper prices on the London Metal Exchange (LME). Because a significant portion of FCX's copper concentrate and cathode sales in any quarterly period usually remain subject to final pricing, the quarter-end forward price is a major determinant of recorded revenues and the average recorded copper price for the period. LME spot copper prices averaged $2.39 per pound during fourth-quarter 2016, compared to FCX's average realized price (excluding Tenke) of $2.48 per pound.

XII
FREEPORT-McMoRan INC.DERIVATIVE INSTRUMENTS (continued)
Following is a summary of the favorable (unfavorable) impacts of net adjustments to prior periods' provisionally priced copper sales for the fourth quarters and years ended 2016 and 2015 (in millions, except per share amounts):
Three Months Ended Years EndedDecember 31, December 31,
2016 2015 2016 2015Revenues $ 129 $ (70) $ 5 $ (100)Net income attributable to common stock (continuing operations) $ 57 $ (37) $ 2 $ (50)Net income per share of common stock (continuing operations) $ 0.04 $ (0.03) $ — $ (0.05)
At December 31, 2016, FCX had provisionally priced copper sales at its copper mining operations totaling 466 million pounds of copper (net of intercompany sales and noncontrolling interests) recorded at an average of $2.51 per pound, subject to final pricing over the next several months. FCX estimates that each $0.05 change in the price realized from the December 31, 2016, provisional price recorded would have an approximate $15 million effect on 2017 net income attributable to common stock. The LME spot copper price closed at $2.67 per pound on January 24, 2017.
DEFERRED PROFITS
FCX defers recognizing profits on sales from its mining operations to Atlantic Copper and on 25 percent of PT Freeport Indonesia's (PT-FI) sales to PT Smelting (PT-FI's 25 percent-owned Indonesian smelting unit) until final sales to third parties occur. Changes in these deferrals attributable to variability in intercompany volumes resulted in net (reductions) additions to net income attributable to common stock totaling $(15) million in fourth-quarter 2016, $4 million in fourth-quarter 2015, $(8) million for the year 2016 and $42 million for the year 2015. FCX's net deferred profits on its inventories at Atlantic Copper and PT Smelting to be recognized in future periods' net income attributable to common stock totaled $43 million at December 31, 2016. Quarterly variations in ore grades, the timing of intercompany shipments and changes in product prices will result in variability in FCX's net deferred profits and quarterly earnings.
BUSINESS SEGMENTS
FCX has organized its mining operations into four primary divisions – North America copper mines, South America mining, Indonesia mining and Molybdenum mines, and operating segments that meet certain thresholds are reportable segments. For oil and gas operations, FCX determines its operating segments on a country-by-country basis. Separately disclosed in the following tables are FCX's reportable segments, which include the Morenci, Cerro Verde and Grasberg copper mines, the Rod & Refining operations and the U.S. Oil & Gas operations.
FCX’s reportable segments previously included Africa mining, which consisted of the Tenke mine. On November 16, 2016, FCX completed the sale of its effective interest in Tenke, which has been removed from continuing operations and reported as discontinued operations for all periods presented.
On May 31, 2016, FCX completed the sale of an additional 13 percent undivided joint venture interest in the Morenci unincorporated joint venture. As a result, FCX’s undivided interest in Morenci was prospectively reduced from 85 percent to 72 percent.
Intersegment sales between FCX’s mining operations are based on similar arms-length transactions with third parties at the time of the sale. Intersegment sales may not be reflective of the actual prices ultimately realized because of a variety of factors, including additional processing, timing of sales to unaffiliated customers and transportation premiums. In addition, intersegment sales from Tenke to FCX's other consolidated subsidiaries have been eliminated in discontinued operations.
FCX allocates certain operating costs, expenses and capital expenditures to its operating divisions and individual segments. However, not all costs and expenses applicable to an operation are allocated. U.S. federal and state income taxes are recorded and managed at the corporate level (included in Corporate, Other & Eliminations), whereas foreign income taxes are recorded and managed at the applicable country level. In addition, most mining exploration and research activities are managed on a consolidated basis, and those costs along with some selling, general and administrative costs are not allocated to the operating divisions or individual segments. Accordingly, the following segment information reflects management determinations that may not be indicative of what the actual financial performance of each operating division or segment would be if it was an independent entity.

XIII
FREEPORT-McMoRan INC. BUSINESS SEGMENTS (continued)
(In millions) Mining Operationsa
North America Copper Mines South America IndonesiaAtlantic Other Corporate
Molyb- Copper Mining U.S. OtherOther Cerro Other denum Rod & Smelting & Elimi- Total Oil & Gas & Elimi- FCX
Morenci Mines Total Verde Mines Total Grasberg Mines Refining & Refining nations Mining Operations nations TotalThree Months Ended December 31, 2016Revenues:
Unaffiliated customers $ 88 $ 29 $ 117 $ 756 $ 131 $ 887 $ 1,219b
$ — $ 1,013 $ 465 $ 295c
$ 3,996 $ 381d
$ — $ 4,377Intersegment 392 585 977 32 — 32 3 50 7 2 (1,071) — — — —
Production and delivery 256 429 685 424e
94 518 566 52 1,016 437 (826) 2,448 274f
18 2,740Depreciation, depletion and amortization 47 76 123 124 27 151 100 17 3 7 16 417 173 3 593Metals inventory adjustments — (5) (5) — — — — 3 — — 11 9 — — 9Selling, general and administrative expenses — 1 1 3 — 3 30 — — 4 6 44 93
g62 199
Mining exploration and research expenses — 1 1 — — — — — — — 17 18 — — 18Environmental obligations and shutdown costs — — — — — — — — — — 2 2 — — 2Net loss on sales of assets — — — — — — — — — — 105 105 8 — 113Operating income (loss) 177 112 289 237 10 247 526 (22) 1 19 (107) 953 (167) (83) 703
Interest expense, net 1 — 1 19 — 19 — — — 4 20 44 103 34 181Provision for (benefit from) income taxes — — — 96 6 102 230 — — — — 332 — (40) 292Total assets at December 31, 2016 2,863 4,448 7,311 9,076 1,533 10,609 10,954 1,934 220 658 1,444
h33,130 467 3,720 37,317
Capital expenditures 6 9 15 50 — 50 319 — — 5 16i
405 99 — 504
Three Months Ended December 31, 2015Revenues:
Unaffiliated customers $ 107 $ 86 $ 193 $ 384 $ 169 $ 553 $ 648b
$ — $ 1,028 $ 482 $ 212c
$ 3,116 $ 400 $ — $ 3,516Intersegment 437 587 1,024 4 — 4 (1) 50 9 3 (1,089) — — — —
Production and deliverye 406 526 932 275 159 434 497 65 1,032 451 (926) 2,485 354f
(8) 2,831Depreciation, depletion and amortization 60 92 152 85 31 116 55 20 2 10 21 376 339 3 718Impairment of oil and gas properties — — — — — — — — — — — — 3,710 (8)
j3,702
Metals inventory adjustments — 76 76 — 73 73 — 5 — — 30 184 — — 184Selling, general and administrative expenses 1 1 2 1 — 1 29 — — 3 4 39 48 50 137Mining exploration and research expenses — 1 1 — — — — — — — 23 24 — — 24Environmental obligations and shutdown costs — — — — — — — — — — 17 17 — — 17Operating income (loss) 77 (23) 54 27 (94) (67) 66 (40) 3 21 (46) (9) (4,051) (37) (4,097)
Interest expense, net — 1 1 15 — 15 — — — 2 18 36 57 86 179Provision for (benefit from) income taxes — — — 13 (41) (28) 50 — — — — 22 — (211) (189)Total assets at December 31, 2015 3,567 4,878 8,445 9,445 1,661 11,106 9,357 1,999 219 612 6,417
h38,155 8,141 281 46,577
Capital expenditures 29 18 47 378 5 383 250 3 2 5 71i
761 518k
19 1,298
a. Excludes the results of Tenke, which is reported as discontinued operations. Net loss from discontinued operations totaled $2 million in fourth-quarter 2016 and $4 million in fourth-quarter 2015. Refer to the supplemental schedules on pages XXVIII and XXIX for a summary of the components of net income (loss) from discontinued operations.
b. Includes PT-FI's sales to PT Smelting totaling $490 million in fourth-quarter 2016 and $350 million in fourth-quarter 2015.c. Includes revenues from FCX's molybdenum sales company, which includes sales of molybdenum produced by the Molybdenum mines and by certain of the North and South America copper mines.d. Includes net losses of $35 million associated with oil derivative contracts that were entered into as part of the terms to sell the onshore California properties.e. Fourth-quarter 2016 includes charges of $16 million at Cerro Verde for social commitments. Fourth-quarter 2015 includes asset impairments and restructuring charges totaling $53 million, consisting of $24 million at North America copper mines, $2
million at South America mines, $5 million at Molybdenum mines, $3 million at Rod & Refining, $18 million at Other Mining & Eliminations and $1 million at Corporate, Other & Eliminations.f. Includes net charges for totaling $93 million in fourth-quarter 2016 and $129 million in fourth-quarter 2015, primarily for idle rig and contract termination costs, inventory adjustments and asset impairment and other net charges, which are
summarized in the supplemental schedule, "Adjusted Net Income (Loss)," on page IX. g. Includes $47 million for net restructuring charges.h. Includes assets held for sale totaling $344 million at December 31, 2016, primarily associated with Freeport Cobalt and the Kisanfu exploration project, and $5.3 billion at December 31, 2015, which also includes the Tenke disposal group. i. Includes $3 million in fourth-quarter 2016 and $63 million in fourth-quarter 2015 associated with discontinued operations. j. Primarily reflects adjustments to the third-quarter 2015 impairment of the Morocco oil and gas propertiesk. Excludes international oil and gas capital expenditures totaling $19 million, primarily related to the Morocco oil and gas properties, which are included in Corporate, Other & Eliminations.

XIV
FREEPORT-McMoRan INC.BUSINESS SEGMENTS (continued)
(In millions) Mining Operationsa
North America Copper Mines South America IndonesiaAtlantic Other Corporate
Molyb- Copper Mining U.S. OtherOther Cerro Other denum Rod & Smelting & Elimi- Total Oil & Gas & Elimi- FCX
Morenci Mines Total Verde Mines Total Grasberg Mines Refining & Refining nations Mining Operations nations TotalYear Ended December 31, 2016Revenues:
Unaffiliated customers $ 444 $ 240 $ 684 $ 2,241 $ 510 $ 2,751 $ 3,233b
$ — $ 3,833 $ 1,825 $ 991c
$ 13,317 $ 1,513d
$ — $ 14,830Intersegment 1,511 2,179 3,690 187 — 187 62 186 29 5 (4,159) — — — —
Production and delivery 1,169 1,763 2,932 1,351e
407 1,758 1,794e
199 3,836 1,712 (3,388) 8,843 1,801f
53 10,697Depreciation, depletion and amortization 217 313 530 443 110 553 384 68 10 29 73 1,647 869 14 2,530Impairment of oil and gas properties — — — — — — — — — — — — 4,299 18
g4,317
Metals inventory adjustments — 1 1 — — — — 15 — — 20 36 — — 36Selling, general and administrative expenses 2 3 5 8 1 9 90 — — 17 15 136 254
h217 607
Mining exploration and research expenses — 3 3 — — — — — — — 61 64 — — 64Environmental obligations and shutdown costs — — — — — — — — — — 19 19 — 1 20Net (gain) loss on sales of assets (576) — (576) — — — — — — — (67) (643) 1 (7) (649)Operating income (loss) 1,143 336 1,479 626 (8) 618 1,027 (96) 16 72 99 3,215 (5,711) (296) (2,792)
Interest expense, net 3 1 4 82 — 82 — — — 15 80 181 369 205 755Provision for (benefit from) income taxes — — — 222 (6) 216 442 — — — — 658 — (287) 371Capital expenditures 77 25 102 380 2 382 1,025 2 1 17 109
i1,638 1,127
j48 2,813
Year Ended December 31, 2015Revenues:
Unaffiliated customers $ 558 $ 351 $ 909 $ 1,065 $ 808 $ 1,873 $ 2,617b
$ — $ 4,125 $ 1,955 $ 1,133c
$ 12,612 $ 1,994d
$ 1 $ 14,607Intersegment 1,646 2,571 4,217 68 (7)
k61 36 348 29 15 (4,706) — — — —
Production and deliverye 1,523 2,276 3,799 815 623 1,438 1,808 312 4,129 1,848 (3,851) 9,483 1,211f
(1) 10,693Depreciation, depletion and amortization 217 343 560 219 133 352 293 97 9 39 72 1,422 1,804 14 3,240Impairment of oil and gas properties — — — — — — — — — — — — 12,980 164
g13,144
Metals inventory adjustments — 142 142 — 73 73 — 11 — — 112 338 — — 338Selling, general and administrative expenses 3 3 6 3 1 4 103 — — 16 20 149 188 221 558Mining exploration and research expenses — 7 7 — — — — — — — 100 107 — — 107Environmental obligations and shutdown costs — 3 3 — — — — — — — 74 77 — 1 78Net gain on sales of assets — (39) (39) — — — — — — — — (39) — — (39)Operating income (loss) 461 187 648 96 (29) 67 449 (72) 16 67 (100) 1,075 (14,189) (398) (13,512)
Interest expense, net 2 2 4 16 — 16 — — — 10 75 105 186 326 617Provision for (benefit from) income taxes — — — 13 (9) 4 195 — — — — 199 — (2,150) (1,951)Capital expenditures 253 102 355 1,674 48 1,722 901 13 4 23 277
i3,295 2,948
j110 6,353
a. Excludes the results of Tenke, which is reported as discontinued operations. Net (loss) income from discontinued operations totaled $(193) million in 2016 and $91 million in 2015. Refer to the supplemental schedules on pages XXX and XXXI for a summary of the components of net (loss) income from discontinued operations.
b. Includes PT-FI's sales to PT Smelting totaling $1.4 billion in 2016 and $1.1 billion in 2015.c. Includes revenues from FCX's molybdenum sales company, which includes sales of molybdenum produced by the Molybdenum mines and by certain of the North and South America copper mines.d. Includes net (losses) gains of $(35) million in 2016 and $87 million in 2015 associated with oil derivative contracts. The 2016 oil derivative contracts were entered into as part of the terms to sell the onshore California properties. e. The year 2016 includes charges of $16 million at Cerro Verde for social commitments and $17 million at Indonesia for asset retirement. The year 2015 includes asset impairments and restructuring charges totaling $145 million, including $99 million
at other North America copper mines, and restructuring charges totaling $13 million at other South America mines, $7 million at Molybdenum mines, $3 million at Rod & Refining, $20 million at Other Mining & Eliminations and $3 million at Corporate, Other & Eliminations.
f. Includes net charges totaling $1.0 billion in 2016 and $188 million in 2015, primarily for drillship settlements/idle rig and contract termination costs, inventory adjustments and other asset impairments and net charges, which are summarized in the supplemental schedule, "Adjusted Net Income (Loss)," on page X.
g. Reflects impairment charges for international oil and gas properties primarily in Morocco.h. Includes $85 million for net restructuring charges.i. Includes $73 million for 2016 and $229 million for 2015 associated with discontinued operations.j. Excludes international oil and gas expenditures totaling $47 million in 2016 and $100 million in 2015, primarily related to the Morocco oil and gas properties, which are included in Corporate, Other & Eliminations.k. Reflects net reductions for provisional pricing adjustments to prior year open sales.

XV
FREEPORT-McMoRan INC.PRODUCT REVENUES AND PRODUCTION COSTS
Mining Product Revenues and Unit Net Cash Costs. Unit net cash costs per pound of copper and molybdenum are measures intended to provide investors with information about the cash-generating capacity of FCX's mining operations expressed on a basis relating to the primary metal product for the respective operations. FCX uses this measure for the same purpose and for monitoring operating performance by its mining operations. This information differs from measures of performance determined in accordance with U.S. GAAP and should not be considered in isolation or as a substitute for measures of performance determined in accordance with U.S. GAAP. This measure is presented by other metals mining companies, although FCX's measures may not be comparable to similarly titled measures reported by other companies.
FCX presents gross profit per pound of copper in the following tables using both a “by-product” method and a “co-product” method. FCX uses the by-product method in its presentation of gross profit per pound of copper because (i) the majority of its revenues are copper revenues, (ii) it mines ore, which contains copper, gold, molybdenum and other metals, (iii) it is not possible to specifically assign all of FCX's costs to revenues from the copper, gold, molybdenum and other metals it produces, (iv) it is the method used to compare mining operations in certain industry publications and (v) it is the method used by FCX's management and Board to monitor mining operations. In the co-product method presentations, shared costs are allocated to the different products based on their relative revenue values, which will vary to the extent FCX's metals sales volumes and realized prices change.
FCX shows revenue adjustments for prior period open sales as a separate line item. Because these adjustments do not result from current period sales, these amounts have been reflected separately from revenues on current period sales. Noncash and other costs, which are removed from site production and delivery costs in the calculation of unit net cash costs, consist of items such as stock-based compensation costs, start-up costs, inventory adjustments, long-lived asset impairments, restructuring and/or unusual charges. As discussed above, gold, molybdenum and other metal revenues at copper mines are reflected as credits against site production and delivery costs in the by-product method. The following schedules are presentations under both the by-product and co-product methods together with reconciliations to amounts reported in FCX's consolidated financial statements.
U.S. Oil & Gas Product Revenues and Cash Production Costs per Unit. Realized revenues and cash production costs per unit are measures intended to provide investors with information about the cash operating margin of FCX's oil and gas operations. FCX uses this measure for the same purpose and for monitoring operating performance by its oil and gas operations. This information differs from measures of performance determined in accordance with U.S. GAAP and should not be considered in isolation or as a substitute for measures of performance determined in accordance with U.S. GAAP. FCX's measures may not be comparable to similarly titled measures reported by other companies.
Accretion, charges for asset retirement obligations and other costs, such as drillship settlements/idle rig and contract termination costs, inventory adjustments, asset impairments and/or unusual charges, are removed from production and delivery costs in the calculation of cash production costs per BOE. Additionally, during fourth-quarter 2016, FCX entered into oil and gas derivative contracts as part of the terms to sell the onshore California properties (these derivative contracts were assumed by the buyer at completion of the sale) and in 2015, FCX had crude oil derivative contracts. FCX shows adjustments from these derivative contracts as separate line items. Because these adjustments did not result from oil and gas sales, gains and losses have been reflected separately from revenues on current period sales. The following schedules include calculations of oil and gas product revenues and cash production costs together with a reconciliation to amounts reported in FCX's consolidated financial statements.

XVI
FREEPORT-McMoRan INC.PRODUCT REVENUES AND PRODUCTION COSTS (continued)
North America Copper Mines Product Revenues, Production Costs and Unit Net Cash Costs
Three Months Ended December 31, 2016(In millions) By-Product Co-Product Method
Method Copper Molybdenuma Otherb TotalRevenues, excluding adjustments $ 1,016 $ 1,016 $ 58 $ 18 $ 1,092Site production and delivery, before net noncash
and other costs shown below 605 570 45 12 627By-product credits (54) — — — —Treatment charges 45 44 — 1 45
Net cash costs 596 614 45 13 672Depreciation, depletion and amortization (DD&A) 123 116 5 2 123Metals inventory adjustments (5) (5) — — (5)Noncash and other costs, net 18 17 1 — 18
Total costs 732 742 51 15 808Revenue adjustments, primarily for pricing
on prior period open sales 6 6 — — 6Gross profit $ 290 $ 280 $ 7 $ 3 $ 290
Copper sales (millions of recoverable pounds) 415 415Molybdenum sales (millions of recoverable pounds)a 8
Gross profit per pound of copper/molybdenum:
Revenues, excluding adjustments $ 2.45 $ 2.45 $ 6.63Site production and delivery, before net noncash
and other costs shown below 1.46 1.37 5.14By-product credits (0.13) — —Treatment charges 0.11 0.11 —
Unit net cash costs 1.44 1.48 5.14DD&A 0.29 0.28 0.59Metals inventory adjustments (0.01) (0.01) —Noncash and other costs, net 0.04 0.04 0.06
Total unit costs 1.76 1.79 5.79Revenue adjustments, primarily for pricing
on prior period open sales 0.01 0.01 —Gross profit per pound $ 0.70 $ 0.67 $ 0.84
Reconciliation to Amounts Reported(In millions) Metals
Production InventoryRevenues and Delivery DD&A Adjustments
Totals presented above $ 1,092 $ 627 $ 123 $ (5)Treatment charges — 45 — —Noncash and other costs, net — 18 — —Revenue adjustments, primarily for pricing
on prior period open sales 6 — — —Eliminations and other (4) (5) — —North America copper mines 1,094 685 123 (5)Other mining & eliminationsc 2,902 1,763 294 14Total mining 3,996 2,448 417 9U.S. oil & gas operations 381 274 173 —Corporate, other & eliminations — 18 3 —As reported in FCX's consolidated financial statements $ 4,377 $ 2,740 $ 593 $ 9
a. Reflects sales of molybdenum produced by certain of the North America copper mines to FCX's molybdenum sales company at market-based pricing.
b. Includes gold and silver product revenues and production costs.c. Represents the combined total for all other mining operations and the related eliminations, as presented in the supplemental schedule
"Business Segments," beginning on page XII.
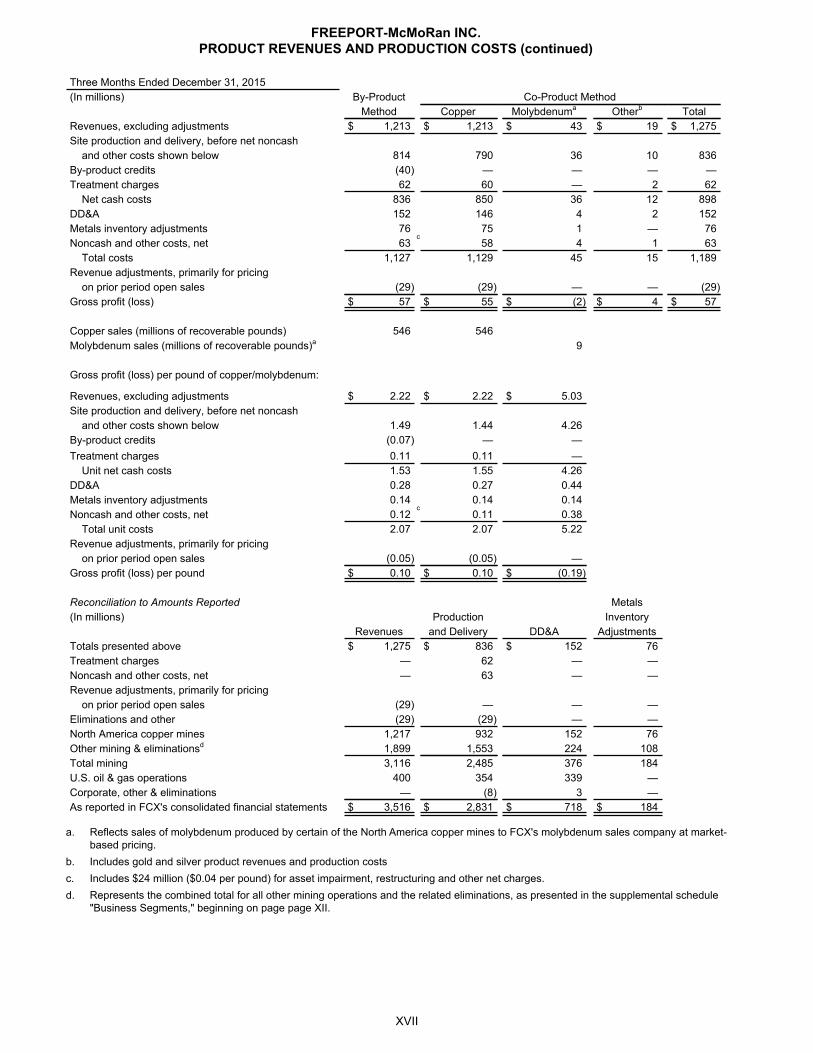
XVII
FREEPORT-McMoRan INC.PRODUCT REVENUES AND PRODUCTION COSTS (continued)
Three Months Ended December 31, 2015(In millions) By-Product Co-Product Method
Method Copper Molybdenuma Otherb TotalRevenues, excluding adjustments $ 1,213 $ 1,213 $ 43 $ 19 $ 1,275Site production and delivery, before net noncash
and other costs shown below 814 790 36 10 836By-product credits (40) — — — —Treatment charges 62 60 — 2 62
Net cash costs 836 850 36 12 898DD&A 152 146 4 2 152Metals inventory adjustments 76 75 1 — 76Noncash and other costs, net 63
c58 4 1 63
Total costs 1,127 1,129 45 15 1,189Revenue adjustments, primarily for pricing
on prior period open sales (29) (29) — — (29)Gross profit (loss) $ 57 $ 55 $ (2) $ 4 $ 57
Copper sales (millions of recoverable pounds) 546 546Molybdenum sales (millions of recoverable pounds)a 9
Gross profit (loss) per pound of copper/molybdenum:
Revenues, excluding adjustments $ 2.22 $ 2.22 $ 5.03Site production and delivery, before net noncash
and other costs shown below 1.49 1.44 4.26By-product credits (0.07) — —Treatment charges 0.11 0.11 —
Unit net cash costs 1.53 1.55 4.26DD&A 0.28 0.27 0.44Metals inventory adjustments 0.14 0.14 0.14Noncash and other costs, net 0.12
c0.11 0.38
Total unit costs 2.07 2.07 5.22Revenue adjustments, primarily for pricing
on prior period open sales (0.05) (0.05) —Gross profit (loss) per pound $ 0.10 $ 0.10 $ (0.19)
Reconciliation to Amounts Reported Metals(In millions) Production Inventory
Revenues and Delivery DD&A AdjustmentsTotals presented above $ 1,275 $ 836 $ 152 76Treatment charges — 62 — —Noncash and other costs, net — 63 — —Revenue adjustments, primarily for pricing
on prior period open sales (29) — — —Eliminations and other (29) (29) — —North America copper mines 1,217 932 152 76Other mining & eliminationsd 1,899 1,553 224 108Total mining 3,116 2,485 376 184U.S. oil & gas operations 400 354 339 —Corporate, other & eliminations — (8) 3 —As reported in FCX's consolidated financial statements $ 3,516 $ 2,831 $ 718 $ 184
a. Reflects sales of molybdenum produced by certain of the North America copper mines to FCX's molybdenum sales company at market-based pricing.
b. Includes gold and silver product revenues and production costsc. Includes $24 million ($0.04 per pound) for asset impairment, restructuring and other net charges.d. Represents the combined total for all other mining operations and the related eliminations, as presented in the supplemental schedule
"Business Segments," beginning on page page XII.

XVIII
FREEPORT-McMoRan INC.PRODUCT REVENUES AND PRODUCTION COSTS (continued)
Year Ended December 31, 2016(In millions) By-Product Co-Product Method
Method Copper Molybdenuma Otherb TotalRevenues, excluding adjustments $ 4,113 $ 4,113 $ 213 $ 94 $ 4,420Site production and delivery, before net noncash
and other costs shown below 2,613 2,474 166 58 2,698By-product credits (222) — — — —Treatment charges 193 185 — 8 193
Net cash costs 2,584 2,659 166 66 2,891DD&A 527 496 20 11 527Metals inventory adjustments 1 1 — — 1Noncash and other costs, net 87 84 2 1 87
Total costs 3,199 3,240 188 78 3,506Revenue adjustments, primarily for pricing
on prior period open sales (1) (1) — — (1)Gross profit $ 913 $ 872 $ 25 $ 16 $ 913
Copper sales (millions of recoverable pounds) 1,836 1,836Molybdenum sales (millions of recoverable pounds)a 33
Gross profit per pound of copper/molybdenum:
Revenues, excluding adjustments $ 2.24 $ 2.24 $ 6.34Site production and delivery, before net noncash
and other costs shown below 1.42 1.35 4.93By-product credits (0.12) — —Treatment charges 0.11 0.10 —
Unit net cash costs 1.41 1.45 4.93DD&A 0.29 0.27 0.60Metals inventory adjustments — — —Noncash and other costs, net 0.05 0.05 0.06
Total unit costs 1.75 1.77 5.59Revenue adjustments, primarily for pricing
on prior period open sales — — —Gross profit per pound $ 0.49 $ 0.47 $ 0.75
Reconciliation to Amounts Reported(In millions) Metals
Production InventoryRevenues and Delivery DD&A Adjustments
Totals presented above $ 4,420 $ 2,698 $ 527 $ 1Treatment charges — 193 — —Noncash and other costs, net — 87 — —Revenue adjustments, primarily for pricing
on prior period open sales (1) — — —Eliminations and other (45) (46) 3 —North America copper mines 4,374 2,932 530 1Other mining & eliminationsc 8,943 5,911 1,117 35Total mining 13,317 8,843 1,647 36U.S. oil & gas operations 1,513 1,801 869 —Corporate, other & eliminations — 53 14 —As reported in FCX's consolidated financial statements $ 14,830 $ 10,697 $ 2,530 $ 36
a. Reflects sales of molybdenum produced by certain of the North America copper mines to FCX's molybdenum sales company at market-based pricing.
b. Includes gold and silver product revenues and production costs.c. Represents the combined total for all other mining operations and the related eliminations, as presented in the supplemental schedule
"Business Segments" beginning on page XII.

XIX
FREEPORT-McMoRan INC.PRODUCT REVENUES AND PRODUCTION COSTS (continued)
Year Ended December 31, 2015(In millions) By-Product Co-Product Method
Method Copper Molybdenuma Otherb TotalRevenues, excluding adjustments $ 4,907 $ 4,907 $ 261 $ 102 $ 5,270Site production and delivery, before net noncash
and other costs shown below 3,339 3,161 209 71 3,441By-product credits (261) — — — —Treatment charges 240 233 — 7 240
Net cash costs 3,318 3,394 209 78 3,681DD&A 558 528 20 10 558Metals inventory adjustments 142 139 2 1 142Noncash and other costs, net 233
c225 6 2 233
Total costs 4,251 4,286 237 91 4,614Revenue adjustments, primarily for pricing
on prior period open sales (28) (28) — — (28)Gross profit $ 628 $ 593 $ 24 $ 11 $ 628
Copper sales (millions of recoverable pounds) 1,985 1,985Molybdenum sales (millions of recoverable pounds)a 37
Gross profit per pound of copper/molybdenum:
Revenues, excluding adjustments $ 2.47 $ 2.47 $ 7.02Site production and delivery, before net noncash
and other costs shown below 1.68 1.59 5.61By-product credits (0.13) — —Treatment charges 0.12 0.12 —
Unit net cash costs 1.67 1.71 5.61DD&A 0.28 0.27 0.53Metals inventory adjustments 0.07 0.07 0.07Noncash and other costs, net 0.12
c0.11 0.16
Total unit costs 2.14 2.16 6.37Revenue adjustments, primarily for pricing
on prior period open sales (0.01) (0.01) —Gross profit per pound $ 0.32 $ 0.30 $ 0.65
Reconciliation to Amounts Reported Metals(In millions) Production Inventory
Revenues and Delivery DD&A AdjustmentsTotals presented above $ 5,270 $ 3,441 $ 558 $ 142Treatment charges — 240 — —Noncash and other costs, net — 233 — —Revenue adjustments, primarily for pricing
on prior period open sales (28) — — —Eliminations and other (116) (115) 2 —North America copper mines 5,126 3,799 560 142Other mining & eliminationsd 7,486 5,684 862 196Total mining 12,612 9,483 1,422 338U.S. oil & gas operations 1,994 1,211 1,804 —Corporate, other & eliminations 1 (1) 14 —As reported in FCX's consolidated financial statements $ 14,607 $ 10,693 $ 3,240 $ 338
a. Reflects sales of molybdenum produced by certain of the North America copper mines to FCX's molybdenum sales company at market-based pricing.
b. Includes gold and silver product revenues and production costs.c. Includes $99 million ($0.05 per pound) for asset impairment, restructuring and other net charges.d. Represents the combined total for all other mining operations and the related eliminations, as presented in the supplemental schedule
"Business Segments" beginning on page XII.

XX
FREEPORT-McMoRan INC.PRODUCT REVENUES AND PRODUCTION COSTS (continued)
South America Mining Product Revenues, Production Costs and Unit Net Cash Costs
Three Months Ended December 31, 2016(In millions) By-Product Co-Product Method
Method Copper Othera TotalRevenues, excluding adjustments $ 898 $ 898 $ 47 $ 945Site production and delivery, before net noncash
and other costs shown below 485 463 33 496By-product credits (36) — — —Treatment charges 90 90 — 90Royalty on metals 2 2 — 2
Net cash costs 541 555 33 588DD&A 151 144 7 151Noncash and other costs, net 23 22 1 23
Total costs 715 721 41 762Revenue adjustments, primarily for pricing
on prior period open sales 67 67 — 67Gross profit $ 250 $ 244 $ 6 $ 250
Copper sales (millions of recoverable pounds) 359 359
Gross profit per pound of copper:
Revenues, excluding adjustments $ 2.50 $ 2.50Site production and delivery, before net noncash
and other costs shown below 1.35 1.29By-product credits (0.10) —Treatment charges 0.25 0.25Royalty on metals 0.01 0.01
Unit net cash costs 1.51 1.55DD&A 0.42 0.40Noncash and other costs, net 0.07 0.06
Total unit costs 2.00 2.01Revenue adjustments, primarily for pricing
on prior period open sales 0.19 0.19Gross profit per pound $ 0.69 $ 0.68
Reconciliation to Amounts Reported(In millions)
ProductionRevenues and Delivery DD&A
Totals presented above $ 945 $ 496 $ 151Treatment charges (90) — —Royalty on metals (2) — —Noncash and other costs, net — 23 —Revenue adjustments, primarily for pricing
on prior period open sales 67 — —Eliminations and other (1) (1) —South America mining 919 518 151Other mining & eliminationsb 3,077 1,930 266Total mining 3,996 2,448 417U.S. oil & gas operations 381 274 173Corporate, other & eliminations — 18 3As reported in FCX's consolidated financial statements $ 4,377 $ 2,740 $ 593
a. Includes silver sales of 981 thousand ounces ($18.23 per ounce average realized price). Also reflects sales of molybdenum produced by Cerro Verde to FCX's molybdenum sales company at market-based pricing.
b. Represents the combined total for all other mining operations and the related eliminations, as presented in the supplemental schedule, "Business Segments" beginning on page XII.

XXI
Three Months Ended December 31, 2015(In millions) By-Product Co-Product Method
Method Copper Othera TotalRevenues, excluding adjustments $ 618 $ 618 $ 17 $ 635Site production and delivery, before net noncash
and other costs shown below 410 401 14 415By-product credits (12) — — —Treatment charges 61 61 — 61Royalty on metals 1 1 — 1
Net cash costs 460 463 14 477DD&A 116 113 3 116Metals inventory adjustments 73 73 — 73Noncash and other costs, net 20 20 — 20
Total costs 669 669 17 686Revenue adjustments, primarily for pricing
on prior period open sales (15) (15) — (15)Gross loss $ (66) $ (66) $ — $ (66)
Copper sales (millions of recoverable pounds) 286 286
Gross loss per pound of copper:
Revenues, excluding adjustments $ 2.16 $ 2.16Site production and delivery, before net noncash
and other costs shown below 1.43 1.40By-product credits (0.04) —Treatment charges 0.21 0.21Royalty on metals 0.01 0.01
Unit net cash costs 1.61 1.62DD&A 0.40 0.39Metals inventory adjustments 0.26 0.26Noncash and other costs, net 0.07 0.07
Total unit costs 2.34 2.34Revenue adjustments, primarily for pricing
on prior period open sales (0.05) (0.05)Gross loss per pound $ (0.23) $ (0.23)
Reconciliation to Amounts Reported Metals(In millions) Production Inventory
Revenues and Delivery DD&A AdjustmentsTotals presented above $ 635 $ 415 $ 116 $ 73Treatment charges (61) — — —Royalty on metals (1) — — —Noncash and other costs, net — 20 — —Revenue adjustments, primarily for pricing
on prior period open sales (15) — — —Eliminations and other (1) (1) — —South America mining 557 434 116 73Other mining & eliminationsb 2,559 2,051 260 111Total mining 3,116 2,485 376 184U.S. oil & gas operations 400 354 339 —Corporate, other & eliminations — (8) 3 —As reported in FCX's consolidated financial statements $ 3,516 $ 2,831 $ 718 $ 184
a. Includes silver sales of 784 thousand ounces ($14.32 per ounce average realized price). Also reflects sales of molybdenum produced by Cerro Verde to FCX's molybdenum sales company at market-based pricing.
b. Represents the combined total for all other mining operations and the related eliminations, as presented in the supplemental schedule, "Business Segments" beginning on page XII.

XXII
FREEPORT-McMoRan INC.PRODUCT REVENUES AND PRODUCTION COSTS (continued)
Year Ended December 31, 2016(In millions) By-Product Co-Product Method
Method Copper Othera TotalRevenues, excluding adjustments $ 3,077 $ 3,077 $ 176 $ 3,253Site production and delivery, before net noncash
and other costs shown below 1,681 1,601 120 1,721By-product credits (136) — — —Treatment charges 320 320 — 320Royalty on metals 7 6 1 7
Net cash costs 1,872 1,927 121 2,048DD&A 552 523 29 552Noncash and other costs, net 40 38 2 40
Total costs 2,464 2,488 152 2,640Revenue adjustments, primarily for pricing
on prior period open sales 11 11 — 11Gross profit $ 624 $ 600 $ 24 $ 624
Copper sales (millions of recoverable pounds) 1,332 1,332
Gross profit per pound of copper:
Revenues, excluding adjustments $ 2.31 $ 2.31Site production and delivery, before net noncash
and other costs shown below 1.26 1.20By-product credits (0.10) —Treatment charges 0.24 0.24Royalty on metals 0.01 —
Unit net cash costs 1.41 1.44DD&A 0.41 0.39Noncash and other costs, net 0.03 0.03
Total unit costs 1.85 1.86Revenue adjustments, primarily for pricing
on prior period open sales 0.01 0.01Gross profit per pound $ 0.47 $ 0.46
Reconciliation to Amounts Reported(In millions)
ProductionRevenues and Delivery DD&A
Totals presented above $ 3,253 $ 1,721 $ 552Treatment charges (320) — —Royalty on metals (7) — —Noncash and other costs, net — 40 —Revenue adjustments, primarily for pricing
on prior period open sales 11 — —Eliminations and other 1 (3) 1South America mining 2,938 1,758 553Other mining & eliminationsb 10,379 7,085 1,094Total mining 13,317 8,843 1,647U.S. oil & gas operations 1,513 1,801 869Corporate, other & eliminations — 53 14As reported in FCX's consolidated financial statements $ 14,830 $ 10,697 $ 2,530
a. Includes silver sales of 3.7 million ounces ($18.05 per ounce average realized price). Also reflects sales of molybdenum produced by Cerro Verde to FCX's molybdenum sales company at market-based pricing.
b. Represents the combined total for all other mining operations and the related eliminations, as presented in the supplemental schedule, "Business Segments" beginning on page XII.

XXIII
FREEPORT-McMoRan INC.PRODUCT REVENUES AND PRODUCTION COSTS (continued)
Year Ended December 31, 2015(In millions) By-Product Co-Product Method
Method Copper Othera TotalRevenues, excluding adjustments $ 2,075 $ 2,075 $ 65 $ 2,140Site production and delivery, before net noncash
and other costs shown below 1,393 1,355 59 1,414By-product credits (44) — — —Treatment charges 161 161 — 161Royalty on metals 4 4 — 4
Net cash costs 1,514 1,520 59 1,579DD&A 352 341 11 352Metals inventory adjustments 73 73 — 73Noncash and other costs, net 41 41 — 41
Total costs 1,980 1,975 70 2,045Revenue adjustments, primarily for pricing
on prior period open sales (28) (28) — (28)Gross profit (loss) $ 67 $ 72 $ (5) $ 67
Copper sales (millions of recoverable pounds) 871 871
Gross profit per pound of copper:
Revenues, excluding adjustments $ 2.38 $ 2.38Site production and delivery, before net noncash
and other costs shown below 1.60 1.56By-product credits (0.05) —Treatment charges 0.19 0.19Royalty on metals — —
Unit net cash costs 1.74 1.75DD&A 0.40 0.39Metals inventory adjustments 0.08 0.08Noncash and other costs, net 0.05 0.05
Total unit costs 2.27 2.27Revenue adjustments, primarily for pricing
on prior period open sales (0.03) (0.03)Gross profit per pound $ 0.08 $ 0.08
Reconciliation to Amounts Reported Metals(In millions) Production Inventory
Revenues and Delivery DD&A AdjustmentsTotals presented above $ 2,140 $ 1,414 $ 352 $ 73Treatment charges (161) — — —Royalty on metals (4) — — —Noncash and other costs, net — 41 — —Revenue adjustments, primarily for pricing
on prior period open sales (28) — — —Eliminations and other (13) (17) — —South America mining 1,934 1,438 352 73Other mining & eliminationsb 10,678 8,045 1,070 265Total mining 12,612 9,483 1,422 338U.S. oil & gas operations 1,994 1,211 1,804 —Corporate, other & eliminations 1 (1) 14 —As reported in FCX's consolidated financial statements $ 14,607 $ 10,693 $ 3,240 $ 338
a. Includes silver sales of 2.0 million ounces ($14.48 per ounce average realized price). Also reflects sales of molybdenum produced by Cerro Verde to FCX's molybdenum sales company at market-based pricing.
b. Represents the combined total for all other mining operations and the related eliminations, as presented in the supplemental schedule, "Business Segments" beginning on page XII.

XXIV
FREEPORT-McMoRan INC.PRODUCT REVENUES AND PRODUCTION COSTS (continued)
Indonesia Mining Product Revenues, Production Costs and Unit Net Cash CostsThree Months Ended December 31, 2016(In millions) By-Product Co-Product Method
Method Copper Gold Silvera TotalRevenues, excluding adjustments $ 874 $ 874 $ 470 $ 15 $ 1,359Site production and delivery, before net noncash
and other costs shown below 527 339 182 6 527Gold and silver credits (473) — — — —Treatment charges 95 61 33 1 95Export duties 32 21 11 — 32Royalty on metals 47 28 18 1 47
Net cash costs 228 449 244 8 701DD&A 100 64 35 1 100Noncash and other costs, net 20 13 7 — 20
Total costs 348 526 286 9 821Revenue adjustments, primarily for pricing on
prior period open sales 49 49 (11) (1) 37PT Smelting intercompany loss (19) (13) (6) — (19)Gross profit $ 556 $ 384 $ 167 $ 5 $ 556
Copper sales (millions of recoverable pounds) 352 352Gold sales (thousands of recoverable ounces) 401
Gross profit per pound of copper/per ounce of gold:
Revenues, excluding adjustments $ 2.48 $ 2.48 $ 1,174Site production and delivery, before net noncash
and other costs shown below 1.50 0.96 455Gold and silver credits (1.34) — —Treatment charges 0.27 0.17 82Export duties 0.09 0.06 28Royalty on metals 0.13 0.09 46
Unit net cash costs 0.65 1.28 611DD&A 0.29 0.18 87Noncash and other costs, net 0.06 0.04 17
Total unit costs 1.00 1.50 715Revenue adjustments, primarily for pricing on
prior period open sales 0.14 0.14 (26)PT Smelting intercompany loss (0.05) (0.03) (16)Gross profit per pound/ounce $ 1.57 $ 1.09 $ 417
Reconciliation to Amounts Reported(In millions) Production
Revenues and Delivery DD&ATotals presented above $ 1,359 $ 527 $ 100Treatment charges (95) — —Export duties (32) — —Royalty on metals (47) — —Noncash and other costs, net — 20 —Revenue adjustments, primarily for pricing on
prior period open sales 37 — —PT Smelting intercompany loss — 19 —Indonesia mining 1,222 566 100Other mining & eliminationsb 2,774 1,882 317Total mining 3,996 2,448 417U.S. oil & gas operations 381 274 173Corporate, other & eliminations — 18 3As reported in FCX's consolidated financial statements $ 4,377 $ 2,740 $ 593
a. Includes silver sales of 907 thousand ounces ($16.24 per ounce average realized price).b. Represents the combined total for all other mining operations and the related eliminations, as presented in the supplemental schedule,
"Business Segments" beginning on page XII.

XXV
FREEPORT-McMoRan INC.PRODUCT REVENUES AND PRODUCTION COSTS (continued)
Three Months Ended December 31, 2015(In millions) By-Product Co-Product Method
Method Copper Gold Silvera TotalRevenues, excluding adjustments $ 418 $ 418 $ 354 $ 8 $ 780Site production and delivery, before net noncash
and other costs shown below 470 252 213 5 470Gold and silver credits (365) — — — —Treatment charges 61 33 28 — 61Export duties 17 9 8 — 17Royalty on metals 29 15 13 1 29
Net cash costs 212 309 262 6 577DD&A 55 29 25 1 55Noncash and other costs, net 18 10 8 — 18
Total costs 285 348 295 7 650Revenue adjustments, primarily for pricing on
prior period open sales (29) (29) 3 — (26)PT Smelting intercompany loss (9) (5) (4) — (9)Gross profit $ 95 $ 36 $ 58 $ 1 $ 95
Copper sales (millions of recoverable pounds) 195 195Gold sales (thousands of recoverable ounces) 333
Gross profit per pound of copper/per ounce of gold:
Revenues, excluding adjustments $ 2.14 $ 2.14 $ 1,066Site production and delivery, before net noncash
and other costs shown below 2.40 1.29 642Gold and silver credits (1.87) — —Treatment charges 0.31 0.16 84Export duties 0.10 0.05 23Royalty on metals 0.15 0.08 40
Unit net cash costs 1.09 1.58 789DD&A 0.28 0.15 75Noncash and other costs, net 0.09 0.05 25
Total unit costs 1.46 1.78 889Revenue adjustments, primarily for pricing on
prior period open sales (0.15) (0.15) 9PT Smelting intercompany loss (0.04) (0.03) (12)Gross profit per pound/ounce $ 0.49 $ 0.18 $ 174
Reconciliation to Amounts Reported(In millions) Production
Revenues and Delivery DD&ATotals presented above $ 780 $ 470 $ 55Treatment charges (61) — —Export duties (17) — —Royalty on metals (29) — —Noncash and other costs, net — 18 —Revenue adjustments, primarily for pricing on
prior period open sales (26) — —PT Smelting intercompany loss — 9 —Indonesia mining 647 497 55Other mining & eliminationsb 2,469 1,988 321Total mining 3,116 2,485 376U.S. oil & gas operations 400 354 339Corporate, other & eliminations — (8) 3As reported in FCX's consolidated financial statements $ 3,516 $ 2,831 $ 718
a. Includes silver sales of 567 thousand ounces ($13.66 per ounce average realized price).b. Represents the combined total for all other mining operations and the related eliminations, as presented in the supplemental schedule,
"Business Segments" beginning on page XII.

XXVI
FREEPORT-McMoRan INC.PRODUCT REVENUES AND PRODUCTION COSTS (continued)
Year Ended December 31, 2016
(In millions) By-Product Co-Product MethodMethod Copper Gold Silvera Total
Revenues, excluding adjustments $ 2,448 $ 2,448 $ 1,304 $ 50 $ 3,802Site production and delivery, before net noncash
and other costs shown below 1,717 1,106 589 22 1,717Gold and silver credits (1,371) — — — —Treatment charges 297 191 102 4 297Export duties 95 61 33 1 95Royalty on metals 131 79 50 2 131
Net cash costs 869 1,437 774 29 2,240DD&A 384 247 132 5 384Noncash and other costs, net 51 33 17 1 51
Total costs 1,304 1,717 923 35 2,675Revenue adjustments, primarily for pricing on
prior period open sales (1) (1) 17 — 16PT Smelting intercompany loss (26) (17) (9) — (26)Gross profit $ 1,117 $ 713 $ 389 $ 15 $ 1,117
Copper sales (millions of recoverable pounds) 1,054 1,054Gold sales (thousands of recoverable ounces) 1,054
Gross profit per pound of copper/per ounce of gold:
Revenues, excluding adjustments $ 2.32 $ 2.32 $ 1,237Site production and delivery, before net noncash
and other costs shown below 1.63 1.05 559Gold and silver credits (1.30) — —Treatment charges 0.28 0.18 97Export duties 0.09 0.06 31Royalty on metals 0.13 0.07 47
Unit net cash costs 0.83 1.36 734DD&A 0.36 0.24 125Noncash and other costs, net 0.05 0.03 17
Total unit costs 1.24 1.63 876Revenue adjustments, primarily for pricing on
prior period open sales — — 16PT Smelting intercompany loss (0.02) (0.02) (8)Gross profit per pound/ounce $ 1.06 $ 0.67 $ 369
Reconciliation to Amounts Reported(In millions) Production
Revenues and Delivery DD&ATotals presented above $ 3,802 $ 1,717 $ 384Treatment charges (297) — —Export duties (95) — —Royalty on metals (131) — —Noncash and other costs, net — 51 —Revenue adjustments, primarily for pricing on
prior period open sales 16 — —PT Smelting intercompany loss — 26 —Indonesia mining 3,295 1,794 384Other mining & eliminationsb 10,022 7,049 1,263Total mining 13,317 8,843 1,647U.S. oil & gas operations 1,513 1,801 869Corporate, other & eliminations — 53 14As reported in FCX's consolidated financial statements $ 14,830 $ 10,697 $ 2,530
a. Includes silver sales of 2.9 million ounces ($17.09 per ounce average realized price).b. Represents the combined total for all other mining operations and the related eliminations, as presented in the supplemental schedule,
"Business Segments" beginning on page XII.

XXVII
FREEPORT-McMoRan INC.PRODUCT REVENUES AND PRODUCTION COSTS (continued)
Year Ended December 31, 2015(In millions) By-Product Co-Product Method
Method Copper Gold Silvera TotalRevenues, excluding adjustments $ 1,735 $ 1,735 $ 1,382 $ 31 $ 3,148Site production and delivery, before net noncash
and other costs shown below 1,780 981 781 18 1,780Gold and silver credits (1,422) — — — —Treatment charges 231 127 101 3 231Export duties 109 60 48 1 109Royalty on metals 114 63 50 1 114
Net cash costs 812 1,231 980 23 2,234DD&A 293 161 129 3 293Noncash and other costs, net 38 21 17 — 38
Total costs 1,143 1,413 1,126 26 2,565Revenue adjustments, primarily for pricing on
prior period open sales (50) (50) 8 1 (41)PT Smelting intercompany profit 10 5 5 — 10Gross profit $ 552 $ 277 $ 269 $ 6 $ 552
Copper sales (millions of recoverable pounds) 744 744Gold sales (thousands of recoverable ounces) 1,224
Gross profit per pound of copper/per ounce of gold:
Revenues, excluding adjustments $ 2.33 $ 2.33 $ 1,129Site production and delivery, before net noncash
and other costs shown below 2.39 1.32 638Gold and silver credits (1.91) — —Treatment charges 0.31 0.17 83Export duties 0.15 0.08 39Royalty on metals 0.15 0.09 41
Unit net cash costs 1.09 1.66 801DD&A 0.39 0.22 105Noncash and other costs, net 0.05 0.03 14
Total unit costs 1.53 1.91 920Revenue adjustments, primarily for pricing on
prior period open sales (0.07) (0.06) 7PT Smelting intercompany profit 0.01 0.01 4Gross profit per pound/ounce $ 0.74 $ 0.37 $ 220
Reconciliation to Amounts Reported(In millions) Production
Revenues and Delivery DD&ATotals presented above $ 3,148 $ 1,780 $ 293Treatment charges (231) — —Export duties (109) — —Royalty on metals (114) — —Noncash and other costs, net — 38 —Revenue adjustments, primarily for pricing on
prior period open sales (41) — —PT Smelting intercompany profit — (10) —Indonesia mining 2,653 1,808 293Other mining & eliminationsb 9,959 7,675 1,129Total mining 12,612 9,483 1,422U.S. oil & gas operations 1,994 1,211 1,804Corporate, other & eliminations 1 (1) 14As reported in FCX's consolidated financial statements $ 14,607 $ 10,693 $ 3,240
a. Includes silver sales of 2.1 million ounces ($14.81 per ounce average realized price).b. Represents the combined total for all other mining operations and the related eliminations, as presented in the supplemental schedule,
"Business Segments" beginning on page XII.

XXVIII
FREEPORT-McMoRan INC.PRODUCT REVENUES AND PRODUCTION COSTS (continued)
Africa Mining Product Revenues, Production Costs and Unit Net Cash CostsPeriod from October 1, 2016, through November 16, 2016(In millions) By-Product Co-Product Method
Method Copper Cobalt TotalRevenues, excluding adjustmentsa $ 136 $ 136 $ 34 $ 170Site production and delivery, before net noncash
and other costs shown below 84 75 23 98Cobalt creditsb (24) — — —Royalty on metals 3 2 1 3
Net cash costs 63 77 24 101DD&A 29 24 5 29Noncash and other credits, net (2) (2) — (2)
Total costs 90 99 29 128Revenue adjustments, primarily for pricing
on prior period open sales — — 4 4Gross profit $ 46 $ 37 $ 9 $ 46
Copper sales (millions of recoverable pounds) 59 59Cobalt sales (millions of contained pounds) 4
Gross profit per pound of copper and cobalt:
Revenues, excluding adjustmentsa $ 2.31 $ 2.31 $ 8.66Site production and delivery, before net noncash
and other costs shown below 1.42 1.26 5.84Cobalt creditsb (0.41) — —Royalty on metals 0.05 0.04 0.15
Unit net cash costs 1.06 1.30 5.99DD&A 0.50 0.41 1.23Noncash and other credits, net (0.03) (0.03) (0.07)
Total unit costs 1.53 1.68 7.15Revenue adjustments, primarily for pricing
on prior period open sales 0.01 0.01 0.90Gross profit per pound $ 0.79 $ 0.64 $ 2.41
Reconciliation to Amounts Reported(In millions) Production
Revenues and Delivery DD&ATotals presented above $ 170 $ 98 $ 29Royalty on metals (3) — —Noncash and other credits, net — (2) —Revenue adjustments, primarily for pricing
on prior period open sales 4 — —Eliminations and other adjustmentsc (31) 7 (29)Totald 140 103 —
a. Includes point-of-sale transportation costs as negotiated in customer contracts.b. Net of cobalt downstream processing and freight costs.c. Reflects adjustments associated with reporting Tenke as discontinued operations, including the elimination of intercompany sales to FCX's
consolidated subsidiaries and the impact of discontinuing DD&A.d. Represents amounts included in net (loss) income from discontinued operations, as reported in FCX's consolidated financial statements (in
millions):
Revenues $ 140Less:
Production and delivery costs 103DD&A —Loss on sale 16Allocated interest expense 6Provision for income taxes 17Other income, net —
Net loss from discontinued operations $ (2)
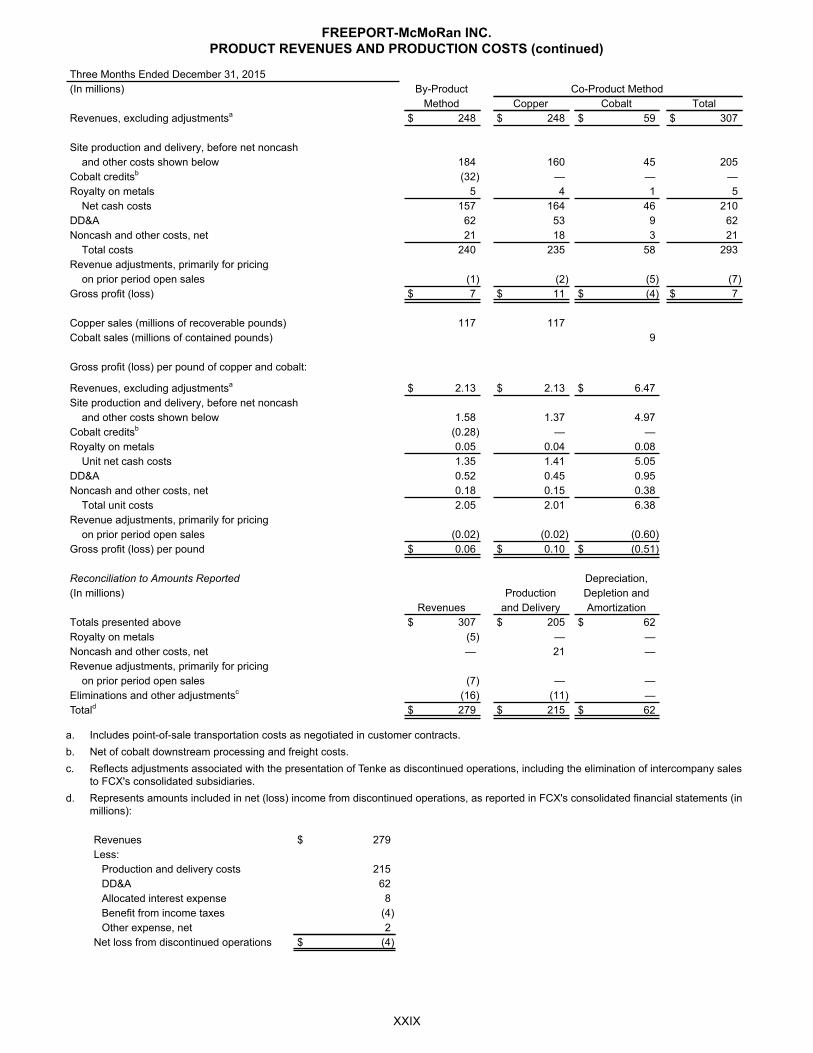
XXIX
FREEPORT-McMoRan INC.PRODUCT REVENUES AND PRODUCTION COSTS (continued)
Three Months Ended December 31, 2015(In millions) By-Product Co-Product Method
Method Copper Cobalt TotalRevenues, excluding adjustmentsa $ 248 $ 248 $ 59 $ 307
Site production and delivery, before net noncashand other costs shown below 184 160 45 205
Cobalt creditsb (32) — — —Royalty on metals 5 4 1 5
Net cash costs 157 164 46 210DD&A 62 53 9 62Noncash and other costs, net 21 18 3 21
Total costs 240 235 58 293Revenue adjustments, primarily for pricing
on prior period open sales (1) (2) (5) (7)Gross profit (loss) $ 7 $ 11 $ (4) $ 7
Copper sales (millions of recoverable pounds) 117 117Cobalt sales (millions of contained pounds) 9
Gross profit (loss) per pound of copper and cobalt:
Revenues, excluding adjustmentsa $ 2.13 $ 2.13 $ 6.47Site production and delivery, before net noncash
and other costs shown below 1.58 1.37 4.97Cobalt creditsb (0.28) — —Royalty on metals 0.05 0.04 0.08
Unit net cash costs 1.35 1.41 5.05DD&A 0.52 0.45 0.95Noncash and other costs, net 0.18 0.15 0.38
Total unit costs 2.05 2.01 6.38Revenue adjustments, primarily for pricing
on prior period open sales (0.02) (0.02) (0.60)Gross profit (loss) per pound $ 0.06 $ 0.10 $ (0.51)
Reconciliation to Amounts Reported Depreciation,(In millions) Production Depletion and
Revenues and Delivery AmortizationTotals presented above $ 307 $ 205 $ 62Royalty on metals (5) — —Noncash and other costs, net — 21 —Revenue adjustments, primarily for pricing
on prior period open sales (7) — —Eliminations and other adjustmentsc (16) (11) —Totald $ 279 $ 215 $ 62
a. Includes point-of-sale transportation costs as negotiated in customer contracts.b. Net of cobalt downstream processing and freight costs.c. Reflects adjustments associated with the presentation of Tenke as discontinued operations, including the elimination of intercompany sales
to FCX's consolidated subsidiaries.d. Represents amounts included in net (loss) income from discontinued operations, as reported in FCX's consolidated financial statements (in
millions):
Revenues $ 279Less:
Production and delivery costs 215DD&A 62Allocated interest expense 8Benefit from income taxes (4)Other expense, net 2
Net loss from discontinued operations $ (4)

XXX
FREEPORT-McMoRan INC.PRODUCT REVENUES AND PRODUCTION COSTS (continued)
Period from January 1, 2016, through November 16, 2016(In millions) By-Product Co-Product Method
Method Copper Cobalt TotalRevenues, excluding adjustmentsa $ 893 $ 893 $ 243 $ 1,136Site production and delivery, before net noncash
and other costs shown below 673 583 172 755Cobalt creditsb (165) — — —Royalty on metals 20 16 4 20
Net cash costs 528 599 176 775DD&A 210 172 38 210Noncash and other costs, net 21 17 4 21
Total costs 759 788 218 1,006Revenue adjustments, primarily for pricing
on prior period open sales (4) (4) 4 —Gross profit $ 130 $ 101 $ 29 $ 130
Copper sales (millions of recoverable pounds) 424 424Cobalt sales (millions of contained pounds) 33
Gross profit per pound of copper and cobalt:
Revenues, excluding adjustmentsa $ 2.10 $ 2.10 $ 7.45Site production and delivery, before net noncash
and other costs shown below 1.58 1.37 5.25Cobalt creditsb (0.39) — —Royalty on metals 0.05 0.04 0.12
Unit net cash costs 1.24 1.41 5.37DD&A 0.50 0.41 1.16Noncash and other costs, net 0.05 0.04 0.12
Total unit costs 1.79 1.86 6.65Revenue adjustments, primarily for pricing
on prior period open sales (0.01) (0.01) 0.12Gross profit per pound $ 0.30 $ 0.23 $ 0.92
Reconciliation to Amounts Reported(In millions) Production
Revenues and Delivery DD&ATotals presented above $ 1,136 $ 755 $ 210Royalty on metals (20) — —Noncash and other costs, net — 21 —Revenue adjustments, primarily for pricing
on prior period open sales — — —Eliminations and other adjustmentsc (157) 57 (130)Totald $ 959 $ 833 $ 80
a. Includes point-of-sale transportation costs as negotiated in customer contracts.b. Net of cobalt downstream processing and freight costs.c. Reflects adjustments associated with the presentation of Tenke as discontinued operations, including the elimination of intercompany sales
to FCX's consolidated subsidiaries and the impact of discontinuing DD&A.d. Represents amounts included in net (loss) income from discontinued operations, as reported in FCX's consolidated financial statements (in
millions):
Revenues $ 959Less:
Production and delivery costs 833DD&A 80Loss on sale 198Allocated interest expense 39Benefit from income taxes (8)Other expense, net 10
Net loss from discontinued operations $ (193)

XXXI
FREEPORT-McMoRan INC.PRODUCT REVENUES AND PRODUCTION COSTS (continued)
Year Ended December 31, 2015(In millions) By-Product Co-Product Method
Method Copper Cobalt TotalRevenues, excluding adjustmentsa $ 1,129 $ 1,129 $ 287 $ 1,416Site production and delivery, before net noncash
and other costs shown below 738 639 189 828Cobalt creditsb (196) — — —Royalty on metals 25 20 5 25
Net cash costs 567 659 194 853DD&A 257 213 44 257Noncash and other costs, net 32 27 5 32
Total costs 856 899 243 1,142Revenue adjustments, primarily for pricing
on prior period open sales (6) (6) (1) (7)Gross profit $ 267 $ 224 $ 43 $ 267
Copper sales (millions of recoverable pounds) 467 467Cobalt sales (millions of contained pounds) 35
Gross profit per pound of copper and cobalt:
Revenues, excluding adjustmentsa $ 2.42 $ 2.42 $ 8.21Site production and delivery, before net noncash
and other costs shown below 1.58 1.37 5.40Cobalt creditsb (0.42) — —Royalty on metals 0.05 0.04 0.14
Unit net cash costs 1.21 1.41 5.54DD&A 0.55 0.46 1.26Noncash and other costs, net 0.07 0.06 0.16
Total unit costs 1.83 1.93 6.96Revenue adjustments, primarily for pricing
on prior period open sales (0.01) (0.01) (0.02)Gross profit per pound $ 0.58 $ 0.48 $ 1.23
Reconciliation to Amounts Reported(In millions) Production
Revenues and Delivery DD&ATotals presented above $ 1,416 $ 828 $ 257Royalty on metals (25) — —Noncash and other costs, net — 32 —Revenue adjustments, primarily for pricing
on prior period open sales (7) — —Eliminations and other adjustmentsc (114) (8) —Totald $ 1,270 $ 852 $ 257
a. Includes point-of-sale transportation costs as negotiated in customer contracts.b. Net of cobalt downstream processing and freight costs.c. Reflects adjustments associated with the presentation of Tenke as discontinued operations, including the elimination of intercompany sales
to FCX's consolidated subsidiaries.d. Represents amounts included in net (loss) income from discontinued operations, as reported in FCX's consolidated financial statements (in
millions):
Revenues $ 1,270Less:
Production and delivery costs 852DD&A 257Allocated interest expense 28Provision from income taxes 16Other expense, net 26
Net income from discontinued operations $ 91

XXXII
FREEPORT-McMoRan INC.PRODUCT REVENUES AND PRODUCTION COSTS (continued)
Molybdenum Mines Product Revenues, Production Costs and Unit Net Cash CostsThree Months Ended December 31,
(In millions) 2016 2015
Revenues, excluding adjustmentsa $ 55 $ 58Site production and delivery, before net noncash
and other costs shown below 49 59Treatment charges and other 5 8
Net cash costs 54 67DD&A 17 20Metals inventory adjustments 3 5Noncash and other costs, net 3 6
b
Total costs 77 98Gross loss $ (22) $ (40)
Molybdenum sales (millions of recoverable pounds)a 7 9
Loss per pound of molybdenum:
Revenues, excluding adjustmentsa $ 8.25 $ 6.26Site production and delivery, before net noncash
and other costs shown below 7.41 6.31Treatment charges and other 0.85 0.84
Unit net cash costs 8.26 7.15DD&A 2.51 2.20Metals inventory adjustments 0.45 0.48Noncash and other costs, net 0.35 0.65
b
Total unit costs 11.57 10.48Gross loss per pound $ (3.32) $ (4.22)
Reconciliation to Amounts Reported(In millions)
MetalsProduction Inventory
Three Months Ended December 31, 2016 Revenues and Delivery DD&A AdjustmentsTotals presented above $ 55 $ 49 $ 17 $ 3Treatment charges and other (5) — — —Noncash and other costs, net — 3 — —Molybdenum mines 50 52 17 3Other mining & eliminationsc 3,946 2,396 400 6Total mining 3,996 2,448 417 9U.S. oil & gas operations 381 274 173 —Corporate, other & eliminations — 18 3 —As reported in FCX's consolidated financial statements $ 4,377 $ 2,740 $ 593 $ 9
Three Months Ended December 31, 2015Totals presented above $ 58 $ 59 $ 20 $ 5Treatment charges and other (8) — — —Noncash and other costs, net — 6 — —Molybdenum mines 50 65 20 5Other mining & eliminationsc 3,066 2,420 356 179Total mining 3,116 2,485 376 184U.S. oil & gas operations 400 354 339 —Corporate, other & eliminations — (8) 3 —As reported in FCX's consolidated financial statements $ 3,516 $ 2,831 $ 718 $ 184
a. Reflects sales of the Molybdenum mines' production to FCX's molybdenum sales company at market-based pricing. On a consolidated basis, realizations are based on the actual contract terms for sales to third parties; as a result, FCX's consolidated average realized price per pound of molybdenum will differ from the amounts reported in this table.
b. Includes restructuring charges of $5 million ($0.56 per pound).c. Represents the combined total for all other mining operations and the related eliminations, as presented in the supplementary schedule,
“Business Segments” beginning on page XII. Also includes amounts associated with FCX's molybdenum sales company, which includes sales of molybdenum produced by the Molybdenum mines and by certain of the North and South America copper mines.

XXXIII
FREEPORT-McMoRan INC.PRODUCT REVENUES AND PRODUCTION COSTS (continued)
Years Ended December 31,(In millions) 2016 2015
Revenues, excluding adjustmentsa $ 208 $ 388Site production and delivery, before net noncash
and other costs shown below 195 299Treatment charges and other 22 40
Net cash costs 217 339DD&A 68 97Metals inventory adjustments 15 11Noncash and other costs, net 4 13
b
Total costs 304 460Gross loss $ (96) $ (72)
Molybdenum sales (millions of recoverable pounds)a 26 48
Gross loss per pound of molybdenum:
Revenues, excluding adjustmentsa $ 8.02 $ 8.14Site production and delivery, before net noncash
and other costs shown below 7.50 6.27Treatment charges and other 0.86 0.84
Unit net cash costs 8.36 7.11DD&A 2.62 2.04Metals inventory adjustments 0.58 0.22Noncash and other costs, net 0.15 0.28
b
Total unit costs 11.71 9.65Gross loss per pound $ (3.69) $ (1.51)
Reconciliation to Amounts Reported(In millions)
MetalsProduction Inventory
Year Ended December 31, 2016 Revenues and Delivery DD&A AdjustmentsTotals presented above $ 208 $ 195 $ 68 $ 15Treatment charges and other (22) — — —Noncash and other costs, net — 4 — —Molybdenum mines 186 199 68 15Other mining & eliminationsc 13,131 8,644 1,579 21Total mining 13,317 8,843 1,647 36U.S. oil & gas operations 1,513 1,801 869 —Corporate, other & eliminations — 53 14 —As reported in FCX's consolidated financial statements $ 14,830 $ 10,697 $ 2,530 $ 36
Year Ended December 31, 2015Totals presented above $ 388 $ 299 $ 97 $ 11Treatment charges and other (40) — — —Noncash and other costs, net — 13 — —Molybdenum mines 348 312 97 11Other mining & eliminationsc 12,264 9,171 1,325 327Total mining 12,612 9,483 1,422 338U.S. oil & gas operations 1,994 1,211 1,804 —Corporate, other & eliminations 1 (1) 14 —As reported in FCX's consolidated financial statements $ 14,607 $ 10,693 $ 3,240 $ 338
a. Reflects sales of the Molybdenum mines' production to FCX's molybdenum sales company at market-based pricing. On a consolidated basis, realizations are based on the actual contract terms for sales to third parties; as a result, FCX's consolidated average realized price per pound of molybdenum will differ from the amounts reported in this table.
b. Includes restructuring charges totaling $7 million ($0.15 per pound).c. Represents the combined total for all other mining operations and the related eliminations, as presented in the supplemental schedule,
“Business Segments” beginning on page XII. Also includes amounts associated with FCX's molybdenum sales company, which includes sales of molybdenum produced by the Molybdenum mines and by certain of the North and South America copper mines.

XXXIV
FREEPORT-McMoRan INC.PRODUCT REVENUES AND PRODUCTION COSTS (continued)
U.S. Oil & Gas Product Revenues, Cash Production Costs and Realizations
Three Months Ended December 31, 2016(In millions) Natural Total U.S.
Oil Gas NGLs Oil & GasOil and gas revenues before derivatives $ 371 $ 38 $ 3 $ 412
a
Cash gains on derivative contracts 6 — — 6Realized revenues $ 377 $ 38 $ 3 418
Cash production costs (153)a
Cash operating margin 265DD&A (173)Accretion and other costs (121)
b
Net noncash mark-to-market losses on derivative contracts (41)Other revenue 4Gross loss $ (66)
Oil (MMBbls) 8.3Gas (Bcf) 12.9NGLs (MMBbls) 0.1Oil Equivalents (MMBOE) 10.5
Oil Natural Gas NGLs(per barrel) (per MMBtu) (per barrel) Per BOE
Oil and gas revenues before derivatives $ 44.79 $ 2.97 $ 47.21 $ 39.31a
Cash gains on derivative contracts 0.72 — — 0.57Realized revenues $ 45.51 $ 2.97 $ 47.21 39.88Cash production costs (14.62)
a
Cash operating margin 25.26DD&A (16.51)Accretion and other costs (11.53)
b
Net noncash mark-to-market losses on derivative contracts (3.89)Other revenue 0.41Gross loss $ (6.26)
Reconciliation to Amounts Reported(In millions)
RevenuesProduction
and Delivery DD&ATotals presented above $ 412 $ 153 $ 173Accretion and other costs — 121 —Cash gains on derivative contracts 6 — —Net noncash mark-to-market losses on derivative contracts (41) — —Other revenue 4 — —U.S. oil & gas operations 381 274 173Total miningc 3,996 2,448 417Corporate, other & eliminations — 18 3As reported in FCX's consolidated financial statements $ 4,377 $ 2,740 $ 593
a. Following is a summary of average realized price and cash production costs per BOE by region:
MBOE
RealizedRevenues(in millions)
AverageRealized Price
per BOE
Cash Production
Costs(in millions)
CashProductionCosts per
BOEGulf of Mexico (GOM) 7,207 $ 287 $ 39.75 $ 82 $ 11.38California 2,947 126 42.88 65 22.01Haynesville/Madden/Other 338 5 16.13 6 19.24
10,492 $ 418 39.31 $ 153 14.62
b. Includes $93 million ($8.78 per BOE) primarily for idle rig and contract termination costs, inventory adjustments and asset impairments, partly offset by adjustments to prior period mineral tax assessments related to the California properties.
c. Represents the combined total for mining operations and the related eliminations, as presented in the supplemental schedule, “Business Segments” beginning on page XII.

XXXV
FREEPORT-McMoRan INC.PRODUCT REVENUES AND PRODUCTION COSTS (continued)
Three Months Ended December 31, 2015(In millions) Natural Total U.S.
Oil Gas NGLs Oil & GasOil and gas revenues before derivatives $ 338 $ 45 $ 10 $ 393
a
Cash gains on derivative contracts 102 — — 102Realized revenues $ 440 $ 45 $ 10 495
Cash production costs (214)a
Cash operating margin 281DD&A (339)Impairment of oil and gas properties (3,710)Accretion and other costs (140)
b
Net noncash mark-to-market losses on derivativecontracts (102)
Other revenue 7Gross loss $ (4,003)
Oil (MMBbls) 9.0Gas (Bcf) 21.5NGLs (MMBbls) 0.6Oil Equivalents (MMBOE) 13.2
Oil Natural Gas NGLs(per barrel) (per MMbtu) (per barrel) Per BOE
Oil and gas revenues before derivatives $ 37.49 $ 2.10 $ 16.37 $ 29.73a
Cash gains on derivative contracts 11.39 — — 7.76Realized revenues $ 48.88 $ 2.10 $ 16.37 37.49
Cash production costs (16.17)a
Cash operating margin 21.32DD&A (25.61)Impairment of oil and gas properties (280.80)Accretion and other costs (10.64)
b
Net noncash mark-to-market losses on derivativecontracts (7.72)
Other revenue 0.53Gross loss $ (302.92)
Reconciliation to Amounts Reported(In millions)
RevenuesProduction
and Delivery DD&A
Impairment ofOil and GasProperties
Totals presented above $ 393 $ 214 $ 339 $ 3,710Cash gains on derivative contracts 102 — — —Net noncash mark-to-market losses on derivative
contracts (102) — — —Accretion and other costs — 140 — —Other revenue 7 — — —U.S. oil & gas operations 400 354 339 3,710Total miningc 3,116 2,485 376 —Corporate, other & eliminations — (8) 3 (8)
d
As reported in FCX's consolidated financial statements $ 3,516 $ 2,831 $ 718 $ 3,702
a. Following is a summary of average realized price and cash production costs per BOE by region:
MBOERevenues(in millions)
AverageRealized Price
per BOE
Cash Production
Costs(in millions)
CashProductionCosts per
BOEGOM 7,994 $ 261 $ 32.65 $ 96 $ 11.94California 3,282 107 32.44 100 30.53Haynesville/Madden/Other 1,935 25 13.11 18 9.37
13,211 $ 393 29.73 $ 214 16.17
b. Includes $129 million ($9.83 per BOE) primarily for asset impairments and inventory adjustments, idle/terminated rig costs and prior period mineral tax assessments related to the California properties.
c. Represents the combined total for all mining operations and the related eliminations, as presented in the supplemental schedule, “Business Segments” beginning on page XII.
d. Primarily reflects adjustments to the third-quarter 2015 impairment of the Morocco oil and gas properties.

XXXVI
FREEPORT-McMoRan INC.PRODUCT REVENUES AND PRODUCTION COSTS (continued)
Year Ended December 31, 2016(In millions) Natural Total U.S.
Oil Gas NGLs Oil & GasOil and gas revenues before derivatives $ 1,339 $ 155 $ 33 $ 1,527
a
Cash gains on derivative contracts 6 — — 6Realized revenues $ 1,345 $ 155 $ 33 1,533
Cash production costs (714)a
Cash operating margin 819DD&A (869)Impairment of oil and gas properties (4,299)Accretion and other costs (1,087)
b
Net noncash mark-to-market losses on derivative contracts (41)Other revenue 21Gross loss $ (5,456)
Oil (MMBbls) 34.4Gas (Bcf) 65.1NGLs (MMBbls) 1.8Oil Equivalents (MMBOE) 47.1
Oil Natural Gas NGLs(per barrel) (per MMBtu) (per barrel) Per BOE
Oil and gas revenues before derivatives $ 38.96 $ 2.38 $ 18.11 $ 32.46a
Cash gains on derivative contracts 0.17 — — 0.13Realized revenues $ 39.13 $ 2.38 $ 18.11 32.59
Cash production costs (15.19)a
Cash operating margin 17.40DD&A (18.47)Impairment of oil and gas properties (91.35)Accretion and other costs (23.10)
b
Net noncash mark-to-market losses on derivative contracts (0.87)Other revenue 0.44Gross loss $ (115.95)
Reconciliation to Amounts Reported(In millions)
RevenuesProduction
and Delivery DD&A
Impairment ofOil and GasProperties
Totals presented above $ 1,527 $ 714 $ 869 $ 4,299Cash gains on derivative contracts 6 — — —Net noncash mark-to-market losses on derivative contracts (41) — — —Accretion and other costs — 1,087 — —Other revenue 21 — — —U.S. oil & gas operations 1,513 1,801 869 4,299Total miningc 13,317 8,843 1,647 —Corporate, other & eliminations — 53 14 18As reported in FCX's consolidated financial statements $ 14,830 $ 10,697 $ 2,530 $ 4,317
a. Following is a summary of average realized price and cash production costs per BOE by region:
MBOE
RealizedRevenues(in millions)
AverageRealized Price
per BOE
Cash Production
Costs(in millions)
CashProductionCosts per
BOEGOM 31,087 $ 1,060 $ 34.09 $ 379 $ 12.20California 11,817 420 35.52 289 24.43Haynesville/Madden/Other 4,154 53 12.98 46 11.26
47,058 $ 1,533 32.46 $ 714 15.19
b. Includes charges of $1.0 billion ($21.63 per BOE) primarily for drillship settlements/idle rig and contract termination costs, inventory adjustments and asset impairments, partly offset by adjustments to prior period mineral tax assessments related to the California properties.
c. Represents the combined total for mining operations and the related eliminations, as presented in the supplemental schedule, “Business Segments,” beginning on page XII.

XXXVII
FREEPORT-McMoRan INC.PRODUCT REVENUES AND PRODUCTION COSTS (continued)
Year Ended December 31, 2015(In millions) Natural Total U.S.
Oil Gas NGLs Oil & GasOil and gas revenues before derivatives $ 1,607 $ 232 $ 46 $ 1,885
a
Cash gains on derivative contracts 406 — — 406Realized revenues $ 2,013 $ 232 $ 46 2,291
Cash production costs (979)a
Cash operating margin 1,312DD&A (1,804)Impairment of oil and gas properties (12,980)Accretion and other costs (232)
b
Net noncash mark-to-market losses on derivativecontracts (319)
Other revenues 22Gross loss $ (14,001)
Oil (MMBbls) 35.3Gas (Bcf) 89.7NGLs (MMBbls) 2.4Oil Equivalents (MMBOE) 52.6
Oil Natural Gas NGLs(per barrel) (per MMbtu) (per barrel) Per BOE
Oil and gas revenues before derivatives $ 45.58 $ 2.59 $ 18.90 $ 35.82a
Cash gains on derivative contracts 11.53 — — 7.72Realized revenues $ 57.11 $ 2.59 $ 18.90 43.54
Cash production costs (18.59)a
Cash operating margin 24.95DD&A (34.28)Impairment of oil and gas properties (246.67)Accretion and other costs (4.41)
b
Net noncash mark-to-market losses on derivativecontracts (6.07)
Other revenues 0.43Gross loss $ (266.05)
Reconciliation to Amounts Reported(In millions)
RevenuesProduction
and Delivery DD&A
Impairment ofOil and GasProperties
Totals presented above $ 1,885 $ 979 $ 1,804 $ 12,980Cash gains on derivative contracts 406 — — —Net noncash mark-to-market losses on derivative
contracts (319) — — —Accretion and other costs — 232 — —Other revenues 22 — — —U.S. oil & gas operations 1,994 1,211 1,804 12,980Total miningc 12,612 9,483 1,422 —Corporate, other & eliminations 1 (1) 14 164
d
As reported in FCX's consolidated financial statements $ 14,607 $ 10,693 $ 3,240 $ 13,144
a. Following is a summary of average realized price and cash production costs per BOE by region.
MBOERevenues(in millions)
AverageRealized Price
per BOE
Cash Production
Costs(in millions)
CashProductionCosts per
BOEGOM 30,350 $ 1,208 $ 39.81 $ 470 $ 15.46California 13,460 538 39.92 412 30.66Haynesville/Madden/Other 8,812 139 15.77 97 11.02
52,622 $ 1,885 35.82 $ 979 18.59
b. Includes $188 million ($3.58 per BOE) primarily for asset impairments and inventory adjustments, idle/terminated rig costs and prior period mineral tax assessments related to the California properties.
c. Represents the combined total for all mining operations and the related eliminations, as presented in the supplemental schedule, “Business Segments” beginning on page XII.
d. Reflects impairment of international oil and gas properties, primarily in Morocco.