FREEPORT-McMoRan INC.d18rn0p25nwr6d.cloudfront.net/CIK-0000831259/...bf63-90819c390cd1.pdf · Item...
90
UNITED STATES SECURITIES AND EXCHANGE COMMISSION Washington, D.C. 20549 FORM 8-K CURRENT REPORT Pursuant to Section 13 OR 15(d) of The Securities Exchange Act of 1934 Date of Report (Date of earliest event reported): January 25, 2018 FREEPORT-McMoRan INC. (Exact name of registrant as specified in its charter) Delaware 001-11307-01 74-2480931 (State or other jurisdiction of incorporation) (Commission File Number) (I.R.S. Employer Identification No.) 333 North Central Avenue Phoenix, AZ 85004 (Address of principal executive offices) (Zip Code) Registrant's telephone number, including area code: (602) 366-8100 Check the appropriate box below if the Form 8-K filing is intended to simultaneously satisfy the filing obligation of the registrant under any of the following provisions: [ ] Written communications pursuant to Rule 425 under the Securities Act (17 CFR 230.425) [ ] Soliciting material pursuant to Rule 14a-12 under the Exchange Act (17 CFR 240.14a-12) [ ] Pre-commencement communications pursuant to Rule 14d-2(b) under the Exchange Act (17 CFR 240.14d-2(b)) [ ] Pre-commencement communications pursuant to Rule 13e-4(c) under the Exchange Act (17 CFR 240.13e-4(c)) Indicate by check mark whether the registrant is an emerging growth company as defined in Rule 405 of the Securities Act of 1933 (17 CFR §230.405) or Rule 12b- 2 of the Securities Exchange Act of 1934 (17 CFR § 240.12b-2). Emerging growth company [ ] If an emerging growth company, indicate by check mark if the registrant has elected not to use the extended transition period for complying with any new or revised financial accounting standards provided pursuant to Section 13(a) of the Exchange Act. [ ]
Transcript of FREEPORT-McMoRan INC.d18rn0p25nwr6d.cloudfront.net/CIK-0000831259/...bf63-90819c390cd1.pdf · Item...
UNITED STATESSECURITIES AND EXCHANGE COMMISSION
Washington, D.C. 20549
FORM 8-K
CURRENT REPORTPursuant to Section 13 OR 15(d) of The Securities Exchange Act of 1934
Date of Report (Date of earliest event reported): January 25, 2018
FREEPORT-McMoRan INC.(Exact name of registrant as specified in its charter)
Delaware 001-11307-01 74-2480931(State or other jurisdiction of
incorporation) (Commission File Number)
(I.R.S. Employer Identification
No.)
333 North Central Avenue Phoenix, AZ 85004
(Address of principal executive offices) (Zip Code)
Registrant's telephone number, including area code: (602) 366-8100
Check the appropriate box below if the Form 8-K filing is intended to simultaneously satisfy the filing obligation of the registrant under any of the followingprovisions:
[ ] Written communications pursuant to Rule 425 under the Securities Act (17 CFR 230.425)
[ ] Soliciting material pursuant to Rule 14a-12 under the Exchange Act (17 CFR 240.14a-12)
[ ] Pre-commencement communications pursuant to Rule 14d-2(b) under the Exchange Act (17 CFR 240.14d-2(b))
[ ] Pre-commencement communications pursuant to Rule 13e-4(c) under the Exchange Act (17 CFR 240.13e-4(c))
Indicate by check mark whether the registrant is an emerging growth company as defined in Rule 405 of the Securities Act of 1933 (17 CFR §230.405) or Rule 12b-2 of the Securities Exchange Act of 1934 (17 CFR § 240.12b-2).
Emerging growth company [ ]
If an emerging growth company, indicate by check mark if the registrant has elected not to use the extended transition period for complying with any new or revisedfinancial accounting standards provided pursuant to Section 13(a) of the Exchange Act. [ ]

Item 2.02. Results of Operations and Financial Condition.
Freeport-McMoRan Inc. (FCX) issued a press release dated January 25, 2018 , announcing its fourth-quarter and year ended December 31, 2017 financial andoperating results, referencing supplementary schedules (see Exhibit 99.1).
Item 7.01. Regulation FD Disclosure.
The slides presented in connection with FCX’s fourth-quarter 2017 earnings conference call conducted via the internet on January 25, 2018 are attached hereto asExhibit 99.2.
The information furnished pursuant to this Item 7.01 shall not be deemed “filed” for purposes of Section 18 of the Securities Exchange Act of 1934, as amended(the “Exchange Act”), or otherwise subject to the liabilities of that section, nor shall it be deemed incorporated by reference in any filing under the Securities Act of1933, as amended, or the Exchange Act, regardless of any general incorporation language in such filing.
Item 9.01. Financial Statements and Exhibits.
(d) Exhibits.
ExhibitNumber Exhibit Title
99.1 Press release dated January 25, 2018, titled “Freeport-McMoRan Reports Fourth-Quarter and Year Ended December 31, 2017Results” and supplementary schedules.
99.2 Slides presented in connection with FCX’s fourth-quarter 2017 earnings conference call conducted via the internet on January
25, 2018.

SIGNATURE
Pursuant to the requirements of the Securities Exchange Act of 1934, the registrant has duly caused this report to be signed on its behalf by theundersigned hereunto duly authorized.
FREEPORT-McMoRan INC.
By: /s/ C. Donald Whitmire, Jr.----------------------------------------
C. Donald Whitmire, Jr.Vice President and Controller -Financial Reporting (authorized signatory andPrincipal Accounting Officer)
Date: January 25, 2018

Freeport-McMoRanReports Fourth-Quarter and Year Ended December 31, 2017 Results
▪ Net income attributable to common stock totaled $1.0 billion , $0.71 per share, for fourth-quarter 2017 . After adjusting for net gains of $291million , $0.20 per share, fourth-quarter 2017 adjusted net income attributable to common stock totaled $750 million , $0.51 per share.
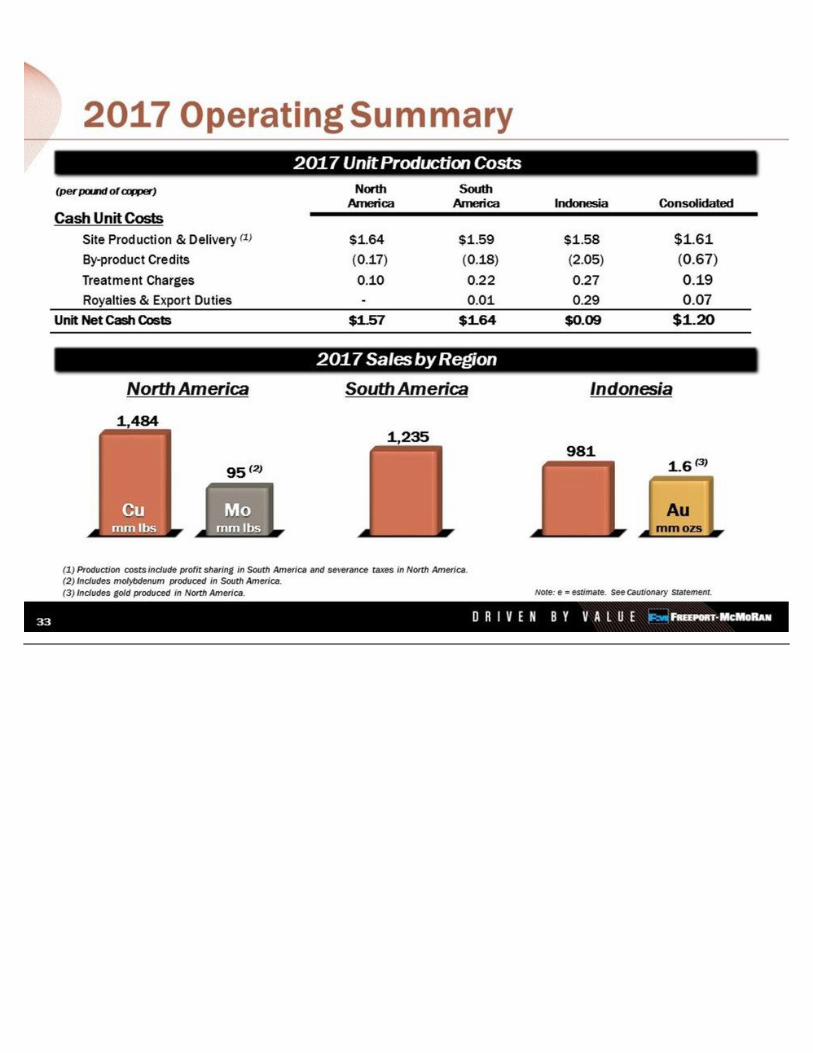
▪ Consolidated sales totaled 1.0 billion pounds of copper, 593 thousand ounces of gold and 24 million pounds of molybdenum for fourth-quarter 2017 and 3.7 billion pounds of copper, 1.6 million ounces of gold and 95 million pounds of molybdenum for the year 2017 .
▪ Consolidated sales for the year 2018 are expected to approximate 3.9 billion pounds of copper, 2.4 million ounces of gold and 91 millionpounds of molybdenum, including 1.0 billion pounds of copper, 675 thousand ounces of gold and 24 million pounds of molybdenum for first-quarter 2018 .
▪ Average realized prices for fourth-quarter 2017 were $3.21 per pound for copper, $1,285 per ounce for gold and $9.79 per pound formolybdenum.
▪ Average unit net cash costs for fourth-quarter 2017 were $1.04 per pound of copper and $1.20 per pound for the year 2017 . Unit netcash costs are expected to average $0.97 per pound of copper for the year 2018 .
▪ Operating cash flows totaled $1.7 billion (including $0.2 billion in working capital sources and timing of other tax payments) for fourth-quarter 2017 and $4.7 billion (including $0.6 billion in working capital sources and timing of other tax payments) for the year 2017 . Basedon current sales volume and cost estimates, and assuming average prices of $3.15 per pound for copper, $1,300 per ounce for gold and$10.00 per pound for molybdenum, operating cash flows for the year 2018 are expected to exceed $5.8 billion (including $0.3 billion inworking capital sources and timing of other tax payments).
▪ Capital expenditures for fourth-quarter 2017 totaled $390 million (including approximately $250 million for major mining projects) and $1.4billion for the year 2017 (including $0.9 billion for major mining projects). Capital expenditures for the year 2018 are expected toapproximate $2.1 billion , including $1.2 billion for major mining projects primarily associated with underground development activities in theGrasberg minerals district and development of the Lone Star oxide project.
▪ During fourth-quarter 2017 , FCX repaid $1.7 billion in debt , including the redemption of $617 million of senior notes due 2020 and therepurchase of $74 million of senior notes due 2018 in open-market transactions.
▪ At December 31, 2017 , consolidated cash totaled $4.4 billion and consolidated debt totaled $13.1 billion . FCX had no borrowings and$3.5 billion available under its revolving credit facility at December 31, 2017 .
Freeport-McMoRan 1

PHOENIX, AZ, January 25, 2018 - Freeport-McMoRan Inc. (NYSE: FCX) reported net income attributable to common stock of $1.0 billion ( $0.71 per share) forfourth-quarter 2017 and $1.8 billion ( $1.25 per share) for the year 2017 , compared with net income attributable to common stock of $292 million ( $0.21 per share)for fourth-quarter 2016 and a net loss attributable to common stock of $4.2 billion ( $3.16 per share) for the year 2016 . After adjusting for net gains of $291 million ($0.20 per share) primarily related to tax benefits associated with U.S. tax reform, partly offset by charges for adjustments to environmental obligations, adjusted netincome attributable to common stock totaled $750 million ( $0.51 per share) for fourth-quarter 2017 . Refer to the supplemental schedule, "Adjusted Net Income,"on page VII , which is available on FCX's website, "fcx.com," for additional information.
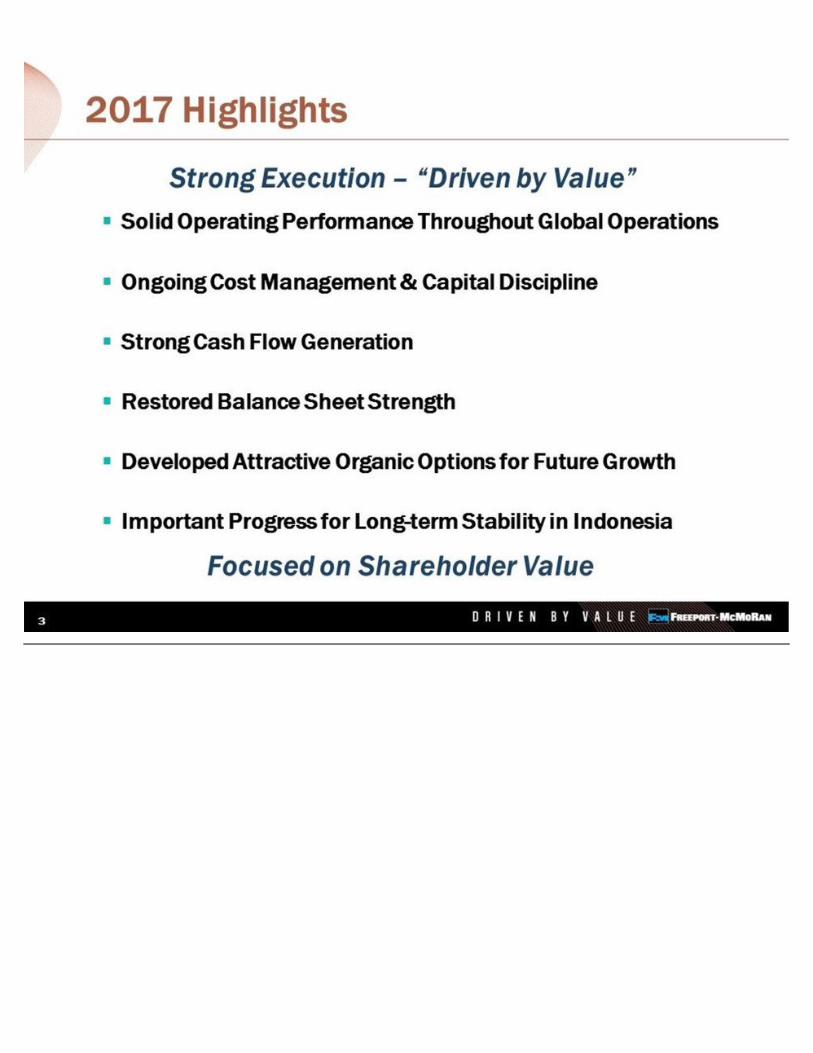
Richard C. Adkerson, President and Chief Executive Officer, said, "During 2017, our global team’s focus on productivity and cost and capitaldiscipline, together with improved market conditions for copper, produced solid results. We generated strong cash flows, continued to strengthen ourbalance sheet and advanced several long-term initiatives to build value for shareholders. Our actions during 2016 and 2017 achieved our debt reductionobjectives efficiently while retaining a strong asset base for the future. As we enter 2018, our shareholders are well positioned to benefit from ourglobal leadership position in copper, supported by a large, high-quality portfolio of long-lived geographically diverse assets and favorable coppermarket conditions. We are continuing to make significant progress in our ongoing negotiations with the Indonesian government to restore long-termstability for our Grasberg operations as we remain focused on executing our business strategy for the benefit of our shareholders and otherstakeholders."
SUMMARY FINANCIAL DATA
Three Months Ended December 31, Years Ended December 31, 2017 2016 2017 2016 (in millions, except per share amounts) Revenues a,b $ 5,041 $ 4,377 $ 16,403 $ 14,830 Operating income (loss) a $ 1,467 $ 703 $ 3,633 $ (2,792) Net income (loss) from continuing operations $ 1,193 $ 202 $ 2,029 $ (3,832) Net income (loss) from discontinued operations $ 16 c $ (2) $ 66 c $ (193) Net income (loss) attributable to common stock d,e $ 1,041 $ 292 $ 1,817 $ (4,154) Diluted net income (loss) per share of common stock:
Continuing operations $ 0.70 $ 0.22 $ 1.21 $ (2.96) Discontinued operations 0.01 (0.01) 0.04 (0.20)
$ 0.71 $ 0.21 $ 1.25 $ (3.16)
Diluted weighted-average common shares outstanding 1,455 1,410 1,454 1,318 Operating cash flows f $ 1,664 $ 1,135 $ 4,682 $ 3,729 Capital expenditures $ 390 $ 504 $ 1,410 $ 2,813 At December 31:
Cash and cash equivalents $ 4,447 $ 4,245 $ 4,447 $ 4,245 Total debt, including current portion $ 13,117 $ 16,027 $ 13,117 $ 16,027
a. For segment financial results, refer to the supplemental schedules, "Business Segments," beginning on page IX , which are available on FCX's website, "fcx.com."b. Includes favorable adjustments to provisionally priced concentrate and cathode copper sales recognized in prior periods totaling $104 million ( $42 million to net income
attributable to common stock or $0.03 per share) in fourth-quarter 2017 , $129 million ( $57 million to net income attributable to common stock or $0.04 per share) in fourth-quarter 2016 , $81 million ( $34 million to net income attributable to common stock or $0.02 per share) for the year 2017 and $5 million ( $2 million to net loss attributable tocommon stock or less than $0.01 per share) for the year 2016 . For further discussion, refer to the supplemental schedule, "Derivative Instruments," on page IX , which isavailable on FCX's website, "fcx.com."
c. Primarily reflects adjustments to the fair value of the potential $120 million in contingent consideration related to the 2016 sale of FCX's interest in TF Holdings Limited(TFHL), which totaled $74 million at December 31, 2017 , and will continue to be adjusted through December 31, 2019.
Freeport-McMoRan 2

d. Includes net gains (charges) of $291 million ( $0.20 per share) in fourth-quarter 2017 , $(59) million ( $(0.04) per share) in fourth-quarter 2016 , $113 million ( $0.08 pershare) for the year 2017 and $(4.5) billion ( $3.39 per share) for the year 2016 that are described in the supplemental schedule, "Adjusted Net Income," on page VII , whichis available on FCX's website, "fcx.com."
e. FCX defers recognizing profits on intercompany sales until final sales to third parties occur. For a summary of net impacts from changes in these deferrals, refer to thesupplemental schedule, "Deferred Profits," on page IX , which is available on FCX's website, "fcx.com."
f. Includes net working capital sources (uses) and timing of other tax payments of $194 million in fourth-quarter 2017 , $(396) million in fourth-quarter 2016 , $589 million forthe year 2017 and $87 million for the year 2016 .
SUMMARY OPERATING DATA
Three Months Ended December
31, Years Ended December 31, 2017 2016 a 2017 2016 a Copper (millions of recoverable pounds)
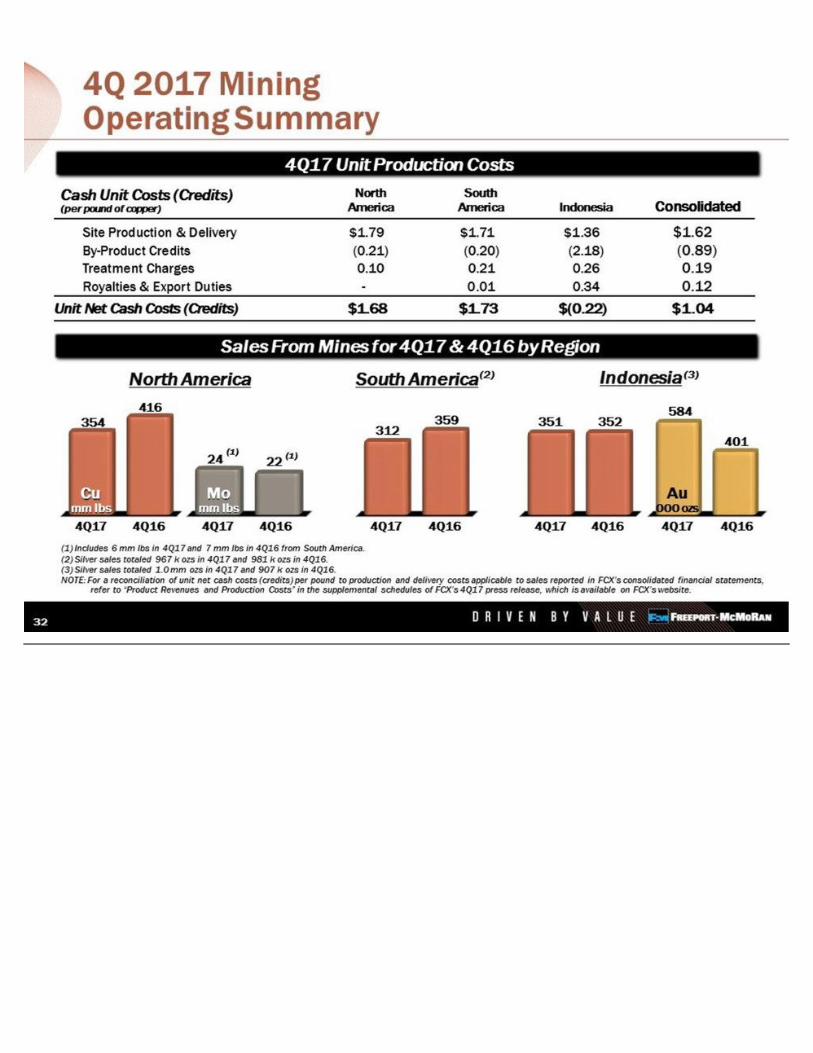
Production 1,007 1,131 3,737 4,222 Sales, excluding purchases 1,017 1,127 3,700 4,227 Average realized price per pound $ 3.21 $ 2.48 $ 2.93 $ 2.28 Site production and delivery costs per pound b $ 1.62 $ 1.44 $ 1.61 $ 1.42 Unit net cash costs per pound b $ 1.04 $ 1.21 $ 1.20 $ 1.26
Gold (thousands of recoverable ounces) Production 567 430 1,577 1,088 Sales, excluding purchases 593 405 1,562 1,079 Average realized price per ounce $ 1,285 $ 1,174 $ 1,268 $ 1,238
Molybdenum (millions of recoverable pounds) Production 22 22 92 80 Sales, excluding purchases 24 22 95 74 Average realized price per pound $ 9.79 $ 8.27 $ 9.33 $ 8.33
a. Excludes the results of the Tenke Fungurume (Tenke) mine, which was sold in November 2016 and is reported as discontinued operations. Copper sales from the Tenkemine totaled 59 million pounds in fourth-quarter 2016 and 424 million pounds for the year 2016 .
b. Reflects per pound weighted-average production and delivery costs and unit net cash costs (net of by-product credits) for all copper mines, before net noncash and othercosts. For reconciliations of per pound unit costs by operating division to production and delivery costs applicable to sales reported in FCX's consolidated financialstatements, refer to the supplemental schedules, "Product Revenues and Production Costs," beginning on page XII , which are available on FCX's website, "fcx.com."
Consolidated Sales VolumesFourth-quarter 2017 copper sales of 1.0 billion pounds approximated the October 2017 estimate and were lower than fourth-quarter 2016 sales of 1.1
billion pounds, primarily reflecting lower sales volumes in North America and at Cerro Verde.
Fourth-quarter 2017 gold sales of 593 thousand ounces were lower than the October 2017 estimate of 625 thousand ounces, primarily reflecting lower millrates at PT Freeport Indonesia (PT-FI). Fourth-quarter 2017 gold sales were higher than fourth-quarter 2016 sales of 405 thousand ounces, primarily reflectinganticipated higher ore grades from Indonesia.
Fourth-quarter 2017 molybdenum sales of 24 million pounds were slightly higher than the October 2017 estimate of 23 million pounds and fourth-quarter2016 sales of 22 million pounds.
Sales volumes for the year 2018 are expected to approximate 3.9 billion pounds of copper, 2.4 million ounces of gold and 91 million pounds ofmolybdenum, including 1.0 billion pounds of copper, 675 thousand ounces of gold and 24 million pounds of molybdenum in first-quarter 2018 .
Freeport-McMoRan 3
Consolidated Unit CostsConsolidated average unit net cash costs (net of by-product credits) for FCX's copper mines of $1.04 per pound of copper in fourth-quarter 2017 were
lower than unit net cash costs of $1.21 per pound in fourth-quarter 2016 , primarily reflecting higher by-product credits, partly offset by lower copper sales volumesand higher mining and milling costs in South America.
Assuming average prices of $1,300 per ounce of gold and $10.00 per pound of molybdenum for 2018 and achievement of current sales volume and costestimates, consolidated unit net cash costs (net of by-product credits) for copper mines are expected to average $0.97 per pound of copper for the year 2018 . Theimpact of price changes on 2018 consolidated unit net cash costs would approximate $0.03 per pound for each $50 per ounce change in the average price of goldand $0.025 per pound for each $2 per pound change in the average price of molybdenum. Quarterly unit net cash costs vary with fluctuations in sales volumes andrealized prices, primarily for gold and molybdenum.
MINING OPERATIONSNorth America Copper Mines. FCX operates seven open-pit copper mines in North America - Morenci, Bagdad, Safford, Sierrita and Miami in Arizona, and Chinoand Tyrone in New Mexico. In addition to copper, certain of FCX's North America copper mines produce molybdenum concentrate, gold and silver.
All of the North America mining operations are wholly owned, except for Morenci. FCX records its 72 percent undivided joint venture interest in Morenciusing the proportionate consolidation method.
Operating and Development Activities. FCX has significant undeveloped reserves and resources in North America and a portfolio of potential long-termdevelopment projects. Future investments will be undertaken based on the results of economic and technical feasibility studies, and are dependent on marketconditions. FCX continues to study opportunities to reduce the capital intensity of its potential long-term development projects.
Through exploration drilling, FCX has identified a significant resource at its wholly owned Lone Star project located near the Safford operation in easternArizona. FCX has commenced a project to develop the Lone Star oxide ores with first production expected by the end of 2020. Total estimated capital costs for theproject, including mine equipment and pre-production stripping, approximates $850 million and will benefit from the utilization of existing infrastructure at theadjacent Safford operation. Production from the Lone Star oxide ores is expected to average approximately 200 million pounds of copper per year with anapproximate 20-year mine life. The project also advances the potential for development of a larger-scale district opportunity. FCX is conducting additional drilling asit continues to evaluate longer term opportunities available from the significant sulfide potential in the Lone Star/Safford minerals district.
Freeport-McMoRan 4

Operating Data. Following is summary consolidated operating data for the North America copper mines for the fourth quarters and years 2017 and 2016 :
Three Months Ended December
31, Years Ended December 31, 2017 2016 2017 2016 Copper (millions of recoverable pounds)
Production 367 420 1,518 1,831 Sales, excluding purchases 354 416 1,484 1,841 Average realized price per pound $ 3.15 $ 2.45 $ 2.85 $ 2.24
Molybdenum (millions of recoverable pounds)
Production a 8 8 33 33
Unit net cash costs per pound of copper b Site production and delivery, excluding adjustments $ 1.79 $ 1.46 $ 1.64 $ 1.42 By-product credits (0.21) (0.13) (0.17) (0.12) Treatment charges 0.10 0.11 0.10 0.11
Unit net cash costs $ 1.68 $ 1.44 $ 1.57 $ 1.41
a. Refer to summary operating data on page 3 for FCX's consolidated molybdenum sales, which includes sales of molybdenum produced at the North America copper mines.b. For a reconciliation of unit net cash costs per pound to production and delivery costs applicable to sales reported in FCX's consolidated financial statements, refer to the
supplemental schedules, "Product Revenues and Production Costs," beginning on page XII , which are available on FCX's website, "fcx.com."
North America's consolidated copper sales volumes of 354 million pounds in fourth-quarter 2017 were lower than fourth-quarter 2016 sales of 416 millionpounds, primarily reflecting anticipated lower ore grades. North America copper sales are estimated to approximate 1.5 billion pounds for the year 2018 , comparedwith 1.5 billion pounds in 2017 .
Average unit net cash costs (net of by-product credits) for the North America copper mines of $1.68 per pound of copper in fourth-quarter 2017 were higherthan unit net cash costs of $1.44 per pound in fourth-quarter 2016 , primarily reflecting lower sales volumes.
Average unit net cash costs (net of by-product credits) for the North America copper mines are expected to approximate $1.67 per pound of copper for theyear 2018 , based on achievement of current sales volume and cost estimates and assuming an average molybdenum price of $10.00 per pound. North America'saverage unit net cash costs for the year 2018 would change by approximately $0.04 per pound for each $2 per pound change in the average price of molybdenum.
South America Mining. FCX operates two copper mines in South America - Cerro Verde in Peru (in which FCX owns a 53.56 percent interest) and El Abra inChile (in which FCX owns a 51 percent interest). These operations are consolidated in FCX's financial statements. In addition to copper, the Cerro Verde mineproduces molybdenum concentrate and silver.
Operating and Development Activities. The Cerro Verde expansion project commenced operations in September 2015. The project expanded theconcentrator facilities from 120,000 metric tons of ore per day to 360,000 metric tons of ore per day, and averaged 374,200 metric tons of ore per day in fourth-quarter 2017 . Cerro Verde's expanded operations benefit from its large-scale, long-lived reserves and cost efficiencies.
FCX continues to evaluate a major expansion at El Abra to process additional sulfide material and to achieve higher recoveries. Exploration results at ElAbra indicate a significant sulfide resource, which could potentially support a major mill project similar to facilities recently constructed at Cerro Verde. Futureinvestments will depend on technical studies, which are being advanced, economic factors and market conditions.
Freeport-McMoRan 5

Operating Data. Following is summary consolidated operating data for the South America mining operations for the fourth quarters and years 2017 and2016 :
Three Months Ended December
31, Years Ended December 31, 2017 2016 2017 2016 Copper (millions of recoverable pounds)
Production 303 342 1,235 1,328 Sales 312 359 1,235 1,332 Average realized price per pound $ 3.22 $ 2.50 $ 2.97 $ 2.31
Molybdenum (millions of recoverable pounds)
Production a 6 7 27 21
Unit net cash costs per pound of copper b Site production and delivery, excluding adjustments $ 1.71 $ 1.35 $ 1.59 $ 1.26 By-product credits (0.20) (0.10) (0.18) (0.10) Treatment charges 0.21 0.25 0.22 0.24 Royalty on metals 0.01 0.01 0.01 0.01
Unit net cash costs $ 1.73 $ 1.51 $ 1.64 $ 1.41
a. Refer to summary operating data on page 3 for FCX's consolidated molybdenum sales, which includes sales of molybdenum produced at Cerro Verde.b. For a reconciliation of unit net cash costs per pound to production and delivery costs applicable to sales reported in FCX's consolidated financial statements, refer to the
supplemental schedules, "Product Revenues and Production Costs," beginning on page XII , which are available on FCX's website, "fcx.com."
South America's consolidated copper sales volumes of 312 million pounds in fourth-quarter 2017 were lower than fourth-quarter 2016 sales of 359 millionpounds, primarily reflecting lower recovery rates at Cerro Verde. Sales from South America mining are expected to approximate 1.2 billion pounds of copper for theyear 2018 , compared with 1.2 billion pounds of copper in 2017 .
Average unit net cash costs (net of by-product credits) for South America mining of $1.73 per pound of copper in fourth-quarter 2017 were higher than unitnet cash costs of $1.51 per pound in fourth-quarter 2016 , primarily reflecting lower sales volumes and higher mining and milling costs at Cerro Verde, partly offsetby higher by-product credits. Average unit net cash costs (net of by-product credits) for South America mining are expected to approximate $1.63 per pound ofcopper for the year 2018 , based on current sales volume and cost estimates and assuming an average price of $10.00 per pound of molybdenum.
Indonesia Mining. Through its 90.64 percent owned and consolidated subsidiary PT-FI, FCX's assets include one of the world's largest copper and gold depositsat the Grasberg minerals district in Papua, Indonesia. PT-FI operates a proportionately consolidated joint venture, which produces copper concentrate that containssignificant quantities of gold and silver.
Regulatory Matters. PT-FI continues to actively engage with Indonesian government officials to address regulatory changes that conflict with its contractualrights in a manner that provides long-term stability for PT-FI’s operations and investment plans, and protects value for FCX’s shareholders.
Following a framework understanding reached in August 2017, the parties have been engaged in negotiation and documentation of a special license(IUPK) and accompanying documentation for assurances on legal and fiscal terms to provide PT-FI with long-term rights through 2041. In addition, the IUPK wouldprovide that PT-FI construct a smelter within five years of reaching a definitive agreement and include agreement for the divestment of 51 percent of the projectarea interests to Indonesian participants at fair market value.
Freeport-McMoRan 6

In late 2017, the Indonesian government (including the regional government of Papua Province and Mimika Regency) and PT Indonesia Asahan Aluminium(Inalum), a state-owned enterprise, which will lead a consortium of investors, agreed to form a special purpose company to acquire Grasberg project areainterests. Inalum is owned 100 percent by the Indonesian government and currently holds 9.36 percent of PT-FI's outstanding common stock.
FCX is engaged in discussions with Inalum and PT-FI’s joint venture partner regarding potential arrangements that would result in the Inalum consortiumacquiring interests that would meet the Indonesian government’s 51 percent ownership objective in a manner satisfactory to all parties, and in a structure that wouldprovide for continuity of FCX’s management of PT-FI’s operations and governance of the business. The parties continue to negotiate documentation on acomprehensive agreement for PT-FI’s extended operations and to reach agreement on timing, process and governance matters relating to the divestment. Theparties have a mutual objective of completing negotiations and the required documentation during the first half of 2018.
In December 2017, the Indonesian government extended PT-FI’s temporary IUPK to June 30, 2018, and PT-FI is seeking an extension of its export licensewhich currently expires on February 16, 2018, to enable normal operations to continue during the negotiation period.
Until a definitive agreement is reached, PT-FI has reserved all rights under its Contract of Work (COW).
Operating and Development Activities. PT-FI is currently mining the final phase of the Grasberg open pit, which contains high copper and gold ore grades.PT-FI expects to mine high-grade ore over the next several quarters prior to transitioning to the Grasberg Block Cave underground mine in the first half of 2019.
PT-FI has several projects in the Grasberg minerals district related to the development of its large-scale, long-lived, high-grade underground ore bodies. Inaggregate, these underground ore bodies are expected to produce large-scale quantities of copper and gold following the transition from the Grasberg open pit.Substantial progress has been made to prepare for the transition to mining of the Grasberg Block Cave underground mine. Mine development activities aresufficiently advanced to commence caving in early 2019. The ore flow system and underground rail line are expected to be installed during 2018.
Subject to reaching a definitive agreement with the Indonesian government to support PT-FI's long-term investment plans, estimated annual capitalspending on these projects would average $0.9 billion per year ( $0.7 billion per year net to PT-FI) over the next five years. Considering the long-term nature andsize of these projects, actual costs could vary from these estimates. In response to market conditions and Indonesian regulatory uncertainty, timing of theseexpenditures continues to be reviewed. If PT-FI is unable to reach a definitive agreement with the Indonesian government on its long-term mining rights, FCXintends to reduce or defer investments significantly in its underground development projects and will pursue dispute resolution procedures under its COW.
Freeport-McMoRan 7

Operating Data. Following is summary consolidated operating data for the Indonesia mining operations for the fourth quarters and years 2017 and 2016 :
Three Months Ended December
31, Years Ended December 31, 2017 2016 2017 2016 Copper (millions of recoverable pounds)
Production 337 369 984 1,063 Sales 351 352 981 1,054 Average realized price per pound $ 3.25 $ 2.48 $ 3.00 $ 2.32
Gold (thousands of recoverable ounces)
Production 562 424 1,554 1,061 Sales 584 401 1,540 1,054 Average realized price per ounce $ 1,285 $ 1,174 $ 1,268 $ 1,237
Unit net cash (credits) costs per pound of copper a Site production and delivery, excluding adjustments $ 1.36 b $ 1.50 $ 1.58 b $ 1.63 Gold and silver credits (2.18) (1.34) (2.05) (1.30) Treatment charges 0.26 0.27 0.27 0.28 Export duties 0.15 0.09 0.12 0.09 Royalty on metals 0.19 0.13 0.17 0.13
Unit net cash (credits) costs $ (0.22) $ 0.65 $ 0.09 $ 0.83
a. For a reconciliation of unit net cash (credits) costs per pound to production and delivery costs applicable to sales reported in FCX's consolidated financial statements, refer
to the supplemental schedules, "Product Revenues and Production Costs," beginning on page XII , which are available on FCX's website, "fcx.com."
b. Excludes fixed costs charged directly to production and delivery costs totaling $8 million ( $0.02 per pound of copper) in fourth-quarter 2017 and $120 million ( $0.12 perpound of copper) for the year 2017 associated with workforce reductions.
Indonesia's consolidated copper sales of 351 million pounds in fourth-quarter 2017 approximated fourth-quarter 2016 sales of 352 million pounds.Indonesia's consolidated gold sales of 584 thousand ounces in fourth-quarter 2017 were higher than fourth-quarter 2016 sales of 401 thousand ounces, reflectinghigher gold ore grades.
PT-FI's labor productivity continues to improve following disruptions that occurred in the first half of 2017. During fourth-quarter 2017 , PT-FI and unionofficials reached terms for a new two-year labor agreement, effective October 1, 2017.
Assuming achievement of planned operating rates for 2018 , consolidated sales volumes from Indonesia mining are expected to approximate 1.2 billionpounds of copper and 2.4 million ounces of gold for the year 2018 , compared with 1.0 billion pounds of copper and 1.5 million ounces of gold for the year 2017 .
A significant portion of PT-FI's costs are fixed and unit costs vary depending on production volumes and other factors. As a result of higher gold and silvercredits, Indonesia had unit net cash credits (including gold and silver credits) of $0.22 per pound of copper in fourth-quarter 2017 , compared with unit net cashcosts of $0.65 per pound in fourth-quarter 2016 .
Assuming an average gold price of $1,300 per ounce for 2018 and achievement of current sales volume and cost estimates, unit net cash credits (includinggold and silver credits) for Indonesia mining are expected to approximate $0.57 per pound of copper for the year 2018 . Indonesia mining's unit net cash credits forthe year 2018 would change by approximately $0.09 per pound for each $50 per ounce change in the average price of gold. Because of the fixed nature of a largeportion of Indonesia's costs, unit net cash credits/costs vary from quarter to quarter depending on copper and gold volumes.
Freeport-McMoRan 8

Indonesia mining's projected sales volumes for the year 2018 are dependent on a number of factors, including operational performance, workforceproductivity, timing of shipments, the extension of PT-FI's export license (which currently expires on February 16, 2018), the extension of PT-FI's IUPK after June30, 2018, and satisfactory progress on the resolution of PT-FI's long-term mining rights.
Molybdenum Mines. FCX has two wholly owned molybdenum mines - the Henderson underground mine and the Climax open-pit mine, both in Colorado. TheHenderson and Climax mines produce high-purity, chemical-grade molybdenum concentrate, which is typically further processed into value-added molybdenumchemical products. The majority of molybdenum concentrate produced at the Henderson and Climax mines, as well as from FCX's North America and SouthAmerica copper mines, is processed at FCX's conversion facilities.
Operating and Development Activities. Production from the Molybdenum mines totaled 8 million pounds of molybdenum in fourth-quarter 2017 and 7million pounds in fourth-quarter 2016 . Refer to summary operating data on page 3 for FCX's consolidated molybdenum sales and average realized prices, whichincludes sales of molybdenum produced at the Molybdenum mines, and from FCX's North America and South America copper mines.
Unit net cash costs for the Molybdenum mines averaged $8.40 per pound of molybdenum in fourth-quarter 2017 and $8.26 per pound in fourth-quarter2016 . Based on current sales volume and cost estimates, average unit net cash costs for the Molybdenum mines are expected to approximate $9.00 per pound ofmolybdenum for the year 2018 .
For a reconciliation of unit net cash costs per pound to production and delivery costs applicable to sales reported in FCX's consolidated financialstatements, refer to the supplemental schedules, "Product Revenues and Production Costs," beginning on page XII , which are available on FCX's website,"fcx.com."
Mining Exploration Activities. FCX's mining exploration activities are generally associated with its existing mines, focusing on opportunities to expandreserves and resources to support development of additional future production capacity. Exploration results continue to indicate opportunities for significant futurepotential reserve additions in North America and South America. Exploration spending is expected to approximate $65 million for the year 2018 , compared to $72million in 2017 .
Preliminary Recoverable Proven and Probable Mineral Reserves. FCX has significant reserves, resources and future development opportunities within itsportfolio of mining assets. FCX's preliminary estimated consolidated recoverable proven and probable reserves from its mines at December 31, 2017 , include 86.7billion pounds of copper, 23.5 million ounces of gold and 2.84 billion pounds of molybdenum, which were determined using $2.00 per pound for copper, $1,000 perounce for gold and $10.00 per pound for molybdenum. The preliminary recoverable proven and probable mining reserves presented in the table below representthe estimated metal quantities from which FCX expects to be paid after application of estimated metallurgical recovery rates and smelter recovery rates, whereapplicable. Recoverable reserve volumes are those which FCX estimates can be economically and legally extracted or produced at the time of the reservedetermination.
Freeport-McMoRan 9
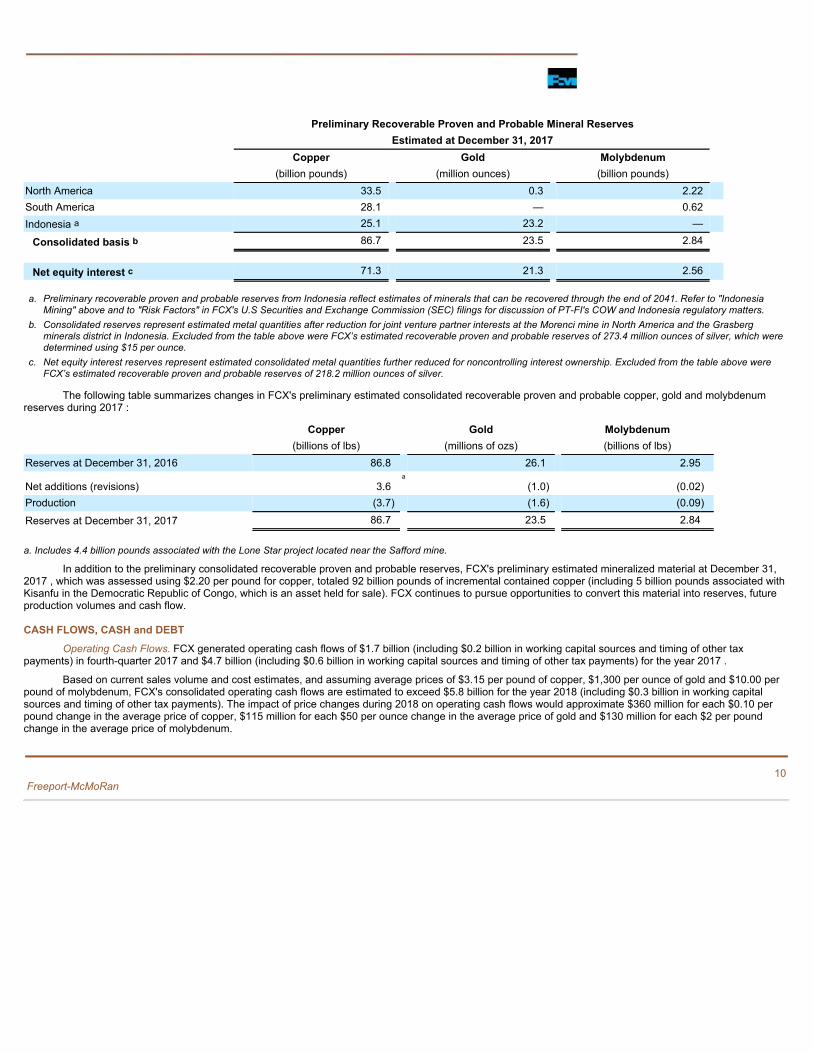
Preliminary Recoverable Proven and Probable Mineral Reserves Estimated at December 31, 2017 Copper Gold Molybdenum (billion pounds) (million ounces) (billion pounds) North America 33.5 0.3 2.22 South America 28.1 — 0.62 Indonesia a 25.1 23.2 —
Consolidated basis b 86.7 23.5 2.84
Net equity interest c 71.3 21.3 2.56
a. Preliminary recoverable proven and probable reserves from Indonesia reflect estimates of minerals that can be recovered through the end of 2041. Refer to "Indonesia
Mining" above and to "Risk Factors" in FCX's U.S Securities and Exchange Commission (SEC) filings for discussion of PT-FI's COW and Indonesia regulatory matters.b. Consolidated reserves represent estimated metal quantities after reduction for joint venture partner interests at the Morenci mine in North America and the Grasberg
minerals district in Indonesia. Excluded from the table above were FCX’s estimated recoverable proven and probable reserves of 273.4 million ounces of silver, which weredetermined using $15 per ounce.
c. Net equity interest reserves represent estimated consolidated metal quantities further reduced for noncontrolling interest ownership. Excluded from the table above wereFCX’s estimated recoverable proven and probable reserves of 218.2 million ounces of silver.
The following table summarizes changes in FCX's preliminary estimated consolidated recoverable proven and probable copper, gold and molybdenumreserves during 2017 :
Copper Gold Molybdenum (billions of lbs) (millions of ozs) (billions of lbs) Reserves at December 31, 2016 86.8 26.1 2.95
Net additions (revisions) 3.6a
(1.0) (0.02) Production (3.7) (1.6) (0.09)
Reserves at December 31, 2017 86.7 23.5 2.84
a. Includes 4.4 billion pounds associated with the Lone Star project located near the Safford mine.
In addition to the preliminary consolidated recoverable proven and probable reserves, FCX's preliminary estimated mineralized material at December 31,2017 , which was assessed using $2.20 per pound for copper, totaled 92 billion pounds of incremental contained copper (including 5 billion pounds associated withKisanfu in the Democratic Republic of Congo, which is an asset held for sale). FCX continues to pursue opportunities to convert this material into reserves, futureproduction volumes and cash flow.
CASH FLOWS, CASH and DEBTOperating Cash Flows. FCX generated operating cash flows of $1.7 billion (including $0.2 billion in working capital sources and timing of other tax
payments) in fourth-quarter 2017 and $4.7 billion (including $0.6 billion in working capital sources and timing of other tax payments) for the year 2017 .
Based on current sales volume and cost estimates, and assuming average prices of $3.15 per pound of copper, $1,300 per ounce of gold and $10.00 perpound of molybdenum, FCX's consolidated operating cash flows are estimated to exceed $5.8 billion for the year 2018 (including $0.3 billion in working capitalsources and timing of other tax payments). The impact of price changes during 2018 on operating cash flows would approximate $360 million for each $0.10 perpound change in the average price of copper, $115 million for each $50 per ounce change in the average price of gold and $130 million for each $2 per poundchange in the average price of molybdenum.
Freeport-McMoRan 10

Capital Expenditures. Capital expenditures totaled $390 million for fourth-quarter 2017 (including approximately $250 million for major mining projects) and$1.4 billion for the year ended 2017 (including $0.9 billion for major mining projects). Capital expenditures are expected to approximate $2.1 billion for the year2018 , including $1.2 billion for major mining projects primarily associated with underground development activities in the Grasberg minerals district anddevelopment of the Lone Star oxide project.
If PT-FI is unable to reach a definitive agreement with the Indonesian government on its long-term mining rights, FCX intends to reduce or deferinvestments significantly in its underground development projects and will pursue dispute resolution procedures under its COW.
Cash. Following is a summary of the U.S. and international components of consolidated cash and cash equivalents available to the parent company, net ofnoncontrolling interests' share, taxes and other costs at December 31, 2017 (in billions):
Cash at domestic companies $ 3.3 Cash at international operations 1.1
Total consolidated cash and cash equivalents 4.4 Noncontrolling interests' share (0.4)
Cash, net of noncontrolling interests' share 4.0 Withholding taxes and other —
Net cash available $ 4.0
Debt. Following is a summary of total debt and the related weighted-average interest rates at December 31, 2017 (in billions, except percentages):
Weighted- Average Interest Rate Senior Notes $ 11.8 4.4% Cerro Verde credit facility 1.3 3.5%
Total debt $ 13.1 4.3%
During fourth-quarter 2017, FCX redeemed $617 million aggregate principal amount of senior notes due 2020 and repurchased $74 million of FCX senior
notes due 2018 in open-market transactions, resulting in annual cash interest savings of over $40 million . During fourth-quarter 2017, FCX also repaid $730 millionof senior notes due 2017 and $220 million of the Cerro Verde credit facility. Debt repayments in fourth-quarter 2017 totaled $1.7 billion.
At December 31, 2017 , FCX had no borrowings, $13 million in letters of credit issued and $3.5 billion available under its revolving credit facility.
FINANCIAL POLICYIn December 2015, FCX's common stock dividend was suspended. The declaration of dividends is at the discretion of the Board of Directors (the Board)
and will depend upon FCX’s financial results, cash requirements, future prospects and other factors deemed relevant by the Board.
Freeport-McMoRan 11

WEBCAST INFORMATIONA conference call with securities analysts to discuss FCX's fourth-quarter 2017 results is scheduled for today at 10:00 a.m. Eastern Time. The conference
call will be broadcast on the Internet along with slides. Interested parties may listen to the conference call live and view the slides by accessing “fcx.com.” A replayof the webcast will be available through Friday, February 23, 2018 .
-----------------------------------------------------------------------------------------------------------
FCX is a leading international mining company with headquarters in Phoenix, Arizona. FCX operates large, long-lived, geographically diverse assets withsignificant proven and probable reserves of copper, gold and molybdenum. FCX is the world's largest publicly traded copper producer. FCX’s portfolio of assetsincludes the Grasberg minerals district in Indonesia, one of the world's largest copper and gold deposits; and significant mining operations in the Americas,including the large-scale Morenci minerals district in North America and the Cerro Verde operation in South America. Additional information about FCX is availableon FCX's website at "fcx.com."
CautionaryStatementandRegulationGDisclosure:This press release contains forward-looking statements in which FCX discusses its potential future performance. Forward-lookingstatements are all statements other than statements of historical facts, such as projections or expectations relating to ore grades and milling rates, production and sales volumes, unit net cashcosts, operating cash flows, anticipated tax refunds resulting from U.S. tax reform, capital expenditures, exploration efforts and results, development and production activities and costs, liquidity,tax rates, the impact of copper, gold and molybdenum price changes, the impact of deferred intercompany profits on earnings, reserve estimates, future dividend payments, and sharepurchases and sales. The words “anticipates,” “may,” “can,” “plans,” “believes,” “estimates,” “expects,” “projects,” "targets," “intends,” “likely,” “will,” “should,” “to be,” ”potential" and any similarexpressions are intended to identify those assertions as forward-looking statements. This press release also contains forward-looking statements and estimates regarding the anticipated effectsof the Tax Cuts and Jobs Act enacted on December 22, 2017. These statements and estimates are based on FCX's current interpretation of this legislation, which may change as a result ofadditional implementation guidance, changes in assumptions, and potential future refinements of or revisions to calculations.
This press release also includes forward-looking statements regarding mineralized material not included in proven and probable mineral reserves. Mineralized material is a mineralizedbody that has been delineated by appropriately spaced drilling and/or underground sampling to support the estimated tonnage and average metal grades. Such a deposit cannot qualify asrecoverable proven and probable reserves until legal and economic feasibility are confirmed based upon a comprehensive evaluation of development costs, unit costs, grades, recoveries andother material factors. Accordingly, no assurance can be given that the estimated mineralized material not included in reserves will become proven and probable reserves. FCX cautions readers that forward-looking statements are not guarantees of future performance and actual results may differ materially from those anticipated, projected or assumed in theforward-looking statements. Important factors that can cause FCX's actual results to differ materially from those anticipated in the forward-looking statements include supply of and demand for,and prices of, copper, gold and molybdenum; mine sequencing; production rates; potential inventory adjustments; potential impairment of long-lived mining assets; the outcome of negotiationswith the Indonesian government regarding PT-FI's long-term mining rights; the potential effects of violence in Indonesia generally and in the province of Papua; industry risks; regulatorychanges; political risks; labor relations; weather- and climate-related risks; environmental risks; litigation results (including the final disposition of Indonesian tax disputes and the outcome ofCerro Verde's royalty dispute with the Peruvian national tax authority); and other factors described in more detail under the heading “Risk Factors” in FCX's Annual Report on Form 10-K for theyear ended December 31, 2016 , filed with the SEC as updated by FCX's subsequent filings with the SEC. With respect to FCX's operations in Indonesia, such factors include whether PT-FI willbe able to resolve complex regulatory matters in Indonesia and continue to export copper after February 16, 2018.
Investors are cautioned that many of the assumptions upon which FCX's forward-looking statements are based are likely to change after the forward-looking statements are made,including for example commodity prices, which FCX cannot control, and production volumes and costs, some aspects of which FCX may not be able to control. Further, FCX may make changesto its business plans that could affect its results. FCX cautions investors that it does not intend to update forward-looking statements more frequently than quarterly notwithstanding any changesin its assumptions, changes in business plans, actual experience or other changes, and FCX undertakes no obligation to update any forward-looking statements.
This press release also contains certain financial measures such as unit net cash costs per pound of copper and molybdenum, which are not recognized under U.S. generallyaccepted accounting principles. As required by SEC Regulation G, reconciliations of these measures to amounts reported in FCX's consolidated financial statements are in the supplementalschedules of this press release, which are also available on FCX's website, "fcx.com."
Freeport-McMoRan 12

FREEPORT-McMoRan INC.SELECTED OPERATING DATA
Three Months Ended December 31, 2017 2016 2017 2016
MINING OPERATIONS: Production Sales
COPPER (millions of recoverable pounds)
(FCX's net interest in %)
North America
Morenci (72%) a 183 190 176 188
Bagdad (100%) 45 38 42 39
Safford (100%) 34 57 34 56
Sierrita (100%) 39 40 37 39
Miami (100%) 5 5 4 6
Chino (100%) 47 69 47 69
Tyrone (100%) 14 20 14 18
Other (100%) — 1 — 1
Total North America 367 420 354 416
South America
Cerro Verde (53.56%) 256 293 259 307
El Abra (51%) 47 49 53 52
Total South America 303 342 312 359
Indonesia
Grasberg (90.64%) b 337 369 351 352
Consolidated - continuing operations 1,007 1,131 1,017 c 1,127 c
Discontinued operations - Tenke Fungurume (Tenke) (56%) d — 69 — 59
Total 1,007 1,200 1,017 1,186
Less noncontrolling interests 173 225 179 227
Net 834 975 838 959
Average realized price per pound (continuing operations) $ 3.21 $ 2.48 GOLD (thousands of recoverable ounces)
(FCX's net interest in %)
North America (100%) 5 6 9 4
Indonesia (90.64%) b 562 424 584 401
Consolidated 567 430 593 405
Less noncontrolling interests 52 40 55 38
Net 515 390 538 367
Average realized price per ounce $ 1,285 $ 1,174 MOLYBDENUM (millions of recoverable pounds)
(FCX's net interest in %)
Henderson (100%) 3 3 N/A N/A
Climax (100%) 5 4 N/A N/A
North America copper mines (100%) a 8 8 N/A N/A
Cerro Verde (53.56%) 6 7 N/A N/A
Consolidated 22 22 24 22
Less noncontrolling interests 3 3 3 2
Net 19 19 21 20
Average realized price per pound $ 9.79 $ 8.27 U.S. OIL AND GAS OPERATIONS e : Sales Volumes Sales per Day
Oil (thousand barrels, or MBbls) 407 8,273 4 90 Natural gas (million cubic feet or MMcf) 2,418 12,852 26 140 Natural gas liquids (NGLs) (MBbls) 21 76 — 1 Thousand barrels of oil equivalents (MBOE) 831 10,492 9 114
a. Amounts are net of Morenci's undivided joint venture partners' interest.

b. Amounts are net of Grasberg's joint venture partner's interest, which varies in accordance with the terms of the joint venture agreement. c. Consolidated sales volumes exclude purchased copper of 78 million pounds in fourth-quarter 2017 and 57 million pounds in fourth-quarter 2016. d. On November 16, 2016, FCX completed the sale of its interest in the Tenke mine. e. During 2016, FCX completed the sales of a majority of its oil and gas properties.
I

FREEPORT-McMoRan INC.SELECTED OPERATING DATA (continued)
Years Ended December 31, 2017 2016 2017 2016
MINING OPERATIONS: Production Sales
Copper (millions of recoverable pounds)
(FCX's net interest in %)
North America
Morenci (72%) a 737 848 713 855
Bagdad (100%) 173 177 164 180
Safford (100%) 150 230 154 229
Sierrita (100%) 160 162 154 162
Miami (100%) 19 25 18 27
Chino (100%) 215 308 217 308
Tyrone (100%) 61 76 61 75
Other (100%) 3 5 3 5
Total North America 1,518 1,831 1,484 1,841
South America
Cerro Verde (53.56%) 1,062 1,108 1,062 1,105
El Abra (51%) 173 220 173 227
Total South America 1,235 1,328 1,235 1,332
Indonesia
Grasberg (90.64%) b 984 1,063 981 1,054
Consolidated - continuing operations 3,737 4,222 3,700 c 4,227 c Discontinued operations - Tenke (56%) d
— 425 — 424
Total 3,737 4,647 3,700 4,651
Less noncontrolling interests 670 909 670 910
Net 3,067 3,738 3,030 3,741
Average realized price per pound (continuing operations) $ 2.93 $ 2.28 Gold (thousands of recoverable ounces)
(FCX's net interest in %)
North America (100%) 23 27 22 25
Indonesia (90.64%) b 1,554 1,061 1,540 1,054
Consolidated 1,577 1,088 1,562 1,079
Less noncontrolling interests 145 99 144 99
Net 1,432 989 1,418 980
Average realized price per ounce $ 1,268 $ 1,238 Molybdenum (millions of recoverable pounds)
(FCX's net interest in %)
Henderson (100%) 12 10 N/A N/A
Climax (100%) 20 16 N/A N/A
North America (100%) a 33 33 N/A N/A
Cerro Verde (53.56%) 27 21 N/A N/A
Consolidated 92 80 95 74
Less noncontrolling interests 13 9 12 6
Net 79 71 83 68
Average realized price per pound $ 9.33 $ 8.33 U.S. OIL AND GAS OPERATIONS e : Sales Volumes Sales per Day
Oil (MBbls) 1,797 34,371 5 94 Natural gas (MMcf) 15,767 65,085 43 178 NGLs (MBbls) 207 1,839 1 5 MBOE 4,632 47,058 13 128
a. Amounts are net of Morenci's undivided joint venture partners' interest; effective May 31, 2016, FCX's undivided interest in Morenci was prospectively reduced from 85 percent to 72 percent.
The year 2016 includes approximately 60 million pounds of copper from the 13 percent undivided interest in Morenci that FCX sold in May 2016.

b. Amounts are net of Grasberg's joint venture partner's interest, which varies in accordance with the terms of the joint venture agreement. c. Consolidated sales volumes exclude purchased copper of 273 million pounds for the year 2017 and 188 million pounds for the year 2016.
d. On November 16, 2016, FCX completed the sale of its interest in the Tenke mine. e. During 2016, FCX completed the sales of a majority of its oil and gas properties.
II

FREEPORT-McMoRan INC.SELECTED OPERATING DATA (continued)
Three Months Ended December 31, Years Ended December 31, 2017 2016 2017 2016
100% North America Copper Mines
Solution Extraction/Electrowinning (SX/EW) Operations
Leach ore placed in stockpiles (metric tons per day) 664,900 663,700 679,000 737,400
Average copper ore grade (percent) 0.27 0.30 0.28 0.31
Copper production (millions of recoverable pounds) 282 303 1,121 1,224 Mill Operations
Ore milled (metric tons per day) 297,800 302,300 299,500 300,500
Average ore grades (percent):
Copper 0.37 0.44 0.39 0.47
Molybdenum 0.02 0.03 0.03 0.03
Copper recovery rate (percent) 85.9 83.0 86.4 85.5
Production (millions of recoverable pounds):
Copper 156 193 683 854
Molybdenum 9 10 36 37 100% South America Mining
SX/EW Operations
Leach ore placed in stockpiles (metric tons per day) 160,600 128,200 142,800 149,100
Average copper ore grade (percent) 0.36 0.43 0.37 0.41
Copper production (millions of recoverable pounds) 65 78 255 328 Mill Operations
Ore milled (metric tons per day) 374,200 366,500 360,100 353,400
Average ore grades (percent):
Copper 0.43 0.43 0.44 0.43
Molybdenum 0.01 0.02 0.02 0.02
Copper recovery rate (percent) 76.7 85.1 81.2 85.8
Production (millions of recoverable pounds):
Copper 238 264 980 1,000
Molybdenum 6 7 27 21 100% Indonesia Mining
Ore milled (metric tons per day): a
Grasberg open pit 133,200 126,900 101,800 119,700
Deep Ore Zone underground mine 36,700 36,000 31,200 38,000
Deep Mill Level Zone (DMLZ) underground mine b 3,700 2,500 3,200 4,400
Grasberg Block Cave underground mine b 3,800 3,000 3,600 2,700
Big Gossan underground mine b 700 1,500 600 900
Total 178,100 169,900 140,400 165,700
Average ore grades:
Copper (percent) 1.03 1.08 1.01 0.91
Gold (grams per metric ton) 1.28 0.97 1.15 0.68
Recovery rates (percent):
Copper 91.8 92.0 91.6 91.0
Gold 85.2 83.7 85.0 82.2
Production (recoverable):
Copper (millions of pounds) 326 327 996 1,063
Gold (thousands of ounces) 562 397 1,554 1,061 100% Molybdenum Mines
Ore milled (metric tons per day) 22,300 20,000 22,500 18,300
Average molybdenum ore grade (percent) 0.19 0.18 0.20 0.21
Molybdenum production (millions of recoverable pounds) 8 7 32 26 a. Amounts represent the approximate average daily throughput processed at PT Freeport Indonesia's (PT-FI) mill facilities from each producing mine and from development activities that
result in metal production. b. Targeted production rates once the DMLZ underground mine reaches full capacity are expected to approximate 80,000 metric tons of ore per day in 2021; production from the Grasberg
Block Cave underground mine is expected to commence in the first half of 2019, and production from the Big Gossan underground mine restarted in fourth-quarter 2017.

III

FREEPORT-McMoRan INC.CONSOLIDATED STATEMENTS OF OPERATIONS (Unaudited)
Three Months Ended Years Ended December 31, December 31, 2017 2016 2017 2016 (In Millions, Except Per Share Amounts) Revenues a $ 5,041 $ 4,377 $ 16,403 $ 14,830 Cost of sales:
Production and delivery 2,811 b 2,740 b 10,300 b,c 10,697b
Depreciation, depletion and amortization 457 593 1,714 2,530
Metals inventory adjustments — 9 b 8 b 36b
Impairment of oil and gas properties — — — 4,317 Total cost of sales 3,268 3,342 12,022 17,580
Selling, general and administrative expenses 118 199 b 484 b 607b
Mining exploration and research expenses 33 18 94 64 Environmental obligations and shutdown costs d 170 2 251 20 Net (gain) loss on sales of assets (15) 113 (81) (649)
Total costs and expenses 3,574 3,674 12,770 17,622 Operating income (loss) 1,467 703 3,633 (2,792) Interest expense, net e (168) (181) (801) c (755) Net gain (loss) on early extinguishment and exchanges of debt 13 (25) 21 26 Other income (expense), net 13 (5) 49 49 Income (loss) from continuing operations before income taxes and equity in affiliated
companies' net earnings 1,325 492 2,902 (3,472) Provision for income taxes f (136) (292) (883) c (371) Equity in affiliated companies' net earnings 4 2 10 11 Net income (loss) from continuing operations 1,193 202 2,029 (3,832) Net income (loss) from discontinued operations g 16 (2) 66 (193) Net income (loss) 1,209 200 2,095 (4,025) Net income attributable to noncontrolling interests:
Continuing operations (168) (81) (274) c (227) Discontinued operations — (19) (4) (63)
Gain on redemption and preferred dividends attributable to redeemable noncontrollinginterest — 192 — 161
Net income (loss) attributable to FCX common stock h $ 1,041 $ 292 $ 1,817 $ (4,154)
Diluted net income (loss) per share attributable to common stock:
Continuing operations $ 0.70 $ 0.22 $ 1.21 $ (2.96) Discontinued operations 0.01 (0.01) 0.04 (0.20)
$ 0.71 $ 0.21 $ 1.25 $ (3.16)
Weighted-average common shares outstanding:
Basic 1,448 1,403 1,447 1,318
Diluted 1,455 1,410 1,454 1,318
a. Revenues include adjustments to provisionally priced concentrate and cathode copper sales recognized in prior periods, which are summarized in the supplemental schedule, "Derivative
Instruments," on page IX . The fourth quarter and year 2016 also include net noncash mark-to-market losses associated with oil derivative contracts, which are summarized in thesupplemental schedule, “Adjusted Net Income,” on page VII .
b. Includes net charges at mining and oil and gas operations, which are summarized in the supplemental schedule, “Adjusted Net Income,” on page VII .c. Includes net charges of $186 million associated with disputed Cerro Verde royalties for prior years, consisting of $203 million to production and delivery costs, $145 million to interest
expense and $7 million to provision for income taxes, net of $169 million to noncontrolling interests.d. The increase in the fourth quarter and year 2017, compared to the 2016 periods, primarily reflects adjustments to environmental obligations resulting from revised cost estimates.e. Consolidated interest costs (before capitalization and excluding interest expense associated with disputed Cerro Verde royalties) totaled $194 million in fourth-quarter 2017 , $207 million in
fourth-quarter 2016 , $777 million for the year 2017 and $854 million for the year 2016 .f. Refer to the supplemental schedule, "Income Taxes," on page VIII for a summary of FCX's provision for income taxes.g. Refer to the supplemental schedule, “Adjusted Net Income,” on page VII for a summary of gains (losses) from discontinued operations.h. FCX defers recognizing profits on intercompany sales until final sales to third parties occur. Refer to the supplemental schedule, "Deferred Profits," on page IX for a summary of net impacts
from changes in these deferrals.
IV

FREEPORT-McMoRan INC.CONSOLIDATED BALANCE SHEETS (Unaudited)
December 31, 2017 2016 (In Millions) ASSETS Current assets:
Cash and cash equivalents $ 4,447 $ 4,245 Trade accounts receivable 1,246 1,126 Income and other tax receivables 325 879 Inventories:
Mill and leach stockpiles 1,422 1,338 Materials and supplies, net 1,305 1,306 Product 1,166 998
Other current assets 270 199 Held for sale 598 344
Total current assets 10,779 10,435 Property, plant, equipment and mine development costs, net 22,836 23,219 Oil and gas properties, subject to amortization, less accumulated amortization and impairments 8 74 Long-term mill and leach stockpiles 1,409 1,633 Other assets 2,270 1,956 Total assets $ 37,302 $ 37,317
LIABILITIES AND EQUITY Current liabilities:
Accounts payable and accrued liabilities $ 2,321 $ 2,393 Current portion of debt 1,414 1,232 Accrued income taxes 565 66 Current portion of environmental and asset retirement obligations 388 369 Held for sale 350 205
Total current liabilities 5,038 4,265 Long-term debt, less current portion 11,703 14,795 Deferred income taxes 3,622 3,768 Environmental and asset retirement obligations, less current portion 3,631 3,487 Other liabilities 2,012 1,745
Total liabilities 26,006 28,060 Equity:
Stockholders' equity: Common stock 158 157 Capital in excess of par value 26,751 26,690 Accumulated deficit (14,722) (16,540) Accumulated other comprehensive loss (487) (548) Common stock held in treasury (3,723) (3,708)
Total stockholders' equity 7,977 6,051 Noncontrolling interests 3,319 3,206
Total equity 11,296 9,257 Total liabilities and equity $ 37,302 $ 37,317
V

FREEPORT-McMoRan INC.CONSOLIDATED STATEMENTS OF CASH FLOWS (Unaudited)
Years Ended December 31, 2017 2016 (In Millions) Cash flow from operating activities:
Net income (loss) $ 2,095 $ (4,025) Adjustments to reconcile net income (loss) to net cash provided by operating activities:
Depreciation, depletion and amortization 1,714 2,610 U.S. tax reform benefit (393) — Net charges for Cerro Verde royalty dispute 355 — Payments for Cerro Verde royalty dispute (53) (30) Impairment of oil and gas properties — 4,317 Oil and gas non-cash drillship settlement costs and other adjustments (33) 803 Net gain on sales of assets (81) (649) Stock-based compensation 71 86 Net charges for environmental and asset retirement obligations, including accretion 383 191 Payments for environmental and asset retirement obligations (131) (242) Net charges for defined pension and postretirement plans 120 113 Pension plan contributions (174) (57) Net gain on early extinguishment and exchanges of debt (21) (26) Deferred income taxes 76 239 (Gain) loss on disposal of discontinued operations (57) 198
Decrease in long-term mill and leach stockpiles 224 10 Oil and gas contract settlement payments (70) — Other, net 68 104 Changes in working capital and tax payments, excluding disposition amounts:
Accounts receivable 427 (175) Inventories (393) 117 Other current assets (28) 37 Accounts payable and accrued liabilities 110 (28) Accrued income taxes and timing of other tax payments 473 136
Net cash provided by operating activities 4,682 3,729 Cash flow from investing activities:
Capital expenditures: North America copper mines (167) (102) South America (115) (382) Indonesia (875) (1,025) Molybdenum mines (5) (2) Other, including oil and gas operations (248) (1,302)
Proceeds from sales of: Interest in TF Holdings Limited — 2,664 Deepwater GOM and onshore California oil and gas properties — 2,272 Additional interest in Morenci — 996 Other assets 72 423
Other, net (25) 8 Net cash (used in) provided by investing activities (1,363) 3,550
Cash flow from financing activities:
Proceeds from debt 955 3,681 Repayments of debt (3,812) (7,625) Net proceeds from sale of common stock — 1,515 Cash dividends paid:
Common stock (2) (6) Noncontrolling interests (174) (693)
Stock-based awards net payments (10) (6) Debt financing costs and other, net (12) (32)

Net cash used in financing activities (3,055) (3,166) Net increase in cash and cash equivalents 264 4,113 Increase in cash and cash equivalents in assets held for sale (62) (45) Cash and cash equivalents at beginning of year 4,245 177 Cash and cash equivalents at end of year $ 4,447 $ 4,245
VI

FREEPORT-McMoRan INC.ADJUSTED NET INCOME
Adjusted net income is intended to provide investors and others with information about FCX's recurring operating performance. This information differsfrom net income (loss) attributable to common stock determined in accordance with U.S. generally accepted accounting principles (GAAP) and should not beconsidered in isolation or as a substitute for measures of performance determined in accordance with U.S. GAAP. FCX's adjusted net income follows, which maynot be comparable to similarly titled measures reported by other companies (in millions, except per share amounts).
Three Months Ended December 31, 2017 2016 Pre-tax After-tax a Per Share Pre-tax After-tax a Per Share Net income attributable to common stock N/A $ 1,041 $ 0.71 N/A $ 292 $ 0.21 Net mining charges (21)
b (18) (0.01) (25) (15) (0.01)
Oil and gas restructuring and other net credits (costs) 5 5 — (39)c (39) (0.02)
Oil and gas idle rig costs/drillship settlements — — — (103) (103) (0.07) Net noncash mark-to-market losses on oil derivative contracts — — — (41) (41) (0.03) Net adjustments to environmental obligations and related litigation reserves (157) (157) (0.11) 5 5 — Net gain (loss) on sales of assets 15 15 0.01 (113) (108) (0.08) Net gain (loss) on early extinguishment and exchanges of debt 13 13 0.01 (25) (25) (0.02) Net tax credits d N/A 417 0.29 N/A 84 0.06
Gain (loss) on discontinued operations 16e 16 0.01 (16) (16) (0.01)
Gain on redemption of redeemable noncontrolling interest — — — 199 199 0.14 $ (129) $ 291 $ 0.20 $ (158) $ (59) $ (0.04) Adjusted net income attributable to common stock N/A $ 750 $ 0.51 N/A $ 351 $ 0.25
Years Ended December 31, 2017 2016 Pre-tax After-tax a Per Share Pre-tax After-tax a Per Share Net income (loss) attributable to common stock N/A $ 1,817 $ 1.25 N/A $ (4,154) $ (3.16) Cerro Verde royalty dispute f $ (348) $ (186) $ (0.13) $ — $ — $ —
PT-FI net charges for workforce reductions (125)g (66) (0.04) — — —
Metals inventory adjustments and other net mining charges (46) (40) (0.03) (69) (50) (0.04)
Oil and gas inventory adjustments, asset impairment and other net charges (11)c (11) (0.01) (196)
c (196) (0.14)
Oil and gas drillship settlements/idle rig credits (costs) 24 24 0.02 (926) (926) (0.70) Impairment of oil and gas properties — — — (4,317) (4,317) (3.28) Net noncash mark-to-market losses on oil derivative contracts — — — (41) (41) (0.03) Net adjustments to environmental obligations and related litigation reserves (210) (210) (0.14) 16 16 0.01 Net gain on sales of assets 81 81 0.06 649 649 0.49 Net gain on early extinguishment and exchanges of debt 21 21 0.01 26 26 0.02 Net tax credits d N/A 438 0.30 N/A 374 0.28
Gain (loss) on discontinued operations 70e 62 0.04 (198) (198) (0.15)
Gain on redemption of redeemable noncontrolling interest — — — 199 199 0.15 $ (544) $ 113 $ 0.08 $ (4,857) $ (4,464) $ (3.39) Adjusted net income attributable to common stock N/A $ 1,704 $ 1.17 N/A $ 310 $ 0.23 a. Reflects impact to FCX net income (loss) attributable to common stock (i.e., net of any taxes and noncontrolling interests).b. Primarily reflects net charges at Cerro Verde for tax related matters, including $11 million to production and delivery costs and $8 million to interest expense.c. Includes net charges in selling, general and administrative expenses totaling $17 million for the year 2017 for contract termination costs and $47 million in fourth-quarter 2016 and $85 million
for the year 2016 for restructuring.d. Refer to “Income Taxes,” on page VIII , for further discussion of net tax credits.e. Primarily reflects adjustments to the estimated fair value of the potential $120 million in contingent consideration related to the 2016 sale of FCX’s interest in TFHL, which totaled $74 million
at December 31, 2017, and will continue to be adjusted through December 31, 2019.f. Refer to “Consolidated Statements of Operations,” on page IV for a summary of these amounts.g. Includes net charges in selling, general and administrative expenses totaling $5 million .
VII
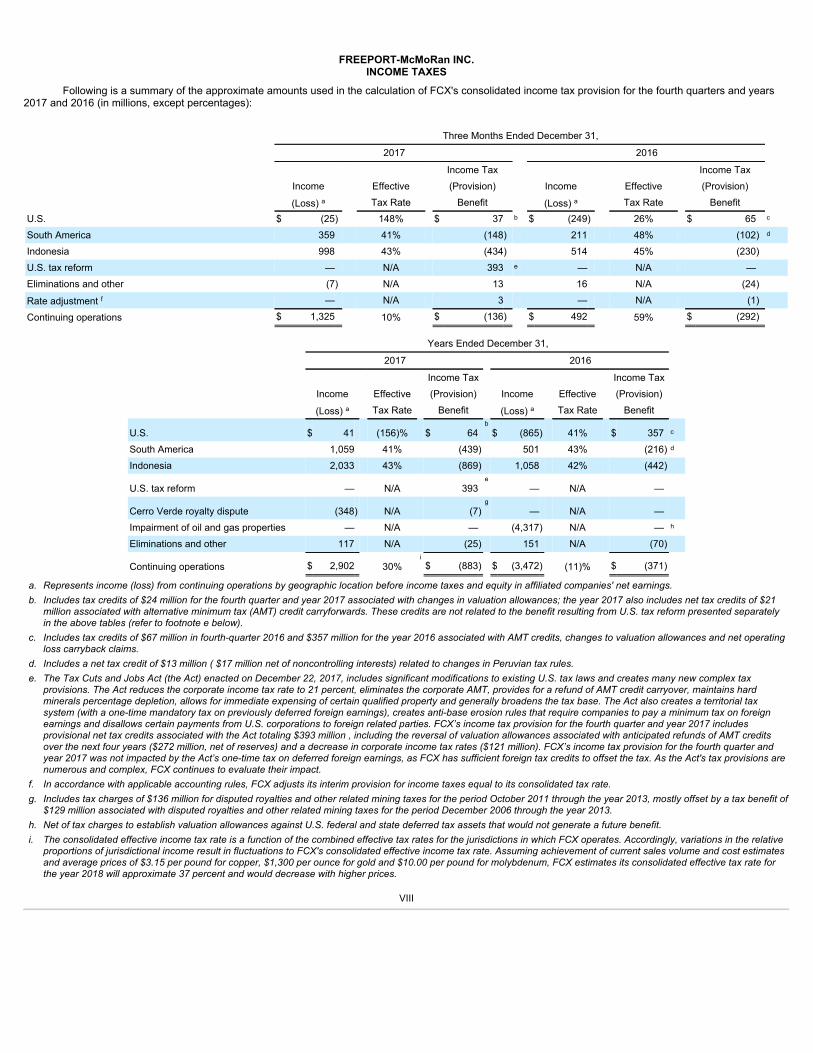
FREEPORT-McMoRan INC.INCOME TAXES
Following is a summary of the approximate amounts used in the calculation of FCX's consolidated income tax provision for the fourth quarters and years2017 and 2016 (in millions, except percentages):
Three Months Ended December 31, 2017 2016 Income Tax Income Tax Income Effective (Provision) Income Effective (Provision) (Loss) a Tax Rate Benefit (Loss) a Tax Rate Benefit U.S. $ (25) 148% $ 37 b $ (249) 26% $ 65 c South America 359 41% (148) 211 48% (102) d Indonesia 998 43% (434) 514 45% (230) U.S. tax reform — N/A 393 e — N/A — Eliminations and other (7) N/A 13 16 N/A (24) Rate adjustment f — N/A 3 — N/A (1) Continuing operations $ 1,325 10% $ (136) $ 492 59% $ (292)
Years Ended December 31, 2017 2016 Income Tax Income Tax Income Effective (Provision) Income Effective (Provision) (Loss) a Tax Rate Benefit (Loss) a Tax Rate Benefit
U.S. $ 41 (156)% $ 64b $ (865) 41% $ 357 c
South America 1,059 41% (439) 501 43% (216) d Indonesia 2,033 43% (869) 1,058 42% (442)
U.S. tax reform — N/A 393e — N/A —
Cerro Verde royalty dispute (348) N/A (7)g — N/A —
Impairment of oil and gas properties — N/A — (4,317) N/A — h Eliminations and other 117 N/A (25) 151 N/A (70)
Continuing operations $ 2,902 30%i $ (883) $ (3,472) (11)% $ (371)
a. Represents income (loss) from continuing operations by geographic location before income taxes and equity in affiliated companies' net earnings.b. Includes tax credits of $24 million for the fourth quarter and year 2017 associated with changes in valuation allowances; the year 2017 also includes net tax credits of $21
million associated with alternative minimum tax (AMT) credit carryforwards. These credits are not related to the benefit resulting from U.S. tax reform presented separatelyin the above tables (refer to footnote e below).
c. Includes tax credits of $67 million in fourth-quarter 2016 and $357 million for the year 2016 associated with AMT credits, changes to valuation allowances and net operatingloss carryback claims.
d. Includes a net tax credit of $13 million ( $17 million net of noncontrolling interests) related to changes in Peruvian tax rules.e. The Tax Cuts and Jobs Act (the Act) enacted on December 22, 2017, includes significant modifications to existing U.S. tax laws and creates many new complex tax
provisions. The Act reduces the corporate income tax rate to 21 percent, eliminates the corporate AMT, provides for a refund of AMT credit carryover, maintains hardminerals percentage depletion, allows for immediate expensing of certain qualified property and generally broadens the tax base. The Act also creates a territorial taxsystem (with a one-time mandatory tax on previously deferred foreign earnings), creates anti-base erosion rules that require companies to pay a minimum tax on foreignearnings and disallows certain payments from U.S. corporations to foreign related parties. FCX’s income tax provision for the fourth quarter and year 2017 includesprovisional net tax credits associated with the Act totaling $393 million , including the reversal of valuation allowances associated with anticipated refunds of AMT creditsover the next four years ($272 million, net of reserves) and a decrease in corporate income tax rates ($121 million). FCX’s income tax provision for the fourth quarter andyear 2017 was not impacted by the Act’s one-time tax on deferred foreign earnings, as FCX has sufficient foreign tax credits to offset the tax. As the Act's tax provisions arenumerous and complex, FCX continues to evaluate their impact.
f. In accordance with applicable accounting rules, FCX adjusts its interim provision for income taxes equal to its consolidated tax rate.g. Includes tax charges of $136 million for disputed royalties and other related mining taxes for the period October 2011 through the year 2013, mostly offset by a tax benefit of
$129 million associated with disputed royalties and other related mining taxes for the period December 2006 through the year 2013.h. Net of tax charges to establish valuation allowances against U.S. federal and state deferred tax assets that would not generate a future benefit.i. The consolidated effective income tax rate is a function of the combined effective tax rates for the jurisdictions in which FCX operates. Accordingly, variations in the relative
proportions of jurisdictional income result in fluctuations to FCX's consolidated effective income tax rate. Assuming achievement of current sales volume and cost estimatesand average prices of $3.15 per pound for copper, $1,300 per ounce for gold and $10.00 per pound for molybdenum, FCX estimates its consolidated effective tax rate forthe year 2018 will approximate 37 percent and would decrease with higher prices.
VIII

FREEPORT-McMoRan INC.DERIVATIVE INSTRUMENTS
For the year 2017 , FCX's mined copper was sold 59 percent in concentrate, 19 percent as cathode and 22 percent as rod from North America operations.Under the long-established structure of sales agreements prevalent in the industry, copper contained in concentrates and cathodes is provisionally priced at thetime of shipment. The provisional prices are finalized in a contractually specified future month (generally one to four months from the shipment date) primarilybased on quoted monthly average spot copper prices on the London Metal Exchange (LME). Because a significant portion of FCX's copper concentrate andcathode sales in any quarterly period usually remain subject to final pricing, the quarter-end forward price is a major determinant of recorded revenues and theaverage recorded copper price for the period. LME spot copper prices averaged $3.09 per pound during fourth-quarter 2017 , compared to FCX's average realizedprice of $3.21 per pound. Following is a summary of the favorable adjustments to prior periods' provisionally priced copper sales for the fourth quarters and years2017 and 2016 (in millions, except per share amounts):
Three Months Ended December 31, Years Ended December 31, 2017 2016 2017 2016Revenues $ 104 $ 129 $ 81 $ 5Net income attributable to common stock $ 42 $ 57 $ 34 $ 2Net income per share of common stock $ 0.03 $ 0.04 $ 0.02 $ —
At December 31, 2017 , FCX had provisionally priced copper sales at its copper mining operations totaling 438 million pounds of copper (net ofintercompany sales and noncontrolling interests) recorded at an average of $3.28 per pound, subject to final pricing over the next several months. FCX estimatesthat each $0.05 change in the price realized from the December 31, 2017 , provisional price recorded would have an approximate $13 million effect on 2018 netincome attributable to common stock. The LME spot copper price closed at $3.23 per pound on January 24, 2018 .
DEFERRED PROFITSFCX defers recognizing profits on sales from its mining operations to Atlantic Copper and on 25 percent of PT-FI's sales to PT Smelting (PT-FI's 25
percent-owned Indonesian smelting unit) until final sales to third parties occur. Changes in these deferrals attributable to variability in intercompany volumesresulted in net reductions to net income attributable to common stock totaling $21 million in fourth-quarter 2017 , $15 million in fourth-quarter 2016 , $21 million forthe year 2017 and $8 million for the year 2016 . FCX's net deferred profits on its inventories at Atlantic Copper and PT Smelting to be recognized in future periods'net income attributable to common stock totaled $96 million at December 31, 2017 . Quarterly variations in ore grades, the timing of intercompany shipments andchanges in product prices will result in variability in FCX's net deferred profits and quarterly earnings.
BUSINESS SEGMENTSFCX has organized its mining operations into four primary divisions – North America copper mines, South America mining, Indonesia mining and
Molybdenum mines, and operating segments that meet certain thresholds are reportable segments. Separately disclosed in the following tables are FCX'sreportable segments, which include the Morenci, Cerro Verde and Grasberg (Indonesia Mining) copper mines, the Rod & Refining operations and Atlantic CopperSmelting & Refining.
FCX’s reportable segments previously included U.S. Oil & Gas operations. During 2016, FCX completed the sales of its Deepwater Gulf of Mexico,onshore California and Haynesville oil and gas properties. As a result, beginning in 2017, the U.S. oil and gas operations no longer qualify as a reportable segment,and oil and gas results for all periods presented have been included in Corporate, Other & Eliminations in the following tables.
Intersegment sales between FCX’s business segments are based on terms similar to arms-length transactions with third parties at the time of the sale.Intersegment sales may not be reflective of the actual prices ultimately realized because of a variety of factors, including additional processing, the timing of salesto unaffiliated customers and transportation premiums.
FCX allocates certain operating costs, expenses and capital expenditures to its operating divisions and individual segments. However, not all costs andexpenses applicable to an operation are allocated. U.S. federal and state income taxes are recorded and managed at the corporate level (included in Corporate,Other & Eliminations), whereas foreign income taxes are recorded and managed at the applicable country level. In addition, most mining exploration and researchactivities are managed on a consolidated basis, and those costs along with some selling, general and administrative costs, are not allocated to the operatingdivisions or individual segments. Accordingly, the following segment information reflects management determinations that may not be indicative of what the actualfinancial performance of each operating division or segment would be if it was an independent entity.
IX

FREEPORT-McMoRan INC.BUSINESS SEGMENTS (continued)
(In millions) Atlantic Corporate, North America Copper Mines South America Mining Copper Other Other Cerro Other Indonesia Molybdenum Rod & Smelting & Elimi- FCX Morenci Mines Total Verde Mines Total Mining Mines Refining & Refining nations a Total Three Months Ended December 31,2017
Revenues:
Unaffiliated customers $ 60 $ 58 $ 118 $ 754 $ 166 $ 920 $ 1,725b $ — $ 1,166 $ 619 $ 493 c $ 5,041
Intersegment 511 588 1,099 148 — 148 — 69 4 — (1,320) —
Production and delivery 280 433 713 428 121 549 510 61 1,171 597 (790) 2,811
Depreciation, depletion and amortization 40 55 95 109 24 133 184 18 3 7 17 457 Selling, general and administrativeexpenses — — — 2 — 2 34 — — 5 77 118
Mining exploration and research expenses — — — — — — — — — — 33 33 Environmental obligations and shutdowncosts — — — — — — — — — — 170 170
Net gain on sales of assets — — — — — — — — — — (15) (15)
Operating income (loss) 251 158 409 363 21 384 997 (10) (4) 10 (319) 1,467 Interest expense, net 1 — 1 25 — 25 3 — — 5 134 168
Provision for (benefit from) income taxes — — — 148 — 148 434 — — 1 (447) d 136
Total assets at December 31, 2017 2,861 4,241 7,102 8,878 1,702 10,580 10,911 1,858 277 822 5,752 e 37,302
Capital expenditures 36 25 61 43 7 50 212 1 1 11 54 390 Three Months Ended December 31, 2016
Revenues:
Unaffiliated customers $ 88 $ 29 $ 117 $ 756 $ 131 $ 887 $ 1,219b $ — $ 1,013 $ 465 $ 676 c $ 4,377
Intersegment 392 585 977 32 — 32 3 50 7 2 (1,071) —
Production and delivery 256 429 685 424 94 518 566 52 1,016 437 (534) f 2,740
Depreciation, depletion and amortization 47 76 123 124 27 151 100 17 3 7 192 593 Metals inventory adjustments
— (5) (5) — — — — 3 — — 11 9 Selling, general and administrativeexpenses — 1 1 3 — 3 30 — — 4 161 f 199
Mining exploration and research expenses — 1 1 — — — — — — — 17 18 Environmental obligations and shutdowncosts — — — — — — — — — — 2 2
Net loss on sale of assets — — — — — — — — — — 113 113
Operating income (loss) 177 112 289 237 10 247 526 (22) 1 19 (357) 703 Interest expense, net 1 — 1 19 — 19 — — — 4 157 181
Provision for (benefit from) income taxes — — — 96 6 102 230 — — 4 (44) 292
Total assets at December 31, 2016 2,863 4,448 7,311 9,076 1,533 10,609 10,493 1,934 220 658 6,092 e 37,317
Capital expenditures 6 9 15 50 — 50 319 — — 5 115 504 a. Includes U.S. oil and gas operations, which were previously a reportable segment.b. Includes PT-FI's sales to PT Smelting totaling $577 million in fourth-quarter 2017 and $490 million in fourth-quarter 2016 .c. Includes revenues from FCX's molybdenum sales company, which includes sales of molybdenum produced by the Molybdenum mines and certain of the North America and South America copper mines.d. Includes provisional tax credits totaling $393 million related to U.S. tax reform, primarily for the reversal of valuation allowances associated with the anticipated refund of AMT credits and a decrease in
corporate income tax rates. Refer to “Income Taxes,” on page VIII , for further discussion.e. Includes (i) assets held for sale totaling $598 million at December 31, 2017 , and $344 million at December 31, 2016 , primarily associated with Freeport Cobalt and the Kisanfu exploration project and (ii)
assets associated with oil and gas operations totaling $271 million at December 31, 2017 , and $467 million at December 31, 2016 .f. Includes net charges for oil and gas operations totaling $95 million in production and delivery costs, primarily for idle rig and contract termination costs, inventory adjustments, asset impairments and other net
charges, and $47 million in selling, general and administrative expenses for net restructuring charges.
X
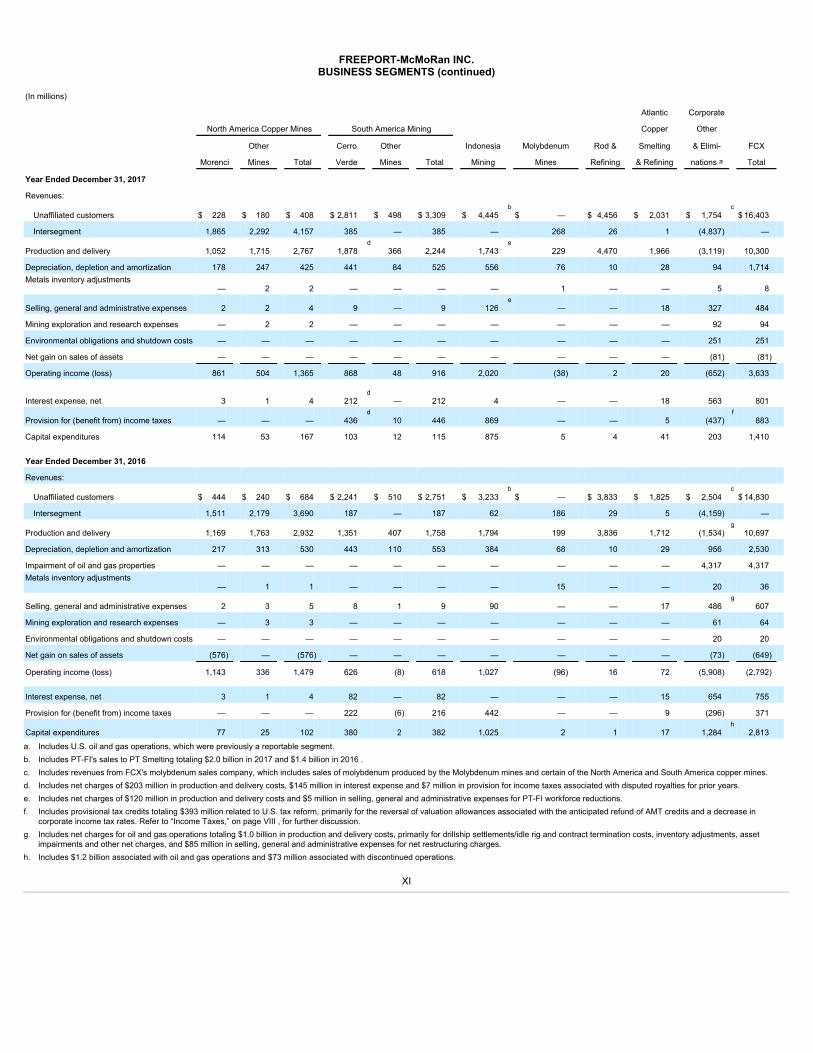
FREEPORT-McMoRan INC.BUSINESS SEGMENTS (continued)
(In millions) Atlantic Corporate North America Copper Mines South America Mining Copper Other Other Cerro Other Indonesia Molybdenum Rod & Smelting & Elimi- FCX Morenci Mines Total Verde Mines Total Mining Mines Refining & Refining nations a Total
Year Ended December 31, 2017
Revenues:
Unaffiliated customers $ 228 $ 180 $ 408 $ 2,811 $ 498 $ 3,309 $ 4,445b $ — $ 4,456 $ 2,031 $ 1,754
c $ 16,403
Intersegment 1,865 2,292 4,157 385 — 385 — 268 26 1 (4,837) —
Production and delivery 1,052 1,715 2,767 1,878d 366 2,244 1,743
e 229 4,470 1,966 (3,119) 10,300
Depreciation, depletion and amortization 178 247 425 441 84 525 556 76 10 28 94 1,714 Metals inventory adjustments
— 2 2 — — — — 1 — — 5 8
Selling, general and administrative expenses 2 2 4 9 — 9 126e — — 18 327 484
Mining exploration and research expenses — 2 2 — — — — — — — 92 94
Environmental obligations and shutdown costs — — — — — — — — — — 251 251
Net gain on sales of assets — — — — — — — — — — (81) (81)
Operating income (loss) 861 504 1,365 868 48 916 2,020 (38) 2 20 (652) 3,633 Interest expense, net 3 1 4 212
d — 212 4 — — 18 563 801
Provision for (benefit from) income taxes — — — 436d 10 446 869 — — 5 (437)
f 883
Capital expenditures 114 53 167 103 12 115 875 5 4 41 203 1,410 Year Ended December 31, 2016
Revenues:
Unaffiliated customers $ 444 $ 240 $ 684 $ 2,241 $ 510 $ 2,751 $ 3,233b $ — $ 3,833 $ 1,825 $ 2,504
c $ 14,830
Intersegment 1,511 2,179 3,690 187 — 187 62 186 29 5 (4,159) —
Production and delivery 1,169 1,763 2,932 1,351 407 1,758 1,794 199 3,836 1,712 (1,534)g 10,697
Depreciation, depletion and amortization 217 313 530 443 110 553 384 68 10 29 956 2,530
Impairment of oil and gas properties — — — — — — — — — — 4,317 4,317 Metals inventory adjustments
— 1 1 — — — — 15 — — 20 36
Selling, general and administrative expenses 2 3 5 8 1 9 90 — — 17 486g 607
Mining exploration and research expenses — 3 3 — — — — — — — 61 64
Environmental obligations and shutdown costs — — — — — — — — — — 20 20
Net gain on sales of assets (576) — (576) — — — — — — — (73) (649)
Operating income (loss) 1,143 336 1,479 626 (8) 618 1,027 (96) 16 72 (5,908) (2,792) Interest expense, net 3 1 4 82 — 82 — — — 15 654 755
Provision for (benefit from) income taxes — — — 222 (6) 216 442 — — 9 (296) 371
Capital expenditures 77 25 102 380 2 382 1,025 2 1 17 1,284h 2,813
a. Includes U.S. oil and gas operations, which were previously a reportable segment.b. Includes PT-FI's sales to PT Smelting totaling $2.0 billion in 2017 and $1.4 billion in 2016 .c. Includes revenues from FCX's molybdenum sales company, which includes sales of molybdenum produced by the Molybdenum mines and certain of the North America and South America copper mines.d. Includes net charges of $203 million in production and delivery costs, $145 million in interest expense and $7 million in provision for income taxes associated with disputed royalties for prior years.e. Includes net charges of $120 million in production and delivery costs and $5 million in selling, general and administrative expenses for PT-FI workforce reductions.f. Includes provisional tax credits totaling $393 million related to U.S. tax reform, primarily for the reversal of valuation allowances associated with the anticipated refund of AMT credits and a decrease in
corporate income tax rates. Refer to “Income Taxes,” on page VIII , for further discussion.g. Includes net charges for oil and gas operations totaling $1.0 billion in production and delivery costs, primarily for drillship settlements/idle rig and contract termination costs, inventory adjustments, asset
impairments and other net charges, and $85 million in selling, general and administrative expenses for net restructuring charges.h. Includes $1.2 billion associated with oil and gas operations and $73 million associated with discontinued operations.
XI

FREEPORT-McMoRan INC.PRODUCT REVENUES AND PRODUCTION COSTS
Unit net cash (credits) costs per pound of copper and molybdenum are measures intended to provide investors with information about the cash-generating capacityof FCX's mining operations expressed on a basis relating to the primary metal product for the respective operations. FCX uses this measure for the same purposeand for monitoring operating performance by its mining operations. This information differs from measures of performance determined in accordance with U.S.GAAP and should not be considered in isolation or as a substitute for measures of performance determined in accordance with U.S. GAAP. These measures arepresented by other metals mining companies, although FCX's measures may not be comparable to similarly titled measures reported by other companies.
FCX presents gross profit per pound of copper in the following tables using both a “by-product” method and a “co-product” method. FCX uses the by-productmethod in its presentation of gross profit per pound of copper because (i) the majority of its revenues are copper revenues, (ii) it mines ore, which contains copper,gold, molybdenum and other metals, (iii) it is not possible to specifically assign all of FCX's costs to revenues from the copper, gold, molybdenum and other metalsit produces and (iv) it is the method used by FCX's management and Board to monitor FCX's mining operations and to compare mining operations in certainindustry publications. In the co-product method presentations, shared costs are allocated to the different products based on their relative revenue values, which willvary to the extent FCX's metals sales volumes and realized prices change.
FCX shows revenue adjustments for prior period open sales as a separate line item. Because these adjustments do not result from current period sales, theseamounts have been reflected separately from revenues on current period sales. Noncash and other costs, which are removed from site production and deliverycosts in the calculation of unit net cash (credits) costs, consist of items such as stock-based compensation costs, start-up costs, inventory adjustments, long-livedasset impairments, restructuring and/or unusual charges. As discussed above, gold, molybdenum and other metal revenues at copper mines are reflected ascredits against site production and delivery costs in the by-product method. The following schedules are presentations under both the by-product and co-productmethods together with reconciliations to amounts reported in FCX's consolidated financial statements.
XII

FREEPORT-McMoRan INC.PRODUCT REVENUES AND PRODUCTION COSTS (continued)
North America Copper Mines Product Revenues, Production Costs and Unit Net Cash Costs Three Months Ended December 31, 2017
(In millions) By-Product Co-Product Method Method Copper Molybdenum a Other b Total
Revenues, excluding adjustments $ 1,117 $ 1,117 $ 70 $ 28 $ 1,215
Site production and delivery, before net noncash
and other costs shown below 635 589 52 17 658
By-product credits (75) — — — —
Treatment charges 36 34 — 2 36
Net cash costs 596 623 52 19 694
Depreciation, depletion and amortization (DD&A) 94 88 4 2 94
Noncash and other costs, net 22 21 — 1 22
Total costs 712 732 56 22 810
Revenue adjustments, primarily for pricing
on prior period open sales 7 7 — — 7
Gross profit $ 412 $ 392 $ 14 $ 6 $ 412
Copper sales (millions of recoverable pounds) 354 354
Molybdenum sales (millions of recoverable pounds) a 8 Gross profit per pound of copper/molybdenum: Revenues, excluding adjustments $ 3.15 $ 3.15 $ 8.48
Site production and delivery, before net noncash
and other costs shown below 1.79 1.66 6.24
By-product credits (0.21) — —
Treatment charges 0.10 0.10 —
Unit net cash costs 1.68 1.76 6.24
DD&A 0.27 0.25 0.50
Noncash and other costs, net 0.06 0.06 0.10
Total unit costs 2.01 2.07 6.84
Revenue adjustments, primarily for pricing
on prior period open sales 0.02 0.02 —
Gross profit per pound $ 1.16 $ 1.10 $ 1.64
Reconciliation to Amounts Reported
(In millions) Production Revenues and Delivery DD&A
Totals presented above $ 1,215 $ 658 $ 94
Treatment charges (17) 19 —
Noncash and other costs, net — 22 —
Revenue adjustments, primarily for pricing
on prior period open sales 7 — —
Eliminations and other 12 14 1
North America copper mines 1,217 713 95
Other mining c 4,651 2,888 345
Corporate, other & eliminations (827) (790) 17
As reported in FCX's consolidated financial statements $ 5,041 $ 2,811 $ 457
a. Reflects sales of molybdenum produced by certain of the North America copper mines to FCX's molybdenum sales company at market-based pricing.b. Includes gold and silver product revenues and production costs.c. Represents the combined total for FCX's other mining operations, including South America mining, Indonesia mining, Molybdenum mines, Rod & Refining and Atlantic Copper Smelting &
Refining, as presented in the supplemental schedule, "Business Segments," beginning on page IX .
XIII
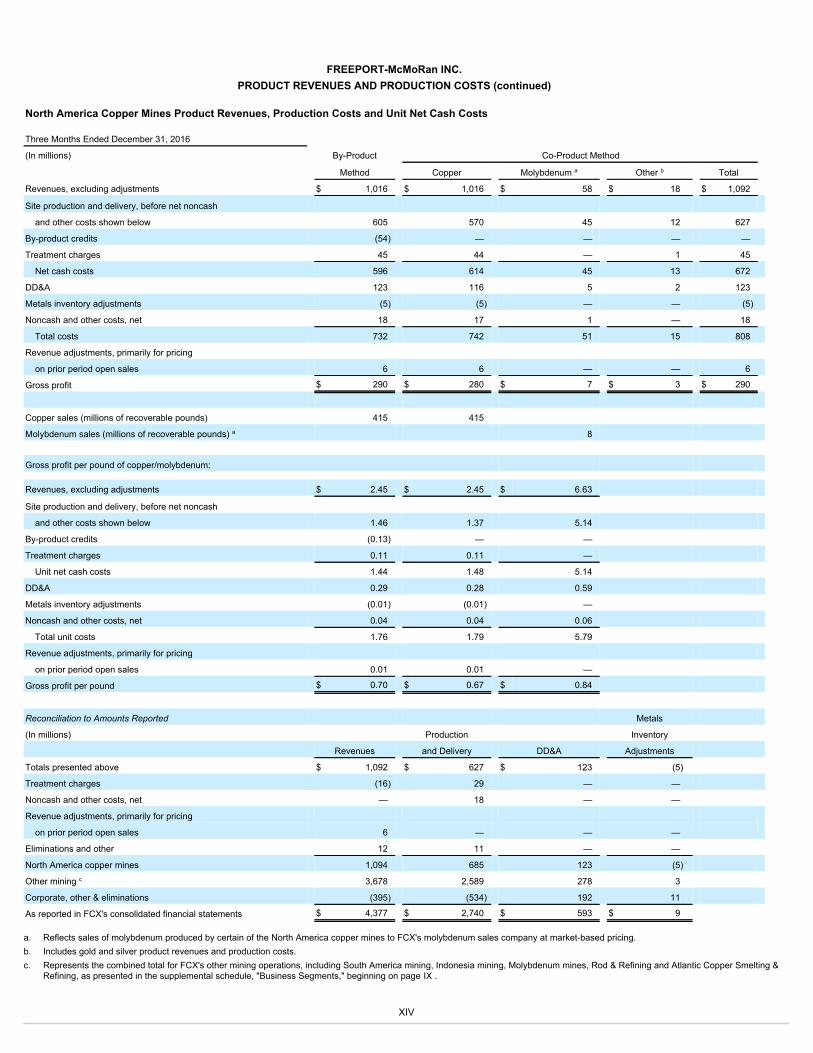
FREEPORT-McMoRan INC.PRODUCT REVENUES AND PRODUCTION COSTS (continued)
North America Copper Mines Product Revenues, Production Costs and Unit Net Cash Costs Three Months Ended December 31, 2016
(In millions) By-Product Co-Product Method Method Copper Molybdenum a Other b Total
Revenues, excluding adjustments $ 1,016 $ 1,016 $ 58 $ 18 $ 1,092
Site production and delivery, before net noncash
and other costs shown below 605 570 45 12 627
By-product credits (54) — — — —
Treatment charges 45 44 — 1 45
Net cash costs 596 614 45 13 672
DD&A 123 116 5 2 123
Metals inventory adjustments (5) (5) — — (5)
Noncash and other costs, net 18 17 1 — 18
Total costs 732 742 51 15 808
Revenue adjustments, primarily for pricing
on prior period open sales 6 6 — — 6
Gross profit $ 290 $ 280 $ 7 $ 3 $ 290
Copper sales (millions of recoverable pounds) 415 415
Molybdenum sales (millions of recoverable pounds) a 8 Gross profit per pound of copper/molybdenum: Revenues, excluding adjustments $ 2.45 $ 2.45 $ 6.63
Site production and delivery, before net noncash
and other costs shown below 1.46 1.37 5.14
By-product credits (0.13) — —
Treatment charges 0.11 0.11 —
Unit net cash costs 1.44 1.48 5.14
DD&A 0.29 0.28 0.59
Metals inventory adjustments (0.01) (0.01) —
Noncash and other costs, net 0.04 0.04 0.06
Total unit costs 1.76 1.79 5.79
Revenue adjustments, primarily for pricing
on prior period open sales 0.01 0.01 —
Gross profit per pound $ 0.70 $ 0.67 $ 0.84
Reconciliation to Amounts Reported Metals
(In millions) Production Inventory Revenues and Delivery DD&A Adjustments
Totals presented above $ 1,092 $ 627 $ 123 (5)
Treatment charges (16) 29 — —
Noncash and other costs, net — 18 — —
Revenue adjustments, primarily for pricing
on prior period open sales 6 — — —
Eliminations and other 12 11 — —
North America copper mines 1,094 685 123 (5)
Other mining c 3,678 2,589 278 3
Corporate, other & eliminations (395) (534) 192 11
As reported in FCX's consolidated financial statements $ 4,377 $ 2,740 $ 593 $ 9
a. Reflects sales of molybdenum produced by certain of the North America copper mines to FCX's molybdenum sales company at market-based pricing.b. Includes gold and silver product revenues and production costs.c. Represents the combined total for FCX's other mining operations, including South America mining, Indonesia mining, Molybdenum mines, Rod & Refining and Atlantic Copper Smelting &
Refining, as presented in the supplemental schedule, "Business Segments," beginning on page IX .
XIV

FREEPORT-McMoRan INC.PRODUCT REVENUES AND PRODUCTION COSTS (continued)
North America Copper Mines Product Revenues, Production Costs and Unit Net Cash Costs Year Ended December 31, 2017
(In millions) By-Product Co-Product Method Method Copper Molybdenum a Other b Total
Revenues, excluding adjustments $ 4,215 $ 4,215 $ 254 $ 90 $ 4,559
Site production and delivery, before net noncash
and other costs shown below 2,429 2,277 188 52 2,517
By-product credits (256) — — — —
Treatment charges 157 150 — 7 157
Net cash costs 2,330 2,427 188 59 2,674
DD&A 423 397 18 8 423
Metals inventory adjustments 2 2 — — 2
Noncash and other costs, net 88 85 2 1 88
Total costs 2,843 2,911 208 68 3,187
Revenue adjustments, primarily for pricing
on prior period open sales 4 4 — — 4
Gross profit $ 1,376 $ 1,308 $ 46 $ 22 $ 1,376
Copper sales (millions of recoverable pounds) 1,481 1,481
Molybdenum sales (millions of recoverable pounds) a 33 Gross profit per pound of copper/molybdenum: Revenues, excluding adjustments $ 2.85 $ 2.85 $ 7.80
Site production and delivery, before net noncash
and other costs shown below 1.64 1.54 5.78
By-product credits (0.17) — —
Treatment charges 0.10 0.10 —
Unit net cash costs 1.57 1.64 5.78
DD&A 0.29 0.27 0.54
Metals inventory adjustments — — —
Noncash and other costs, net 0.06 0.06 0.07
Total unit costs 1.92 1.97 6.39
Revenue adjustments, primarily for pricing
on prior period open sales — — —
Gross profit per pound $ 0.93 $ 0.88 $ 1.41
Reconciliation to Amounts Reported
(In millions) Metals Production Inventory Revenues and Delivery DD&A Adjustments
Totals presented above $ 4,559 $ 2,517 $ 423 $ 2
Treatment charges (52) 105 — —
Noncash and other costs, net — 88 — —
Revenue adjustments, primarily for pricing
on prior period open sales 4 — — —
Eliminations and other 54 57 2 —
North America copper mines 4,565 2,767 425 2
Other mining c 14,921 10,652 1,195 1
Corporate, other & eliminations (3,083) (3,119) 94 5
As reported in FCX's consolidated financial statements $ 16,403 $ 10,300 $ 1,714 $ 8 a. Reflects sales of molybdenum produced by certain of the North America copper mines to FCX's molybdenum sales company at market-based pricing.b. Includes gold and silver product revenues and production costs.c. Represents the combined total for FCX's other mining operations, including South America mining, Indonesia mining, Molybdenum mines, Rod & Refining and Atlantic Copper Smelting &
Refining, as presented in the supplemental schedule, "Business Segments," beginning on page IX .
XV
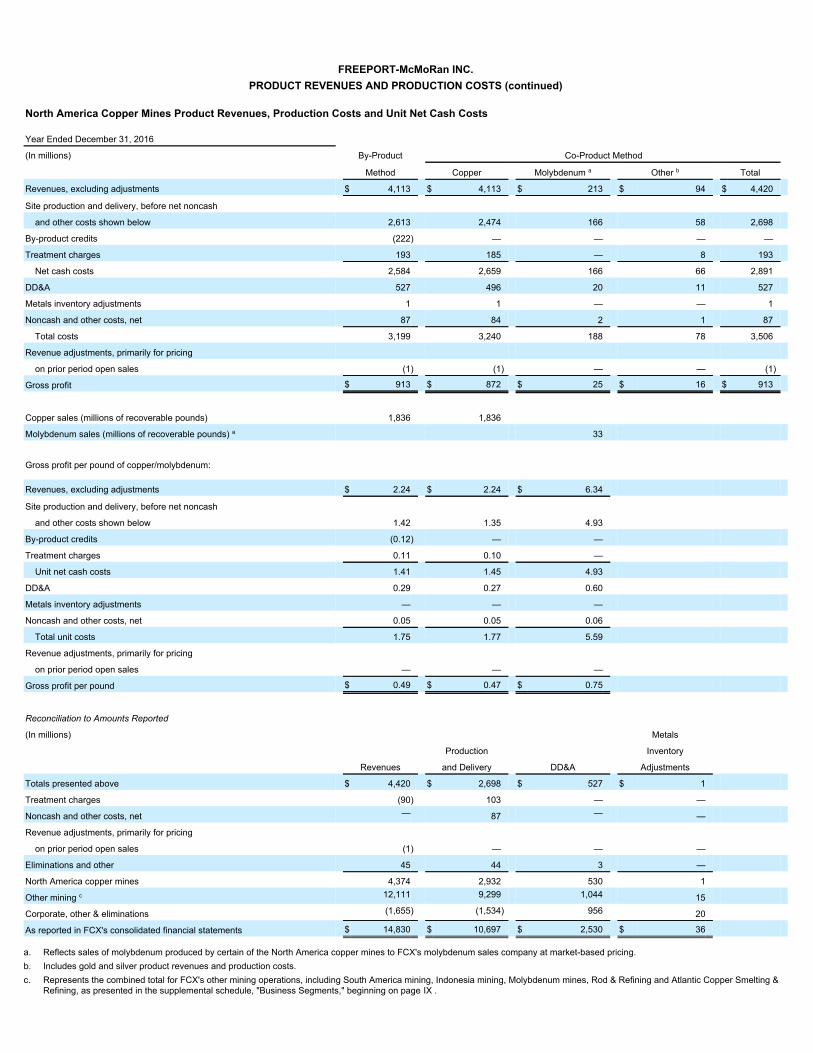
FREEPORT-McMoRan INC.PRODUCT REVENUES AND PRODUCTION COSTS (continued)
North America Copper Mines Product Revenues, Production Costs and Unit Net Cash Costs Year Ended December 31, 2016
(In millions) By-Product Co-Product Method Method Copper Molybdenum a Other b Total
Revenues, excluding adjustments $ 4,113 $ 4,113 $ 213 $ 94 $ 4,420
Site production and delivery, before net noncash
and other costs shown below 2,613 2,474 166 58 2,698
By-product credits (222) — — — —
Treatment charges 193 185 — 8 193
Net cash costs 2,584 2,659 166 66 2,891
DD&A 527 496 20 11 527
Metals inventory adjustments 1 1 — — 1
Noncash and other costs, net 87 84 2 1 87
Total costs 3,199 3,240 188 78 3,506
Revenue adjustments, primarily for pricing
on prior period open sales (1) (1) — — (1)
Gross profit $ 913 $ 872 $ 25 $ 16 $ 913
Copper sales (millions of recoverable pounds) 1,836 1,836
Molybdenum sales (millions of recoverable pounds) a 33 Gross profit per pound of copper/molybdenum: Revenues, excluding adjustments $ 2.24 $ 2.24 $ 6.34
Site production and delivery, before net noncash
and other costs shown below 1.42 1.35 4.93
By-product credits (0.12) — —
Treatment charges 0.11 0.10 —
Unit net cash costs 1.41 1.45 4.93
DD&A 0.29 0.27 0.60
Metals inventory adjustments — — —
Noncash and other costs, net 0.05 0.05 0.06
Total unit costs 1.75 1.77 5.59
Revenue adjustments, primarily for pricing
on prior period open sales — — —
Gross profit per pound $ 0.49 $ 0.47 $ 0.75
Reconciliation to Amounts Reported
(In millions) Metals Production Inventory Revenues and Delivery DD&A Adjustments
Totals presented above $ 4,420 $ 2,698 $ 527 $ 1
Treatment charges (90) 103 — —
Noncash and other costs, net — 87 — —
Revenue adjustments, primarily for pricing
on prior period open sales (1) — — —
Eliminations and other 45 44 3 —
North America copper mines 4,374 2,932 530 1
Other mining c 12,111 9,299 1,044 15
Corporate, other & eliminations (1,655) (1,534) 956 20
As reported in FCX's consolidated financial statements $ 14,830 $ 10,697 $ 2,530 $ 36 a. Reflects sales of molybdenum produced by certain of the North America copper mines to FCX's molybdenum sales company at market-based pricing.b. Includes gold and silver product revenues and production costs.c. Represents the combined total for FCX's other mining operations, including South America mining, Indonesia mining, Molybdenum mines, Rod & Refining and Atlantic Copper Smelting &
Refining, as presented in the supplemental schedule, "Business Segments," beginning on page IX .

XVI

FREEPORT-McMoRan INC.PRODUCT REVENUES AND PRODUCTION COSTS (continued)
South America Mining Product Revenues, Production Costs and Unit Net Cash Costs Three Months Ended December 31, 2017
(In millions) By-Product Co-Product Method
Method Copper Other a Total
Revenues, excluding adjustments $ 1,001 $ 1,001 $ 77 $ 1,078
Site production and delivery, before net noncash
and other costs shown below 531 498 48 546
By-product credits (62) — — —
Treatment charges 68 68 — 68
Royalty on metals 2 2 — 2
Net cash costs 539 568 48 616
DD&A 133 124 9 133
Noncash and other costs, net 6 7 (1) 6
Total costs 678 699 56 755
Revenue adjustments, primarily for pricing
on prior period open sales 62 62 — 62
Gross profit $ 385 $ 364 $ 21 $ 385
Copper sales (millions of recoverable pounds) 312 312 Gross profit per pound of copper: Revenues, excluding adjustments $ 3.22 $ 3.22
Site production and delivery, before net noncash
and other costs shown below 1.71 1.60
By-product credits (0.20) —
Treatment charges 0.21 0.21
Royalty on metals 0.01 0.01
Unit net cash costs 1.73 1.82
DD&A 0.43 0.40
Noncash and other costs, net 0.02 0.03
Total unit costs 2.18 2.25
Revenue adjustments, primarily for pricing
on prior period open sales 0.20 0.20
Gross profit per pound $ 1.24 $ 1.17
Reconciliation to Amounts Reported
(In millions) Production Revenues and Delivery DD&A
Totals presented above $ 1,078 $ 546 $ 133
Treatment charges (68) — —
Royalty on metals (2) — —
Noncash and other costs, net — 6 —
Revenue adjustments, primarily for pricing
on prior period open sales 62 — —
Eliminations and other (2) (3) —
South America mining 1,068 549 133
Other mining b 4,800 3,052 307
Corporate, other & eliminations (827) (790) 17
As reported in FCX's consolidated financial statements $ 5,041 $ 2,811 $ 457
a. Includes silver sales of 967 thousand ounces ( $16.97 per ounce average realized price). Also reflects sales of molybdenum produced by Cerro Verde to FCX's molybdenum sales
company at market-based pricing.
b. Represents the combined total for FCX's other mining operations, including North America copper mines, Indonesia mining, Molybdenum mines, Rod & Refining and Atlantic CopperSmelting & Refining, as presented in the supplemental schedule, "Business Segments," beginning on page IX .

XVII

FREEPORT-McMoRan INC.PRODUCT REVENUES AND PRODUCTION COSTS (continued)
South America Mining Product Revenues and Production Costs and Unit Net Cash Costs Three Months Ended December 31, 2016
(In millions) By-Product Co-Product Method Method Copper Other a Total
Revenues, excluding adjustments $ 898 $ 898 $ 47 $ 945
Site production and delivery, before net noncash
and other costs shown below 485 463 33 496
By-product credits (36) — — —
Treatment charges 90 90 — 90
Royalty on metals 2 2 — 2
Net cash costs 541 555 33 588
DD&A 151 144 7 151
Noncash and other costs, net 23 22 1 23
Total costs 715 721 41 762
Revenue adjustments, primarily for pricing
on prior period open sales 67 67 — 67
Gross profit $ 250 $ 244 $ 6 $ 250
Copper sales (millions of recoverable pounds) 359 359 Gross profit per pound of copper: Revenues, excluding adjustments $ 2.50 $ 2.50
Site production and delivery, before net noncash
and other costs shown below 1.35 1.29
By-product credits (0.10) —
Treatment charges 0.25 0.25
Royalty on metals 0.01 0.01
Unit net cash costs 1.51 1.55
DD&A 0.42 0.40
Noncash and other costs, net 0.07 0.06
Total unit costs 2.00 2.01
Revenue adjustments, primarily for pricing
on prior period open sales 0.19 0.19
Gross profit per pound $ 0.69 $ 0.68
Reconciliation to Amounts Reported
(In millions) Production Revenues and Delivery DD&A
Totals presented above $ 945 $ 496 $ 151
Treatment charges (90) — —
Royalty on metals (2) — —
Noncash and other costs, net — 23 —
Revenue adjustments, primarily for pricing
on prior period open sales 67 — —
Eliminations and other (1) (1) —
South America mining 919 518 151
Other mining b 3,853 2,756 250
Corporate, other & eliminations (395) (534) 192
As reported in FCX's consolidated financial statements $ 4,377 $ 2,740 $ 593
a. Includes silver sales of 981 thousand ounces ( $18.23 per ounce average realized price). Also reflects sales of molybdenum produced by Cerro Verde to FCX's molybdenum sales company
at market-based pricing.
b. Represents the combined total for FCX's other mining operations, including North America copper mines, Indonesia mining, Molybdenum mines, Rod & Refining and Atlantic CopperSmelting & Refining, as presented in the supplemental schedule, "Business Segments," beginning on page IX .
XVIII

FREEPORT-McMoRan INC.PRODUCT REVENUES AND PRODUCTION COSTS (continued)
South America Copper Mines Product Revenues, Production Costs and Unit Net Cash Costs Year Ended December 31, 2017
(In millions) By-Product Co-Product Method
Method Copper Other a Total
Revenues, excluding adjustments $ 3,668 $ 3,668 $ 267 $ 3,935
Site production and delivery, before net noncash
and other costs shown below 1,960 1,838 171 2,009
By-product credits (218) — — —
Treatment charges 272 272 — 272
Royalty on metals 8 7 1 8
Net cash costs 2,022 2,117 172 2,289
DD&A 525 489 36 525
Noncash and other costs, net 241 b 224 17 241
Total costs 2,788 2,830 225 3,055
Revenue adjustments, primarily for pricing
on prior period open sales 41 41 — 41
Gross profit $ 921 $ 879 $ 42 $ 921
Copper sales (millions of recoverable pounds) 1,235 1,235 Gross profit per pound of copper: Revenues, excluding adjustments $ 2.97 $ 2.97
Site production and delivery, before net noncash
and other costs shown below 1.59 1.49
By-product credits (0.18) —
Treatment charges 0.22 0.22
Royalty on metals 0.01 0.01
Unit net cash costs 1.64 1.72
DD&A 0.43 0.39
Noncash and other costs, net 0.19 b 0.18
Total unit costs 2.26 2.29
Revenue adjustments, primarily for pricing
on prior period open sales 0.03 0.03
Gross profit per pound $ 0.74 $ 0.71
Reconciliation to Amounts Reported
(In millions) Production Revenues and Delivery DD&A
Totals presented above $ 3,935 $ 2,009 $ 525
Treatment charges (272) — —
Royalty on metals (8) — —
Noncash and other costs, net — 241 —
Revenue adjustments, primarily for pricing
on prior period open sales 41 — —
Eliminations and other (2) (6) —
South America mining 3,694 2,244 525
Other mining c — 15,792 11,175 1,095
Corporate, other & eliminations — (3,083) (3,119) 94
As reported in FCX's consolidated financial statements $ 16,403 $ 10,300 $ 1,714
a. Includes silver sales of 3.8 million ounces ( $16.74 per ounce average realized price). Also reflects sales of molybdenum produced by Cerro Verde to FCX's molybdenum sales company at
market-based pricing.
b. Includes charges totaling $203 million ( $0.16 per pound of copper) associated with disputed Cerro Verde royalties for prior years.
c. Represents the combined total for FCX's other mining operations, including North America copper mines, Indonesia mining, Molybdenum mines, Rod & Refining and Atlantic CopperSmelting & Refining, as presented in the supplemental schedule, "Business Segments," beginning on page IX .

XIX

FREEPORT-McMoRan INC.PRODUCT REVENUES AND PRODUCTION COSTS (continued)
South America Copper Mines Product Revenues, Production Costs and Unit Net Cash Costs Year Ended December 31, 2016
(In millions) By-Product Co-Product Method Method Copper Other a Total
Revenues, excluding adjustments $ 3,077 $ 3,077 $ 176 $ 3,253
Site production and delivery, before net noncash
and other costs shown below 1,681 1,601 120 1,721
By-product credits (136) — — —
Treatment charges 320 320 — 320
Royalty on metals 7 6 1 7
Net cash costs 1,872 1,927 121 2,048
DD&A 552 523 29 552
Noncash and other costs, net 40 38 2 40
Total costs 2,464 2,488 152 2,640
Revenue adjustments, primarily for pricing
on prior period open sales 11 11 — 11
Gross profit $ 624 $ 600 $ 24 $ 624
Copper sales (millions of recoverable pounds) 1,332 1,332 Gross profit per pound of copper: Revenues, excluding adjustments $ 2.31 $ 2.31
Site production and delivery, before net noncash
and other costs shown below 1.26 1.20
By-product credits (0.10) —
Treatment charges 0.24 0.24
Royalty on metals 0.01 —
Unit net cash costs 1.41 1.44
DD&A 0.41 0.39
Noncash and other costs, net 0.03 0.03
Total unit costs 1.85 1.86
Revenue adjustments, primarily for pricing
on prior period open sales 0.01 0.01
Gross profit per pound $ 0.47 $ 0.46
Reconciliation to Amounts Reported
(In millions) Production Revenues and Delivery DD&A
Totals presented above $ 3,253 $ 1,721 $ 552
Treatment charges (320) — —
Royalty on metals (7) — —
Noncash and other costs, net — 40 —
Revenue adjustments, primarily for pricing
on prior period open sales 11 — —
Eliminations and other 1 (3) 1
South America mining 2,938 1,758 553
Other mining b 13,547 10,473 1,021
Corporate, other & eliminations (1,655) (1,534) 956
As reported in FCX's consolidated financial statements $ 14,830 $ 10,697 $ 2,530
a. Includes silver sales of 3.7 million ounces ( $18.05 per ounce average realized price). Also reflects sales of molybdenum produced by Cerro Verde to FCX's molybdenum sales company at
market-based pricing.b. Represents the combined total for FCX's other mining operations, including North America copper mines, Indonesia mining, Molybdenum mines, Rod & Refining and Atlantic Copper
Smelting & Refining, as presented in the supplemental schedule, "Business Segments," beginning on page IX .
XX

FREEPORT-McMoRan INC.
PRODUCT REVENUES AND PRODUCTION COSTS (continued) Indonesia Mining Product Revenues, Production Costs and Unit Net Cash Credits Three Months Ended December 31, 2017
(In millions) By-Product Co-Product Method
Method Copper Gold Silver a Total
Revenues, excluding adjustments $ 1,140 $ 1,140 $ 750 $ 17 $ 1,907
Site production and delivery, before net noncash
and other costs shown below 476 284 187 5 476
Gold and silver credits (763) — — — —
Treatment charges 91 54 36 1 91
Export duties 53 32 21 — 53
Royalty on metals 67 39 28 — 67
Net cash (credits) costs (76) 409 272 6 687
DD&A 184 110 72 2 184
Noncash and other costs, net 23 b 14 9 — 23
Total costs 131 533 353 8 894
Revenue adjustments, primarily for pricing on
prior period open sales 33 33 (4) — 29
PT Smelting intercompany loss (11) (7) (4) — (11)
Gross profit $ 1,031 $ 633 $ 389 $ 9 $ 1,031
Copper sales (millions of recoverable pounds) 351 351
Gold sales (thousands of recoverable ounces) 584 Gross profit per pound of copper/per ounce of gold: Revenues, excluding adjustments $ 3.25 $ 3.25 $ 1,285
Site production and delivery, before net noncash
and other costs shown below 1.36 0.81 320
Gold and silver credits (2.18) — —
Treatment charges 0.26 0.16 61
Export duties 0.15 0.09 36
Royalty on metals 0.19 0.11 48
Unit net cash (credits) costs (0.22) 1.17 465
DD&A 0.53 0.31 124
Noncash and other costs, net 0.07 b 0.04 16
Total unit costs 0.38 1.52 605
Revenue adjustments, primarily for pricing on
prior period open sales 0.10 0.10 (6)
PT Smelting intercompany loss (0.03) (0.02) (8)
Gross profit per pound/ounce $ 2.94 $ 1.81 $ 666
Reconciliation to Amounts Reported
(In millions) Production Revenues and Delivery DD&A
Totals presented above $ 1,907 $ 476 $ 184
Treatment charges (91) — —
Export duties (53) — —
Royalty on metals (67) — —
Noncash and other costs, net — 23 —
Revenue adjustments, primarily for pricing on
prior period open sales 29 — —
PT Smelting intercompany loss — 11 —
Indonesia mining 1,725 510 184
Other mining c 4,143 3,091 256
Corporate, other & eliminations (827) (790) 17
As reported in FCX's consolidated financial statements $ 5,041 $ 2,811 $ 457

a. Includes silver sales of 1.0 million ounces ( $16.28 per ounce average realized price).b. Includes $8 million ( $0.02 per pound of copper) of costs charged directly to production and delivery costs as a result of workforce reductions.c. Represents the combined total for FCX's other mining operations, including North America copper mines, South America mining, Molybdenum mines, Rod & Refining and Atlantic Copper
Smelting & Refining, as presented in the supplemental schedule, "Business Segments," beginning on page IX .
XXI

FREEPORT-McMoRan INC.PRODUCT REVENUES AND PRODUCTION COSTS (continued)
Indonesia Mining Product Revenues, Production Costs and Unit Net Cash Costs Three Months Ended December 31, 2016
(In millions) By-Product Co-Product Method Method Copper Gold Silver a Total
Revenues, excluding adjustments $ 874 $ 874 $ 470 $ 15 $ 1,359
Site production and delivery, before net noncash
and other costs shown below 527 339 182 6 527
Gold and silver credits (473) — — — —
Treatment charges 95 61 33 1 95
Export duties 32 21 11 — 32
Royalty on metals 47 28 18 1 47
Net cash costs 228 449 244 8 701
DD&A 100 64 35 1 100
Noncash and other costs, net 20 13 7 — 20
Total costs 348 526 286 9 821
Revenue adjustments, primarily for pricing on
prior period open sales 49 49 (11) (1) 37
PT Smelting intercompany loss (19) (13) (6) — (19)
Gross profit $ 556 $ 384 $ 167 $ 5 $ 556
Copper sales (millions of recoverable pounds) 352 352
Gold sales (thousands of recoverable ounces) 401 Gross profit per pound of copper/per ounce of gold: Revenues, excluding adjustments $ 2.48 $ 2.48 $ 1,174
Site production and delivery, before net noncash
and other costs shown below 1.50 0.96 455
Gold and silver credits (1.34) — —
Treatment charges 0.27 0.17 82
Export duties 0.09 0.06 28
Royalty on metals 0.13 0.09 46
Unit net cash costs 0.65 1.28 611
DD&A 0.29 0.18 87
Noncash and other costs, net 0.06 0.04 17
Total unit costs 1.00 1.50 715
Revenue adjustments, primarily for pricing on
prior period open sales 0.14 0.14 (26)
PT Smelting intercompany loss (0.05) (0.03) (16)
Gross profit per pound/ounce $ 1.57 $ 1.09 $ 417
Reconciliation to Amounts Reported
(In millions) Production Revenues and Delivery DD&A
Totals presented above $ 1,359 $ 527 $ 100
Treatment charges (95) — —
Export duties (32) — —
Royalty on metals (47) — —
Noncash and other costs, net — 20 —
Revenue adjustments, primarily for pricing on
prior period open sales 37 — —
PT Smelting intercompany loss — 19 —
Indonesia mining 1,222 566 100
Other mining b 3,550 2,708 301
Corporate, other & eliminations (395) (534) 192
As reported in FCX's consolidated financial statements $ 4,377 $ 2,740 $ 593
a.

a. Includes silver sales of 907 thousand ounces ( $16.24 per ounce average realized price).b. Represents the combined total for FCX's other mining operations, including North America copper mines, South America mining, Molybdenum mines, Rod & Refining and Atlantic Copper
Smelting & Refining, as presented in the supplemental schedule, "Business Segments," beginning on page IX .
XXII

FREEPORT-McMoRan INC.PRODUCT REVENUES AND PRODUCTION COSTS (continued)
Indonesia Mining Product Revenues, Production Costs and Unit Net Cash Costs Year Ended December 31, 2017
(In millions) By-Product Co-Product Method
Method Copper Gold Silver a Total
Revenues, excluding adjustments $ 2,945 $ 2,945 $ 1,952 $ 49 $ 4,946
Site production and delivery, before net noncash
and other costs shown below 1,552 924 612 16 1,552
Gold and silver credits (2,010) — — — —
Treatment charges 261 156 103 2 261
Export duties 115 68 46 1 115
Royalty on metals 173 98 73 2 173
Net cash costs 91 1,246 834 21 2,101
DD&A 556 331 220 5 556
Noncash and other costs, net 163 b 97 64 2 163
Total costs 810 1,674 1,118 28 2,820
Revenue adjustments, primarily for pricing on
prior period open sales 39 39 9 — 48
PT Smelting intercompany loss (28) (17) (11) — (28)
Gross profit $ 2,146 $ 1,293 $ 832 $ 21 $ 2,146
Copper sales (millions of recoverable pounds) 981 981
Gold sales (thousands of recoverable ounces) 1,540 Gross profit per pound of copper/per ounce of gold: Revenues, excluding adjustments $ 3.00 $ 3.00 $ 1,268
Site production and delivery, before net noncash
and other costs shown below 1.58 0.94 398
Gold and silver credits (2.05) — —
Treatment charges 0.27 0.16 67
Export duties 0.12 0.07 30
Royalty on metals 0.17 0.10 47
Unit net cash costs 0.09 1.27 542
DD&A 0.57 0.34 142
Noncash and other costs, net 0.17 b 0.10 42
Total unit costs 0.83 1.71 726
Revenue adjustments, primarily for pricing on
prior period open sales 0.04 0.04 6
PT Smelting intercompany loss (0.02) (0.01) (7)
Gross profit per pound/ounce $ 2.19 $ 1.32 $ 541
Reconciliation to Amounts Reported
(In millions) Production Revenues and Delivery DD&A
Totals presented above $ 4,946 $ 1,552 $ 556
Treatment charges (261) — —
Export duties (115) — —
Royalty on metals (173) — —
Noncash and other costs, net — 163 —
Revenue adjustments, primarily for pricing on
prior period open sales 48 — —
PT Smelting intercompany loss — 28 —
Indonesia mining 4,445 1,743 556
Other mining c 15,041 11,676 1,064
Corporate, other & eliminations (3,083) (3,119) 94
As reported in FCX's consolidated financial statements $ 16,403 $ 10,300 $ 1,714

a. Includes silver sales of 3.0 million ounces ( $16.56 per ounce average realized price).b. Includes $120 million ( $0.12 per pound of copper) of costs charged directly to production and delivery costs as a result of workforce reductions.c. Represents the combined total for FCX's other mining operations, including North America copper mines, South America mining, Molybdenum mines, Rod & Refining and Atlantic Copper
Smelting & Refining, as presented in the supplemental schedule, "Business Segments," beginning on page IX .
XXIII

FREEPORT-McMoRan INC.PRODUCT REVENUES AND PRODUCTION COSTS (continued)
Indonesia Mining Product Revenues and Production Costs and Unit Net Cash Costs Year Ended December 31, 2016
(In millions) By-Product Co-Product Method Method Copper Gold Silver a Total
Revenues, excluding adjustments $ 2,448 $ 2,448 $ 1,304 $ 50 $ 3,802
Site production and delivery, before net noncash
and other costs shown below 1,717 1,106 589 22 1,717
Gold and silver credits (1,371) — — — —
Treatment charges 297 191 102 4 297
Export duties 95 61 33 1 95
Royalty on metals 131 79 50 2 131
Net cash costs 869 1,437 774 29 2,240
DD&A 384 247 132 5 384
Noncash and other costs, net 51 33 17 1 51
Total costs 1,304 1,717 923 35 2,675
Revenue adjustments, primarily for pricing on
prior period open sales (1) (1) 17 — 16
PT Smelting intercompany loss (26) (17) (9) — (26)
Gross profit $ 1,117 $ 713 $ 389 $ 15 $ 1,117
Copper sales (millions of recoverable pounds) 1,054 1,054
Gold sales (thousands of recoverable ounces) 1,054 Gross profit per pound of copper/per ounce of gold: Revenues, excluding adjustments $ 2.32 $ 2.32 $ 1,237
Site production and delivery, before net noncash
and other costs shown below 1.63 1.05 559
Gold and silver credits (1.30) — —
Treatment charges 0.28 0.18 97
Export duties 0.09 0.06 31
Royalty on metals 0.13 0.07 47
Unit net cash costs 0.83 1.36 734
DD&A 0.36 0.24 125
Noncash and other costs, net 0.05 0.03 17
Total unit costs 1.24 1.63 876
Revenue adjustments, primarily for pricing on
prior period open sales — — 16
PT Smelting intercompany loss (0.02) (0.02) (8)
Gross profit per pound/ounce $ 1.06 $ 0.67 $ 369
Reconciliation to Amounts Reported
(In millions) Production Revenues and Delivery DD&A
Totals presented above $ 3,802 $ 1,717 $ 384
Treatment charges (297) — —
Export duties (95) — —
Royalty on metals (131) — —
Noncash and other costs, net — 51 —
Revenue adjustments, primarily for pricing on
prior period open sales 16 — —
PT Smelting intercompany loss — 26 —
Indonesia mining 3,295 1,794 384
Other mining b 13,190 10,437 1,190
Corporate, other & eliminations (1,655) (1,534) 956
As reported in FCX's consolidated financial statements $ 14,830 $ 10,697 $ 2,530

a. Includes silver sales of 2.9 million ounces ( $17.09 per ounce average realized price).b. Represents the combined total for FCX's other mining operations, including North America copper mines, South America mining, Molybdenum mining, Rod & Refining and Atlantic Copper
Smelting and Refining, as presented in the supplemental schedule, "Business Segments," beginning on page IX .
XXIV
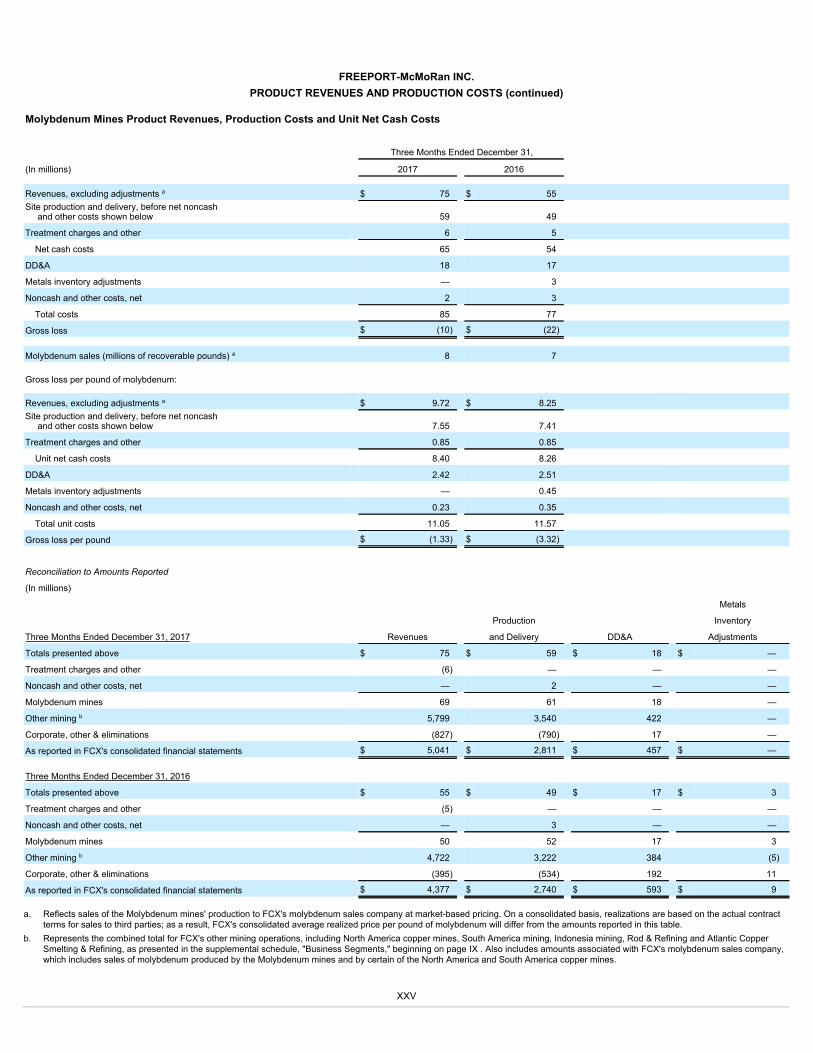
FREEPORT-McMoRan INC.PRODUCT REVENUES AND PRODUCTION COSTS (continued)
Molybdenum Mines Product Revenues, Production Costs and Unit Net Cash Costs Three Months Ended December 31,
(In millions) 2017 2016 Revenues, excluding adjustments a $ 75 $ 55 Site production and delivery, before net noncash
and other costs shown below 59 49
Treatment charges and other 6 5
Net cash costs 65 54
DD&A 18 17
Metals inventory adjustments — 3
Noncash and other costs, net 2 3
Total costs 85 77
Gross loss $ (10) $ (22)
Molybdenum sales (millions of recoverable pounds) a 8 7 Gross loss per pound of molybdenum: Revenues, excluding adjustments a $ 9.72 $ 8.25 Site production and delivery, before net noncash
and other costs shown below 7.55 7.41
Treatment charges and other 0.85 0.85
Unit net cash costs 8.40 8.26
DD&A 2.42 2.51
Metals inventory adjustments — 0.45
Noncash and other costs, net 0.23 0.35
Total unit costs 11.05 11.57
Gross loss per pound $ (1.33) $ (3.32)
Reconciliation to Amounts Reported
(In millions) Metals Production Inventory
Three Months Ended December 31, 2017 Revenues and Delivery DD&A Adjustments
Totals presented above $ 75 $ 59 $ 18 $ —
Treatment charges and other (6) — — —
Noncash and other costs, net — 2 — —
Molybdenum mines 69 61 18 —
Other mining b 5,799 3,540 422 —
Corporate, other & eliminations (827) (790) 17 —
As reported in FCX's consolidated financial statements $ 5,041 $ 2,811 $ 457 $ —
Three Months Ended December 31, 2016
Totals presented above $ 55 $ 49 $ 17 $ 3
Treatment charges and other (5) — — —
Noncash and other costs, net — 3 — —
Molybdenum mines 50 52 17 3
Other mining b 4,722 3,222 384 (5)
Corporate, other & eliminations (395) (534) 192 11
As reported in FCX's consolidated financial statements $ 4,377 $ 2,740 $ 593 $ 9
a. Reflects sales of the Molybdenum mines' production to FCX's molybdenum sales company at market-based pricing. On a consolidated basis, realizations are based on the actual contract
terms for sales to third parties; as a result, FCX's consolidated average realized price per pound of molybdenum will differ from the amounts reported in this table.b. Represents the combined total for FCX's other mining operations, including North America copper mines, South America mining, Indonesia mining, Rod & Refining and Atlantic Copper
Smelting & Refining, as presented in the supplemental schedule, "Business Segments," beginning on page IX . Also includes amounts associated with FCX's molybdenum sales company,which includes sales of molybdenum produced by the Molybdenum mines and by certain of the North America and South America copper mines.
XXV

FREEPORT-McMoRan INC.PRODUCT REVENUES AND PRODUCTION COSTS (continued)
Molybdenum Mines Product Revenues, Production Costs and Unit Net Cash Costs Years Ended December 31,
(In millions) 2017 2016 Revenues, excluding adjustments a $ 295 $ 208 Site production and delivery, before net noncash
and other costs shown below 223 195
Treatment charges and other 27 22
Net cash costs 250 217
DD&A 76 68
Metals inventory adjustments 1 15
Noncash and other costs, net 6 4
Total costs 333 304
Gross loss $ (38) $ (96)
Molybdenum sales (millions of recoverable pounds) a 32 26 Gross loss per pound of molybdenum: Revenues, excluding adjustments a $ 9.22 $ 8.02 Site production and delivery, before net noncash
and other costs shown below 6.94 7.50
Treatment charges and other 0.85 0.86
Unit net cash costs 7.79 8.36
DD&A 2.39 2.62
Metals inventory adjustments 0.02 0.58
Noncash and other costs, net 0.21 0.15
Total unit costs 10.41 11.71
Gross loss per pound $ (1.19) $ (3.69)
Reconciliation to Amounts Reported
(In millions) Metals Production Inventory
Year Ended December 31, 2017 Revenues and Delivery DD&A Adjustments
Totals presented above $ 295 $ 223 $ 76 $ 1
Treatment charges and other (27) — — —
Noncash and other costs, net — 6 — —
Molybdenum mines 268 229 76 1
Other mining b 19,218 13,190 1,544 2
Corporate, other & eliminations (3,083) (3,119) 94 5
As reported in FCX's consolidated financial statements $ 16,403 $ 10,300 $ 1,714 $ 8
Year Ended December 31, 2016
Totals presented above $ 208 $ 195 $ 68 $ 15
Treatment charges and other (22) — — —
Noncash and other costs, net — 4 — —
Molybdenum mines 186 199 68 15
Other mining b 16,299 12,032 1,506 1
Corporate, other & eliminations (1,655) (1,534) 956 20
As reported in FCX's consolidated financial statements $ 14,830 $ 10,697 $ 2,530 $ 36
a. Reflects sales of the Molybdenum mines' production to FCX's molybdenum sales company at market-based pricing. On a consolidated basis, realizations are based on the actual contract
terms for sales to third parties; as a result, FCX's consolidated average realized price per pound of molybdenum will differ from the amounts reported in this table.b. Represents the combined total for FCX's other mining operations, including North America copper mines, South America mining, Indonesia mining, Rod & Refining and Atlantic Copper
Smelting & Refining, as presented in the supplemental schedule, "Business Segments," beginning on page IX . Also includes amounts associated with FCX's molybdenum sales company,which includes sales of molybdenum produced by the Molybdenum mines and by certain of the North America and South America copper mines.
XXVI