
Freeport, Illinois ANNUAL FINANCIAL REPORT April 30, 2012 Annual Report for City... · this...
109
CITY OF FREEPORT, ILLINOIS Freeport, Illinois ANNUAL FINANCIAL REPORT April 30, 2012
Transcript of Freeport, Illinois ANNUAL FINANCIAL REPORT April 30, 2012 Annual Report for City... · this...
CITY OF FREEPORT, ILLINOISFreeport, Illinois
ANNUAL FINANCIAL REPORT
April 30, 2012

CITY OF FREEPORT, ILLINOIS
________
TABLE OF CONTENTS
________
PageNumber
INDEPENDENT AUDITOR'S REPORT 1 - 2
MANAGEMENT DISCUSSION AND ANALYSIS 3 - 8
BASIC FINANCIAL STATEMENTS
Statement of Net Assets 9
Statement of Activities 10
Statement of Assets, Liabilities and Fund Balances - Governmental Funds 11
Reconciliation of the Governmental Funds Balance Sheet to the Statement of Net Assets 12
Statement of Revenues, Expenditures, and Changes in Fund Balances - Governmental Funds 13
Reconciliation of the Statement of Revenues, Expenditures, and Changes in Fund Balances of Governmental Funds to the Statement of Activities 14
Statement of Net Assets - Proprietary Funds 15
Statement of Revenues, Expenses, and Changes in Fund Net Assets - Proprietary Funds 16
Statement of Cash Flows - Proprietary Funds 17 - 18
Statement of Fiduciary Net Assets - Fiduciary Funds 19
Statement of Changes in Fiduciary Net Assets - Fiduciary Funds 20
Notes to Financial Statements 21 - 60
CITY OF FREEPORT, ILLINOIS
________
TABLE OF CONTENTS
________
PageNumbers
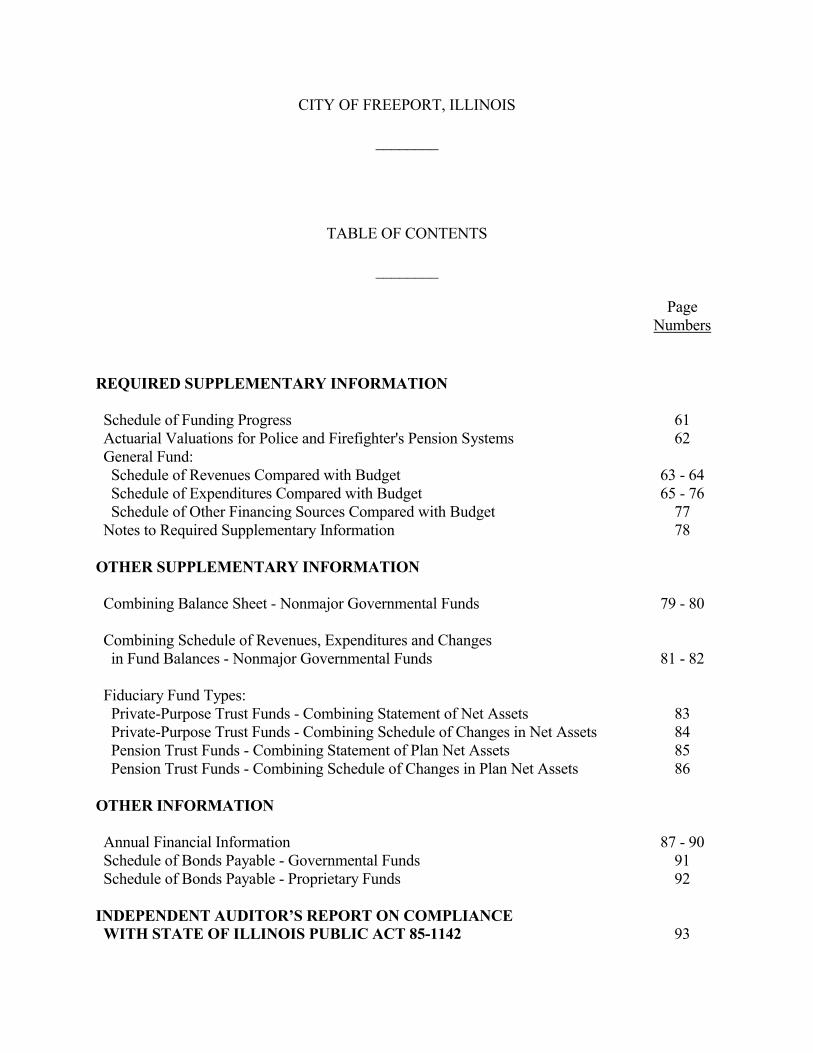
REQUIRED SUPPLEMENTARY INFORMATION
Schedule of Funding Progress 61 Actuarial Valuations for Police and Firefighter's Pension Systems 62 General Fund: Schedule of Revenues Compared with Budget 63 - 64 Schedule of Expenditures Compared with Budget 65 - 76 Schedule of Other Financing Sources Compared with Budget 77 Notes to Required Supplementary Information 78
OTHER SUPPLEMENTARY INFORMATION
Combining Balance Sheet - Nonmajor Governmental Funds 79 - 80
Combining Schedule of Revenues, Expenditures and Changes in Fund Balances - Nonmajor Governmental Funds 81 - 82
Fiduciary Fund Types: Private-Purpose Trust Funds - Combining Statement of Net Assets 83 Private-Purpose Trust Funds - Combining Schedule of Changes in Net Assets 84 Pension Trust Funds - Combining Statement of Plan Net Assets 85 Pension Trust Funds - Combining Schedule of Changes in Plan Net Assets 86
OTHER INFORMATION
Annual Financial Information 87 - 90 Schedule of Bonds Payable - Governmental Funds 91 Schedule of Bonds Payable - Proprietary Funds 92
INDEPENDENT AUDITOR’S REPORT ON COMPLIANCE WITH STATE OF ILLINOIS PUBLIC ACT 85-1142 93

MANAGEMENT DISCUSSION AND ANALYSIS
-3-
CITY OF FREEPORT, ILLINOISMANAGEMENT DISCUSSION AND ANALYSIS
April 30, 2012
________
As management of City of Freeport, Illinois, we offer the readers of the City's financial statements this narrative overview and analysis of the financial activities of City of Freeport, Illinois for the year ended April 30, 2012.
The MD&A is provided at the beginning of the report to provide an overview of the City's financial position at April 30, 2012 and the results of operations for the year. This summary should not be taken as a replacement for the audit report, which consists of the financial statements, notes to the financial statements, required and other supplementary information.
USING THIS FINANCIAL REPORT
The financial section of this annual report consists of four parts - Independent Auditor's Reports, required supplementary information which includes the MD&A (this section), the basic financial statements, and other supplementary information. The basic financial statements include two kinds of statements that present different views of the City:
Government -Wide Financial Statements
The first two statements are government-wide financial statements that provide both short term and long term information about the City's overall financial status, similar to a private sector business. In the government-wide financial statements the City's activities are shown in two categories -governmental activities and business-type activities. The City's governmental activities are general government, public safety, public works, health, and culture and recreation. These activities are largely financed with sales taxes, income taxes, property taxes, and user fees. The City’s business-type activities include water, sewer, storm sewer, landfill closure, and health and environment. These activities are largely financed with user fees.
The statement of net assets presents information on all of the City's assets and liabilities, with the difference between the two reported as net assets. Over time, increases or decreases in net assets may serve as a useful indicator of whether the financial position of the City is improving or deteriorating. To assess the overall health of the City you need to consider additional non-financial factors such as the condition of the City's buildings and facilities.
The statement of activities presents information showing how the government's net assets changed during the most recent fiscal year. The financial statements are prepared under the accrual basis of accounting, whereby revenues and assets are recognized when earned regardless of when the cash is received and expenditures/expenses and liabilities are recognized when incurred, regardless of when payment is made.
-4-
CITY OF FREEPORT, ILLINOISMANAGEMENT DISCUSSION AND ANALYSIS
April 30, 2012
________
Fund Financial Statements
The fund financial statements provide more detailed information about the City's funds - not the City as a whole. Funds are accounting devices the City uses to keep track of specific sources of funding and spending on particular programs. Some funds are required by state law, while others are established to control and manage money for particular purposes or to show that the City is properly using certain revenues.
Because the focus of the governmental funds is narrower than that of the government-wide financial statements, it is useful to compare the information presented for each. By doing so, readers may better understand the long-term impact of the City's near-term financing decisions. Both the governmental fund balance sheet and the governmental fund statement of revenues, expenditures, and changes in fund balances provide a reconciliation to facilitate the comparison between governmental funds and governmental activities.
The City maintains seventeen individual governmental funds. Information is presented separately in the governmental fund balance sheet and in the governmental fund statement of revenues, expenditures, and the changes in fund balances for all these funds. One of these seventeen funds isconsidered a major fund of the City. More detail of the individual revenues and expenditures for these funds is presented in the supplementary section of this report.
The City maintains five individual business-type funds. Information is presented separately in the proprietary statement of net assets and in the proprietary statement of revenues, expenses, and thechanges in net assets for all these funds. All of these five funds are considered major funds of the City. More detail of the individual revenues and expenditures for these funds is presented in the supplementary section of this report.
The City adopts annual budgets for all funds. A budgetary comparison statement has been provided for the major funds only, which is in compliance with GASB Statement No.34.
Fiduciary Funds - The City is the trustee, or fiduciary, for assets that belong to others or are designated to be used for a specific purpose with the principal left intact. The City is responsible for ensuring that the assets reported in these funds are used only for their intended purpose and by those to whom the assets belong. The City's fiduciary activities are reported in a separate statement of fiduciary net assets and a statement of changes in fiduciary net assets. These activities are excluded from the government-wide financial statements because the City cannot use these assets to finance its operations.

-5-
CITY OF FREEPORT, ILLINOISMANAGEMENT DISCUSSION AND ANALYSIS
April 30, 2012
________
Condensed Financial Information
Net assets are summarized in the table below.
Condensed Statement of Net Assets as of April 30, 2012 and 2011
Governmental Business-typeActivities Activities Total
2012 2011 2012 2011 2012 2011
Assets:Current Assets $14,483,910 $14,075,681 $ 5,215,380 $ 3,415,003 $19,699,290 $17,490,684Non-current Assets 15,364,995 15,544,003 52,320,519 51,608,018 67,685,514 67,152,021
Total Assets 29,848,905 29,619,684 57,535,899 55,023,021 87,384,804 84,642,705
Liabilities:Current Liabilities 5,128,603 4,926,954 3,228,487 2,393,902 8,357,090 7,320,856Non-current Liabilities 16,840,411 15,131,588 28,140,561 26,847,477 44,980,972 41,979,065
Total liabilities 21,969,014 20,058,542 31,369,048 29,241,379 53,338,062 49,299,921
Net Assets:Investments in capital assets, net of debt 11,489,699 11,639,944 24,171,071 24,618,059 35,660,770 36,258,003Restricted 2,199,307 304,910 1,619,209 1,541,814 3,818,516 1,846,724Unrestricted (5,809,115) (2,383,712) 376,571 (378,231) (5,432,544) (2,761,943)
Total net assets $ 7,879,891 $ 9,561,142 $26,166,851 $25,781,642 $34,046,742 $35,342,784
Current assets consist of cash, investments, receivables, and prepaid items.
The City's largest asset group is its capital assets. This includes buildings, infrastructure, equipment, and vehicles.
Current liabilities consist mainly of accounts payable, deferred revenue, and the current portion of long-term debt.
General obligation bonds, notes payable, lease obligations, landfill liability, and net pension and OPEB obligations constitute the City's long-term liabilities.
The City's net assets consist of capital assets net of related debt, restricted and unrestricted net assets.

-6-
CITY OF FREEPORT, ILLINOISMANAGEMENT DISCUSSION AND ANALYSIS
April 30, 2012
________
Condensed Financial Information (Continued)
Revenues, expenses, and changes in net assets are summarized in the table below.
Condensed Statement of ActivitiesFor Fiscal Years Ending April 30, 2012 and 2011
Governmental Business-typeActivities Activities Total
2012 2011 2012 2011 2012 2011
Revenues: Program: Charges for services $ 1,545,025 $ 1,461,463 $8,860,577 $8,706,747 $10,405,602 $10,168,210 Operating grants & contributions 2,717,060 1,556,564 - - 2,717,060 1,556,564 General: Property & other taxes 18,840,980 18,376,484 - - 18,840,980 18,376,484 Other 673,851 1,664,930 20,494 745 694,345 1,665,675
Total revenues 23,776,916 23,059,441 8,881,071 8,707,492 32,657,987 31,766,933
Expenses: General government 9,397,309 10,065,510 - - 9,397,309 10,065,510 Public safety 9,137,970 7,419,110 - - 9,137,970 7,419,110 Judiciary and legal 178,489 195,581 - - 178,489 195,581 Public works 4,847,178 2,378,329 - - 4,847,178 195,581 Health 79,189 95,228 - - 79,189 2,378,329 Culture and recreation 1,655,416 1,533,876 - - 1,655,416 1,533,876 Interest on long-term debt 162,616 188,657 - - 162,616 1,533,876 Water - - 2,155,381 1,986,988 2,155,381 188,657 Sewer - - 3,981,567 3,601,312 3,981,567 1,986,988 Storm Sewer - - 698,642 659,394 698,642 3,601,312 Landfill Closure - - 259,915 200,278 259,915 659,394 Health and Environment - - 1,400,357 1,368,569 1,400,357 200,278
Total expenses 25,458,167 21,876,291 8,495,862 7,816,541 33,954,029 29,692,832
Change in net assets $ (1,681,251) $ 1,183,150 $ 385,209 $ 890,951 $(1,296,042) $ 2,074,101
Major sources of operating revenues for the City include: Property and state taxes and charges for services.
-7-
CITY OF FREEPORT, ILLINOISMANAGEMENT DISCUSSION AND ANALYSIS
April 30, 2012
________
Management's Analysis of the City's Overall Financial Position and Results of Operations
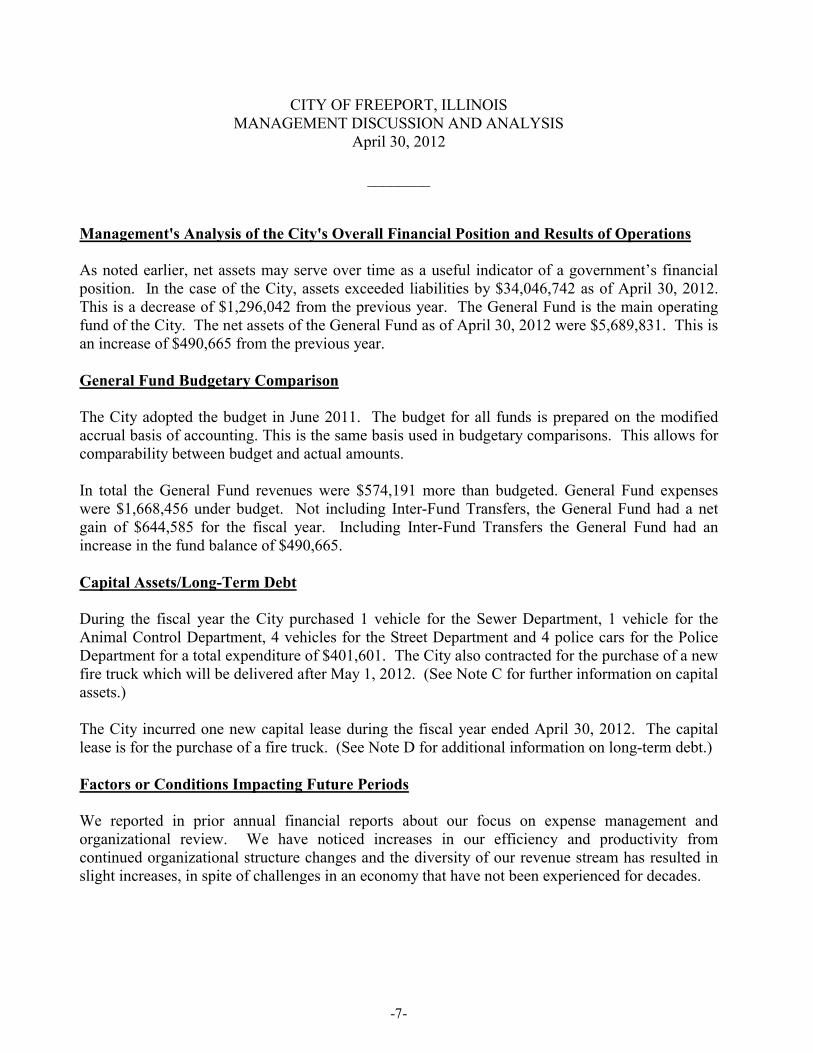
As noted earlier, net assets may serve over time as a useful indicator of a government’s financial position. In the case of the City, assets exceeded liabilities by $34,046,742 as of April 30, 2012. This is a decrease of $1,296,042 from the previous year. The General Fund is the main operating fund of the City. The net assets of the General Fund as of April 30, 2012 were $5,689,831. This is an increase of $490,665 from the previous year.
General Fund Budgetary Comparison
The City adopted the budget in June 2011. The budget for all funds is prepared on the modified accrual basis of accounting. This is the same basis used in budgetary comparisons. This allows for comparability between budget and actual amounts.
In total the General Fund revenues were $574,191 more than budgeted. General Fund expenses were $1,668,456 under budget. Not including Inter-Fund Transfers, the General Fund had a net gain of $644,585 for the fiscal year. Including Inter-Fund Transfers the General Fund had an increase in the fund balance of $490,665.
Capital Assets/Long-Term Debt
During the fiscal year the City purchased 1 vehicle for the Sewer Department, 1 vehicle for the Animal Control Department, 4 vehicles for the Street Department and 4 police cars for the Police Department for a total expenditure of $401,601. The City also contracted for the purchase of a new fire truck which will be delivered after May 1, 2012. (See Note C for further information on capital assets.)
The City incurred one new capital lease during the fiscal year ended April 30, 2012. The capital lease is for the purchase of a fire truck. (See Note D for additional information on long-term debt.)
Factors or Conditions Impacting Future Periods
We reported in prior annual financial reports about our focus on expense management and organizational review. We have noticed increases in our efficiency and productivity from continued organizational structure changes and the diversity of our revenue stream has resulted in slight increases, in spite of challenges in an economy that have not been experienced for decades.

-8-
CITY OF FREEPORT, ILLINOISMANAGEMENT DISCUSSION AND ANALYSIS
April 30, 2012
________
Factors or Conditions Impacting Future Periods (Continued)
Although challenges still exist, we are cognizant of the need to continue investing in our infrastructure. To this end we are increasing the financial commitment to our roadways, investing $20,000,000 in our water & sewer utility and are finalizing the strategies to embark on a five year economic development program that will provide the stimulus to perpetuate the forward progress and momentum we are experiencing.
We believe this balanced approach, coupled with the prospects of an uptick in the economy, will prove to be a successful recipe for sustained growth in our region and will enable us to capitalize on emerging opportunities.
Contacting the City’s Financial Management
This financial report is designed to provide our citizens, taxpayers and customers with a general overview of the City’s finances and to demonstrate the City’s accountability for the money it receives. If you have questions about this report or need additional financial information, please contact the City of Freeport Finance Director, 524 W. Stephenson Street, Freeport, IL 61032.

BASIC FINANCIAL STATEMENTS

CITY OF FREEPORT, ILLINOIS
STATEMENT OF NET ASSETS
April 30, 2012
_________
Governmental Business-typeActivities Activities Total
ASSETS Cash and cash equivalents 3,228,237$ 2,197,321$ 5,425,558$ Investments 3,439,049 95,797 3,534,846 Receivables (net of allowances): Property taxes 3,730,879 - 3,730,879 Accounts 3,491,248 1,141,957 4,633,205 Interest - 1,395 1,395
Inventories - 152,601 152,601
Deposits - 7,100 7,100
Prepaid expenses 594,497 - 594,497 Restricted cash accounts - 1,619,209 1,619,209
Total current assets 14,483,910 5,215,380 19,699,290
Bond issuance costs - 214,658 214,658
Deferred charges - 11,067 11,067
Prepaid interest 351,811 2,856,845 3,208,656
Work in process - 2,456,818 2,456,818
Capital Assets (net of accumulated depreciation):
Buildings 7,951,859 16,076,646 24,028,505
Infrastructure 5,479,092 27,990,911 33,470,003
Equipment 203,200 2,713,574 2,916,774 Vehicles 1,379,033 - 1,379,033
Total noncurrent assets 15,364,995 52,320,519 67,685,514
Total assets 29,848,905 57,535,899 87,384,804
See Notes to Financial Statements.
-9-

LIABILITIESCurrent liabilities:
Accounts payable 631,242 1,252,202 1,883,444
Accrued payroll 212,346 42,947 255,293
Deposits and escrow amounts - 611,669 611,669 Unearned grant revenue 158,828 - 158,828 Deferred revenue 3,730,879 141,719 3,872,598 Accrued interest 38,679 376,705 415,384 Current portion long term debt 356,629 803,245 1,159,874
Total current liabilities 5,128,603 3,228,487 8,357,090
Noncurrent liabilities: General obligation bonds payable 2,251,000 21,929,000 24,180,000 Market premium on bonds payable - 24,050 24,050 Deferred gain 131,576 1,067,143 1,198,719 Notes payable 556,384 2,364,878 2,921,262 Capital leases 359,472 - 359,472 Net pension obligation 9,681,882 - 9,681,882 Net OPEB obligation 3,439,962 - 3,439,962 Accrued compensated absences 420,135 135,000 555,135 Landfill closure liability - 2,620,490 2,620,490
Total noncurrent liabilities 16,840,411 28,140,561 44,980,972
Total liabilities 21,969,014 31,369,048 53,338,062
NET ASSETSInvested in capital assets, net of related debt 11,489,699 24,171,071 35,660,770 Restricted 2,199,307 1,619,209 3,818,516 Unrestricted (5,809,115) 376,571 (5,432,544)
Total net assets 7,879,891$ 26,166,851$ 34,046,742$
See Notes to Financial Statements.
-9-

CITY OF FREEPORT, ILLINOIS
STATEMENT OF ACTIVITIES
Year ended April 30, 2012________
Program Revenue
Operating Capital
Charges for Grants and Grants and
Functions/Programs Expenses Services Contributions Contributions
Governmental activities:
General government 9,397,309$ 165,241$ 1,506,625$ -$
Public safety 9,137,970 937,748 381,765 -
Judiciary and legal 178,489 13,097 - -
Public works 4,847,178 401,761 790,170 -
Social services 79,189 - - -
Culture and recreation 1,655,416 27,178 38,500 -
Interest 162,616 - - -
Total governmental
activities 25,458,167$ 1,545,025$ 2,717,060$ -$
Business-type activities:
Water 2,155,381$ 2,949,950$ -$ -$
Sewer 3,981,567 3,385,926 - -
Storm Sewer 698,642 632,966 - -
Landfill Closure 259,915 268,299 - -
Health and Environment 1,400,357 1,623,436 - -
Total business-type activities 8,495,862$ 8,860,577$ -$ -$
General revenues:
Taxes:
Property taxes
State taxes
Miscellaneous taxes
Unrestricted investment earnings
Miscellaneous
Total general revenues
Change in net assets
Net assets - beginning
Net assets - ending
See Notes to Financial Statements.
-10-

Net (Expense) Revenue andChanges in Net Assets
Governmental Business-typeActivities Activities Total
(7,725,443)$ -$ (7,725,443)$
(7,818,457) - (7,818,457)
(165,392) - (165,392)
(3,655,247) - (3,655,247)
(79,189) - (79,189)
(1,589,738) - (1,589,738)
(162,616) - (162,616)
(21,196,082) - (21,196,082)
- 794,569 794,569
- (595,641) (595,641)
- (65,676) (65,676)
- 8,384 8,384
- 223,079 223,079
- 364,715 364,715
4,694,440 - 4,694,440
12,250,200 - 12,250,200
1,896,340 - 1,896,340
18,085 194 18,279
655,766 20,300 676,066
19,514,831 20,494 19,535,325
(1,681,251) 385,209 (1,296,042)
9,561,142 25,781,642 35,342,784
7,879,891$ 26,166,851$ 34,046,742$
See Notes to Financial Statements.
-10-

CITY OF FREEPORT, ILLINOIS
STATEMENT OF ASSETS, LIABILITIES AND FUND BALANCES
GOVERNMENTAL FUNDS
April 30, 2012
________
Other Total
General Governmental GovernmentalFund Funds Funds
ASSETS
Cash and cash equivalents 171,295$ 611,965$ 783,260$
Investments 2,582,276 3,237,885 5,820,161
Receivables, net of allowances
Property tax 2,392,000 1,338,879 3,730,879
Other 670,879 978,049 1,648,928
Due from other governments 1,743,607 - 1,743,607
Due from other funds 507,786 21,743 529,529 Prepaid expenses 565,704 3,750 569,454
Total assets 8,633,547$ 6,192,271$ 14,825,818$
LIABILITIES AND FUND BALANCES
Current liabilities
Accounts payable 182,013$ 296,729$ 478,742$
Accrued payroll 194,982 17,364 212,346
Due to other funds 15,893 478,515 494,408
Unearned grant revenue 158,828 - 158,828 Deferred revenue 2,392,000 1,338,879 3,730,879
Total liabilities 2,943,716 2,131,487 5,075,203
Fund balances:
Nonspendable 565,704 3,750 569,454
Restricted - 2,199,307 2,199,307
Committed 112,154 1,850,580 1,962,734
Assigned - 7,147 7,147 Unassigned 5,011,973 - 5,011,973
Total fund balances 5,689,831 4,060,784 9,750,615
Total liabilities and fund balances 8,633,547$ 6,192,271$ 14,825,818$
See Notes to Financial Statements.
-11-
CITY OF FREEPORT, ILLINOIS
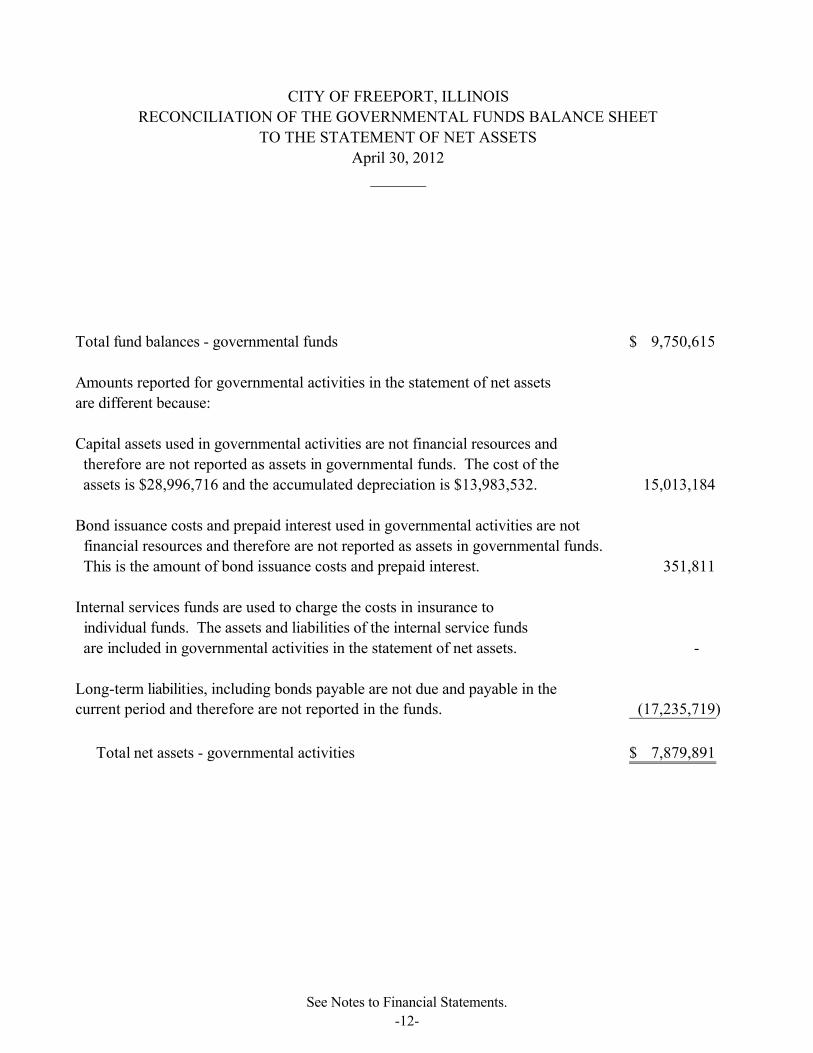
Total fund balances - governmental funds 9,750,615$
Amounts reported for governmental activities in the statement of net assets
are different because:
Capital assets used in governmental activities are not financial resources and
therefore are not reported as assets in governmental funds. The cost of the
assets is $28,996,716 and the accumulated depreciation is $13,983,532. 15,013,184
Bond issuance costs and prepaid interest used in governmental activities are not
financial resources and therefore are not reported as assets in governmental funds.
This is the amount of bond issuance costs and prepaid interest. 351,811
Internal services funds are used to charge the costs in insurance to
individual funds. The assets and liabilities of the internal service funds
are included in governmental activities in the statement of net assets. -
Long-term liabilities, including bonds payable are not due and payable in the
current period and therefore are not reported in the funds. (17,235,719)
Total net assets - governmental activities 7,879,891$
_______
RECONCILIATION OF THE GOVERNMENTAL FUNDS BALANCE SHEET
TO THE STATEMENT OF NET ASSETS
April 30, 2012
See Notes to Financial Statements.
-12-
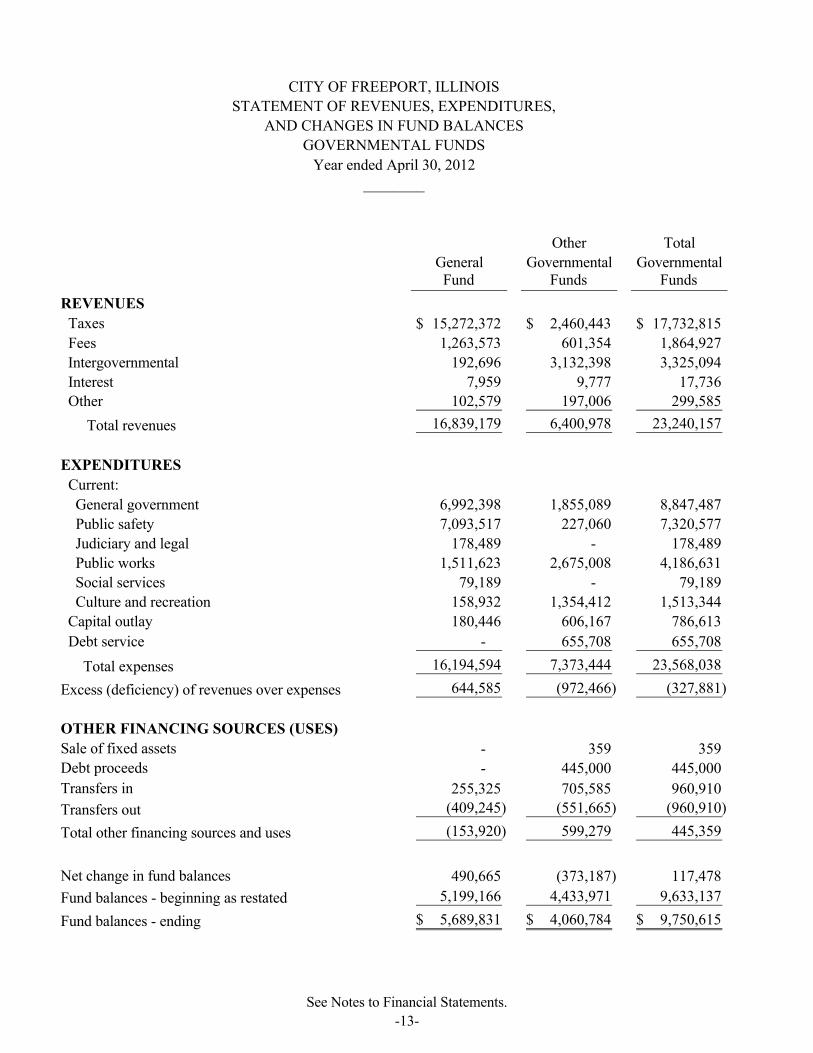
CITY OF FREEPORT, ILLINOIS
STATEMENT OF REVENUES, EXPENDITURES,
AND CHANGES IN FUND BALANCES
GOVERNMENTAL FUNDS
Year ended April 30, 2012
________
Other Total
General Governmental GovernmentalFund Funds Funds
REVENUES
Taxes 15,272,372$ 2,460,443$ 17,732,815$
Fees 1,263,573 601,354 1,864,927
Intergovernmental 192,696 3,132,398 3,325,094
Interest 7,959 9,777 17,736 Other 102,579 197,006 299,585
Total revenues 16,839,179 6,400,978 23,240,157
EXPENDITURES
Current:
General government 6,992,398 1,855,089 8,847,487
Public safety 7,093,517 227,060 7,320,577
Judiciary and legal 178,489 - 178,489
Public works 1,511,623 2,675,008 4,186,631
Social services 79,189 - 79,189
Culture and recreation 158,932 1,354,412 1,513,344
Capital outlay 180,446 606,167 786,613
Debt service - 655,708 655,708
Total expenses 16,194,594 7,373,444 23,568,038
Excess (deficiency) of revenues over expenses 644,585 (972,466) (327,881)
OTHER FINANCING SOURCES (USES)
Sale of fixed assets - 359 359
Debt proceeds - 445,000 445,000
Transfers in 255,325 705,585 960,910
Transfers out (409,245) (551,665) (960,910)
Total other financing sources and uses (153,920) 599,279 445,359
Net change in fund balances 490,665 (373,187) 117,478
Fund balances - beginning as restated 5,199,166 4,433,971 9,633,137
Fund balances - ending 5,689,831$ 4,060,784$ 9,750,615$
See Notes to Financial Statements.
-13-

Excess (deficiency) of revenues received and other sources over (under)
expenditures disbursed and other uses - Governmental funds 117,478$
Amounts reported for governmental activities in the statement of activities
are different because:
Capital outlays are reported in governmental funds as expenditures. However,
in the statement of activities, the cost of those assets is allocated over their
useful lives as depreciation expense. This is the amount by which depreciation
expense $(786,613) exceeds capitalized fixed assets $(633,698) in the period. (152,915)
Losses on the disposition of capital assets are recorded in the statement of activities.
However, the entire cost of the capital assets have already been expensed in
the governmental funds as expenditures. This is the amount of the loss in the period. (7,159)
Accrued compensated absences are recorded as a liability in the governmental
activities. However, these amounts are expensed when paid in the governmental
funds. This is the amount that was expensed in the governmental activities in
the period. 57,253
Debt proceeds are reported in governmental funds as other financing sources.
However, the amount is recorded as a liability in the statement of net assets.
This is the amount of debt proceeds in the period. (445,000)
Debt payments are reported in governmental funds as expenditures. However,
only the interest on debt is recorded in the statement of activities. This is the
amount of debt payments in the period. 454,829
The increase in the net pension and OPEB obligations recorded on the government-
wide statements are not recorded in the governmental funds because it does not
affect current expenditures. This is the increase in the period. (1,705,737)
Change in net assets of governmental activities (1,681,251)$
For the year ended April 30, 2012
________
CITY OF FREEPORT, ILLINOIS
RECONCILIATION OF THE STATEMENT OF REVENUES,
EXPENDITURES, AND CHANGES IN FUND BALANCES OF
GOVERNMENTAL FUNDS TO THE STATEMENT OF ACTIVITIES
See Notes to Financial Statements.
-14-
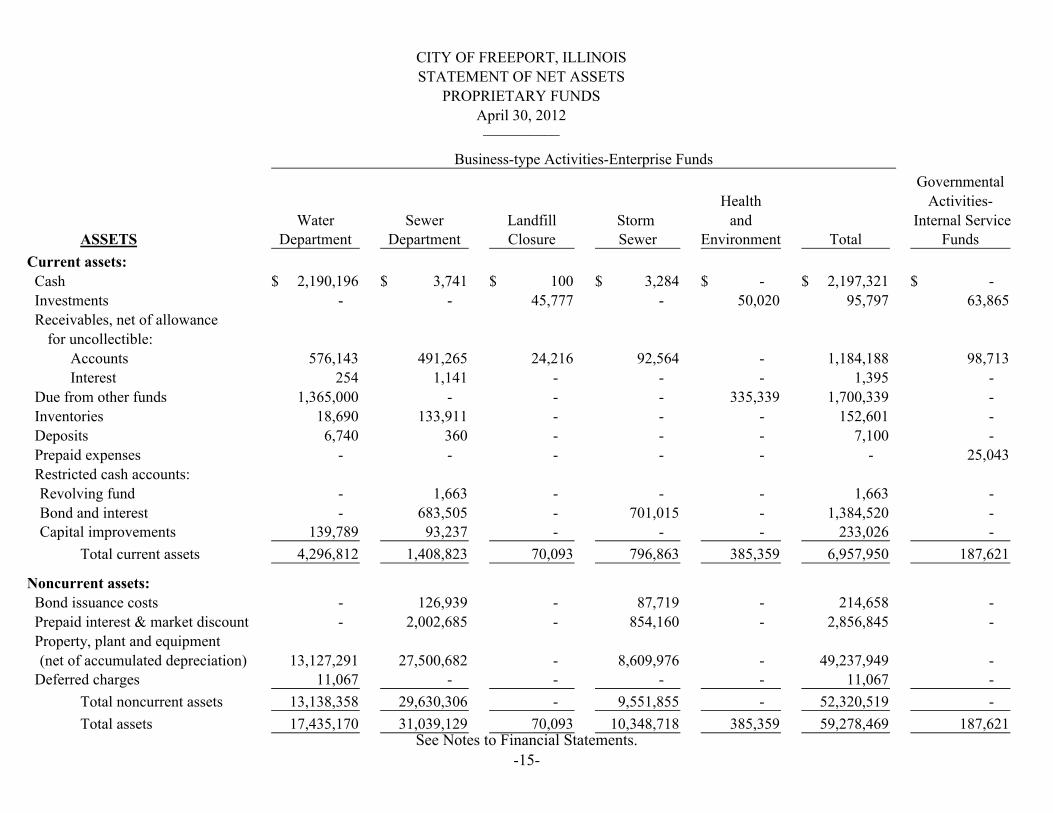
CITY OF FREEPORT, ILLINOIS
STATEMENT OF NET ASSETS
PROPRIETARY FUNDS
April 30, 2012__________
Business-type Activities-Enterprise Funds
Governmental
Health Activities-
Water Sewer Landfill Storm and Internal ServiceASSETS Department Department Closure Sewer Environment Total Funds
Current assets:
Cash 2,190,196$ 3,741$ 100$ 3,284$ -$ 2,197,321$ -$
Investments - - 45,777 - 50,020 95,797 63,865
Receivables, net of allowance
for uncollectible:
Accounts 576,143 491,265 24,216 92,564 - 1,184,188 98,713
Interest 254 1,141 - - - 1,395 -
Due from other funds 1,365,000 - - - 335,339 1,700,339 -
Inventories 18,690 133,911 - - - 152,601 -
Deposits 6,740 360 - - - 7,100 -
Prepaid expenses - - - - - - 25,043
Restricted cash accounts:
Revolving fund - 1,663 - - - 1,663 -
Bond and interest - 683,505 - 701,015 - 1,384,520 - Capital improvements 139,789 93,237 - - - 233,026 -
Total current assets 4,296,812 1,408,823 70,093 796,863 385,359 6,957,950 187,621
Noncurrent assets:
Bond issuance costs - 126,939 - 87,719 - 214,658 -
Prepaid interest & market discount - 2,002,685 - 854,160 - 2,856,845 -
Property, plant and equipment
(net of accumulated depreciation) 13,127,291 27,500,682 - 8,609,976 - 49,237,949 - Deferred charges 11,067 - - - - 11,067 -
Total noncurrent assets 13,138,358 29,630,306 - 9,551,855 - 52,320,519 -
Total assets 17,435,170 31,039,129 70,093 10,348,718 385,359 59,278,469 187,621 See Notes to Financial Statements.
-15-

LIABILITIES
Current liabilities:
Accounts payable 305,159 820,010 55,874 1,037 112,353 1,294,433 152,500
Accrued payroll 16,773 25,224 - 950 - 42,947 -
Due to other funds 335,339 905,000 - 460,000 - 1,700,339 35,121
Deposits and escrow amounts 610,144 1,525 - - - 611,669 -
Deferred revenue - 83,175 38,507 20,037 - 141,719 -
Accrued interest payable - 270,287 - 106,418 - 376,705 - Current portion long term debt - 536,668 30,245 236,332 - 803,245 -
Total current liabilities 1,267,415 2,641,889 124,626 824,774 112,353 4,971,057 187,621
Noncurrent liabilities:Landfill closure liability - - 2,620,490 - - 2,620,490 -
Deferred gain - 550,346 - 516,797 - 1,067,143 -
Accrued compensated absences 45,696 86,519 - 2,785 - 135,000 -
Note payable 823,879 1,304,098 236,901 - - 2,364,878 -
General obligation bonds payable - 13,761,054 - 8,167,946 - 21,929,000 - Market premium on bonds payable - 14,544 - 9,506 - 24,050 -
Total noncurrent liabilities 869,575 15,716,561 2,857,391 8,697,034 - 28,140,561 -
Total liabilities 2,136,990 18,358,450 2,982,017 9,521,808 112,353 33,111,618 187,621
NET ASSETS
Restricted due to bond ordinance 139,789 778,405 - 701,015 - 1,619,209 - Unrestricted 15,158,391 11,902,274 (2,911,924) 125,895 273,006 24,547,642 -
Total net assets 15,298,180$ 12,680,679$ (2,911,924)$ 826,910$ 273,006$ 26,166,851$ -$
See Notes to Financial Statements.
-15-

CITY OF FREEPORT, ILLINOIS
STATEMENT OF REVENUES, EXPENSES, AND CHANGES IN FUND NET ASSETS
PROPRIETARY FUNDS
Year ended April 30, 2012
__________
Business-type Activities-Enterprise Funds
Governmental
Health Activities-
Water Sewer Landfill Storm and Internal ServiceDepartment Department Closure Sewer Environment Total Funds
Operating revenues: Charges for services 2,949,950$ 3,385,926$ 268,299$ 632,966$ 1,623,436$ 8,860,577$ 3,330,423$
Operating expenses:
Operating 1,794,001 2,415,550 259,915 87,188 1,400,357 5,957,011 3,330,772 Depreciation 361,380 865,754 - 223,284 - 1,450,418 -
Total operating expenses 2,155,381 3,281,304 259,915 310,472 1,400,357 7,407,429 3,330,772
Operating income (loss) 794,569 104,622 8,384 322,494 223,079 1,453,148 (349)
Nonoperating revenues (expenses):
Interest income 27 25 37 74 31 194 349
Interest and fiscal charges - (700,263) - (388,170) - (1,088,433) -
Other revenue - 20,300 - - - 20,300 -
Total nonoperating revenues 27 (679,938) 37 (388,096) 31 (1,067,939) 349
Net income (loss) 794,596 (575,316) 8,421 (65,602) 223,110 385,209 -
14,503,584 13,255,995 (2,920,345) 892,512 49,896 25,781,642 -
15,298,180$ 12,680,679$ (2,911,924)$ 826,910$ 273,006$ 26,166,851$ -$ Net assets - April 30, 2012
Net assets - May 1, 2011
See Notes to Financial Statements.
-16-

CITY OF FREEPORT, ILLINOIS
STATEMENT OF CASH FLOWS
PROPRIETARY FUNDS
Year ended April 30, 2012
_________
Business-type Activities-Enterprise Funds
Governmental
Health Activities-
Water Sewer Landfill Storm and Internal ServiceDepartment Department Closure Sewer Environment Total Funds
CASH FLOWS FROM OPERATING
ACTIVITIES
Receipts from customers and users 3,638,642$ 3,341,363$ 245,277$ 689,565$ 1,373,372$ 9,288,219$ 3,400,820$ Payments to suppliers (840,805) (1,651,911) (178,867) (43,088) (1,399,182) (4,113,853) (3,401,074) Payments to employees (640,596) (941,271) - (43,174) - (1,625,041) -
Net cash provided by (used in)
operations 2,157,241 748,181 66,410 603,303 (25,810) 3,549,325 (254)
CASH FLOWS FROM INVESTING
ACTIVITIES
Purchase of investments - - (19,123) - (1,817) (20,940) -
Sale of investments 170 (53,217) (18,098) (4,048) 27,596 (47,597) (95)
Interest received 27 27 37 74 31 196 349
Net cash provided by (used
in) investing activities 197 (53,190) (37,184) (3,974) 25,810 (68,341) 254
See Notes to Financial Statements.
-17-

CASH FLOWS FROM CAPITAL AND RELATED
FINANCING ACTIVITIES
Interest paid - (635,650) - (373,373) - (1,009,023) -
Proceeds from long term debt 823,879 1,304,098 - - - 2,127,977 -
Principal payments on long
term debt - (515,348) (29,226) (222,652) - (767,226) - Purchase of property and equipment (1,425,388) (907,947) - (601) - (2,333,936) -
Net cash provided by (used in)
capital and related financing activities (601,509) (754,847) (29,226) (596,626) - (1,982,208) -
Net increase (decrease) in
cash and cash equivalents 1,555,929 (59,856) - 2,703 - 1,498,776 - Beginning cash and cash equivalents 634,267 63,597 100 581 - 698,545 -
Ending cash and cash equivalents 2,190,196$ 3,741$ 100$ 3,284$ -$ 2,197,321$ -$
See Notes to Financial Statements.
-17-

CITY OF FREEPORT, ILLINOIS
STATEMENT OF CASH FLOWS (CONTINUED)
PROPRIETARY FUNDS
Year ended April 30, 2012
_________
Business-type Activities-Enterprise Funds
Governmental
Health Activities-
Water Sewer Landfill Storm and Internal ServiceDepartment Department Closure Sewer Environment Total Funds
Operating income (loss) 794,569$ 104,622$ 8,384$ 322,494$ 223,079$ 1,453,148$ (349)$
Adjustments to reconcile operating income
to net cash provided by (used in)
operations:
Depreciation 361,380 865,754 - 223,284 - 1,450,418 - Changes in assets and liabilities:
Accounts receivable (223,936) (63,538) (24,216) 56,599 - (255,091) (96,363)
Inventory 94 - - - - 94 -
Due from other funds 975,000 - - - (250,064) 724,936 166,760
Deposits - - - - - - -
Prepaid expenses - - - - - - (22,923)
Accounts payable 56,762 785,452 50,633 862 1,175 894,884 (82,500)
Accrued payroll 2,527 4,925 - 208 - 7,660 -
Accrued compensated absences 3,153 6,991 - (144) - 10,000 -
Deposits and escrow amounts (62,372) (1,200) - - - (63,572) -
Deferred revenue - 20,175 1,194 - - 21,369 -
Other liabilities - - 30,415 - - 30,415 - Due to other funds 250,064 (975,000) - - - (724,936) 35,121
Net cash provided by (used in) operations 2,157,241$ 748,181$ 66,410$ 603,303$ (25,810)$ 3,549,325$ (254)$
provided (used) by operating activities:
Reconciliation of operating income to net
See Notes to Financial Statements.
-18-

CITY OF FREEPORT, ILLINOIS
STATEMENT OF FIDUCIARY NET ASSETS
FIDUCIARY FUNDS
April 30, 2012
__________
Private-
Purpose PensionASSETS Trust Funds Trust Funds
Cash 57,976$ 1,931,864$
Investments 30,932 44,848,275
Receivables, net of allowance
for uncollectible:
Loan 367,380 - Interest - 183,221
Total assets 456,288 46,963,360
LIABILITIES
Accounts payable 5,765 -
NET ASSETS
Held in trust for pension benefits and other purposes 450,523$ 46,963,360$
See Notes to Financial Statements.
-19-

Year ended April 30, 2012
Private-
Purpose PensionTrust Funds Trust Funds
Additions:
Foreign fire insurance 26,681$ -$
Contributions-employer taxes - 2,386,708
Contributions-employee - 547,945 Investment income 11,017 1,922,886
Total additions 37,698 4,857,539
Deductions:
Benefits and refunds - 3,617,291 Other charges and services 31,695 183,403
Total deductions 31,695 3,800,694
Net increase 6,003 1,056,845
444,520 45,906,515
450,523$ 46,963,360$
Net assets - beginning
Net assets - ending
__________
CITY OF FREEPORT, ILLINOIS
STATEMENT OF CHANGES IN FIDUCIARY NET ASSETS
FIDUCIARY FUNDS
See Notes to Financial Statements.
-20-

-21-
CITY OF FREEPORT, ILLINOISNOTES TO FINANCIAL STATEMENTS
April 30, 2012
________
A. Summary of Significant Accounting Policies:
REPORTING ENTITY
The City of Freeport, Illinois was incorporated under the provisions of the State of Illinois. The City operates under a Mayor/Council form of government and provides services to the public such as health services, public safety, fire protection, water and sewer system, streets, and general administrative services.
The accounting policies of the City conform to accounting principles generally accepted in the United State of America as applicable to governmental units. City of Freeport's basic financial statements include the accounts of all City operations that are controlled by or dependent on the City. Control or dependence is determined by financial interdependency, selection of governing board, designation of management, accountability for fiscal matters and ability to significantly influence operations.
In evaluating how to define the government, for financial reporting purposes, the City has considered all potential component units. The decision to include a potential component unit in the reporting entity was made by applying the criteria set forth in GAAP. The basic - but not the only - criterion for including a potential component unit within the reporting entity is the governing body's ability to exercise oversight responsibility. The most significant manifestation of this ability is financial interdependency. Other manifestations of the ability to exercise oversight responsibility include, but are not limited to, the selection of governing authority, the designation of management, the ability to significantly influence operations and accountability for fiscal matters. A second criterion used in evaluating potential component units is the scope of public service. Application of this criterion involves considering whether the activity is conducted within the geographic boundaries of the City and is generally available to its citizens. A third criterion used to evaluate potential component units for inclusion or exclusion from the reporting entity is the existence of special financing relationships, regardless of whether the City is able to exercise oversight responsibilities.
The City is considered to be a primary government pursuant to GASB Statement 14, as amended by GASB Statement 39, since it is legally separate and financially independent. This report includes all of the funds and account groups of the City. It includes all activities considered to be part of (controlled by or dependent on) the City as set forth under the GAAP criteria. Blended component units, although legally separate entities, are part of the government’s operations and so data from these units are combined with data of the primary government.

-22-
CITY OF FREEPORT, ILLINOISNOTES TO FINANCIAL STATEMENTS
April 30, 2012
________
A. Summary of Significant Accounting Policies (Continued):
REPORTING ENTITY (CONTINUED)
Blended Component Unit. The Library serves all the citizens of the City and is governed by the Library Board of Trustees. The budget and appropriation ordinance is approved by the Library Board and City Council, and the legal liability for any Library debt remains with the City. The Library is reported as a Special Revenue Fund.
GOVERNMENT WIDE, FUND FINANCIAL STATEMENTS AND BASIS OF ACCOUNTING
The government wide financial statements (i.e., the Statement of Net Assets and the Statement of Activities) report information on all of the nonfiduciary activities of the City. For the most part, the effect of the interfund activity has been removed from these statements.
The Statement of Activities demonstrates the degree to which the direct expense of a given function or segment are offset by program revenues. Direct expenses are those that are clearly identifiable with a specific function. Program revenues include 1) charges to applicants who purchase, use, or directly benefit from goods, services, or privileges provided by a given function and 2) grants and contributions that are restricted to meeting the operational or capital requirements of a particular function.
Earnings on investments are not included among program revenues, but are reported instead as general revenue.
Separate financial statements are provided for governmental funds and proprietary funds.Fiduciary funds for which the City maintains a Fiduciary or Agency responsibility are not presented in the government wide financial statements.
The government wide financial statements are reported using the economic resources measurement focus and the accrual basis of accounting. Revenues are recorded when earned and expenses are recorded when a liability is incurred, regardless of the timing of related cash flows. Grants and similar items are recognized as revenue as soon as all the eligibility requirements imposed by the provider have been met.
The financial transactions of the City are reported in individual funds in the fund financial statements. Each fund is accounted for by providing a separate set of self-balancing accounts that comprises its assets, liabilities, reserves, fund equity, revenues and expenditures/expenses. The various funds are reported by generic classification within the financial statements.

-23-
CITY OF FREEPORT, ILLINOISNOTES TO FINANCIAL STATEMENTS
April 30, 2012
________
A. Summary of Significant Accounting Policies (Continued):
GOVERNMENT WIDE, FUND FINANCIAL STATEMENTS AND BASIS OF ACCOUNTING (CONTINUED)
The following fund types are used by the City:
Governmental Funds
The focus of the governmental funds’ measurement (in the fund statements) is upon determination of financial position and changes in financial position (sources, uses, and balances of financial resources) rather than upon net income. Governmental fund financial statements are reported using the modified accrual basis method of accounting and the current financial resources measurement focus. Under this basis revenues are recognized in the accounting period in which they become measurable and available. Revenues are considered to be available when they are collectible within the current period or soon enough thereafter to pay liabilities of the current period. For this purpose, the City considers revenues to be available if they are collected within 60 days of the end of the current fiscal period.Expenditures are recognized in the accounting period in which the fund liability is incurred, if measurable. The following is a description of the governmental funds of the City:
1. General Fund is the general operating fund of the City. It is used to account for all financial resources except those required to be accounted for in another fund.
2. Special Revenue Funds are used to account for the proceeds of specific revenue sources that are legally restricted to expenditures for a particular purpose.
3. Debt Service Funds are used to account for the accumulation of funds for the periodic payment of principal and interest on general long-term debt.
4. Capital Projects Funds are used to account for financial resources to be used for the acquisition or construction of major capital facilities (other than those financed by business type/proprietary funds).
Proprietary Fund
The focus of the proprietary fund measurement is upon determination of operating income, changes in net assets, financial position, and cash flows. The generally accepted accounting principles applicable are those similar to businesses in the private sector. Proprietary fund financial statements are reported using the accrual basis of accounting. Revenues are
-24-
CITY OF FREEPORT, ILLINOISNOTES TO FINANCIAL STATEMENTS
April 30, 2012
________
A. Summary of Significant Accounting Policies (Continued):
GOVERNMENT WIDE, FUND FINANCIAL STATEMENTS AND BASIS OF ACCOUNTING (CONTINUED)
Proprietary Fund (Continued)
recognized when earned and expenses are recognized when incurred. Proprietary funds have selected to consistently not follow Financial Accounting Standards Board pronouncements issued subsequent to November 30, 1989 as permitted under Governmental Standards Board Statement No. 20.
A proprietary fund is a fund in which a fee is charged to external users of goods and services and the activity (a) is financed with debt that is solely secured by a pledge of the net revenues, (b) has third party requirements that the cost of providing services, including capital costs, be recovered with fees and charges or (c) establishes fees and charges based on pricing policy designed to recover similar costs.
Proprietary funds distinguish operating revenues and expenses from nonoperating items. Operating revenues and expenses generally result from providing services and producing and delivering goods in connection with a proprietary fund’s principal ongoing operations. The principal operating revenues of the City’s internal service funds are charges to employees for insurance coverage. Operating expenses for internal service funds include the administrative expenses and insurance premiums. All revenues and expenses not meeting this definition are reported as nonoperating revenues and expenses.
The City reports the following major funds:
Governmental Funds:
General Fund
The general fund is the general operating fund of the City. It is used to account for all the financial resources except those required to be accounted for in another fund.
Enterprise Funds:
Water Department Fund To account for the costs related to the operation of the City's watersystem. Funding is provided by user fees.

-25-
CITY OF FREEPORT, ILLINOISNOTES TO FINANCIAL STATEMENTS
April 30, 2012
________
A. Summary of Significant Accounting Policies (Continued):
GOVERNMENT WIDE, FUND FINANCIAL STATEMENTS AND BASIS OF ACCOUNTING (CONTINUED)
Enterprise Funds (Continued):
Sewer Department Fund To account for the costs related to the operation of the City's sewer system. Funding is provided by user fees.
Storm Sewer Fund To account for the costs related to the operation of the City's storm sewer system. Funding is provided by user fees.
Landfill Closure Fund To account for the costs related to post-closure care of the landfill which was closed in previous years. Funding is provided by transfers from the general fund.
Health and Environment Fund To account for the costs related to the operation of garbage in the City. Funding is provided by a fee charged to the homeowners.
CASH AND INVESTMENTS
Cash consists of demand deposits and savings accounts, both being easily accessible and with short-term duration. Investments as of April 30, 2012 consist of treasury bills, certificates of deposit, and money market accounts in various financial institutions. Investments are stated at fair market value.
Statutes authorize the City to invest in: 1) securities guaranteed by the full faith and credit of the United States of America; 2) deposits or other investments constituting direct obligations of any bank as defined by the Illinois Banking Act; 3) short-term obligations of corporations organized in the United States which meet other restrictions as defined in Illinois Revised Statutes Chapter 35, Paragraph 902, as amended; 4) money market funds registered under the Investment Company Act of 1940; 5) short-term discount obligations of the Federal National Mortgage Association; 6) shares or other forms of securities legally issuable by savings and loan associations; 7) various share accounts of a credit union chartered under the laws of the State of Illinois or the laws of the United States provided the principal office of any such credit union is located within the State of Illinois; 8) a Public Treasurer's Investment Pool created Under Section 17 of "An Act to revise the law in relation to the State Treasurer", approved April 23, 1873, as amended. Bank and savings and loan investments may only be made in institutions which are insured by the Federal Deposit Insurance Corporation or the Federal Savings and Loan Insurance Corporation. Pension funds may also invest in certain non-U.S. obligations, Illinois municipal corporations tax anticipation warrants, veteran’s loans, obligations of the State of Illinois and its political subdivisions, and Illinois insurance company general and separate accounts.
-26-
CITY OF FREEPORT, ILLINOISNOTES TO FINANCIAL STATEMENTS
April 30, 2012
________
A. Summary of Significant Accounting Policies (Continued):
PROPERTY TAXES
Property taxes attach as an enforceable lien on January 1st on property values assessed as of the same date. Taxes are levied by December of the subsequent fiscal year (by passage of a Tax Levy Ordinance). Tax bills are prepared by the City and issued on or about May 1st. Such taxes are payable by taxpayers in two installments on approximately June 1 and September 1 subsequent to the year of levy. Distribution of tax receipts to the various City funds usually occurs within one month of the installment due dates.
Property tax revenue in the current year relates to the 2010 levy. Property taxes related to the 2011 levy are collected in the subsequent year are not considered available and are accordingly recorded as revenues in the year following the levy.
Effective in December 2011, the City levied its 2011 taxes which will be recognized as revenue in 2013. The amounts of taxes levied are:
General Fund $2,416,161Special Revenue Funds: IMRF 256,007 Library 1,096,396
$3,768,564
Property taxes receivable are shown in the financial statements net of a 1% allowance foruncollectibles.
INVENTORY
Inventories are valued at cost, which approximates market, using the first in/first out (FIFO) method. The costs of governmental fund-type inventories are recorded as expenditures when consumed rather than when purchased.
-27-
CITY OF FREEPORT, ILLINOISNOTES TO FINANCIAL STATEMENTS
April 30, 2012
________
A. Summary of Significant Accounting Policies (Continued):
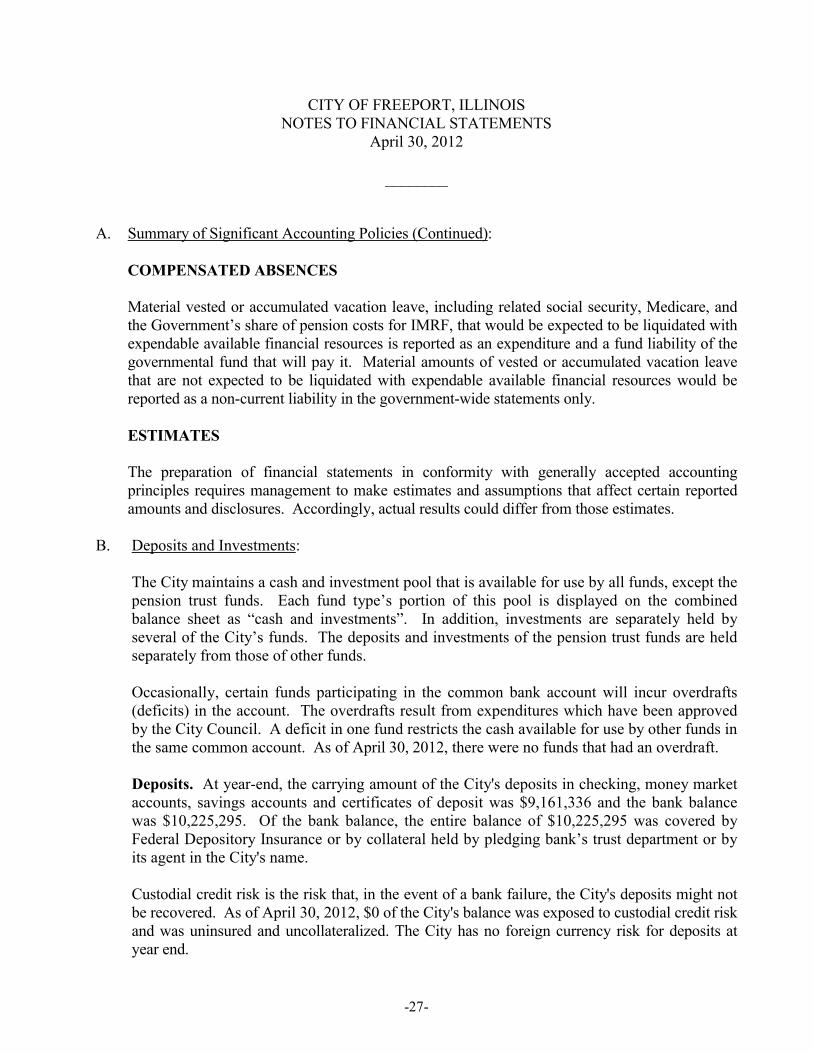
COMPENSATED ABSENCES
Material vested or accumulated vacation leave, including related social security, Medicare, and the Government’s share of pension costs for IMRF, that would be expected to be liquidated with expendable available financial resources is reported as an expenditure and a fund liability of the governmental fund that will pay it. Material amounts of vested or accumulated vacation leave that are not expected to be liquidated with expendable available financial resources would be reported as a non-current liability in the government-wide statements only.
ESTIMATES
The preparation of financial statements in conformity with generally accepted accounting principles requires management to make estimates and assumptions that affect certain reported amounts and disclosures. Accordingly, actual results could differ from those estimates.
B. Deposits and Investments:
The City maintains a cash and investment pool that is available for use by all funds, except the pension trust funds. Each fund type’s portion of this pool is displayed on the combined balance sheet as “cash and investments”. In addition, investments are separately held by several of the City’s funds. The deposits and investments of the pension trust funds are held separately from those of other funds.
Occasionally, certain funds participating in the common bank account will incur overdrafts (deficits) in the account. The overdrafts result from expenditures which have been approved by the City Council. A deficit in one fund restricts the cash available for use by other funds in the same common account. As of April 30, 2012, there were no funds that had an overdraft.
Deposits. At year-end, the carrying amount of the City's deposits in checking, money market accounts, savings accounts and certificates of deposit was $9,161,336 and the bank balance was $10,225,295. Of the bank balance, the entire balance of $10,225,295 was covered by Federal Depository Insurance or by collateral held by pledging bank’s trust department or by its agent in the City's name.
Custodial credit risk is the risk that, in the event of a bank failure, the City's deposits might not be recovered. As of April 30, 2012, $0 of the City's balance was exposed to custodial credit risk and was uninsured and uncollateralized. The City has no foreign currency risk for deposits at year end.
-28-
CITY OF FREEPORT, ILLINOISNOTES TO FINANCIAL STATEMENTS
April 30, 2012
________
B. Deposits and Investments (Continued):
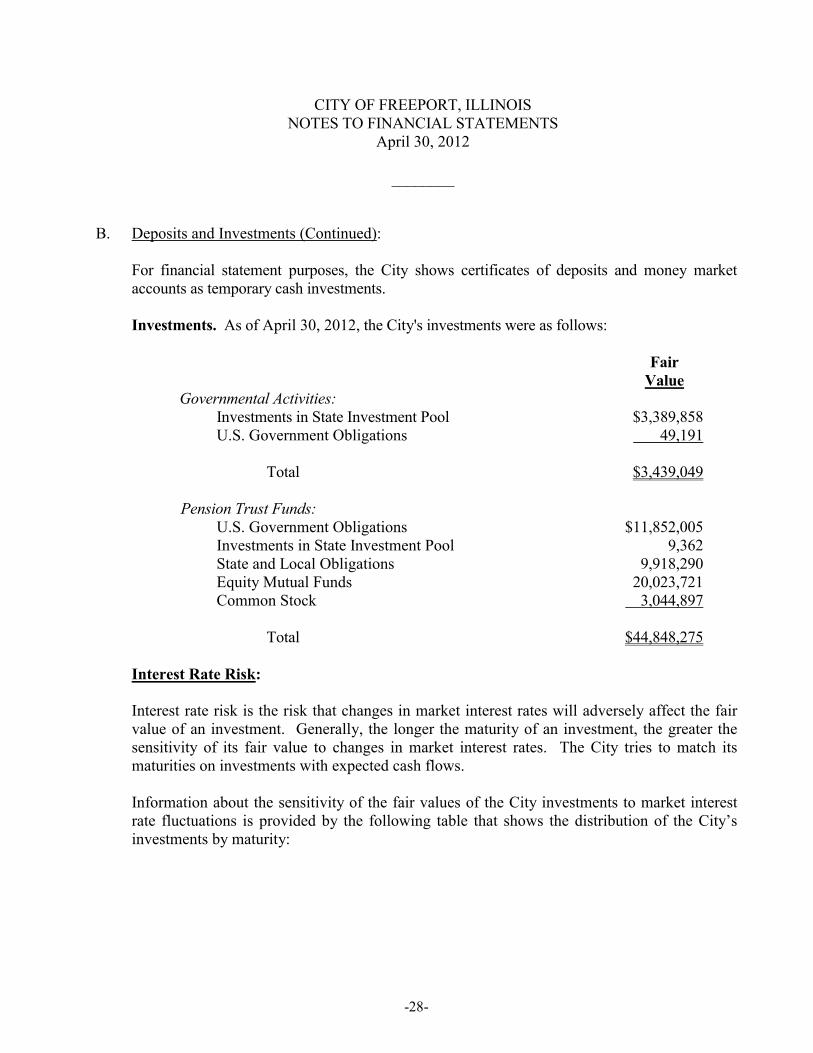
For financial statement purposes, the City shows certificates of deposits and money market accounts as temporary cash investments.
Investments. As of April 30, 2012, the City's investments were as follows:
FairValue
Governmental Activities:Investments in State Investment Pool $3,389,858U.S. Government Obligations 49,191
Total $3,439,049
Pension Trust Funds:U.S. Government Obligations $11,852,005Investments in State Investment Pool 9,362State and Local Obligations 9,918,290Equity Mutual Funds 20,023,721Common Stock 3,044,897
Total $44,848,275
Interest Rate Risk:
Interest rate risk is the risk that changes in market interest rates will adversely affect the fair value of an investment. Generally, the longer the maturity of an investment, the greater the sensitivity of its fair value to changes in market interest rates. The City tries to match its maturities on investments with expected cash flows.
Information about the sensitivity of the fair values of the City investments to market interest rate fluctuations is provided by the following table that shows the distribution of the City’s investments by maturity:

-29-
CITY OF FREEPORT, ILLINOISNOTES TO FINANCIAL STATEMENTS
April 30, 2012
________
B. Deposits and Investments (Continued):
Remaining Maturity (in Months)12 Months 13-60 60+
or Less Months Months TotalGovernmental activities:
Investments in StateInvestment Pool $3,389,858 $ - $ - $3,389,858
U.S. Government Obligations - - 49,191 49,191
Total $3,389,858 $ - $ 49,191 $3,439,049
Pension Trust Funds:
U.S. Government Obligations $105,393 $5,962,431 $5,784,181 $11,852,005Investments in State Investment Pool 9,362 - - 9,362State and Local Obligations 144,461 3,333,069 6,440,760 9,918,290
Total $259,216 $9,295,500 $12,224,941 $21,779,657
Credit Risk:
Generally, credit risk is the risk that an issuer of an investment will not fulfill its obligation to the holder of the investment. This is measured by the assignment of a rating by a nationally recognized statistical rating organization. Investments in U.S. Government obligations and State and Local Obligations are not considered to be of any credit risk since they carry the full obligation and guarantee of the U.S. Government.
Presented below is the City’s investment policy, or debt agreements, and the actual rating as of year-end for each investment type:
Total as ofApril 30, 2012 AAA Unrated
Governmental activities:Investments in State Investment Pool $3,389,858 $3,389,858 $ -U.S. Government Obligations 49,191 - 49,191
Total $3,439,049 $3,389,858 $49,191

-30-
CITY OF FREEPORT, ILLINOISNOTES TO FINANCIAL STATEMENTS
April 30, 2012
________
B. Deposits and Investments (Continued):
Total as ofApril 30, 2012 AAA Unrated
Pension Trust Funds:Investments in State Investment Pool $ 9,362 $9,362 $ -State and Local Obligations 9,918,290 * - -Equity Mutual Funds 20,023,721 - 20,023,721Common Stock 3,044,897 - 3,044,897U.S. Government Obligations 11,852,005 - 11,852,005
Total $44,848,275 $9,362 $34,920,623
* See Table 1 below
Rating Rating AgencyAA- Standard & Poor’s $ 471,876A+ Standard & Poor’s 455,771A Standard & Poor’s 727,587A- Standard & Poor’s 1,036,440BBB+ Standard & Poor’s 428,406BBB Standard & Poor’s 305,418BBB- Standard & Poor’s 142,627Aaa Moody’s 222,255Aa2 Moody’s 87,859Aa3 Moody’s 564,332A1 Moody’s 958,771A2 Moody’s 1,411,672A3 Moody’s 1,369,231Baa1 Moody’s 678,174Baa2 Moody’s 630,651Baa3 Moody’s 326,141Not Rated Moody’s 101,079
Total $9,918,290

-31-
CITY OF FREEPORT, ILLINOISNOTES TO FINANCIAL STATEMENTS
April 30, 2012
________
B. Deposits and Investments (Continued):
Concentration of Credit Risk:
The City has no investments, other than mutual funds that are exempted from this requirement, in any one issuer that represent 5% or more of total City’s investments.
Custodial Credit Risk:
The custodial credit risk for investments is the risk that, in the event of the failure of the counterparty to a transaction, a government will not be able to recover the value of its investment or collateral securities that are in the possession of another party.
As of April 30, 2012 there are no investments with custodial credit risk in that all of its investments are insured.
Foreign Currency Risk:
The City has no foreign currency risk for investments at year end.
C. Property, Plant and Equipment:
Capital assets, which include buildings, land improvements, construction in progress and equipment are reported in the government-wide financial statements. The City defines capital assets as assets with an initial individual cost of more than $1,000 to $100,000 depending on the asset type, and an estimated useful life in excess of one year. Such assets are recorded at historical cost if purchased or constructed. For those assets for which historical cost is not available, the City has estimated historical cost by using current costs and adjusting for inflation. Donated assets are stated at estimated fair market value as of the date of acquisition. The cost of normal maintenance and repair that do not add to the value of the asset or materially extend the useful life are not capitalized. Major outlays for capital assets and improvements are capitalized as projects are constructed. All capital assets, except construction in progress, are being depreciated using the straight line method over the following useful lives:
Buildings & Improvements 50 yearsInfrastructure 50 yearsEquipment & Vehicles 8 - 20 years
Capital assets in the governmental fund financial statements are reported as expenditures when incurred.

-32-
CITY OF FREEPORT, ILLINOISNOTES TO FINANCIAL STATEMENTS
April 30, 2012
________
C. Property, Plant and Equipment (Continued):
The governmental activities capital asset activity for the year ended April 30, 2012 is as follows:
Balance BalanceMay 1, 2011 Additions Deletions April 30, 2012
Capital assets being depreciated:Buildings $12,059,522 $ 213,313 $ - $12,272,835Infrastructure 9,069,495 - - 9,069,495Equipment 1,628,747 69,644 - 1,698,391Vehicles 5,711,267 350,741 106,013 5,955,995
Total capital assets being depreciated 28,469,031 633,698 106,013 28,996,716
Less accumulated depreciation for:Buildings 4,112,138 208,838 - 4,320,976Infrastructure 3,409,013 181,390 - 3,590,403Equipment 1,441,916 53,275 - 1,495,191Vehicles 4,332,706 343,110 98,854 4,576,962
Total accumulated depreciation 13,295,773 786,613 98,854 13,983,532
Governmental activities capital assets, net $15,173,258 $(152,915) $ 7,159 $15,013,184
The business-type activities capital asset activity for the year ended April 30, 2012 is as follows:
Balance BalanceMay 1, 2011 Additions Deletions April 30, 2012
Capital assets not being depreciated:Work in process $ 617,956 $2,333,936 $495,074 $ 2,456,818
Capital assets being depreciated:Buildings 23,830,109 - - 23,830,109Infrastructure 40,246,009 495,074 - 40,741,083Equipment 5,756,170 - - 5,756,170
Total capital assets being depreciated 69,832,288 495,074 - 70,327,362

-33-
CITY OF FREEPORT, ILLINOISNOTES TO FINANCIAL STATEMENTS
April 30, 2012
________
C. Property, Plant and Equipment (Continued):
Balance BalanceMay 1, 2011 Additions Deletions April 30, 2012
Less accumulated depreciation for:Buildings 7,195,086 558,377 - 7,753,463Infrastructure 11,973,370 776,802 - 12,750,172Equipment 2,927,357 115,239 - 3,042,596
Total accumulated depreciation 22,095,813 1,450,418 - 23,546,231
Business-type activities capital assets, net 47,736,475 955,344 - 46,781,131
Business-type activities capital assets, net $48,354,431 $2,829,010 $495,074 $49,237,949
Depreciation expense was charged to function/programs of the primary government as follows:
Governmental activities:
General government $ 13,424Public safety 180,187Public works 450,930Culture and recreation 142,072
Total depreciation expense, governmental activities $786,613
Business-type activities:
Water Department $ 350,613Sewer Department 876,521Storm Sewer Department 223,284
Total depreciation expense, business-type activities $1,450,418

-34-
CITY OF FREEPORT, ILLINOISNOTES TO FINANCIAL STATEMENTS
April 30, 2012
________
D. Long-Term Debt:
LEASE OBLIGATIONS
The City was obligated under certain leases accounted for as capital leases.
On February 1, 2003, the City entered into a capital lease for the purchase of a Fire Truck in the amount of $643,899. The City agreed to pay 10 annual payments of $88,411 at an interest rate of 4.5% with final payment on February 1, 2012. This lease was paid off during the year.
On March 30, 2012, the City entered into a capital lease for the purchase of a Fire Truck in the amount of $445,000. The City agreed to pay 20 quarterly payments of $23,422 at an interest rate of 1.975% with final payment on March 30, 2017.
Annual debt service requirements to maturity are as follows:
Fiscal YearEndingApril 30 Principal Interest
2013 $ 85,528 $ 8,1582014 87,230 6,4562015 88,965 4,7212016 90,736 2,9502017 92,541 1,145
Total $445,000 $23,430
INSTALLMENT CONTRACTS/NOTES PAYABLE
The City enters into installment contracts/notes payable to provide funds for the acquisition of capital assets.
Installment contracts/notes payable currently outstanding included in long-term debt are as follows:
Fund Debt Balances BalancesIssue Retired By May 1 Additions Reductions April 30
US Bank, payable monthlywith interest at 4.76%, due DebtFebruary 22, 2012 Service $ 25,502 $ - $ 25,502 $ -

-35-
CITY OF FREEPORT, ILLINOISNOTES TO FINANCIAL STATEMENTS
April 30, 2012
________
D. Long-Term Debt (Continued):
INSTALLMENT CONTRACTS/NOTES PAYABLE (CONTINUED)
Fund Debt Balances BalancesIssue Retired By May 1 Additions Reductions April 30
Midwest Bank, payable monthlywith interest at 4.13% due DebtNovember 9, 2011 Service 81,248 - 81,248 -
US Bank, payable monthlywith interest at 5.71% due DebtJanuary 11, 2022 Service 91,130 - 6,292 84,838
US Bank, payable monthlywith interest at 5.37%, due DebtJanuary 31, 2022 Service 49,284 - 3,469 45,815
State Bank, payable annuallywith interest at 5.60%, due Debt July 23, 2013 Service 346,632 - 109,870 236,762
US Bank, payable monthly General/with interest at 2.77%, due LandfillApril 28, 2020 Closure 686,251 - 66,035 620,216
$1,280,047 $ - $292,416 $987,631
Annual debt service requirements to maturity are as follows:
Fiscal YearEndingApril 30 Principal Interest
2013 $194,346 $ 41,7982014 202,822 32,2872015 84,880 22,3462016 88,170 19,0562017 91,597 15,630
2018 – 2022 325,816 26,447
Total $987,631 $157,564

-36-
CITY OF FREEPORT, ILLINOISNOTES TO FINANCIAL STATEMENTS
April 30, 2012
________
D. Long-Term Debt (Continued):
IEPA LOAN PAYABLE
On November 15, 2011, the City entered into two separate agreements with the Illinois Environmental Protection Agency (IEPA). One agreement was for a loan up to $9,873,218where the proceeds would be expended on upgrades to the public water supply loan. The other agreement was for a loan up to $9,059,782 where the proceeds would be expended on upgrades to the wastewater treatment plan. The City will request reimbursements over the construction period which ends October 17, 2013 for the public water loan and August 18, 2013 for the wastewater treatment loan. If all of the requirements are met for the project, 25% of the loans will be forgiven by the IEPA. The remaining loans will then be repaid in semi-annual payments over 20 years beginning February 18, 2014 and ending August 18, 2033 for the public water loan and December 17, 2013 and ending June 17, 2033 for the wastewater treatment loan. Both loans will be repaid with an interest rate of 1.25%. As of April 30, 2012, the City had borrowed $823,879 against the public water loan and $1,304,098 against the wastewater treatment loan.
GENERAL OBLIGATION BONDS
2000 Issue
On March 6, 2000 the City passed an ordinance for the issuance of $16,000,000 Bond Series of 2000. The purpose of the bonds is to pay the costs of the construction of upgrades to the City’s wastewater treatment plant and various other capital improvements within the City, pay capitalized interest on the Bonds for a period of one year, pay the costs of issuance of the Bonds and refund all or a portion of the City’s General Obligation Bonds, Series 1993 dated May 13, 1993, originally issued in the aggregate principal amount of $3,395,000. This bond was paid off during the fiscal year.
2003 Issue
On June 2, 2003 the City passed an ordinance for the issuance of $12,750,000 Bond Series of 2003. The purpose of the bonds is to complete storm water projects, fund city's commitmentto the new library, and TIF commitment to Raleigh office complex.
2004 Issue
On December 15, 2004 the City passed an ordinance for the issuance of $8,665,000 Bond Series of 2004. The purpose of the bonds is to refund a portion of the 2000 Issue and realize interest savings due to lower interest rates.
-37-
CITY OF FREEPORT, ILLINOISNOTES TO FINANCIAL STATEMENTS
April 30, 2012
________
D. Long-Term Debt (Continued):
GENERAL OBLIGATION BONDS (CONTINUED)
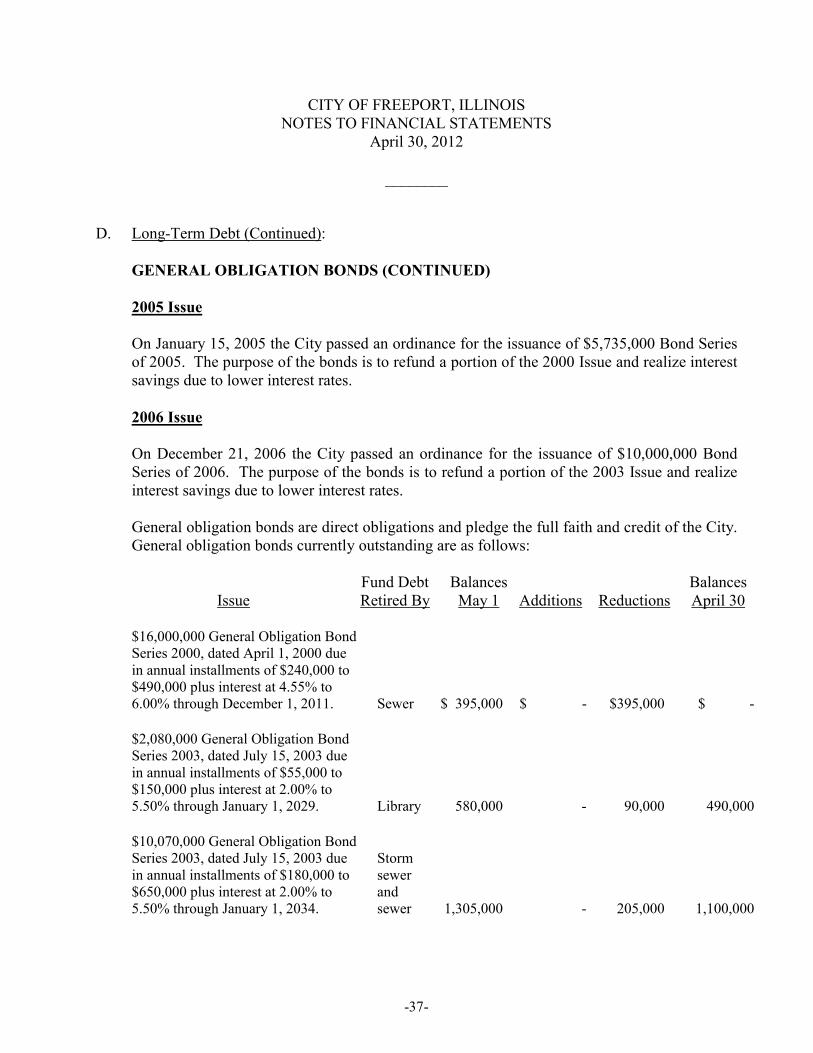
2005 Issue
On January 15, 2005 the City passed an ordinance for the issuance of $5,735,000 Bond Series of 2005. The purpose of the bonds is to refund a portion of the 2000 Issue and realize interest savings due to lower interest rates.
2006 Issue
On December 21, 2006 the City passed an ordinance for the issuance of $10,000,000 Bond Series of 2006. The purpose of the bonds is to refund a portion of the 2003 Issue and realize interest savings due to lower interest rates.
General obligation bonds are direct obligations and pledge the full faith and credit of the City. General obligation bonds currently outstanding are as follows:
Fund Debt Balances BalancesIssue Retired By May 1 Additions Reductions April 30
$16,000,000 General Obligation BondSeries 2000, dated April 1, 2000 duein annual installments of $240,000 to$490,000 plus interest at 4.55% to6.00% through December 1, 2011. Sewer $ 395,000 $ - $395,000 $ -
$2,080,000 General Obligation BondSeries 2003, dated July 15, 2003 duein annual installments of $55,000 to$150,000 plus interest at 2.00% to5.50% through January 1, 2029. Library 580,000 - 90,000 490,000
$10,070,000 General Obligation BondSeries 2003, dated July 15, 2003 due Stormin annual installments of $180,000 to sewer$650,000 plus interest at 2.00% to and5.50% through January 1, 2034. sewer 1,305,000 - 205,000 1,100,000

-38-
CITY OF FREEPORT, ILLINOISNOTES TO FINANCIAL STATEMENTS
April 30, 2012
________
D. Long-Term Debt (Continued):
GENERAL OBLIGATION BONDS (CONTINUED)
Fund Debt Balances BalancesIssue Retired By May 1 Additions Reductions April 30
$8,665,000 General Obligation BondSeries 2004, dated December 15, 2004due in annual installments of $60,000to $800,000 plus interest at 2.50% to4.375% through December 1, 2024 Sewer 8,270,000 - 70,000 8,200,000
$5,735,000 General Obligation BondSeries 2005, dated January 15, 2005due in annual installments of $25,000to $1,095,000 plus interest at 2.25% to4.70% through December 1, 2024 Sewer 5,535,000 - 30,000 5,505,000
$10,000,000 General Obligation Bond TIF,Series 2006, dated December 21, 2006 Library,due in annual installments of $35,000 Stormto $645,000 plus interest at 4.00% to Sewer, and4.20% through January 1, 2034 Sewer 9,820,000 - 55,000 9,765,000
$25,905,000 $ - $845,000 $25,060,000
Annual debt service requirements to maturity are as follows:
Fiscal YearEndingApril 30 Principal Interest
2013 $ 880,000 $ 1,073,346 2014 910,000 1,034,673 2015 955,000 991,467 2016 1,000,000 946,069 2017 1,045,000 901,170 2018 – 2022 5,915,000 3,828,202 2023 – 2027 7,165,000 2,514,223 2028 – 2032 6,010,000 893,644 2033 – 2034 1,180,000 74,970
Total $25,060,000 $12,257,764

-39-
CITY OF FREEPORT, ILLINOISNOTES TO FINANCIAL STATEMENTS
April 30, 2012
________
D. Long-Term Debt (Continued):
CHANGES IN LONG-TERM LIABILITIES
During the fiscal year the following changes occurred in long-term debt:
Balances BalancesMay 1 Additions Reductions April 30
Installment notes $ 1,280,047 $2,127,977 $ 292,416 $ 3,115,608Capitalized leases 84,639 445,000 84,639 445,000General obligation bonds payable 25,905,000 - 845,000 25,060,000
Total $27,269,686 $2,572,977 $1,222,055 $28,620,608
LEGAL DEBT MARGIN
The City is a home rule municipality.
Article VII, Section 6(k) of the 1970 Illinois Constitution governs computation of the legal debt margin.
“The General Assembly may limit by law the amount and require referendum approval of debt to be incurred by home rule municipalities, payable from ad valorem property tax receipts; only in excess of the following percentages of the assessed value of its taxable property (2) if its population is more than 25,000 and less than 500,000 an aggregate of one percent…indebtedness which is outstanding on the effective date (July 1, 1971) of this constitution or which is thereafter approved by referendum…shall not be included in the foregoing percentage amounts”.
To date the General Assembly has set no limits for home rule municipalities.
E. Debt Defeasance:
In prior years, the City defeased a portion of the 2000 and 2003 General Obligation bond issues by creating separate irrevocable trust funds. New debt was issued and the proceeds have been used to purchase U.S. government securities that were placed in the trust funds. The investments and fixed earnings from the investments are sufficient to fully service the defeased debt until the debt is called or matures. For financial reporting purposes, the debt has been considered defeased and therefore removed as a liability from the City’s financial statements. As of April 30, 2012, the amount of defeased debt from the 2000 and 2003 issuesoutstanding but removed from the City’s financial statements amounted to $19,935,000.

-40-
CITY OF FREEPORT, ILLINOISNOTES TO FINANCIAL STATEMENTS
April 30, 2012
________
F. Conduit Debt:
Governmental entities may enter into arrangements whereby a non-governmental entity is able to finance the acquisition of facilities by issuing conduit debt obligations. Conduit debt obligations are therefore certain limited obligation revenue bonds issued by a state or local governmental entity for a specific third party that is not a part of the issuer’s financial reporting entity.
The City entered into an agreement described above with Freeport Regional Health Care Foundation on June 16, 2008. $8,000,000 of Health Care Facilities Revenue Bonds (Freeport Regional Health Care Foundation Project) Series 2008 were issued in the City’s name. At the same time a mortgage agreement was signed between the City and Freeport Regional Health Care. Freeport Regional Health Care used the proceeds to build a new hospital facility. The mortgage agreement is set up to cover the payments of the mortgage revenue bonds. At April 30, 2012, there was $7,560,000 of Health Care Facilities Revenue Bonds (Freeport Regional Health Care Foundation Project) Series 2008 outstanding.
The City has no responsibility for the payment of the debt except for the payments received from Freeport Regional Health Care on the underlying mortgage loan agreement.
G. Interfund Assets/Liabilities:
At April 30, 2012, the following interfund receivables/payables existed:
Interfund InterfundReceivables Payables
Governmental funds: General $ 507,786 $ 15,893 Non-major governmental funds 21,743 478,515Proprietary funds: Water 1,365,000 335,339 Sewer - 905,000 Storm Sewer - 460,000 Internal Service - 35,121 Health and Environment 335,339 -
$2,229,868 $2,229,868
The purpose of the interfund loans is to fund temporary cash deficits in each of the borrowing funds. The loans will be paid back when sufficient cash amounts exist in those funds.

-41-
CITY OF FREEPORT, ILLINOISNOTES TO FINANCIAL STATEMENTS
April 30, 2012
________
H. Transfers:
Below are the interfund transfers as of April 30, 2012:
Operating OperatingTransfers in Transfers out
Governmental Funds: General $255,325 $(409,245) Non-Major Governmental Funds 705,585 (551,665)
Total all funds $960,910 $(960,910)
The purpose of these transfers was to subsidize special revenue funds and to reimburse theGeneral fund for administrative services provided to the Public Library Fund.
I. Solid Waste Landfill Closure and Postclosure Care Costs:
The City owns and operated a landfill site that was closed in 2003. State and federal laws require the City to close the landfill and to monitor and maintain the site for thirty subsequent years. The City recognized a portion of the closure and postclosure care costs in each operating period even though actual payouts will occur as the landfill is capped and monitored. As of April 30, 2012, the Government has incurred a liability of $2,620,490 which represents the estimated costs of capping and monitoring the landfill. The estimated costs of closure and postclosure care are subject to changes such as the effects of inflation, revision of laws, and other variables.
The City has established an enterprise fund to accumulate assets needed for the actual payout of closure and postclosure care costs. As of April 30, 2012, assets reported on the combined balance sheet which total $45,877 are held for this purpose.
The City was required by state and federal laws and regulations to make annual contributions to finance the closure and postclosure care costs while the landfill was in operation. The City complied with these requirements until the landfill was closed in 2003. The City expects that future inflation costs will be paid from interest earnings on these annual contributions and transfer station rents with the difference being funded by general fund contributions. The amount of future general fund contributions cannot be determined at this time. The amount will depend on the amount of actual interest earnings and the timing of monitoring costs over the thirty year monitoring period.

-42-
CITY OF FREEPORT, ILLINOISNOTES TO FINANCIAL STATEMENTS
April 30, 2012
________
J. Legal Compliance and Accountability:
DEFICIT FUND BALANCES/RETAINED EARNINGS OF INDIVIDUALS FUNDS
The following funds had a deficit in fund balance/retained earnings as of the date of this report:
DeficitFund Balance
Enterprise:Landfill Closure Fund $(2,911,924)
K. Fund Balance Reporting:
According to Government Accounting Standards, fund balances are to be classified into five major classifications; Nonspendable Fund Balance, Restricted Fund Balance, Committed Fund Balance, Assigned Fund Balance, and Unassigned Fund Balance. Below are definitions of the how these balances are reported.
1. Nonspendable Fund Balance
The nonspendable fund balance classification includes amounts that cannot be spent because they are either (a) not in spendable form or (b) legally or contractually required to be maintained intact. The “not in spendable form” criterion includes items that are not expected to be converted to cash, for example inventories and prepaid amounts. The City reports prepaid expenses as nonspendable fund balance within different funds for the following purposes:
Nonspendable for General Fund $565,704Nonspendable for Fire Capital Improvements $3,750
2. Restricted Fund Balance
The restricted fund balance classification refers to amounts that are subject to outside restrictions, not controlled by the entity. Things such as restrictions imposed by creditors, grantors, contributors, or laws and regulations of other governments, or imposed by law through constitutional provisions or enabling legislation. The City has several revenue sources received within different funds that are restricted for the following purposes:

April 30, 2012
K. Fund Balance Reporting (Continued):
2. Restricted Fund Balance (Continued)
Restricted for IMRF 125,402$
Restricted for Streets 682,070
Restricted for Cemetery Care 105,734
Restricted for Tourism Promotion 114,211
Restricted for Grants 1
Restricted for Drug Forfeiture 25,946
Restricted for Downtown T.I.F. District 193,213
Restricted for Lamm Road T.I.F. District 93,938
Restricted for West Ave. T.I.F. District 22,283
Restricted for Burchard Hills T.I.F. District 3,259
Restricted for Public Library 451,882 Restricted for Street & Police Equipment 381,368
Total Restricted 2,199,307$
3. Committed Fund Balance
The committed fund balance classification refers to amounts that can only be used
for specific purposes pursuant to constraints imposed by formal action of the
government’s highest level of decision making authority (the City Council). Those
committed amounts cannot be used for any other purpose unless the government
removes or changes the specified use by taking the same type of formal action
it employed to previously commit those amounts.
The City Council commits fund balance by making motions or passing resolutions
to adopt policy or to approve contracts. Committed fund balance also incorporates
contractual obligations to the extent that existing resources in the fund have been
specifically committed for use in satisfying those contractual requirements.
The City has the amounts that are committed for the following purposes:
Committed for Future Capital Improvements 112,154$
Committed for Parking Lot Repairs 54,541
Committed for Debt Service 320,532 Committed for Fire Dept. Equipment 1,475,507
Total Committed 1,962,734$
CITY OF FREEPORT, ILLINOIS
NOTES TO FINANCIAL STATEMENTS
__________
-43-

-44-
CITY OF FREEPORT, ILLINOISNOTES TO FINANCIAL STATEMENTS
April 30, 2012
________
K. Fund Balance Reporting (Continued):
4. Assigned Fund Balance
The assigned fund balance classification refers to amounts that are constrained by the government’s intent to be used for a specific purpose, but are neither restricted norcommitted. Intent may be expressed by (a) the City Council itself or (b) the finance committee when the City Council has delegated the authority to assign amounts to be used for specific purposes. The City has several revenue sources received within different funds that are restricted for the following purposes:
Assigned for Fire Related Safety Programs $7,147
5. Unassigned Fund Balance
The unassigned fund balance classification is the residual classification for amounts in the General Fund for amounts that have not been restricted, committed, or assigned to specific purposes within the General Fund.
6. Expenditures of Fund Balance
Unless specifically identified, expenditures act to reduce restricted balances first, then committed balances, next assigned balances, and finally act to reduce unassigned balances. Expenditures for a specifically identified purpose will act to reduce the specific classification of fund balance that is identified.
L. Restricted Net Assets:
The following restricted net assets existed as of April 30, 2012:
Business-type Activities/Enterprise:Water Fund:
Reserved due to bond ordinance $139,789Sewer Fund:
Reserved due to bond ordinance $778,405Storm Sewer Fund:
Reserved due to bond ordinance $701,015
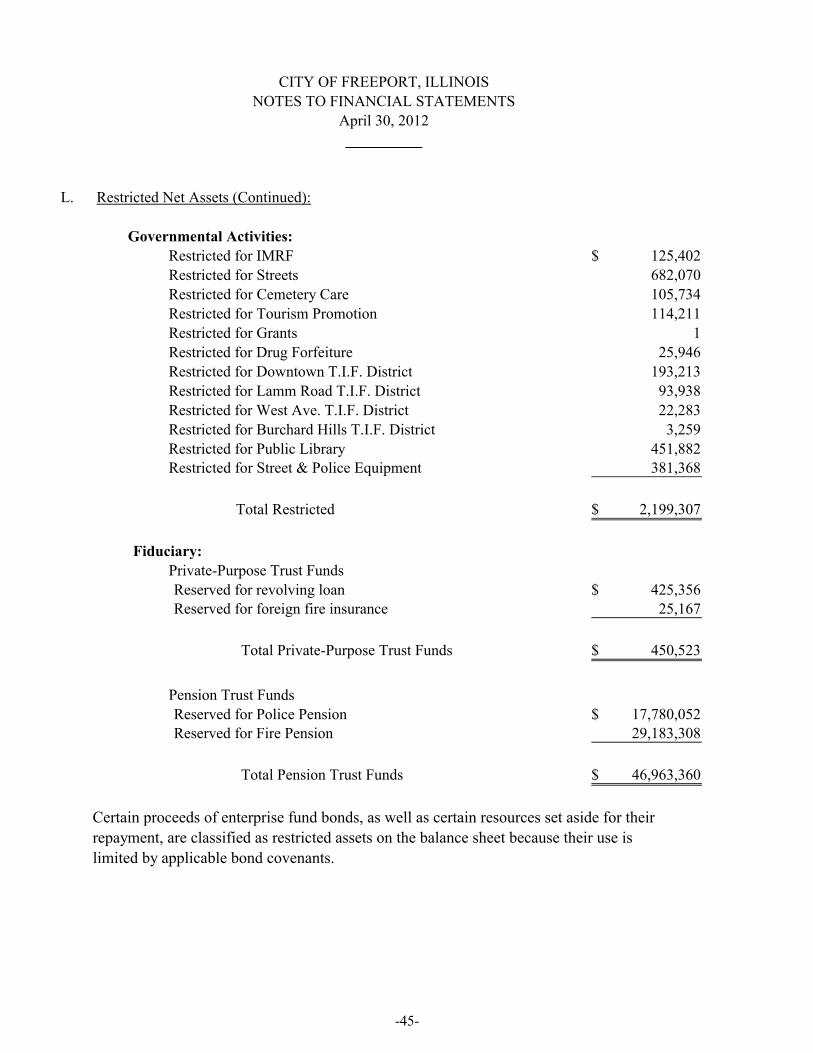
April 30, 2012
L. Restricted Net Assets (Continued):
Governmental Activities:
Restricted for IMRF 125,402$
Restricted for Streets 682,070
Restricted for Cemetery Care 105,734
Restricted for Tourism Promotion 114,211
Restricted for Grants 1
Restricted for Drug Forfeiture 25,946
Restricted for Downtown T.I.F. District 193,213
Restricted for Lamm Road T.I.F. District 93,938
Restricted for West Ave. T.I.F. District 22,283
Restricted for Burchard Hills T.I.F. District 3,259
Restricted for Public Library 451,882 Restricted for Street & Police Equipment 381,368
Total Restricted 2,199,307$
Fiduciary:
Private-Purpose Trust Funds
Reserved for revolving loan 425,356$ Reserved for foreign fire insurance 25,167
Total Private-Purpose Trust Funds 450,523$
Pension Trust Funds
Reserved for Police Pension 17,780,052$ Reserved for Fire Pension 29,183,308
Total Pension Trust Funds 46,963,360$
Certain proceeds of enterprise fund bonds, as well as certain resources set aside for their
repayment, are classified as restricted assets on the balance sheet because their use is
limited by applicable bond covenants.
CITY OF FREEPORT, ILLINOIS
NOTES TO FINANCIAL STATEMENTS
__________
-45-

-46-
CITY OF FREEPORT, ILLINOIS NOTES TO FINANCIAL STATEMENTS April 30, 2012 ________ M. Risk Management:
The City is exposed to various risks of loss related to torts; theft of, damage to, and destruction of assets; errors and omissions; injuries to employees; and natural disasters. These risks are covered by commercial insurance purchased from independent third parties.
The deductible in effect through these policies as of April 30, 2012 was $500 for “normal” claims and $25,000 for catastrophes. Settled claims from these risks have not exceeded commercial insurance coverage for the past five fiscal years.
The City is exposed to various risks of loss related to illness of employees. The City is self-insured for health insurance risks and has established a risk financing fund, Health Care Fund (the Fund), for these risks. It is accounted for as an internal service fund where assets are set aside for claim settlements. Under this program, the Fund provides coverage up to a maximum of $90,000 for each health claim. The City purchases commercial insurance for claims in excess of the coverages provided by the Fund. During fiscal year 2012, the City’s claims did not exceed its stop loss limits. Settled claims in each of the prior four fiscal years did not exceed commercial coverage.
All funds of the City participate and make payments to the Fund based upon actuarial
estimates of the amounts needed to pay prior and current-year claims. Liabilities of the Fund are reported when it is probable that a loss has occurred and the amount of the loss can be reasonably estimated. Liabilities include an amount for claims that have been incurred but not reported (IBNR). Claim liabilities are calculated considering the effects of inflation, recent claim settlement trends including frequency and amount of payouts, and other economic and societal factors. Changes in the balances of claims liabilities during the past fiscal year are as follows:
Fiscal Year Ended April 30, 2012
Unpaid claims - beginning $ 235,000
Incurred claims including IBNR, net of claims in excess of stop loss 3,027,248
Claim payments 3,109,748
Unpaid claims - ending $ 152,500

-47-
CITY OF FREEPORT, ILLINOISNOTES TO FINANCIAL STATEMENTS
April 30, 2012
________
N. Segment Information-Enterprise Funds:
The City maintains the following enterprise funds which are intended to be self-supporting through user fees charged for services to the public. Financial segment information as of the date of this report and for the fiscal year is as follows:
Health and Storm LandfillEnvironment Water Sewer Sewer Closure
Operating revenues $1,623,436 $2,949,950 $3,385,926 $632,966 $ 268,299
Depreciation and amortization expense $ - $361,380 $865,754 $223,284 $ -
Operating income (loss) $1,453,148 $794,569 $104,622 $322,494 $8,384
Net income (loss) $385,209 $794,596 $(575,316) $(65,602) $8,421
Plant, property, and equipment: Additions $ - $1,356,801 $ 977,135 $ - $ - Deletions $ - $ - $ - $ - $ -
Allowance for uncollectible accounts $ - $(72,121) $(54,964) $(13,232) $ -
Total assets $385,359 $17,435,170 $31,039,129 $10,348,718 $70,093
Net working capital $273,006 $3,029,397 $(1,233,066) $(27,911) $(54,533)
Bonds and other long- term liabilities: Payable from operating revenues $ - $869,575 $15,716,561 $8,697,034 $2,857,391
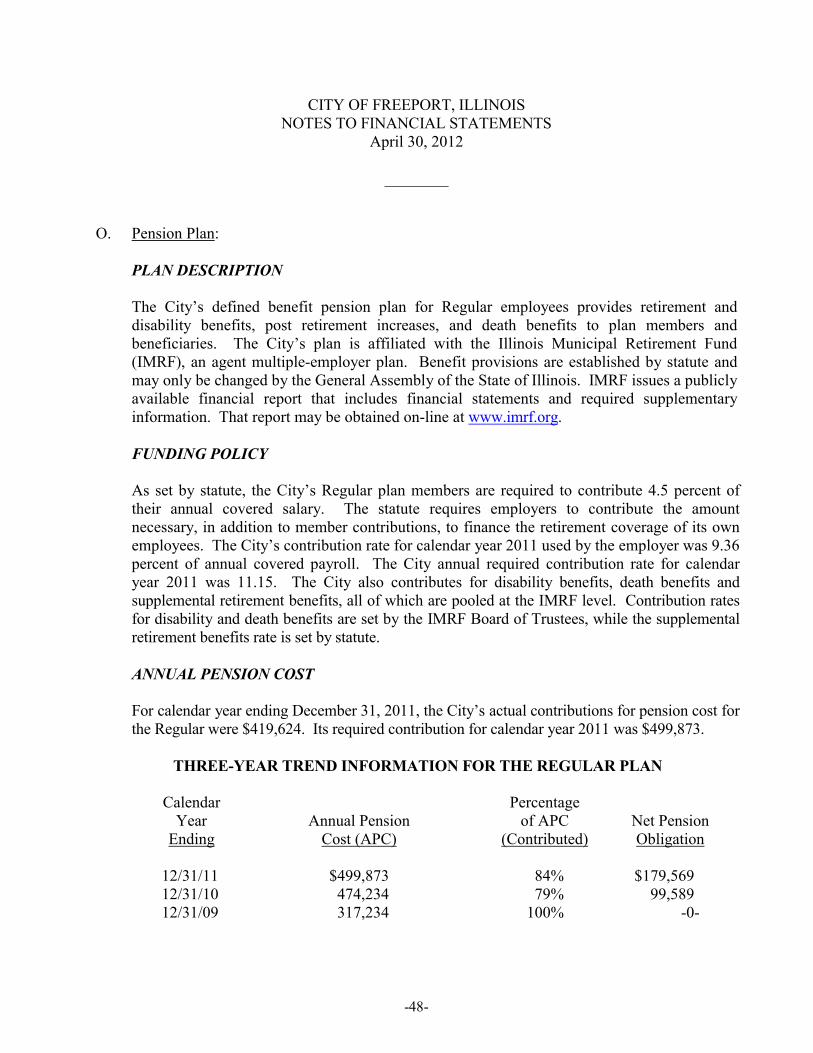
-48-
CITY OF FREEPORT, ILLINOISNOTES TO FINANCIAL STATEMENTS
April 30, 2012
________
O. Pension Plan:
PLAN DESCRIPTION
The City’s defined benefit pension plan for Regular employees provides retirement anddisability benefits, post retirement increases, and death benefits to plan members and beneficiaries. The City’s plan is affiliated with the Illinois Municipal Retirement Fund(IMRF), an agent multiple-employer plan. Benefit provisions are established by statute and may only be changed by the General Assembly of the State of Illinois. IMRF issues a publicly available financial report that includes financial statements and required supplementary information. That report may be obtained on-line at www.imrf.org.
FUNDING POLICY
As set by statute, the City’s Regular plan members are required to contribute 4.5 percent of their annual covered salary. The statute requires employers to contribute the amount necessary, in addition to member contributions, to finance the retirement coverage of its own employees. The City’s contribution rate for calendar year 2011 used by the employer was 9.36percent of annual covered payroll. The City annual required contribution rate for calendar year 2011 was 11.15. The City also contributes for disability benefits, death benefits and supplemental retirement benefits, all of which are pooled at the IMRF level. Contribution rates for disability and death benefits are set by the IMRF Board of Trustees, while the supplemental retirement benefits rate is set by statute.
ANNUAL PENSION COST
For calendar year ending December 31, 2011, the City’s actual contributions for pension cost for the Regular were $419,624. Its required contribution for calendar year 2011 was $499,873.
THREE-YEAR TREND INFORMATION FOR THE REGULAR PLAN
Calendar PercentageYear Annual Pension of APC Net Pension
Ending Cost (APC) (Contributed) Obligation
12/31/11 $499,873 84% $179,56912/31/10 474,234 79% 99,58912/31/09 317,234 100% -0-

-49-
CITY OF FREEPORT, ILLINOISNOTES TO FINANCIAL STATEMENTS
April 30, 2012
________
O. Pension Plan (Continued):
ANNUAL PENSION COST (CONTINUED)
The required contribution for 2011 was determined as part of the December 31, 2009, actuarial valuation using the entry age normal actuarial cost method. The actuarial assumptions at December 31, 2009 included (a) 7.5% investment rate of return (net of administrative and direct investment expenses), (b) projected salary increases of 4.00% a year, attributable to inflation, (c) additional projected salary increases ranging from 0.4% to 10% per year depending on age and service, attributable to seniority/merit, and (d) post-retirement benefit increases of 3% annually. The actuarial value of the City’s Regular plan assets was determined using techniques that spread the effects of short-term volatility in the market value of investments over a five-year period with a 20% corridor between the actuarial and market value of assets. The City’s Regular plan’s unfunded actuarial accrued liability at December 31, 2009 is being amortized as a level percentage of projected payroll on an open 30 year basis.
FUNDED STATUS AND FUNDING PROGRESS
As of December 31, 2011, the most recent actuarial valuation date, the Regular plan was 76.90percent funded. The actuarial accrued liability for benefits was $13,654,023 and the actuarial value of assets was $10,500,214, resulting in an underfunded actuarial accrued liability (UAAL) of $3,153,809. The covered payroll for calendar year 2011 (annual payroll of active employees covered by the plan) was $4,483,167 and the ratio of the UAAL to the covered payroll was 70percent.
The schedule of funding progress, presented as RSI following the notes to the financial statements, presents multiyear trend information about whether the actuarial value of plan assets is increasing or decreasing over time relative to the actuarial accrued liability for benefits.
Police Pension
Police sworn personnel are covered by the Police Pension Plan which is a defined benefit single-employer pension plan. Although this is a single-employer pension plan, the defined benefits and employee and employer contributions levels are governed by Illinois Compiled Statutes (Chapter 40-Article 5/3) and may be amended only by the Illinois legislature. The City accounts for the plan as a pension trust fund.

-50-
CITY OF FREEPORT, ILLINOISNOTES TO FINANCIAL STATEMENTS
April 30, 2012
________
O. Pension Plan (Continued):
PLAN DESCRIPTIONS AND PROVISIONS (CONTINUED)
Police Pension (Continued)
At April 30, 2012, the Police Pension Plan membership consisted of:
Retirees and beneficiaries currently receiving benefits and terminated employees entitled to benefits but not yet receiving them 44
Current employees Vested 34 Nonvested 16
Total 94
The following is a summary of the Police Pension Plan as provided for in the Illinois Compiled Statutes.
The Police Pension Plan provides retirement benefits as well as death and disability benefitsunder two different “Tiers”. “Tier 1” (hired before 01/01/11) employees attaining the age of 50 or more with 20 or more years of creditable service are entitled to receive an annual retirement benefit of one-half of the salary attached to the rank held on the last day of service or for one year prior to the last day, whichever is greater. The pension shall be increased by 2.5 percent of such salary for each additional year of service over 20 years up to 30 years, to a maximum of 75 percent of such salary.
Employees with at least 8 years but less than 20 years of credited service may retire at or after age 60 and receive a reduced benefit. The monthly pension of a police officer who retired with 20 or more years of service after January 1, 1977 shall be increased annually, following the first anniversary date of retirement and be paid upon reaching the age of at least 55 years, by 3 percent of the original pension and 3 percent of the amount of pension payable at the time of the increase annually thereafter.
“Tier 2” (hired on or after 01/01/11) employees attaining the age of 55 or more with 10 or more years of creditable service are entitled to receive an annual retirement benefit of one-half of the salary attached to the rank based on the highest consecutive 96 months of the final 120 months of service. Pensionable salary is capped at $106,800. The pension shall be increased 2.5% of such salary for each additional year of service over 20 up to a maximum of 75 percent of such salary.
-51-
CITY OF FREEPORT, ILLINOISNOTES TO FINANCIAL STATEMENTS
April 30, 2012
________
O. Pension Plan (Continued):
PLAN DESCRIPTIONS AND PROVISIONS (CONTINUED)
Police Pension (Continued)
COLA increases begin at age 60 or on the first anniversary of the pension start date whichever is later. COLA increases will be based on the lesser of one half of the CPI-U (certified by the Illinois Department of Insurance) or 3 percent of the originally granted pension.
Covered employees are required to contribute 9.91 percent of their base salary to the Police Pension Plan. If an employee leaves covered employment with less than 20 years of service, accumulated employee contributions may be refunded without accumulated interest. The City is required to contribute the remaining amounts necessary to finance the plan as actuarially determined by an enrolled actuary. Municipalities are required to fund the pension fund to 90 percent of the total actuarial liabilities by 2040.
On March 30, 2011, the actuarial value of the pension fund’s assets shall be equal to the market value of the assets as of that date. In determining the actuarial value of assets after March 30, 2011, any actuarial gains or losses from investment returns incurred in a fiscal year shall be recognized in equal amounts over the five-year period following that fiscal year.
The Statutes also contain a Portability Ruling that may impact the police pension fund. If a police officer transfers to another fund, that officer's former fund may be required to transfer monies to the officer's current fund if one of two requirements are met. The police officer must have either actively served in the police department for two years or the officer was involuntarily terminated for reasons other than fault of the officer. In these cases, the former fund will be required to transfer to the current fund amounts equal to twice the amounts of employee contributions to the plan plus interest at the rate of 6 percent per year, compounded annually.
Firefighter’s Pension
Fire sworn personnel are covered by the Firefighter’s Pension Plan which is a defined benefit single-employer pension plan. Although this is a single-employer pension plan, the defined benefits as well as the employee and employer contributions levels are mandated by Illinois Compiled Statutes (Chapter 40-Article 5/4) and may be amended only by the Illinois legislature. The City accounts for the plan as a pension trust fund.
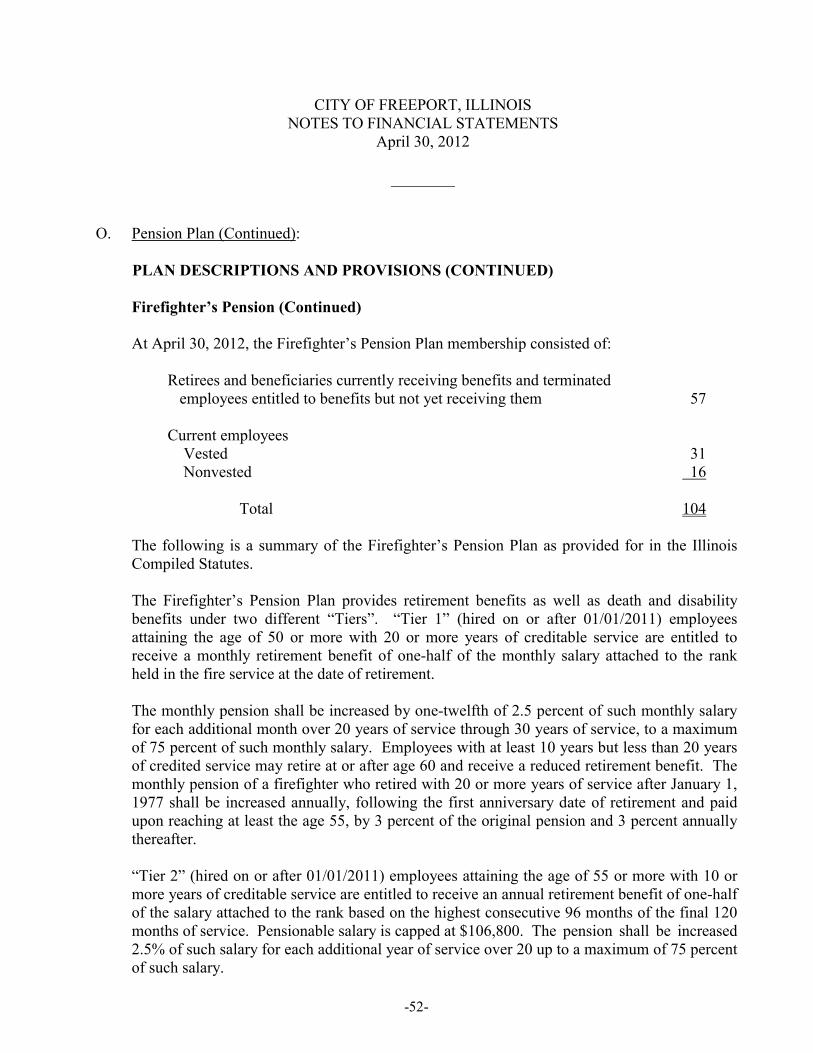
-52-
CITY OF FREEPORT, ILLINOISNOTES TO FINANCIAL STATEMENTS
April 30, 2012
________
O. Pension Plan (Continued):
PLAN DESCRIPTIONS AND PROVISIONS (CONTINUED)
Firefighter’s Pension (Continued)
At April 30, 2012, the Firefighter’s Pension Plan membership consisted of:
Retirees and beneficiaries currently receiving benefits and terminated employees entitled to benefits but not yet receiving them 57
Current employees Vested 31 Nonvested 16
Total 104
The following is a summary of the Firefighter’s Pension Plan as provided for in the Illinois Compiled Statutes.
The Firefighter’s Pension Plan provides retirement benefits as well as death and disability benefits under two different “Tiers”. “Tier 1” (hired on or after 01/01/2011) employees attaining the age of 50 or more with 20 or more years of creditable service are entitled to receive a monthly retirement benefit of one-half of the monthly salary attached to the rank held in the fire service at the date of retirement.
The monthly pension shall be increased by one-twelfth of 2.5 percent of such monthly salary for each additional month over 20 years of service through 30 years of service, to a maximum of 75 percent of such monthly salary. Employees with at least 10 years but less than 20 years of credited service may retire at or after age 60 and receive a reduced retirement benefit. The monthly pension of a firefighter who retired with 20 or more years of service after January 1, 1977 shall be increased annually, following the first anniversary date of retirement and paid upon reaching at least the age 55, by 3 percent of the original pension and 3 percent annually thereafter.
“Tier 2” (hired on or after 01/01/2011) employees attaining the age of 55 or more with 10 or more years of creditable service are entitled to receive an annual retirement benefit of one-half of the salary attached to the rank based on the highest consecutive 96 months of the final 120 months of service. Pensionable salary is capped at $106,800. The pension shall be increased 2.5% of such salary for each additional year of service over 20 up to a maximum of 75 percent of such salary.
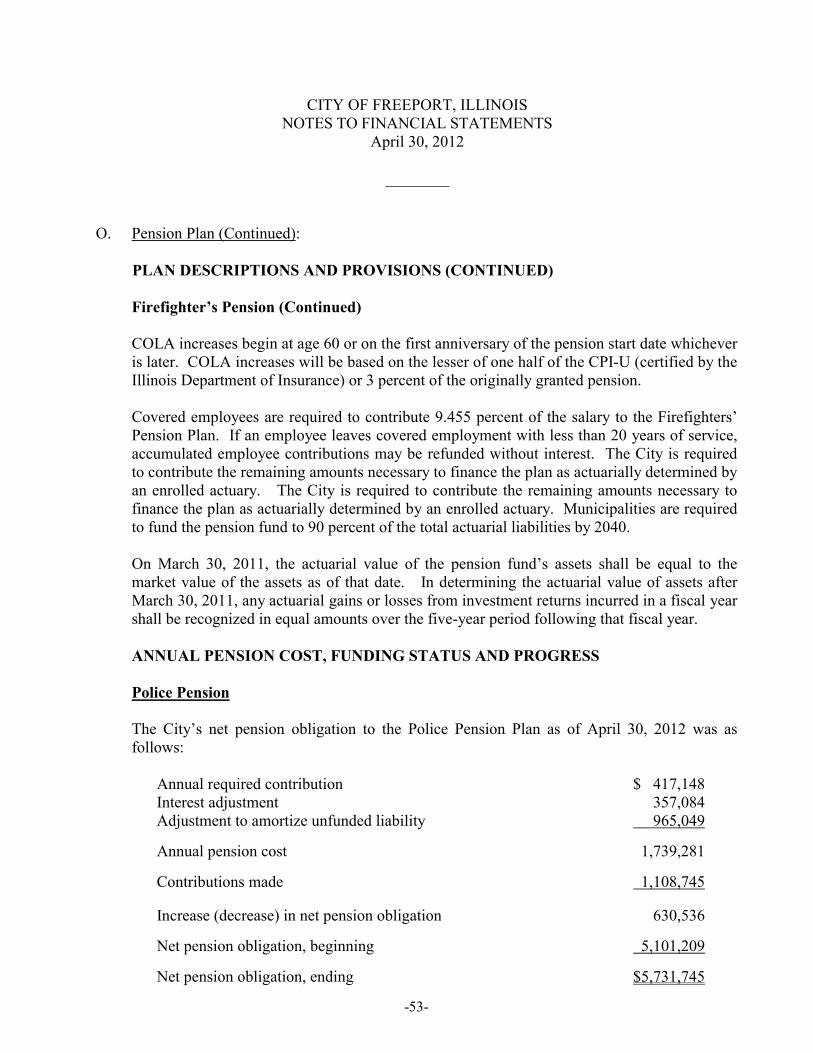
-53-
CITY OF FREEPORT, ILLINOISNOTES TO FINANCIAL STATEMENTS
April 30, 2012
________
O. Pension Plan (Continued):
PLAN DESCRIPTIONS AND PROVISIONS (CONTINUED)
Firefighter’s Pension (Continued)
COLA increases begin at age 60 or on the first anniversary of the pension start date whichever is later. COLA increases will be based on the lesser of one half of the CPI-U (certified by the Illinois Department of Insurance) or 3 percent of the originally granted pension.
Covered employees are required to contribute 9.455 percent of the salary to the Firefighters’ Pension Plan. If an employee leaves covered employment with less than 20 years of service, accumulated employee contributions may be refunded without interest. The City is requiredto contribute the remaining amounts necessary to finance the plan as actuarially determined by an enrolled actuary. The City is required to contribute the remaining amounts necessary to finance the plan as actuarially determined by an enrolled actuary. Municipalities are required to fund the pension fund to 90 percent of the total actuarial liabilities by 2040.
On March 30, 2011, the actuarial value of the pension fund’s assets shall be equal to the market value of the assets as of that date. In determining the actuarial value of assets after March 30, 2011, any actuarial gains or losses from investment returns incurred in a fiscal year shall be recognized in equal amounts over the five-year period following that fiscal year.
ANNUAL PENSION COST, FUNDING STATUS AND PROGRESS
Police Pension
The City’s net pension obligation to the Police Pension Plan as of April 30, 2012 was as follows:
Annual required contribution $ 417,148Interest adjustment 357,084Adjustment to amortize unfunded liability 965,049
Annual pension cost 1,739,281
Contributions made 1,108,745
Increase (decrease) in net pension obligation 630,536
Net pension obligation, beginning 5,101,209
Net pension obligation, ending $5,731,745

-54-
CITY OF FREEPORT, ILLINOISNOTES TO FINANCIAL STATEMENTS
April 30, 2012
________
O. Pension Plan (Continued):
ANNUAL PENSION COST, FUNDING STATUS AND PROGRESS (CONTINUED)
Police Pension (Continued)
The annual required contribution for the current year was determined as part of the April 30, 2010 actuarial valuation using the entry age normal cost method. The actuarial assumptions included (a) 7.0% investment rate of return and (b) projected salary increases of 5.5% per year. The unfunded actuarial accrued liability is being amortized as a level percentage of payroll in accordance with section 3-127 of the Illinois Pension Code. The remaining amortization period at April 30, 2011, was 22 years.
Three-Year Trend Information
Fiscal Annual Percentage NetYear Pension of APC Pension
Ending Cost (APC) Contributed Obligation
4/30/11 $1,739,282 63.75% $5,731,7454/30/10 1,654,982 61.98% 5,101,2094/30/09 1,448,869 64.74% 4,472,037
As of April 30, 2011, the most recent actuarial valuation date, the Police Pension plan was 49.6percent funded. The actuarial accrued liability for benefits was $35,254,806 and the actuarial value of assets was $17,482,448 resulting in an underfunded actuarial accrued liability (UAAL) of $17,772,358. The covered payroll (annual payroll of active employees covered by the plan) was $2,983,941 and the ratio of the UAAL to the covered payroll was 595.6 percent.
The schedule of funding progress, presented as RSI following the notes to the financial statements, presents multiyear trend information about whether the actuarial value of plan assets is increasing or decreasing over time relative to the actuarial accrued liability for benefits.
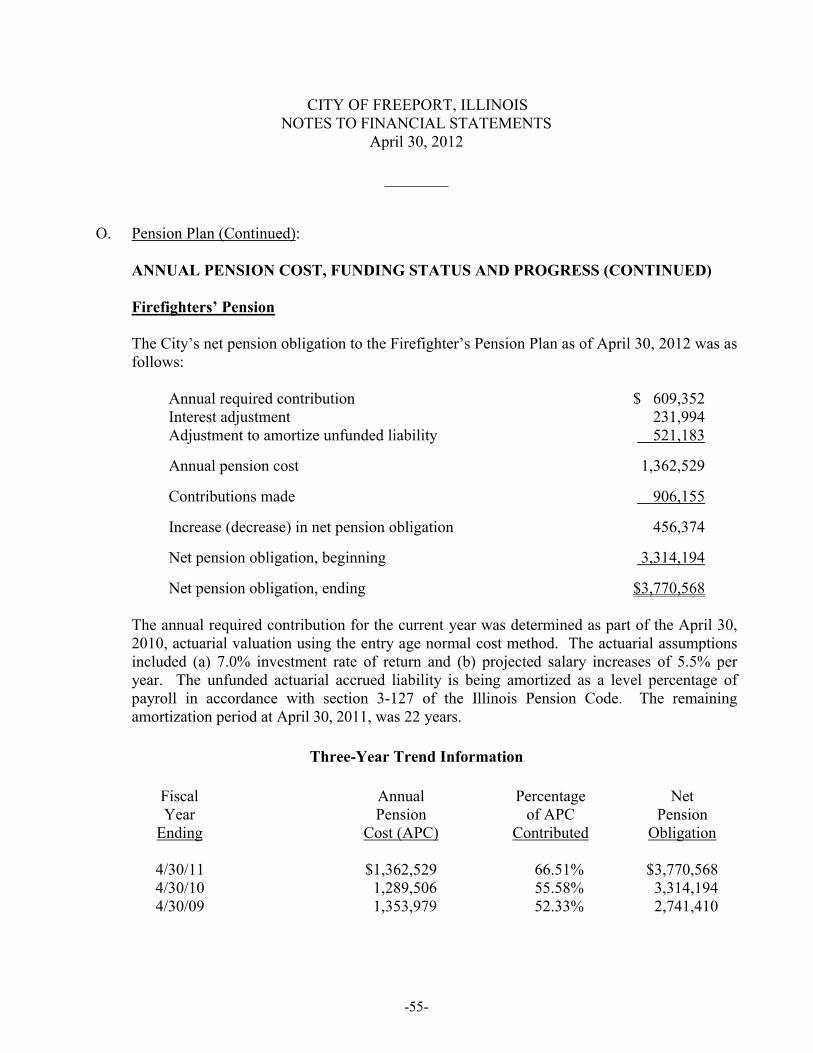
-55-
CITY OF FREEPORT, ILLINOISNOTES TO FINANCIAL STATEMENTS
April 30, 2012
________
O. Pension Plan (Continued):
ANNUAL PENSION COST, FUNDING STATUS AND PROGRESS (CONTINUED)
Firefighters’ Pension
The City’s net pension obligation to the Firefighter’s Pension Plan as of April 30, 2012 was as follows:
Annual required contribution $ 609,352Interest adjustment 231,994Adjustment to amortize unfunded liability 521,183
Annual pension cost 1,362,529
Contributions made 906,155
Increase (decrease) in net pension obligation 456,374
Net pension obligation, beginning 3,314,194
Net pension obligation, ending $3,770,568
The annual required contribution for the current year was determined as part of the April 30, 2010, actuarial valuation using the entry age normal cost method. The actuarial assumptions included (a) 7.0% investment rate of return and (b) projected salary increases of 5.5% per year. The unfunded actuarial accrued liability is being amortized as a level percentage of payroll in accordance with section 3-127 of the Illinois Pension Code. The remaining amortization period at April 30, 2011, was 22 years.
Three-Year Trend Information
Fiscal Annual Percentage NetYear Pension of APC Pension
Ending Cost (APC) Contributed Obligation
4/30/11 $1,362,529 66.51% $3,770,5684/30/10 1,289,506 55.58% 3,314,1944/30/09 1,353,979 52.33% 2,741,410

-56-
CITY OF FREEPORT, ILLINOISNOTES TO FINANCIAL STATEMENTS
April 30, 2012
________
O. Pension Plan (Continued):
ANNUAL PENSION COST, FUNDING STATUS AND PROGRESS (CONTINUED)
Firefighters’ Pension (Continued)
As of April 30, 2011, the most recent actuarial valuation date, the Fire Pension plan was 78.0percent funded. The actuarial accrued liability for benefits was $36,419,859 and the actuarial value of assets was $28,424,068 resulting in an underfunded actuarial accrued liability (UAAL) of $7,995,791. The covered payroll (annual payroll of active employees covered by the plan) was $2,862,891 and the ratio of the UAAL to the covered payroll was 279.3 percent.
The schedule of funding progress, presented as RSI following the notes to the financial statements, presents multiyear trend information about whether the actuarial value of plan assets is increasing or decreasing over time relative to the actuarial accrued liability for benefits.
P. Other Post-Employment Benefits:
Plan description. In addition to providing the pension benefits described, the City provides post-employment healthcare benefits (OPEB) for retired employees through a single employer defined benefit plan. The benefits, benefit levels, employee contributions and employer contribution are governed by the City and can be amended by the City through its personnel manual and union contracts. The plan is not accounted for as a trust fund, as an irrevocable trust has not been established to account for the plan. The plan does not issue a separate report. The activity of the plan is reported in the City’s governmental and business-type activities.
Benefits provided. The City provides continued health insurance coverage at the active employer rate to all eligible employees. To be eligible for the benefits, an employee must qualify for retirement under one of the City’s retirement plans.
Membership. At April 30, 2012, membership consisted of:
Retirees and beneficiaries currently receiving benefits 38Terminated employees entitled to benefits but not yet receiving benefits -Active vested plan members 115Active non-vested plan members 71
Total 224
Number of participating employers 1

-57-
CITY OF FREEPORT, ILLINOISNOTES TO FINANCIAL STATEMENTS
April 30, 2012
________
P. Other Post-Employment Benefits (Continued):
Funding policy. The City is not required to and currently does not advance fund the cost of benefits that will become due and payable in the future. Active employees do not contribute to the plan until retirement.
Annual OPEB Cost and Net OPEB Obligation. The City’s annual other post-employment benefits (OPEB) cost (expense) for the fiscal year ended April 30, 2012, is calculated based on the annual required contribution of the employer (ARC), an amount actuarially determined in accordance with the parameters of GASB Statement 45. The City’s annual OPEB cost, the percentage of annual OPEB cost contributed to the plan, and the net OPEB obligation for 2012was as follows:
Annual Percentage ofFiscal OPEB Employer Annual OPEB Net OPEB
Year ended Cost Contributions Cost Contributed Obligation
April 30, 2012 $ 618,068 $304,595 49.3% $3,439,962April 30, 2011 629,646 300,720 47.8% 3,126,489April 30, 2010 1,725,658 213,688 12.4% 2,797,563
The net OPEB obligation as of April 30, 2012, was calculated as follows:
Annual required contribution $ 571,442Interest of net OPEB obligation 139,878Adjustment to annual required contribution (93,252)
Annual OPEB cost 618,068Contributions made (304,595)
Increase (decrease) in net OPEB obligation 313,473Net OPEB obligation beginning of year 3,126,489
Net OPEB obligation end of year $3,439,962

-58-
CITY OF FREEPORT, ILLINOISNOTES TO FINANCIAL STATEMENTS
April 30, 2012
________
P. Other Post-Employment Benefits (Continued):
Funded Status and Funding in Process. The funded status of the plan as of April 30, 2012, was as follows:
Actuarial accrued liability (AAL) $8,919,997Actuarial value of plan assets -Unfunded actuarial accrued liability (UAAL) 8,919,997Funded ratio (actuarial value of plan assets/AAL) -Covered payroll (active plan members) 10,126,575UAAL as a percentage of covered payroll 88%
Actuarial valuations of an ongoing plan involve estimates of the value of reported amounts and assumptions about the probability of occurrence of events far into the future. Examples include assumptions about future employment, mortality, and the healthcare cost trend. Amounts determined regarding the funded status of the plan and the annual required contributions of the employer are subject to continual revision as actual results are compared with past expectations and new estimates are made about the future. The schedule of funding progress, presented as required supplementary information following the notes to the financial statements, presents multiyear trend information that shows whether the actuarial value of plan assets is increasing or decreasing over time relative to the actuarial accrued liabilities for benefits.
Actuarial Methods and Assumptions - Projections of benefits for financial reporting purposes are based on the substantive plan (the plan as understood by the employer and plan members) and include the types of benefits provided at the time of each valuation and the historical pattern of sharing of benefit costs between the employer and plan members to that point. The actuarial methods and assumptions used include techniques that are designed to reduce short-term volatility in actuarial accrued liabilities and the actuarial value of assets, consistent with the long-term perspective of the calculations.
In the April 30, 2012, actuarial valuation, the entry age actuarial cost method was used. The actuarial assumptions included a 5.0% investment rate of return and an initial healthcare cost trend rate of 8.0% with an ultimate healthcare inflation rate of 6.0%. Both rates include a 5.0% inflation assumption. The actuarial value of assets was not determined as the City has not advanced funded its obligation. The plan’s unfunded actuarial accrued liability is being amortized as a level percentage of projected payroll on a closed basis. The remaining amortization period at April 30, 2012, was 30 years.

-59-
CITY OF FREEPORT, ILLINOISNOTES TO FINANCIAL STATEMENTS
April 30, 2012
________
Q. Contingencies:
From time to time, the City is party to other pending claims and legal proceedings. Although the outcome of such matters cannot be forecast with certainty, it is the opinion of management and the City’s legal counsel that the likelihood is remote that any such claims or proceedings will have a material adverse effect on the City’s financial position or results of operations.
R. Restatement:
Fund balance has been restated due to the implementation of GASB Statement No. 54. The Economic Development, Insurance Reserve and Capital Improvement funds previously reported as special revenue and capital project funds have been combined with the General Fund for financial reporting purposes under the new fund-type definitions described under GASB Statement No. 54.
General Economic Insurance CapitalFund Development Reserve Improvements
Fund balance as previously reported, April 30, 2011 $5,080,387 $3,783 $2,911 $112,085Adjustment to include Economic Development Fund balance as of April 30, 2011 3,783 (3,783) - -Adjustment to include Insurance Reserve Fund balance as of April 30, 2011 2,911 - (2,911) -Adjustment to include Capital Improvements Fund balance as of April 30, 2011 112,085 - - (112,085)
Fund balance as restated, April 30, 2011 $5,199,166 $ - $ - $ -
S. Pending Accounting Pronouncements:
In December 2010, the Governmental Accounting Standards Board (GASB) issued Statement 61 “The Financial Reporting Entity: Omnibus - an amendment of GASB Statements No. 14 and No. 34.” The City is required to implement this standard for the fiscal year ending April30, 2014.
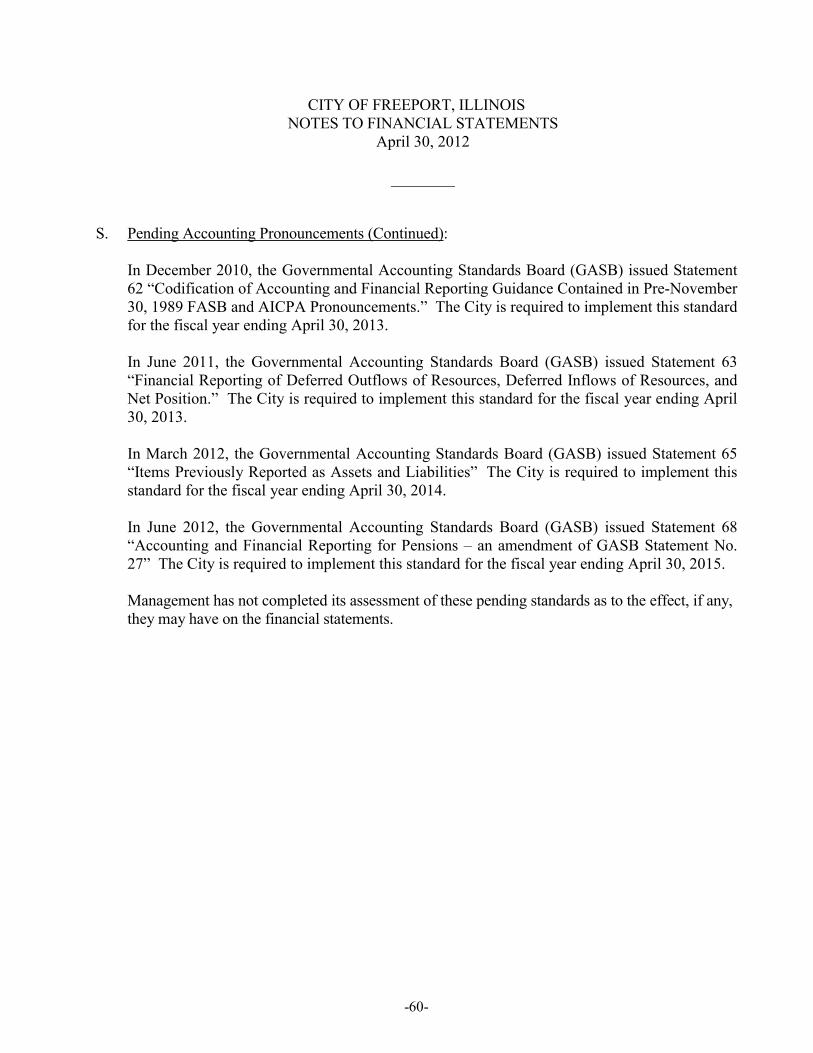
-60-
CITY OF FREEPORT, ILLINOISNOTES TO FINANCIAL STATEMENTS
April 30, 2012
________
S. Pending Accounting Pronouncements (Continued):
In December 2010, the Governmental Accounting Standards Board (GASB) issued Statement 62 “Codification of Accounting and Financial Reporting Guidance Contained in Pre-November 30, 1989 FASB and AICPA Pronouncements.” The City is required to implement this standard for the fiscal year ending April 30, 2013.
In June 2011, the Governmental Accounting Standards Board (GASB) issued Statement 63 “Financial Reporting of Deferred Outflows of Resources, Deferred Inflows of Resources, and Net Position.” The City is required to implement this standard for the fiscal year ending April30, 2013.
In March 2012, the Governmental Accounting Standards Board (GASB) issued Statement 65 “Items Previously Reported as Assets and Liabilities” The City is required to implement this standard for the fiscal year ending April 30, 2014.
In June 2012, the Governmental Accounting Standards Board (GASB) issued Statement 68 “Accounting and Financial Reporting for Pensions – an amendment of GASB Statement No. 27” The City is required to implement this standard for the fiscal year ending April 30, 2015.
Management has not completed its assessment of these pending standards as to the effect, if any, they may have on the financial statements.
REQUIRED SUPPLEMENTARY INFORMATION(UNAUDITED)

-61-
CITY OF FREEPORT, ILLINOISREQUIRED SUPPLEMENTARY INFORMATION
April 30, 2012
________
Illinois Municipal Retirement FundSchedule of Funding Progress
ActuarialAccrued UAAL as a
Actuarial Liability Unfunded PercentageActuarial Value of (AAL) AAL Funded Covered of CoveredValuation Assets Entry Age (UAAL) Ratio Payroll Payroll Date (a) (b) (b-a) (a/b) (c) ((b-a)/(c)
12/31/11 $10,500,214 $13,654,023 $3,153,809 76.90% $4,483,167 70.35%12/31/10 9,943,325 12,763,902 2,820,577 77.90% 4,395,129 64.18%12/31/09 11,024,256 13,195,289 2,171,033 83.55% 4,519,000 48.04%
On a market value basis, the actuarial value of assets as of December 31, 2011 is $9,842,375. On a market basis, the funded ratio would be 72.08%.
Retiree Health PlanSchedule of Funding Progress
ActuarialAccrued UAAL as a
Actuarial Actuarial Liability Unfunded PercentageValuation Value of (AAL) AAL Funded Covered of Covered
Date Assets Entry Age (UAAL) Ratio Payroll PayrollApril 30 (a) (b) (b-a) (a/b) (c) ((b-a)/(c)
4/30/12 $0 $ 8,919,997 $ 8,919,997 0.0% $10,126,575 88.09%4/30/11 0 8,919,997 8,919,997 0.0% 10,126,575 88.09%4/30/10 0 15,839,465 15,839,465 0.0% 10,495,006 150.92%

-62-
CITY OF FREEPORT, ILLINOISREQUIRED SUPPLEMENTARY INFORMATION
April 30, 2012
________
ACTUARIAL VALUATIONS FOR POLICE AND FIREFIGHTERS PENSION SYSTEMS
Police Pension Fund
Analysis of funding progress for the year ended April 30, 2012.(6)
UnfundedAccrued
(2) (4) Liability(1) Actuarial Unfunded as a
Actuarial Actuarial Accrued (3) Actuarial (5) PercentageValuation Value Liability Funded Accrued Annual of Covered
Date of Plan (AAL) Ratio Liability Covered PayrollApril 30 Assets Entry Age (1)/(2) (2)-(1) Payroll (4)/(5)
2011 $17,482,448 $35,254,806 49.6% $17,772,358 $2,983,941 595.6%2010 15,843,333 34,227,967 46.3% 18,384,634 2,897,030 634.6%2009 14,443,123 29,922,428 48.3% 15,479,305 2,970,165 521.2%2008 15,278,332 30,000,084 50.9% 14,721,752 3,042,379 483.9%2007 15,345,387 28,989,967 52.9% 13,644,580 2,819,378 484.0%2006 14,881,332 27,125,601 54.9% 12,244,269 2,742,792 446.4%
Fire Pension Fund
Analysis of funding progress for the year ended April 30, 2012.(6)
UnfundedAccrued
(2) (4) Liability(1) Actuarial Unfunded as a
Actuarial Actuarial Accrued (3) Actuarial (5) PercentageValuation Value Liability Funded Accrued Annual of Covered
Date of Plan (AAL) Ratio Liability Covered PayrollApril 30 Assets Entry Age (1)/(2) (2)-(1) Payroll (4)/(5)
2011 $28,424,068 $36,419,859 78.0% $7,995,791 $2,862,891 279.3%2010 25,430,308 35,359,086 71.9% 9,928,778 2,779,506 357.2%2009 22,139,703 34,110,453 64.9% 11,970,750 2,846,313 420.6%2008 26,223,233 32,705,508 80.2% 6,482,275 2,735,484 237.0%2007 26,230,887 30,088,786 87.2% 3,857,899 2,421,933 159.3%2006 24,528,748 28,028,435 87.5% 3,499,687 2,493,336 140.4%

REQUIRED SUPPLEMENTARY INFORMATION
Year ended April 30, 2012
Over
Original Final (Under)Budget Budget Actual Budget
Revenues:
Taxes:
Property taxes 2,392,618$ 2,392,618$ 2,402,514$ 9,896$
Property transfer tax 120,000 120,000 116,183 (3,817)
Retailers occupation tax 7,300,000 7,300,000 7,441,944 141,944
Income tax 2,000,000 2,000,000 2,172,207 172,207
Replacement tax 405,000 405,000 408,092 3,092
Food, drink tax 600,000 600,000 588,257 (11,743)
Utility tax 450,000 450,000 442,728 (7,272)
Special use tax 310,000 310,000 373,922 63,922
Natural gas tax 325,000 325,000 272,143 (52,857)
Telephone utility tax 775,000 775,000 807,589 32,589 Water and sewer payment 245,000 245,000 246,793 1,793
Total taxes 14,922,618 14,922,618 15,272,372 349,754
Fees:
Cable TV franchise fees 300,000 300,000 308,512 8,512
Circuit clerk fines and fees 315,000 315,000 338,393 23,393
Building fees and permits 195,100 195,100 268,588 73,488
Airport hangar rent 100,000 100,000 101,543 1,543 911 dispatching fees 86,000 86,000 74,533 (11,467)
Miscellaneous other charges for services 135,000 135,000 172,004 37,004
Total fees 1,131,100 1,131,100 1,263,573 132,473
Intergovernmental:
Grant administration reimbursements 30,000 30,000 61,063 31,063
IDOT reimbursement 55,000 55,000 55,955 955
Federal grant for SLANT officer 36,000 36,000 50,366 14,366
Fire training reimbursement 10,000 10,000 - (10,000)
Police training reimbursement 10,000 10,000 19,181 9,181 Traffic signal maintenance reimbursement 15,000 15,000 6,131 (8,869)
Total intergovernmental 156,000 156,000 192,696 36,696
__________
CITY OF FREEPORT, ILLINOIS
GENERAL FUND
SCHEDULE OF REVENUES COMPARED WITH BUDGET
-63-
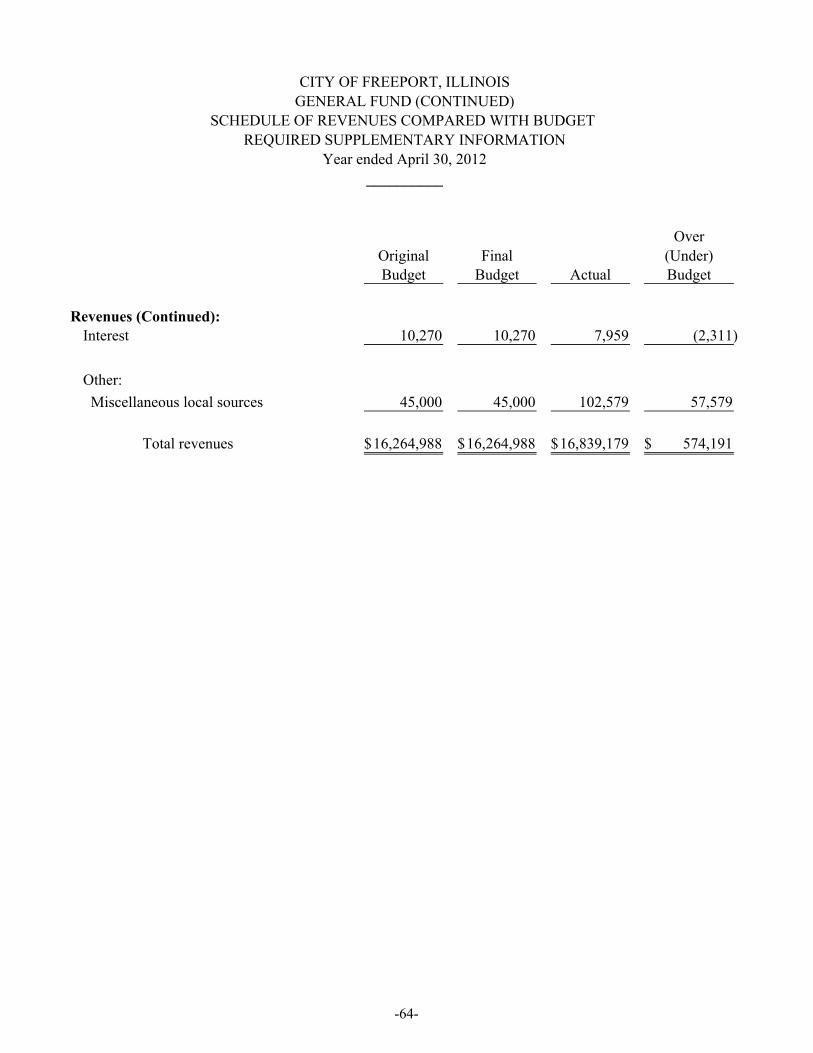
REQUIRED SUPPLEMENTARY INFORMATION
Year ended April 30, 2012
Over
Original Final (Under)Budget Budget Actual Budget
Revenues (Continued): Interest 10,270 10,270 7,959 (2,311)
Other:
Miscellaneous local sources 45,000 45,000 102,579 57,579
Total revenues 16,264,988$ 16,264,988$ 16,839,179$ 574,191$
__________
CITY OF FREEPORT, ILLINOIS
GENERAL FUND (CONTINUED)
SCHEDULE OF REVENUES COMPARED WITH BUDGET
-64-

REQUIRED SUPPLEMENTARY INFORMATION
Year ended April 30, 2012
Over
Original Final (Under)Budget Budget Actual Budget
Expenditures: General government:
City Council:
Elected officials 30,400$ 30,400$ 30,399$ (1)$
Ordinance codification 9,500 9,500 6,118 (3,382)
Total city council 39,900 39,900 36,517 (3,383)
Commissions:
Commissions stipends 4,325 4,325 4,300 (25)
Education, training and travel 11,500 11,500 9,951 (1,549) Books, periodicals, and memberships 3,000 3,000 375 (2,625)
Total commissions 18,825 18,825 14,626 (4,199)
City Clerk:
Elected officials 55,097 55,097 53,977 (1,120)
Printing 500 500 726 226
Publication expense 9,000 9,000 6,489 (2,511)
Education, training and travel 1,500 1,500 142 (1,358)
Insurance other than employee benefits 100 100 - (100)
Books, periodicals and memberships 500 500 345 (155)
Office supplies 1,500 1,500 1,072 (428)
Equipment, furniture and fixtures 1,850 1,850 1,138 (712)
Total city clerk 70,047 70,047 63,889 (6,158)
Mayor:
Non-bargaining 42,393 42,393 41,927 (466)
Elected officials 84,420 84,420 84,420 -
Contracted vehicle repair and maintenance 300 300 274 (26)
Contracted equip. repair and maintenance 200 200 - (200)
Telephone and communications 2,500 2,500 2,256 (244)
Printing 200 200 - (200)
Education, training and travel 4,500 5,000 5,441 441
__________
CITY OF FREEPORT, ILLINOIS
GENERAL FUND (CONTINUED)
SCHEDULE OF EXPENDITURES COMPARED WITH BUDGET
-65-
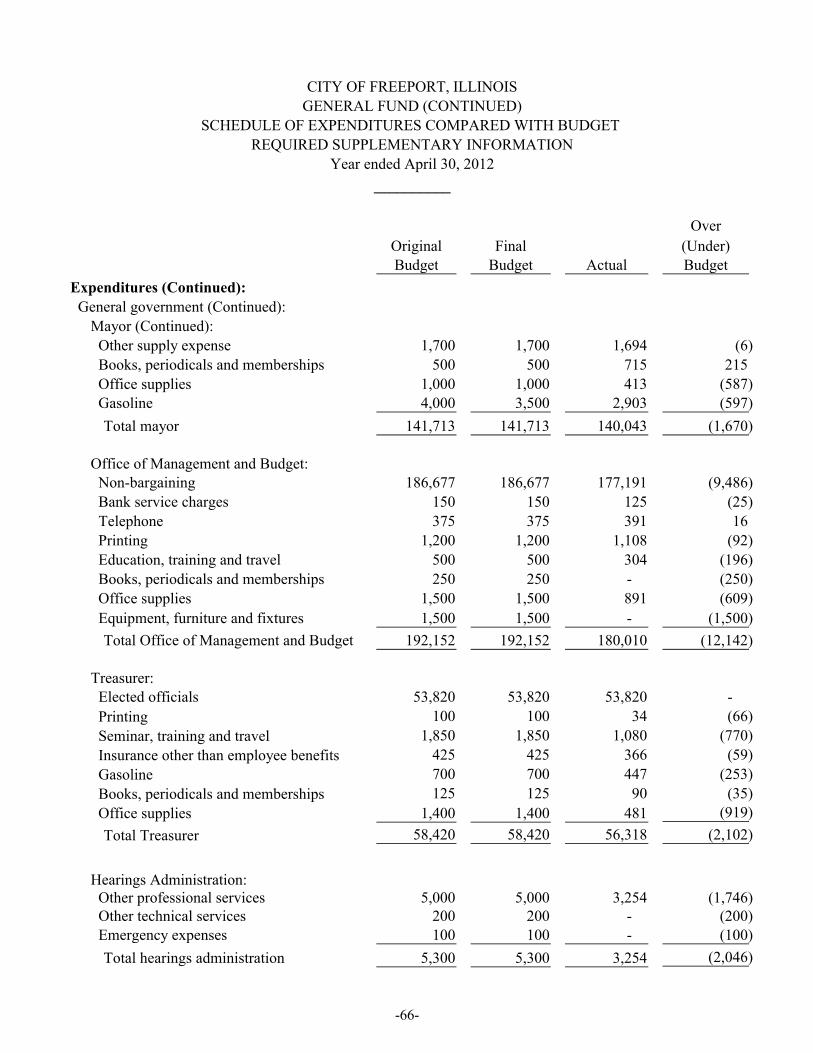
REQUIRED SUPPLEMENTARY INFORMATION
Year ended April 30, 2012
Over
Original Final (Under)Budget Budget Actual Budget
Expenditures (Continued):
General government (Continued):
Mayor (Continued):
Other supply expense 1,700 1,700 1,694 (6)
Books, periodicals and memberships 500 500 715 215
Office supplies 1,000 1,000 413 (587) Gasoline 4,000 3,500 2,903 (597)
Total mayor 141,713 141,713 140,043 (1,670)
Office of Management and Budget: Non-bargaining 186,677 186,677 177,191 (9,486)
Bank service charges 150 150 125 (25)
Telephone 375 375 391 16
Printing 1,200 1,200 1,108 (92)
Education, training and travel 500 500 304 (196)
Books, periodicals and memberships 250 250 - (250)
Office supplies 1,500 1,500 891 (609)
Equipment, furniture and fixtures 1,500 1,500 - (1,500)
Total Office of Management and Budget 192,152 192,152 180,010 (12,142)
Treasurer: Elected officials 53,820 53,820 53,820 -
Printing 100 100 34 (66)
Seminar, training and travel 1,850 1,850 1,080 (770)
Insurance other than employee benefits 425 425 366 (59)
Gasoline 700 700 447 (253)
Books, periodicals and memberships 125 125 90 (35)
Office supplies 1,400 1,400 481 (919)
Office suppliesTotal Treasurer 58,420 58,420 56,318 (2,102)
Hearings Administration: Other professional services 5,000 5,000 3,254 (1,746) Other technical services 200 200 - (200) Emergency expenses 100 100 - (100)
Total hearings administration 5,300 5,300 3,254 (2,046)
CITY OF FREEPORT, ILLINOIS
GENERAL FUND (CONTINUED)
SCHEDULE OF EXPENDITURES COMPARED WITH BUDGET
__________
-66-

REQUIRED SUPPLEMENTARY INFORMATION
Year ended April 30, 2012
Over
Original Final (Under)Budget Budget Actual Budget
Expenditures (Continued): General government (Continued): General Government Building: Custodial 21,000 21,000 9,095 (11,905) Contracted building repair and maintenance 15,000 85,000 79,037 (5,963) Contracted equipment repair and maintenance 10,000 10,000 9,958 (42) Other supply expense 250 250 515 265 Building supplies 500 500 1,157 657 Building rental - - 9,318 9,318 Equipment and janitorial supplies 3,500 3,500 1,344 (2,156) Natural gas 15,000 15,000 3,554 (11,446) Electricity - - 186 186
Water and sewer 2,500 2,500 3,358 858
Total general government building 67,750 137,750 117,522 (20,228)
Management information systems: Computer and network consulting 1,000 1,000 247 (753) Contracted equipment repairs 7,500 7,500 2,129 (5,371) Books, periodicals and memberships 5,500 5,500 4,368 (1,132)
Hardware 15,000 15,000 231 (14,769)
Total management information systems 29,000 29,000 6,975 (22,025)
Community development: Salaries, non-bargaining 152,835 150,335 139,311 (11,024) Other professional services 4,500 4,500 1,038 (3,462) Other technical services 4,500 4,500 1,665 (2,835) Emergency expenses 25,000 3,000 3,632 632 Telephone and communications 1,800 1,800 1,345 (455) Printing 100 100 432 332 Legal advertising 800 800 346 (454) Education, training, and travel 3,000 3,000 2,042 (958) Economic development 15,000 100,000 100,000 - Books, periodicals, and memberships 1,000 2,500 2,227 (273)
Office supplies 1,800 2,800 2,665 (135) Machinery 3,000 3,000 21 (2,979)
Total community development 213,335 276,335 254,724 (21,611)
__________
CITY OF FREEPORT, ILLINOIS
GENERAL FUND (CONTINUED)
SCHEDULE OF EXPENDITURES COMPARED WITH BUDGET
-67-
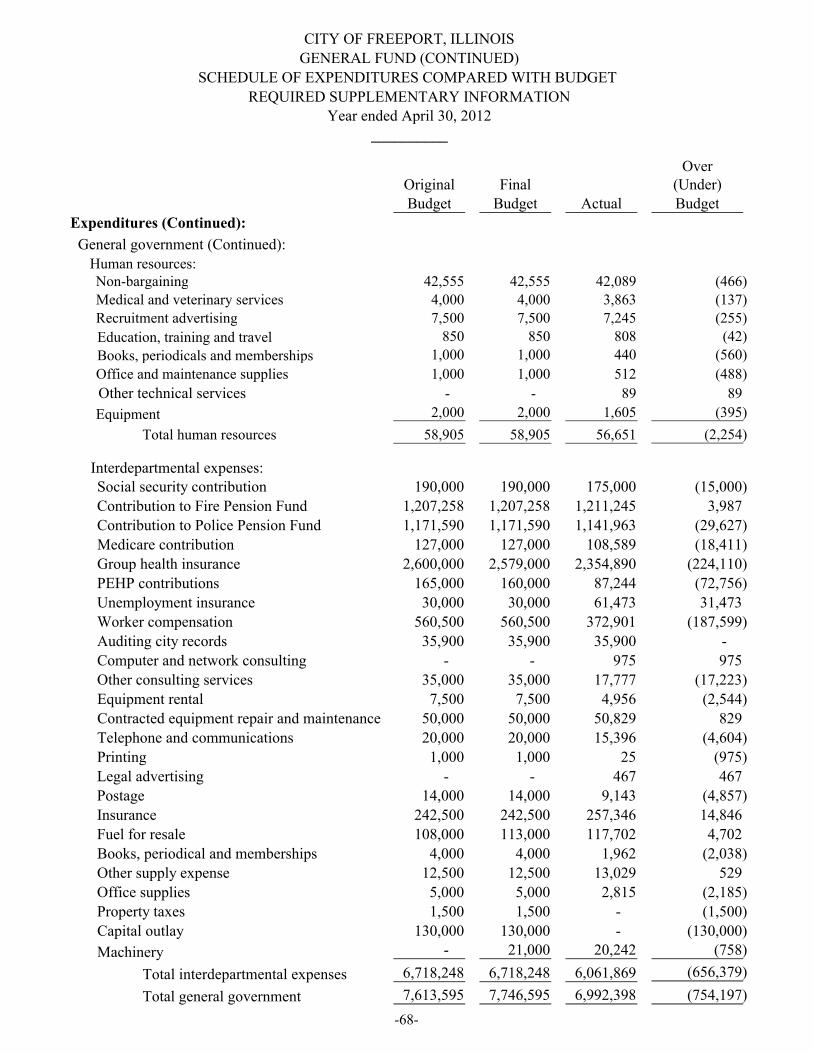
REQUIRED SUPPLEMENTARY INFORMATIONYear ended April 30, 2012
OverOriginal Final (Under)Budget Budget Actual Budget
Expenditures (Continued):
General government (Continued):
Human resources: Non-bargaining 42,555 42,555 42,089 (466) Medical and veterinary services 4,000 4,000 3,863 (137) Recruitment advertising 7,500 7,500 7,245 (255)
Education, training and travel 850 850 808 (42)
Books, periodicals and memberships 1,000 1,000 440 (560)
Office and maintenance supplies 1,000 1,000 512 (488)
Other technical services - - 89 89
Equipment 2,000 2,000 1,605 (395)
Total human resources 58,905 58,905 56,651 (2,254)
Interdepartmental expenses: Social security contribution 190,000 190,000 175,000 (15,000)
Contribution to Fire Pension Fund 1,207,258 1,207,258 1,211,245 3,987
Contribution to Police Pension Fund 1,171,590 1,171,590 1,141,963 (29,627)
Medicare contribution 127,000 127,000 108,589 (18,411)
Group health insurance 2,600,000 2,579,000 2,354,890 (224,110)
PEHP contributions 165,000 160,000 87,244 (72,756)
Unemployment insurance 30,000 30,000 61,473 31,473
Worker compensation 560,500 560,500 372,901 (187,599)
Auditing city records 35,900 35,900 35,900 -
Computer and network consulting - - 975 975
Other consulting services 35,000 35,000 17,777 (17,223)
Equipment rental 7,500 7,500 4,956 (2,544)
Contracted equipment repair and maintenance 50,000 50,000 50,829 829
Telephone and communications 20,000 20,000 15,396 (4,604)
Printing 1,000 1,000 25 (975)
Legal advertising - - 467 467
Postage 14,000 14,000 9,143 (4,857)
Insurance 242,500 242,500 257,346 14,846
Fuel for resale 108,000 113,000 117,702 4,702
Books, periodical and memberships 4,000 4,000 1,962 (2,038)
Other supply expense 12,500 12,500 13,029 529
Office supplies 5,000 5,000 2,815 (2,185)
Property taxes 1,500 1,500 - (1,500)
Capital outlay 130,000 130,000 - (130,000)
Machinery - 21,000 20,242 (758)
Total interdepartmental expenses 6,718,248 6,718,248 6,061,869 (656,379)
Total general government 7,613,595 7,746,595 6,992,398 (754,197)
__________
CITY OF FREEPORT, ILLINOIS
GENERAL FUND (CONTINUED)
SCHEDULE OF EXPENDITURES COMPARED WITH BUDGET
-68-
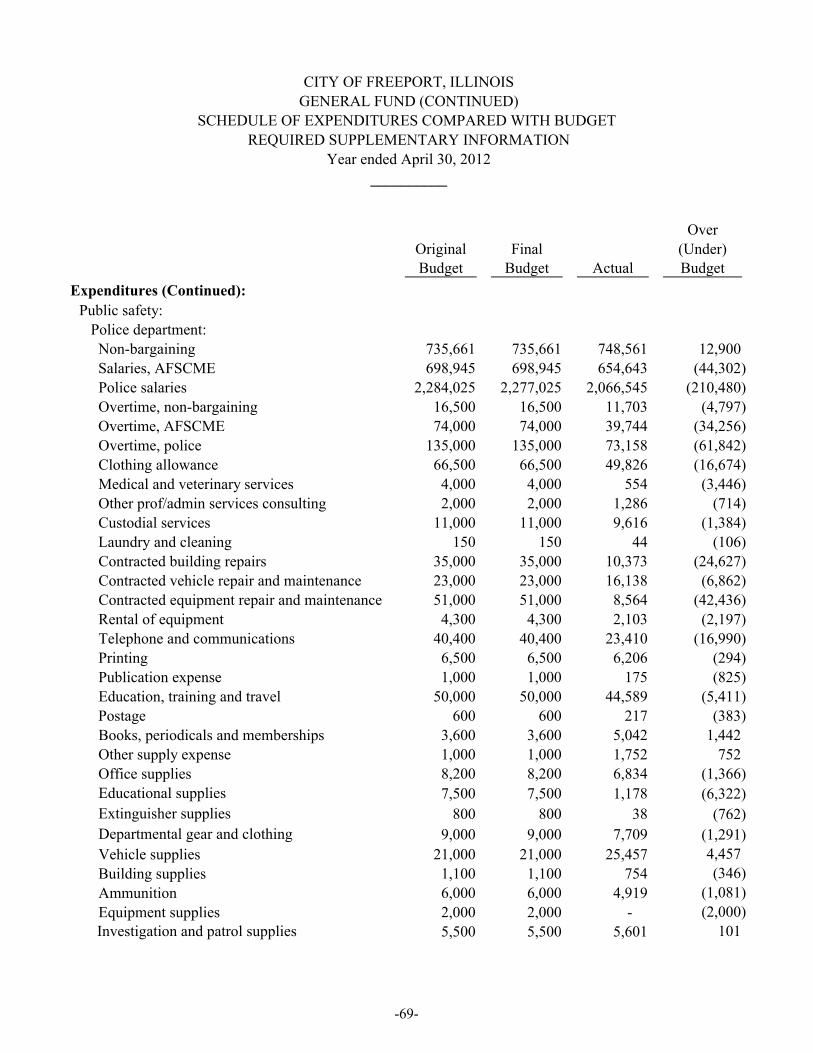
REQUIRED SUPPLEMENTARY INFORMATION
Year ended April 30, 2012
Over
Original Final (Under)Budget Budget Actual Budget
Expenditures (Continued):
Public safety:
Police department:
Non-bargaining 735,661 735,661 748,561 12,900
Salaries, AFSCME 698,945 698,945 654,643 (44,302)
Police salaries 2,284,025 2,277,025 2,066,545 (210,480)
Overtime, non-bargaining 16,500 16,500 11,703 (4,797)
Overtime, AFSCME 74,000 74,000 39,744 (34,256)
Overtime, police 135,000 135,000 73,158 (61,842)
Clothing allowance 66,500 66,500 49,826 (16,674)
Medical and veterinary services 4,000 4,000 554 (3,446)
Other prof/admin services consulting 2,000 2,000 1,286 (714)
Custodial services 11,000 11,000 9,616 (1,384)
Laundry and cleaning 150 150 44 (106)
Contracted building repairs 35,000 35,000 10,373 (24,627)
Contracted vehicle repair and maintenance 23,000 23,000 16,138 (6,862)
Contracted equipment repair and maintenance 51,000 51,000 8,564 (42,436)
Rental of equipment 4,300 4,300 2,103 (2,197)
Telephone and communications 40,400 40,400 23,410 (16,990)
Printing 6,500 6,500 6,206 (294)
Publication expense 1,000 1,000 175 (825)
Education, training and travel 50,000 50,000 44,589 (5,411)
Postage 600 600 217 (383)
Books, periodicals and memberships 3,600 3,600 5,042 1,442
Other supply expense 1,000 1,000 1,752 752
Office supplies 8,200 8,200 6,834 (1,366)
Educational supplies 7,500 7,500 1,178 (6,322)
Extinguisher supplies 800 800 38 (762)
Departmental gear and clothing 9,000 9,000 7,709 (1,291)
Vehicle supplies 21,000 21,000 25,457 4,457
Building supplies 1,100 1,100 754 (346)
Ammunition 6,000 6,000 4,919 (1,081)
Equipment supplies 2,000 2,000 - (2,000)
Investigation and patrol supplies 5,500 5,500 5,601 101
__________
CITY OF FREEPORT, ILLINOIS
GENERAL FUND (CONTINUED)
SCHEDULE OF EXPENDITURES COMPARED WITH BUDGET
-69-

REQUIRED SUPPLEMENTARY INFORMATION
Year ended April 30, 2012
Over
Original Final (Under)Budget Budget Actual Budget
Expenditures (Continued):
Public safety (Continued):
Police department (Continued): Maintenance and janitorial supplies 3,300 3,300 3,981 681
Gasoline 90,000 90,000 91,160 1,160
Water/sewer 1,000 1,000 1,369 369
Equipment, furniture and fixtures 2,000 2,000 - (2,000)
Machinery 1,500 1,500 - (1,500)
Computer hardware 15,000 15,000 6,198 (8,802)
Total police department 4,418,081 4,411,081 3,929,447 (481,634)
Fire department:
Non-bargaining 608,988 608,988 617,338 8,350
Fire 2,318,501 2,314,501 2,246,180 (68,321)
Overtime, non-bargaining 3,500 3,500 2,213 (1,287)
Overtime, fire 36,500 36,500 20,268 (16,232)
Clothing allowance 22,500 22,500 17,640 (4,860)
Medical services 10,000 10,000 2,870 (7,130)
Laundry and cleaning 7,500 7,500 4,618 (2,882)
Contracted building repairs 7,500 7,500 2,162 (5,338)
Contracted vehicle repair and maintenance 20,000 20,000 12,451 (7,549)
Contracted equipment repair and maintenance 15,000 15,000 6,156 (8,844)
Telephone and communications 10,000 10,000 6,989 (3,011)
Printing 500 500 72 (428)
Publication expense 500 500 - (500)
Education, training and travel 15,000 15,000 4,975 (10,025)
Postage and freight 500 500 114 (386)
Books, periodicals and memberships 4,000 4,000 3,704 (296)
Other supply expense 500 500 212 (288)
Office supplies 1,500 1,500 1,894 394
Ambulance supplies 8,000 8,000 6,910 (1,090)
Educational supplies 1,000 1,000 68 (932)
Extinguisher supplies 1,000 1,000 392 (608)
Department clothing gear supplies 10,000 10,000 4,355 (5,645)
__________
GENERAL FUND (CONTINUED)
CITY OF FREEPORT, ILLINOIS
SCHEDULE OF EXPENDITURES COMPARED WITH BUDGET
-70-

REQUIRED SUPPLEMENTARY INFORMATION
Year ended April 30, 2012
Over
Original Final (Under)Budget Budget Actual Budget
Expenditures (Continued):
Public safety (Continued):
Fire department (Continued):
Vehicle supplies 20,000 20,000 13,286 (6,714)
Building supplies 5,000 5,000 2,463 (2,537)
Equipment supplies 7,500 7,500 4,141 (3,359)
Investigation and patrol supplies 1,000 1,000 660 (340)
Maintenance and janitorial supplies 6,000 6,000 3,769 (2,231)
Gasoline 4,000 4,000 6,478 2,478
Diesel fuel 12,500 12,500 17,353 4,853 Water/sewer 2,250 2,250 1,897 (353)
Total fire department 3,160,739 3,156,739 3,011,628 (145,111)
Buildings:
Non-bargaining 83,299 83,299 77,011 (6,288)
Title searches and recording fees 3,000 3,000 6,058 3,058
Court report, witness and service fees - - - -
Other technical services 1,200 1,200 4,004 2,804
Lawn care 12,500 12,500 9,131 (3,369)
Contracted vehicle repairs 3,500 3,500 194 (3,306)
Contracted equip repairs 800 800 68 (732)
Demolition 35,000 65,000 47,300 (17,700)
Telephone and communications 1,700 1,700 1,970 270
Printing 300 300 42 (258)
Publication expense 400 400 153 (247)
Education, training and travel 2,000 2,000 - (2,000)
Other supply expense 33,100 33,100 1,391 (31,709)
Books, periodicals and memberships 2,200 2,200 142 (2,058)
Office and maintenance supplies 800 800 110 (690)
Investigation and patrol supplies 600 600 876 276 Gasoline 4,500 4,500 3,992 (508)
Total buildings 184,899 214,899 152,442 (62,457)
Total public safety 7,763,719 7,782,719 7,093,517 (689,202)
__________
CITY OF FREEPORT, ILLINOIS
GENERAL FUND (CONTINUED)
SCHEDULE OF EXPENDITURES COMPARED WITH BUDGET
-71-

REQUIRED SUPPLEMENTARY INFORMATION
Year ended April 30, 2012
Over
Original Final (Under)Budget Budget Actual Budget
Expenditures (Continued):
Judiciary and legal: Legal: Non-bargaining 138,744 138,744 137,098 (1,646) Title searches and recording fees 750 750 338 (412) Outside legal 45,000 45,000 2,699 (42,301) Outside legal - prosecutorial 40,000 40,000 27,310 (12,690) Court report, witness and service fees 4,000 4,000 3,030 (970) Printing 450 450 174 (276) Education 2,000 2,000 920 (1,080) Books, periodicals and memberships 5,750 5,750 5,148 (602) Office supplies 550 550 455 (95)
Equipment, furniture and fixtures 1,500 1,500 1,317 (183)
Total judiciary and legal 238,744 238,744 178,489 (60,255)
Public works:
Department of Public Works:
Non-bargaining 46,842 46,842 45,775 (1,067)
Engineering 41,500 41,500 36,834 (4,666)
Other technical services 100 100 - (100)
Title searches 100 100 - (100) Telephone and communications 500 500 1,022 522 Printing 100 100 82 (18) Publication expense 200 200 278 78 Education, training and travel 500 500 - (500) Other supplies 100 100 475 375
Books, periodicals and memberships 500 500 - (500)
Postage and freight 100 100 - (100)
Office supplies 250 250 280 30 Equipment supplies 100 100 - (100)
Equipment rental 1,000 21,000 17,531 (3,469)
Total department of public works 91,892 111,892 102,277 (9,615)
CITY OF FREEPORT, ILLINOIS
GENERAL FUND (CONTINUED)
SCHEDULE OF EXPENDITURES COMPARED WITH BUDGET
__________
-72-

REQUIRED SUPPLEMENTARY INFORMATION
Year ended April 30, 2012
Over
Original Final (Under)Budget Budget Actual Budget
Expenditures (Continued): Public works (continued):
Street department: Non-bargaining 36,246 36,246 35,952 (294)
Salaries, AFSCME 585,510 585,510 568,042 (17,468)
Temporary, non-bargaining - - 5,631 5,631
Overtime, AFSCME 50,000 20,000 19,311 (689)
Medical services 2,000 2,000 1,008 (992)
Contracted building repairs and maintenance 20,000 20,000 19,262 (738)
Contracted vehicles repairs and maintenance 17,000 17,000 6,950 (10,050)
Contracted equipment repairs and maintenance 25,000 5,000 1,543 (3,457)
Contracted infrastructure repairs and maintenance 65,000 65,000 48,665 (16,335)
Equipment rental 5,500 5,500 186 (5,314)
Telephone and communications 4,000 4,000 2,589 (1,411)
Printing 300 300 155 (145)
Education, training, and travel 500 500 430 (70)
Postage and freight 500 500 - (500)
Other supplies 4,000 4,000 4,516 516
Books, periodicals, and memberships 500 500 - (500)
Office supplies 1,200 1,200 1,765 565
Departmental gear and clothing 4,000 4,000 1,625 (2,375)
Vehicle supplies 35,000 35,000 17,675 (17,325)
Rock and road 35,000 35,000 38,482 3,482
Street marking supplies 40,000 40,000 39,969 (31)
Snow removal supplies 150,000 150,000 139,818 (10,182)
Building supplies 10,000 10,000 15,873 5,873
Equipment supplies 40,000 40,000 43,444 3,444
Maintenance and janitorial supplies 3,000 3,000 13,592 10,592
Gasoline 45,000 45,000 65,757 20,757
Diesel fuel 80,000 60,000 44,533 (15,467)
Equipment, furniture, and fixtures 5,500 5,500 728 (4,772) Computer hardware 1,000 1,000 - (1,000)
Total highways and streets/transportation 1,265,756 1,195,756 1,137,501 (58,255)
__________
CITY OF FREEPORT, ILLINOIS
GENERAL FUND (CONTINUED)
SCHEDULE OF EXPENDITURES COMPARED WITH BUDGET
-73-
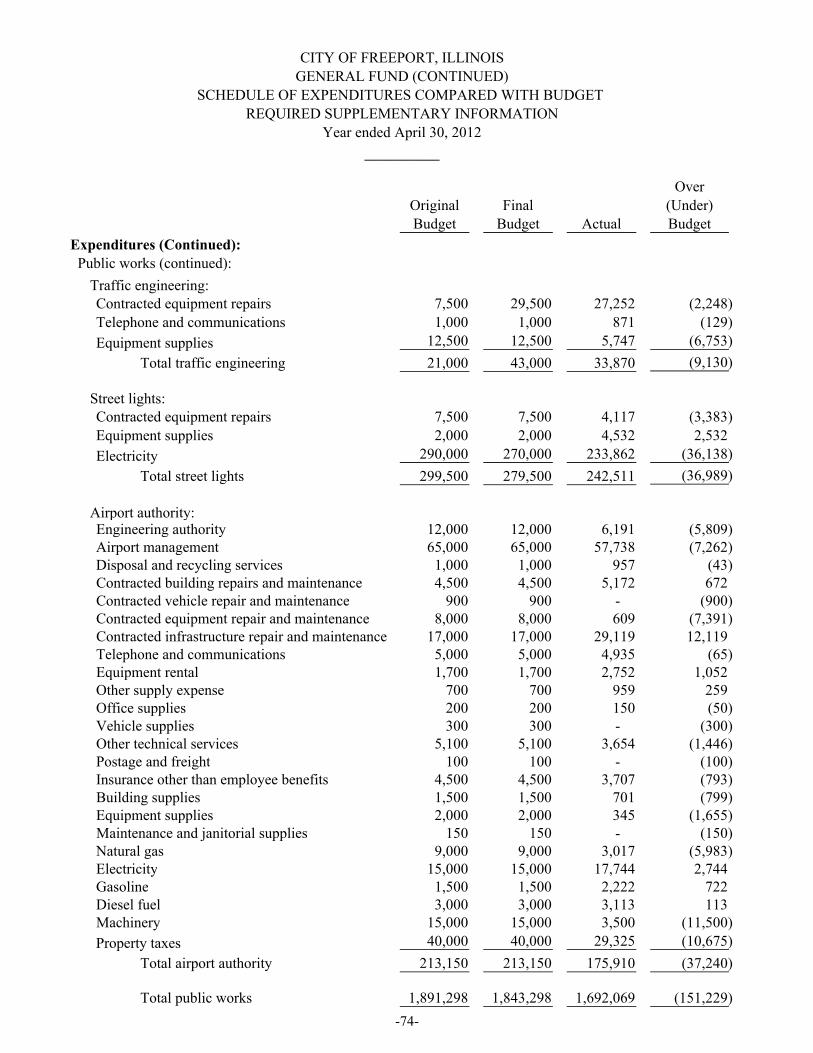
REQUIRED SUPPLEMENTARY INFORMATION
Year ended April 30, 2012
Over
Original Final (Under)Budget Budget Actual Budget
Expenditures (Continued): Public works (continued):
Traffic engineering: Contracted equipment repairs 7,500 29,500 27,252 (2,248)
Telephone and communications 1,000 1,000 871 (129)
Equipment supplies 12,500 12,500 5,747 (6,753)
Total traffic engineering 21,000 43,000 33,870 (9,130)
Street lights: Contracted equipment repairs 7,500 7,500 4,117 (3,383)
Equipment supplies 2,000 2,000 4,532 2,532
Electricity 290,000 270,000 233,862 (36,138)
Total street lights 299,500 279,500 242,511 (36,989)
Airport authority: Engineering authority 12,000 12,000 6,191 (5,809) Airport management 65,000 65,000 57,738 (7,262) Disposal and recycling services 1,000 1,000 957 (43) Contracted building repairs and maintenance 4,500 4,500 5,172 672 Contracted vehicle repair and maintenance 900 900 - (900) Contracted equipment repair and maintenance 8,000 8,000 609 (7,391) Contracted infrastructure repair and maintenance 17,000 17,000 29,119 12,119 Telephone and communications 5,000 5,000 4,935 (65) Equipment rental 1,700 1,700 2,752 1,052 Other supply expense 700 700 959 259 Office supplies 200 200 150 (50) Vehicle supplies 300 300 - (300) Other technical services 5,100 5,100 3,654 (1,446) Postage and freight 100 100 - (100) Insurance other than employee benefits 4,500 4,500 3,707 (793) Building supplies 1,500 1,500 701 (799) Equipment supplies 2,000 2,000 345 (1,655) Maintenance and janitorial supplies 150 150 - (150) Natural gas 9,000 9,000 3,017 (5,983) Electricity 15,000 15,000 17,744 2,744 Gasoline 1,500 1,500 2,222 722 Diesel fuel 3,000 3,000 3,113 113 Machinery 15,000 15,000 3,500 (11,500)
Property taxes 40,000 40,000 29,325 (10,675)
Total airport authority 213,150 213,150 175,910 (37,240)
Total public works 1,891,298 1,843,298 1,692,069 (151,229)
__________
CITY OF FREEPORT, ILLINOIS
GENERAL FUND (CONTINUED)
SCHEDULE OF EXPENDITURES COMPARED WITH BUDGET
-74-
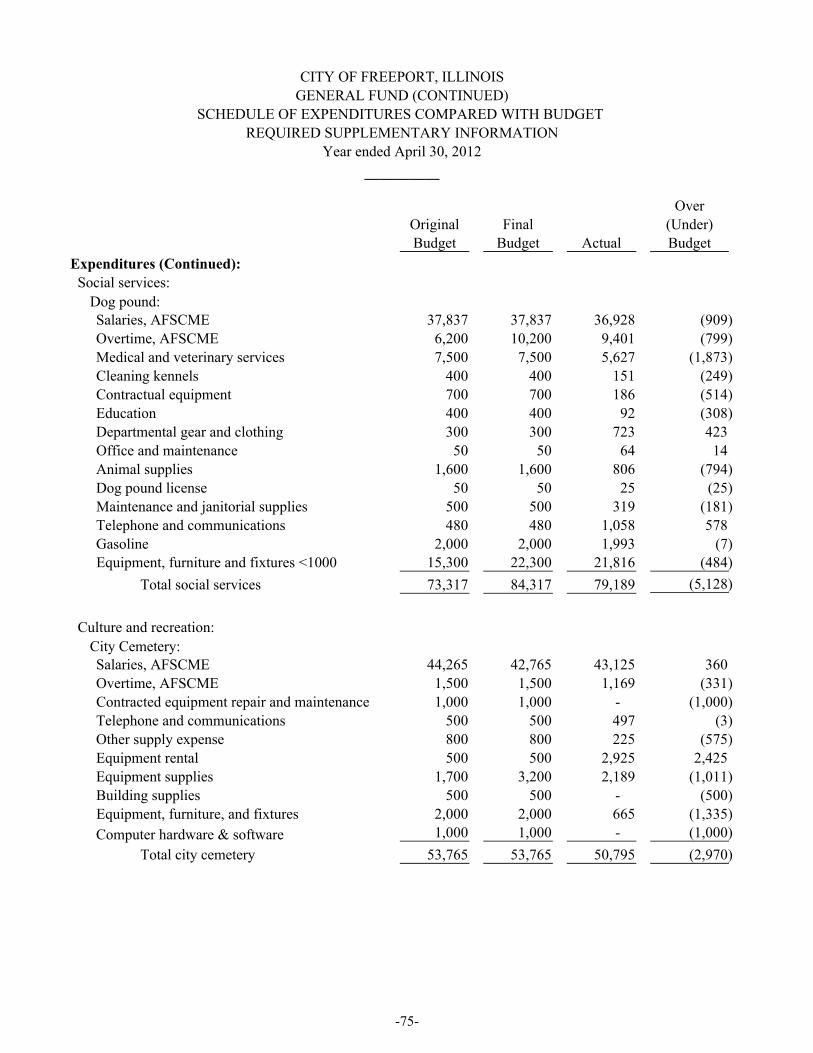
REQUIRED SUPPLEMENTARY INFORMATION
Year ended April 30, 2012
Over
Original Final (Under)Budget Budget Actual Budget
Expenditures (Continued):
Social services:
Dog pound: Salaries, AFSCME 37,837 37,837 36,928 (909)
Overtime, AFSCME 6,200 10,200 9,401 (799)
Medical and veterinary services 7,500 7,500 5,627 (1,873)
Cleaning kennels 400 400 151 (249)
Contractual equipment 700 700 186 (514)
Education 400 400 92 (308)
Departmental gear and clothing 300 300 723 423
Office and maintenance 50 50 64 14
Animal supplies 1,600 1,600 806 (794)
Dog pound license 50 50 25 (25)
Maintenance and janitorial supplies 500 500 319 (181)
Telephone and communications 480 480 1,058 578
Gasoline 2,000 2,000 1,993 (7) Equipment, furniture and fixtures <1000 15,300 22,300 21,816 (484)
Total social services 73,317 84,317 79,189 (5,128)
Culture and recreation:
City Cemetery: Salaries, AFSCME 44,265 42,765 43,125 360
Overtime, AFSCME 1,500 1,500 1,169 (331)
Contracted equipment repair and maintenance 1,000 1,000 - (1,000)
Telephone and communications 500 500 497 (3)
Other supply expense 800 800 225 (575)
Equipment rental 500 500 2,925 2,425
Equipment supplies 1,700 3,200 2,189 (1,011)
Building supplies 500 500 - (500)
Equipment, furniture, and fixtures 2,000 2,000 665 (1,335)
Computer hardware & software 1,000 1,000 - (1,000)
Total city cemetery 53,765 53,765 50,795 (2,970)
CITY OF FREEPORT, ILLINOIS
GENERAL FUND (CONTINUED)
SCHEDULE OF EXPENDITURES COMPARED WITH BUDGET
__________
-75-

REQUIRED SUPPLEMENTARY INFORMATION
Year ended April 30, 2012
Over
Original Final (Under)Budget Budget Actual Budget
Expenditures (Continued):
Culture and recreation (continued):
Forestry: Salaries, AFSCME 94,562 94,562 92,157 (2,405)
Overtime, AFSCME 2,500 2,500 1,373 (1,127)
Other technical services 1,000 7,000 7,800 800
Contracted vehicle repairs and maintenance 1,500 1,500 1,391 (109)
Contracted equip. repairs and maintenance 1,000 1,000 - (1,000)
Postage 50 50 - (50)
Other supplies 2,500 2,500 184 (2,316)
Vehicle supplies 500 500 9 (491)
Equipment supplies 3,500 3,500 5,223 1,723 Equipment, furniture and fixtures 500 500 - (500)
Total forestry 107,612 113,612 108,137 (5,475)
Total culture and recreation 161,377 167,377 158,932 (8,445)
Total expenditures 17,742,050$ 17,863,050$ 16,194,594$ (1,668,456)$
__________
CITY OF FREEPORT, ILLINOIS
GENERAL FUND (CONTINUED)
SCHEDULE OF EXPENDITURES COMPARED WITH BUDGET
-76-

REQUIRED SUPPLEMENTARY INFORMATION
Year ended April 30, 2012
Over
Original Final (Under)Budget Budget Actual Budget
Other financing sources (uses): Operating transfers in:
Insurance Reserve 200,000$ 200,000$ 192,701$ (7,299)$
Library Fund 25,000 25,000 25,000 - Motor Fuel Tax Fund 100,000 100,000 37,624 (62,376)
Total operating transfers in 325,000$ 325,000$ 255,325$ (69,675)$
Operating transfers out:
IMRF Fund (60,000)$ (60,000)$ (60,000)$ -$
Grant Administration Fund (67,500) (61,500) (31,651) (29,849) Debt Service Fund (451,500) (451,500) (317,594) (133,906)
Total operating transfers out (579,000)$ (573,000)$ (409,245)$ (163,755)$
__________
CITY OF FREEPORT, ILLINOIS
GENERAL FUND (CONTINUED)
SCHEDULE OF OTHER FINANCING SOURCES COMPARED WITH BUDGET
-77-

-78-
CITY OF FREEPORT, ILLINOISNOTES TO REQUIRED SUPPLEMENTARY INFORMATION
April 30, 2012
________
BUDGETS
The term "budget" used throughout the financial statements represents the estimated revenues and appropriations as set forth in the City's annual appropriation ordinance adopted for the fiscal year ended April 30, 2012. Budgets are adopted on a basis consistent with generally accepted accounting principles.
The City follows these procedures in establishing the budgetary data reflected in the financial statements:
a. At least 15 days prior to the enactment of the budget, the committee on Finance Procurement submits to the City Council a proposed means of financing expenditure appropriations for the fiscal year commencing the following April 1.
b. Normally on the last Wednesday in April, but no later than April 30, the budget is legally enacted through passage of the appropriation ordinance.
c. Budgeted amounts are as originally reported or as amended by the City Council. Individual amendments were not material in relation to the original appropriations.
d. Unexpended budgeted amounts lapse at the end of the budget year. Spending control is established by the amount of expenditures budgeted for each object and purpose, but management control is exercised at budgetary line item levels.
e. The budget amounts shown in the financial statements are the final authorized amounts as revised during the year.

OTHER SUPPLEMENTARY INFORMATION

CITY OF FREEPORT, ILLINOIS
NONMAJOR GOVERNMENTAL FUNDS
COMBINING BALANCE SHEET
April 30, 2012__________
Total Special
Nonmajor Illinois
Governmental Municipal Motor CemeteryFunds Retirement Fuel Tax Care
ASSETS
Cash 611,965$ -$ 22,952$ -$
Investments, at cost 3,237,885 119,601 618,375 106,205
Receivables:
Property tax 1,338,879 253,447 - -
Accounts 978,049 - 49,773 -
Prepaid expenses 3,750 - - - Due from other funds 21,743 5,801 - -
Total assets 6,192,271$ 378,849$ 691,100$ 106,205$
LIABILITIES
Accounts payable 296,729$ -$ 9,030$ -$
Accrued payroll 17,364 - - -
Due to other funds 478,515 - - 471 Deferred revenues 1,338,879 253,447 - -
Total liabilities 2,131,487 253,447 9,030 471
FUND BALANCE
Nonspendable 3,750 - - -
Restricted 2,199,307 125,402 682,070 105,734
Committed 1,850,580 - - - Assigned 7,147 - - -
Total fund balances 4,060,784 125,402 682,070 105,734
Total liabilities and fund equity 6,192,271$ 378,849$ 691,100$ 106,205$
-79-
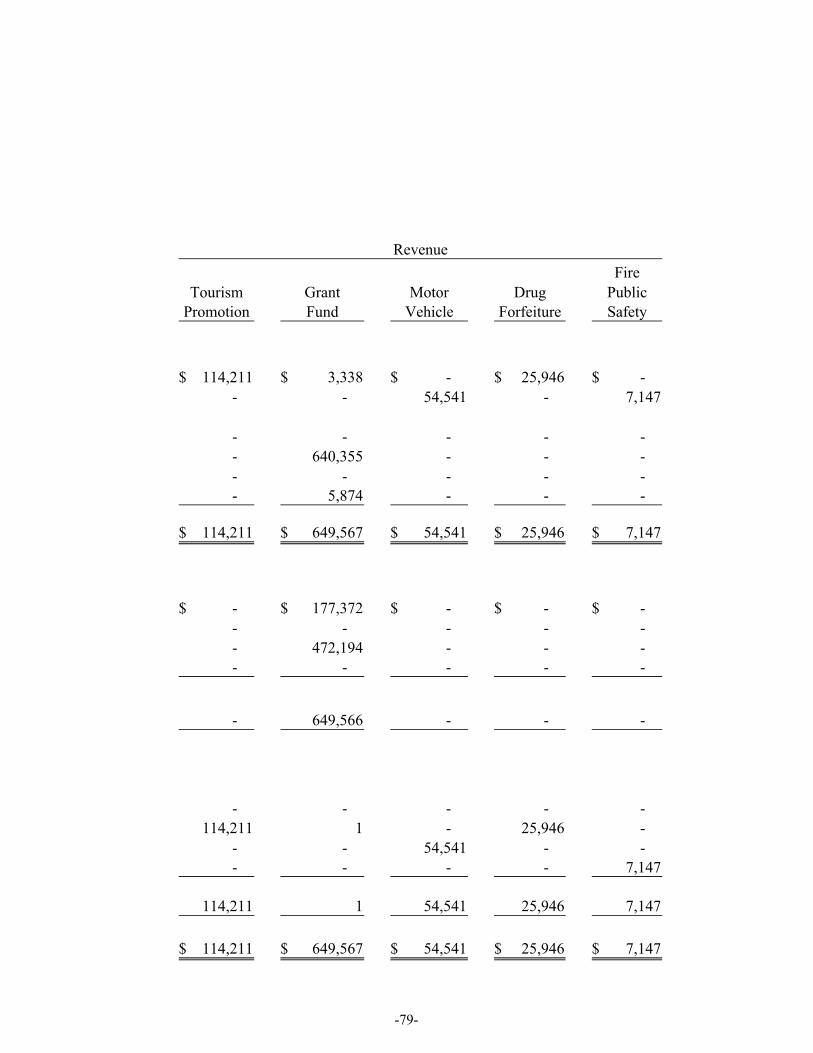
Revenue
Fire
Tourism Grant Motor Drug PublicPromotion Fund Vehicle Forfeiture Safety
114,211$ 3,338$ -$ 25,946$ -$
- - 54,541 - 7,147
- - - - -
- 640,355 - - -
- - - - - - 5,874 - - -
114,211$ 649,567$ 54,541$ 25,946$ 7,147$
-$ 177,372$ -$ -$ -$
- - - - -
- 472,194 - - - - - - - -
- 649,566 - - -
- - - - -
114,211 1 - 25,946 -
- - 54,541 - - - - - - 7,147
114,211 1 54,541 25,946 7,147
114,211$ 649,567$ 54,541$ 25,946$ 7,147$
-79-

CITY OF FREEPORT, ILLINOIS
NONMAJOR GOVERNMENTAL FUNDS
COMBINING BALANCE SHEET (CONTINUED)
April 30, 2012
__________
Special
Downtown Lamm Road West Ave. Burchard Hills
T.I.F. T.I.F. T.I.F. T.I.F.District District District District
ASSETS
Cash -$ -$ -$ -$
Investments, at cost 199,978 124,619 22,283 3,259
Receivables:
Property tax - - - -
Accounts - - - -
Prepaid expenses - - - - Due from other funds - - - -
Total assets 199,978$ 124,619$ 22,283$ 3,259$
LIABILITIES
Accounts payable 6,765$ 30,681$ -$ -$
Accrued payroll - - - -
Due to other funds - - - -
Deferred revenues - - - -
Total liabilities 6,765 30,681 - -
FUND EQUITY
Nonspendable - - - -
Restricted 193,213 93,938 22,283 3,259
Committed - - - - Assigned - - - -
Total fund balances 193,213 93,938 22,283 3,259
Total liabilities and fund equity 199,978$ 124,619$ 22,283$ 3,259$
-80-

DebtRevenue Service Capital Projects
Fire Equipment
Public Debt Capital CapitalLibrary Service Improvements Projects
518$ -$ 445,000$ -$
512,308 326,333 777,616 365,620
1,085,432 - - -
6,727 - 257,139 24,055
- - 3,750 - 10,068 - - -
1,615,053$ 326,333$ 1,483,505$ 389,675$
60,375$ -$ 4,199$ 8,307$
17,364 - - -
- 5,801 49 -
1,085,432 - - -
1,163,171 5,801 4,248 8,307
- - 3,750 -
451,882 - - 381,368
- 320,532 1,475,507 - - - -
451,882 320,532 1,479,257 381,368
1,615,053$ 326,333$ 1,483,505$ 389,675$
-80-

CITY OF FREEPORT, ILLINOIS
NONMAJOR GOVERNMENTAL FUNDS
COMBINING SCHEDULE OF REVENUES, EXPENDITURES,
AND CHANGES IN FUND BALANCES
Year ended April 30, 2012
__________
Total Special
Nonmajor Illinois
Governmental Municipal Motor CemeteryFunds Retirement Fuel Tax Care
Revenues:
Taxes 2,460,443$ 240,996$ -$ -$
Fees 601,354 - - 5,190
Intergovernmental 3,132,398 - 750,924 -
Interest 9,777 165 511 - Other 197,006 - - -
Total revenues 6,400,978 241,161 751,435 5,190
Expenditures: General government 1,855,089 287,626 - -
Public safety 227,060 - - -
Public works 2,675,008 - 835,500 -
Culture and recreation 1,354,412 - - -
Debt service 606,167 - - - Capital outlay 655,708 - - -
Total expenditures 7,373,444 287,626 835,500 -
Excess of revenues over (under) expenditures (972,466) (46,465) (84,065) 5,190
Other financing sources (uses):
Sale of fixed assets 359 - - -
Debt proceeds 445,000 - - -
Operating transfers in 705,585 60,000 - - Operating transfers out (551,665) - (37,624) -
Total other financing sources (uses) 599,279 60,000 (37,624) -
Excess of revenues
(under) expenditures
and other uses (373,187) 13,535 (121,689) 5,190
4,433,971 111,867 803,759 100,544
4,060,784$ 125,402$ 682,070$ 105,734$
Fund balance - May 1, 2011
Fund balance - April 30, 2012
-81-

Revenue
Fire
Tourism Grants Motor Drug PublicPromotion Fund Vehicle Forfeiture Safety
168,517$ -$ -$ -$ -$
- - 6,200 - -
- 2,042,715 - 4,737 -
334 - 33 - 4 - - - - 235
168,851 2,042,715 6,233 4,737 239
138,600 1,428,863 - - -
- 210,264 - 15,756 1,040
- 363,150 - - -
- - - - -
- - - - - - 213,313 - - -
138,600 2,215,590 - 15,756 1,040
30,251 (172,875) 6,233 (11,019) (801)
- - - - -
- - - - -
- 172,876 - - - - - - - -
- 172,876 - - -
30,251 1 6,233 (11,019) (801)
83,960 - 48,308 36,965 7,948
114,211$ 1$ 54,541$ 25,946$ 7,147$
-81-
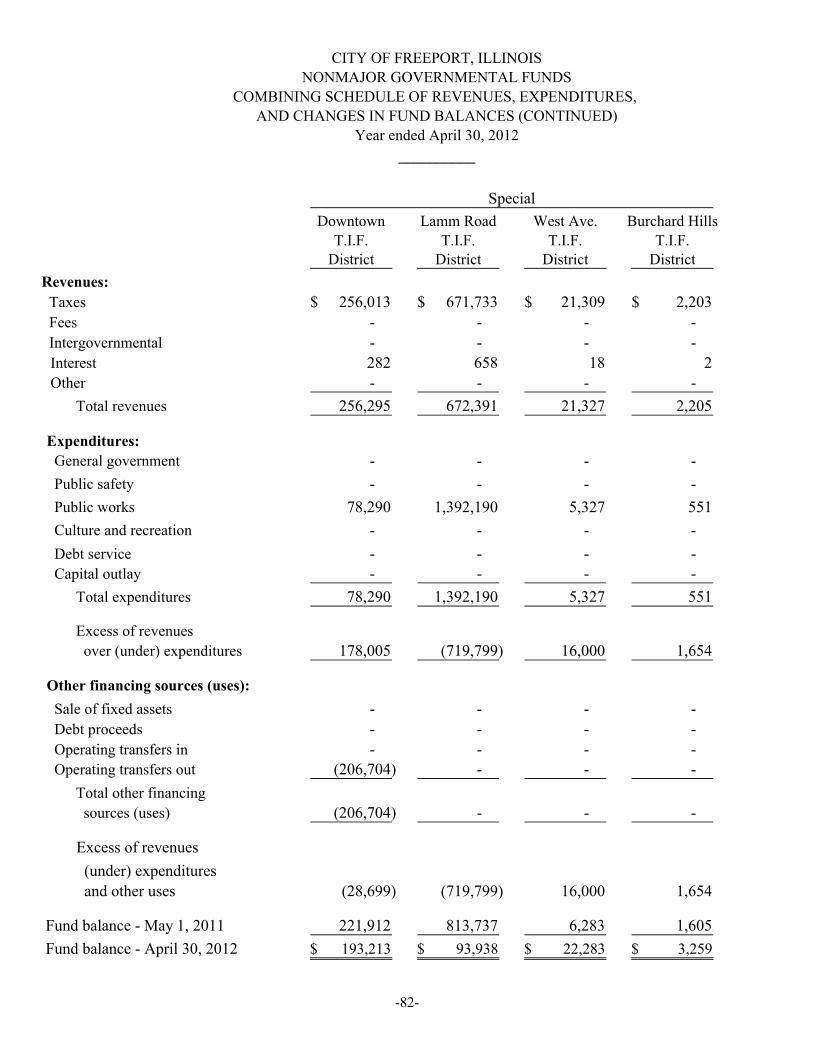
CITY OF FREEPORT, ILLINOIS
NONMAJOR GOVERNMENTAL FUNDS
COMBINING SCHEDULE OF REVENUES, EXPENDITURES,
AND CHANGES IN FUND BALANCES (CONTINUED)
Year ended April 30, 2012
__________
Special
Downtown Lamm Road West Ave. Burchard Hills
T.I.F. T.I.F. T.I.F. T.I.F.District District District District
Revenues:
Taxes 256,013$ 671,733$ 21,309$ 2,203$
Fees - - - -
Intergovernmental - - - -
Interest 282 658 18 2 Other - - - -
Total revenues 256,295 672,391 21,327 2,205
Expenditures:
General government - - - -
Public safety - - - -
Public works 78,290 1,392,190 5,327 551
Culture and recreation - - - -
Debt service - - - - Capital outlay - - - -
Total expenditures 78,290 1,392,190 5,327 551
Excess of revenues
over (under) expenditures 178,005 (719,799) 16,000 1,654
Other financing sources (uses):
Sale of fixed assets - - - -
Debt proceeds - - - -
Operating transfers in - - - - Operating transfers out (206,704) - - -
Total other financing
sources (uses) (206,704) - - -
Excess of revenues
(under) expenditures
and other uses (28,699) (719,799) 16,000 1,654
221,912 813,737 6,283 1,605
193,213$ 93,938$ 22,283$ 3,259$
Fund balance - May 1, 2011
Fund balance - April 30, 2012
-82-

Debt
Revenue Service Capital Projects
Fire Equipment
Public Debt Capital CapitalLibrary Service Improvements Projects
1,099,672$ -$ -$ -$
27,178 - 549,689 13,097
83,844 - - 250,178
4,367 319 2,814 270 5,152 191,619 - -
1,220,213 191,938 552,503 263,545
- - - -
- - - -
- - - -
1,354,412 - - -
- 606,167 - - 50,500 - 49,253 342,642
1,404,912 606,167 49,253 342,642
(184,699) (414,229) 503,250 (79,097)
- - 359 -
- - 445,000 -
- 472,709 - - (25,000) - (282,337) -
(25,000) 472,709 163,022 -
(209,699) 58,480 666,272 (79,097)
661,581 262,052 812,985 460,465
451,882$ 320,532$ 1,479,257$ 381,368$
-82-

April 30, 2012
Foreign Fire RevolvingASSETS Total Insurance Loan
Cash and cash equivalents 57,976$ -$ 57,976$
Investments 30,932 30,932 - Loans receivable 367,380 - 367,380
Total assets 456,288 30,932 425,356
LIABILITIES AND NET ASSETS
Accounts payable 5,765 5,765 -
Net assets 450,523$ 25,167$ 425,356$
__________
FIDUCIARY FUNDS
PRIVATE-PURPOSE TRUST FUNDS
CITY OF FREEPORT, ILLINOIS
COMBINING STATEMENT OF NET ASSETS
-83-

Year ended April 30, 2012
Foreign Fire RevolvingTotal Insurance Loan
Additions:
Foreign fire insurance 26,681$ 26,681$ -$ Interest 11,017 19 10,998
Total additions 37,698 26,700 10,998
Deductions:
Contractual services 4,216 4,216 -
Supplies 25,950 25,950 - Capital outlay 1,529 1,529 -
Total deductions 31,695 31,695 -
Net increase (decrease) 6,003 (4,995) 10,998
Net assets held in trust for other purposes
444,520 30,162 414,358
450,523$ 25,167$ 425,356$
Net assets, May 1, 2011
Net assets, April 30, 2012
__________
CITY OF FREEPORT, ILLINOIS
FIDUCIARY FUNDS
PRIVATE-PURPOSE TRUST FUNDS
COMBINING SCHEDULE OF CHANGES IN NET ASSETS
-84-
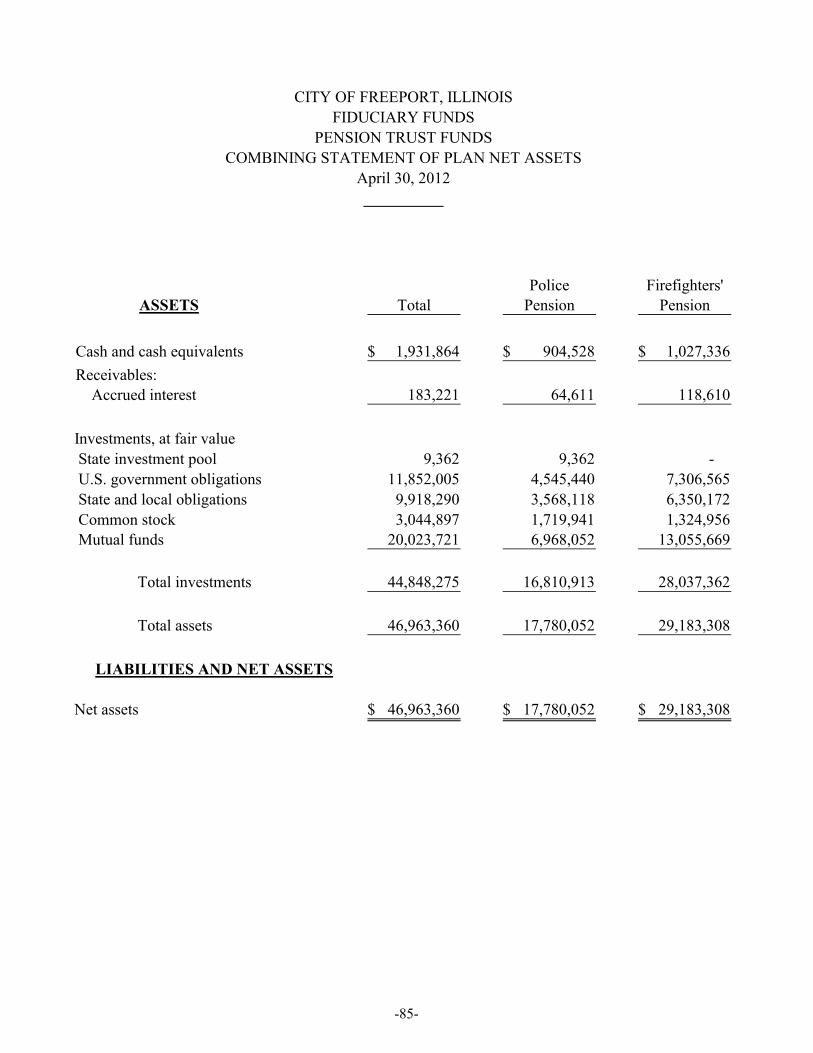
April 30, 2012
Police Firefighters'ASSETS Total Pension Pension
Cash and cash equivalents 1,931,864$ 904,528$ 1,027,336$
Receivables: Accrued interest 183,221 64,611 118,610
Investments, at fair value
State investment pool 9,362 9,362 -
U.S. government obligations 11,852,005 4,545,440 7,306,565
State and local obligations 9,918,290 3,568,118 6,350,172
Common stock 3,044,897 1,719,941 1,324,956 Mutual funds 20,023,721 6,968,052 13,055,669
Total investments 44,848,275 16,810,913 28,037,362
Total assets 46,963,360 17,780,052 29,183,308
LIABILITIES AND NET ASSETS
Net assets 46,963,360$ 17,780,052$ 29,183,308$
__________
FIDUCIARY FUNDS
PENSION TRUST FUNDS
CITY OF FREEPORT, ILLINOIS
COMBINING STATEMENT OF PLAN NET ASSETS
-85-

Year ended April 30, 2012
Police Firefighters'Total Pension Pension
Additions:
Contributions - employer 2,386,708$ 1,175,463$ 1,211,245$
Contributions - employees 547,945 280,373 267,572 Other investment income 1,922,886 609,305 1,313,581
Total additions 4,857,539 2,065,141 2,792,398
Deductions:
Benefits and refunds 3,617,291 1,681,268 1,936,023 Other charges and services 183,403 86,269 97,134
Total deductions 3,800,694 1,767,537 2,033,157
Net increase 1,056,845 297,604 759,241
Net assets held in trust for pension benefits
45,906,515 17,482,448 28,424,067
46,963,360$ 17,780,052$ 29,183,308$
Net assets, May 1, 2011
Net assets, April 30, 2012
__________
CITY OF FREEPORT, ILLINOIS
FIDUCIARY FUNDS
PENSION TRUST FUNDS
COMBINING SCHEDULE OF CHANGES IN PLAN NET ASSETS
-86-

-87-
CITY OF FREEPORT ANNUAL FINANCIAL INFORMATION
FREEPORT SEWER SYSTEM April 30, 2012
________
Freeport Sewer System The Freeport sanitary sewer system consists of nine lift stations and 125 miles of sanitary sewers ranging in size from 6 inches to 42 inches. Freeport separated its sanitary and storm sewer systems in the late 1930s. The oldest lift stations were constructed in 1969. Freeport Water and Sewer Commission The five-person Freeport Water & Sewer Commission was founded in 1937 to manage, operate and control water and wastewater treatment systems. The Commissioners are appointed by the Aprilor and approved by City Council. They serve five-year terms. The Commission has the authority to hire an Executive Director to oversee the daily operations. The Commission approves and monitors the annual budget after its approval by City Council. After the Council has approved the budget, only those items that exceed $2,500 and are not in the budget must be approved by the Council. Sewer Rates and Collections Sewer Rates Sewer Rates Fiscal Year Debt Service Per 100 Cu Ft Sewer Revenues 2003 $4.90/month $1.59 $2,706,980 2004 $4.90/month $1.68 $2,781,776 2005 $4.90/month $1.74 $2,799,819 2006 $4.90/month $2.21 $3,072,732 2007 $4.90/month $2.29 $3,249,700 2008 $5.15/month $2.63 $3,837,360 2009 $5.15/month $2.63 $4,114,647 2010 $5.15/month $2.63 $3,960,197 2011 $5.15/month $2.63 $3,892,259 2012 $5.15/month $2.63 $3,385,926

-88-
CITY OF FREEPORTANNUAL FINANCIAL INFORMATION
PROPERTY ASSESSMENT AND TAX INFORMATIONApril 30, 2012
________
Assessment of Property
The City of Freeport Assessor supervises the assessment of all real property and railroad property not used for transportation purposes. These valuations are subject to appeal by the taxpayer to the City Council of Review and the Illinois Property Tax Appeal Board and then to equalization by the Illinois Department of Revenue. Real estate sales ratio studies conducted annually by the Illinois Department of Revenue provide the foundation of inter-City equalization by means of multipliers assigned to each City. The multiplier (also known as the “equalization factor”) is applied to all assessments in the City to adjust such assessment by a given percentage in order to bring the Citylevel toward the statutory standard of 33 1/3% of fair market value. The multiplier applied to levy year 2000 assessments in City of Freeport was 1.0.
Equalized Assessed Valuation
The City’s EAV has increased $4,970,695 or approximately 1.913% between 2007 and 2011 (see table following). The EAV is net of Senior Citizen’s Homestead and General Homestead exemptions. The Senior Citizen’s Homestead, effective for tax years 1983 and following, has reduced the EAV of real property owned and occupied by a person 65 years of age or older. The General Homestead Exemption is valuable to owner-occupied residential property; the amount of the exemption is the increase in the current year’s equalized assessed valuation above the 1977 tax year equalized assessed valuation, with a maximum of $1,500 in 1978, $3,000 between 1979 and 1982 and $3,500 thereafter.
City of FreeportEqualized Assessed Valuation
Five Year History
Tax Levy Equalized Percent Increase Year Assessed Valuation Over Prior Year
2011 $259,823,575 (2.030)%2010 $265,099,149 3.408%2009 $256,361,207 (0.795)%2008 $258,416,227 1.398%2007 $254,852,880 3.430%
Per Capita EAV $9,841.80
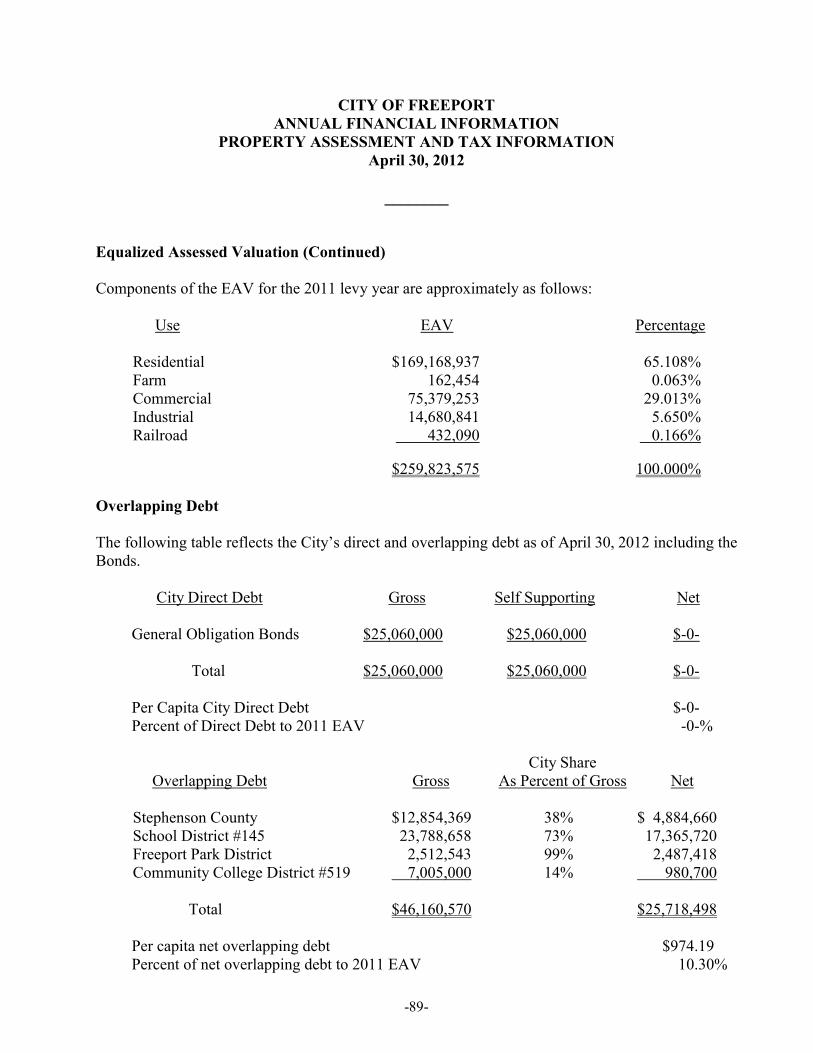
-89-
CITY OF FREEPORTANNUAL FINANCIAL INFORMATION
PROPERTY ASSESSMENT AND TAX INFORMATIONApril 30, 2012
________
Equalized Assessed Valuation (Continued)
Components of the EAV for the 2011 levy year are approximately as follows:
Use EAV Percentage
Residential $169,168,937 65.108%Farm 162,454 0.063%Commercial 75,379,253 29.013%Industrial 14,680,841 5.650%Railroad 432,090 0.166%
$259,823,575 100.000%
Overlapping Debt
The following table reflects the City’s direct and overlapping debt as of April 30, 2012 including the Bonds.
City Direct Debt Gross Self Supporting Net
General Obligation Bonds $25,060,000 $25,060,000 $-0-
Total $25,060,000 $25,060,000 $-0-
Per Capita City Direct Debt $-0-Percent of Direct Debt to 2011 EAV -0-%
City ShareOverlapping Debt Gross As Percent of Gross Net
Stephenson County $12,854,369 38% $ 4,884,660School District #145 23,788,658 73% 17,365,720Freeport Park District 2,512,543 99% 2,487,418Community College District #519 7,005,000 14% 980,700
Total $46,160,570 $25,718,498
Per capita net overlapping debt $974.19Percent of net overlapping debt to 2011 EAV 10.30%

-90-
CITY OF FREEPORTANNUAL FINANCIAL INFORMATION
PROPERTY ASSESSMENT AND TAX INFORMATIONApril 30, 2012
________
Property Tax Rates
Excluding taxes levied by other units of government, the City’s property tax rates expressed as a dollar for each $1.00 of EAV, for the levy years 2007 through 2011 are as follows:
2011 2010 2009 2008 2007
Corporate 0.18601 0.19390 0.28179 0.38616 0.39155Police Pension 0.42992 0.37123 0.35365 0.31928 0.29444Public Library 0.43906 0.43368 0.43590 0.43561 0.42887Municipal Retirement 0.10252 0.09506 0.08270 0.06502 0.06749Firefighter’s Pension 0.35164 0.38253 0.28179 0.22154 0.22244
Total 1.50915 1.47640 1.43583 1.42761 1.40479
In addition to the City’s tax rates, residents of the City must pay property taxes to other units of local government. Total rates for property in the City expressed as a dollar for each $100 of EAV, for the levy year 2011 were as follows:
Taxing Unit 2011 Tax Levy
City of Freeport 1.50915Stephenson County 1.20950Freeport Township .40077Community College District #519 .49356School District #145 6.23798Freeport Park District .97664Freeport MOSQ Abate .04500

Principal Interest Principal Interest
2013 90,000$ 24,806$ 17,000$ 74,355$
2014 90,000 22,947 17,000 71,632
2015 100,000 15,694 18,000 73,665
2016 100,000 10,273 17,000 73,387
2017 110,000 4,611 19,000 73,386
2018 - - 140,000 72,124
2019 - - 143,000 66,665
2020 - - 148,000 60,990
2021 - - 151,000 55,107
2022 - - 161,000 49,009
2023 - - 169,000 42,496
2024 - - 170,000 35,645
2025 - - 127,000 28,738
2026 - - 136,000 23,580
2027 - - 138,000 18,033
2028 - - 147,000 12,376 2029 - - 150,000 6,262
490,000$ 78,331$ 1,868,000$ 837,450$
CITY OF FREEPORT, ILLINOIS
SCHEDULE OF BONDS PAYABLE - GOVERNMENTAL FUNDS
Year ended April 30, 2012
__________
April 30
2003Year ended General Obligation Bonds
2006General Obligation Bonds
-91-

Year ended April 30, 2012
Principal Interest Principal Interest
2013 215,000$ 57,606$ 490,000$ 344,842$
2014 225,000 46,122 510,000 322,792
2015 235,000 36,444 530,000 299,843
2016 250,000 23,858 555,000 275,992
2017 175,000 10,708 575,000 253,793
2018 - - 600,000 230,792
2019 - - 625,000 206,793
2020 - - 645,000 181,792
2021 - - 675,000 155,993
2022 - - 700,000 128,318
2023 - - 735,000 98,918
2024 - - 760,000 67,680
2025 - - 800,000 35,000
2026 - - - -
2027 - - - -
2028 - - - -
2029 - - - -
2030 - - - -
2031 - - - -
2032 - - - -
2033 - - - - 2034 - - - -
1,100,000$ 174,738$ 8,200,000$ 2,602,548$
April 30
2004
Year ended General Obligation Bonds2003
General Obligation Bonds
CITY OF FREEPORT, ILLINOIS
SCHEDULE OF BONDS PAYABLE - PROPRIETARY FUNDS
__________
-92-

Principal Interest Principal Interest
30,000$ 250,992$ 38,000$ 320,745$
30,000 249,912 38,000 321,268
30,000 248,786 42,000 317,035
35,000 247,646 43,000 314,913
35,000 246,158 131,000 312,514
35,000 244,672 320,000 308,151
35,000 243,184 332,000 296,130
40,000 241,696 347,000 283,280
40,000 239,996 364,000 269,858
40,000 238,296 374,000 255,356
45,000 236,546 391,000 240,469
45,000 234,578 405,000 224,920
50,000 232,608 423,000 208,827
915,000 230,422 439,000 191,985
960,000 189,246 457,000 174,532
1,000,000 146,046 478,000 156,389
1,045,000 99,796 495,000 136,722
1,095,000 51,466 510,000 116,377
- - 535,000 95,340
- - 555,000 72,870
- - 575,000 49,560 - - 605,000 25,410
5,505,000$ 3,872,046$ 7,897,000$ 4,692,651$
2006General Obligation Bonds
2005General Obligation Bonds
-92-


![FREEPORT LNG TERMINAL · 2020. 5. 20. · FREEPORT LNG TERMINAL FREEPORT MARINE OPERATIONS MANUAL [04/15/20]2 FREEPORT LNG CONTACT INFORMATION TERMINAL OFFICES Freeport LNG Terminal](https://static.fdocuments.in/doc/165x107/606c9d1603f05e3bdb64da66/freeport-lng-terminal-2020-5-20-freeport-lng-terminal-freeport-marine-operations.jpg)


