Framework for Pension Investment Managementpubdocs.worldbank.org/...Petre-Pension-Investment... ·...
62
Framework for Pension Investment Management November 1 st , 2019 Gabriel Petre World Bank Treasury Pensions Core Course
Transcript of Framework for Pension Investment Managementpubdocs.worldbank.org/...Petre-Pension-Investment... ·...

Framework for Pension Investment Management
November 1st, 2019Gabriel Petre
World Bank Treasury
Pensions Core Course

Road Map
2
• Quick Overview of the World Bank Pension Fund
• Pension Fund Investment Framework
• Governance Structure
• Investment Policy
• Investment Management
• Risk Management
• Performance Measurement
• Accounting & Reporting
• Information Technology

3
World Bank Post-Retirement Benefit Plans
• The World Bank’s post-retirement benefit plans are comprised of 3 plans: 1) StaffRetirement Plan (the pension plan); 2) Retired Staff Benefit Plan (the medical plan); and 3)an other Post-Retirement Benefit Plan.
• The Pension Plan is a funded contributory defined benefit pension plan established toprovide retirement benefits to eligible employees of the World Bank Group.
• Currently, there are more than 26,500 plan participants (16,552 active and 9,880retirees) covered by the Plans.
• Assets under management total approximately USD 28 billion.
• The Pension and Medical Plan are formalized as explicit trusts, where contributions areirrevocable with IBRD acting as a trustee.

4
Pension – Definition/Classifications
• System that would provide an individual with income when they are no longer earning a regular income from employment;
• Pension schemes may be set up by an employer for the benefit of employees (occupational or employer pension) or by the state in the form of social security;
• These schemes typically require participants and employers to make payments during their working life in order to qualify for benefits later on.
• Based on how the benefits are determined, pension plans can be classified as defined benefit or defined contribution plans;
• Defined benefit plans:
– Guarantees a certain benefit stream at retirement;
– The benefit stream is usually determined based on some formula related to the member’s salary and length of membership in the plan.
• Defined contribution plans:
– The benefit stream at retirement is dependent exclusively upon the amount of money contributed and the investment returns realized from investing the contributions through capital markets.

5
From a Pension Scheme to a Pension Fund
• Defined benefit plans may be either funded or unfunded;
• Unfunded defined benefit plan:
– No assets are set aside to service future benefit payments;
– The benefits are paid by the pension sponsor (the state) directly from current active participants contributions and taxes (if the state is the sponsor);
– This is commonly known as a Pay-as-you-go system.
• Funded defined benefit plan:
– Contributions from the plan sponsor and the plan participants are invested in a fund towards meeting the benefits;
– In this case the plan sponsor is the “beneficiary” of both investment risk/rewards.
• Defined contribution plans are funded

Pension Fund Management Decisions
6
• Overall goal is to build up and sustain a well-funded pension plan that can meet the contractual pension benefits in a timely fashion as they come due, not only in the short-term but well into the future as well
• Ultimately, the pension benefits have to be met through some combination of contributions from sponsor and participants and investment returns on plan assets (Funding Policy and Investment Policy).
• Critical decision involves making the appropriate trade-off between return and risk.
• A very conservative investment policy could result in meager but certain investment returns and require the sponsor to make large contributions.
• A very aggressive investment policy could make the fund vulnerable to adverse investment outcomes, and jeopardize the financial health and security of the plan.

Investment Framework
7
Governance Structure
Investment Policy
Investment Management
Risk Management
Performance Measurement
Accounting & Reporting
InformationTechnology

*Keith Ambachtsheer, Governance and Investment of Public Pension Assets: Practitioners’ Perspectives (2010) 8
Other key drivers of investment outcomes:
governance quality
investment beliefs
operational and strategic risk management
implementation capability
Results
Management
Governance
Mission
When integrated appropriately, these elements facilitate the conversion of retirement savings into pension payments in an efficient, cost-effective manner*
Elements of Governance Structure

Governance – Coherence, People, Processes
9
• Legal foundation
• Ownership of investment decisions
• Clarity of investment objectives
• Delegation of authority and clear
accountability
• Transparency of decisions and result
• Clear standards of care for fiduciaries
and managers: prudent person rule
• Leadership
• Qualified, well trained and empowered
staff
• Demonstrable quantitative skills
• Capacity for logical thinking, ability to think
about risk in the probability domain
• Culture of risk-awareness
Coherence People

Responsibility as a Fiduciary
10
• Pension Trustees perform a fiduciary role and have specific responsibilities. In
the US, ERISA (Employee Retirement Income Security Act) sets fiduciary
responsibilities with respect to qualified retirement plans. These include:
• Acting solely in the interest of the plans’ participants and their beneficiaries and with
exclusive purpose of providing benefits and avoiding conflicts of interest;
• Ensuring that the plans offers a diversified investment approach that minimizes risk of
long-term losses;
• Following the plan documents;
• Paying only reasonable plan expenses (not necessarily the lowest costs);
• Monitoring investments;
• Avoiding prohibited transactions;
Processes
11
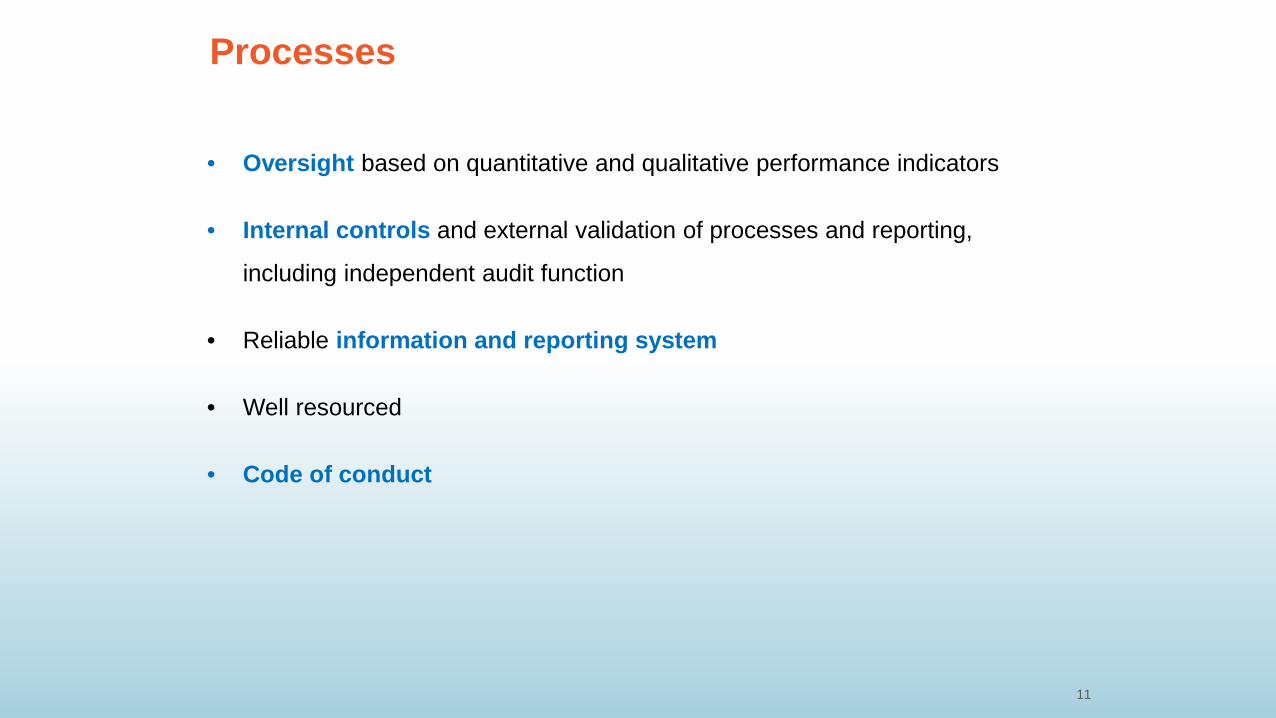
• Oversight based on quantitative and qualitative performance indicators
• Internal controls and external validation of processes and reporting,
including independent audit function
• Reliable information and reporting system
• Well resourced
• Code of conduct

Guiding Principles
12
Good governance = Clear separation of roles and accountabilities;
Every pool of funds (the ‘Fund’) has a unique risk profile based on:
– the objectives for which those funds exist;
– the liability characteristics of the Fund (where there are explicit liabilities); and
– the size of the Fund relative to its liabilities;
Board should “own” the Fund’s risk profile (both SAA & Risk Budget), and should review it at regular intervals, as well as in response to structural changes (e.g. availability of new asset classes, demographic profile of beneficiaries, cash-flow needs, changes in market conditions and/or structures, ability to hedge currency risk);
Policy decisions need to be clearly articulated and documented;
All other decisions should be delegated to levels where they can be made most effectively, together with enhanced controls which create accountability; and
Risk usage, total return, and performance versus benchmarks, should be monitored and reportedregularly with a focus on the Fund’s investment horizon;

Organizational Structure
13
Investment ManagementIn-house Mgmt.
Mgmt. of Ext. ManagersActive risk Mgmt.
Risk & AnalyticsRisk
BenchmarksPerformance
Settlement & Control
Bank balancesTrade settlementOperational risk measurement
Internal AuditPeriodic review of
processes and procedures
Investment CommitteeInvestment Guidelines
Risk AllocationExternal vs In-house Mgmt.
Governing BoardInvestment Policy
Overall Risk BudgetOversight
Legal Counsel
Accounting & Valuations
PricingAccounting
Reconciliation
ControllerFinancial Statements
Internal Control Environment
What decisions need to be made?
14
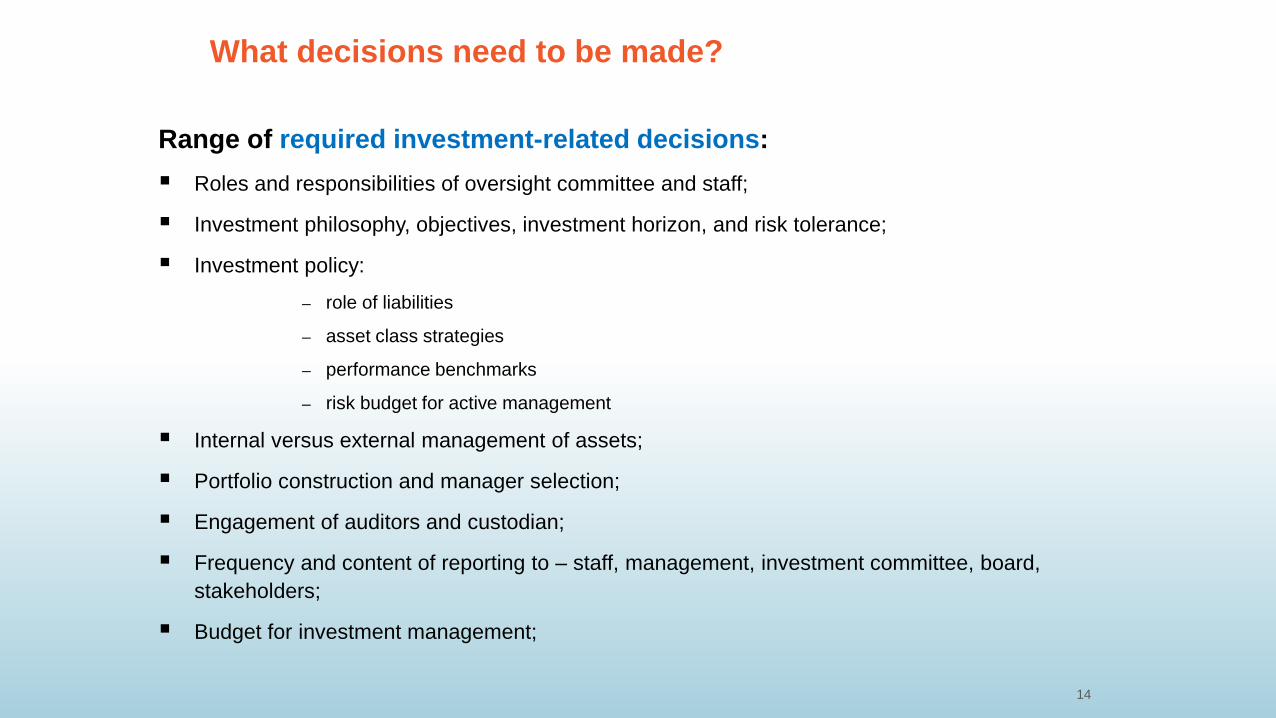
Range of required investment-related decisions: Roles and responsibilities of oversight committee and staff;
Investment philosophy, objectives, investment horizon, and risk tolerance;
Investment policy:
– role of liabilities
– asset class strategies
– performance benchmarks
– risk budget for active management
Internal versus external management of assets;
Portfolio construction and manager selection;
Engagement of auditors and custodian;
Frequency and content of reporting to – staff, management, investment committee, board, stakeholders;
Budget for investment management;

Key Roles
15
GOVERNING BOARDApproves Investment Policy: Fund Objectives, Investment Horizon, Risk Tolerance & Metrics, Eligible Asset Classes, SAA, Risk Budget
INVESTMENTCOMMITTEE
Sets Policy Benchmarks, Allocates Risk Budget,Approves Investment Guidelines
STAFF Implements Investment Policy

Importance of on-going Board education
16
Continuing orientation and education of Board members, both individually and as a group.
Education ensures understanding of fiduciary responsibilities and scope of authority.
Participation by external ‘experts’ in Board meetings as necessary, particularly when specialized topics are presented by staff.
Ultimate objective is to facilitate the Board’s ability to make necessary decisions, and ‘own’ these decisions.
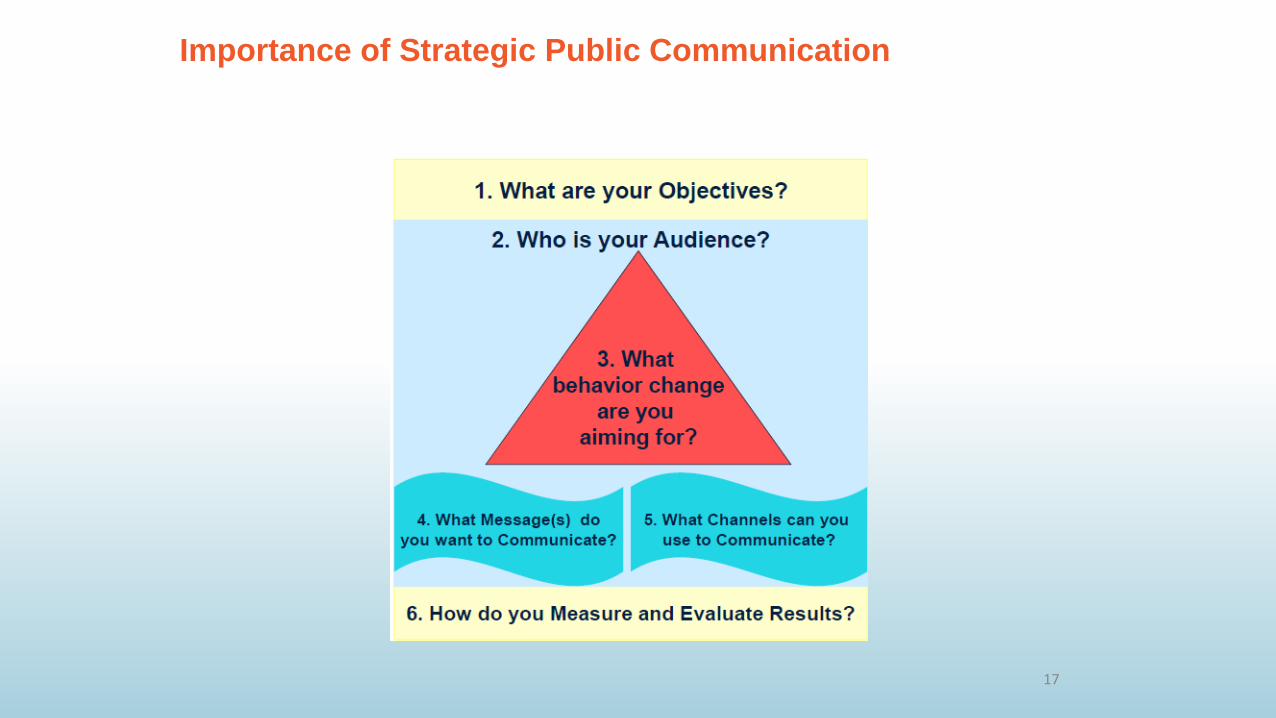
Importance of Strategic Public Communication
17

Focus on Investment Management Costs
18
Impact on Value of Pensions Singapore’s Central Provident Fund – a 1% administrative charge on assets over a 40-year
period could erode returns at a member’s retirement by 25%.
Denmark’s ATP – 0.8% higher annual asset management costs over a 40-year period may reduce benefits available to members by about 23%
“Funds with low cost structures generally outperform funds with higher cost structures (adjusted for difference in investment policies)” and
“Higher-than-necessary costs are a primary indicator of a shortfall in fund management excellence”*Keith Ambachtsheer, Governance and Investment of Public Pension Assets: Practitioners’ Perspectives (2010)
Years
Cum
ulat
ive
Valu
e

Investment Framework
19
Governance Structure
Investment Policy
Investment Management
Risk Management
Performance Measurement
Accounting & Reporting
InformationTechnology

Importance of Long-term Investment Policy
20
The Strategic asset allocation is the key driver of long-term investment success:
Defines the overall risk-return profile of the portfolio
Ranks high in the hierarchy of investment decisions
Needs to be owned at the highest governance level
What is Strategic Asset Allocation?
21
“The process by which an institution determines the appropriate neutral (static) asset allocation to achieve its long-term investment objectives”
SAA is neutral in the sense that it should not be driven by short-term market views)
Objectives are long-term and can be varied (help meet certain future payment obligations or liabilities, preserve and grow capital, etc.)
SAA should be reviewed periodically (conditions can change, both internal and external)
SAA involves primarily a trade-off between risk and return
Typically SAA seeks to maximize return subject to a set of risk constraints
For a pension fund, ideally the SAA should be liability informed

Investment Policy Process
22
2. Risk Tolerance and Other Constraints
1. Fund Objectives, Investment Horizon, and Investment Beliefs
3. Capital Markets Assumptions and Eligible Asset Classes
4. SAA/ALM Model
Optimization/simulation methods to determine the best long-term allocation
5. Implementing the SAA
Setting policy benchmarks

Investment Policy Issues
23
Defined Benefit Pension Fund
Fund Objectives: Fund stream of cash outflows in cheapest possible way, given that:
Cash inflows (e.g. contributions) can be controlled
Cash outflows (e.g. benefit payments) are somewhat uncertain and cannot easily be controlled or influenced
Investment Horizon Typically fairly long, but may be affected by regulatory and accounting factors
Risk Tolerance Moderate to High, but can vary depending on funded status, financial strength of
the sponsor, and demographic profile of beneficiaries

Typical Investment Objective
24
A typical investment objective for a defined benefit pension plan is to maintain and grow the plan surplus, which is the difference between the value of assets and liabilities.
Another way to express this is through the funded ratio, which is the ratio of assets to liabilities. On that basis the investment objective would be to maximize the funded ratio over time.
Liabilities are the key to definition of pension plan investment objectives
It follows that it is critical to understand the nature of liabilities (e.g. are the benefit payments indexed with inflation, etc.) and how they are valued

Measuring Liabilities
25

Investment Horizon
26
The investment horizon is the time period over which the fund is expected to be held and used, and over which returns and risks should be managed and measured
Critical factor in determining the SAA; generally, higher risk tolerance is appropriate for investors with long investment horizon
It is not the accounting or reporting cycle
Sub-portfolios with different investment objectives can have different investment horizons

Investment Horizon
27
Stocks, bonds and bills (1926 – 2016)
Source: Ibbotson Associates and World Bank Treasury calculations
-67.6%
-17.4%
-4.9%
1.9%
-4.6%0.7% 0.5% 1.6% -0.1% 0.0% 0.1% 0.4%
36.1%
21.4%18.1%
26.0%
16.0%12.2% 9.6%
15.5%11.3% 9.3% 7.8%
11.5%
4.9%3.9%
-50%
-40%
-30%
-20%
-10%
0%
10%
20%
30%
40%
50%
Annu
alize
d N
omin
al R
etur
n
5 year holding periods1 year holding periods20 year holding periods10 year holding periodsMedian annual return
Stocks, bonds and bills (1926 – 2016)

Investment Beliefs – What are they?
28
• There are no universally-agreed or universally-appropriate methods on many questions concerning the financial markets
• Investment beliefs can be thought of as a clear view of how each organization perceives that capital markets work and how the organization can add value and strive for excellence.
• Most beliefs cannot be definitely proven and are instead collectively agreed judgements based on research and experience.
• As such, beliefs:
– Provide clarity of thought
– Combine individual perspectives into a disciplined institutional whole
– Allow for consistency of decision making over time
– Provide support for staying the course when most needed
– Represent the foundation of the institutional identity and culture

Why is important to formulate beliefs
29
• Trustees need a clear governance framework to make choices for a constructive dialogue with stakeholders. They are an important governance instrument.
• Even more relevant in financial markets where different visions and/or investment models co-exit (e.g. internal management vs. outsourcing, passive vs. active management, asset classes vs. risk factors, traditional portfolio allocation vs. the endowment model, etc).
Asset managers have to articulate their unique proposition for client(s)
• Investment beliefs offer also a framework for evaluating new developments and decide whether to include them in the strategy (reduces the tendency to ‘join the herd’)
• From a governance perspective investment beliefs should be made explicit, documented, shared and understood by both fiduciaries and investment professionals

Elements of an investment belief system
30
• An investment belief system has four main elements: – Basic beliefs (e.g. markets are mean-reverting, active management adds value, etc.)– Investment theory or arguments supporting the beliefs– Their translation into a workable investment strategy– Requirement for the organization to implement beliefs successfully
Source: Koedijk, Slager and Bauer – ‘Investment Beliefs that Matter: New insights into the Value Drivers of Pension Funds’, ICPM, July 2010

Investment Beliefs – Stylized Categories seen in practice
31
Broad Category Pension Funds’ Stylized Investment Belief
Long-term investing Long holding periods allow investment in assets with higher risk premiums, notably illiquidity and equity risk, earning additional returns. Implies also greater ability to tolerate short-term volatility
Diversification Diversification is the only ‘free lunch’ in investment management. Larger funds can realize additional diversification advantages by adding niche, complex strategies
Active management With the right skills, resources and process, an investor should be able to create excess returns with active strategies. Passive management should be the norm in markets with high costs, limited inefficiencies and difficulties in separating skill from noise
Costs Costs are certain and a drag on net returns. Future returns are uncertain. So costs need to be properly considered, managed and accounted for
Organization/ Governance
Pension funds can access the right skills by combining internal and external management lowering principal-agent costs and enhancing returns
Responsible investing As long-term investors Pension funds must have concern for environmental, social and governance (ESG) factors because they are material to long-term returns.
Asset allocation and Investment Strategy
Strategic asset allocation is a key determinant of long-term performance. Pension fund liabilities should be considered in determining the appropriate asset allocation and investment strategy
Source: adapted from: Koedijk, Slager and Bauer – ‘Investment Beliefs that Matter: New insights into the Value Drivers of Pension Funds’, ICPM, July 2010

Risk Tolerance
32
Risk tolerance is about knowing where the line is drawn between acceptable and unacceptable outcomes
Risk tolerance depends on expected funding and withdrawal pattern
Need to translate concerns of decision makers into quantifiable statistics (risk measures)
Risk tolerance should ideally reflect an institution’s ability to take risk, and not the Board’s or decision maker’s willingness to tolerate risk
How to assess risk tolerance?

Risk Tolerance in Finance Terms
33
Average Return
What is the minimumreturn at a 95% confidence level? Value at Risk (95%)
What is the average worst case outcome(95% confidence level)?(Average loss or Conditional VaR)
Probability of negative returns(Shortfall probability)
Dispersion of returns(volatility or standard deviation)
Distribution of portfolio returns
-4% -2% 0% 2% 4% 6% 8% 10% 12% 14% 16% 18%
0
2
4
6
8
10
12
14

Determinants of Risk Tolerance
34
Sponsor Financial Strength
- Size of the plan relative to the sponsor- Financial health of the sponsor
Stronger sponsor implies a higher ability to take risk
Investment Horizon
- Net cash flow profile of the plan- Demographics of the plan
A longer investment horizon implies a higher ability to take risk
Funded Status
Funded ratio of the plan on mark to market basis
A higher funded ratio implies a higher ability to take risk
Risk Tolerance

Willingness vs. Ability to Take Risk
35
Ability to Take RiskAbility to take risk refers to the appropriate amount of risk to achieve long-term objectives and is driven by:
• Rationale for holding funds, investment horizon and investment objectives
• Asset liability considerations
• Institutional constraints and human resources (capacity and skills of staff members)
Willingness to Take RiskCan be driven by:
• Emotions and noise
• Peer pressure & herd behavior
• Misunderstanding of objectives and financial illiteracy of public or parliament
• Undue focus on accounting value instead of economic values
Distinguish between the institution’s ability to take risk and individual’s or committee’s willingness to take risk!
If willingness is lower than ability, huge opportunity costs may be incurred

Typical Risk Trade-offs
36
Avoid low funded ratios(Staff and Retirees Objective)
Maximize Return(max. wealth of Fund) Avoid high
contributions(Plan Sponsor’s Objective)
Maximum acceptable contribution rate
Maximize Return(max. wealth of Fund)
Two measures of risk:
a. Minimum acceptable funded ratio levels
b. Maximum acceptable contribution rates
Minimum acceptable funded ratio

Eligible Asset Classes
37
• Selection of eligible asset classes is an important part of the asset allocation process
• Considerations influencing choice of eligible asset classes:
• Investment objectives and risk-return considerations
• Risk factor exposure and diversification potential
• Headline/Reputational risk issues
• Staff capabilities and skill mix
• Sophistication of portfolio and risk management infrastructure
• Focus should be on total portfolio risk and return – not on the riskiness of individual assets in isolation

38
Risk-return Profile of Asset Classes
Asset classes are typically evaluated in terms of risk (measured by volatility) and expected return
US Cash
US Treasury
Global ILBUS Corporates
US MBSG7 Govt
US High Yield
US Equity
Developed Equity
EM Equity
Commodities
Private Real Estate
REITs
Leveraged Loans
Private Equity
EM Debt
0%
2%
4%
6%
8%
10%
12%
14%
16%
0% 5% 10% 15% 20% 25% 30%
Hist
oric
al R
etur
n (%
, Ann
ualiz
ed)
Risk (Standard Deviation, %)
Historical risk/return trade-off (1994-2016, USD)

39
Diversification Matters
Source: Macrobond, Bloomberg, WB Treasury calculations
Total Return Indices (USD, Unhedged)
Index Value (Dec 2007 = 100)
US High Yield
US Treasuries
US Corporates
EM Debt
50
75
100
125
150
175
200
225
250
2010 2012 2014 2016 2018
Total Return Indices (USD, Unhedged)
Index Value (Dec 2007 = 100)
EM Equities
Global REITs
S&P 500 Index
MSCI EAFE Index
25
50
75
100
125
150
175
200
225
2010 2012 2014 2016 2018

Capital Market Assumptions
40
• One of the key assumptions in the SAA process is related to the expected properties of assets over the investment horizon in particular the expected returns. Optimization results (hence ALM results) are disproportionately sensitive to these expectations.
• There is scope for building internal capabilities to derive forward-looking return expectations as institutional ownership of these assumptions is critical.
• Elements of potential process for setting return expectations:
– Research various methodologies for setting return expectations and build capabilities to implement such methodologies internally;
– Link the underlying assumptions to the external economic and financial environment and the consensus expectations going forward (perhaps through the use of a macroeconomic model or by surveying market expectations for such variables)
– Periodically compare the expected returns derived internally versus the expectations of other market participants (e.g. consultants, institutional investors, investment banks) and seek to understand the main methodological differences
• Role of the Board: approve the methodology for deriving expectations and oversee the consistent implementation of this methodology over time.

Example - Building Blocks for Asset Return Assumptions
41
• In general, expected returns for various assets can be decomposed into a yield or cash flow component and a change valuation (e.g. change in yield, P/E ratio or cap rate).
• The valuation change is much more volatile in the short term but tends to mean-revert over the long-term.
FX Return Il l iquidity Premium
Valuation Change
Valuation Change
Valuation Change
Valuation Change
Real Earnings Growth
Real Earnings Growth
Real Income Growth
Valuation Change
Spread Inflation Inflation Inflation
Yield (Coupon) Yield Dividend Yield Dividend Yield Cash Flow Yield
Govt BondsCorporate
BondsUS Stocks
International Stocks
Private Equity
Real Estate
Public Markets

Equity expected return - No predictability in the short-term
42
• It is important to stress that there is a much lower predictability in the short-run when it comes to linking observable variable with future realized returns. The predictability power increases significantly with the investment horizon.
Starting CAPE and Subsequent 1yr Real return – Since 1980
R² = 0.0549
-40%
-30%
-20%
-10%
0%
10%
20%
30%
40%
50%
60%
70%
0 5 10 15 20 25 30 35 40 45 50
Ann
ualiz
ed R
eal R
etur
n -S
ubse
quen
t Yea
r
Starting Shiller P/E
Starting CAPE and Subsequent 10yr Real return – Since 1960
R² = 0.3686
-10.0%
-7.5%
-5.0%
-2.5%
0.0%
2.5%
5.0%
7.5%
10.0%
12.5%
15.0%
0 5 10 15 20 25 30 35 40 45 50
Ann
ualiz
ed 1
0yr.
Rea
l Ret
urn
(nex
t 10
yrs)
Starting Shiller P/E Ratio
Source: Bloomberg, Shiller CAPE data, World Bank Treasury calculations as of March 2018

Portfolio Construction
43
Most common approach employed by institutional investors and asset managers to determine optimal portfolios is mean variance optimization.
Mean variance optimization is a procedure that helps an investor find the portfolio that maximizes expected return for a given level of risk (as measured by variance or standard deviation of returns)
In the case of pension fund where liabilities have to taken into account, the measure of risk changes to what is called ‘surplus risk’ (standard deviation of the difference between asset returns and liability returns). Similarly the measure of expected return changes to ‘expected surplus excess return’ (expected asset return over the expected liability return)
Inputs:- Expected return of each asset class (or expected excess returns vs. liabilities)- Standard deviation of each asset class (or surplus risk when optimization includes liabilities)- Correlation of returns between asset classes (or correlation of excess returns over the liabilities)
Output:- The efficient frontier, i.e. the set of portfolios with the highest expected return for a given level of risk

Efficient Frontier - Example
44
Expe
cted
Tot
al R
etur
n
Expected Risk (variance or standard deviation)
Efficient frontier
Inefficientportfolios
Minimum variance portfolio
Efficientportfolios

What should come out of the Investment Policy process?
45
• The key elements coming out of the process should be reflected in the Investment Policy Statement and include:
• Investment objective
• Investment horizon
• Risk tolerance measure and specific metrics
• Asset allocation: asset class weights, benchmarks, bands around the target weights (if any), expected risk/return profile over the investment horizon
• Rebalancing policy
• Overall active risk budget and limits
Investment Management
46
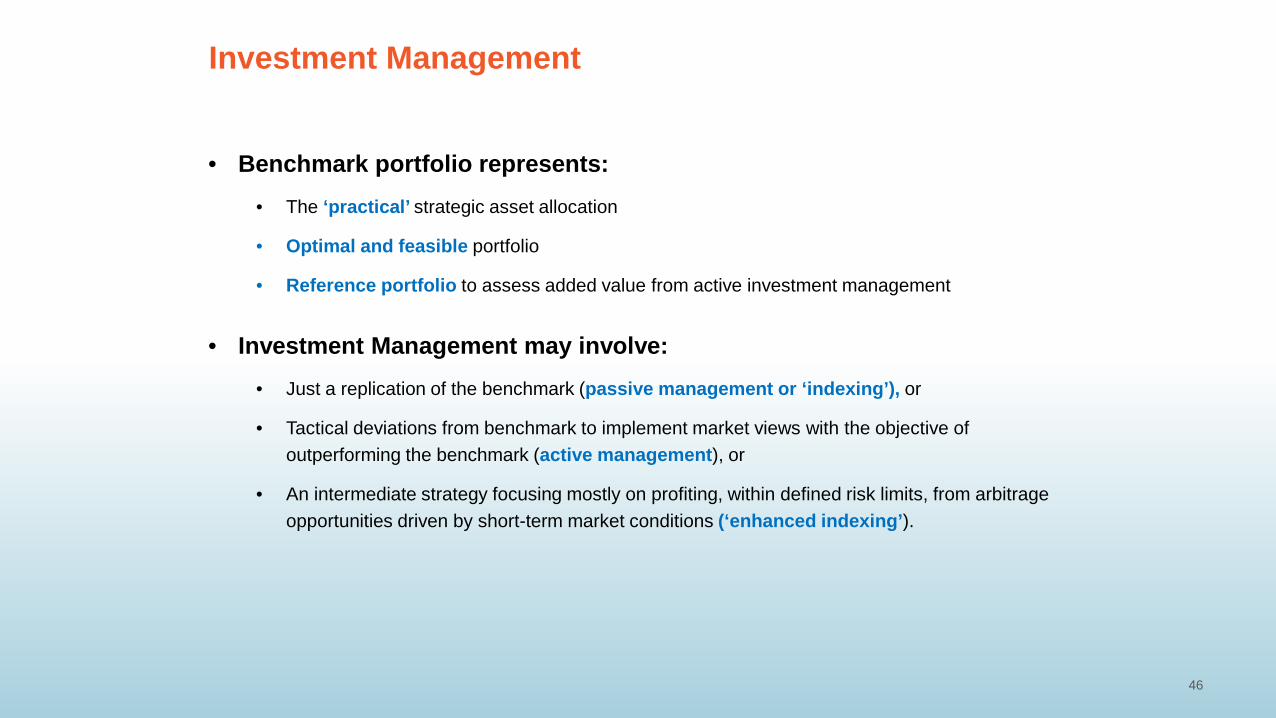
• Benchmark portfolio represents:• The ‘practical’ strategic asset allocation
• Optimal and feasible portfolio
• Reference portfolio to assess added value from active investment management
• Investment Management may involve:• Just a replication of the benchmark (passive management or ‘indexing’), or
• Tactical deviations from benchmark to implement market views with the objective of outperforming the benchmark (active management), or
• An intermediate strategy focusing mostly on profiting, within defined risk limits, from arbitrage opportunities driven by short-term market conditions (‘enhanced indexing’).

Investment Management Styles
47

Strategic Decisions (beta)
Main decision
Measurement
Active Decisions (active)
Implementation
Costs
Importance
Passive management of market exposures; source of expected long term risk
premium
Active management through security selection, tactical deviations , market
timing (zero sum game)
Investing in the benchmark portfolio
Outperform the benchmark portfolio
Cheap (low fees) and does not require much skill
Expensive (fees and cost of infrastructure) and skill is
critical
Dominant source of risk in most institutional portfolios
Small part in most institutional portfolios
Measurement: excess return over benchmark
Measurement: total return of the benchmark
48
Strategic vs. Active Investment Decisions
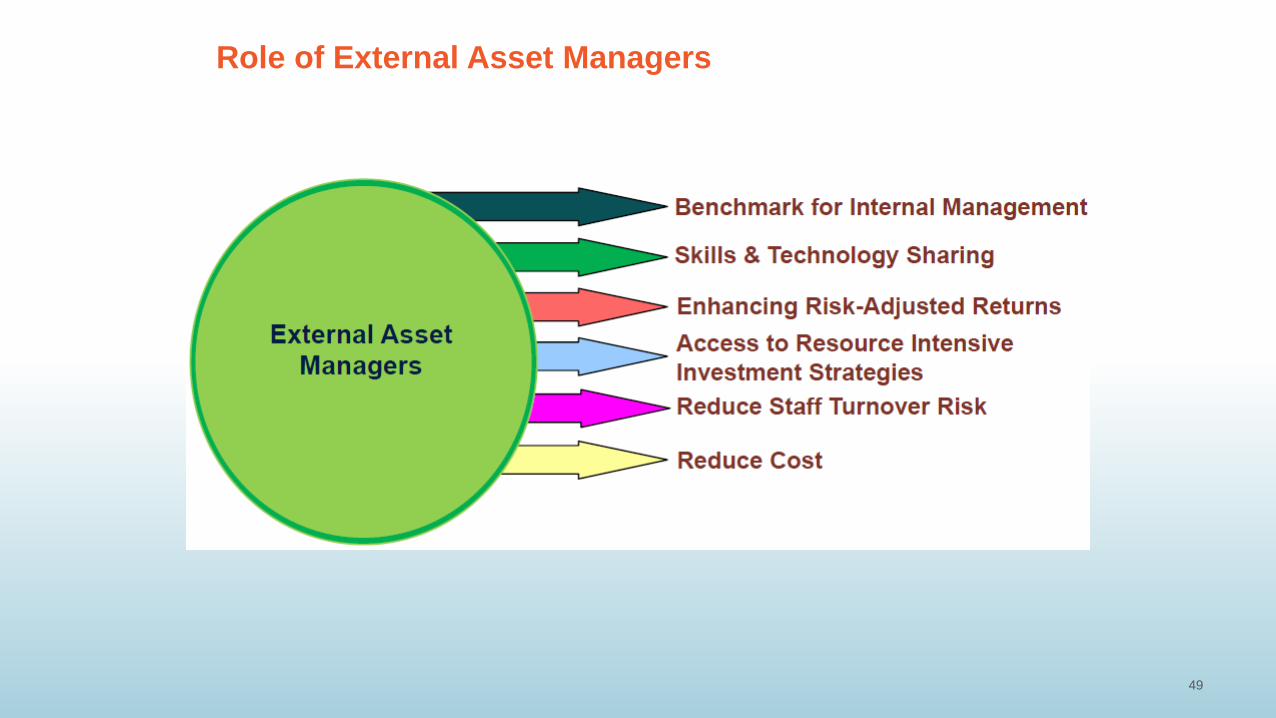
Role of External Asset Managers
49
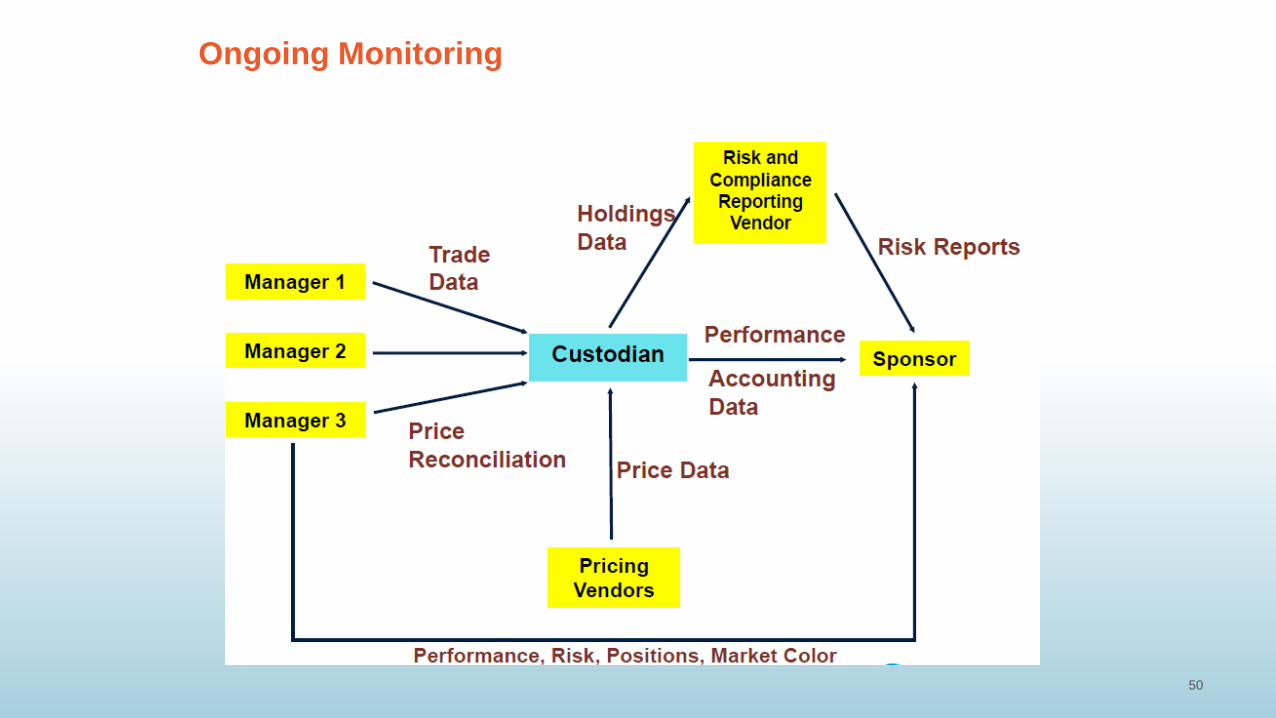
Ongoing Monitoring
50

Investment Framework
51
Governance Structure
Investment Policy
Investment Management
Risk Management
Performance Measurement
Accounting & Reporting
InformationTechnology

Stages of Risk Management
52
Typical Risks in Pension Fund
53
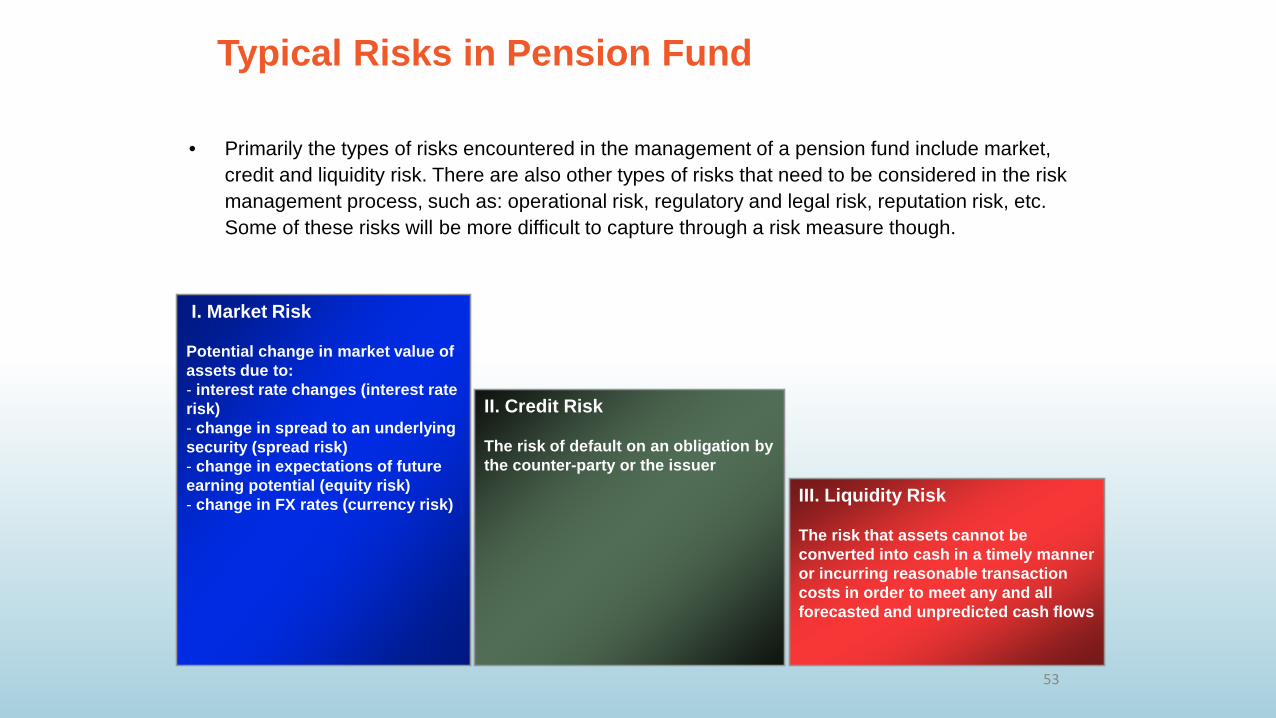
I. Market Risk
Potential change in market value of assets due to:- interest rate changes (interest rate risk)- change in spread to an underlying security (spread risk)- change in expectations of future earning potential (equity risk)- change in FX rates (currency risk) III. Liquidity Risk
The risk that assets cannot be converted into cash in a timely manner or incurring reasonable transaction costs in order to meet any and all forecasted and unpredicted cash flows
II. Credit Risk
The risk of default on an obligation by the counter-party or the issuer
• Primarily the types of risks encountered in the management of a pension fund include market, credit and liquidity risk. There are also other types of risks that need to be considered in the risk management process, such as: operational risk, regulatory and legal risk, reputation risk, etc. Some of these risks will be more difficult to capture through a risk measure though.

What do you need for Risk Management?
54
• Professional systems that allow to accurately measure risks across the asset portfolio on a forward-looking basis, but also from an ALM perspective

Types of Risk-taking Activities
Risk can be deployed in one of two ways:
– Strategic Asset Allocation
– Active Risk Taking
55
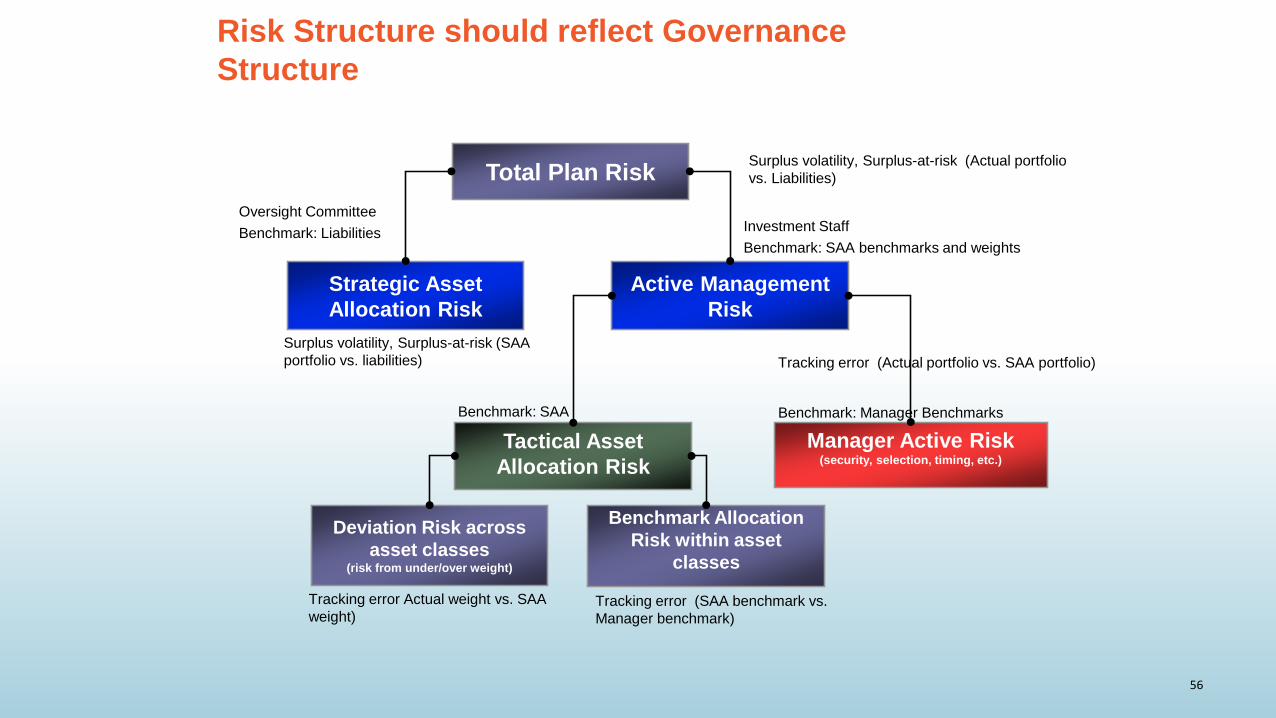
Risk Structure should reflect Governance Structure
56
Total Plan Risk
Strategic Asset Allocation Risk
Active Management Risk
Tactical Asset Allocation Risk
Manager Active Risk(security, selection, timing, etc.)
Deviation Risk across asset classes
(risk from under/over weight)
Benchmark Allocation Risk within asset
classes
Surplus volatility, Surplus-at-risk (Actual portfolio vs. Liabilities)
Surplus volatility, Surplus-at-risk (SAA portfolio vs. liabilities) Tracking error (Actual portfolio vs. SAA portfolio)
Tracking error Actual weight vs. SAA weight)
Tracking error (SAA benchmark vs. Manager benchmark)
Oversight Committee Benchmark: Liabilities Investment Staff
Benchmark: SAA benchmarks and weights
Benchmark: SAA Benchmark: Manager Benchmarks

Performance Measurement
It is important to measure accurately performance and to understand the attribution of it to the various investment decisions made (either internally or be the external managers)
57

Investment Framework
58
Governance Structure
Investment Policy
Investment Management
Risk Management
Performance Measurement
Accounting & Reporting
InformationTechnology

Role of a custodian
59

Periodic, Relevant and Reliable Reporting are Key to our Governance
60
Summary
61
• Create a governance structure which aligns incentives of fiduciaries with those of stakeholders in the assets and ensures accountability for results.
• Focus on continuing Board education as well as an explicit strategic communication strategy with all stakeholders.
• Define investment objectives and risk tolerance in the context of liability characteristics when setting investment policy.
• Translate that into a sound strategic asset allocation that is owned at the Board level and implemented consistently over time
• Evaluate passive versus active management decisions in the context of your risk tolerance and organizational capabilities; recognize that managing external managers requires significant investment in in-house staff and infrastructure.
©2012 The International Bank for Reconstruction and Development / The World Bank 1818 H Street NWWashington DC 20433/ Telephone: 202-473-1000/ Internet: www.worldbank.org
E-mail: [email protected]
All rights reserved.
This work is a product of the staff of the International Bank for Reconstruction and Development/The World Bank. Thefindings, interpretations, and conclusions expressed in this work do not necessarily reflect the views of the ExecutiveDirectors of the World Bank or the governments they represent.
The World Bank does not guarantee the accuracy of the data included in this work. The boundaries, colors,denominations, and other information shown on any map in this work do not imply any judgment on the part of theWorld Bank concerning the legal status of any territory or the endorsement or acceptance of such boundaries.
Rights and Permissions
The material in this publication is copyrighted. Copying and/or transmitting portions or all of this work without permissionmay be a violation of applicable law. The International Bank for Reconstruction and Development / The World Bankencourages dissemination of its work and will normally grant permission to reproduce portions of the work promptly.
For permission to photocopy or reprint any part of this work, please contact the World Bank Treasury.
Disclaimers