Fracture Toughness Evaluation of Natural Gas … TOUGHNESS EVALUATION OF NATURAL GAS PIPELINE UNDER...
6
CORROSION SCIENCE AND TECHNOLOGY, Vol.8, No.4(2009), pp.133~138 133 Fracture Toughness Evaluation of Natural Gas Pipeline under the Cathodic Protection Cheol-Man Kim † , Jong-Hyun Baek, Young-Pyo Kim, and Woo-Sik Kim Gas Facility Research Group, R&D Division, Korea Gas Corporation 638-1, Il-Dong, Sangnok_Gu, Ansan-City, Gyeonggi-Do, 426-790, Korea (Received March 19, 2007; Revised July 17, 2009; Accepted July 18, 2009) For the corrosion protection of the natural gas transmission pipelines, two methods are used, cathodic protectio n and coating technique. In the case of cathodic protection, defects are embrittled by occurring hydrogen at the crack tip or material surface. It is however very important to evaluate whether cracks in the embrittled area can grow or not, especially in weld metal. In this work, on the basis of elastic plastic fracture mechanics, we performed the CTOD testing with various test conditions, such as testing rate and potential. The CTOD of the base metal and the weld metal showed a strong dependence of the test conditions. The CTOD decrease d with decreasing testing rate and with increasing cathodic potential. The morphology of the fracture surface showed the quasi-cleavage at low testing rate and cathodic overprotection. The low CTOD was caused by hydrogen embrittlement at crack tip. Keywords : fracture toughness, cathodic protection, hydrogen embrittlement, CTOD, API 5L X65 steel † Corresponding author: [email protected] 1. Introduction Korea Gas Corporation (KOGAS) has pipelines that are coated with polyethylene and buried to a depth of about 1.5 m from the natural ground level. Designated sand is used as backfilling material. In spite of careful installation and inspection, the pipelines may however have a few coating holidays. In order to prevent external corrosion, the electrochemical potential of the pipelines shall not be- come more anodic than -0.85 V vs. Cu/CuSO 4 . 1) For the most effective corrosion protection, it is preferable that the potential is far below the -0.85 V criteria. However, additional cost must be paid to maintain a very low potential. In KOGAS, the potential standard of the cathodic pro- tection system for underground pipeline was prescribed so that it is conforms to “Cathodic Protection of Pipelines” specified in Standard for Urban Gas Safety Control, Unified Notification. The upper limit of cathodic potential of a pipeline in the soil with flowing cathodic current shall be -0.85 V and less (-0.95 V and less in the soil where sulfate reducing bacteria propagate) on the basis of the reference electrode of saturated copper sulfate. Efforts shall be made so that the lower limit of cathodic potential will be -2.5 V and over on the basis of the reference elec- trode of saturated copper sulfate, except areas interfered by the subway and others. It has been reported that the hydrogen produced by elec- trochemical reactions result in embrittlement for the cath- odically protected pipelines. 2),3),4) In general, hydrogen em- brittlement tends to appear in high strength, low alloy steels and the possibility of its occurrence depends on the operating stress, hardness of the metal, and the amount of absorbed hydrogen. Previous studies have shown that hydrogen could diffuse into carbon steel by 8 wt%ppm, 2),5) when the negative electrochemical reaction occurs on the carbon steel at the conditions of room temperature and 1atm regardless of the solution pH. The fracture morphol- ogy changes from dimple rupture to intergranular or cleav- age fracture and the reduction of area decreases for high strength steel with increasing amounts of hydrogen. Only mechanical testing such as tensile and impact tests have been conducted up to the present. In that respect, it was considered to perform a series of fracture toughness tests, including cracks embedded in material. The objective of this work is to evaluate the CTOD (Crack Tip Opening Displacement) of the API 5L X65 natural gas pipeline steel under cathodic protection at vari- ous conditions. The effects of the rolling direction, welding process and potential with respect on hydrogen embrittle-
Transcript of Fracture Toughness Evaluation of Natural Gas … TOUGHNESS EVALUATION OF NATURAL GAS PIPELINE UNDER...

CORROSION SCIENCE AND TECHNOLOGY, Vol.8, No.4(2009), pp.133~138
133
Fracture Toughness Evaluation of Natural Gas Pipeline under the Cathodic Protection
Cheol-Man Kim†, Jong-Hyun Baek, Young-Pyo Kim, and Woo-Sik Kim
Gas Facility Research Group, R&D Division, Korea Gas Corporation638-1, Il-Dong, Sangnok_Gu, Ansan-City, Gyeonggi-Do, 426-790, Korea
(Received March 19, 2007; Revised July 17, 2009; Accepted July 18, 2009)
For the corrosion protection of the natural gas transmission pipelines, two methods are used, cathodic protectionand coating technique. In the case of cathodic protection, defects are embrittled by occurring hydrogenat the crack tip or material surface. It is however very important to evaluate whether cracks in the embrittledarea can grow or not, especially in weld metal. In this work, on the basis of elastic plastic fracture mechanics,we performed the CTOD testing with various test conditions, such as testing rate and potential. The CTODof the base metal and the weld metal showed a strong dependence of the test conditions. The CTOD decreasedwith decreasing testing rate and with increasing cathodic potential. The morphology of the fracture surfaceshowed the quasi-cleavage at low testing rate and cathodic overprotection. The low CTOD was causedby hydrogen embrittlement at crack tip.
Keywords : fracture toughness, cathodic protection, hydrogen embrittlement, CTOD, API 5L X65 steel
†Corresponding author: [email protected]
1. Introduction
Korea Gas Corporation (KOGAS) has pipelines that are coated with polyethylene and buried to a depth of about 1.5 m from the natural ground level. Designated sand is used as backfilling material. In spite of careful installation and inspection, the pipelines may however have a few coating holidays. In order to prevent external corrosion, the electrochemical potential of the pipelines shall not be-come more anodic than -0.85 V vs. Cu/CuSO4.1) For the most effective corrosion protection, it is preferable that the potential is far below the -0.85 V criteria. However, additional cost must be paid to maintain a very low potential. In KOGAS, the potential standard of the cathodic pro-tection system for underground pipeline was prescribed so that it is conforms to “Cathodic Protection of Pipelines” specified in Standard for Urban Gas Safety Control, Unified Notification. The upper limit of cathodic potential of a pipeline in the soil with flowing cathodic current shall be -0.85 V and less (-0.95 V and less in the soil where sulfate reducing bacteria propagate) on the basis of the reference electrode of saturated copper sulfate. Efforts shall be made so that the lower limit of cathodic potential
will be -2.5 V and over on the basis of the reference elec-trode of saturated copper sulfate, except areas interfered by the subway and others. It has been reported that the hydrogen produced by elec-trochemical reactions result in embrittlement for the cath-odically protected pipelines.2),3),4) In general, hydrogen em-brittlement tends to appear in high strength, low alloy steels and the possibility of its occurrence depends on the operating stress, hardness of the metal, and the amount of absorbed hydrogen. Previous studies have shown that hydrogen could diffuse into carbon steel by 8 wt%ppm, 2),5) when the negative electrochemical reaction occurs on the carbon steel at the conditions of room temperature and 1atm regardless of the solution pH. The fracture morphol-ogy changes from dimple rupture to intergranular or cleav-age fracture and the reduction of area decreases for high strength steel with increasing amounts of hydrogen. Only mechanical testing such as tensile and impact tests have been conducted up to the present. In that respect, it was considered to perform a series of fracture toughness tests, including cracks embedded in material. The objective of this work is to evaluate the CTOD (Crack Tip Opening Displacement) of the API 5L X65 natural gas pipeline steel under cathodic protection at vari-ous conditions. The effects of the rolling direction, welding process and potential with respect on hydrogen embrittle-

CHEOL-MAN KIM, JONG-HYUN BAEK, YOUNG-PYO KIM, AND WOO-SIK KIM
134 CORROSION SCIENCE AND TECHNOLOGY Vol.8, No.4, 2009
Table 1. The chemical compositions (wt%) of X65 base and weld metal
Elements C Mn P S Si Nb V Ti Cu Al Ni Cr Mo Ceq.*Base metal 0.084 1.22 0.014 0.001 0.279 0.046 0.055 0.023 0.019 0.041 0.026 0.030 0.002 0.31Seam weld metal 0.080 1.36 0.021 0.005 0.393 0.023 0.035 0.012 0.051 0.026 0.018 0.039 0.160 0.36Girth weld metal 0.073 1.06 0.022 0.005 0.525 0.021 0.016 0.030 0.024 0.012 0.023 0.046 0.003 0.27
* Ceq. = C + Mn/6 + (Ni+Cu)/15 + (Cr+Mo+V)/5
ment at the notch tip of CTOD specimens were studied.
2. Experimental procedure
2.1 Materials Pipe Grade API 5L X65 with diameter 30 inch and wall thickness of 17.5 mm was tested. The pipeline was manu-factured by TMCP (thermo-mechanical control process). The welding processes were seam weld (longitudinal di-rection of pipelines) and girth weld (circumferential direc-tion of pipelines). The seam weld was conducted in the pipe mill by means of GMAW (Gas Metal Arc Welding) tack welding and SAW (Submerged Arc Welding). The girth weld, conducted in the field, consisted of GTAW (Gas Tungsten Arc Welding) and SMAW (Shielded Metal Arc Welding). Table 1 shows the chemical compositions of base and weld metal. The carbon content was about 0.08 wt% and the Mn content was 1 wt% or more.
2.2 Specimen Structure specimens were made for microstructure ob-servation by rolling direction. They were etched with 3 % Nital and were observed by optical microscope. Subsize tensile specimen by ASTM E8M6) were taken from base metal (longitudinal and circumferential direction) and weld metal (seam and girth weld metal). The thickness of speci-men was 5 mm. The CTOD fracture toughness specimen were prepared by BS7448 part 17) for base and weld metal. It was a rectangular section bend type and width and thickness was 26 mm, 13 mm respectively. The base metal specimen was divided into T-L and L-T according to crack growth direction and the weld metal was classified by seam and girth weld metal. For the CTOD specimens, L-T means that fatigue crack grows transverse to the rolling direction and T-L means parallel to the rolling direction. All of the specimens were polished by SiC paper (#600).
2.3 Fracture toughness experiment device Figure 1 shows a schematic diagram of the experimental equipment. The CTOD fracture toughness test was con-ducted in a cell filled with buffer solution of 1 N Na2CO3
and 1 N NaHCO3 (pH 7.63). The specimens were cathodi-cally charged for 12 hours in a cell with a potentio-stat/galvanostat. A carbon stick was used as the counter electrode and a saturated calomel electrode as the reference electrode. The specimens were the working electrode.
2.4 CTOD testing The CTOD fracture toughness tests were carried out for the base and weld metal under various conditions of testing rate and potential. According to BS7448 Part 1, the speci-mens were pre-cracked to have a crack depth of approx-imately 13 mm. The final cyclic load was 247.5 - 202.5 kgf. Before testing, all of the specimens were charged cath-odically for 12 hours. The surrounding of notch and pre-crack was protected from hydrogen attack by coating so that it could permeate only through the notch and pre-crack. The range of testing rate set up as 0.01 to 1 mm/min and potential -2 to -0.4 V. The displacement was measured by using a COD gauge and critical CTOD, δc, determined at the maximum applied load. After CTOD testing, the specimens were cooled in liq-uid N2 and broken open. The total crack length (machined and pre-cracked notch) was measured with an image ana-lyzer equipped with CCD camera. The specimens were
Fig. 1. Schematic diagram of CTOD testing deviceA: COD gauge, B: Load cell, C: Counter electrode, D: Reference electrode, E: Galvanostat/Potentiostat
FRACTURE TOUGHNESS EVALUATION OF NATURAL GAS PIPELINE UNDER THE CATHODIC PROTECTION
135CORROSION SCIENCE AND TECHNOLOGY Vol.8, No.4, 2009
investigated by scanning electron microscope for further examination of their fracture surface morphology at the crack tip.
3. Results and discussion
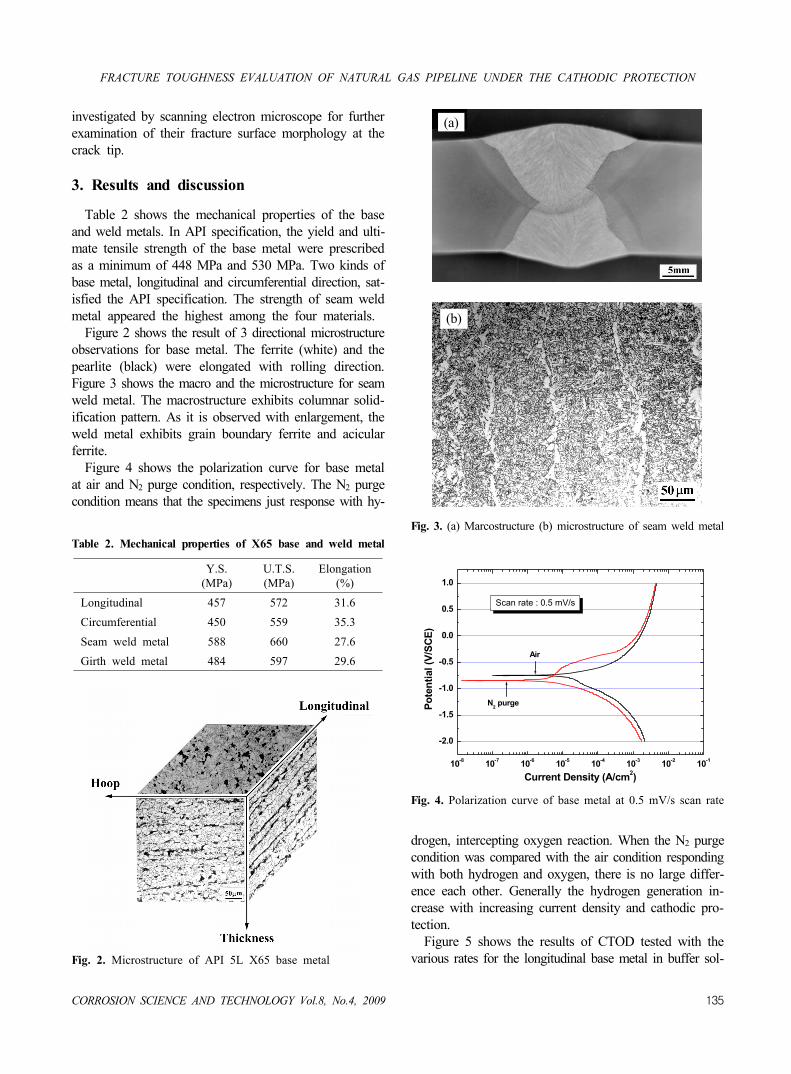
Table 2 shows the mechanical properties of the base and weld metals. In API specification, the yield and ulti-mate tensile strength of the base metal were prescribed as a minimum of 448 MPa and 530 MPa. Two kinds of base metal, longitudinal and circumferential direction, sat-isfied the API specification. The strength of seam weld metal appeared the highest among the four materials. Figure 2 shows the result of 3 directional microstructure observations for base metal. The ferrite (white) and the pearlite (black) were elongated with rolling direction. Figure 3 shows the macro and the microstructure for seam weld metal. The macrostructure exhibits columnar solid-ification pattern. As it is observed with enlargement, the weld metal exhibits grain boundary ferrite and acicular ferrite. Figure 4 shows the polarization curve for base metal at air and N2 purge condition, respectively. The N2 purge condition means that the specimens just response with hy-
Table 2. Mechanical properties of X65 base and weld metal
Y.S.(MPa)
U.T.S. (MPa)
Elongation(%)
Longitudinal 457 572 31.6Circumferential 450 559 35.3Seam weld metal 588 660 27.6Girth weld metal 484 597 29.6
Fig. 2. Microstructure of API 5L X65 base metal
(a)
(b)
Fig. 3. (a) Marcostructure (b) microstructure of seam weld metal
10-8 10-7 10-6 10-5 10-4 10-3 10-2 10-1
-2.0
-1.5
-1.0
-0.5
0.0
0.5
1.0
Scan rate : 0.5 mV/s
Air
N2 purge
Pote
ntia
l (V/
SCE)
Current Density (A/cm2)
Fig. 4. Polarization curve of base metal at 0.5 mV/s scan rate
drogen, intercepting oxygen reaction. When the N2 purge condition was compared with the air condition responding with both hydrogen and oxygen, there is no large differ-ence each other. Generally the hydrogen generation in-crease with increasing current density and cathodic pro-tection. Figure 5 shows the results of CTOD tested with the various rates for the longitudinal base metal in buffer sol-

CHEOL-MAN KIM, JONG-HYUN BAEK, YOUNG-PYO KIM, AND WOO-SIK KIM
136 CORROSION SCIENCE AND TECHNOLOGY Vol.8, No.4, 2009
(a)
(b)
(c)
(d)
Fig. 6. Fractographs of X65 base metal (L-T) (a) 0.01 and, (b) 1 mm/min in air, (c) 0.01 and, (d) 1 mm/min in -1 V
ution under the conditions of air and -1 V potential. In air condition, which means that the solution was exposed to the atmosphere without applying an electric current, the value of CTOD changed little with testing rate. But the CTOD was decreased severely with decreasing the testing rate at the specimen charged with -1 V cathodic potential.
1E-3 0.01 0.1 1 100.0
0.5
1.0
1.5
2.0
-1 V
Air
CTO
D (m
m)
Testing Rate (mm/min)
Fig. 5. CTOD variations of X65 base metal (L-T) according to testing rate
Therefore, we confirmed that cathodic potential charge and testing rate play an important role in the fracture behavior of the CTOD test. Figure 6 shows fractographs of X65 base metal (L-T direction) for different test rate in air and -1 V. The fracto-graphs of all specimens have a dimpled ductile fracture appearance. But the one tested at -1 V potential and 0.01 mm/min testing rate has the smaller dimple sizes and some cleavage of brittle fracture. Figure 7 shows the results of CTOD testing of the base and weld metal with potential variations at the testing rate of 0.01 mm/min. The CTOD decreased as the potential increased cathodically over the entire potential range, which means that hydrogen was present to enhance hydro-gen embrittlement. The CTOD of the base metal decreased more than that of the weld metal. L-T base metal showed higher CTOD than T-L at every potential level. It showed that the rolling direction has an important relation with the CTOD under the cathodic protection, too. Especially, T-L base metal had the lowest CTOD of 0.05 mm at -2.0 V. When it is considered that the applied

FRACTURE TOUGHNESS EVALUATION OF NATURAL GAS PIPELINE UNDER THE CATHODIC PROTECTION
137CORROSION SCIENCE AND TECHNOLOGY Vol.8, No.4, 2009
load in the circumferential direction is twice than that of the longitudinal direction in the pressured pipeline and the CTOD of T-L is very low at the over protection condition, the cracks in the longitudinal direction are the most critical factor. In KOGAS, it was prescribed that the protection poten-tial had to be maintained more negative than -0.85 V vs. Cu/CuSO4. Because overprotection causes a reduction of CTOD as shown in figure 7, it had to ensure that the pipes had sufficient toughness. In API standard 1104, when three valid specimen tests performed at or below the lowest anticipated service temperature, the CTOD of girth weld metal and heat affected zone are prescribed as 0.127 or 0.254 mm respectively.8) Though under different conditions, the CTOD of T-L base metal tested at -2 V was smaller than the API standard 1104 specification while other results were larger. Therefore, in the case of pipe-lines under overprotection less than -1.5 V, brittle fracture will occur more easily in the T-L base metal. There wasn’t a large difference for CTOD between seam and girth weld metal. As potential increased under the cathodic protection, the CTOD decreased over the total range. The CTOD of both weld metal at -2 V showed 0.14 mm, which is higher than the lower value of API 1104. Figure 8 shows a typical load vs. displacement record for the T-L base metal at the testing rate of 0.01 mm/min. When it was charged cathodically by -2 V, as soon as the yield point was reached, the applied load decreased slowly. But under cathodic condition of -0.4 V, the dis-placement at maximum load was increased largely without a clear load drop. Figure 9 shows the fractographs of X65 base and seam weld metal at -0.4 and -2 V. The L-T base metal at -0.4
-2.5 -2.0 -1.5 -1.0 -0.5 0.00.0
0.5
1.0
CTO
D (m
m)
Potential (V)
Base Metal (L-T) Base Metal (T-L) Seam Weld Metal Girth Weld Metal
Fig. 7. CTOD variations of X65 base and weld metal according to potential
V showed large dimples, which were typical ductile frac-ture mode. Also the weld metal at -0.4 V appeared to have a ductile fracture mode, but the size of dimples was smaller than the base metal. The two materials at -2 V showed a quasi-cleavage, which was a kind of brittle fracture. The results of fracture morphology observation indicated that the quantity of quasi-cleavage increased and the CTOD decreased with increasing cathodic potential. Because the hydrogen occurred at the crack tip under over-protection, the area fraction of quasi-cleavage increased and the CTOD decreased, which it showed that fracture morphology had a good correlation with the CTOD.
4. Conclusions
(1) The CTOD of API 5L X65 base metal (L-T) de-pended sensitively on the testing rate in cathodic protection condition, but not in air condition. (2) The CTOD decreased with increasing cathodic po-tential at the testing rate of 0.01 mm/min. This is due to hydrogen embrittlement at the crack tip. The fracture morphology of base and weld metal changed from ductile fracture, such as dimples, to brittle fracture, such as qua-si-cleavage as a result of hydrogen embrittlement at the notch tip. (3) The CTOD of L-T base metal, in which the crack grows perpendicularly to the rolling direction, was larger than the CTOD of T-L, in which the crack grows parallel to the rolling direction, under cathodic potential environ-ment. (4) The CTOD of T-L base metal was smaller than the API specification at -2 V cathodic potential. Therefore, it was estimated that brittle fracture will be happened more easily under overprotection.
0.0 0.5 1.0 1.5 2.0 2.5 3.00
500
1000
1500
2000
-0.4V
-2V
Load
(Kg f)
CMOD (mm)
Fig. 8. Load vs. COD graph of base metal (T-L)

CHEOL-MAN KIM, JONG-HYUN BAEK, YOUNG-PYO KIM, AND WOO-SIK KIM
138 CORROSION SCIENCE AND TECHNOLOGY Vol.8, No.4, 2009
(a)
(b)
(c)
(d)
Fig. 9. Fractographs of X65 base and seam weld metal at 0.01 mm/min(a) -0.4 V and, (b) -2 V in base metal (L-T), (c) -0.4 V and, (d) -2 V in seam weld metal
References
1. NACE Standard RP0169-92, “Control of external corro-sion on underground or submerged metallic piping systems”.
2. K. Kasahara and T. Isowaki, Tetsu to Hagane, 2, 148 (1981).
3. N. Hagiwara and N. Oguchi, “Fracture Toughness (CTOD) of Line Pipe Materials under Cathodic Protection”, Osaka Gas Forum, 1997.
4. Y. Yamaguchi and H. Nonaka, et al., Tetsu to Hagane, 12, 66 (1992).
5. Scot X. Mao and J.L.Luo, et al., International pipeline conference proceeding, 1, 485, (1998).
6. ASTM E8M, “Standard test method for tension testing of metallic materials”, 1997.
7. BS 7448 Part 1, “Method for determination of KIc, critical CTOD and critical J values of metallic materials”, 1991.
8. API Standard 1104, “Welding of pipelines and related facilities”, 1999.