Agile Modelling in Software Engineering Audrey Nemeth, Vladimir Borisov.
Upload
myron-stevensCategory
view
221download
3
Fracture Strength of Silicon Carbide Microspecimens Versus Weibull Size Effect Predictions
Noel Nemeth
Laura Evans
Osama Jadaan
William Sharpe
George Quinn
Mark Trapp
Glenn Beheim
TMS 2005 Annual MeetingSymposium: Mechanical Behavior of Thin Films and Small Structures:
Fatigue, Fracture, and Reliability of MEMS and Thin Structures I
February 14-17, 2005,
San Francisco, California
Glenn Research Centerat Lewis Field

Outline
ObjectiveWeibull size-effect relationship Specimen design, testing & fractographyRoom-temperature size-effect study of a
polycrystalline SiCRoom-temperature size-effect study of a
single crystal SiC
- Effect of dimensional variation using ANSYS/PDS & CARES/Life

Objective
Examine the capability of Weibull statistics to predict the stochastic strength behavior of brittle SiC structures at the appropriate size scale for designing PowerMEMS. Weibull Size-effect study
Demonstrate the ANSYS Probabilistic Design System (PDS) with NASA CARES/Life
- predict the effect of stochastic variables (component geometry in this case) on the strength response of a structure.

Technical Approach:
• SiC microfabrication technology (Glenn Beheim (PI), RIS0) - Develop deep reactive ion etching (DRIE) process for fabrication of high aspect ratio SiC microstructures.
• Reliability model for SiC microstructures (Noel Nemeth, RSL0) - Test SiC microstructures and analyze using CARES to establish a probabilistic design methodology for microscale turbomachinery fabricated using SiC.
Structures for microengines have high aspect ratios (vertical dimension oretch depth divided by lateral feature size), which makes microfabricationdifficult. Highly directional etch processes are required.
Advanced Micromachining Technology for SiC Microengines
MIT radial inflow turbine, fabricated in silicon.Rotor diameter = 4 mm, Blade span (height) = 200 m,Bearing gap = 10 m (between rotor and stator baseplate).Must hold bearing gap to within 1 m whileetching though 300-m-thick stator baseplate.

What does Weibull behavior & size-effect mean? Material strength displays stochastic behavior.
Strength depends on size, load configuration, and geometry of structure (size effect).
mf
e
mf
m
fA
mf
f
A
dAyx
P
exp1
exp1
),(exp1
0
0
m
e
e
f
f
A
A/1
1,
2,
2,
1,
Size-Effect:
1 2
f is the peak stressfound in the specimen

3.1 mm1.3 mm
0.2mm
1.179 mm
0.675 mm
(a) (b) (c) (d)
0.1 mm
Curved Double-Notch Circular-hole Elliptical-hole
Size-effect study with test specimens designed withvarious levels of stress concentration
Tests a fundamental premise of Weibull theory – that strength increases as the area (or volume) under highest stress decreases.
BaselineGeometry

DRIE Process Parameters
FABRICATION RUN
SUBSTRATE MECHANISM GAS RATE
Batch 3Batch 4
Polycrystalline SiC Chemical / Physical (A) SF6
Ar
0.22 µm/min
Batch 6 Single crystal SiC TMEP (B) etch SF6
passivate C4F8 0.2 µm/min
etch: F ions CFx, SiFxpassivate: CxFy
maskSiC
etch: F ions CFx, SiFx
mask
(B) Time-Multiplexed Etch-Passivate (TMEP)
(A) Chemical/PhysicalEtch mechanisms:

Materials Fabricated with DRIESingle Crystal SiC
• Hexagonal crystal n-type 6H-SiC • TMEP process
Polycrystalline SiC• Cubic -phase • Chemical/physical process
Note side-wall roughness from etching

Notice the roughness and grooving in the notch and all the twist hackle in the single large columnar SiC grain.
Fractography of polycrystalline SiC
The critical flaws were in most cases a combination of the sidewall grooves, which probably acted as stress concentrators, and a favorably oriented large grain.

Specimen n Avg. strength(GPa)
m
(GPa)
Aesw
mm2
Curved 22 0.47 0.16 3.2 0.53 0.184
Notched 26 0.68 0.19 3.8 0.75 0.0143
Specimen n Avg. strength(GPa)
m
(GPa)
Aesw
mm2
Curved 23 0.47 0.15 3.4 0.53 0.197
Notched 25 0.79 0.28 3.1 0.88 0.0157
Size-effect study of polycrystalline SiC Batches 3 & 4
Both fabricated using the same processing recipe
Batch 3 - Weibull parameters:
Batch 4 – Weibull parameters:
Fracture stresses determined with stress concentration factors computed from FEA using average-specimen dimensions
CARES/Life & FEA used to calculate effective side-wall area Aesw
Batch 3
0.0
0.2
0.4
0.6
0.8
1.0
0.0 0.5 1.0 1.5 2.0
Strength (GPa)
Pro
bab
ility
of
Fa
ilure
Curved experimental
Notched Experimental
Curved Weibull Plot
Notched (side-wall)
Batch 4
0.0
0.2
0.4
0.6
0.8
1.0
0.0 0.5 1.0 1.5 2.0
Strength (GPa)
Pro
ba
bili
ty o
f F
ailu
re
Curved Experimental
Notched Experimental
Curved Weibull Plot
Notched (side-wall)
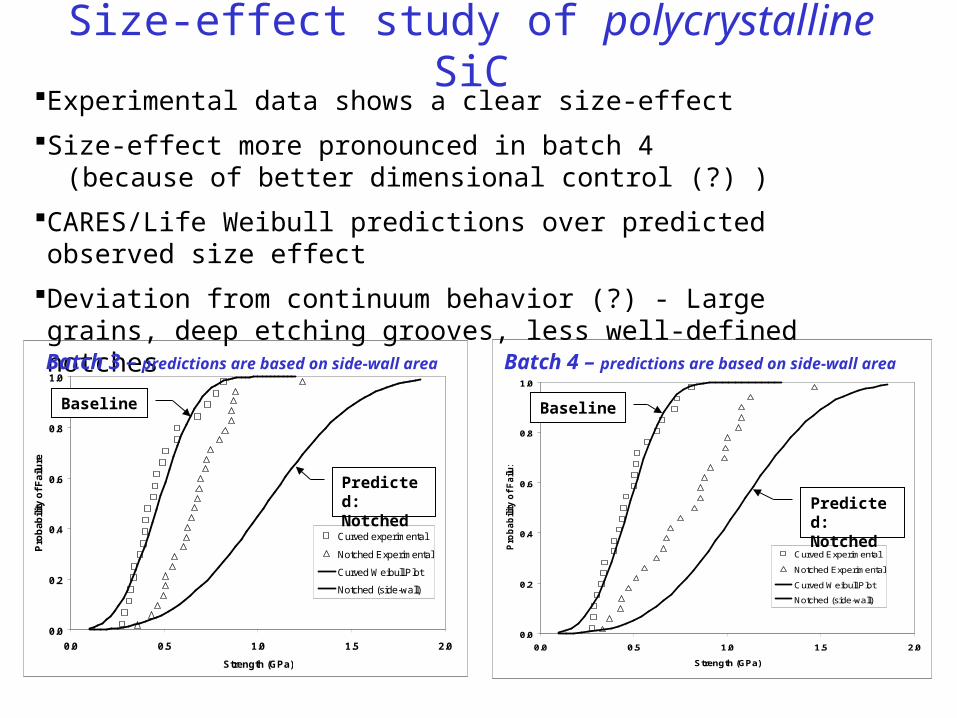
Size-effect study of polycrystalline SiCExperimental data shows a clear size-effect
Size-effect more pronounced in batch 4 (because of better dimensional control (?) )
CARES/Life Weibull predictions over predicted observed size effect
Deviation from continuum behavior (?) - Large grains, deep etching grooves, less well-defined notches
Baseline Baseline
Predicted:Notched Predicted:
Notched
Batch 3 – predictions are based on side-wall area Batch 4 – predictions are based on side-wall area

Size-effect study of single crystal SiC Batch 6 – fabricated 2004
fabricated with an improved process than previous batches 3 & 4
Nickel Mask Side (Top)
Circular-hole specimencross-section
Side-wall
Circular-hole example 1
Circular-hole example 2
Elliptical-hole example 1
Elliptical-hole example 2

Curved t Top Width Bottom Width
Batch 6 127 2 111 3 125 7
Circular hole t Top Width Top Diameter Bottom Width Bottom Diameter
Batch 6 126 2 210 3 91 2 223 7 77 5
Ellipse t Top Width
Top Maj. Axis
Top Min. Axis
Bottom Width
Bottom Maj. Axis
Bottom Min. Axis
Batch 6 127 1 210 4 91 4 42 3 225 7 73 5 26 8
Batch 6
Circular-hole Specimen
Curved Specimen
Elliptical-hole Specimen
2:1 3:1Degree of ellipticity changesfrom top to bottom surface
Top Bottom
Size-effect study of single crystal SiC

Random inputvariables
Random inputvariables
Finite-ElementModel
Finite-ElementModel
Material• Strength• Material
Properties
Loads• Thermal• Structural
Geometry/Tolerances
Boundary Conditions
• Gaps• Fixity
ANSYS/PDS & CARES/Life (Probabilistic Design System)
Bringing Probabilistic Design into Component life prediction
Probabilistic Life Prediction
Probabilistic Life Prediction
CARESANSYS PDS SimulationsPDS Simulations
Using ANSYS macros, CARES/Life evaluates component failure probability for each trial within an ANSYS/PDS simulation.

Normal distribution assumed for dimensional variationMonte-Carlo method used for PDS simulationIsotropic properties assumed – anisotropy not modeled
baselinem
ifiesw
baselineeswbaselineif P
nA
A1
,,
,,, 1
1
ANSYS/PDS & CARES/Life simulation procedure Simulate the effect of dimensional variation
CARES/Life & FEA calculates effective side-wall area Aesw,i using baseline mbaseline and Aesw,baseline
Random number generator chooses Pf,i
Calculate f,i ;
Result : a collection of n ranked fracture strengths;f,1 , f,2 , … f,i , …, f,n. That can be plotted according to :
n
iP irankedf
5.0,,
For the ith trial within the simulation:

Max. Max.
Elliptical-hole principal stress Circular-hole principal stress
Elliptical-hole ¼ symmetry mesh Circular-hole ¼ symmetry meshFinite element models using average specimen dimensions

Specimen n Avg. strength(GPa)
m
(GPa)
Curved 19 0.66 0.12 5.9 0.71
Circular hole 19 1.26 0.34 3.8 1.38
Elliptical hole 18 1.53 0.84 2.0 1.74
Size-effect study of single crystal SiC
Specimen # Simulated specimens,n
m
(GPa)
Curved (baseline) --- 6.5 0.71
Circular hole 200 5.9 1.24
Elliptical hole 200 4.1 1.87
Batch 6 - Weibull parameters from experimental data calculated fracture stresses:
PDS simulated data – estimated Weibull parameters:
Simulations for the circular-hole and elliptical-hole specimen types were run. The curved-specimen was used as the baseline. The simulations were generated using a Weibull modulus mbaseline of 6.5, which was the value obtained from the fracture forces for the curved specimen and ,baseline of 0.71 GPa.

Batch 6
0.0
0.2
0.4
0.6
0.8
1.0
0.0 1.0 2.0 3.0 4.0 5.0
Strength (Gpa)
Pro
ba
bil
ity
of
Fa
ilu
re
Curved (avg. dim.)
Circ.-hole (avg. dim.)
Ellip.-hole (avg. dim.)
Circ.-hole (PDS)
Ellip.-hole (PDS)
Curved (Exp. data)
Circ.-hole (Exp. data)
Ellip.-hole (Exp. data)
Batch 6 – Predictions are based on side-wall area
Size-effect study of single crystal SiC
Baseline
PDS Predicted:Circular-hole
PDS Predicted:Elliptical-hole

Weibull plot of elliptical-hole specimen PDS simulation
Batch 6

Size-effect study of single crystal SiC
Experimental data showed a clear size-effect
Good correlation between prediction and experimental data for the circular-hole specimen
CARES/Life Weibull predictions over predicted size-effect for the elliptical-hole specimen
PDS simulation for the elliptical-hole specimen correlated better to the experimental data than the prediction based on average specimen dimensions

Conclusions The strength response of room-temperature SiC polycrystalline and single crystal microtensile
specimens with various stress concentrations was investigated. Strength controlling flaws were assumed to reside on surfaces that were exposed etching. Both materials showed a size-effect. The Weibull distribution tended to over predict the strength of the polycrystalline material but had
better success predicting the strength response for the single crystal material. Large columnar grains and rough side-walls likely caused deviation from continuum behavior and
therefore affected the accuracy of the analysis for the polycrystalline material . The single crystal material did not have (or had less of) these complications because of an
improved fabrication process that produced smoother side-walls. The microtensile specimens had significant specimen-to-specimen variations in dimensions. We
demonstrated with the single crystal SiC specimens that ANSYS-PDS and CARES/Life could be used to account for this variation.
These results tend to support using the Weibull distribution for design and analysis purposes of SiC MEMS – as long as the material can be modeled as a continuum and size-effect extrapolation from a baseline is kept modest.
Acknowledgments:The authors would like to acknowledge NASA Alternate Fuel Foundation Technologies (AFFT),The Ultra Efficient Engine Technology (UEET) program, DOE, and the generous cooperation and support of ANSYS Incorporated.

Extra Material

Room-temperature test setup at JHU

Specimen: SCGN-14 (notched) Polycrystalline SiC
Fracture started at the notch root from a side wall groove that popped in a crack into a large columnar SiC grain (white arrows) that ran the entire length of the specimen from top to bottom.
Notice the roughness and grooving in the notch and all the twist hackle in the single large columnar SiC grain.
260 MPa nominal gage section stress

Fractography of polycrystalline SiCThe primary fracture sources were grooves in the side walls of the specimens
caused by the etching procedure. These grooves tended to spread out and get deeper away from the nickel mask and probably acted as stress concentrators.
Large grains were often (but not always) at the origin. Presumably the large grains were susceptible to a sharp crack popping in from the etch groove, due to cleavage along a preferred crystallographic plane in the SiC. Other grooves had large grains located next to them, but these may have had orientations resistant to fracture.
In short the critical flaws were in many cases a combination of the sidewall grooves and a favorably oriented large grain.
The colored ellipses show the direction of the elongated columnar SiC grains relative to the specimen geometry. Sometimes they were tilted a little bit.

Batch # n t Top Width Bottom Width
Batch 3 22 136 5 104 2 81 6
Batch 4 23 143 3 107 2 93 2
Batch # n t Top Width Top Notch Width
Bottom Width Bottom Notch Width
Batch 3 26 138 3 202 2 156 7 176 6 146 8
Batch 4 25 144 4 207 2 160 4 193 3 156 5
Two fabrication runs 2003 Batch 3 & Batch 4
Both batches fabricated using the same processing recipe
Notched Specimen
Curved Specimen
Size-effect study of polycrystalline SiC

Batch 3
0.0
0.2
0.4
0.6
0.8
1.0
0.0 0.5 1.0 1.5 2.0
Strength (GPa)
Pro
ba
bili
ty o
f F
ailu
re
Curved experimental
Notched Experimental
Curved Weibull Plot
Notched (side-wall)
Batch 3 – Predictions are based on side-wall area
Size-effect study of polycrystalline SiC
Baseline
Predicted:Notched

Batch 4
0.0
0.2
0.4
0.6
0.8
1.0
0.0 0.5 1.0 1.5 2.0
Strength (GPa)
Pro
ba
bili
ty o
f F
ailu
re
Curved Experimental
Notched Experimental
Curved Weibull Plot
Notched (side-wall)
Size-effect study of polycrystalline SiC
Baseline
Predicted:Notched
Batch 4 – Predictions are based on side-wall area

• Volume flaw & surface analysis• PIA & Batdorf multiaxial models• Fast fracture reliability analysis
•Time-/Cycle-dependent analysis• Multiaxial proof testing• Works with transient FE analysis
CARES/LifePredicting the lifetime reliability of brittle material components
Reliability Evaluation• Component probability of survival• Component “hot spots” - high risk of failure
Parameter EstimationWeibull and fatigue parameter
estimates generated fromspecimen rupture data
Finite Element InterfaceOutput from FEA codes
(stresses, temperatures, volumes)read and printed toNeutral Data Base
Weibull-BatdorfStress-Volume Integration
Weibull-BatdorfStress-Volume Integration
Characterize material• Specimen rupture tests
Predict componentreliability

• General - Free for ANSYS users - works with any kind of ANSYS finite element model – including transient, static, dynamic, linear, non-linear, thermal, structural, electro-magnetic, CFD ..
•Probabilistic preprocessing - Allows large number random input and output parameters - modeling uncertainty in input parameters – Gaussian, log-normal, Weibull… - random input parameters can be defined as correlated data
• Probabilistic methods - Monte Carlo Direct & Latin Hypercube Sampling - Response Surface Method Central Composite & Box-Behnken Designs
• Probabilistic postprocessing - Histograms - Cumulative distribution functions - Sensitivity plots
• Parallel, distributed computing
ANSYS/PDS (Probabilistic Design System)
Capabilities

Random inputvariables
Random inputvariables
Finite-ElementModel
Finite-ElementModel
Material• Strength• Material
Properties
Loads• Thermal• Structural
Geometry/Tolerances
Boundary Conditions
• Gaps• Fixity
ANSYS/PDS (Probabilistic Design System)
Bringing Probabilistic Design into Finite Element Analysis
PDS SimulationsPDS Simulations• Deformations• Stresses• Lifetime
(LCF,...)
Statistical analysis of output parameters
Statistical analysis of output parameters
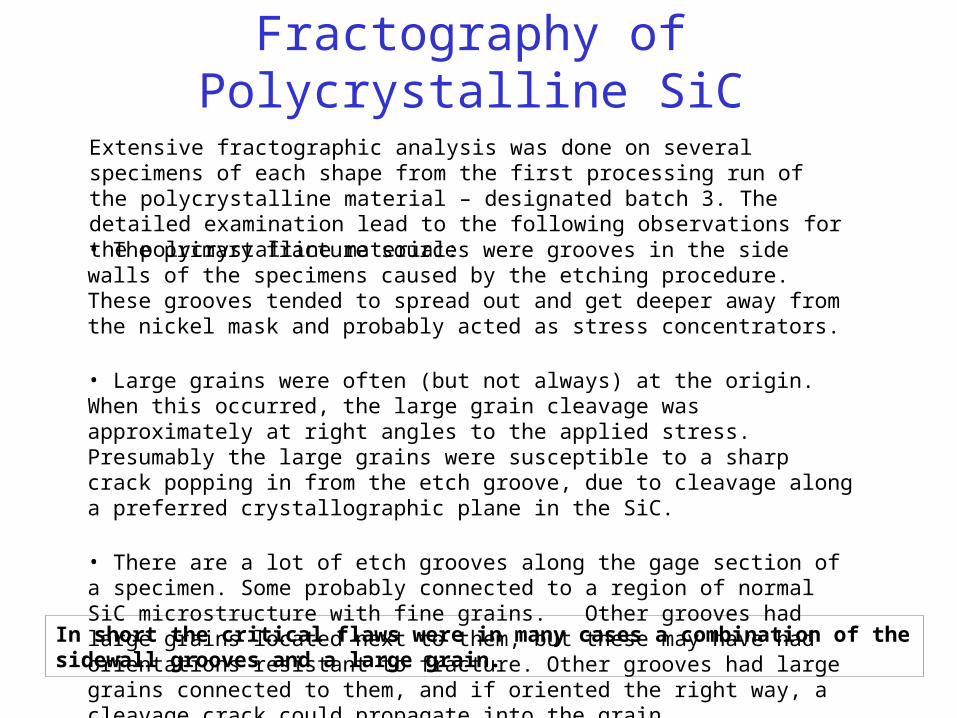
Extensive fractographic analysis was done on several specimens of each shape from the first processing run of the polycrystalline material – designated batch 3. The detailed examination lead to the following observations for the polycrystalline material:
Fractography of Polycrystalline SiC
• The primary fracture sources were grooves in the side walls of the specimens caused by the etching procedure. These grooves tended to spread out and get deeper away from the nickel mask and probably acted as stress concentrators.
• Large grains were often (but not always) at the origin. When this occurred, the large grain cleavage was approximately at right angles to the applied stress. Presumably the large grains were susceptible to a sharp crack popping in from the etch groove, due to cleavage along a preferred crystallographic plane in the SiC.
• There are a lot of etch grooves along the gage section of a specimen. Some probably connected to a region of normal SiC microstructure with fine grains. Other grooves had large grains located next to them, but these may have had orientations resistant to fracture. Other grooves had large grains connected to them, and if oriented the right way, a cleavage crack could propagate into the grain.
In short the critical flaws were in many cases a combination of the sidewall grooves and a large grain.