Fracture behavior of plain concrete beams –...
20
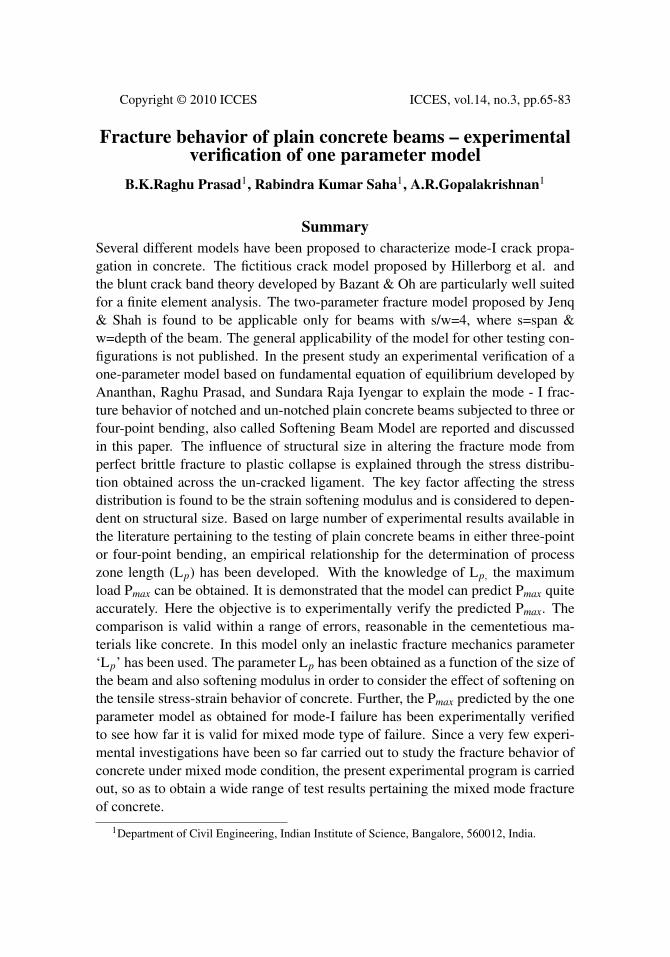
Copyright © 2010 ICCES ICCES, vol.14, no.3, pp.65-83 Fracture behavior of plain concrete beams – experimental verification of one parameter model B.K.Raghu Prasad 1 , Rabindra Kumar Saha 1 , A.R.Gopalakrishnan 1 Summary Several different models have been proposed to characterize mode-I crack propa- gation in concrete. The fictitious crack model proposed by Hillerborg et al. and the blunt crack band theory developed by Bazant & Oh are particularly well suited for a finite element analysis. The two-parameter fracture model proposed by Jenq & Shah is found to be applicable only for beams with s/w=4, where s=span & w=depth of the beam. The general applicability of the model for other testing con- figurations is not published. In the present study an experimental verification of a one-parameter model based on fundamental equation of equilibrium developed by Ananthan, Raghu Prasad, and Sundara Raja Iyengar to explain the mode - I frac- ture behavior of notched and un-notched plain concrete beams subjected to three or four-point bending, also called Softening Beam Model are reported and discussed in this paper. The influence of structural size in altering the fracture mode from perfect brittle fracture to plastic collapse is explained through the stress distribu- tion obtained across the un-cracked ligament. The key factor affecting the stress distribution is found to be the strain softening modulus and is considered to depen- dent on structural size. Based on large number of experimental results available in the literature pertaining to the testing of plain concrete beams in either three-point or four-point bending, an empirical relationship for the determination of process zone length (L p ) has been developed. With the knowledge of L p, the maximum load P max can be obtained. It is demonstrated that the model can predict P max quite accurately. Here the objective is to experimentally verify the predicted P max . The comparison is valid within a range of errors, reasonable in the cementetious ma- terials like concrete. In this model only an inelastic fracture mechanics parameter ‘L p ’ has been used. The parameter L p has been obtained as a function of the size of the beam and also softening modulus in order to consider the effect of softening on the tensile stress-strain behavior of concrete. Further, the P max predicted by the one parameter model as obtained for mode-I failure has been experimentally verified to see how far it is valid for mixed mode type of failure. Since a very few experi- mental investigations have been so far carried out to study the fracture behavior of concrete under mixed mode condition, the present experimental program is carried out, so as to obtain a wide range of test results pertaining the mixed mode fracture of concrete. 1 Department of Civil Engineering, Indian Institute of Science, Bangalore, 560012, India.
Transcript of Fracture behavior of plain concrete beams –...
Copyright © 2010 ICCES ICCES, vol.14, no.3, pp.65-83
Fracture behavior of plain concrete beams – experimentalverification of one parameter model
B.K.Raghu Prasad1, Rabindra Kumar Saha1, A.R.Gopalakrishnan1
SummarySeveral different models have been proposed to characterize mode-I crack propa-gation in concrete. The fictitious crack model proposed by Hillerborg et al. andthe blunt crack band theory developed by Bazant & Oh are particularly well suitedfor a finite element analysis. The two-parameter fracture model proposed by Jenq& Shah is found to be applicable only for beams with s/w=4, where s=span &w=depth of the beam. The general applicability of the model for other testing con-figurations is not published. In the present study an experimental verification of aone-parameter model based on fundamental equation of equilibrium developed byAnanthan, Raghu Prasad, and Sundara Raja Iyengar to explain the mode - I frac-ture behavior of notched and un-notched plain concrete beams subjected to three orfour-point bending, also called Softening Beam Model are reported and discussedin this paper. The influence of structural size in altering the fracture mode fromperfect brittle fracture to plastic collapse is explained through the stress distribu-tion obtained across the un-cracked ligament. The key factor affecting the stressdistribution is found to be the strain softening modulus and is considered to depen-dent on structural size. Based on large number of experimental results available inthe literature pertaining to the testing of plain concrete beams in either three-pointor four-point bending, an empirical relationship for the determination of processzone length (Lp) has been developed. With the knowledge of Lp, the maximumload Pmax can be obtained. It is demonstrated that the model can predict Pmax quiteaccurately. Here the objective is to experimentally verify the predicted Pmax. Thecomparison is valid within a range of errors, reasonable in the cementetious ma-terials like concrete. In this model only an inelastic fracture mechanics parameter‘Lp’ has been used. The parameter Lp has been obtained as a function of the size ofthe beam and also softening modulus in order to consider the effect of softening onthe tensile stress-strain behavior of concrete. Further, the Pmax predicted by the oneparameter model as obtained for mode-I failure has been experimentally verifiedto see how far it is valid for mixed mode type of failure. Since a very few experi-mental investigations have been so far carried out to study the fracture behavior ofconcrete under mixed mode condition, the present experimental program is carriedout, so as to obtain a wide range of test results pertaining the mixed mode fractureof concrete.
1Department of Civil Engineering, Indian Institute of Science, Bangalore, 560012, India.
66 Copyright © 2010 ICCES ICCES, vol.14, no.3, pp.65-83
Keywords: Concrete softening; Fracture energy; Fracture Process zone; Mode-I fracture of concrete; Size effect.
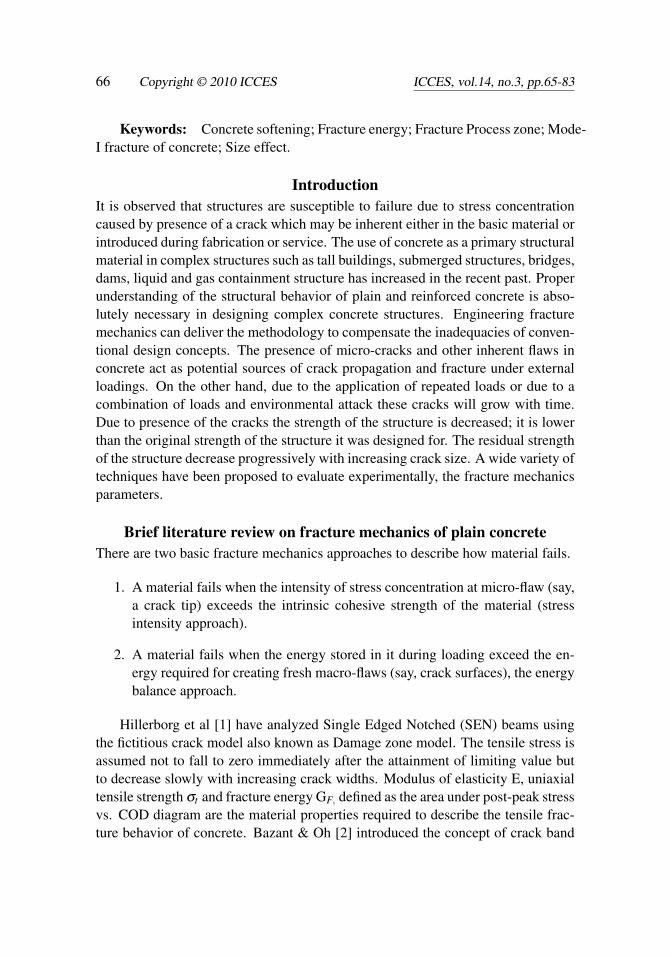
IntroductionIt is observed that structures are susceptible to failure due to stress concentrationcaused by presence of a crack which may be inherent either in the basic material orintroduced during fabrication or service. The use of concrete as a primary structuralmaterial in complex structures such as tall buildings, submerged structures, bridges,dams, liquid and gas containment structure has increased in the recent past. Properunderstanding of the structural behavior of plain and reinforced concrete is abso-lutely necessary in designing complex concrete structures. Engineering fracturemechanics can deliver the methodology to compensate the inadequacies of conven-tional design concepts. The presence of micro-cracks and other inherent flaws inconcrete act as potential sources of crack propagation and fracture under externalloadings. On the other hand, due to the application of repeated loads or due to acombination of loads and environmental attack these cracks will grow with time.Due to presence of the cracks the strength of the structure is decreased; it is lowerthan the original strength of the structure it was designed for. The residual strengthof the structure decrease progressively with increasing crack size. A wide variety oftechniques have been proposed to evaluate experimentally, the fracture mechanicsparameters.
Brief literature review on fracture mechanics of plain concreteThere are two basic fracture mechanics approaches to describe how material fails.
1. A material fails when the intensity of stress concentration at micro-flaw (say,a crack tip) exceeds the intrinsic cohesive strength of the material (stressintensity approach).
2. A material fails when the energy stored in it during loading exceed the en-ergy required for creating fresh macro-flaws (say, crack surfaces), the energybalance approach.
Hillerborg et al [1] have analyzed Single Edged Notched (SEN) beams usingthe fictitious crack model also known as Damage zone model. The tensile stress isassumed not to fall to zero immediately after the attainment of limiting value butto decrease slowly with increasing crack widths. Modulus of elasticity E, uniaxialtensile strength σt and fracture energy GF, defined as the area under post-peak stressvs. COD diagram are the material properties required to describe the tensile frac-ture behavior of concrete. Bazant & Oh [2] introduced the concept of crack band
Fracture behavior of plain concrete beams 67
theory for fracture of concrete. The fracture front is modeled as a blunt smearedcrack band. The material fracture parameters are characterized by three parame-ters GF,σt and the width of crack band WC (fracture process zone). GF is howeverdefined as the product of WC and the area under the tensile stress-strain curve.Using this model the maximum load carrying capacity of several beams are pre-dicted. GF is found to depend on the specimen size. The values of GF so obtainedare used to obtain an empirical relationship to predict GF from the knowledge ofmaterial properties. These model irrespective of the approach adopted requires acomplete stress-crack opening relation. They are particularly well suited for nu-merical techniques like the finite element method. Some models which do notrequire the finite element technique are also proposed. Wecharatana & Shah [3]based on some simple and approximate extensions of the concepts of LEFM, havepredicted the extent of the non-linear fracture process zone in concrete. CriticalCOD equal to 0.025mm and a constant closing pressure to exist along the length ofthe fracture process zone are assumed. Fracture loads of a large number of notchedbeams are reported to have been estimated with a reasonable degree of accuracy.Jenq & Shah [4] have proposed two parameter fracture model. The two param-eters are critical stress intensity factor calculated at the tip of the effective crackand critical COD. Based on their test results, the two parameters are found to besize dependent. Alberto Carpinteri [5] presented a critical review of works dealingwith concrete fracture. He concludes that heterogeneity is only a matter of scaleand notch sensitivity is necessary but not sufficient condition for the applicabilityof the linear elastic fracture mechanics. Nallathambi & Karihaloo [6] have per-formed tests on cement mortar and concrete beams in two stages, with a view tostudy the influence of several variables upon the fracture behavior of concrete. Onthe basis of the results from the first stage of test in which a single water/cementratio and type of coarse aggregate were used, a simple formula was established toestimate the fracture toughness of concrete in terms of specimen dimensions, max-imum aggregate size and notch depth together with the mix compressive strengthand modulus of elasticity (determined from separate standard cylinder test). It wasfound to predict with sufficient accuracy, the results from the second stage of testin which, besides variation of the type of coarse aggregate and water/cement ratio,some of the specimen sizes were outside the range used in the first series. Peter-son [7] determined fracture energy GIC using load-deflection curve. His test resultsindicate that GICis independent of both notch depth and beam depth. A simplenumerical method called Initial stiffness method and Modified lattice model wereproposed by Raghu Prasad et al.[8-9] to analyze fracture behavior of plain concretebeam (strain softening material) in mode-I using finite element method. A new pa-rameter namely, strain softening parameter α has been introduced. The method isvalidated by analyzing a significant number of beams tested and reported by various
68 Copyright © 2010 ICCES ICCES, vol.14, no.3, pp.65-83
researchers.
Objective & scope of present studySeveral different models have been proposed to characterize mode-I crack propaga-tion in concrete. The fictitious crack model proposed by Hillerborg et al [1] and theblunt crack band theory developed by Bazant & Oh [2] are particularly well suitedfor a finite element analysis. The two-parameter fracture model proposed by Jenq& Shah [4] is found to be applicable only for beams with s/w=4, where s=span& w=depth of the beam. In the present study an experimental verification of aone-parameter model based on fundamental equation of equilibrium developed byAnanthan et al.[10-11] to explain the mode-I fracture behavior of notched and un-notched plain concrete beams subjected to three or four-point bending also called assoftening beam model are presented. The influence of structural size in altering thefracture mode from perfect brittle fracture to plastic collapse is explained throughthe stress distribution obtained across the un-cracked ligament. The key factor af-fecting the stress distribution is found to be the strain softening modulus and isconsidered to dependent on structural size. Based on large number of experimentalresults available in the literature pertaining to the testing of plain concrete beams ineither three-point or four-point bending, an empirical relationship for the determi-nation of process zone length (Lp) has been developed [10]. With the knowledgeof Lp the maximum Pmax can be obtained. It is demonstrated that the model canpredict Pmax quite accurately.
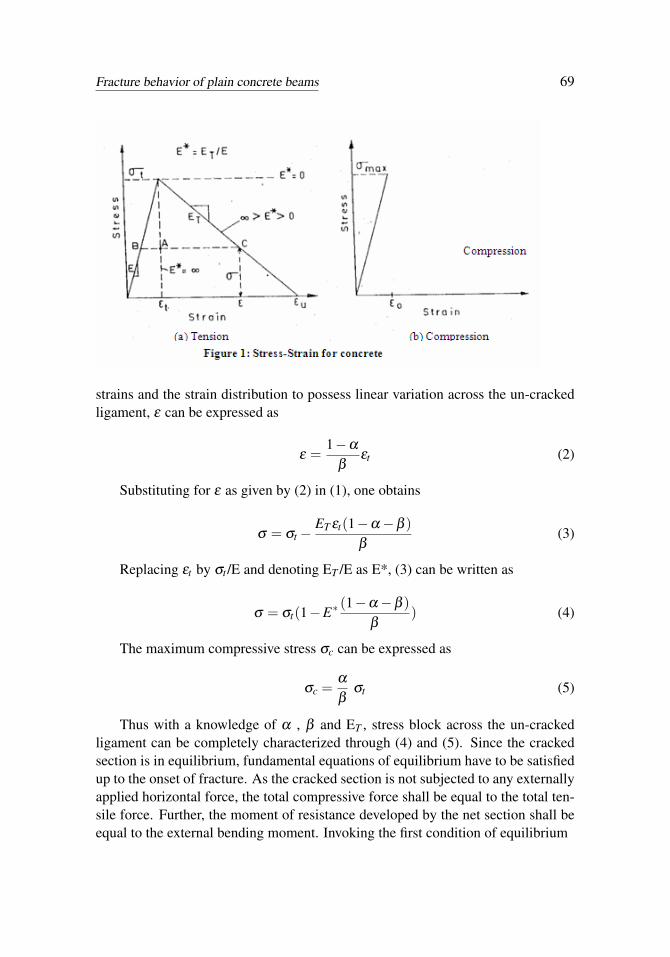
Proposed modelSince concrete is generally known to exhibit strain softening in tension, brittle frac-ture or perfect plastic collapse seem to be only idealizations. Hence by modelingconcrete according to the strain softening behavior and by varying the strain soften-ing slope between infinity to zero a transition between the two extreme idealizationscan be achieved. Since Mmax/Mn can characterize the type of fracture of a beamof given dimensions, it becomes necessary to determine the stress block across theun-cracked ligament. The stress–strain diagram for concrete in tension can be ap-proximated to be bilinear as shown in Fig. 1(a). The stress σ in the strain softeningrange can be expressed as, for details see [10]
σ = σt −ET (ε − εt) (1)
in which σt = limiting uni-axial tensile strength, ET = strain softening modulus, ε
, εt = tensile strain corresponding to σ and σt respectively. With the additional as-sumptions regarding compressive stresses to vary linearly Fig. 1(b) with increasing
Fracture behavior of plain concrete beams 69
strains and the strain distribution to possess linear variation across the un-crackedligament, ε can be expressed as
ε =1−α
βεt (2)
Substituting for ε as given by (2) in (1), one obtains
σ = σt −ET εt(1−α −β )
β(3)
Replacing εt by σt /E and denoting ET /E as E*, (3) can be written as
σ = σt(1−E∗ (1−α −β )β
) (4)
The maximum compressive stress σc can be expressed as
σc =α
βσt (5)
Thus with a knowledge of α , β and ET , stress block across the un-crackedligament can be completely characterized through (4) and (5). Since the crackedsection is in equilibrium, fundamental equations of equilibrium have to be satisfiedup to the onset of fracture. As the cracked section is not subjected to any externallyapplied horizontal force, the total compressive force shall be equal to the total ten-sile force. Further, the moment of resistance developed by the net section shall beequal to the external bending moment. Invoking the first condition of equilibrium
70 Copyright © 2010 ICCES ICCES, vol.14, no.3, pp.65-83
12
σc α Db =12
σt β Db +12(σt + σ)(1−α −β )Db (6)
is obtained.Substituting for σ and σc according to (4) and (5), (6) after simplification can
be written as
α2 (1+E∗)+2α(β +E∗
β −E∗)+ [(β 2(1+E∗)−2β (1+E∗)+E∗] = 0 (7)
The roots of the above quadratic equation are given by
α =−(β +E∗β −E∗)±
√2βE∗+2β −E∗
(1+E∗)(8)
According to moment equilibrium condition, if M is the external bending mo-ment acting on the cross-section, then moment of the tensile forces about the centreof compression can be written as
M =bD2
6[2σtβ (α +β )+σ(1−α −β )(α +3β +3)
+(σt −σ)(1−α −β )(α +2β +1)] (9)
Substituting for σ according to (4), (9) after simplification can be obtained inthe following non-dimensional form
MMn
= 3−2α +E∗ (β +2)β
(2β +2α −1)− (α +β )2(1+E∗(β +2)
β) (10)
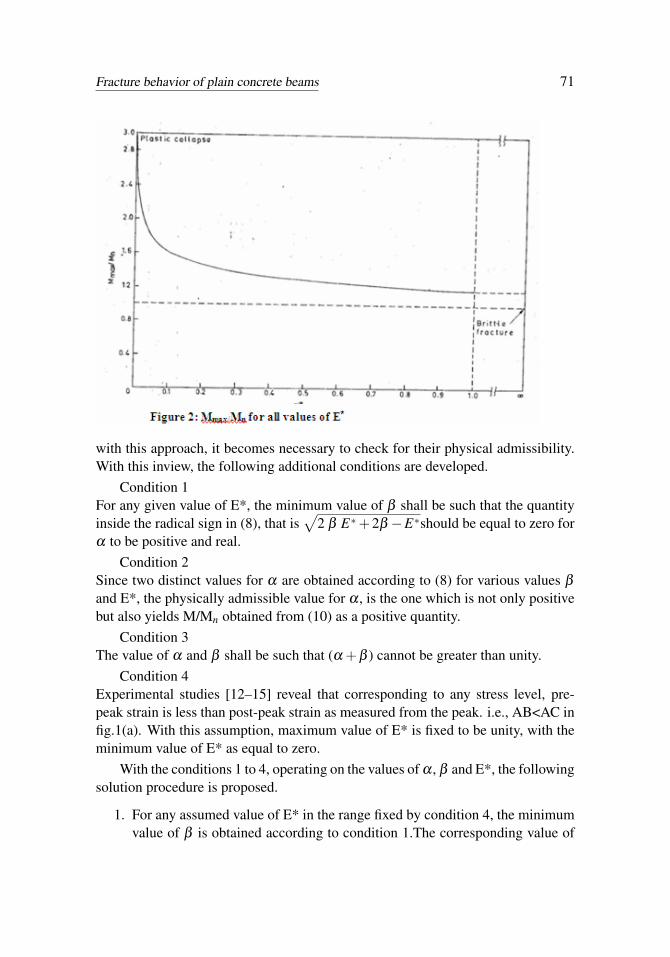
It can be easily verified from (10), that for E* = ∞, β=α= 0.5, M/Mn equal tounity is obtained. Mmax/Mn values obtained for various values of E∗ in the range0-1 is shown in Fig. 2. Likewise for E* = 0, α=β= 0, M/Mn equal to three results.
Solution procedureOnly two equations (8) and (10) are available to determine three unknown param-eters α , β and E*, required to completely characterize the stress block across theun-cracked ligament. Thus, the solution in a straight forward manner seems to beimpossible. However, by assuming values for E* and β , α can be obtained accord-ing to (8) and hence M/Mn according to (10). Since arbitrary values are obtained
Fracture behavior of plain concrete beams 71
with this approach, it becomes necessary to check for their physical admissibility.With this inview, the following additional conditions are developed.
Condition 1For any given value of E*, the minimum value of β shall be such that the quantityinside the radical sign in (8), that is
√2 β E∗+2β −E∗should be equal to zero for
α to be positive and real.Condition 2
Since two distinct values for α are obtained according to (8) for various values β
and E*, the physically admissible value for α , is the one which is not only positivebut also yields M/Mn obtained from (10) as a positive quantity.
Condition 3The value of α and β shall be such that (α +β ) cannot be greater than unity.
Condition 4Experimental studies [12–15] reveal that corresponding to any stress level, pre-peak strain is less than post-peak strain as measured from the peak. i.e., AB<AC infig.1(a). With this assumption, maximum value of E* is fixed to be unity, with theminimum value of E* as equal to zero.
With the conditions 1 to 4, operating on the values of α , β and E*, the followingsolution procedure is proposed.
1. For any assumed value of E* in the range fixed by condition 4, the minimumvalue of β is obtained according to condition 1.The corresponding value of
72 Copyright © 2010 ICCES ICCES, vol.14, no.3, pp.65-83
α is evaluated from (8).
2. This value of α is checked for its admissibility according to conditions 2 and3.
The corresponding value of M/Mn is obtained from (10).
3. The minimum value of β is then incremented by a small amount and thewhole procedure is repeated till a limiting stage according to condition 3 isreached.
Here the objective is to experimentally verify the predicted Pmax. The com-parison is valid within a range of errors, reasonable in the cementitious materialslike concrete. In this model only an inelastic fracture mechanics parameter ‘Lp’has been used. The parameter Lp has been obtained as a function of the size of thebeam and also softening modulus in order to consider the effect of softening on thetensile stress-strain behavior of concrete. Jenq and Shah has extended the conceptsof two parameter fracture model to characterize the mixed mode fracture behaviorof concrete[15]. The procedure developed by them to predict Pmax, again requiresthe use of finite element analyses.
Further, the Pmax predicted by the one parameter model as obtained for mode-Ifailure has been experimentally verified to see how far it is valid for mixed modetype of failure. Since a very few experimental investigations have been so far car-ried out to study the fracture behavior of concrete under mixed mode condition, thepresent experimental program is carried out, so as to obtain a wide range of testresults pertaining to the mixed mode fracture of concrete.
Experimental set-up and other detailsMaterials usedCement: Ordinary Portland cement conforming to Indian standard specification
(IS:269-1976) was used.
Aggregate: Sand obtained from local river beds was used as fine aggregate. Bro-ken granite stone of maximum size 20mm was used as coarse aggregate.
Water Ordinary potable water was used.
Mix AdoptedA concrete mix of 1:1.5:3 by weight with a water cement ratio of 0.45 was used.Generally this proportion of mix gives M20 grade concrete.
Fracture behavior of plain concrete beams 73
Casting and curing of specimensThe notch is made by a plastic plate of 3mm thickness with V-shape at tip. Thenotch plate is fixed to the mould with nails. Concrete was poured in three layersand vibrated. Six cubes and six cylinders were also cast along with each batch ofcasting of the beams to take the measurement of cube-crushing and tensile strengthof concrete. After 24 hours of the casting of the beam the notch making platewas carefully removed and after that mould also removed. Specimens were curedunder damped gunny bags for 28 days. Only two beams of the first set B1−4/8,B1−2/8) were tested on 14th day. The beams were dried and kept for 24 hours inthe laboratory at room temperature and humidity before testing.
Test SpecimensA total of 15 beams were cast for testing, but one beam failed due to handlingbefore testing.
The 15 beams were in three different sizes.1st set 1400mm * 300mm * 150mm2nd set 1580mm * 230mm * 115mm3rd set 1800mm * 200mm * 100mmThe spans of the beam were 1200mm, 1380mm and 1600mm for the 1st set,
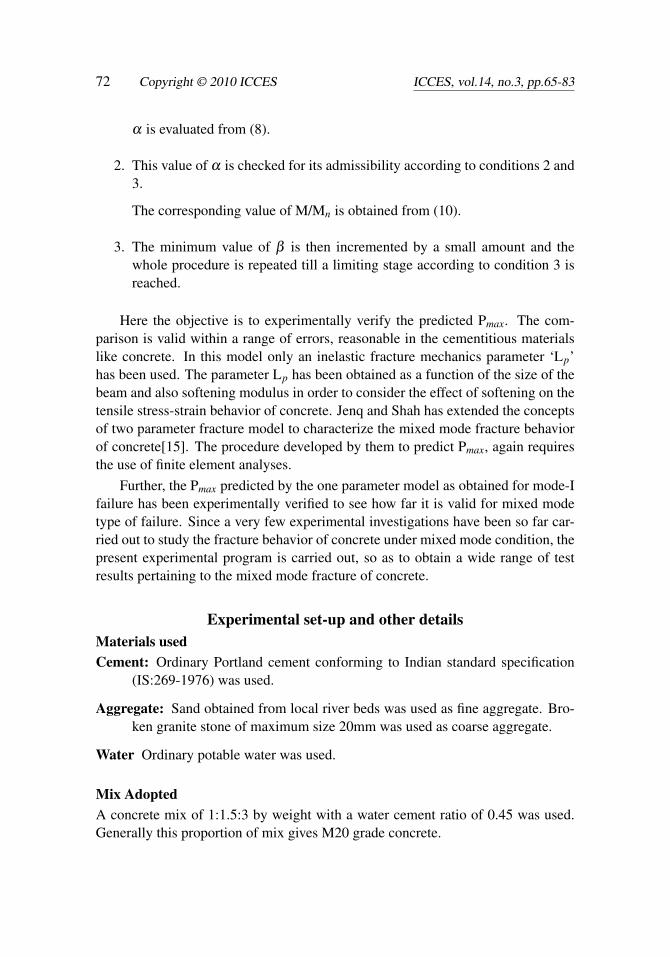
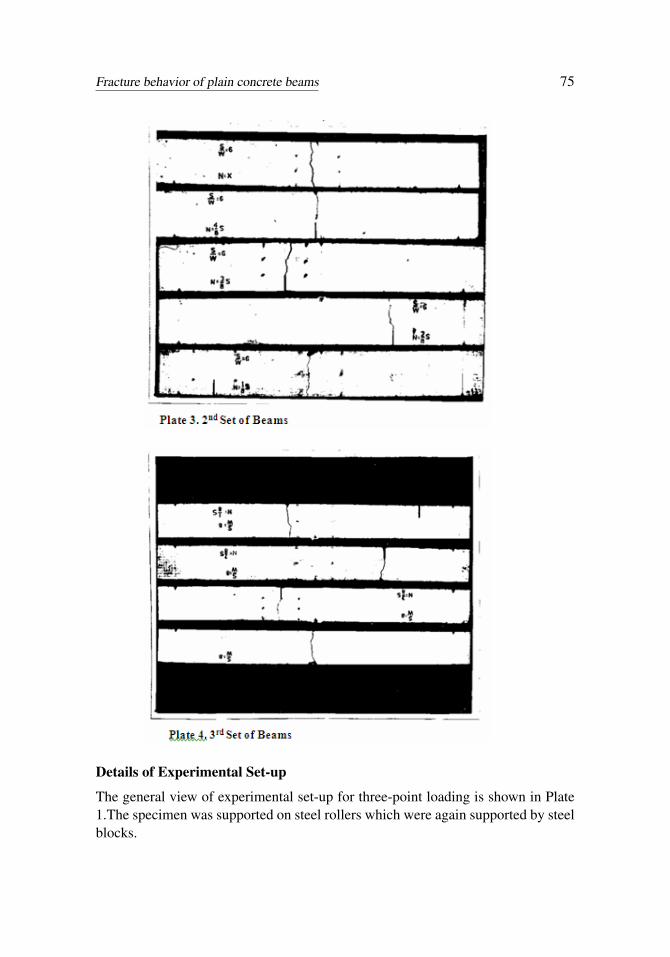
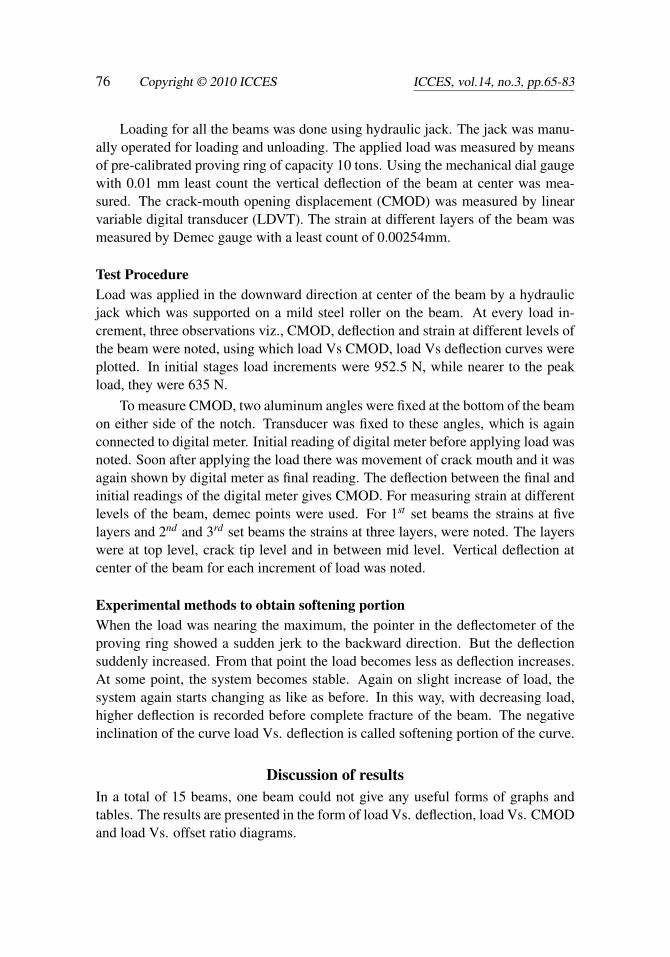
2nd set and 3rd set respectively. The experimental set up for beam testing ,Ist , 2nd ,and 3rd set of beams are shown in Plates 1-4 respectively.
In each set of the beams the notch position was varied from centre to 1/8th spanfrom support.
74 Copyright © 2010 ICCES ICCES, vol.14, no.3, pp.65-83
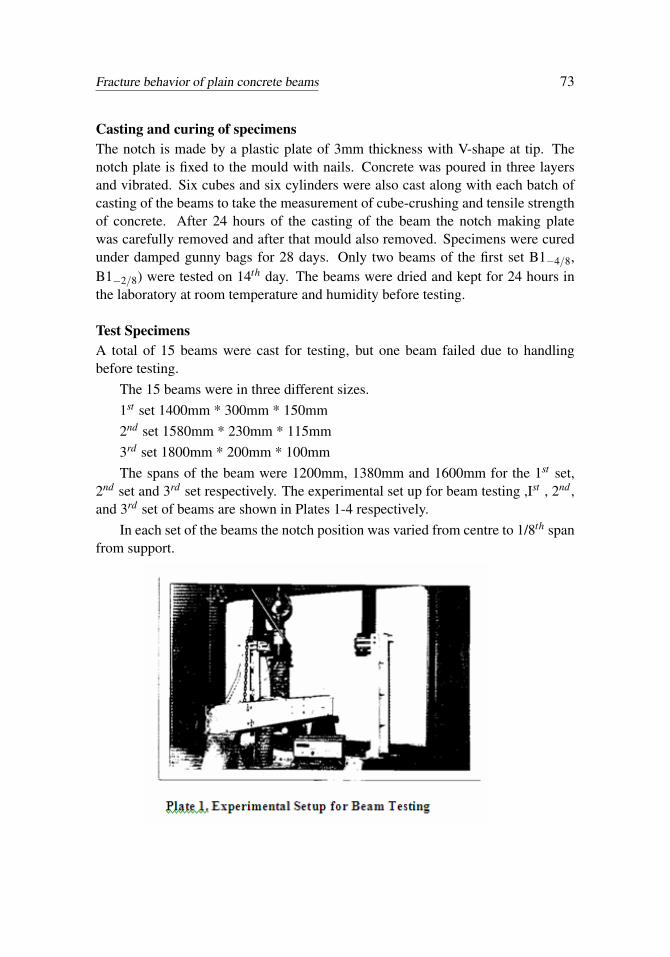
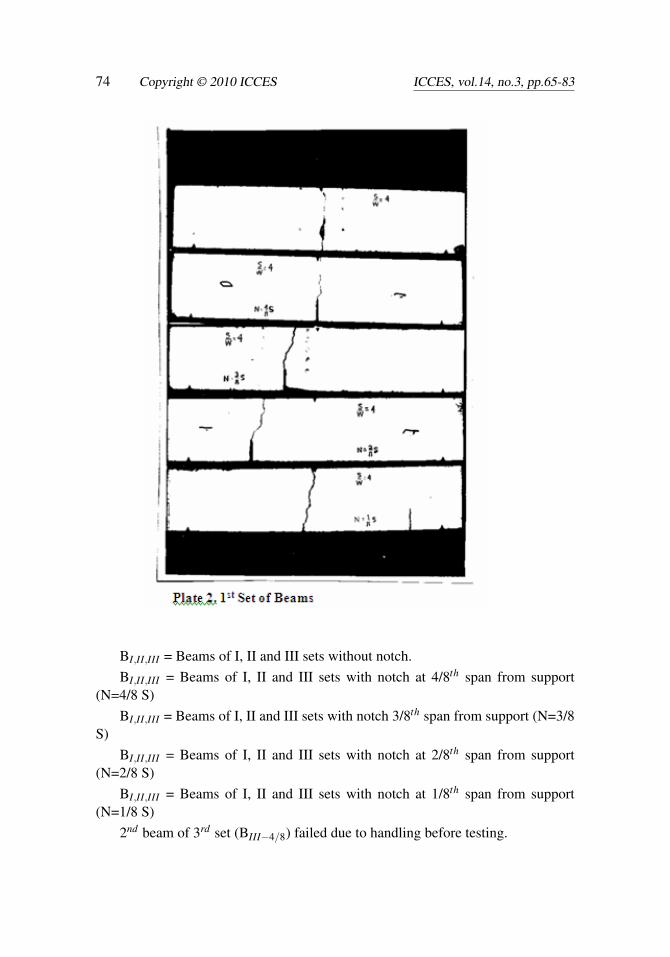
BI,II,III = Beams of I, II and III sets without notch.BI,II,III = Beams of I, II and III sets with notch at 4/8th span from support
(N=4/8 S)BI,II,III = Beams of I, II and III sets with notch 3/8th span from support (N=3/8
S)BI,II,III = Beams of I, II and III sets with notch at 2/8th span from support
(N=2/8 S)BI,II,III = Beams of I, II and III sets with notch at 1/8th span from support
(N=1/8 S)2nd beam of 3rd set (BIII−4/8) failed due to handling before testing.
Fracture behavior of plain concrete beams 75
Details of Experimental Set-up
The general view of experimental set-up for three-point loading is shown in Plate1.The specimen was supported on steel rollers which were again supported by steelblocks.
76 Copyright © 2010 ICCES ICCES, vol.14, no.3, pp.65-83
Loading for all the beams was done using hydraulic jack. The jack was manu-ally operated for loading and unloading. The applied load was measured by meansof pre-calibrated proving ring of capacity 10 tons. Using the mechanical dial gaugewith 0.01 mm least count the vertical deflection of the beam at center was mea-sured. The crack-mouth opening displacement (CMOD) was measured by linearvariable digital transducer (LDVT). The strain at different layers of the beam wasmeasured by Demec gauge with a least count of 0.00254mm.
Test ProcedureLoad was applied in the downward direction at center of the beam by a hydraulicjack which was supported on a mild steel roller on the beam. At every load in-crement, three observations viz., CMOD, deflection and strain at different levels ofthe beam were noted, using which load Vs CMOD, load Vs deflection curves wereplotted. In initial stages load increments were 952.5 N, while nearer to the peakload, they were 635 N.
To measure CMOD, two aluminum angles were fixed at the bottom of the beamon either side of the notch. Transducer was fixed to these angles, which is againconnected to digital meter. Initial reading of digital meter before applying load wasnoted. Soon after applying the load there was movement of crack mouth and it wasagain shown by digital meter as final reading. The deflection between the final andinitial readings of the digital meter gives CMOD. For measuring strain at differentlevels of the beam, demec points were used. For 1st set beams the strains at fivelayers and 2nd and 3rd set beams the strains at three layers, were noted. The layerswere at top level, crack tip level and in between mid level. Vertical deflection atcenter of the beam for each increment of load was noted.
Experimental methods to obtain softening portionWhen the load was nearing the maximum, the pointer in the deflectometer of theproving ring showed a sudden jerk to the backward direction. But the deflectionsuddenly increased. From that point the load becomes less as deflection increases.At some point, the system becomes stable. Again on slight increase of load, thesystem again starts changing as like as before. In this way, with decreasing load,higher deflection is recorded before complete fracture of the beam. The negativeinclination of the curve load Vs. deflection is called softening portion of the curve.
Discussion of resultsIn a total of 15 beams, one beam could not give any useful forms of graphs andtables. The results are presented in the form of load Vs. deflection, load Vs. CMODand load Vs. offset ratio diagrams.

Fracture behavior of plain concrete beams 77
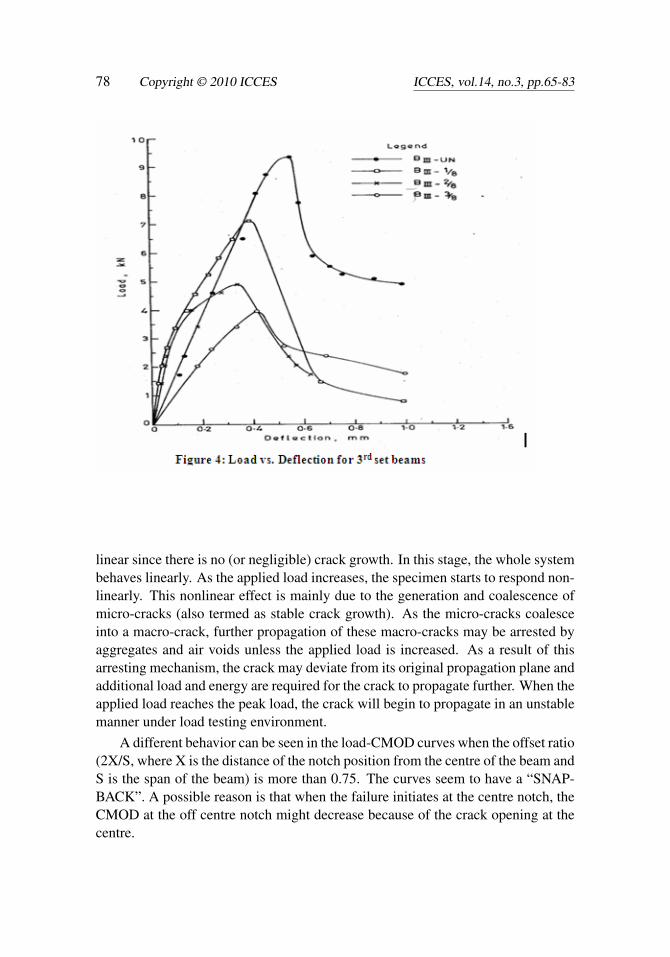
Load Vs. deflectionThe Figs. 3 and 4 show the load vs. deflection for the beams of the second set andthird set beams. As the experiment progressed, the recording of the data improvedas also beam testing was done under improved set up conditions. Therefore secondand third set results are completely reliable.
It may be observed that the curve is mostly linear in the initial stage but in thepre-peak load region, it is highly non-linear. This confirms the assumption namely,post-peak softening modulus ET is less than the peak elastic modulus, made in thederivation of expression for LP [10]. The peak loads are shown in Table 1.
It is also observed that at peak load, for the same offset ratio for the 3rd setbeams, the deflections (at centre) are more than that of the second set beams. Thisis due to the fact that the third set beams span / depth ratio is more than that ofsecond set beams.
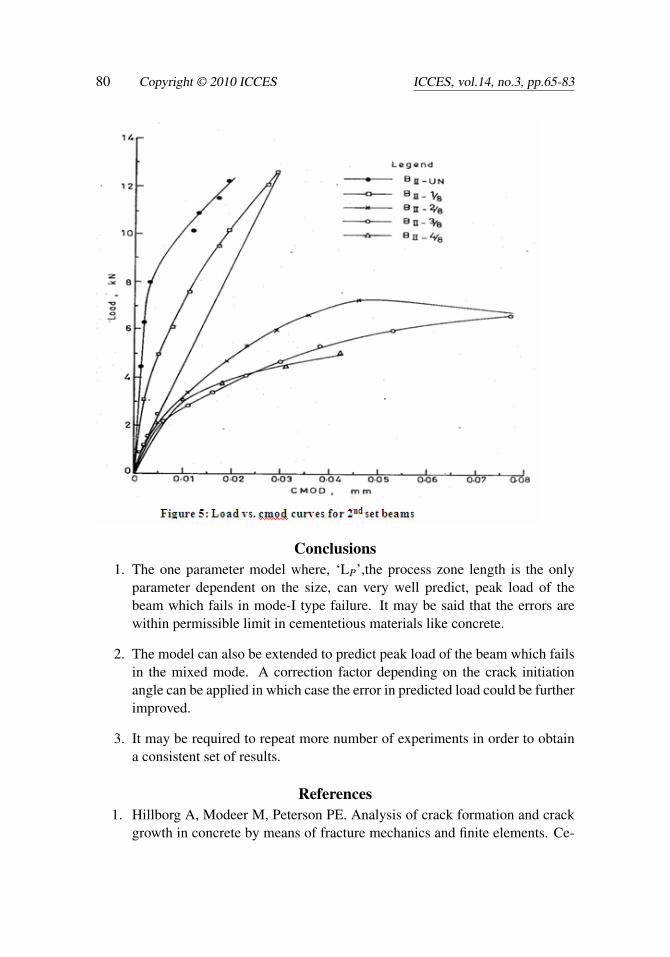
Load Vs. CMODThe Figs. 5-6, shows the load vs. CMOD for the second and third set beamsrespectively. As earlier observed by Jenq & Shah[15], the diagrams could be seento be easily classified into 3 parts, i.e., linear, stable crack growth and unstablecrack growth. It can be seen that the initial stage of the load – CMOD curve is
78 Copyright © 2010 ICCES ICCES, vol.14, no.3, pp.65-83
linear since there is no (or negligible) crack growth. In this stage, the whole systembehaves linearly. As the applied load increases, the specimen starts to respond non-linearly. This nonlinear effect is mainly due to the generation and coalescence ofmicro-cracks (also termed as stable crack growth). As the micro-cracks coalesceinto a macro-crack, further propagation of these macro-cracks may be arrested byaggregates and air voids unless the applied load is increased. As a result of thisarresting mechanism, the crack may deviate from its original propagation plane andadditional load and energy are required for the crack to propagate further. When theapplied load reaches the peak load, the crack will begin to propagate in an unstablemanner under load testing environment.
A different behavior can be seen in the load-CMOD curves when the offset ratio(2X/S, where X is the distance of the notch position from the centre of the beam andS is the span of the beam) is more than 0.75. The curves seem to have a “SNAP-BACK”. A possible reason is that when the failure initiates at the centre notch, theCMOD at the off centre notch might decrease because of the crack opening at thecentre.
Fracture behavior of plain concrete beams 79
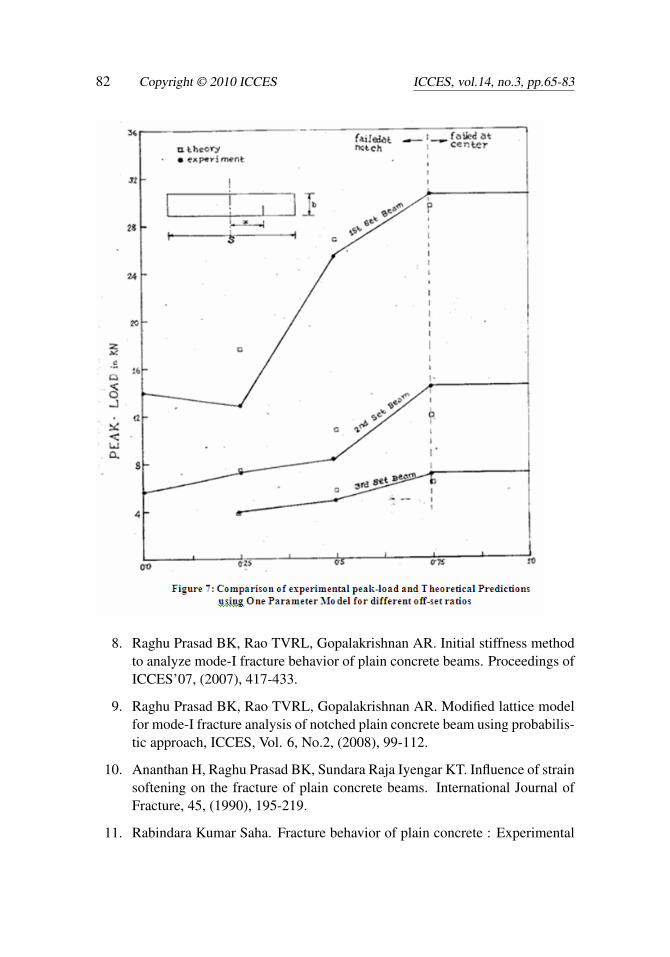
Load Vs. offset ratio curve
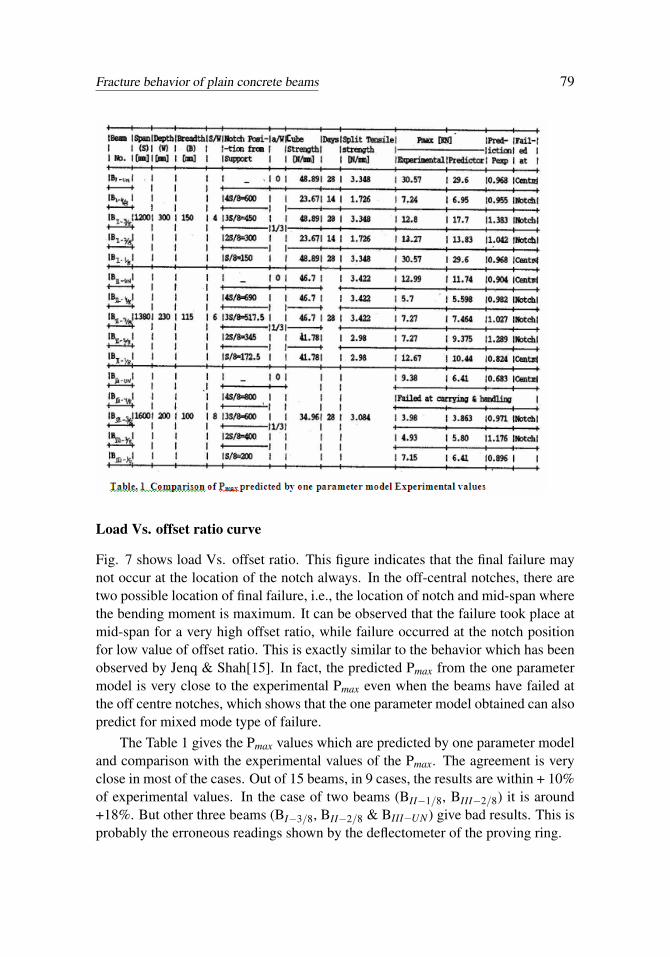
Fig. 7 shows load Vs. offset ratio. This figure indicates that the final failure maynot occur at the location of the notch always. In the off-central notches, there aretwo possible location of final failure, i.e., the location of notch and mid-span wherethe bending moment is maximum. It can be observed that the failure took place atmid-span for a very high offset ratio, while failure occurred at the notch positionfor low value of offset ratio. This is exactly similar to the behavior which has beenobserved by Jenq & Shah[15]. In fact, the predicted Pmax from the one parametermodel is very close to the experimental Pmax even when the beams have failed atthe off centre notches, which shows that the one parameter model obtained can alsopredict for mixed mode type of failure.
The Table 1 gives the Pmax values which are predicted by one parameter modeland comparison with the experimental values of the Pmax. The agreement is veryclose in most of the cases. Out of 15 beams, in 9 cases, the results are within + 10%of experimental values. In the case of two beams (BII−1/8, BIII−2/8) it is around+18%. But other three beams (BI−3/8, BII−2/8 & BIII−UN) give bad results. This isprobably the erroneous readings shown by the deflectometer of the proving ring.
80 Copyright © 2010 ICCES ICCES, vol.14, no.3, pp.65-83
Conclusions1. The one parameter model where, ‘LP’,the process zone length is the only
parameter dependent on the size, can very well predict, peak load of thebeam which fails in mode-I type failure. It may be said that the errors arewithin permissible limit in cementetious materials like concrete.
2. The model can also be extended to predict peak load of the beam which failsin the mixed mode. A correction factor depending on the crack initiationangle can be applied in which case the error in predicted load could be furtherimproved.
3. It may be required to repeat more number of experiments in order to obtaina consistent set of results.
References1. Hillborg A, Modeer M, Peterson PE. Analysis of crack formation and crack
growth in concrete by means of fracture mechanics and finite elements. Ce-

Fracture behavior of plain concrete beams 81
ment and Concrete Research, Vol.6, (1976), 773-782.
2. Bazant ZP, Oh BH. Crack band theory for fracture of concrete. Materials andStructure, RILEM, Paris, Vo.16, (1983), 155-17.
3. Wecharatana M, Shah SP. Prediction of nonlinear fracture process zone inconcrete, Journal of the Engineering Mehanics, ASCE, Vol.104, (1983) 1231-124.
4. Jenq YS., Shah SP. Two Parameter Fracture Model of Concrete, Journal ofEngineering Mechanics, ASCE, Vol.111, No.10, (1985), 1227-1241.
5. Alberto Carpinteri, Application of fracture mechanics to concrete structure,Journal of the Structural Division, Proceedings of the ASCE, Vol.108, No.ST4,April (1982).
6. Nallathambi P, Karihaloo BL, Heaton BS, Effect of specimen and crack size,Water / Cement ratio and coarse aggregate texture upon fracture toughnessof concrete, Magazine of Concrete research, 36, December (1984), 227-236.
7. Peterson PE, Fracture energy of concrete – Method of determination, Cementand Concrete Research, (1980), 79-89.
82 Copyright © 2010 ICCES ICCES, vol.14, no.3, pp.65-83
8. Raghu Prasad BK, Rao TVRL, Gopalakrishnan AR. Initial stiffness methodto analyze mode-I fracture behavior of plain concrete beams. Proceedings ofICCES’07, (2007), 417-433.
9. Raghu Prasad BK, Rao TVRL, Gopalakrishnan AR. Modified lattice modelfor mode-I fracture analysis of notched plain concrete beam using probabilis-tic approach, ICCES, Vol. 6, No.2, (2008), 99-112.
10. Ananthan H, Raghu Prasad BK, Sundara Raja Iyengar KT. Influence of strainsoftening on the fracture of plain concrete beams. International Journal ofFracture, 45, (1990), 195-219.
11. Rabindara Kumar Saha. Fracture behavior of plain concrete : Experimental
Fracture behavior of plain concrete beams 83
verification of one parameter model. A dissertation submitted in partial ful-filment of the requirements for the Degree of Master of Engineering in CivilEngineering, Department of Civil Engineering, Indian Institute of Science,Bangalore, India. (1989).
12. Nallathambi P, Karihallo BL. Determination of specimen size independentfracture toughness of plain concrete, Magazine of concrete research, June(1986), 67-76.
13. Barr BIG, Hasso EBP, Sabir BB. The effect of test specimen size on the frac-ture toughness of concrete, Cement and Concrete Research, Vol.15, (1985),83-84.
14. Swartz SI, Hu KK, Fartush M,C. Hung CMJ. Stress intensity factor for plainconcrete in bending pre-notched versus pre-cracked beams, Experimentalmechanics, 22 (1982), 417.
15. Jenq YS, Shah SP, Mixed mode fracture of concrete, International Jl. ofFracture, Vol. 38, (1988), 123-142.