Fourth Quarter 2019 Earnings - Seeking Alpha
43
Fourth Quarter 2019 Earnings (Unaudited Results) February 13, 2020
Transcript of Fourth Quarter 2019 Earnings - Seeking Alpha

Fourth Quarter 2019 Earnings(Unaudited Results)February 13, 2020

©2020 Mattel, Inc. All Rights Reserved. 2
This presentation contains a number of forward-looking statements within the meaning of the Private Securities Litigation Reform Act of 1995. The use of words such as “anticipates,” “expects,” “intends,” “plans,”
“confident that” and “believes,” among others, generally identify forward-looking statements. These forward-looking statements are based on currently available operating, financial, economic and other
information, and are subject to a number of significant risks and uncertainties. A variety of factors, many of which are beyond our control, could cause actual future results to differ materially from those projected in
the forward-looking statements. Specific factors that might cause such a difference include, but are not limited to: (i) Mattel’s ability to design, develop, produce, manufacture, source and ship products on a timely
and cost-effective basis, as well as interest in and purchase of those products by retail customers and consumers in quantities and at prices that will be sufficient to profitably recover Mattel’s costs; (ii) downturns
in economic conditions affecting Mattel’s markets which can negatively impact retail customers and consumers, and which can result in lower employment levels, lower consumer disposable income and
spending, including lower spending on purchases of Mattel’s products; (iii) other factors which can lower discretionary consumer spending, such as higher costs for fuel and food, drops in the value of homes or
other consumer assets, and high levels of consumer debt; (iv) potential difficulties or delays Mattel may experience in implementing cost savings and efficiency enhancing initiatives; (v) other economic and public
health conditions or regulatory changes in the markets in which Mattel and its customers and suppliers operate, which could create delays or increase Mattel’s costs, such as higher commodity prices, labor costs
or transportation costs, or outbreaks of disease; (vi) currency fluctuations, including movements in foreign exchange rates, which can lower Mattel’s net revenues and earnings, and significantly impact Mattel’s
costs; (vii) the concentration of Mattel’s customers, potentially increasing the negative impact to Mattel of difficulties experienced by any of Mattel’s customers, such as the bankruptcy and liquidation of Toys “R”
Us, Inc., or changes in their purchasing or selling patterns; (viii) the future willingness of licensors of entertainment properties for which Mattel currently has licenses or would seek to have licenses in the future to
license those products to Mattel; (ix) the inventory policies of Mattel’s retail customers, including retailers’ potential decisions to lower their inventories, even if it results in lost sales, as well as the concentration of
Mattel’s revenues in the second half of the year, which coupled with reliance by retailers on quick response inventory management techniques increases the risk of underproduction of popular items,
overproduction of less popular items and failure to achieve compressed shipping schedules; (x) the increased costs of developing more sophisticated digital and smart technology products, and the corresponding
supply chain and design challenges associated with such products; (xi) work disruptions, which may impact Mattel’s ability to manufacture or deliver product in a timely and cost-effective manner; (xii) the
bankruptcy and liquidation of Mattel’s significant retailers, such as Toys “R” Us, Inc. or the general lack of success of one of Mattel’s significant retailers which could negatively impact Mattel’s revenues or bad
debt exposure; (xiii) the impact of competition on revenues, margins and other aspects of Mattel’s business, including the ability to offer products which consumers choose to buy instead of competitive products,
the ability to secure, maintain and renew popular licenses and the ability to attract and retain talented employees; (xiv) the risk of product recalls or product liability suits and costs associated with product safety
regulations; (xv) changes in laws or regulations in the United States and/or in other major markets, such as China, in which Mattel operates, including, without limitation, with respect to taxes, tariffs, trade policies
or product safety, which may increase Mattel’s product costs and other costs of doing business, and reduce Mattel’s earnings; (xvi) failure to realize the planned benefits from any investments or acquisitions made
by Mattel; (xvii) the impact of other market conditions, third party actions or approvals and competition which could reduce demand for Mattel’s products or delay or increase the cost of implementation of Mattel’s
programs or alter Mattel’s actions and reduce actual results; (xviii) changes in financing markets or the inability of Mattel to obtain financing on attractive terms; (xix) the impact of litigation, arbitration, or regulatory
decisions or settlement actions; (xx) uncertainty from the expected discontinuance of LIBOR and transition to any other interest rate benchmark; (xxi) an inability to remediate the material weakness in our internal
control over financial reporting or additional material weaknesses or other deficiencies in the future or the failure to maintain an effective system of internal controls; and (xxii) other risks and uncertainties as may
be described in Mattel’s periodic filings with the Securities and Exchange Commission, including the “Risk Factors” section of Mattel’s Amended Annual Report on Form 10-K/A for the fiscal year ended December
31, 2018, as well as in Mattel’s other public statements. Mattel does not update forward-looking statements and expressly disclaims any obligation to do so, except as required by law.
To supplement our financial results presented in accordance with generally accepted accounting principles in the United States (“GAAP”), Mattel presents certain non-GAAP financial measures within the meaning
of Regulation G promulgated by the Securities and Exchange Commission. The non-GAAP financial measures that Mattel uses in our earnings release and earnings slide presentation include Gross Sales,
Adjusted Gross Profit, Adjusted Gross Margin, Adjusted Other Selling and Administrative Expenses, Adjusted Operating Income (Loss), Adjusted Earnings (Loss) Per Share, earnings before interest expense,
taxes, depreciation and amortization (“EBITDA”), Adjusted EBITDA, Free Cash Flow, and constant currency. Mattel uses these metrics to analyze its continuing operations and to monitor, assess and identify
meaningful trends in its operating and financial performance, and each is discussed in detail below. Mattel believes that the disclosure of non-GAAP financial measures provides useful supplemental information to
investors to be able to better evaluate ongoing business performance and certain components of the Company’s results. These measures are not, and should not be viewed as, substitutes for GAAP financial
measures and may not be comparable to similarly-titled measures used by other companies. Reconciliations of the non-GAAP financial measures to the most directly comparable GAAP financial measures are
attached to our earnings release as exhibits and to our earnings slide presentation as an appendix.
The earnings release and earnings slide presentation are available on Mattel's Investor Relations website, https://mattel.gcs-web.com/, under the subheading “Financial Information – Earnings Releases.”
Forward-Looking Statements / Regulation G

©2020 Mattel, Inc. All Rights Reserved. 3
Strategy to Grow Shareholder Value
Transforming Mattel into an IP-driven, high-performing toy company
Our mission is to create innovative products and experiences
that inspire, entertain and develop children through play

©2020 Mattel, Inc. All Rights Reserved. 4
Mattel Brands
One of the strongest portfolios of children’s and family entertainment franchises in the world

©2020 Mattel, Inc. All Rights Reserved. 5
Full year gross sales flat as reported, up 2% in constant currency
FY 2019 Key Takeaways (1 of 2)
• Company exceeded its full year 2019 guidance, making consistent progress in its
transformation into an IP-driven, high-performing toy company.
• Net Sales of $4,505 million, flat as reported, including the negative foreign
exchange impact of $75 million, and up 1% in constant currency, versus prior year.
• Gross Sales of $5,065 million, flat as reported, including the negative foreign
exchange impact of $92 million, and up 2% in constant currency.
• Structural Simplification run-rate savings of $875 million exiting 2019, exceeding
target of $650 million by $225 million, or 35%.
Please see the Appendix for a Glossary of Non-GAAP Financial Measures and Non-GAAP Reconciliations.

©2020 Mattel, Inc. All Rights Reserved. 6
Operating Cash Flow and Free Cash Flow positive for first time since 2016
FY 2019 Key Takeaways (2 of 2)
• Reported Gross Margin of 44.0%, an improvement of 420 basis points; Adjusted
Gross Margin of 44.9%, an improvement of 480 basis points.
• Reported Operating Income of $39 million, an improvement of $274 million;
Adjusted Operating Income of $156 million, an improvement of $269 million.
• Cash Flows Provided by Operating Activities of $181 million, an improvement of
$208 million, achieving positive operating cash flow for the first time in three years.
• Free Cash Flow of $65 million, an improvement of $244 million, achieving positive
Free Cash Flow for the first time in three years.
• Mattel was the #1 U.S. and global toy company in 2019, per NPD.
Please see the Appendix for a Glossary of Non-GAAP Financial Measures and Non-GAAP Reconciliations.

©2020 Mattel, Inc. All Rights Reserved. 7
180 basis point improvement in Reported Gross Margin
Q4 2019 Key Takeaways
• Net Sales of $1,474 million, down 3% as reported, including the negative foreign
exchange impact of $9 million, and down 3% in constant currency, versus the prior
year’s fourth quarter.
• Gross Sales of $1,665 million, down 3% as reported, including the negative foreign
exchange impact of $12 million, and down 2% in constant currency.
• Reported Gross Margin of 48.4%, an improvement of 180 basis points; Adjusted
Gross Margin of 48.9%, an improvement of 230 basis points.
• Reported Operating Income of $68 million, a decline of $38 million; Adjusted
Operating Income of $109 million, a decline of $2 million.
Please see the Appendix for a Glossary of Non-GAAP Financial Measures and Non-GAAP Reconciliations.

©2020 Mattel, Inc. All Rights Reserved. 8
2018A2019 Guidance
As of Feb-192019A
Gross Sales $5,076MFlat
in constant currency
+2%
in constant currency
Adjusted Gross Margin % 40.1% Low 40’s 44.9%
Advertising
(as a % of net sales)11.6%
Increase
vs. Prior Year12.2%
Structural Simplification
Run-Rate Savings$521M $650M+ $875M
Adjusted SG&A $1,399MDecrease
vs. Prior Year$1,313M
Adjusted EBITDA $200M $350M to $400M $453M
Adjusted Operating Income
/ (Loss)($113M)
Slightly
Positive$156M
2019 Full Year Guidance Recap
Please see the Appendix for a Glossary of Non-GAAP Financial Measures and Non-GAAP Reconciliations.
Exceeded guidance for key metrics

©2020 Mattel, Inc. All Rights Reserved. 9
52%
26%
14%
8%
ByRegion(2)
North America w/ American
Girl
EMEA
LatinAmerica
Asia Pacific
38%
23%
21%
18%
ByCategories(1)
Dolls
Vehicles
Infant, Toddler
and Preschool
Action Figures, Building Sets and Games
Q4 2019 Worldwide Gross Sales Mix
Highly-diversified sales mix across categories and regions
1) Mattel modified its reporting structure for revenues in the first quarter of 2019 to disclose revenues by categories
2) Mattel reorganized its regional sales reporting structure in the first quarter of 2019. As a result, the new International regions are Europe, the Middle East, and Africa ("EMEA"), Latin America, and Asia Pacific. The Middle East, Africa, Russia, and Turkey were previously included in the Asia Pacific region (previously Global Emerging Markets) and are now included in EMEA (previously Europe). Prior period amounts have been reclassified to conform to the current period presentation.
Amounts may not foot due to rounding.
Please see the Appendix for a Glossary of Non-GAAP Financial Measures and Non-GAAP Reconciliations.
©2020 Mattel, Inc. All Rights Reserved. 10
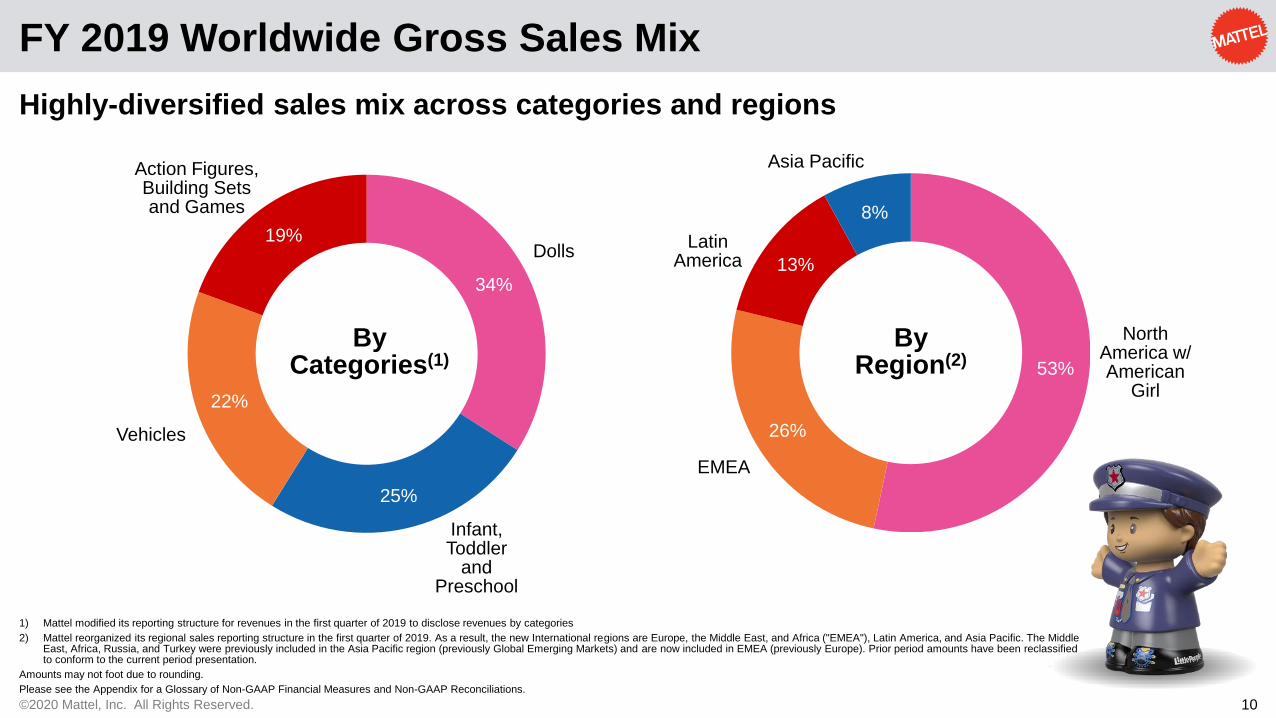
53%
26%
13%
8%
ByRegion(2)
North America w/ American
Girl
EMEA
LatinAmerica
Asia Pacific
34%
25%
22%
19%
ByCategories(1)
Dolls
Vehicles
Infant, Toddler
and Preschool
Action Figures, Building Sets and Games
FY 2019 Worldwide Gross Sales Mix
Highly-diversified sales mix across categories and regions
1) Mattel modified its reporting structure for revenues in the first quarter of 2019 to disclose revenues by categories
2) Mattel reorganized its regional sales reporting structure in the first quarter of 2019. As a result, the new International regions are Europe, the Middle East, and Africa ("EMEA"), Latin America, and Asia Pacific. The Middle East, Africa, Russia, and Turkey were previously included in the Asia Pacific region (previously Global Emerging Markets) and are now included in EMEA (previously Europe). Prior period amounts have been reclassified to conform to the current period presentation.
Amounts may not foot due to rounding.
Please see the Appendix for a Glossary of Non-GAAP Financial Measures and Non-GAAP Reconciliations.

©2020 Mattel, Inc. All Rights Reserved. 11
630
381
357
297
Worldwide Gross Sales(as reported; $ in millions)
Dolls
Vehicles
Infant, Toddler
and Preschool
Action Figures,
Building Sets
and Games
Q4 2019 Worldwide Gross Sales by Categories
Down 3% as reported, down 2% in constant currency, driven by Dolls and Infant, Toddler and Preschool
Total
YOY Growth Rate (%)
As Reported
-6% -5%
-9% -9%
+1% +1%
+9% +10%
Constant Currency
-3% -2%
Amounts may not foot due to rounding.
Please see the Appendix for a Glossary of Non-GAAP Financial Measures and Non-GAAP Reconciliations.

©2020 Mattel, Inc. All Rights Reserved. 12
1,724
1,258
1,101
982
Worldwide Gross Sales(as reported; $ in millions)
Dolls
Vehicles
Infant, Toddler
and Preschool
Action Figures,
Building Sets
and Games
FY 2019 Worldwide Gross Sales by Categories
Flat as reported, up 2% in constant currency, driven by Action Figures, Building Sets and Games, and Vehicles
Total
YOY Growth Rate (%)
As Reported
0% +2%
-11% -10%
+3% +6%
+14% +15%
Constant Currency
0% +2%
Amounts may not foot due to rounding.
Please see the Appendix for a Glossary of Non-GAAP Financial Measures and Non-GAAP Reconciliations.

©2020 Mattel, Inc. All Rights Reserved. 13
Q4 2019 North America & American Girl Gross Sales by Categories
North America sales down 1% as reported, down 1% in constant currency, driven by Dolls, and Infant, Toddler and Preschool
YOY Growth Rate (%)North America(1) Gross Sales
(as reported; $ in millions)
North America(1):
-8%
-8%
+8%
+9%
As Reported
-1%
-19%
-8%
-8%
+8%
+9%
Constant Currency
-1%
-19%American Girl:
212
205
167
152
Dolls
Vehicles
Infant, Toddler
and Preschool
Action Figures,
Building Sets
and Games
$735
American Girl Gross Sales (as reported; $ in millions)
134Dolls
(1) North America segment excludes American Girl sales
Amounts may not foot due to rounding.
Please see the Appendix for a Glossary of Non-GAAP Financial Measures and Non-GAAP Reconciliations.

©2020 Mattel, Inc. All Rights Reserved. 14
FY 2019 North America & American Girl Gross Sales by Categories
North America sales flat as reported, up 1% in constant currency, driven by Action Figures, Building Sets and Games, Vehicles, and Dolls
(1) North America segment excludes American Girl sales
Amounts may not foot due to rounding.
Please see the Appendix for a Glossary of Non-GAAP Financial Measures and Non-GAAP Reconciliations.
North America(1) Gross Sales(as reported; $ in millions)
636
730
511
555
Dolls
Vehicles
Infant, Toddler
and Preschool
Action Figures,
Building Sets
and Games
$2,432
American Girl Gross Sales (as reported; $ in millions)
269Dolls
North America(1):
+2%
-10%
+5%
+11%
As Reported
0%
-21%
+2%
-10%
+5%
+11%
Constant Currency
+1%
-21%American Girl:
YOY Growth Rate (%)

©2020 Mattel, Inc. All Rights Reserved. 15
Q4 2019 International Gross Sales by Categories
Down 1% as reported, flat in constant currency, driven by Action Figures, Building Sets and Games, and Dolls
Amounts may not foot due to rounding.
Please see the Appendix for a Glossary of Non-GAAP Financial Measures and Non-GAAP Reconciliations.
284
176
190
146
International Gross Sales(as reported; $ in millions)
Dolls
Vehicles
Infant, Toddler
and Preschool
Action Figures,
Building Sets
and Games
Total
YOY Growth Rate (%)
As Reported
+4% +6%
-11% -10%
-5% -4%
+10% +11%
Constant Currency
-1% 0%
©2020 Mattel, Inc. All Rights Reserved. 16
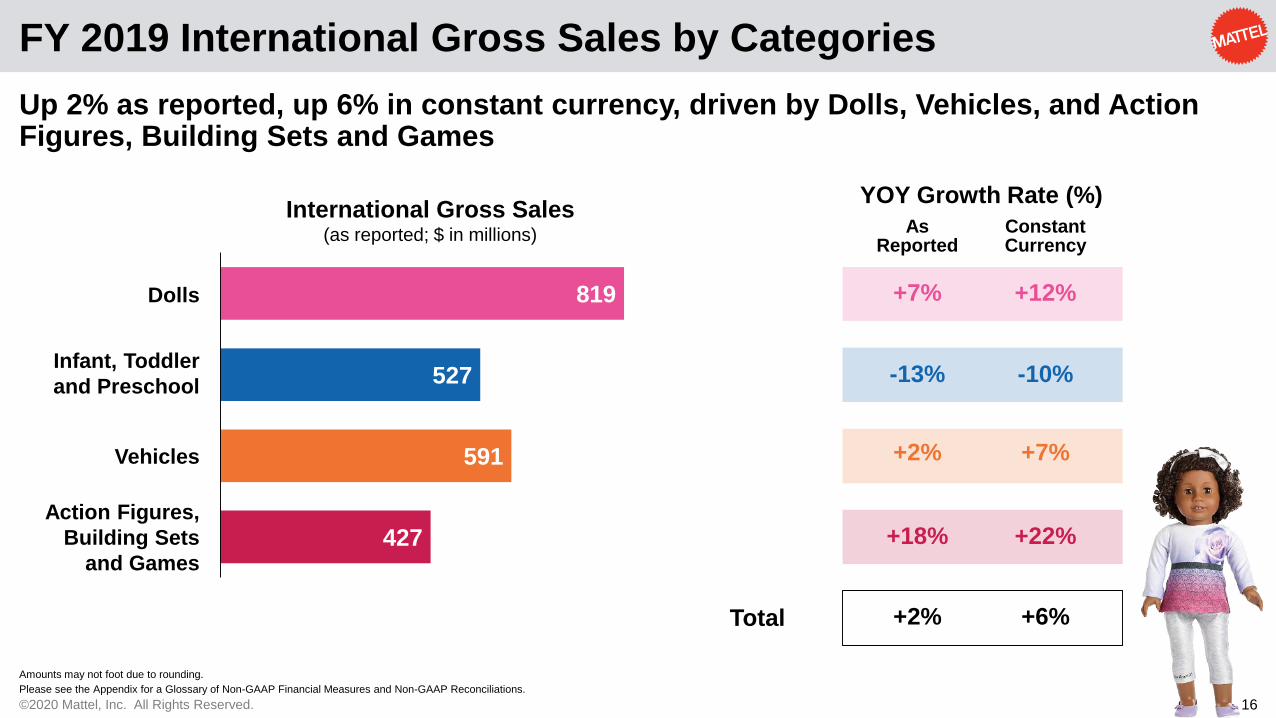
FY 2019 International Gross Sales by Categories
Up 2% as reported, up 6% in constant currency, driven by Dolls, Vehicles, and Action Figures, Building Sets and Games
Amounts may not foot due to rounding.
Please see the Appendix for a Glossary of Non-GAAP Financial Measures and Non-GAAP Reconciliations.
819
527
591
427
International Gross Sales(as reported; $ in millions)
Dolls
Vehicles
Infant, Toddler
and Preschool
Action Figures,
Building Sets
and Games
Total
YOY Growth Rate (%)
As Reported
+7% +12%
-13% -10%
+2% +7%
+18% +22%
Constant Currency
+2% +6%

©2020 Mattel, Inc. All Rights Reserved. 17
Q4 2019 International Gross Sales by Region
Down 1% as reported, flat in constant currency, with continued strength in EMEA
434
236
127
EMEA
Latin America
Asia Pacific(1)
International Gross Sales (as reported; $ in millions)
(1) Mattel reorganized its regional sales reporting structure in the first quarter of 2019. As a result, the new International regions are Europe, the Middle East, and Africa ("EMEA"), Latin America, and Asia Pacific. The Middle East, Africa, Russia, and Turkey were previously included in the Asia Pacific region (previously Global Emerging Markets) and are now included in EMEA (previously Europe). Prior period amounts have been reclassified to conform to the current period presentation.
Amounts may not foot due to rounding.
Please see the Appendix for a Glossary of Non-GAAP Financial Measures and Non-GAAP Reconciliations.
Total
0%
-3%
-2%
-1%
As Reported
+2%
-1%
-1%
0%
Constant Currency
YOY Growth Rate (%)
(1)

©2020 Mattel, Inc. All Rights Reserved. 18
FY 2019 International Gross Sales by Region
Solid momentum across EMEA and Latin America
1,293
666
405
EMEA
Latin America
Asia Pacific(1)
International Gross Sales (as reported; $ in millions)
(1) Mattel reorganized its regional sales reporting structure in the first quarter of 2019. As a result, the new International regions are Europe, the Middle East, and Africa ("EMEA"), Latin America, and Asia Pacific. The Middle East, Africa, Russia, and Turkey were previously included in the Asia Pacific region (previously Global Emerging Markets) and are now included in EMEA (previously Europe). Prior period amounts have been reclassified to conform to the current period presentation.
Amounts may not foot due to rounding.
Please see the Appendix for a Glossary of Non-GAAP Financial Measures and Non-GAAP Reconciliations.
(1)
Total
+3%
+2%
0%
+2%
As Reported
+8%
+5%
+3%
+6%
Constant Currency
YOY Growth Rate (%)

©2020 Mattel, Inc. All Rights Reserved. 19
Q4 2019 Top 3 Power Brand Gross Sales
Strong growth in Hot Wheels and Barbie; progress in Fisher-Price and Thomas & Friends
(1) Break out of the Top 3 Power Brand Gross Sales for the North America and International segments can be found in the Appendix for non-GAAP reconciliations.
Amounts may not foot due to rounding.
Please see the Appendix for a Glossary of Non-GAAP Financial Measures and Non-GAAP Reconciliations.
+2%
+7%
-3%
As Reported
+3%
+8%
-3%
Constant Currency
YOY Growth Rate (%)
397
307
341
-
Worldwide Gross Sales(1)
(as reported; $ in millions)
+
©2020 Mattel, Inc. All Rights Reserved. 20
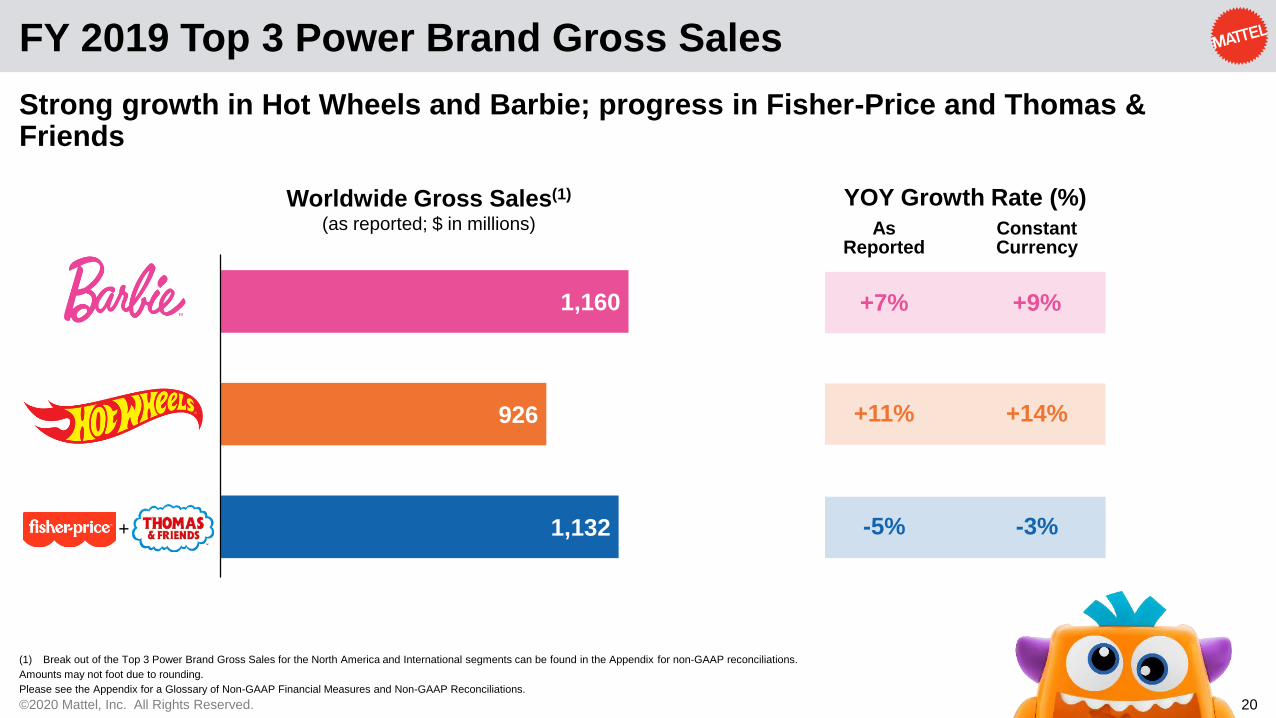
1,160
926
1,132
-
Worldwide Gross Sales(1)
(as reported; $ in millions)
FY 2019 Top 3 Power Brand Gross Sales
Strong growth in Hot Wheels and Barbie; progress in Fisher-Price and Thomas & Friends
(1) Break out of the Top 3 Power Brand Gross Sales for the North America and International segments can be found in the Appendix for non-GAAP reconciliations.
Amounts may not foot due to rounding.
Please see the Appendix for a Glossary of Non-GAAP Financial Measures and Non-GAAP Reconciliations.
+7%
+11%
-5%
As Reported
+9%
+14%
-3%
Constant Currency
YOY Growth Rate (%)
+

©2020 Mattel, Inc. All Rights Reserved. 21
Q4 2019
Q4 2018 QTD as Reported 46.6%
Non-GAAP Adjustments(1)
Q4 2018 QTD Adjusted 46.6%
Structural Simplification
2018 Toys “R” Us Revenue Reversal
Inflation
Currency
Product Recall
Mix
Obsolescence
Q4 2019 QTD Adjusted 48.9%
Non-GAAP Adjustments*
Q4 2019 QTD as Reported 48.4%
2019 Gross Margin
Significant improvement in profitability driven by Structural Simplification cost savings
(1) Please refer to Exhibit 99.1 of the Company's Form 8-K, dated February 13, 2019 (Exhibit VII). Mattel is no longer adjusting Toys "R" Us-related items as part of non-GAAP adjustments.
Impacts to Gross Margin are not shown in order of magnitude.
Please see the Appendix for a Glossary of Non-GAAP Financial Measures and Non-GAAP Reconciliations.
FY 2019 Gross Margin improved 420 bps and Adjusted Gross Margin improved 480 bps
FY 2019
FY 2018 as Reported 39.8%
Non-GAAP Adjustments(1)
FY 2018 Adjusted 40.1%
Structural Simplification
2018 Toys “R” Us Revenue Reversal
Inflation
Currency
Product Recall
Mix
Obsolescence
FY 2019 Adjusted 44.9%
Non-GAAP Adjustments*
FY 2019 as Reported 44.0%

©2020 Mattel, Inc. All Rights Reserved. 22
FY 2019 SG&A down $119M and Adjusted SG&A down $86M
2019 SG&A
Structural Simplification driving improved FY performance
(1) Please refer to Exhibit 99.1 of the Company's Form 8-K, dated February 13, 2019 (Exhibit VII). Mattel is no longer adjusting Toys "R" Us-related items as part of non-GAAP adjustments.
Impacts to SG&A are not shown in order of magnitude.
Please see the Appendix for a Glossary of Non-GAAP Financial Measures and Non-GAAP Reconciliations.
($ in millions)
Q4 2019
Q4 2018 QTD as Reported $398
Severance & Restructuring(1)
Other Non-GAAP Adjustments(1)
Q4 2018 QTD Adjusted $392
Structural Simplification
2018 Toys “R” Us Bad Debt Expense, Net
Employee-Related Costs
Strategic Investments
Q4 2019 QTD Adjusted $384
Severance & Restructuring*
Other Non-GAAP Adjustments*
Q4 2019 QTD as Reported $418
FY 2019
FY 2018 as Reported $1,509
Severance & Restructuring(1)
Other Non-GAAP Adjustments(1)
FY 2018 Adjusted $1,399
Structural Simplification
2018 Toys “R” Us Bad Debt Expense, Net
Employee-Related Costs
Strategic Investments
FY 2019 Adjusted $1,313
Severance & Restructuring*
Other Non-GAAP Adjustments*
FY 2019 as Reported $1,390

©2020 Mattel, Inc. All Rights Reserved. 23
Operating Cash Flow and Free Cash Flow positive for first time since 2016
FY 2019 Balance Sheet & Cash Flow Highlights
Dec 31, 2018 Dec 31, 2019 Comments
Cash $595M $630M Positive cash improvement
Accounts Receivable $970M $936MDecrease driven by lower Q4 sales and lower
past dues
Inventory $543M $496MDecrease driven by tighter inventory
management and lower product cost
Depreciation & Amortization $272M $245MDecrease driven by lower PP&E and tooling
depreciation
Cash Flows Provided by
(Used for) Operating Activities($27M) $181M
Improvement driven by structural simplification
savings
Capital Expenditures $152M $116MDecrease vs. prior year driven by reduction of
tooling expense
Free Cash Flow ($180M) $65M First positive FCF since 2016
Operating Cash Flow improved by $208M; Capital Expenditures down 24%
Please see the Appendix for a Glossary of Non-GAAP Financial Measures and Non-GAAP Reconciliations.

©2020 Mattel, Inc. All Rights Reserved. 24
Structural Simplification: Run-Rate and Realized Savings
(1) Run Rate includes savings from both P&L and capital expenditures.
(2) Only severance and restructuring expenses related to Structural Simplification are included.
Please see the Appendix for a Glossary of Non-GAAP Financial Measures.
Achieved $875M of run-rate savings exiting 2019; realized $366M in 2019 P&L
Offsetting factors may include strategic investments, non-cash items and product cost inflation, and macro-factors such as
foreign exchange, tariffs, and economic environment.
Cost of Goods Sold 325 259 491 177 219 94
A&P 32 30 54 30 24 0
SG&A 293 232 330 165 123 42
Total Savings(1)
650 521 875 372 366 137
Adjusted EBITDA Impact 797 372 333 92
Severance and Restructuring (2)
(131) (110) (22)
Full Year
2020
Full Year
2019($ in millions)
Exiting
2019
Full Year
2018
Exiting
2018
Exiting
2019
Exiting Run-Rate Savings Realized Savings
TargetAchieved Run-Rate
Achieved Savings Outlookas of Dec 31

©2020 Mattel, Inc. All Rights Reserved. 25
2019 Strategic Investments
• Grow brands in additional categories
• Continue to grow IP outside of toy, including digital games
$88M of strategic investments in 2019, with 73% impacting Operating Expenditures
Gross Profit
Advertising
SG&A
• Increase digital engagement and POS through online content, including
animated series, influencer programs and product related videos
• Improve efficiency: IT transformation initiatives focused on digital design and
development, and non-consumer facing systems
~50%
~45%
Two-year program investments of
$151 million dollars out of a target of $170 million dollars
~5%
FY 2019

26
2020 Guidance

©2020 Mattel, Inc. All Rights Reserved. 27
2020 Guidance Highlights
Excludes impact of the Coronavirus situation.
Source: Mattel Internal Analysis.
Please see the Appendix for a Glossary of Non-GAAP Financial Measures.
• Gross Sales to grow 1% to 2.5%, as reported
• Growth in owned brands partially offset by declines in licensed brands
• Margins to expand as we continue to reshape our operations and benefit from our
Structural Simplification and Capital Light programs
• Adjusted EBITDA to grow to an expected range of $575 to $600 million dollars
• Operating and free cash flow to continue to grow along with our cash balance
• Ongoing cash generation will improve our financial position, including
strengthening the balance sheet, improving leverage ratios, and giving us
additional financial flexibility
Continued progress towards transforming Mattel
into an IP-driven, high-performing toy company

©2020 Mattel, Inc. All Rights Reserved. 28
2020 Gross Sales Drivers
1% to 2.5% sales increase driven primarily by mid-single digit growth in owned brands
(Constant currency)
2020 assumptions
Comments
Dolls Continued growth• Driven primarily by Barbie and expansion of our doll portfolio
• Partially offset by American Girl
Vehicles Continued growth• Hot Wheels and Matchbox driving growth
• Partially offset by continued decline in licensed vehicles
Infant, Toddler and
PreschoolDown slightly
• Fisher-Price Core growth partially offset by a smaller decline in Thomas
• Fisher-Price Friends expected to decline as we exit underperforming licenses
Action Figures,
Building Sets and
Games
Down slightly
• Action Figures decline due to Toy Story 4 and DC licenses, partially offset by
growth from Minions and Minecraft
• Building Sets and Games to grow
• Launch of plush with licenses for Minions, Disney/Pixar and Star Wars
Excludes impact of the Coronavirus situation.
Source: Mattel Internal Analysis.
Please see the Appendix for a Glossary of Non-GAAP Financial Measures.

©2020 Mattel, Inc. All Rights Reserved. 29
2020 P&L Outlook (1 of 2)
Expect Adjusted Operating Income to continue to improve
FY 2019AFY 2020E Approx.
Comments
Gross Sales $5,065M Up 1% to 2.5% • Refer to slide 28
Sales Adjustments $560M Flat • In-line with prior year on a percentage basis
Adj Gross Margin
(as a % of net sales)44.9% +150-200 bps
• Continue to benefit from Structural Simplification and Capital
Light programs, as well as a reduction of royalty expenses
Advertising
(as a % of net sales)12.2% Flat • Within our normalized range of 11% to 13%, as a % of net sales
Adjusted SG&A $1,313MLower Y/Y by
$30M to $50M
• Driven by Structural Simplification savings and lower planned
incentive compensation
• Partially offset by annual merit and benefit increases, along with
general inflation
Adjusted Operating
Income$156M
Significant Y/Y
improvement• Revenue growth, margin expansion, and lower SG&A expenses
Excludes impact of the Coronavirus situation.
Source: Q4 2019 Earnings Release and Mattel Internal Analysis.
Please see the Appendix for a Glossary of Non-GAAP Financial Measures.

©2020 Mattel, Inc. All Rights Reserved. 30
2020 P&L Outlook (2 of 2)
Expect Adjusted EBITDA to continue to improve
FY 2019AFY 2020E Approx.
Comments
Interest Expense $201M Flat Y/Y • Includes the impact of the 2019 debt refinancing
Tax Expenses $55M $75M-$100M• Reflects better operational performance and assumes no
discrete tax items compared to 2019
Depreciation &
Amortization$245M Down Y/Y
• Driven by Structural Simplification and Capital Light efforts to
date
Adjusted EBITDA $453M $575M-$600M• A significant increase over 2019, and indicative of our
commitment to restore profitability and regain topline growth
Source: Q4 2019 Earnings Release and Mattel Internal Analysis.
Please see the Appendix for a Glossary of Non-GAAP Financial Measures.

©2020 Mattel, Inc. All Rights Reserved. 31
2020 Cash Flow Outlook
Expect Cash Flows to continue to improve
Source: Q4 2019 Earnings Release and Mattel Internal Analysis.
Please see the Appendix for a Glossary of Non-GAAP Financial Measures.
FY 2019AFY 2020E Approx.
Comments
Cash Flow
Provided by
Operating Activities
$181M Grow Y/Y• Continued improvement, ongoing cash generation will
provide additional financial flexibility
Capital
Expenditures$116M $125M-$150M • Continued investment in the business
Free Cash Flow $65M Grow Y/Y • Project a second consecutive year of positive free cash flow

32
Appendix

©2020 Mattel, Inc. All Rights Reserved. 33
Consolidated Statements of Operations
MATTEL, INC. AND SUBSIDIARIES EXHIBIT I
CONSOLIDATED STATEMENTS OF OPERATIONS (Unaudited)1
Yr / Yr Yr / Yr Yr / Yr Yr / Yr
% Change % Change % Change % Change
(In millions, except per share and 2019 2018 as in Constant 2019 2018 as in Constant
percentage information) $ Amt % Net Sales $ Amt % Net Sales Reported Currency $ Amt % Net Sales $ Amt % Net Sales Reported Currency
Net Sales $ 1,473.7 $ 1,524.3 -3% -3% $ 4,504.6 $ 4,514.8 0% 1%
Cost of sales 760.5 51.6% 814.7 53.4% -7% 2,523.8 56.0% 2,716.1 60.2% -7%
Gross Profit 713.2 48.4% 709.6 46.6% 1% 1% 1,980.8 1,798.7 39.8% 10% 12%
Advertising and promotion expenses 227.2 15.4% 205.8 13.5% 10% 551.5 12.2% 524.3 11.6% 5%
Other selling and administrative expenses 418.4 28.4% 398.2 26.1% 5% 1,390.0 30.9% 1,508.7 33.4% -8%
Operating Income (Loss) 67.6 4.6% 105.6 6.9% -36% -33% 39.2 0.9% (234.3) -5.2% n/m n/m
Interest expense 60.2 4.1% 49.2 3.2% 22% 201.0 4.5% 181.9 4.0% 11%
Interest (income) (1.5) -0.1% (0.8) -0.1% 85% (6.2) -0.1% (6.5) -0.1% -5%
Other non-operating (income) expense, net (0.2) 3.0 2.6 7.3
Income (Loss) Before Income Taxes 9.2 0.6% 54.3 3.6% -83% -81% (158.3) -3.5% (417.1) -9.2% -62% -65%
Provision for income taxes 9.0 44.7 55.2 116.2
Net Income (Loss) $ 0.2 0.0% $ 9.6 0.6% -98% $ (213.5) -4.7% $ (533.3) -11.8% -60%
Net Income (Loss) Per Common Share - Basic $ 0.00 $ 0.03 $ (0.62) $ (1.55)
Weighted average number of common shares 346.7 345.7 346.1 345.0
Net Income (Loss) Per Common Share - Diluted $ 0.00 $ 0.03 $ (0.62) $ (1.55)
Weighted average number of common
and potential common shares 348.3 345.8 346.1 345.0
1 Amounts may not foot due to rounding.
n/m - Not Meaningful
For the Three Months Ended December 31, For the Year Ended December 31,
©2020 Mattel, Inc. All Rights Reserved. 34
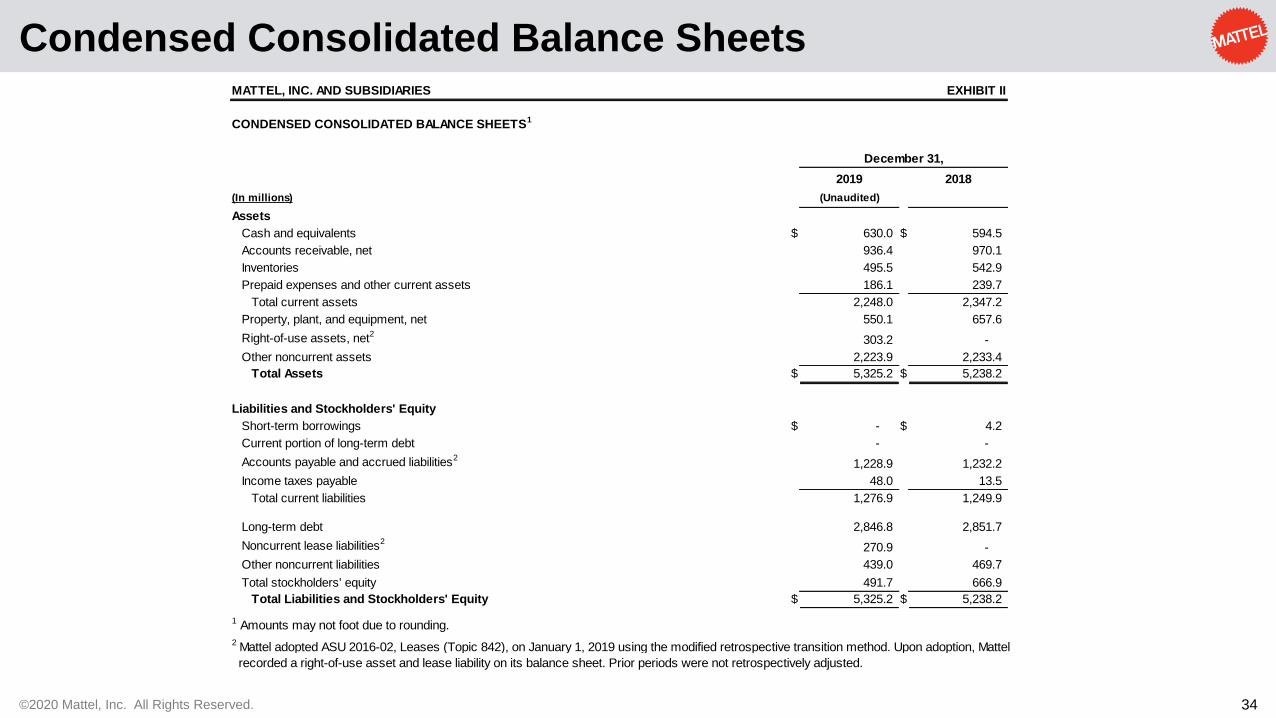
Condensed Consolidated Balance Sheets
1 Amounts may not foot due to rounding.
2 Mattel adopted ASU 2016-02, Leases (Topic 842), on January 1, 2019 using the modified retrospective transition method. Upon adoption, Mattel
recorded a right-of-use asset and lease liability on its balance sheet. Prior periods were not retrospectively adjusted.
MATTEL, INC. AND SUBSIDIARIES EXHIBIT II
CONDENSED CONSOLIDATED BALANCE SHEETS1
2019 2018
(In millions) (Unaudited)
Assets
Cash and equivalents $ 630.0 $ 594.5
Accounts receivable, net 936.4 970.1
Inventories 495.5 542.9
Prepaid expenses and other current assets 186.1 239.7
Total current assets 2,248.0 2,347.2
Property, plant, and equipment, net 550.1 657.6
Right-of-use assets, net2 303.2 -
Other noncurrent assets 2,223.9 2,233.4
Total Assets $ 5,325.2 $ 5,238.2
Liabilities and Stockholders' Equity
Short-term borrowings $ - $ 4.2
Current portion of long-term debt - -
Accounts payable and accrued liabilities21,228.9 1,232.2
Income taxes payable 48.0 13.5
Total current liabilities 1,276.9 1,249.9
Long-term debt 2,846.8 2,851.7
Noncurrent lease liabilities2270.9 -
Other noncurrent liabilities 439.0 469.7
Total stockholders' equity 491.7 666.9
Total Liabilities and Stockholders' Equity $ 5,325.2 $ 5,238.2
December 31,

©2020 Mattel, Inc. All Rights Reserved. 35
Supplemental Balance Sheet and Cash Flow DataMATTEL, INC. AND SUBSIDIARIES EXHIBIT II
SUPPLEMENTAL BALANCE SHEET AND CASH FLOW DATA (Unaudited)1
2019 2018
Key Balance Sheet Data:
Accounts receivable, net days of sales outstanding (DSO) 57 57
(In millions) 2019 2018
Condensed Cash Flow Data:
Cash flows provided by (used for) operating activities 181$ (27)$
Cash flows used for investing activities (114) (161)
Cash flows used for financing activities and other (31) (297)
Increase (decrease) in cash and equivalents 36$ (485)$
1 Amounts may not foot due to rounding.
December 31,
For the Year Ended December 31,
©2020 Mattel, Inc. All Rights Reserved. 36
Reconciliation of Non-GAAP Financial Measures
MATTEL, INC. AND SUBSIDIARIES EXHIBIT III
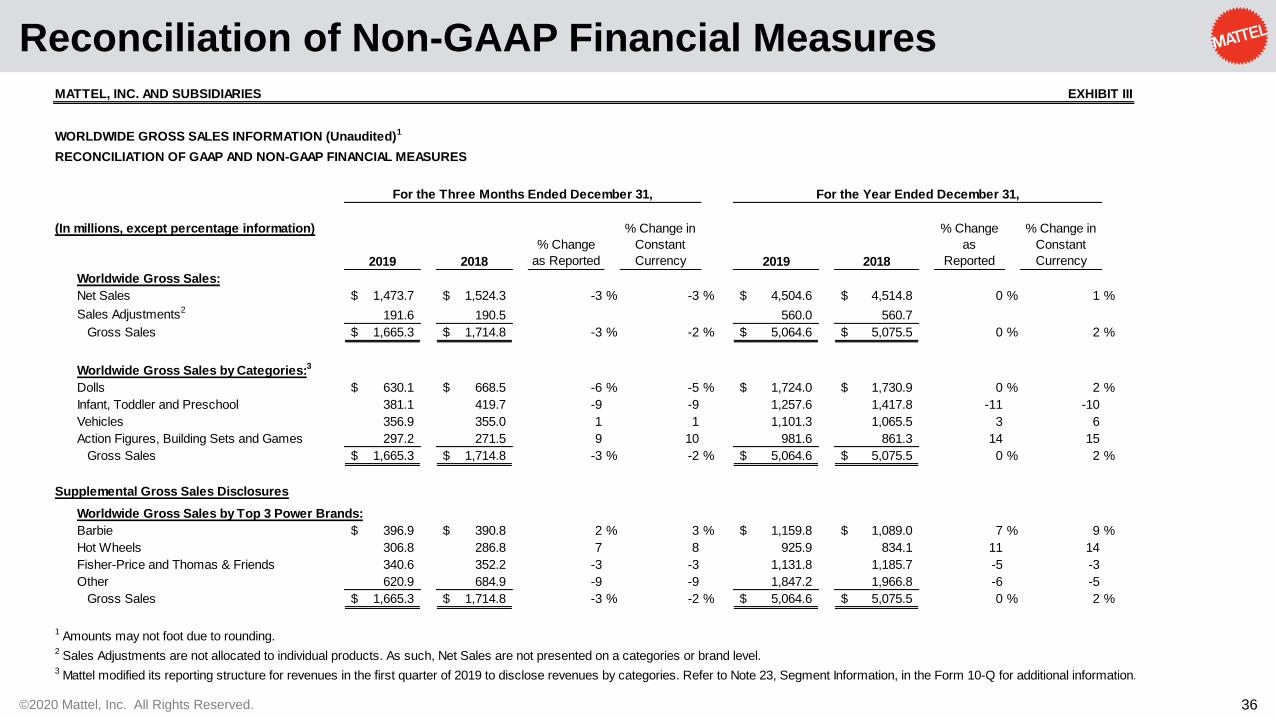
WORLDWIDE GROSS SALES INFORMATION (Unaudited)1
RECONCILIATION OF GAAP AND NON-GAAP FINANCIAL MEASURES
(In millions, except percentage information)
2019 2018
% Change
as Reported
% Change in
Constant
Currency 2019 2018
% Change
as
Reported
% Change in
Constant
Currency
Worldwide Gross Sales:
Net Sales 1,473.7$ 1,524.3$ -3 % -3 % 4,504.6$ 4,514.8$ 0 % 1 %
Sales Adjustments2191.6 190.5 560.0 560.7
Gross Sales 1,665.3$ 1,714.8$ -3 % -2 % 5,064.6$ 5,075.5$ 0 % 2 %
Worldwide Gross Sales by Categories:3
Dolls 630.1$ 668.5$ -6 % -5 % 1,724.0$ 1,730.9$ 0 % 2 %
Infant, Toddler and Preschool 381.1 419.7 -9 -9 1,257.6 1,417.8 -11 -10
Vehicles 356.9 355.0 1 1 1,101.3 1,065.5 3 6
Action Figures, Building Sets and Games 297.2 271.5 9 10 981.6 861.3 14 15
Gross Sales 1,665.3$ 1,714.8$ -3 % -2 % 5,064.6$ 5,075.5$ 0 % 2 %
Supplemental Gross Sales Disclosures
Worldwide Gross Sales by Top 3 Power Brands:
Barbie 396.9$ 390.8$ 2 % 3 % 1,159.8$ 1,089.0$ 7 % 9 %
Hot Wheels 306.8 286.8 7 8 925.9 834.1 11 14
Fisher-Price and Thomas & Friends 340.6 352.2 -3 -3 1,131.8 1,185.7 -5 -3
Other 620.9 684.9 -9 -9 1,847.2 1,966.8 -6 -5
Gross Sales 1,665.3$ 1,714.8$ -3 % -2 % 5,064.6$ 5,075.5$ 0 % 2 %
1 Amounts may not foot due to rounding. 2 Sales Adjustments are not allocated to individual products. As such, Net Sales are not presented on a categories or brand level.3 Mattel modified its reporting structure for revenues in the first quarter of 2019 to disclose revenues by categories. Refer to Note 23, Segment Information, in the Form 10-Q for additional information.
For the Three Months Ended December 31, For the Year Ended December 31,

©2020 Mattel, Inc. All Rights Reserved. 37
Reconciliation of Non-GAAP Financial MeasuresMATTEL, INC. AND SUBSIDIARIES EXHIBIT IV
GROSS SALES BY SEGMENT (Unaudited)1
RECONCILIATION OF GAAP AND NON-GAAP FINANCIAL MEASURES
(In millions, except percentage information)
2019 2018
% Change
as Reported
% Change in
Constant
Currency 2019 2018
% Change
as
Reported
% Change in
Constant
Currency
North America Segment Gross Sales:
Net Sales 689.6$ 708.3$ -3 % -3 % 2,275.8$ 2,272.8$ 0 % 0 %
Sales Adjustments245.5 36.2 156.5 149.3
Gross Sales 735.1$ 744.5$ -1 % -1 % 2,432.3$ 2,422.1$ 0 % 1 %
North America Gross Sales by Categories:3
Dolls 211.9$ 229.7$ -8 % -8 % 636.2$ 624.7$ 2 % 2 %
Infant, Toddler and Preschool 205.1 222.0 -8 -8 730.3 808.2 -10 -10
Vehicles 166.5 154.0 8 8 510.8 488.6 5 5
Action Figures, Building Sets and Games 151.6 138.8 9 9 555.0 500.6 11 11
Gross Sales 735.1$ 744.5$ -1 % -1 % 2,432.3$ 2,422.1$ 0 % 1 %
Supplemental Gross Sales Disclosures
North America Gross Sales by Top 3 Power Brands:
Barbie 189.4$ 197.3$ -4 % -4 % 558.3$ 535.7$ 4 % 4 %
Hot Wheels 142.6 125.2 14 14 419.0 380.2 10 10
Fisher-Price and Thomas & Friends 178.7 182.4 -2 -2 650.7 665.9 -2 -2
Other 224.5 239.7 -6 -6 804.2 840.3 -4 -4
Gross Sales 735.1$ 744.5$ -1 % -1 % 2,432.3$ 2,422.1$ 0 % 1 %
1 Amounts may not foot due to rounding. 2 Sales Adjustments are not allocated to individual products. As such, Net Sales are not presented on a categories or brand level.3 Mattel modified its reporting structure for revenues in the first quarter of 2019 to disclose revenues by categories. Refer to Note 23, Segment Information, in the Form 10-Q for additional information.
For the Three Months Ended December 31, For the Year Ended December 31,

©2020 Mattel, Inc. All Rights Reserved. 38
Reconciliation of Non-GAAP Financial MeasuresMATTEL, INC. AND SUBSIDIARIES EXHIBIT V
GROSS SALES BY SEGMENT (Unaudited)1
RECONCILIATION OF GAAP AND NON-GAAP FINANCIAL MEASURES
(In millions, except percentage information)
2019 2018
% Change
as Reported
% Change in
Constant
Currency 2019 2018
% Change
as Reported
% Change in
Constant
Currency
Total International Segment Gross Sales:
Net Sales 657.2$ 658.1$ 0 % 1 % 1,972.2$ 1,915.2$ 3 % 7 %
Sales Adjustments2139.2 146.8 391.6 397.1
Gross Sales 796.4$ 805.0$ -1 % 0 % 2,363.8$ 2,312.2$ 2 % 6 %
International Segment Gross Sales:
EMEA3
Net Sales 353.1$ 346.4$ 2 % 4 % 1,056.4$ 1,018.7$ 4 % 9 %
Sales Adjustments280.7 86.8 236.6 233.7
Gross Sales 433.8$ 433.3$ 0 % 2 % 1,292.9$ 1,252.4$ 3 % 8 %
Latin America
Net Sales 197.5$ 206.7$ -4 % -3 % 565.4$ 554.1$ 2 % 5 %
Sales Adjustments238.5 35.5 100.7 99.9
Gross Sales 236.0$ 242.2$ -3 % -1 % 666.1$ 654.0$ 2 % 5 %
Asia Pacific3
Net Sales 106.6$ 105.0$ 2 % 3 % 350.4$ 342.4$ 2 % 5 %
Sales Adjustments220.0 24.5 54.4 63.5
Gross Sales 126.6$ 129.5$ -2 % -1 % 404.7$ 405.8$ 0 % 3 %
International Gross Sales by Categories:4
Dolls 284.4$ 273.7$ 4 % 6 % 819.4$ 765.6$ 7 % 12 %
Infant, Toddler and Preschool 176.0 197.8 -11 -10 527.3 609.6 -13 -10
Vehicles 190.4 201.0 -5 -4 590.5 576.9 2 7
Action Figures, Building Sets and Games 145.6 132.5 10 11 426.5 360.2 18 22
Gross Sales 796.4$ 805.0$ -1 % 0 % 2,363.8$ 2,312.2$ 2 % 6 %
Supplemental Gross Sales Disclosures
International Gross Sales by Top 3 Power Brands:
Barbie 207.6$ 193.6$ 7 % 10 % 601.4$ 553.2$ 9 % 14 %
Hot Wheels 164.3 161.6 2 3 506.9 453.9 12 17
Fisher-Price and Thomas & Friends 162.0 169.8 -5 -4 481.0 519.8 -7 -4
Other 262.6 280.0 -6 -5 774.5 785.4 -1 2
Gross Sales 796.4$ 805.0$ -1 % 0 % 2,363.8$ 2,312.2$ 2 % 6 %
1 Amounts may not foot due to rounding. 2 Sales Adjustments are not allocated to individual products. As such, Net Sales are not presented on a categories or brand level.3 Mattel reorganized its regional sales reporting structure in the first quarter of 2019. As a result, the new regions are Europe, the Middle East, and Africa (“EMEA”), Latin America, and Asia Pacific. The
Middle East, Africa, Russia, and Turkey were previously included in the Asia Pacific region (previously Global Emerging Markets) and are now included in EMEA (previously Europe). Prior period
amounts have been reclassified to conform to the current period presentation.4 Mattel modified its reporting structure for revenues in the first quarter of 2019 to disclose revenues by categories. Refer to Note 23, Segment Information, in the Form 10-Q for additional information.
For the Three Months Ended December 31, For the Year Ended December 31,

©2020 Mattel, Inc. All Rights Reserved. 39
Reconciliation of Non-GAAP Financial Measures
MATTEL, INC. AND SUBSIDIARIES EXHIBIT VI
GROSS SALES BY SEGMENT (Unaudited)1
RECONCILIATION OF GAAP AND NON-GAAP FINANCIAL MEASURES
(In millions, except percentage information)
2019 2018
% Change
as Reported
% Change in
Constant
Currency 2019 2018
% Change
as Reported
% Change in
Constant
Currency
American Girl Segment Gross Sales:
Net Sales 126.9$ 157.8$ -20 % -20 % 256.6$ 326.8$ -21 % -21 %
Sales Adjustments 6.9 7.5 11.9 14.4
Gross Sales 133.8$ 165.3$ -19 % -19 % 268.5$ 341.2$ -21 % -21 %1 Amounts may not foot due to rounding.
For the Three Months Ended December 31, For the Year Ended December 31,

©2020 Mattel, Inc. All Rights Reserved. 40
Reconciliation of Non-GAAP Financial MeasuresMATTEL, INC. AND SUBSIDIARIES EXHIBIT VII
SUPPLEMENTAL FINANCIAL INFORMATION (Unaudited)1
RECONCILIATION OF GAAP AND NON-GAAP FINANCIAL MEASURES
(In millions, except per share and percentage information) 20192 20182 20192 20182
Gross Profit
Gross Profit, As Reported $ 713.2 $ 709.6 $ 1,980.8 $ 1,798.7
Gross Margin 48.4% 46.6% 44.0% 39.8%
Adjustments:
Asset Impairments - - - 5.8
Severance and Restructuring Expenses36.7 - 18.6 5.7
Inclined Sleeper Product Recalls40.4 - 21.7 -
Gross Profit, As Adjusted $ 720.3 $ 709.6 $ 2,021.1 $ 1,810.2
Adjusted Gross Margin 48.9% 46.6% 44.9% 40.1%
Other Selling and Administrative Expenses
Other Selling and Administrative Expenses, As Reported $ 418.4 $ 398.2 $ 1,390.0 $ 1,508.7
% of Net Sales 28.4% 26.1% 30.9% 33.4%
Adjustments:
Asset Impairments8(25.9) - (25.9) (6.1)
Non-recurring Executive Compensation - - - (1.0)
Severance and Restructuring Expenses3(6.1) (5.9) (40.5) (104.1)
Inclined Sleeper Product Recalls4
(2.6) - (10.3) -
Sale of Assets - - - 1.4
Other Selling and Administrative Expenses, As Adjusted $ 383.8 $ 392.3 $ 1,313.4 $ 1,398.9
% of Net Sales 26.0% 25.7% 29.2% 31.0%
Operating Income (Loss)
Operating Income (Loss), As Reported $ 67.6 $ 105.6 $ 39.2 $ (234.3)
Adjustments:
Asset Impairments825.9 - 25.9 11.9
Non-recurring Executive Compensation - - - 1.0
Severance and Restructuring Expenses312.7 5.9 59.1 109.8
Inclined Sleeper Product Recalls43.1 - 32.0 -
Sale of Assets - - - (1.4)
Operating Income (Loss), As Adjusted $ 109.3 $ 111.5 $ 156.2 $ (113.0)
Other Information
Toys “R” Us Net Sales Reversal5 $ - $ - $ - $ 29.5
Toys “R” Us Bad Debt Expense, Net5 $ (4.7) $ (5.1) $ (6.1) $ 32.2
Inclined Sleeper Product Recalls4
$ 3.5 $ - $ 37.8 $ -
1 Amounts may not foot due to rounding.2 Toys “R” Us Net Sales Reversal and Toys “R” Us Bad Debt Expense, Net are not presented as non-GAAP adjustments for the three months and year ended December 31, 2019 and 2018. 3For the three months ended December 31, 2019, severance and restructuring expenses include $9.8 million related to the Capital Light program of which $6.7 million was recorded
to Cost of Sales and $3.1 million was recorded to Other Selling and Administrative Expenses.
For the year ended December 31, 2019, severance and restructuring expenses include $37.6 million related to the Capital Light program of which $18.6 million was recorded
to Cost of Sales and $19.0 million was recorded to Other Selling and Administrative Expenses.4 Mattel recorded an estimated impact of $3.5 million and $37.8 million related to inclined sleeper product recalls for the three months and year ended December 31, 2019, respectively. Of
the $37.8 million recorded during the year ended December 31, 2019, $5.8 million was a reduction to Net Sales for estimated retailer returns.5 As a result of the Toys “R” Us liquidation, Mattel reversed Net Sales for the estimated uncollectible portion of its outstanding receivables originating from first quarter 2018 sales. As
such, Gross Profit, As Reported includes the Cost of Sales for the inventory sold to Toys “R” Us but excludes the corresponding Net Sales. Additionally, during 2018, Mattel recorded
Bad Debt Expense, Net for the estimated uncollectible portion of its outstanding receivables, net of recoveries and other reductions. 8 For the three months and year ended December 31, 2019, asset impairments represent write-offs of American Girl retail store assets of $25.9 million,
which were recorded in other selling and administrative expenses.
For the Three Months Ended December 31, For the Year Ended December 31,

©2020 Mattel, Inc. All Rights Reserved. 41
Reconciliation of Non-GAAP Financial MeasuresMATTEL, INC. AND SUBSIDIARIES EXHIBIT VII
SUPPLEMENTAL FINANCIAL INFORMATION (Unaudited)1
RECONCILIATION OF GAAP AND NON-GAAP FINANCIAL MEASURES
(In millions, except per share and percentage information) 20192 20182 20192 20182
Earnings Per Share
Net Income (Loss) Per Common Share, As Reported $ 0.00 $ 0.03 $ (0.62) $ (1.55)
Adjustments:
Asset Impairments80.07 - 0.07 0.03
Severance and Restructuring Expenses3
0.04 0.02 0.17 0.32
Inclined Sleeper Product Recalls40.01 - 0.09 -
Tax Effect of Adjustments6(0.01) - (0.02) (0.01)
Tax Items7
- (0.02) - 0.05
Net Income (Loss) Per Common Share, As Adjusted $ 0.11 $ 0.03 $ (0.30) $ (1.15)
EBITDA and Adjusted EBITDA
Net Income (Loss), As Reported $ 0.2 $ 9.6 $ (213.5) $ (533.3)
Adjustments:
Interest Expense 60.2 49.2 201.0 181.9
Provision for Income Taxes 9.0 44.7 55.2 116.2
Depreciation 48.2 53.2 204.4 232.8
Amortization 10.0 9.2 40.1 39.1
EBITDA 127.5 165.9 287.3 36.8
Adjustments:
Asset Impairments8 25.9 - 25.9 11.9
Shared-based Compensation 16.8 12.7 56.0 48.9
Severance and Restructuring Expenses3 12.0 5.9 52.0 104.1
Inclined Sleeper Product Recalls4 3.1 - 32.0 -
Sale of Assets - - - (1.4)
Adjusted EBITDA $ 185.2 $ 184.5 $ 453.1 $ 200.2
Free Cash Flow
Net Cash Flows Provided By (Used For) Operating Activities $ 181.0 $ (27.3)
Capital Expenditures $ (116.4) $ (152.4)
Free Cash Flow $ 64.6 $ (179.7)
1 Amounts may not foot due to rounding.2 Toys “R” Us Net Sales Reversal and Toys “R” Us Bad Debt Expense, Net are not presented as non-GAAP adjustments for the three months and year ended December 31, 2019 and 2018. 3For the three months ended December 31, 2019, severance and restructuring expenses include $9.8 million related to the Capital Light program of which $6.7 million was recorded
to Cost of Sales and $3.1 million was recorded to Other Selling and Administrative Expenses.
For the year ended December 31, 2019, severance and restructuring expenses include $37.6 million related to the Capital Light program of which $18.6 million was recorded
to Cost of Sales and $19.0 million was recorded to Other Selling and Administrative Expenses.4 Mattel recorded an estimated impact of $3.5 million and $37.8 million related to inclined sleeper product recalls for the three months and year ended December 31, 2019, respectively. Of
the $37.8 million recorded during the year ended December 31, 2019, $5.8 million was a reduction to Net Sales for estimated retailer returns.6 The aggregate tax effect of the adjustments is calculated by tax effecting the adjustments by the current effective tax rate, and dividing by the reported weighted average number of
of common and potential common shares. Adjustments for the U.S. and certain International affiliates were not tax effected because of the valuation allowance on deferred tax assets.7 For the three months and year ended December 31, 2018, the amount includes a benefit of approximately $6 million and expense of approximately $18 million, respectively,
related to the provisional tax for deemed repatriation of accumulated foreign earnings and changes to the indefinite reinvestment assertion made as a result of U.S. Tax Reform.8 For the three months and year ended December 31, 2019, asset impairments represent write-offs of American Girl retail store assets of $25.9 million,
which were recorded in other selling and administrative expenses.
For the Three Months Ended December 31, For the Year Ended December 31,
©2020 Mattel, Inc. All Rights Reserved. 42
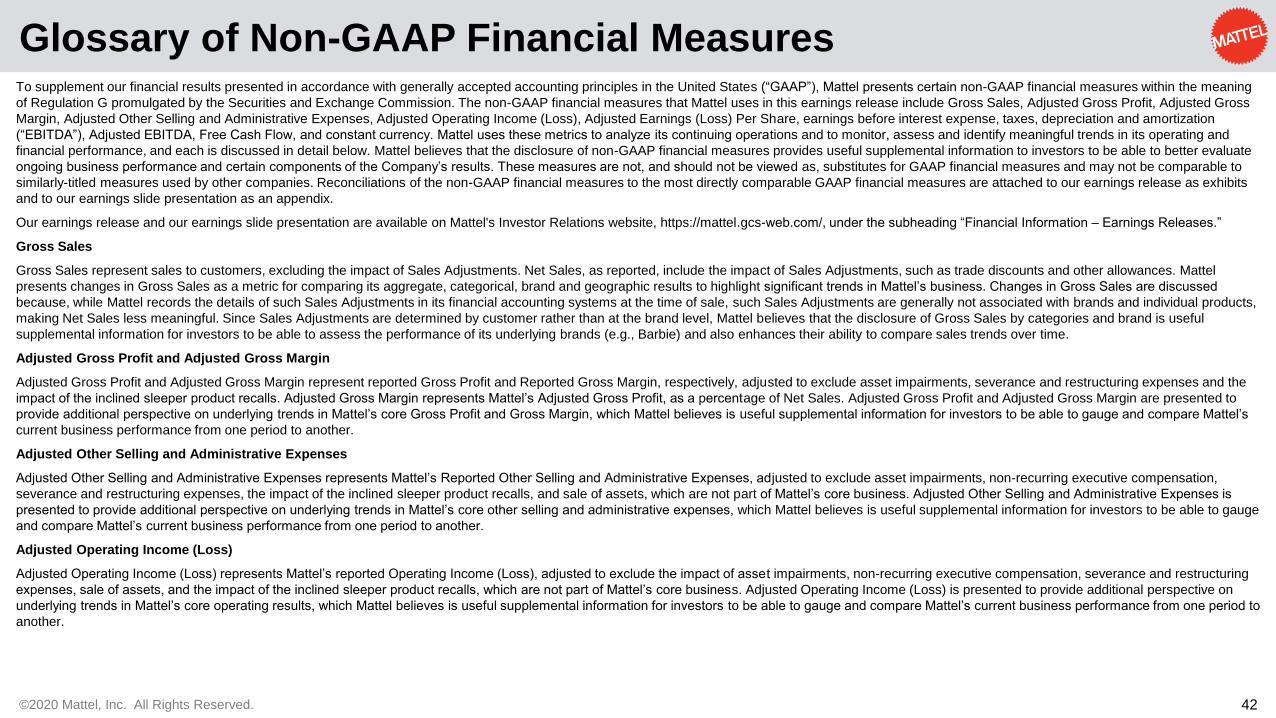
Glossary of Non-GAAP Financial MeasuresTo supplement our financial results presented in accordance with generally accepted accounting principles in the United States (“GAAP”), Mattel presents certain non-GAAP financial measures within the meaning
of Regulation G promulgated by the Securities and Exchange Commission. The non-GAAP financial measures that Mattel uses in this earnings release include Gross Sales, Adjusted Gross Profit, Adjusted Gross
Margin, Adjusted Other Selling and Administrative Expenses, Adjusted Operating Income (Loss), Adjusted Earnings (Loss) Per Share, earnings before interest expense, taxes, depreciation and amortization
(“EBITDA”), Adjusted EBITDA, Free Cash Flow, and constant currency. Mattel uses these metrics to analyze its continuing operations and to monitor, assess and identify meaningful trends in its operating and
financial performance, and each is discussed in detail below. Mattel believes that the disclosure of non-GAAP financial measures provides useful supplemental information to investors to be able to better evaluate
ongoing business performance and certain components of the Company’s results. These measures are not, and should not be viewed as, substitutes for GAAP financial measures and may not be comparable to
similarly-titled measures used by other companies. Reconciliations of the non-GAAP financial measures to the most directly comparable GAAP financial measures are attached to our earnings release as exhibits
and to our earnings slide presentation as an appendix.
Our earnings release and our earnings slide presentation are available on Mattel's Investor Relations website, https://mattel.gcs-web.com/, under the subheading “Financial Information – Earnings Releases.”
Gross Sales
Gross Sales represent sales to customers, excluding the impact of Sales Adjustments. Net Sales, as reported, include the impact of Sales Adjustments, such as trade discounts and other allowances. Mattel
presents changes in Gross Sales as a metric for comparing its aggregate, categorical, brand and geographic results to highlight significant trends in Mattel’s business. Changes in Gross Sales are discussed
because, while Mattel records the details of such Sales Adjustments in its financial accounting systems at the time of sale, such Sales Adjustments are generally not associated with brands and individual products,
making Net Sales less meaningful. Since Sales Adjustments are determined by customer rather than at the brand level, Mattel believes that the disclosure of Gross Sales by categories and brand is useful
supplemental information for investors to be able to assess the performance of its underlying brands (e.g., Barbie) and also enhances their ability to compare sales trends over time.
Adjusted Gross Profit and Adjusted Gross Margin
Adjusted Gross Profit and Adjusted Gross Margin represent reported Gross Profit and Reported Gross Margin, respectively, adjusted to exclude asset impairments, severance and restructuring expenses and the
impact of the inclined sleeper product recalls. Adjusted Gross Margin represents Mattel’s Adjusted Gross Profit, as a percentage of Net Sales. Adjusted Gross Profit and Adjusted Gross Margin are presented to
provide additional perspective on underlying trends in Mattel’s core Gross Profit and Gross Margin, which Mattel believes is useful supplemental information for investors to be able to gauge and compare Mattel’s
current business performance from one period to another.
Adjusted Other Selling and Administrative Expenses
Adjusted Other Selling and Administrative Expenses represents Mattel’s Reported Other Selling and Administrative Expenses, adjusted to exclude asset impairments, non-recurring executive compensation,
severance and restructuring expenses, the impact of the inclined sleeper product recalls, and sale of assets, which are not part of Mattel’s core business. Adjusted Other Selling and Administrative Expenses is
presented to provide additional perspective on underlying trends in Mattel’s core other selling and administrative expenses, which Mattel believes is useful supplemental information for investors to be able to gauge
and compare Mattel’s current business performance from one period to another.
Adjusted Operating Income (Loss)
Adjusted Operating Income (Loss) represents Mattel’s reported Operating Income (Loss), adjusted to exclude the impact of asset impairments, non-recurring executive compensation, severance and restructuring
expenses, sale of assets, and the impact of the inclined sleeper product recalls, which are not part of Mattel’s core business. Adjusted Operating Income (Loss) is presented to provide additional perspective on
underlying trends in Mattel’s core operating results, which Mattel believes is useful supplemental information for investors to be able to gauge and compare Mattel’s current business performance from one period to
another.

©2020 Mattel, Inc. All Rights Reserved. 43
Glossary of Non-GAAP Financial Measures
Adjusted Earnings (Loss) Per Share
Adjusted Earnings (Loss) Per Share represents Mattel’s Reported Diluted Earnings (Loss) Per Common Share, adjusted to exclude the impact of asset impairments, severance and restructuring expenses,
and the impact of the inclined sleeper product recalls, which are not part of Mattel’s core business. The aggregate tax effect of the adjustments is calculated by tax effecting the adjustments by the current
effective tax rate, adjusting for certain discrete tax items, and dividing by the reported weighted average number of common shares. Adjusted Earnings (Loss) Per Share is presented to provide additional
perspective on underlying trends in Mattel’s core business. Mattel believes it is useful supplemental information for investors to gauge and compare Mattel’s current earnings results from one period to another.
Adjusted Earnings (Loss) Per Share is a performance measure and should not be used as a measure of liquidity.
EBITDA and Adjusted EBITDA
EBITDA represents Mattel’s Net Income (Loss), adjusted to exclude the impact of interest expense, taxes, depreciation and amortization. Adjusted EBITDA represents EBITDA adjusted to exclude the impact
of asset impairments, share-based compensation, severance and restructuring expenses, sale of assets, and the impact of the inclined sleeper product recalls, which are not part of Mattel’s core business.
Mattel believes EBITDA and Adjusted EBITDA are useful supplemental information for investors to gauge and compare Mattel’s business performance to other companies in our industry with similar capital
structures. The presentation of Adjusted EBITDA differs from how we will calculate EBITDA for purposes of covenant compliance under the indenture governing our 6.75% senior notes due 2025, the indenture
governing our 5.875% senior notes due 2027, and the syndicated facility agreement governing our senior secured revolving credit facilities. Because of these limitations, EBITDA and Adjusted EBITDA should
not be considered as measures of discretionary cash available to us to invest in the growth of our business. As a result, we rely primarily on our GAAP results and use EBITDA and Adjusted EBITDA only
supplementally.
Free Cash Flow
Free Cash Flow represents Mattel’s net cash flows from operating activities less capital expenditures. Mattel believes Free Cash Flow is useful supplemental information for investors to gauge Mattel’s liquidity
and performance and to compare Mattel’s business performance to other companies in our industry. Free Cash Flow does not represent cash available to Mattel for discretionary expenditure.
Constant currency
Percentage changes in results expressed in constant currency are presented excluding the impact from changes in currency exchange rates. To present this information, Mattel calculates constant currency
information by translating current period and prior period results for entities reporting in currencies other than the US dollar using consistent exchange rates. The constant currency exchange rates are
determined by Mattel at the beginning of each year and are applied consistently during the year. They are generally different from the actual exchange rates in effect during the current or prior period due to
volatility in actual foreign exchange rates. Mattel considers whether any changes to the constant currency rates are appropriate at the beginning of each year. The exchange rates used for these constant
currency calculations are generally based on prior year actual exchange rates. The difference between the current period and prior period results using the consistent exchange rates reflects the changes in
the underlying performance results, excluding the impact from changes in currency exchange rates. Mattel analyzes constant currency results to provide additional perspective on changes in underlying trends
in Mattel’s operating performance. Mattel believes that the disclosure of the percentage change in constant currency is useful supplemental information for investors to be able to gauge Mattel’s current
business performance and the longer-term strength of its overall business since foreign currency changes could potentially mask underlying sales trends. The disclosure of the percentage change in constant
currency enhances investor’s ability to compare financial results from one period to another.