FOUR PHASES QUALITY FUNCTION DEPLOYMENT (QFD) BY...
17
2 nd International Conference on Engineering and Technology Development (ICETD 2013) Universitas Bandar Lampung Faculty of Engineering and Faculty of Computer Science 22 ISSN 2301-6590 FOUR PHASES QUALITY FUNCTION DEPLOYMENT (QFD) BY CONSIDERING KANO CONCEPT, TIME AND MANUFACTURING COST Moses L. Singgih 1 , Dyah L. Trenggonowati 2 , Putu D. Karningsih 3 1,2,3) Manufacturing System Laboratory, Department of Industrial Engineering Institut Teknologi Sepuluh Nopember Kampus ITS Sukolilo, Surabaya 60111 Email: [email protected] , [email protected] , [email protected] Abstract : Each company must carry out product development to maintain or build sales. Relationship between specifications and parameters of quality products to the wishes of the customer is an important consideration in doing product development. Product development methods QFD (Quality Function Deployment) has been widely applied in industry to maximize customer satisfaction based on quality, cost, time and other, become source of constraints. Quality, time and cost are important factors for a company to maintain existency of the company in the industry. This study will provide customer deployment requirements to consider not only the quality factors are more often a point of view assuming the successful development of a product, but also on the factors of time and cost. Factors to be considered in stages creating new products or improving old products are not only detailed data about the four phases of phasing as product planning, product design, process planning, process control and planning is needed, but also a complete view of the overall technical response . The final integration of the four phases of QFD is influential in producing and marketing the products. Team of product development must plan how to design new products to exploit existing technical response. Matters relating to the quality characteristic and the voice of stakeholders is very relevant and should be well understood and thoroughly. Technical approach to a more detailed response can lead a team of product developers to pay attention to the changes of each phase to obtain the allocation of resources for each of the responses are perfectly. Key words- cost, four-phase QFD, quality, and time
Transcript of FOUR PHASES QUALITY FUNCTION DEPLOYMENT (QFD) BY...

2nd
International Conference on Engineering and Technology Development
(ICETD 2013)
Universitas Bandar Lampung
Faculty of Engineering and Faculty of Computer Science
22
ISSN 2301-6590
FOUR PHASES QUALITY FUNCTION DEPLOYMENT (QFD)
BY CONSIDERING KANO CONCEPT, TIME AND
MANUFACTURING COST
Moses L. Singgih1, Dyah L. Trenggonowati
2, Putu D. Karningsih
3
1,2,3) Manufacturing System Laboratory, Department of Industrial Engineering
Institut Teknologi Sepuluh Nopember
Kampus ITS Sukolilo, Surabaya 60111
Email: [email protected], [email protected], [email protected]
Abstract : Each company must carry out product development to maintain or build sales.
Relationship between specifications and parameters of quality products to the wishes of the
customer is an important consideration in doing product development. Product development
methods QFD (Quality Function Deployment) has been widely applied in industry to
maximize customer satisfaction based on quality, cost, time and other, become source of
constraints. Quality, time and cost are important factors for a company to maintain
existency of the company in the industry. This study will provide customer deployment
requirements to consider not only the quality factors are more often a point of view
assuming the successful development of a product, but also on the factors of time and cost.
Factors to be considered in stages creating new products or improving old products are not
only detailed data about the four phases of phasing as product planning, product design,
process planning, process control and planning is needed, but also a complete view of the
overall technical response . The final integration of the four phases of QFD is influential in
producing and marketing the products. Team of product development must plan how to
design new products to exploit existing technical response. Matters relating to the quality
characteristic and the voice of stakeholders is very relevant and should be well understood
and thoroughly. Technical approach to a more detailed response can lead a team of product
developers to pay attention to the changes of each phase to obtain the allocation of
resources for each of the responses are perfectly.
Key words- cost, four-phase QFD, quality, and time
2nd
International Conference on Engineering and Technology Development
(ICETD 2013)
Universitas Bandar Lampung
Faculty of Engineering and Faculty of Computer Science
23
ISSN 2301-6590
1. INTRODUCTION
QFD product development
methods have been widely applied in
industry to maximize the customer
satisfaction based on quality, cost, time
and other, these factors are considered as
constraints. Quality, time and cost are
important factors for a company to
maintain its existence in the
industrialized world. In some previous
studies focus more on the quality factor is
how to help the company to obtain
satisfaction of the consumer, while the
cost and time factors have received less
attention, if any, are not calculated and
discussed in detail.
The things that must be
considered in stages creating new
products or improving old products not
only detailed data on product planning,
product design, process planning, process
control and planning is needed, but also a
complete view of the overall technical
response. Where the end result is the
integration of the four phases of QFD
influential in producing and marketing the
products. Product development team
should plan how to design new products
to exploit existing technical response.
Matters relating to the quality
characteristic and the voice of
stakeholders is very relevant and should
be well understood and thoroughly.
Approach to a more detailed technical
response can lead a team of developers to
pay attention to changes in product
product planning, product design, process
planning, process control and planning.
However, most of the existing research
has been discussed about the issues of
new product development requirements
are dominated by the respective technical
framework respond regarding product
planning (Chen and Weng, 2006; Kwong
et al., 2007; Chend and Ko, 2008) and
product design (Zhai et al., 2010), among
several issues that it is called a research
topic that is often discussed and
considered. While the technical response
and the process planning, process control
and integration of the four phases of QFD
less attention (Chen and Ko, 2009).
This study will provide customer
deployment requirements to consider not
only the quality but also factor in the time
and cost factor in developing a product. In
this case QFD is considered able to
support the success of this research. QFD
four phases may provide some short-term
benefits such as reducing barriers
associated with cross-functional product
development team and help change
corporate culture. In the long run, QFD
has been shown to have tangible benefits
such as further reducing cycle time,
reduce development costs, and increased
productivity. An important benefit of
QFD is its effectiveness in capturing,
prioritizing and stabilizing customer
needs (Delgado and Aspinwall, 2003).
According to Cohen (1995), QFD
benefits for companies seeking to
improve their competitiveness and
productivity through improved quality is
continuously improving product
reliability, improve product quality,
increase customer satisfaction, shorten
time to market, reduce design costs,
improve communications, increase
productivity and increase corporate
profits.
Departing from problems such as
those described above, developed a new
concept of how to respond to customer
requirements is a good category to
integrate all technical respond that there is
commonly called the QFD 4 phases to

2nd
International Conference on Engineering and Technology Development
(ICETD 2013)
Universitas Bandar Lampung
Faculty of Engineering and Faculty of Computer Science
24
ISSN 2301-6590
obtain the form of resource allocation for
each response is perfect.
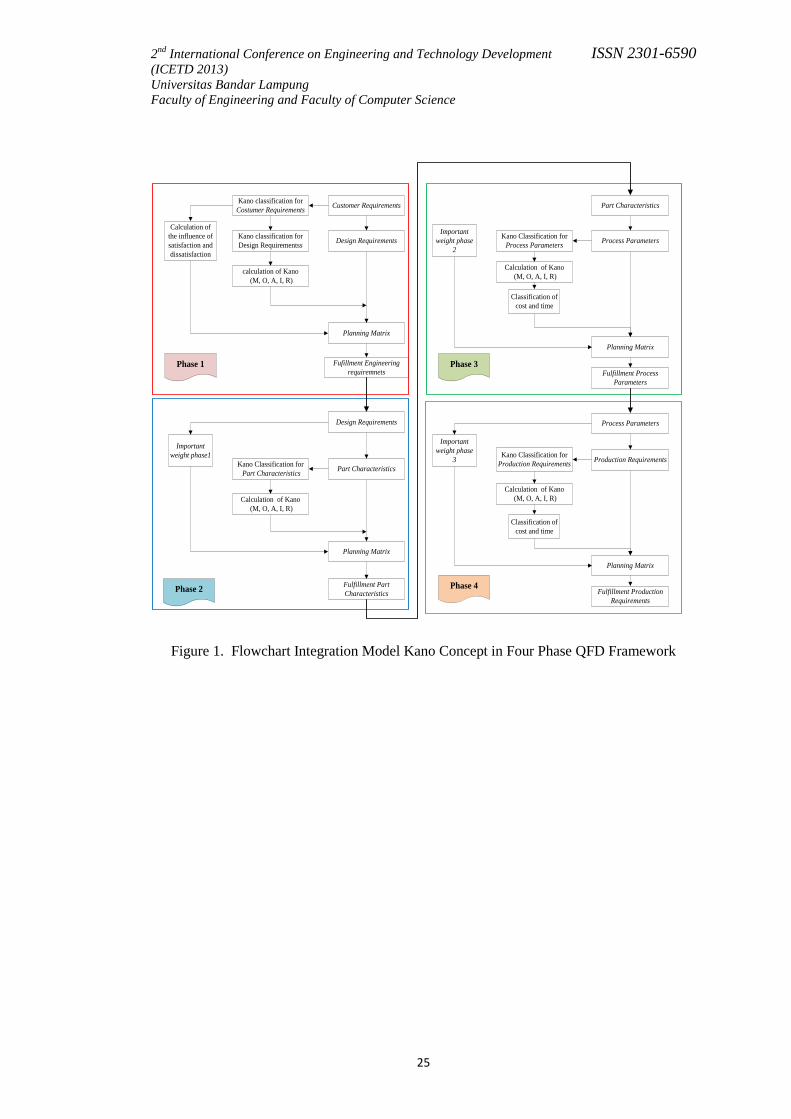
2. FLOWCHART INTEGRATION
MODEL FOUR PHASE QFD
Four phases of the integration
process of QFD is described in the
flowchart in Figure 1. illustrates the
process of the integration is done. In the
first phase of QFD using Kano method to
classify customer requirements and design
requirements. Kano questionnaire will be
calculated based on the value of the
influence of consumer satisfaction and
dissatisfaction.
Values influence consumer
satisfaction and dissatisfaction will be
input in the planning matrix. So we get
the output fulfillment requirements
engineering. In the phase two QFD using
Kano method to classify the design
requirements and part characteristics.
Output important weight in phase one will
be used as design input requirements in
phase two. Kano classification process on
the part characteristics similar to that
carried out in phase one until finally
found fulfillment part characteristics. In
the third phase QFD using Kano method
to classify part characteristics and process
parameters. Output important weight in
phase two will be used as input phase
three on the part characteristics. In
addition to the results of operation time
and manufacturing cost will also be used
as input process parameters. So that they
become input to the planning matrix and
to obtain fulfillment process parameters.
In the fourth phase QFD using Kano
method to classify process parameters and
production requirements. Output from
phase three (important weight) will be
used as the input process parameters on
phase four. Kano and classification
process on the production requirements as
well as performed in phase three to finally
obtain fulfillment production
requirements. At this integration process
we will get a good important weight for
quality, cost and time, so we get a trade
off between the three. More specifically
we will get a comparison between the cost
and time of manufacturing processes.
2nd
International Conference on Engineering and Technology Development
(ICETD 2013)
Universitas Bandar Lampung
Faculty of Engineering and Faculty of Computer Science
25
ISSN 2301-6590
Customer Requirements
Design Requirements
Fufillment Engineering
requiremnets
Planning Matrix
Kano classification for
Costumer Requirements
Calculation of Kano
(M, O, A, I, R)
Calculation of
the influence of
satisfaction and
dissatisfaction
calculation of Kano
(M, O, A, I, R)
Kano classification for
Design Requirementss
Classification of
cost and time
Part Characteristics
Design Requirements
Kano Classification for
Part Characteristics
Planning Matrix
Fulfillment Part
Characteristics
Important
weight phase1
Part Characteristics
Process Parameters
Important
weight phase
2
Kano Classification for
Process Parameters
Planning Matrix
Fulfillment Process
Parameters
Process Parameters
Production Requirements
Important
weight phase
3Kano Classification for
Production Requirements
Planning Matrix
Fulfillment Production
Requirements
Phase 1
Phase 2
Phase 3
Phase 4
Classification of
cost and time
Calculation of Kano
(M, O, A, I, R)
Calculation of Kano
(M, O, A, I, R)
Figure 1. Flowchart Integration Model Kano Concept in Four Phase QFD Framework

2nd
International Conference on Engineering and Technology Development
(ICETD 2013)
Universitas Bandar Lampung
Faculty of Engineering and Faculty of Computer Science
26
ISSN 2301-6590
3. FRAMEWORK INTEGRATION
FOUR PHASE QFD
Framework Four Phase QFD
Integration that has been modified with a
development Integration Model QFD -
concept Kano Model from research
Singgih, Tansiah dan Immanuel
(forthcoming). Integration of the results of
four Phase QFD - Kano can be seen in
Figure 3 to Figure 6 which consists of the
following parts:
Customer requirement (CRi)
Column customer needs / customer
requirements is the main column of the
HOQ (House of Quality), which contains
the desires of consumers and the basic
characteristics of the product. Part is still
the same as the conventional QFD. The
term Customer needs / customer
requirement is symbolized by CRi.
Planning Matrix
There are some parts that are the
same as part of the planning matrix of
QFD Conventional namely:
Importance to customer (di)
Current satisfaction performance
(CSPi)
Competitive satisfaction
performace (CoSPi)
Goal (Gi)
Improvement Ratio (IRi)
Sales Point (SPi)
Raw weight (RWi)
Some additional columns
integration Kano Model is as follows:
Kategory Kano to CRi (Qi)
Kano Category for CRi that
include categories must be, one-
dimensional and attractive, and then
reverse and indifference categories
does not include the input of the
HOQ. This categorization process
will be the basis of classification of
technical response in the next section.
Extent of satisfaction
This section shows the effect of
the value of each customer
requirement on the level of customer
satisfaction that is symbolized by the
letter S. That is, it measures how
much the value of customer
satisfaction will increase when the
relevant customer requirements
embodied in a product. The more
positive value, then this indicates that
customer requirements are referred to
the effect on the level of consumer
satisfaction. Extent of satisfaction can
be generated using the following
equation.
IMOA
OASi
(1)
Si : Extent of satisfaction
A : Atrractive Category
O : One-dimensional Category
M : Must-be Category
I : Indifference Category
The values Si indicate that the
customer requirement (CR) i will
increase customer satisfaction when i
met CR. Each CRi will have all the
elements of Kano categories, i.e.,
must-be, one-dimensional, attractive,
indifference or reverse the
proportions vary by consumer
preferences. Proportion to the value
of each category is derived from the
questionnaire Kano.
The value Si indicates the
magnitude of the positive effect on
customer satisfaction customer
requirements in the product when it is
raised. The value is in the range of
numbers from 0 to 1. Value of 1
2nd
International Conference on Engineering and Technology Development
(ICETD 2013)
Universitas Bandar Lampung
Faculty of Engineering and Faculty of Computer Science
27
ISSN 2301-6590
indicates the existence of a very large
influence on the level of customer
satisfaction as customer requirement i
displayed. Vice versa when the Si is 0
which indicates that no significant
effect on the level of customer
satisfaction as customer requirement i
displayed.
Extent of dissatisfaction
This section will show the
impact of each CRi to levels of
consumer dissatisfaction. This value
can be generated by the following
equation.
)1()('
IMOA
MOSi
(2)
where:
Si‘ : Extent of dissatisfaction
Extent of this dissatisfaction is
basically a value that measures how
much influence the disappearance of
the level of consumer dissatisfaction
CRi. Unlike Si, Si‘ value aims to
measure the negative impact on the
level of satisfaction that can be
interpreted as the level of consumer
dissatisfaction with the product.
The value Si‘ will be in the range
-1 to 0. A value of -1 indicates a
strong influence on the level of
consumer dissatisfaction when a
customer requirement is not shown.
Vice versa, the value of 0 indicates no
influence on the rate of disappearance
customer requirement of consumer
dissatisfaction. By looking at the
magnitude of thiss value, the
company can look at customer
requirements which need to be given
special attention. Customer
requirements with value Si‘
approaching -1, remembering to note
the disappearance customer
requirements will significantly affect
consumer dissatisfaction.
Technical response (TRj)
This section describes the
translation CRi on Technical Response
(TRj) will be elected as the concept of
product design. There is one additional
columns:
Kategory Kano to TRj (Qj)
As in the CRi, this section will
contain the Kano categories for each
of the TRj is derived directly from
CRi category. Decrease in Kano on
technical response categories is done
so that the product development team
to learn more about the technical
response which will affect the focus
of the development of CRi, CRi
suppose that category attractive. In
addition, the cost allocation process,
the model will consider the Kano
categories.
Relationship Matrix (Rij)
This section will contain inter -
CRi. As is the case with conventional
QFD, at even this section will use a
value of 1, 3 and 9 to denote the
relationship or relationship. The value
9 shows the value of the most robust
positive relationship.
Technical Correlation (kj )
Correlation are shown in this
model is limited to the positive
correlation as has been done on the
model Bode and Fung (1998).
Positive relationship when the
relationship in question is the value
TR1 will go up by a certain
prosesntase, TR2 also raised the value.
Symbol correlation used in this study
were 1, 3 and 9 for the relationship is
weak, medium and strong and 10 to
illustrate the value of correlation with
TRj same.
Technical Matrix
In the technical part of this matrix
are the combination of the conventional
QFD models and QFD models Bode and
Fung (1998). Sections are as follows:
Threshold Value (TQ )
2nd
International Conference on Engineering and Technology Development
(ICETD 2013)
Universitas Bandar Lampung
Faculty of Engineering and Faculty of Computer Science
28
ISSN 2301-6590
Threshold value (TQ) is the part
that contains the value limits the
extent to which the allocation of
technical response development costs
allocated to meet a category of Kano.
TQ value of this will be the percentage
of the amount of funds that can be
allocated on a set of TRj for certain
categories. Where these categories
denoted by the letter Q in which the
value is 1, 2 and 3. A value of 1
indicates the category must-be, a
value of 2 indicates the category of
one-dimensional and 3 show values
attractive category.
TQ value will depend on the
type of company concerned. Each
company will have its own decisions
in the product development process.
For a company that offers innovative
products, sometimes attractive
category will get more attention,
while for companies with the type of
follower can be a category of must-be
and one-dimensional first importance.
However, that would be the order of
the parameters is that the allocation
will follow the rules of the category
of interest must-be > one-dimensional
> attractive. Must-be is the basic
function of the product so that the
basic function must exist in the
product, while the one-dimensional is
a performance improvement of the
basic functions and attractive are the
additional features that will be related
to the competitive advantage of a
product.
Technical Importance (wQj),
Technical Manufacturing Cost,
Technical Manufacturing Time,
Technical Assembly Cost,
Technical Assembly Time.
The value of relationship (Rij) is
the importance to the customer (di)
for the entire CRi. wQi value
calculated for each TRj in each
category Kano Q. This value indicates
the value of each TRj effect on the
fulfillment of CRi. Rij values used in
this calculation is the value of Rij has
been done the normalization process
or norm
ijR . Normalization process used
is a normalization process
Wasserman.
wQi value can be determined
using the following equation.
m
i
ijij Rdw1
(3)
Resource Importance (w*Qj)
Resource importance is the
contribution of technical response to
the fulfillment of customer
requirements j, i when allocated a
resource unit. This value provides
information about the contribution of
technical response to customer
satisfaction with regard to the value
of each correlation the technical
response. Bode and Fung (1998)
calculated the resource importance by
the following equation:
n
j
jkjkQj ww1
*
,
(4)
w*Qj value will increase when j
technical response has a lot of
correlation with other technical
response. This suggests that the more
a technical response has correlation
with the other technical response, it
indicates that the j realizing the
technical response will increase
another technical response. Thus, to
show an increasing contribution to
realizing customer requirements.
Technical Satisfaction (wsQj)
This value is the theoretical
value of norm
ijR normalization was
done with grades Extent to
satisfaction (S). This value indicates
how much influence j technical
response to customer satisfaction
when it developed a technical
response will cause realization of CRi
in a product.
Each CRi will have a different
amount of impact on the level of
2nd
International Conference on Engineering and Technology Development
(ICETD 2013)
Universitas Bandar Lampung
Faculty of Engineering and Faculty of Computer Science
29
ISSN 2301-6590
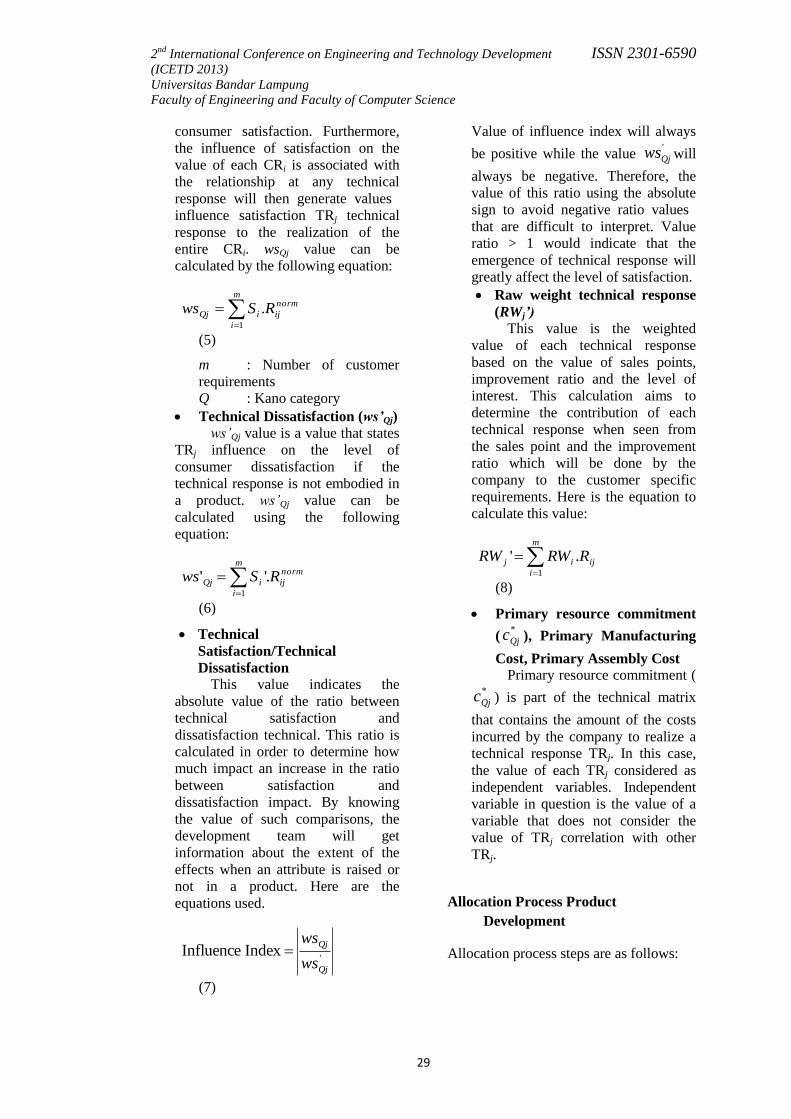
consumer satisfaction. Furthermore,
the influence of satisfaction on the
value of each CRi is associated with
the relationship at any technical
response will then generate values
influence satisfaction TRj technical
response to the realization of the
entire CRi. wsQj value can be
calculated by the following equation:
norm
ij
m
i
iQj RSws .1
(5)
m : Number of customer
requirements
Q : Kano category
Technical Dissatisfaction (ws’Qj)
ws’Qj value is a value that states
TRj influence on the level of
consumer dissatisfaction if the
technical response is not embodied in
a product. ws’Qj value can be
calculated using the following
equation:
norm
ij
m
i
iQj RSws .''1
(6)
Technical
Satisfaction/Technical
Dissatisfaction
This value indicates the
absolute value of the ratio between
technical satisfaction and
dissatisfaction technical. This ratio is
calculated in order to determine how
much impact an increase in the ratio
between satisfaction and
dissatisfaction impact. By knowing
the value of such comparisons, the
development team will get
information about the extent of the
effects when an attribute is raised or
not in a product. Here are the
equations used.
'Index Influence
Qj
Qj
ws
ws
(7)
Value of influence index will always
be positive while the value '
Qjws will
always be negative. Therefore, the
value of this ratio using the absolute
sign to avoid negative ratio values
that are difficult to interpret. Value
ratio > 1 would indicate that the
emergence of technical response will
greatly affect the level of satisfaction.
Raw weight technical response
(RWj’) This value is the weighted
value of each technical response
based on the value of sales points,
improvement ratio and the level of
interest. This calculation aims to
determine the contribution of each
technical response when seen from
the sales point and the improvement
ratio which will be done by the
company to the customer specific
requirements. Here is the equation to
calculate this value:
m
i
ijij RRWRW1
.'
(8)
Primary resource commitment
(*
Qjc ), Primary Manufacturing
Cost, Primary Assembly Cost
Primary resource commitment (*
Qjc ) is part of the technical matrix
that contains the amount of the costs
incurred by the company to realize a
technical response TRj. In this case,
the value of each TRj considered as
independent variables. Independent
variable in question is the value of a
variable that does not consider the
value of TRj correlation with other
TRj.
Allocation Process Product
Development
Allocation process steps are as follows:

2nd
International Conference on Engineering and Technology Development
(ICETD 2013)
Universitas Bandar Lampung
Faculty of Engineering and Faculty of Computer Science
30
ISSN 2301-6590
1) Grouping technical response by Kano
category
2) The determination of the threshold
value
1)
The calculation of the value of
'
Qj
Qj
ws
ws
2)
The calculation of the value of
*
'
* / Qj
Qj
Qj
Qj cws
wsw
3) The calculation of the value of RW‘j
1.1 Trade-off between Time and
Cost
In the product development
process or produce new products will
usually arise problems in achieving a
particular goal (the trade-off). During the
process would take time and cost, where
the time and costs associated with being a
problem to determine the manufacturing
cost of the product being made. In
determining the cost of the product and
the estimated time of completion is
influenced by many factors such as
product below.

2nd
International Conference on Engineering and Technology Development
(ICETD 2013)
Universitas Bandar Lampung
Faculty of Engineering and Faculty of Computer Science
31
ISSN 2301-6590
Manufacturing Cost
OverheadAssemblyComponents
Standard Custom LaborEquipment
and ToolingSupport
Indirect
Allocation
Raw
MaterialProcessing Tooling
Figure 2. Structure of Manufacturing Cost by Boothroyd and Dewhurst
2nd
International Conference on Engineering and Technology Development
(ICETD 2013)
Universitas Bandar Lampung
Faculty of Engineering and Faculty of Computer Science
32
ISSN 2301-6590
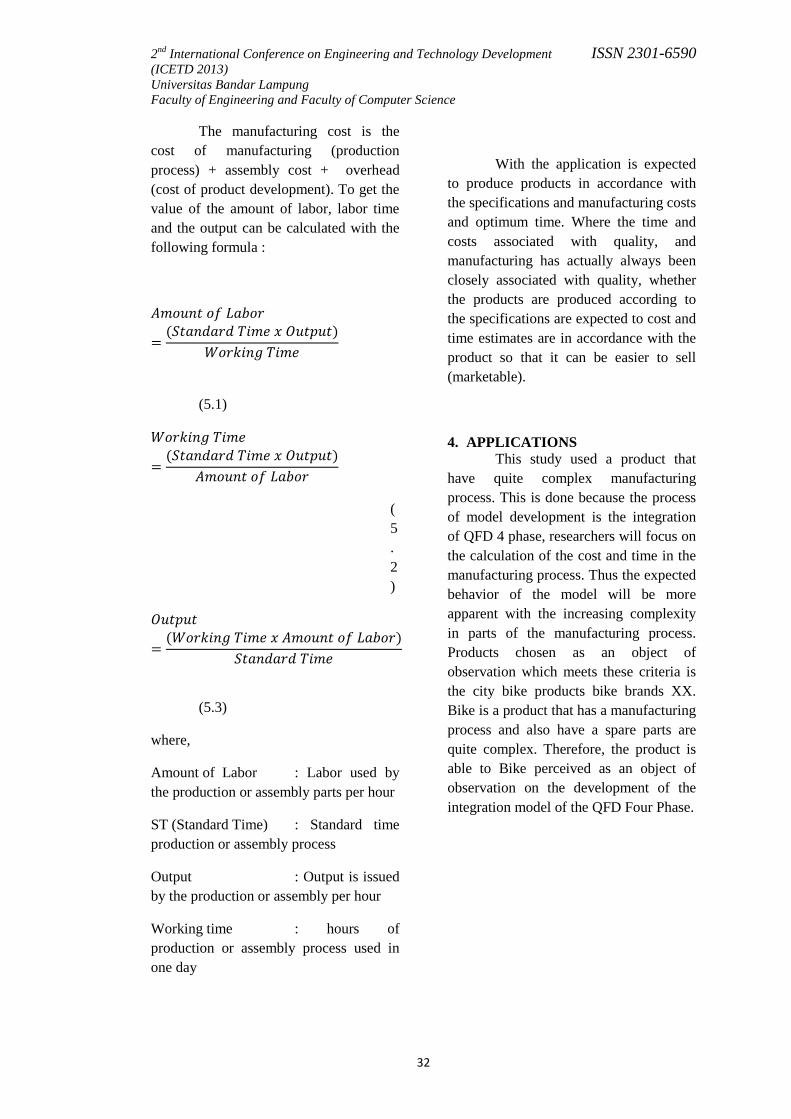
The manufacturing cost is the
cost of manufacturing (production
process) + assembly cost + overhead
(cost of product development). To get the
value of the amount of labor, labor time
and the output can be calculated with the
following formula :
𝐴𝑚𝑜𝑢𝑛𝑡 𝑜𝑓 𝐿𝑎𝑏𝑜𝑟
=(𝑆𝑡𝑎𝑛𝑑𝑎𝑟𝑑 𝑇𝑖𝑚𝑒 𝑥 𝑂𝑢𝑡𝑝𝑢𝑡)
𝑊𝑜𝑟𝑘𝑖𝑛𝑔 𝑇𝑖𝑚𝑒
(5.1)
𝑊𝑜𝑟𝑘𝑖𝑛𝑔 𝑇𝑖𝑚𝑒
=(𝑆𝑡𝑎𝑛𝑑𝑎𝑟𝑑 𝑇𝑖𝑚𝑒 𝑥 𝑂𝑢𝑡𝑝𝑢𝑡)
𝐴𝑚𝑜𝑢𝑛𝑡 𝑜𝑓 𝐿𝑎𝑏𝑜𝑟
(
5
.
2
)
𝑂𝑢𝑡𝑝𝑢𝑡
=(𝑊𝑜𝑟𝑘𝑖𝑛𝑔 𝑇𝑖𝑚𝑒 𝑥 𝐴𝑚𝑜𝑢𝑛𝑡 𝑜𝑓 𝐿𝑎𝑏𝑜𝑟)
𝑆𝑡𝑎𝑛𝑑𝑎𝑟𝑑 𝑇𝑖𝑚𝑒
(5.3)
where,
Amount of Labor : Labor used by
the production or assembly parts per hour
ST (Standard Time) : Standard time
production or assembly process
Output : Output is issued
by the production or assembly per hour
Working time : hours of
production or assembly process used in
one day
With the application is expected
to produce products in accordance with
the specifications and manufacturing costs
and optimum time. Where the time and
costs associated with quality, and
manufacturing has actually always been
closely associated with quality, whether
the products are produced according to
the specifications are expected to cost and
time estimates are in accordance with the
product so that it can be easier to sell
(marketable).
4. APPLICATIONS
This study used a product that
have quite complex manufacturing
process. This is done because the process
of model development is the integration
of QFD 4 phase, researchers will focus on
the calculation of the cost and time in the
manufacturing process. Thus the expected
behavior of the model will be more
apparent with the increasing complexity
in parts of the manufacturing process.
Products chosen as an object of
observation which meets these criteria is
the city bike products bike brands XX.
Bike is a product that has a manufacturing
process and also have a spare parts are
quite complex. Therefore, the product is
able to Bike perceived as an object of
observation on the development of the
integration model of the QFD Four Phase.
2nd
International Conference on Engineering and Technology Development
(ICETD 2013)
Universitas Bandar Lampung
Faculty of Engineering and Faculty of Computer Science
33
ISSN 2301-6590
Relationship MatrixCustomer
Requirements
Kano Category
Technical Importance
Technical Satisfaction ( )
Primary Resource Commitment Required
Actual Resource Required
% Allocation
Nilai Threshold
Cu
sto
mer I
mp
orta
nce S
ati
sfa
cti
on
Cu
rren
t S
ati
sfa
cti
on
Perfo
rm
an
ce
Co
mp
eti
tiv
e S
ati
sfa
cti
on
Perfo
rm
an
ce
Ex
ten
t o
f S
ati
sfa
cti
on
Ex
ten
t o
f D
isa
tisf
acti
on
Go
al
Imp
ro
vem
en
t R
ati
o
Sa
les
Po
int
Cost Engineering with
consideration Kano
Kano Model
Technical Correlation
Design Requirements
Ka
no
Ca
teg
ory
Technical Dissatisfaction ( )
Resource Importance (w*k )
Technical Satisfaction/Technical Dissatisfaction ( )
Ra
w w
eig
ht
jws
jws '
'/ jj wsws
*'* // kjjj cwswsw
Raw Weight’
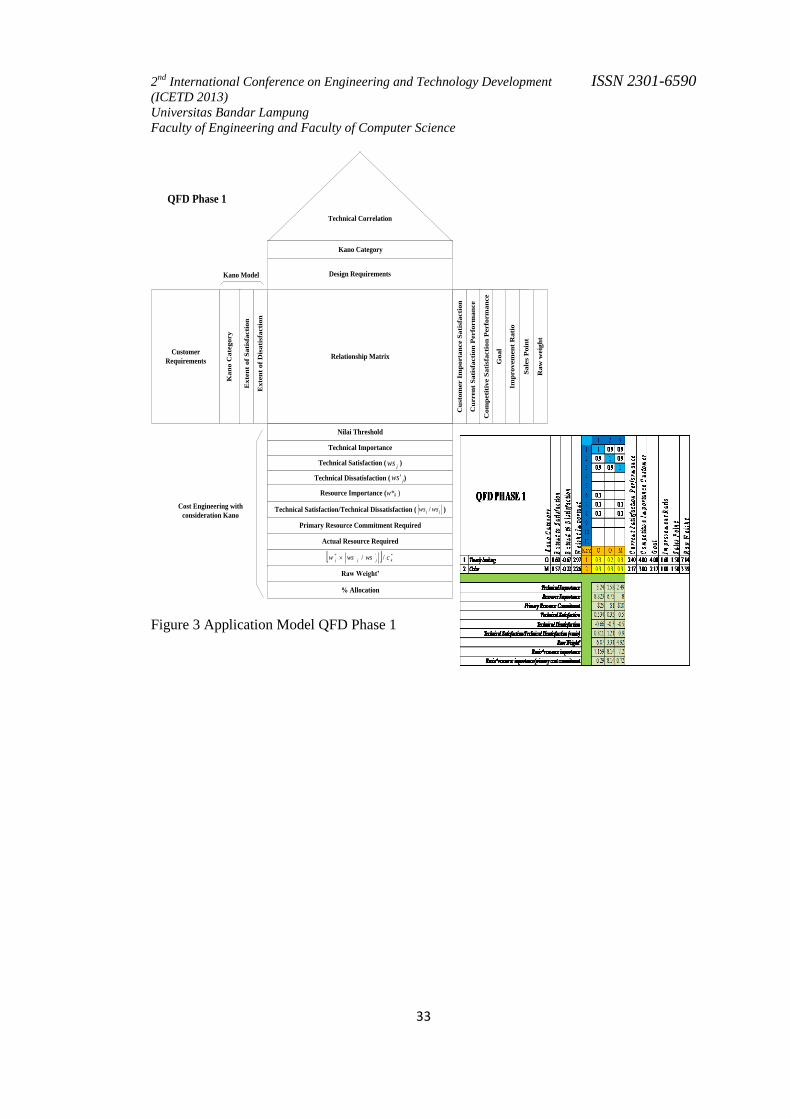
QFD Phase 1
Figure 3 Application Model QFD Phase 1
2nd
International Conference on Engineering and Technology Development
(ICETD 2013)
Universitas Bandar Lampung
Faculty of Engineering and Faculty of Computer Science
34
ISSN 2301-6590
1.2
Relationship MatrixDesign Requirements
Kano Category
Technical Importance
Technical Satisfaction ( )
Primary Resource Commitment Required
Actual Resource Required
% Allocation
Nilai Threshold
Cu
sto
mer I
mp
orta
nce S
ati
sfa
cti
on
Cu
rren
t S
ati
sfa
cti
on
Perfo
rm
an
ce
Co
mp
eti
tiv
e S
ati
sfa
cti
on
Perfo
rm
an
ce
Ex
ten
t o
f S
ati
sfa
cti
on
Ex
ten
t o
f D
isa
tisf
acti
on
Go
al
Imp
ro
vem
en
t R
ati
o
Sa
les
Po
int
Cost Engineering with
consideration Kano
Model Kano
Technical Correlation
Part CharacteristicsK
an
o C
ate
go
ry
Technical Dissatisfaction ( )
Resource Importance (w*k )
Technical Satisfaction/Technical Dissatisfaction ( )
Ra
w w
eig
ht
jws
jws '
'/ jj wsws
*'* // kjjj cwswsw
Raw Weight’
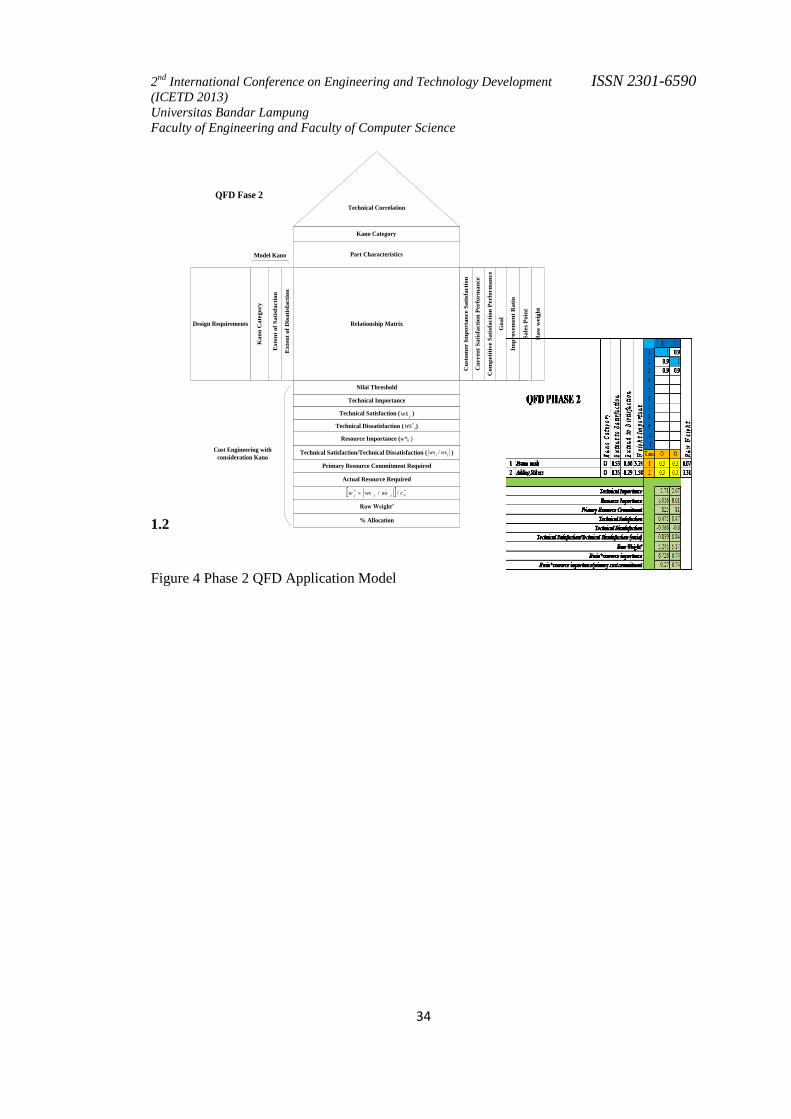
QFD Fase 2
Figure 4 Phase 2 QFD Application Model

2nd
International Conference on Engineering and Technology Development
(ICETD 2013)
Universitas Bandar Lampung
Faculty of Engineering and Faculty of Computer Science
35
ISSN 2301-6590
Relationship Matrix
Part
Characterist
ics
Kano Category
Technical Importance
Technical Satisfaction ( )
Primary Resource Commitment Required
Rasio*resource importance
Rasio*MC-AC Importance
Primary Manufacturing-Assembly Cost (MC-AC)
Cu
sto
mer
Im
po
rta
nce
Sa
tisf
act
ion
Cu
rren
t S
ati
sfa
ctio
n P
erfo
rma
nce
Co
mp
etit
ive
Sa
tisf
act
ion
Per
form
an
ce
Ex
ten
t o
f S
ati
sfa
ctio
n
Ex
ten
t o
f D
isa
tisf
act
ion
Go
al
Imp
rov
emen
t R
ati
o
Sa
les
Po
int
Kano
Model
Technical Correlation
Process ParameterK
an
o C
ate
go
ry
Technical Dissatisfaction ( )
Resource Importance (w*k )
Technical Satisfaction/Technical Dissatisfaction ( )
Ra
w w
eig
ht
jws
jws '
'/ jj wsws
Rasio*resource importance/primary cost commitment
Raw Weight’
Ass
emb
y O
per
ati
on
Co
st
Ass
emb
ly O
per
ati
on
Tim
e
Technical Manufacturing-Assembly Cost (MC-AC)
Ma
nu
fact
ure
Op
era
tio
n C
ost
Ma
nu
fact
ure
Op
era
tio
n T
ime
Rasio* MC-AC Importance/ Primary MC-AC
Technical Manufacturing-Assembly Time (MT-AT)
Primary Manufacturing-Assembly Time (MT-AT)
Rasio*MT-AT Importance
Rasio* MT-AT Importance/ Primary MT-AT
Output/ hours
Working Time/ hours
Worker/ hours
DFM DFA
Phase 3
Manufacturing
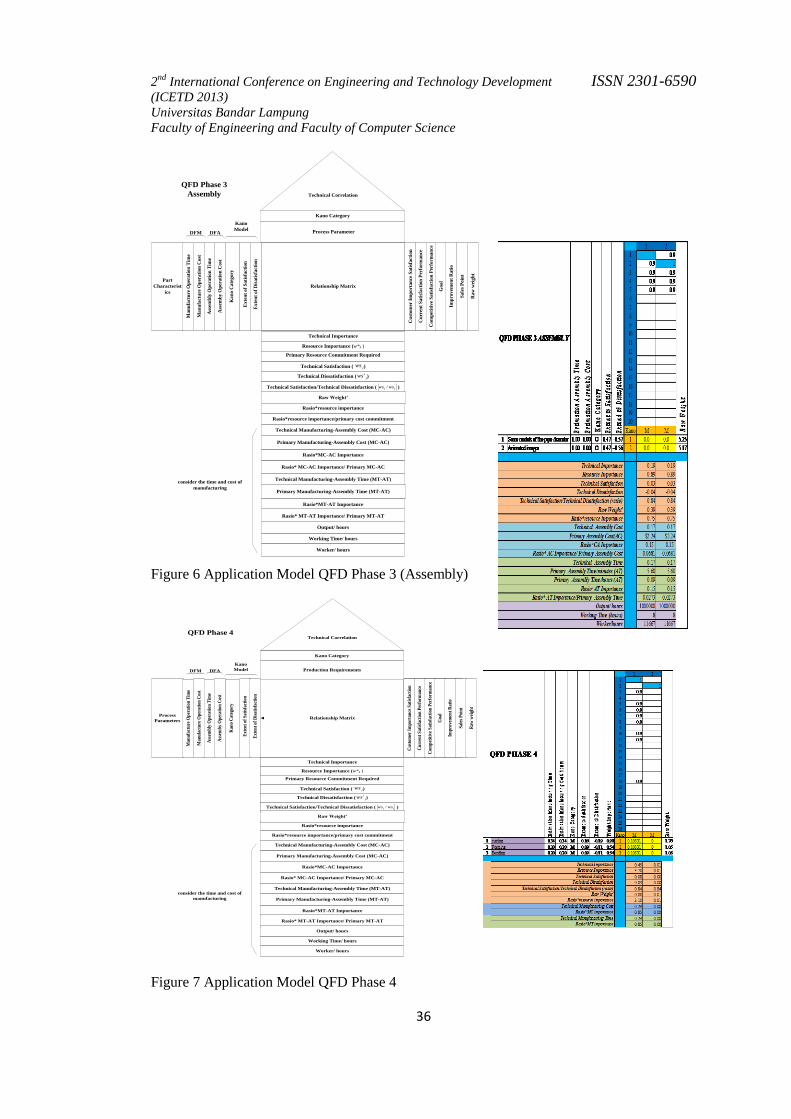
consider the time and cost of
manufacturing
Figure 5 Application Model QFD Phase 3 (Production)
2nd
International Conference on Engineering and Technology Development
(ICETD 2013)
Universitas Bandar Lampung
Faculty of Engineering and Faculty of Computer Science
36
ISSN 2301-6590
Relationship Matrix
Part
Characterist
ics
Kano Category
Technical Importance
Technical Satisfaction ( )
Primary Resource Commitment Required
Rasio*resource importance
Rasio*MC-AC Importance
Primary Manufacturing-Assembly Cost (MC-AC)
Cu
sto
mer
Im
po
rta
nce
Sa
tisf
act
ion
Cu
rren
t S
ati
sfa
ctio
n P
erfo
rma
nce
Co
mp
etit
ive
Sa
tisf
act
ion
Per
form
an
ce
Ex
ten
t o
f S
ati
sfa
ctio
n
Ex
ten
t o
f D
isa
tisf
act
ion
Go
al
Imp
rov
emen
t R
ati
o
Sa
les
Po
int
consider the time and cost of
manufacturing
Kano
Model
Technical Correlation
Process ParameterK
an
o C
ate
go
ry
Technical Dissatisfaction ( )
Resource Importance (w*k )
Technical Satisfaction/Technical Dissatisfaction ( )
Ra
w w
eig
ht
jws
jws '
'/ jj wsws
Rasio*resource importance/primary cost commitment
Raw Weight’
Ass
emb
y O
per
ati
on
Co
st
Ass
emb
ly O
per
ati
on
Tim
e
Technical Manufacturing-Assembly Cost (MC-AC)
Ma
nu
fact
ure
Op
era
tio
n C
ost
Ma
nu
fact
ure
Op
era
tio
n T
ime
Rasio* MC-AC Importance/ Primary MC-AC
Technical Manufacturing-Assembly Time (MT-AT)
Primary Manufacturing-Assembly Time (MT-AT)
Rasio*MT-AT Importance
Rasio* MT-AT Importance/ Primary MT-AT
Output/ hours
Working Time/ hours
Worker/ hours
DFM DFA
QFD Phase 3
Assembly
Figure 6 Application Model QFD Phase 3 (Assembly)
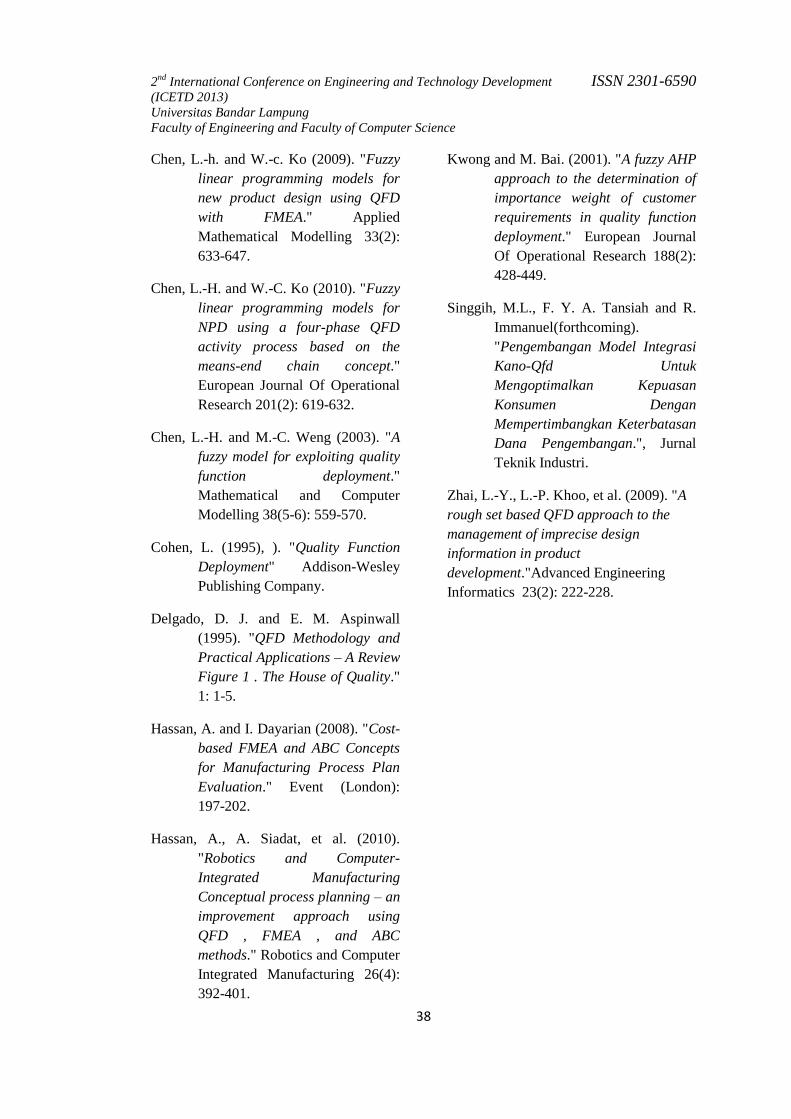
Relationship MatrixProcess
Parameters
Kano Category
Technical Importance
Technical Satisfaction ( )
Primary Resource Commitment Required
Rasio*resource importance
Rasio*MC-AC Importance
Primary Manufacturing-Assembly Cost (MC-AC)
Cu
stom
er I
mp
orta
nce
Sat
isfa
ctio
n
Cu
rren
t S
atis
fact
ion
Per
form
ance
Com
pet
itiv
e S
atis
fact
ion
Per
form
ance
Ext
ent
of S
atis
fact
ion
Ext
ent
of D
isat
isfa
ctio
n
Goa
l
Imp
rove
men
t R
atio
Sal
es P
oin
t
Technical Correlation
Production Requirements
Kan
o C
ateg
ory
Technical Dissatisfaction ( )
Resource Importance (w*k )
Technical Satisfaction/Technical Dissatisfaction ( )
Raw
wei
ght
jws
jws '
'/ jj wsws
Rasio*resource importance/primary cost commitment
Raw Weight’
Ass
emb
y O
per
atio
n C
ost
Ass
emb
ly O
per
atio
n T
ime
Technical Manufacturing-Assembly Cost (MC-AC)
Man
ufa
ctu
re O
per
atio
n C
ost
Man
ufa
ctu
re O
per
atio
n T
ime
Rasio* MC-AC Importance/ Primary MC-AC
Technical Manufacturing-Assembly Time (MT-AT)
Primary Manufacturing-Assembly Time (MT-AT)
Rasio*MT-AT Importance
Rasio* MT-AT Importance/ Primary MT-AT
Output/ hours
Working Time/ hours
Worker/ hours
DFM DFA
QFD Phase 4
Kano
Model
consider the time and cost of
manufacturing
Figure 7 Application Model QFD Phase 4

2nd
International Conference on Engineering and Technology Development
(ICETD 2013)
Universitas Bandar Lampung
Faculty of Engineering and Faculty of Computer Science
37
ISSN 2301-6590
5. CONCLUSION
Integration model development
four phase QFD in this research aims to
get engineering characteristics, getting
part characteristics, process parameters
get, get production requirements,
determine the cost and length of time
required to develop the final product and
determine the ratio of cost and time.
Where in this study, the cost and time is
divided into two parts, namely the cost
and time of manufacturing process itself
which of them is the time and cost of the
assembly process. Based on model
development and implementation process
that has been done, it will get the
following conclusion
1) In the first phase of engineering
characteristics is obtained, where the
engineering characteristics used as
input integration framework QFD
and Kano concept in phase one.
Kano theory application will serve as
the basis of grouping customer
requirements and technical
importance so as to know how the
effect of each design requirements on
the level of consumer satisfaction.
2) In the phase two, part characteristics
are obtained, where the part is used
as an input characteristics framework
integration of QFD and Kano
concept in phase two. Kano theory
application will serve as the basis of
grouping design requirements and
technical importance so as to know
how the effect of each part
characteristics on the level of design
requirements.
3) In the third phase, the process
parameters is obtained, which is used
as an input parameter process
integration framework QFD and
Kano concept in phase three. Kano
theory application will serve as the
basis of grouping part characteristics
and technical importance sehingga so
as to know how the effect of each
process parameters on the level of
part characteristics.
4) In the fourth phase of the obtained
production requirements, where
production requirements are used as
input integration framework QFD
and Kano concept in phase four.
Kano theory application will serve as
the basis of grouping parameter
process and technical importance so
as to know how the effect of each
production requirements on the level
of process parameters.
5) To make the kind of bike products
XX at PT. XYZ takes the value of
the manufacturing cost of Rp.
835,842.50, assembly fee of Rp. Rp.
1,659,170.30 and product
development costs amounting to Rp.
1,027,600.00. while the time required
for manufacturing is 6 hours / 1
million output and the time required
for the assembly is at 7.53 hours / 1
million output.
6) The trade off level interest of
expense and the time when the
production of the satisfaction will be
used in accordance with the
conditions of the company at that
time.
6. REFERENCES
Bode, J. and R. Y. K. Fung (1998). "Cost
Engineering with Quality
Function Deployment The Need
For Cost Considerations in
Quality Illustrated Example." 35:
587-590.
Boothroyd., G., Dewhurst, P., and Knight,
W (1985). "Product Design for
Assembly." New York, Boothroyd
Dewhurst, Inc.
Boothroyd, G., Dewhurst, P., and Knight,
W., (1994) "Product Design for
Manufacture and Assembly." New
York, Marcel Dekker, Inc, 1994.
2nd
International Conference on Engineering and Technology Development
(ICETD 2013)
Universitas Bandar Lampung
Faculty of Engineering and Faculty of Computer Science
38
ISSN 2301-6590
Chen, L.-h. and W.-c. Ko (2009). "Fuzzy
linear programming models for
new product design using QFD
with FMEA." Applied
Mathematical Modelling 33(2):
633-647.
Chen, L.-H. and W.-C. Ko (2010). "Fuzzy
linear programming models for
NPD using a four-phase QFD
activity process based on the
means-end chain concept."
European Journal Of Operational
Research 201(2): 619-632.
Chen, L.-H. and M.-C. Weng (2003). "A
fuzzy model for exploiting quality
function deployment."
Mathematical and Computer
Modelling 38(5-6): 559-570.
Cohen, L. (1995), ). "Quality Function
Deployment" Addison-Wesley
Publishing Company.
Delgado, D. J. and E. M. Aspinwall
(1995). "QFD Methodology and
Practical Applications – A Review
Figure 1 . The House of Quality."
1: 1-5.
Hassan, A. and I. Dayarian (2008). "Cost-
based FMEA and ABC Concepts
for Manufacturing Process Plan
Evaluation." Event (London):
197-202.
Hassan, A., A. Siadat, et al. (2010).
"Robotics and Computer-
Integrated Manufacturing
Conceptual process planning – an
improvement approach using
QFD , FMEA , and ABC
methods." Robotics and Computer
Integrated Manufacturing 26(4):
392-401.
Kwong and M. Bai. (2001). "A fuzzy AHP
approach to the determination of
importance weight of customer
requirements in quality function
deployment." European Journal
Of Operational Research 188(2):
428-449.
Singgih, M.L., F. Y. A. Tansiah and R.
Immanuel(forthcoming).
"Pengembangan Model Integrasi
Kano-Qfd Untuk
Mengoptimalkan Kepuasan
Konsumen Dengan
Mempertimbangkan Keterbatasan
Dana Pengembangan.", Jurnal
Teknik Industri.
Zhai, L.-Y., L.-P. Khoo, et al. (2009). "A
rough set based QFD approach to the
management of imprecise design
information in product
development."Advanced Engineering
Informatics 23(2): 222-228.