FOUR FACTS CONCERNING COMPETITION IN U.S. GENERIC ...
44
NBER WORKING PAPER SERIES FOUR FACTS CONCERNING COMPETITION IN U.S. GENERIC PRESCRIPTION DRUG MARKETS Rena M. Conti Ernst R. Berndt Working Paper 26194 http://www.nber.org/papers/w26194 NATIONAL BUREAU OF ECONOMIC RESEARCH 1050 Massachusetts Avenue Cambridge, MA 02138 August 2019 Research support from the National Institutes of Health, Grant R01AG043560 (Berndt), and from the American Cancer Society and the Commonwealth Fund (Conti) is gratefully acknowledged. Much of the research reported here took place when Ms. Conti was Associate Professor at the University of Chicago. Mr. Berndt and Ms. Conti acknowledge research assistance from Steven J. Murphy and Hyun Moh (John) Shin. Any opinions and findings expressed here are those of the authors, and are not necessarily those of the institutions with whom they are affiliated, the research sponsors, the data vendor, or the National Bureau of Economic Research. NBER working papers are circulated for discussion and comment purposes. They have not been peer-reviewed or been subject to the review by the NBER Board of Directors that accompanies official NBER publications. © 2019 by Rena M. Conti and Ernst R. Berndt. All rights reserved. Short sections of text, not to exceed two paragraphs, may be quoted without explicit permission provided that full credit, including © notice, is given to the source.
Transcript of FOUR FACTS CONCERNING COMPETITION IN U.S. GENERIC ...

NBER WORKING PAPER SERIES
FOUR FACTS CONCERNING COMPETITION IN U.S. GENERIC PRESCRIPTIONDRUG MARKETS
Rena M. ContiErnst R. Berndt
Working Paper 26194http://www.nber.org/papers/w26194
NATIONAL BUREAU OF ECONOMIC RESEARCH1050 Massachusetts Avenue
Cambridge, MA 02138August 2019
Research support from the National Institutes of Health, Grant R01AG043560 (Berndt), and from the American Cancer Society and the Commonwealth Fund (Conti) is gratefully acknowledged. Much of the research reported here took place when Ms. Conti was Associate Professor at the University of Chicago. Mr. Berndt and Ms. Conti acknowledge research assistance from Steven J. Murphy and Hyun Moh (John) Shin. Any opinions and findings expressed here are those of the authors, and are not necessarily those of the institutions with whom they are affiliated, the research sponsors, the data vendor, or the National Bureau of Economic Research.
NBER working papers are circulated for discussion and comment purposes. They have not been peer-reviewed or been subject to the review by the NBER Board of Directors that accompanies official NBER publications.
© 2019 by Rena M. Conti and Ernst R. Berndt. All rights reserved. Short sections of text, not to exceed two paragraphs, may be quoted without explicit permission provided that full credit, including © notice, is given to the source.

Four Facts Concerning Competition in U.S. Generic Prescription Drug MarketsRena M. Conti and Ernst R. BerndtNBER Working Paper No. 26194August 2019JEL No. I10,L10,L65
ABSTRACT
We establish four facts concerning competition among U.S. generic drug suppliers, using IQVIA’s National Sales Perspective™ 2004Q4 – 2016Q3 data. We define a unique product market (“molform”), consisting of the combination of a molecule active ingredient and a route of administration formulation, aggregated over different dosages and strengths. We find: (i) supply exhibits substantial churning in entrants and exits; (ii) volume-weighted use concentrates in older generic molform cohorts; (iii) the extent of competition is greatest for the oldest molform cohorts and is smallest for the youngest molform cohorts. With a median of one competitor, the extent of competition in the youngest molform cohort is very limited; and (iv) supplier-molform annual revenues are typically small, are largest for relatively young drugs, but are heavily right skewed. These four facts provide an empirical platform on which to construct and empirically evaluate hypotheses regarding generic drug market structure, performance, and possible policy reforms.
Rena M. ContiBoston UniversityQuestrom School of BusinessDepartment of Markets, Public Policy and Law595 Commonwealth AveBoston, MA [email protected]
Ernst R. BerndtMIT Sloan School of Management100 Main Street, E62-533Cambridge, MA 02142and [email protected]

4
I. INTRODUCTION
Off-patent ‘generic’ prescription drugs are a dominant
component of the United States’ medicinal armamentarium. In
2017, 90 percent of retail and mail order prescriptions in the
United States (U.S.) were dispensed as generic drugs, and for
those molecules for which a generic was available, the generic
penetration rate was 97 percent (M. L. Aitken and Kleinrock
2018). Vigorous demand for generic products is buttressed by
state laws and regulations requiring generic substitution when
available, with limited exceptions.
The U.S. Food and Drug Administration (FDA) requires
manufacturers to obtain approval to market a drug. On-patent
‘branded’ prescription drugs are marketed under the pioneer’s
FDA approved New Drug Application (NDA) that specifies its
chemical composition, safety and efficacy in treating disease,
and manufacturing procedures to comply with good manufacturing
practices. Generic competition with a branded drug occurs after
the branded product has lost patent or market exclusivity. FDA
approval of a generic manufacturer’s Abbreviated New Drug
Application (ANDA) requires its sponsor to establish
pharmaceutical and bioequivalence to the brand and compliance
with good manufacturing practices; establishing safety and
efficacy of the generic is not required. Thus, once generics
are approved and certified by the FDA, competition among them,

5
and between them and the brand, primarily involves price and
assured availability and only minimally entails quality.
Observed differences between generic and brand pricing are
a function of several factors. First, the development process
of generic drugs is generally less costly than for the brand.
Generic manufacturers also exploit technological developments
and cost efficiency improvements since the original product was
approved, enabling the generic manufacturer to attain lower
variable production costs. Consequently, generics are
frequently considered to be a commodity-type product with low
marginal costs.
Second, like all consumer products, the number of unique
competitors marketing a product affects its price. A
substantial existing literature documents the marginal impact of
additional numbers of generic entrants on generic price in the
24 months following initial loss of exclusivity (LOE) in largely
orally formulated branded drugs (Berndt and Aitken 2011; Berndt
and Newhouse 2012). Other research finds the extent of generic
entry in the 24 months after LOE is in large part determined by
pre-LOE sales volume (higher sales volume pre-LOE is associated
with more entry post-LOE) and by product formulation (less entry
among non-orally formulated drugs compared to oral
formulations)(Conti and Berndt 2014).

6
However, despite the very robust competitive entry and
price competition exhibited by commonly used drugs in the 24
months post-LOE, not all post-LOE pioneer drugs face competition
from generic competitors. Post-LOE entry by generic competitors
may be frustrated or forestalled by the brand through various
“pay for delay” agreements, or by successful line extension
launches by the brand manufacturer (Drake, Starr, and McGuire
2015; McGuire et al. 2016; Drake and McGuire 2016). Various
recent reports have raised questions regarding the adequacy of
supplier competition in mature generic drug markets years after
initial LOE. Government investigations have focused on factors
associated with drug shortages involving largely old, injectible
generic drugs (Conti and Berndt 2014; Collins and McCaskill
2016) and relatively rare, but highly visible, high prices and
dramatic price increases (Collins and McCaskill 2016; Alpern,
Stauffer, and Kesselheim 2014) involving generic drugs facing
little if any market competition (Conti and Berndt 2014; Alpern,
Stauffer, and Kesselheim 2014; Silverman 2014). Former
Commissioner Gottlieb has interpreted the role of the FDA to
include ensuring competition over generic drugs’ lifecycle (U.S.
Food and Drug Administration 2017). The Trump Administration’s
Blueprint to Lower Drug Prices suggested additional efforts the
FDA, the Federal Trade Commission (FTC) and the Department of
Justice (DOJ) might pursue to ensure and sustain robust generic
7
drug competition over time (U.S. Department of Health and Human
Services 2018).
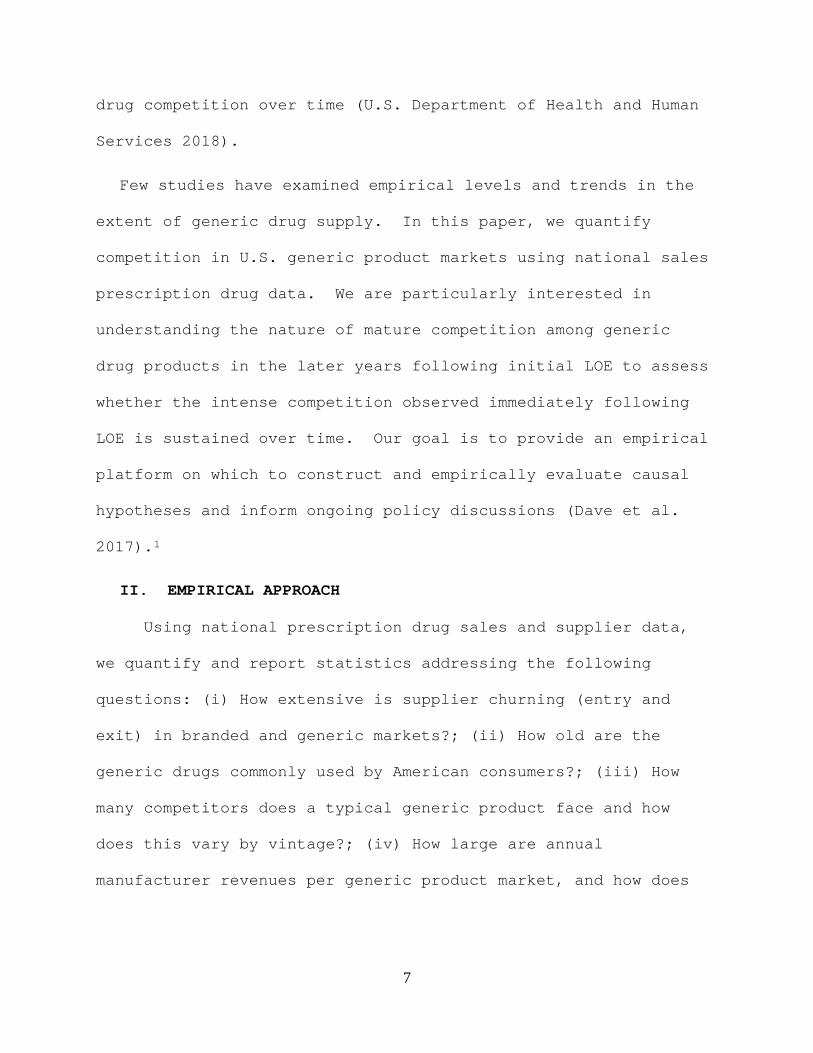
Few studies have examined empirical levels and trends in the
extent of generic drug supply. In this paper, we quantify
competition in U.S. generic product markets using national sales
prescription drug data. We are particularly interested in
understanding the nature of mature competition among generic
drug products in the later years following initial LOE to assess
whether the intense competition observed immediately following
LOE is sustained over time. Our goal is to provide an empirical
platform on which to construct and empirically evaluate causal
hypotheses and inform ongoing policy discussions (Dave et al.
2017).1
II. EMPIRICAL APPROACH
Using national prescription drug sales and supplier data,
we quantify and report statistics addressing the following
questions: (i) How extensive is supplier churning (entry and
exit) in branded and generic markets?; (ii) How old are the
generic drugs commonly used by American consumers?; (iii) How
many competitors does a typical generic product face and how
does this vary by vintage?; (iv) How large are annual
manufacturer revenues per generic product market, and how does

8
this vary by vintage? And (v) How do these relationships change
over time and differ by generic product formulation?
Using commercially available data from IQVIA (formerly IMS
Health and QuintilesIMS) National Sales Perspective™ (NSP)
database, 2004Q4 – 2016Q3, we examine the universe of
prescription drugs sold nationwide (Berndt, Conti, and Murphy
2017). NSP data derive from a projected audit of purchases from
manufacturers or wholesalers to pharmacies, clinics, hospitals
and other distribution outlets, covering 100 percent of the
national unit volume in all major classes of trade and
distribution channels. The data provides information on each
prescription drug by specific chemical and brand name,
formulation and name of the drug’s labeler (FDA’s terminology
for the holder of the drug’s NDA or ANDA) which we interpret
here as the name of a given drug’s manufacturer.2 The branded
status of a drug is a variable assigned by NSP quarterly to
account for loss of patent exclusivity and generic entry over
time. NSP includes ‘branded’ drugs - those on some patent or
other exclusivity and sold by only one manufacturer – and
‘generic’ or ‘biosimilar’ drugs – those with LOE and sold by one
or more manufacturers. NSP distinguishes between ‘oral’,
‘injectible’ and ‘other’ product formulations. ‘Other’ products
include drugs formulated as topicals and inhalants.

9
We define product markets at the molecule-formulation
level, “molform”. This product market definition takes a
molecule (e.g., atorvastatin) and aggregates up over the various
strengths of its dosage forms (e.g., over 10, 20, 40 and 80 mg
strengths of an oral tablet). Different forms of a molecule
(e.g., injectibles and oral tablets) constitute different
‘molforms’ and consequently different product markets. This
definition implies that different manufacturers selling the same
molform are competing in the same product market. It also
implies different manufacturers selling different molecules that
are used for the same or similar clinical purpose are not
competing in the same product market. For example, the various
oral tablet dosage strengths of the statin drug rosuvastatin
(brand name Crestor™) used to treat LDL-cholesterol are in a
different product market than the various oral tablet dosage
strengths of the statin drug atorvastatin (brand name Lipitor™)
also used to treat LDL-cholesterol.
Consequently, in our empirical framework, product markets
are assumed to exhibit significant within market cross-price
substitutability but limited between market cross-price
substitutability. This definition generally conforms to product
market definitions adopted by the FTC in enforcing its
horizontal merger guidelines jointly developed with the DOJ
(Whinston 2007). However, it is important to note that this

10
economic price-substitutability defined market definition may
not conform to product market conceptions used in clinical
practice. For example, the statin drugs rosuvastatin and
atorvastatin might be considered by some physicians as being
clinically substitutable, although our approach deems them to be
in separate product markets.
Additional details regarding variable definitions and analyses
NSP defines a drug as being “generic” at the quarter-year
the branded molform loses patent or other exclusivity. The data
vendor’s assignment of ‘generic’ to a molform does not imply
that the product faces intra-molform competition from another
manufacturer. There are two types of manufacturers marketing
‘generic’ molforms in our sample: manufacturers marketing the
molform under the branded manufacturer’s FDA approved NDA and
ANDA. NSP designates the former ‘branded’. Branded drugs are
marketed either by the originator branded manufacturer or
through a license to another manufacturer (e.g., Pfizer holds
the NDA to market the molform EpipenTM and Pfizer has licensed to
Mylan the right to market EpipenTM. Mylan is the sole
manufacturer of EpipenTM in our sample). The latter are commonly
termed in the gray literature and in legal proceedings as
‘authorized generics’(Berndt et al. 2007). NSP also designates a
branded drug with LOE and facing same-molecule generic
competition as a “branded generic” drug. ‘Branded generics’

11
include molforms that are slight reformulations of the
originator product or combine the originator molecule with
another already generic molecule(s) under the originator’s NDA
(so-called supplemental NDA). In our empirical framework, we
enumerate brands, branded generics and generics available post-
LOE in our manufacturer count of a given product market and
alternative estimates of within product market size. Branded
generics and generics are both considered ‘generics’ in our
analysis.
Our principal metrics for analyses are: (1) the number of
unique manufacturers of a molform in a quarter-year; (2) the
market size of a molform proxied by its quarterly and annual
number of standard units sales volume and its inflation-adjusted
sales revenues; and (3) two other product characteristics – the
quarter and year of its original U.S. launch date (we term this
drug ‘vintage’)(Lichtenberg 2009), and the product market’s
formulation which we interpret as a measure of its
manufacturer’s fixed and variable costs of production.
As a measure of sales volume, NSP reports “standard units”
measuring the number of smallest dosage form single items (such
as vials, syringes, bottles of tablets/capsules) contained in a
unit or shipping package purchased by pharmacies or other
distribution outlets. These units are ‘standardized’ to
approximate per prescription volume comparisons between orally

12
formulated and non-orally formulated drugs. Although “standard
unit” is an inherently ambiguous metric, we are unaware of any
better or more commonly utilized metric of drug product volume
sold nation-wide (Berndt and Dubois 2016).
The “dollar sales” reported by NSP is the total amounts
paid for purchases of a molform from a specific manufacturer by
quarter, converted into 2016Q1 U.S. dollars using the Gross
Domestic Implicit Price Deflator, indexed to 1.000 in 2016Q1
(“Federal Reserve Board Economic Data” 2018). The invoice-based
dollar metrics reflect the amounts paid by retail pharmacies,
hospitals and clinics, whether purchased directly from a
manufacturer or indirectly via a wholesaler or chain warehouse.
Invoice line item discounts are included, but prompt-payment,
bottom-line invoice and 340B discounts are excluded (Dusetzina et
al. 2017; M. Aitken et al. 2016). Drug rebates paid by the
manufacturer to an insurer or intermediary are not reflected in
these invoiced revenues and are generally not publicly
available. To the extent sales from wholesalers include
wholesaler margins and exclude off-invoice rebates paid by
manufacturers to pharmaceutical benefit managers (PBMs), third
party payers, pharmacies and insurers, the NSP data overstate
net revenues received by manufacturers.
NSP contains two variables denoting “manufacturers”, “Corp”
and “Mnf”. “Corp” is the alphanumeric name of the corporation,

13
including its subsidiaries, identified on the sponsor-owned-FDA-
approved label appearing in the Orange Book (the NDA or ANDA
applicant), while “Mnf” is the product’s manufacturer, such as
the “parent” corporation of a multi-corporation firm. Here we
employ “Mnf” as the principal identity of generic drug supplier,
although we also undertake sensitivity analyses utilizing
“Corp”. Our results are not materially different using “Corp”
rather than “Mnf”.
For each generic molform quarterly observation, we count the
number of unique Mnfs having positive unit volumes during that
quarter. We measure competition in each molform by the number
of distinct manufacturers having positive sales volumes in that
quarter. The number of competitors includes the branded or
branded generic manufacturer for the molform when available.
We consider an entry to occur in the first period in which
the Mnf makes a positive sale in the respective molform market,
following at least one quarter of zero sales. Similarly, we
consider an exit to occur at the last quarter year in which the
Mnf makes a positive sale in the molform market, followed by one
or more quarters of zero sales. When calculating quarterly
entry and exit rates in quarter t, we define the denominator as
the count of Mnfs in quarter t-1 aggregated over all molform-
Mnfs.
14
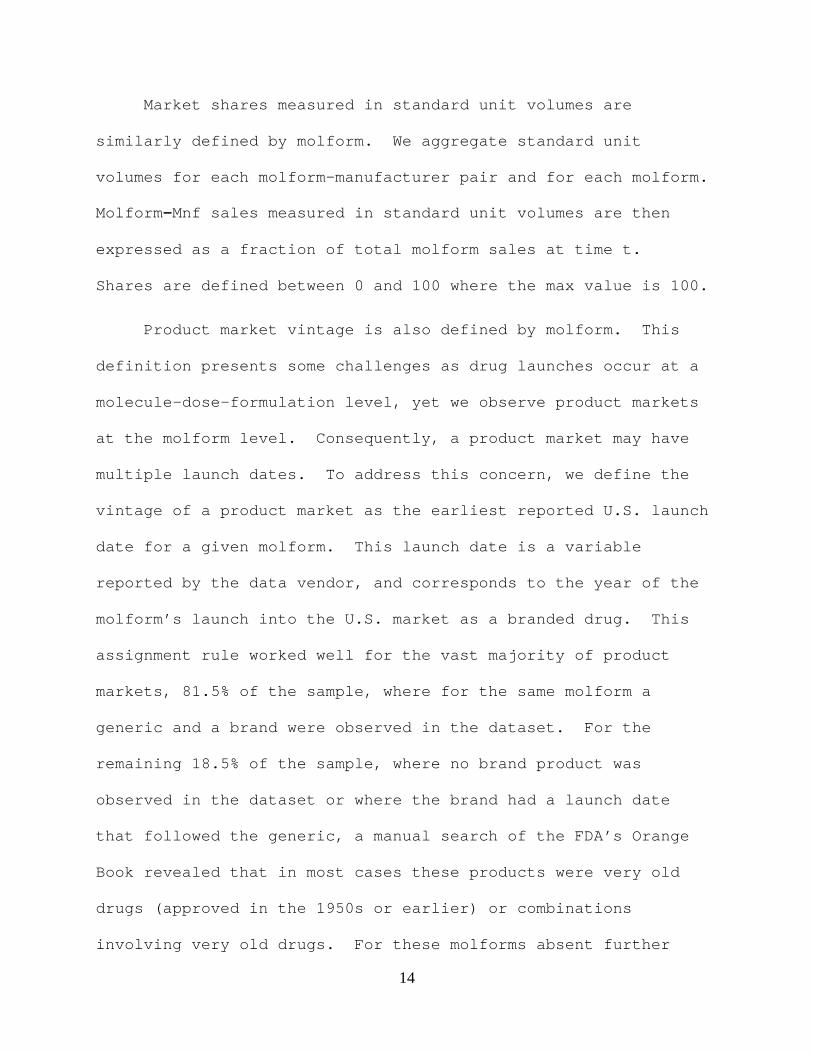
Market shares measured in standard unit volumes are
similarly defined by molform. We aggregate standard unit
volumes for each molform-manufacturer pair and for each molform.
Molform-Mnf sales measured in standard unit volumes are then
expressed as a fraction of total molform sales at time t.
Shares are defined between 0 and 100 where the max value is 100.
Product market vintage is also defined by molform. This
definition presents some challenges as drug launches occur at a
molecule-dose-formulation level, yet we observe product markets
at the molform level. Consequently, a product market may have
multiple launch dates. To address this concern, we define the
vintage of a product market as the earliest reported U.S. launch
date for a given molform. This launch date is a variable
reported by the data vendor, and corresponds to the year of the
molform’s launch into the U.S. market as a branded drug. This
assignment rule worked well for the vast majority of product
markets, 81.5% of the sample, where for the same molform a
generic and a brand were observed in the dataset. For the
remaining 18.5% of the sample, where no brand product was
observed in the dataset or where the brand had a launch date
that followed the generic, a manual search of the FDA’s Orange
Book revealed that in most cases these products were very old
drugs (approved in the 1950s or earlier) or combinations
involving very old drugs. For these molforms absent further
15
information, we faced the choice of identifying the product
molform launch date as the earliest of (i) the launch date of
the generic recorded in NSP (‘Option 1’), or (ii) the launch
date of the brand even if NSP indicated the launch date of the
brand occurred after that of the generic (‘Option 2’). In
operationalizing these options, we found Option 1 always entails
a greater age than Option 2, with the size of the age difference
being small and stable. We chose to use Option 2 for the main
analysis. In sensitivity analyses, we used the Option 1
definition of product market vintage and reran all analyses.
There were no material differences in results.
We identify five vintages among molform drug markets and
assign each molform to one of five vintage cohorts in each year:
< 15 years; 15-19 years; 20-24 years; 25-34 years; and 35+
years. Thus, in 2004, the youngest cohorts contain products
launched before 2004 – relatively recent, newly generic products
- while the oldest set of cohorts in 2004 includes molforms
launched before 1969.
III. RESULTS
Sample Descriptive Statistics
517-652 manufacturers sold 1982-2655 unique branded and
generic molforms between 2004-2016 (Table 1). The number of
unique manufacturers and the number of unique molforms increased

16
between 2004 and 2016. In all years, about half of unique
molforms are oral (50%), the remainder are split between
injectible (22%) and ‘other’ formulated drugs (27%).
Approximately two thirds of our full sample of 4,289 molforms
(including non-unique molforms) are generics, the remainder are
brands.
INSERT TABLE 1
The 2721 generic molforms in our sample can be further
disaggregated into: (i) markets with a branded product but no
branded generic (n=801); (ii) markets with a branded generic but
no branded product (n=334); and (iii) markets with no brand and
no branded generic (n=1586). Thus, generic drug markets with no
branded competition are the most common generics in our sample
and generic markets with a branded generic but no brand, are the
least common in the sample. Moreover, generic molform markets
with only a brand (n=1568 from Table 1) occur with about the
same frequency in our data as markets with no brand and no
branded generic (n=1586). In total, the sample includes 334
molform markets with a branded generic, 2387 (801 + 1586)
generic markets with no branded generic, and 1568 branded
markets with no generic and no branded generic.
Brands comprise a larger share of annual sales revenue
compared to generics in all years, but they decrease in

17
importance over time from 83% of annual sales revenue in 2004 to
74% in 2016. While orally formulated generics comprise the
largest category of generic sales revenue in all years, this
share declines from 67% in 2004 to 49% in 2016. At the same
time, injectible and other formulated generic drugs become
increasingly important to annual sales revenue: injectible sales
revenue increase from 23% of total in 2004 to 38% in 2016 and
other sales revenue increases from 10% in 2004 to 13% in 2016.
The relatively rapid growing share of injectibles likely
reflects the increasing launch and use of small molecule
specialty drugs and biologics over our study period.
Finally, the descriptive statistics of standard unit
volumes are opposite that of revenue shares. While branded and
generic revenue shares average 76% and 24% between 2004 and
2016, branded standard unit volume shares average 23% and 77%,
respectively; both generic volume and generic revenue shares
increase over time, while those for brands decline. In terms of
formulations of total standard unit volumes, oral molforms
steadily dominate at 78%, others constitute a stable 21%, and
injectibles account for only 1%.
Figure 1 reports generic product market ages over our study
period. We find that the average generic drug age rises over
our study time period from approximately 20 years in 2004 to 25

18
years in 2016. Oral drugs match the overall trend, whereas non-
oral drugs do not: injectible drugs exhibit an average age of
approximately 18 years in 2004 and climb to 26 years in 2016.
Other drugs are younger than oral and injectible drugs
(approximately 15 years in 2004), appear to become slightly
younger by 2013 and then age slightly back to about 17 years by
2016.
INSERT FIGURE 1
With these drug characteristics as background, we now
present four facts involving more disaggregated statistics on
the sample.
FACT 1: Branded and Generic Drug Products Exhibit Substantial
Churning (Entry and Exit)
Manufacturer entry and exit in drug markets is robust,
particularly among generics. Table 2 displays quarterly exit
and entry rates separately for branded and generic product
markets. The numbers in the cells are percentages and each
percentage point corresponds to about 60-70 absolute quarterly
entrants or exits. On average, entry rates are about 3 percent
for generics, 1 percent for brands, and for exit rates, about 2
percent for generics and 1 percent for brands. Entry rates in
both branded and generic product markets are greater than exit
rates and increase over time, but recently entry rates have
fallen and exit rates have increased.

19
INSERT TABLE 2
Greater entry/exit upheaval and churning appears to occur
in generic compared to branded drug markets. Specifically,
total quarterly churn (entry plus exit) rates are non-trivial
and exhibit relative stability at about 4 to 5 percent, but the
entry vs. exit composition differs between branded and generic
product markets: branded entry rates are slightly U-shaped over
time, while branded exit rates fall until about 2013 and then
increase thereafter. In contrast, generic entry rates increase
from 2006 until 2013, and then decrease, while generic exit
rates generally increase until 2011, and are flat thereafter.
The total brand plus generic entry rate falls from about 6
percent in 2004 to under 4 percent in 2016, while the total
brand plus generic exit rate increases from about 3 percent in
2004 to 4 percent in 2011, and then falls to about 3.5 percent.3
Any observed entry breaks in Table 2 occur between 2011 and
2013, coinciding with the “patent cliff” in 2011-2012 as a large
number of “blockbuster” drugs lost patent and other
exclusivities, and implementation of Generic Drug User Fee
Amendment Acts (GDUFA-I) in 2013 (Berndt, Conti, and Murphy
2018). While the difference between brand and generic entry
rates is much smaller in 2016 than earlier, the difference in
20
brand and generic exit rates is observed to increase
substantially beginning around 2011.
FACT 2: Generic Drugs Commonly Sold in the U.S. are Increasingly
Older Products
In Figure 2, we report volume-weighted shares for each
molform in the five vintage cohorts. In all years, the greatest
volume share is achieved by the two oldest cohorts of generic
drugs – molforms age 25 through 34 years and molforms aged 35
years and older. In addition, volume shares of these oldest
products have increasingly dominated domestic generic markets.
Specifically, the sum of volume shares attained by the two
oldest vintage cohorts of generic drugs was about 52 percent in
2004 and almost 75 percent by 2016. Moreover, around 2009, the
volume shares of molforms aged 25 through 34 years appeared to
dramatically decrease in volume, while those aged 35 and older
increased in volume.
INSERT FIGURE 2
The volume share of the youngest generic product markets is
not only the smallest of the five vintage cohorts, it appears to
be getting even smaller over time; in 2004 the volume share of
generic product markets under 15 years was about 9 percent, in
subsequent years it rose slightly to about 10 percent, and by
2016 it had fallen to less than 3 percent. Volume shares

21
attained by the second youngest cohort of generic product
markets (15-19 years) did not fare much better, beginning at
about 14 percent in 2004, increasing to just over 18 percent in
2010, and then falling back to about 9 percent in 2016. The
volume share of the middle aged generic product markets (ages
20-24) was generally stable after 2006, increasing slightly from
about 13 percent in 2006 to about 16 percent in 2016.
In summary, newly genericized drug products have not been
that successful in penetrating U.S. generic markets. This is in
rather marked contrast to the older cohorts of generic drug
whose U.S. volume shares have grown quite steadily over time.
Finally, as seen in Appendix Figure A1 these vintage trends
in volume shares observed over all formulations are similar to
those occurring for orally formulated molforms. In contrast,
the oldest cohorts among the injectible and especially the other
molforms do not increasingly dominate volume shares, but instead
it is the second oldest and middle age vintage cohorts among
these formulated generic drug products that increase in volume
share over time. The youngest cohorts (< 15 years) fare the
poorest in garnering volume market share overall and across each
of the product formulations.

22
FACT 3: Competition in Generic Molform Markets is Typically
Limited and is More Robust Among Older Compared to Younger
Product Markets
We calculate the mean and interquartile range of number of
manufacturers by molform vintage cohort, and display these
calculated values in Table 3.
INSERT TABLE 3
As measured by means (Table 3), competition among generic
manufacturers is most intense for the oldest cohorts of generic
drugs, and least intense for the youngest generic drug cohorts.
At about 7, the mean number of manufacturers for the oldest
drugs (35+ years) is larger than for any other vintage cohort,
and at about 2 manufacturers, it is smaller for the youngest (<
15 years) than for any other vintage cohort. However, for the
oldest (35+ years), second oldest (25-34) and youngest (< 15
years) vintage cohorts the mean number of manufacturers is
falling over time, while for the younger but not youngest (15-19
years) and middle age (20-24 years) generic drugs the mean
number of manufacturers generally increases over time. After
2012, the mean number of competitors in the 15-19 year and 20-24
year vintage cohorts is greater than that for the 25-34 year
cohort. After 2013 the mean number of competitors for the 15-19
and 20-24 year cohorts reaches between 5 and 6, with at 6 the

23
20-24 year cohort facing almost as many competitors as the
oldest (35+ years) cohort.
In each time period, median values for each vintage cohort
are generally smaller than their corresponding mean values.
However, we do observe some differences across vintage cohorts.
The median number of manufacturers in the oldest vintage cohort,
at between 4 and 6, is only slightly smaller than the
corresponding mean number of manufacturers which range from
above 6 to almost 8. In contrast, for the youngest vintage
cohort (< 15 years), the median number of manufacturers is 1
throughout the 2004-2016 time period, while the mean number of
competitor manufacturers is relatively stable at about 2 – twice
the median value. Hence the ratio of mean to median is largest
for the youngest vintage, and smallest for the oldest vintage,
with the other vintages having mean/median ratios in between.
In summary, the extent of competition is greatest for the
oldest cohorts of drugs (35+ years) and is smallest for the
youngest cohort (< 15 years). Indeed, with a median of but 1
competitor, for the youngest cohort the extent of competition is
very limited.
To evaluate whether this characterization of competition
also holds for each molform formulation, in Appendix Table A1 we
report the annualized mean and interquartile range of

24
manufacturer counts in each vintage cohort separately by
formulation.
For the most populous oral formulations, although time
trends are not monotonic, mean numbers of competitors are larger
in 2016 than in 2004 for the three intermediate vintages, but
for the youngest (< 15 years) and oldest (35+ years) vintages
the mean numbers are smaller in 2016 than in 2004. Across all
vintages, the mean number of competitors is largest in the
oldest vintage and smallest in the youngest vintage. In all
vintages, the median number of competitors is less than the
mean, with medians relatively stable in the < 15 year, 25-34
years, and 35+ year vintages, but increasing in the intermediate
15-19 year and 20-24 year vintages.
For injectable formulations, again time trends are not
monotonic, means and medians are quite similar for all vintages,
with the ratio of mean to median evaluated at overall averages
being less than 2 for all vintages.
For other formulations, only for the oldest cohort (35+
years) are time trends in mean and median number of
manufacturers monotonic, with the oldest generic drug vintage
cohort facing a smaller number of competitors over time.

25
FACT 4: Manufacturer Generic Drug Product Market Annual Revenues
are Typically Small, are Largest among Younger Generic Drugs,
but are Heavily Right Skewed
Table 4 reports mean, median and interquartile range of
annual revenues per generic molform-Mnf (in thousands) overall
and by formulation.
We observe that in early years, median annual sales
revenues are $500K-$600K, they rise steadily and by 2016 have
almost tripled to about $1.5 million in 2016. In contrast, the
25th percentile annual sales are relatively stable from 2004
through 2013, ranging between $36K - $56K, but then increase
more sharply, doubling and reaching $110K in 2016. The 75th
percentile annual sales are relatively stable between $4.0 -
$4.7 million through 2010, then increase more rapidly between
2011 and 2013 to about $5.4 - 6.8 million and then hold steady
at about $8 million thereafter.
INSERT TABLE 4
More striking is that in every year mean revenues per
molform-Mnf are at least several times larger than even at the
75th percentile, indicating that sales revenues per molform-Mnf
are extremely right-skewed. In the early years, annual mean
sales revenues were about 2.3 to 2.8 times larger than at the
75th percentile, and even as the 75th percentile level of sales

26
increased sharply in 2011-2013, so too did the mean, which by
2016 was just over $15 million annually.
Again in all three product formulations, sales revenues per
molecule-manufacturer are highly right-skewed, with the
difference between mean and median being the largest in the
other formulation. In all years, injectible generic drug
product markets exhibit larger median, mean and 75Th percentile
annual sales revenue per manufacturer compared to oral and other
formulated drugs. In summary, the aggregate trends in sales
revenue per molecule-manufacturer appear to be driven largely by
orals and injectibles.
Table 5 reports these annual revenue statistics
disaggregated by product market vintage.
INSERT TABLE 5
A striking finding is that while for all vintages except
the youngest, the ratio of mean annual revenues to median annual
revenues, evaluated at the average over all years, ranges
between 12 and 17, indicating substantial skewness. However,
for the youngest cohort – those < 15 years – this mean/median
ratio reaches an astonishing value of about 30. Thus, it is in
the youngest vintage of generic drugs where the dispersion in
annual revenues is relatively largest – a very few recent
vintage generic drugs are extremely successful, but most are

27
not. Indeed, as seen in Table 5, for the youngest vintage,
median annual revenues have fallen by over 50% between 2004 and
2016, from $875,000 to $371,000. In contrast, for the oldest
vintage, between 2004 and 2016 median annual revenues have grown
four-fold – from $351,000 to $1.44 million.
In terms of mean annual revenues, for the three oldest
vintages, there have been steady increases up through 2013-2014
followed either by stable or slightly declining trends. Peak
annual mean revenues occurred earlier for the younger vintages –
in 2006 for the youngest (< 15 years) and in 2011 for the
younger (15-19 years) vintage.
Hence, all generic drug vintage cohorts exhibit substantial
right skewness, and a small number of very successful generic
molforms make mean revenues look much more attractive than
median values. However, it is the younger generic drug market
vintages that display the most enormous heterogeneity in annual
revenue streams. In general but especially in recent years,
older generic vintage drugs have experienced greater revenue
growth than have the younger vintages.
28
IV. DISCUSSION
The four descriptive facts about U.S generic product
markets we report in this study raise several issues important
for further empirical evaluation and policy discussion.
First, we report that considerable product churning (exit
and entry) occurs, with entry rates decreasing and exit rates
increasing in recent years. This raises the question of what
role, if any, the Generic Drug User Fee program has had in
creating barriers to entry and incentives to exit. Berndt,
Conti and Murphy (2018) examined the changing features embodied
in the GDUFA-I (2013) and GDUFA-II (2017) using recently
released public data from the FDA (Berndt, Conti, and Murphy
2018). The analysis of that data yielded three findings: (i)
generic drugs and their base ingredients are increasingly and
overwhelmingly manufactured outside the U.S.; (ii) most ANDA
sponsors hold small portfolios of ANDAs with the median number
being one. However, a small number of ANDA sponsors each holds
hundreds if not thousands of ANDAs. In 2017, the largest 1
percent of ANDA portfolio holders accounted for 5,475 of the
7,966 (68.7 percent) claimed approved ANDAs; (iii) The fee
structure of GDUFA-I (set per drug and per establishment and
levied annually) likely erected barriers to entry, and created
scale and scope economies for incumbent manufacturers. User

29
fees were changed under GDUFA II in part to mitigate these
incentives. The authors hypothesized that the GDUFA I fee
schedule may have created incentives for existing generic
manufacturers to consider exiting drug markets, particularly
when annual product revenues did not outweigh the new fixed
costs imposed by GDUFA I annual fees. The increase in exit
rates reported in this paper is consistent with the observed
recent decline in the number of net active manufacturing
facilities, based on manufacturer voluntarily-supplied data to
the FDA. Future research that examined these questions
empirically could shed light on the effects of regulatory
policies on U.S. generic product markets.
Second, our finding that over the entire 2004-2016 time
period, the number of generic manufacturers per molform is
typically two or smaller across product vintages and
formulations suggests that mature U.S. generic drug markets
should be considered in steady state typically to involve only a
small number of generic competitors. This analysis extends
preliminary research (Berndt, Conti, and Murphy 2017) in which
we reported that aggregated over all generic product vintage
cohorts, the distribution of the number of manufacturers was
right-skewed, with a small number of molforms having extremely
large number of competitors, resulting in the mean number of
competitors being considerably larger than the median.

30
These findings contrast sharply with evidence presented by
previous studies suggesting generic competition is significant,
commonly involving four or more suppliers in the first 24 months
after loss of patent protection and other exclusivities (Berndt
and Aitken 2011; Berndt and Newhouse 2012). The research
findings reported here are also generally consistent with
recently published research based on selected claims data
encompassing a more limited set of generic drug markets (Dave et
al. 2017).
Over the last few years policy makers and the FDA have
raised concerns regarding the adequacy of competition among
selected generic drug markets. These discussions have led to
the FDA implementing policies to encourage more competition
whenever the number of generic competitors is less than three
(U.S. Food and Drug Administration 2017). Our findings suggest
increased FDA scrutiny over markets with limited competition may
be a larger task than commonly appreciated.
Third, we find that the revenues received for a small
number of generic drug products by their manufacturers appears
to have been much larger than for most generic products. The
occurrence of this phenomenon in the last decade suggests the
possibility that relatively high revenue generic drugs might
concentrate among those awarded 180-day exclusivity from

31
successful patent challenges and thus face no or only an
“authorized” generic competitor. Certain older products
enjoying high revenues might be those with no competitors,
slight reformulations of older pioneer products that confer some
advantages to consumers or prescribers, or those benefiting from
price increases during shortages due to temporary exits for
which demand still exists.
From a regulator’s perspective, it could well prove
challenging to sustain or encourage competition in generic drug
markets where the underlying reason for limited suppliers is
very strong brand loyalty to the ‘improved’ line extension
product, or slack demand due to therapeutic obsolescence,
regardless of product vintage. To contribute to a better
understanding of supply dynamics and their amenability to
potential policy intervention, it would be useful if future
research examined in detail revenue outliers (revenues in the
75th percentile or higher and in the 25th percentile or lower)
relative to the mean and median by vintage cohorts and their
characteristics. Another potentially informative investigation
could involve a decomposition into various therapeutic classes,
such as oncology, respiratory, infectious disease, and
neurodegenerative illnesses (Berndt, Conti, and Murphy 2017).

32
Lastly, an intriguing issue raised here relates market
competition to drug price increases. Previous research has
reported high and growing prices among selected generic drugs,
related to a limited number of manufacturers (Collins and
McCaskill 2016; Alpern, Stauffer, and Kesselheim 2014; Silverman
2014). Given the limited and possibly declining generic
molecule competition we observe generally, why have prices for
generic drugs not risen more rapidly than has been observed?
Two hypotheses come to mind. First, the increased
consolidation in recent years from merger and acquisition
activity involving wholesaler purchasers, retail chains,
insurers and PBM firms may have increased demand side buying
power, putting downward pressure on generic manufacturers’
prices. By exercising this increased monopsonistic buying power
and combining it with PBMs’ powerful utilization management
tools, purchasers may increasingly be able to play generic
manufacturers off against each other, intensifying generic price
competition.
Second, it may be that many generic molecule markets are
contestable, whereby firms hold an option to enter or re-enter.
In contestable markets, the threat of entry disciplines
incumbent firms, resulting in pricing outcomes that resemble
highly competitive, multi-manufacturer markets, even when the
number of actual competitors is small.4 Once a generic

33
manufacturer receives an approved ANDA, it can retain it
indefinitely even if it temporarily discontinues producing the
product. The threat of reentry by temporary exiting firms might
facilitate contestability. This possibility and the role of the
Generic Drug User Fee legislation in 2013 and 2017 in affecting
temporary or permanent exit merit more research.
In summary, U.S. generic molecule markets typically
experience substantial entry and exit “churn” rates, generating
surprisingly modest annual revenues (although in recent years a
small number of molform markets have earned substantial revenue
streams). The median number of generic manufacturers in molform
markets is between 2 and 3 indicating that U.S. generic molecule
markets are highly concentrated and that manufacturers typically
face very limited competition. Although much recent attention
has been placed on generic entry and use patterns among newer
generic drugs, the most commonly used generic drug products are
older drugs, many of which launched in the 1990s ‘blockbuster’
era. The research findings reported here suggest that dynamic
patterns of entry, exit, and revenues achieved by generic
prescription drugs in U.S. markets are complex, vary by vintage,
and are worthy of further scrutiny.
34
Notes
1 These authors use MarketScan™ retrospective claims data to examine prices and market competition for drugs classified as either single or multi-source between 2008-2013, excluding entry and exit of new brands, and entry of generics following the brand’s loss of exclusivity between 2008-2013. The data contain retail and mail order pharmacy claims, but likely understate sales through long term care, hospital, and federal facility channels. 2 The FDA’s Orange Book identifies the ANDA applicant, noting the actual manufacturer may differ from the ANDA applicant (also called labeler) due to manufacturing outsourcing to contract manufacturers. The ANDA applicant may differ from the marketer, due to licensing actions. Our use of the term “supplier” should therefore be interpreted as the entity selling and marketing a molecule dosage form. 3 Based on manufacturer-supplied data reported to the FDA, Berndt ER, Conti RM, Murphy SJ, 2018, op. cit., find that the number of net active pharmaceutical ingredient and final dosage form manufacturing facilities has declined between 2013 and 2017. 4 For further discussion on contestable markets, and possible resemblance of US generic drug markets to contestable markets, see Economics Online, Contestable Markets, 2017. Available from: http://www.economicsonline.co.uk/Business_economics/Contestable_markets.html. References Aitken, Murray, Ernst R. Berndt, David Cutler, Michael
Kleinrock, and Luca Maini. 2016. “Has the Era of Slow Growth for Prescription Drug Spending Ended?” Health Affairs 35(9):1595–1603.
Aitken, Murray L., and Michael Kleinrock. 2018. “Medicines Use
and Spending in the U.S.: A Review of 2017 and Outlook to 2022.” Parsippany, NJ: IQVIA Institute for Human Data Science. https://www.iqvia.com/-/media/iqvia/pdfs/institute-reports/medicine-use-and-spending-in-the-us-a-review-of-2017-and-outlook-to-2022.pdf.

35
Alpern, Jonathan D., William M. Stauffer, and Aaron S.
Kesselheim. 2014. “High-Cost Generic Drugs—Implications for Patients and Policymakers.” New England Journal of Medicine 371(20): 1859–1862.
Berndt, Ernst R., and Murray L. Aitken. 2011. “Brand Loyalty,
Generic Entry and Price Competition in Pharmaceuticals in the Quarter Century after the 1984 Waxman-Hatch Legislation.” International Journal of the Economics of Business 18(2): 177–201. http://proxy.uchicago.edu/login?url=http://search.ebscohost.com/login.aspx?direct=true&db=eoh&AN=1262154&site=ehost-live&scope=site.
Berndt, Ernst R., Rena M. Conti, and Stephen J. Murphy. 2017.
“The Landscape of US Generic Prescription Drug Markets, 2004-2016.” National Bureau of Economic Research, Working Paper No. 23640.
———. 2018. “The Generic Drug User Fee Amendments: An Economic
Perspective.” Journal of Law and the Biosciences 5 (1): 103–141.
Berndt, Ernst R., and Pierre Dubois. 2016. “Impacts of Patent
Expiry and Regulatory Policies on Daily Cost of Pharmaceutical Treatments: OECD Countries, 2004-2010.” International Journal of the Economics of Business 23(2): 125–47. https://doi.org/ttps://doi.org/10.1080/13571516.2015.1122969.
Berndt, Ernst R., Richard Mortimer, Ashoke Bhattacharjya, Andrew
Parece, and Edward Tuttle. 2007. “Authorized Generic Drugs, Price Competition, and Consumers’ Welfare.” Health Affairs 26(3): 790–799.
Berndt, Ernst R., and Joseph P. Newhouse. 2012. “Pricing and
Reimbursement in U.S. Pharmaceutical Markets.” In The Oxford Handbook of the Economics of the Biopharmaceutical Industry, Danzon PM, Nicholson S, editors, 201–65. New York, NY: Oxford University Press.
Collins, Susan M., and Claire McCaskill. 2016. “Sudden Price
Spikes in Off-Patent Prescription Drugs, The Monopoly Business Model That Harms Patients, Taxpayers, and the US Health Care System.” 114–429. Washington, DC: U.S. Government Publishing Office.

36
https://www.congress.gov/114/crpt/srpt429/CRPT-114srpt429.pdf.
Conti, Rena M., and Ernst R. Berndt. 2014. “Specialty Drug
Prices and Utilization After Loss of U.S. Patent Exclusivity, 2001-2007.” http://proxy.uchicago.edu/login?url=http://search.ebscohost.com/login.aspx?direct=true&db=eoh&AN=1440021&site=ehost-live&scope=site.
Dave, Chintan V., Aaron S. Kesselheim, Erin R. Fox, Peihua Qiu,
and Abraham Hartzema. 2017. “High Generic Drug Prices and Market Competition: A Retrospective Cohort Study.” Annals of Internal Medicine 167(3):145-151. https://doi.org/10.7326/M16-1432.
Drake, Keith M., and Thomas G. McGuire. 2016. “Stock Price
Evidence For Anticompetitive Effects In The Nexium ‘Reverse-Payment’ Settlement.” Journal of Competition Law & Economics 12(4):735–747.
Drake, Keith M., Martha A. Starr, and Thomas G. McGuire. 2015.
“Do ‘Reverse Payment’ Settlements Constitute an Anticompetitive Pay-for-Delay?” International Journal of the Economics of Business 22(2):173–200.
Dusetzina, Stacie B., Rena M. Conti, L. Yu Nancy, and Peter B.
Bach. 2017. “Association of Prescription Drug Price Rebates in Medicare Part D with Patient Out-of-Pocket and Federal Spending.” JAMA Internal Medicine 177(8):1185–1188.
“Federal Reserve Board Economic Data.” 2018. Federal Reserve
Bank of St. Louis. 2018. https://fred.stlouisfed.org/series/A191RI1Q225SBEA.
Lichtenberg, Frank R. 2009. “International Differences in Cancer
Survival Rates: The Role of New Drug Launches.” International Journal of Healthcare Technology and Management 10(3):138–155.
McGuire, Thomas, Keith Drake, Einer Ethauge, Raymond Hartman,
and Martha Starr. 2016. “Resolving Reverse-Payment Settlements with the Smoking Gun of Stock Price Movements.” Iowa Law Review 101(4):1581–99.
Silverman, Ed. 2014. “Lawmakers Probe ‘Staggering’ Price Hikes
for Generic Drugs.” Wall Street Journal, October 2, 2014.

37
https://blogs.wsj.com/pharmalot/2014/10/02/lawmakers-probe-staggering-price-hikes-for-generic-drugs/.
U.S. Department of Health and Human Services. 2018. “American
Patients First.” Washington, DC: U.S. Department of Health and Human Services. https://www.hhs.gov/sites/default/files/AmericanPatientsFirst.pdf.
U.S. Food and Drug Administration. 2017. “FDA Tackles Drug
Competition to Improve Patient Access: Agency Takes Important Steps under New Drug Competition Action Plan.” U.S. Food and Drug Administration. June 27, 2017. https://www.fda.gov/NewsEvents/Newsroom/PressAnnouncements/ucm564725.htm.
Whinston, Michael D. 2007. “Antitrust Policy Toward Horizontal
Mergers.” In Handbook of Industrial Organization, 3:2369–2440. Amsterdam: North Holland Elsevier.

FIGURE 1: MOLFORM MEAN AGE OVERALL AND BY FORMULATION
SOURCE: Authors’ calculations based on IQVIA’s National Sales Perspective (NSP) database, 2004Q4 – 2016Q3.
FIGURE 2: MOLFORM VOLUME SHARE BY VINTAGE
SOURCE: Authors’ calculations based on IQVIA’s National Sales Perspective (NSP) database, 2004Q4 – 2016Q3. NOTES: Mnf (manufacturer) is the generic supplier. Generics include both multi-source and branded generics. An entry occurs in the first period in which the Mnf has a positive sale in the respective molform market. An exit occurs at the last quarter year in the Mnf has a positive sale in the molform market. The numbers in the cells are percentages, each percentage point corresponds to about 60-70 absolute quarterly entrants or exits.

SOURCE: Authors’ calculations based on IQVIA’s National Sales Perspective (NSP) database, 2004Q4 – 2016Q3.
YEAR # Total # Branded # Generic # Orals # Injectables # Others # MnfsAnnual ($MIL)
Branded (%) Generic (%) Oral (%) Injectible (%) Other (%)Annual (MIL)
Branded (%) Generic (%) Oral (%) Injectible (%) Other (%)
2004 1982 1061 1346 1026 545 411 517 295121 83 17 67 23 10 208351 37 63 77 1 222005 2076 1100 1427 1068 563 445 545 296143 82 18 66 24 10 208342 35 65 76 1 232006 2145 1124 1493 1107 579 459 555 314246 80 20 64 25 10 215277 32 68 77 1 222007 2179 1129 1537 1132 584 463 565 317694 80 20 63 26 11 219504 30 70 77 1 222008 2248 1111 1625 1178 586 484 562 317485 79 21 62 27 11 221111 27 73 77 1 222009 2356 1116 1734 1236 605 515 572 331864 78 22 61 27 12 232081 25 75 77 1 212010 2415 1114 1804 1242 613 560 583 345567 76 24 59 28 12 235300 23 77 78 1 212011 2476 1126 1866 1254 622 600 589 351557 74 26 58 29 13 237492 21 79 78 1 212012 2481 1126 1883 1209 626 646 609 334015 72 28 54 32 14 223919 18 82 78 1 212013 2594 1146 1991 1191 631 772 621 343254 71 29 51 34 15 229928 16 84 78 1 212014 2627 1197 1989 1212 647 768 633 385416 72 28 52 34 14 230897 14 86 78 1 212015 2655 1232 2000 1216 657 782 652 428242 73 27 51 36 13 236742 13 87 78 1 212016 2550 1220 1906 1195 662 693 651 446400 74 26 49 38 13 239074 13 87 78 1 21
Overall 3488 1568 2721 1755 775 958 898 346693 76 24 57 30 13 2721985 23 77 78 1 21
TABLE 1: CHARACTERISTICS OF PRESCRIPTION DRUGS IN ANALYTIC SAMPLEREVENUE STATISTICS VOLUME STATISTICSMOLFORM COUNTS

TABLE 2: CHURN RATE (%) OF ACTIVE MNF-MOLECULE PAIRS OVER ALL FORMULATIONS AMONG GENERICS AND BRANDS
SOURCE: Authors' calculations based on IQVIA NSP data, 2004Q4 - 2016Q3.
Year Quarter Exit Rate (%) Entry Rate (%) Exit Rate (%) Entry Rate (%)2004 Q4 1.61 2.092005 Q1 1.30 4.93 0.73 4.832005 Q2 2.16 3.63 0.64 2.482005 Q3 1.37 3.09 1.19 2.282005 Q4 1.56 3.13 1.28 1.552006 Q1 1.31 3.03 1.44 2.442006 Q2 1.23 2.54 0.46 1.092006 Q3 2.23 2.41 0.54 1.972006 Q4 1.47 2.99 0.81 1.252007 Q1 1.36 2.26 1.25 0.812007 Q2 1.56 2.64 1.26 1.172007 Q3 1.57 3.26 0.90 0.812007 Q4 1.83 2.29 1.34 0.992008 Q1 1.71 3.72 0.72 0.452008 Q2 2.27 2.66 0.90 0.992008 Q3 2.24 3.40 1.82 0.552008 Q4 2.49 2.98 1.94 0.652009 Q1 2.52 2.92 1.21 1.212009 Q2 2.21 3.04 0.65 1.122009 Q3 2.29 3.20 1.50 0.842009 Q4 2.34 3.19 1.87 0.942010 Q1 1.99 2.73 0.95 1.052010 Q2 2.28 3.02 0.58 0.292010 Q3 2.14 2.91 0.76 0.762010 Q4 2.92 3.05 0.38 1.332011 Q1 1.81 2.89 0.95 0.852011 Q2 3.21 3.47 1.41 1.322011 Q3 2.56 2.65 0.76 1.232011 Q4 2.34 2.84 0.75 0.572012 Q1 2.53 3.09 0.85 1.132012 Q2 2.08 3.41 0.85 0.752012 Q3 2.11 3.06 1.03 0.942012 Q4 2.60 3.93 0.84 0.752013 Q1 2.30 4.18 0.28 0.942013 Q2 2.32 3.28 0.82 2.012013 Q3 1.96 2.68 0.82 0.462013 Q4 2.17 2.56 0.36 1.642014 Q1 2.41 2.92 0.90 1.082014 Q2 2.00 2.48 0.45 1.702014 Q3 2.85 2.57 0.97 1.322014 Q4 2.18 2.53 0.61 2.092015 Q1 2.28 3.00 1.29 1.382015 Q2 2.82 2.93 1.04 0.612015 Q3 2.71 2.36 1.38 1.292015 Q4 2.29 2.40 1.35 2.202016 Q1 2.95 2.08 2.37 0.762016 Q2 3.28 2.37 3.79 1.352016 Q3 2.26 0.42
GENERIC BRAND

TABLE 3: MEAN, MEDIAN AND INTERQUARTILE RANGE OF NUMBER OF MANUFACTURERS BY MOLFORM VINTAGE OVER ALL FORMULATIONS
SOURCE: Authors' calculations based on IQVIA NSP data, 2004Q4 - 2016Q3.
YEAR Mean Median 25-pctile 75-pctile Mean Median 25-pctile 75-pctile Mean Median 25-pctile 75-pctile Mean Median 25-pctile 75-pctile Mean Median 25-pctile 75-pctile2004 2.16 1.00 1.00 2.00 3.28 2.00 1.00 4.00 4.59 3.00 1.00 6.00 5.19 4.00 2.00 7.00 7.55 6.00 3.00 11.002005 2.24 1.00 1.00 2.00 3.60 2.00 1.00 5.00 4.81 3.00 1.00 6.00 5.39 4.00 2.00 7.00 7.86 6.00 3.00 11.002006 2.28 1.00 1.00 2.00 3.66 2.00 1.00 5.00 4.63 3.00 1.00 6.00 5.30 3.00 2.00 7.00 7.49 6.00 3.00 11.002007 2.28 1.00 1.00 2.00 4.41 3.00 1.00 6.00 4.21 3.00 1.00 5.00 5.10 3.00 1.00 7.00 7.50 6.00 3.00 11.002008 2.12 1.00 1.00 2.00 4.97 3.00 1.00 7.00 4.35 3.00 1.00 5.00 5.16 3.00 2.00 7.00 7.81 6.00 3.00 11.002009 2.04 1.00 1.00 2.00 5.01 3.00 1.00 7.00 4.20 3.00 1.00 5.00 5.04 3.00 2.00 6.00 7.85 6.00 2.50 11.002010 1.94 1.00 1.00 2.00 5.37 3.00 1.00 8.00 4.09 3.00 1.00 5.00 4.78 3.00 2.00 6.00 6.97 5.00 2.00 10.002011 1.83 1.00 1.00 2.00 5.23 3.00 1.00 7.00 4.36 3.00 1.00 5.00 4.68 3.00 2.00 6.00 6.83 5.00 2.00 10.002012 1.79 1.00 1.00 2.00 5.61 4.00 1.00 8.00 4.95 3.00 1.00 6.00 4.58 3.00 1.00 5.00 6.73 5.00 2.00 9.002013 1.78 1.00 1.00 2.00 5.60 3.00 1.00 8.00 5.28 4.00 1.00 7.00 4.58 3.00 1.00 5.00 6.59 4.00 2.00 9.002014 1.75 1.00 1.00 2.00 5.33 3.00 1.00 8.00 5.48 3.00 1.00 8.00 4.61 3.00 1.00 6.00 6.57 4.00 2.00 9.002015 1.72 1.00 1.00 2.00 5.13 3.00 1.00 7.00 6.47 4.00 2.00 10.00 4.59 3.00 1.00 6.00 6.61 4.00 2.00 9.002016 1.68 1.00 1.00 2.00 4.81 2.00 1.00 6.00 6.01 4.00 1.00 9.00 4.81 3.00 1.00 6.00 6.38 4.00 2.00 9.00
Overall 1.93 1.00 1.00 2.00 4.72 3.00 1.00 6.00 4.78 3.00 1.00 6.00 4.90 3.00 2.00 6.00 6.94 5.00 2.00 10.00
< 15 years 15-19 years 20-24 years 25-34 years 35+ years

TABLE 4: MEAN, MEDIAN AND INTERQUARTILE RANGE OF MOLFORM ANNUAL REVENUES OVER ALL FORMULATIONS AND BY FORMULATION
SOURCE: Authors' calculations based on IQVIA NSP data, 2004Q4 - 2016Q3. NOTES: Revenues collected at the mnf-molform level for each period.
YEAR Mean Median 25-pctile 75-pctile Mean Median 25-pctile 75-pctile Mean Median 25-pctile 75-pctile Mean Median 25-pctile 75-pctile2004 9279 534 36 3979 8703 452 42 3979 12164 1635 182 3979 9051 323 8 39792005 9714 539 42 4074 8963 450 46 4074 12266 1832 228 4074 10298 357 11 40742006 10497 554 49 3998 9724 442 51 3998 12512 1848 246 3998 11590 381 11 39982007 10723 572 52 4081 9832 457 49 4081 12822 1764 345 4081 12231 468 13 40812008 10561 581 53 3949 9672 420 47 3949 12904 1870 357 3949 11870 495 17 39492009 11429 617 57 4203 10319 475 52 4203 14539 1827 294 4203 12828 569 19 42032010 12853 666 56 4681 11633 501 51 4681 16411 1862 314 4681 14171 654 19 46812011 13463 783 62 5354 11665 631 63 5354 19441 1998 312 5354 14791 579 16 53542012 13968 850 53 5833 12290 732 63 5833 19482 2084 299 5833 15254 426 11 58332013 14049 907 56 6837 12387 943 91 6837 20375 2333 373 6837 14710 193 7 68372014 14802 1027 67 7616 12999 1033 104 7616 22769 2579 512 7616 15057 230 8 76162015 15260 1173 94 8064 12974 1200 147 8064 25094 3028 555 8064 15892 269 10 80642016 15062 1279 110 7930 11924 1248 147 7930 26751 2958 500 7930 17330 457 15 7930
Overall 12765 758 59 5461 11239 655 68 5098 17930 2129 348 8061 13954 409 12 4394
Oral OtherMolform Revenue (in thousands)
Overall Formulations Injectible

TABLE 5: MEAN, MEDIAN AND INTERQUARTILE RANGE OF MOLFORM ANNUAL REVENUES BY VINTAGE OVER ALL FORMULATIONS (THOUSANDS)
SOURCE: Authors' calculations based on IQVIA NSP data, 2004Q4 - 2016Q3. NOTES: Revenues collected at the mnf-molform level for each period.
YEAR Mean Median 25-pctile 75-pctile Mean Median 25-pctile 75-pctile Mean Median 25-pctile 75-pctile Mean Median 25-pctile 75-pctile Mean Median 25-pctile 75-pctile2004 12704 875 78 5028 10934 824 68 5143 7375 454 32 3356 6866 470 23 3217 9998 351 22 37392005 13905 720 82 5234 10356 738 71 5083 7856 534 40 3290 7065 478 32 3540 10648 414 28 40442006 16725 591 74 4555 11930 790 82 4944 8778 585 53 3643 7256 489 35 3443 10074 424 36 41322007 13182 540 65 3978 18282 1202 126 7045 8617 532 56 3627 8319 533 43 3366 10169 506 37 45872008 14424 545 56 3821 13380 1150 169 5740 8147 507 52 3565 8582 527 42 3420 10346 461 40 43792009 12770 509 60 3724 17081 1148 157 5252 9488 775 96 4348 9506 576 44 3537 11208 533 43 45342010 12982 522 57 3845 21137 1227 115 7288 10070 782 86 4352 9192 668 54 3859 13102 611 41 51652011 12143 461 45 3503 24533 1905 212 9456 10534 886 62 5429 9771 807 57 4566 13632 685 55 56732012 13583 359 19 3849 20219 1810 203 8909 13136 1134 103 6287 10928 894 67 4858 14068 780 47 65052013 11648 249 14 3516 17814 1825 178 9678 15480 1497 124 8398 12034 970 76 6136 14728 1024 57 75962014 13901 272 15 3880 12596 1307 126 9388 19856 1606 128 9601 13126 1141 78 7391 15669 1218 83 82142015 15109 254 15 4174 11577 1509 150 8526 18352 1693 167 8903 13767 1186 99 7824 16626 1454 154 91082016 14318 371 27 4745 12334 1604 149 8033 17683 1665 170 8275 13332 1371 113 7392 16395 1438 137 8898
Overall 13627 450 39 4001 15760 1292 138 7382 11955 854 81 5470 10051 716 54 4582 13609 801 56 6265
VINTAGE< 15 years 15 - 19 years 20 - 24 years 25 - 34 years 35+ years

APPENDIX FIGURE 1: VOLUME SHARES BY MOLECULE VINTAGE AND FORMULATION APPENDIX FIGURE 1a Orals
APPENDIX FIGURE 1b Injectibles
APPENDIX FIGURE 1c Others
SOURCE: Authors' calculations based on IQVIA NSP data, 2004Q4 - 2016Q3

APPENDIX TABLE 1: MEAN AND INTERQUARTILE RANGE OF MANUFACTURER COUNTS BY MOLFORM FORMULATION
SOURCE: Authors' calculations based on IQVIA NSP data, 2004Q4 - 2016Q3
APPENDIX TABLE 1a Orals VINTAGE
YEAR Mean Median 25-pctile 75-pctile Mean Median 25-pctile 75-pctile Mean Median 25-pctile 75-pctile Mean Median 25-pctile 75-pctile Mean Median 25-pctile 75-pctile2004 2.65 1.00 1.00 3.00 4.25 3.00 1.00 6.00 6.19 4.00 1.00 9.50 6.18 4.00 2.00 9.00 8.11 7.00 4.00 11.502005 2.75 1.00 1.00 3.00 4.76 3.00 1.00 7.00 6.46 4.00 1.00 10.00 6.40 4.00 2.00 10.00 8.52 7.00 4.00 12.002006 2.92 1.00 1.00 4.00 4.66 3.00 1.00 6.00 6.13 3.50 1.00 10.00 6.44 4.00 2.00 10.00 8.15 7.00 4.00 11.502007 2.88 1.00 1.00 3.00 5.92 4.00 1.00 9.00 5.27 3.00 1.00 7.00 6.31 4.00 2.00 10.00 8.28 7.00 4.00 12.002008 2.52 1.00 1.00 2.00 6.67 4.50 2.00 10.00 6.07 4.00 1.00 9.00 6.46 4.00 2.00 10.00 8.83 7.00 4.00 13.002009 2.38 1.00 1.00 2.00 6.76 5.00 2.00 10.00 5.68 4.00 1.00 7.00 6.42 4.00 2.00 11.00 8.92 7.00 3.00 12.002010 2.28 1.00 1.00 2.00 7.22 6.00 2.00 11.00 5.78 4.00 2.00 8.00 5.99 4.00 2.00 9.50 8.43 7.00 3.00 12.002011 2.16 1.00 1.00 2.00 7.34 5.00 2.00 11.00 5.83 4.00 1.00 8.00 5.93 4.00 2.00 9.00 8.15 7.00 3.00 12.002012 2.14 1.00 1.00 2.00 8.11 6.00 3.00 13.00 6.76 4.00 2.00 11.00 6.09 4.00 2.00 9.00 8.09 6.00 3.00 12.002013 2.12 1.00 1.00 2.00 8.07 6.00 2.00 14.00 7.16 5.00 2.00 11.00 6.34 5.00 2.00 9.00 7.89 6.00 2.00 12.002014 2.10 1.00 1.00 2.00 7.75 6.00 2.00 13.00 7.28 5.00 2.00 11.00 6.46 5.00 2.00 9.00 7.80 6.00 2.00 12.002015 2.02 1.00 1.00 2.00 7.21 5.50 2.00 11.00 8.86 8.00 3.00 13.00 6.56 5.00 2.00 9.00 7.91 6.00 3.00 11.002016 2.03 1.00 1.00 2.00 7.28 6.00 2.00 11.00 8.36 7.00 3.00 13.00 6.69 4.50 2.00 11.00 7.90 6.00 2.00 12.00
Overall 2.35 1.00 1.00 2.00 6.63 5.00 2.00 10.00 6.55 4.00 2.00 10.00 6.33 4.00 2.00 9.00 8.16 6.00 3.00 12.00
< 15 years 15-19 years 20-24 years 25-34 years 35+ years
APPENDIX TABLE 1b Injectibles VINTAGE
YEAR Mean Median 25-pctile 75-pctile Mean Median 25-pctile 75-pctile Mean Median 25-pctile 75-pctile Mean Median 25-pctile 75-pctile Mean Median 25-pctile 75-pctile2004 1.85 1.00 1.00 2.00 2.43 2.00 1.00 3.00 2.56 2.00 2.00 4.00 3.47 3.00 2.00 4.00 2.74 2.00 1.00 4.002005 1.85 1.00 1.00 2.00 2.81 2.00 1.00 4.00 2.79 2.00 2.00 4.00 3.60 3.00 2.00 4.00 3.04 2.00 1.00 4.002006 1.74 1.00 1.00 2.00 2.82 2.00 1.00 4.00 3.11 3.00 2.00 4.00 3.32 3.00 2.00 4.00 3.04 3.00 1.00 4.002007 1.67 1.00 1.00 2.00 3.21 2.00 1.00 5.00 2.88 2.00 1.00 4.00 3.25 3.00 2.00 4.00 3.07 2.00 1.00 4.002008 1.84 1.00 1.00 2.00 3.14 2.00 1.00 5.00 3.13 3.00 1.00 4.00 3.16 3.00 2.00 4.00 3.38 2.50 1.00 4.002009 1.77 1.00 1.00 2.00 3.32 2.00 1.00 5.00 3.23 3.00 1.00 5.00 3.22 3.00 2.00 4.00 3.19 3.00 1.00 4.002010 1.70 1.00 1.00 2.00 3.02 2.00 1.00 4.50 2.91 2.00 1.00 4.00 3.22 3.00 2.00 4.00 3.55 3.00 2.00 5.002011 1.52 1.00 1.00 1.00 2.98 2.00 1.00 5.00 2.99 2.00 1.00 4.00 2.99 2.00 2.00 4.00 3.67 3.00 2.00 5.002012 1.54 1.00 1.00 1.00 3.21 2.00 1.00 5.00 3.09 2.50 1.00 5.00 2.84 2.00 1.00 4.00 3.51 3.00 2.00 5.002013 1.56 1.00 1.00 1.00 3.40 2.00 1.00 6.00 3.30 2.00 1.00 5.00 2.81 2.00 1.00 4.00 3.45 3.00 1.00 5.002014 1.59 1.00 1.00 1.00 3.09 2.00 1.00 4.00 3.40 2.00 1.00 5.00 2.84 2.00 1.00 4.00 3.51 3.00 2.00 5.002015 1.57 1.00 1.00 1.00 3.44 2.00 1.00 5.00 2.97 1.00 1.00 4.50 2.75 2.00 1.00 4.00 3.34 2.50 1.50 4.502016 1.57 1.00 1.00 1.50 2.63 1.00 1.00 4.00 3.28 2.00 1.00 5.00 2.97 2.00 1.00 4.00 3.05 2.00 1.00 4.00Overall 1.68 1.00 1.00 2.00 3.00 2.00 1.00 4.00 3.03 2.00 1.00 4.00 3.08 2.00 1.00 4.00 3.36 3.00 1.00 5.00
< 15 years 15-19 years 20-24 years 25-34 years 35+ years
APPENDIX TABLE 1c Others VINTAGE
YEAR Mean Median 25-pctile 75-pctile Mean Median 25-pctile 75-pctile Mean Median 25-pctile 75-pctile Mean Median 25-pctile 75-pctile Mean Median 25-pctile 75-pctile2004 1.52 1.00 1.00 1.00 2.85 1.00 1.00 3.00 3.83 3.00 1.00 5.00 4.69 3.00 1.00 7.00 9.62 6.00 5.00 11.002005 1.58 1.00 1.00 1.50 2.79 1.00 1.00 3.00 3.95 3.00 1.00 5.00 4.98 4.00 1.00 7.00 9.59 6.50 5.00 12.002006 1.47 1.00 1.00 1.00 2.85 2.00 1.00 3.00 3.89 3.00 1.00 6.00 4.92 3.00 1.00 6.00 8.88 6.50 3.50 12.002007 1.46 1.00 1.00 1.00 2.95 2.00 1.00 4.00 4.12 3.00 1.00 7.00 4.53 3.00 1.00 6.00 8.36 6.00 3.00 9.002008 1.45 1.00 1.00 1.00 3.32 2.00 1.00 5.00 3.42 2.00 1.00 4.00 4.67 3.00 1.00 6.00 7.81 6.00 2.00 10.502009 1.47 1.00 1.00 1.00 3.31 2.00 1.00 5.00 3.46 2.00 1.00 4.00 4.28 3.00 2.00 6.00 8.14 6.00 3.00 11.002010 1.46 1.00 1.00 1.00 3.76 2.00 1.00 6.00 3.33 2.00 1.00 4.00 3.85 3.00 1.50 5.00 7.07 5.00 2.00 10.002011 1.44 1.00 1.00 1.00 3.38 2.00 1.00 4.00 3.71 2.00 1.00 5.00 4.13 3.00 2.00 6.00 6.70 4.50 3.00 9.002012 1.41 1.00 1.00 2.00 3.54 2.00 1.00 6.00 3.94 2.00 1.00 5.00 4.18 3.00 1.00 5.00 6.49 5.00 2.00 9.002013 1.53 1.00 1.00 2.00 2.96 2.00 1.00 4.00 4.29 2.00 1.00 6.00 4.10 3.00 1.50 5.00 6.19 4.00 2.00 8.002014 1.47 1.00 1.00 2.00 2.89 2.00 1.00 3.00 4.25 2.00 1.00 6.50 4.21 3.00 2.00 5.00 6.10 4.00 2.00 8.502015 1.50 1.00 1.00 2.00 2.88 2.00 1.00 3.00 5.09 3.00 2.00 8.00 4.04 3.00 1.00 5.00 6.24 4.00 2.00 9.002016 1.37 1.00 1.00 2.00 2.55 2.00 1.00 3.00 4.24 2.00 1.00 8.00 4.20 3.00 1.00 5.00 5.92 3.00 2.00 8.50Overall 1.47 1.00 1.00 2.00 3.00 2.00 1.00 4.00 3.88 2.00 1.00 5.00 4.33 3.00 1.00 6.00 6.87 5.00 2.00 9.00
< 15 years 15-19 years 20-24 years 25-34 years 35+ years