Facts Concerning the Consumption and Production of ...
107
Facts Concerning the Consumption and Production of Electric Power in Iowa Project Manager and Contact Person: Lisa Stump [email protected] (515) 281-8825 Policy Development Staff Contributing to the Report: Parveen Baig Gordon Dunn Stuart Ormsbee John Pearce Leslie Cleveland (Editor) Iowa Utilities Board Department of Commerce 350 Maple Street Des Moines, Iowa 50319 August 2000
Transcript of Facts Concerning the Consumption and Production of ...

Facts Concerning the Consumption and Production ofElectric Power in Iowa
Project Manager and Contact Person:
Lisa [email protected]
(515) 281-8825
Policy Development Staff Contributing to the Report:
Parveen BaigGordon Dunn
Stuart OrmsbeeJohn Pearce
Leslie Cleveland (Editor)
Iowa Utilities BoardDepartment of Commerce
350 Maple StreetDes Moines, Iowa 50319
August 2000
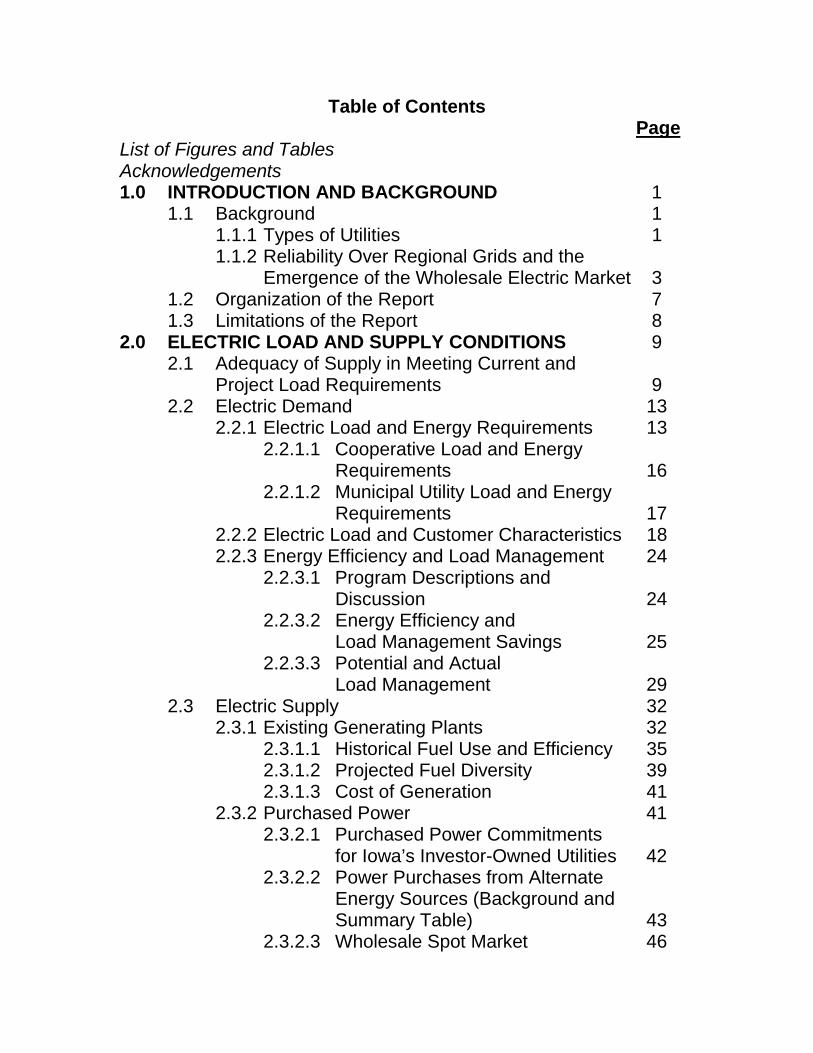
Table of ContentsPage
List of Figures and TablesAcknowledgements1.0 INTRODUCTION AND BACKGROUND 1
1.1 Background 11.1.1 Types of Utilities 11.1.2 Reliability Over Regional Grids and the
Emergence of the Wholesale Electric Market 31.2 Organization of the Report 71.3 Limitations of the Report 8
2.0 ELECTRIC LOAD AND SUPPLY CONDITIONS 92.1 Adequacy of Supply in Meeting Current and
Project Load Requirements 92.2 Electric Demand 13
2.2.1 Electric Load and Energy Requirements 132.2.1.1 Cooperative Load and Energy
Requirements 162.2.1.2 Municipal Utility Load and Energy
Requirements 172.2.2 Electric Load and Customer Characteristics 182.2.3 Energy Efficiency and Load Management 24
2.2.3.1 Program Descriptions andDiscussion 24
2.2.3.2 Energy Efficiency andLoad Management Savings 25
2.2.3.3 Potential and ActualLoad Management 29
2.3 Electric Supply 322.3.1 Existing Generating Plants 32
2.3.1.1 Historical Fuel Use and Efficiency 352.3.1.2 Projected Fuel Diversity 392.3.1.3 Cost of Generation 41
2.3.2 Purchased Power 412.3.2.1 Purchased Power Commitments
for Iowa’s Investor-Owned Utilities 422.3.2.2 Power Purchases from Alternate
Energy Sources (Background andSummary Table) 43
2.3.2.3 Wholesale Spot Market 46

Table of Contents ContinuedPage
2.3.3 Regional Generation SupplyConsiderations 48
2.3.4 SO2 and NOx Emissions fromFossil-Fuel-Fired Generation 50
2.3.5 Generation Siting Requirements 513.0 DELIVERY SYSTEM CONDITIONS 53
3.1 Existing Transmission and Distribution Facilities 533.1.1 Location of Facilities 533.1.2 Age of Existing Facilities 57
3.2 Reliability of Delivery Systems 613.2.1 Reliability Indices 613.2.2 Bulk Transmission System Outage Report 633.2.3 MAPP Constraints 633.2.4 Potential Constraints in Iowa 65
3.3 Future of the State’s Transmission and DistributionSystems 663.3.1 Scheduled Transmission
System Construction 663.3.2 Transmission Siting Requirements 673.3.3 Distributed Generation 673.3.4 Regional Reliability and
Transmission Studies 684.0 CUSTOMER SERVICE 69
4.1 Billing Systems 694.2 Metering 704.3 Automatic Outage Reporting 70
List of AcronymsGlossary of Terms
AppendicesAppendix A – Rural Electric Cooperatives Serving IowaAppendix B – Municipal Utilities Serving IowaAppendix C – Investor-Owned Utility Reporting to MAPPAppendix D - Utility GeneratorsAppendix E – Non-Utility GeneratorsAppendix F – New Generation (Operational & Announced)
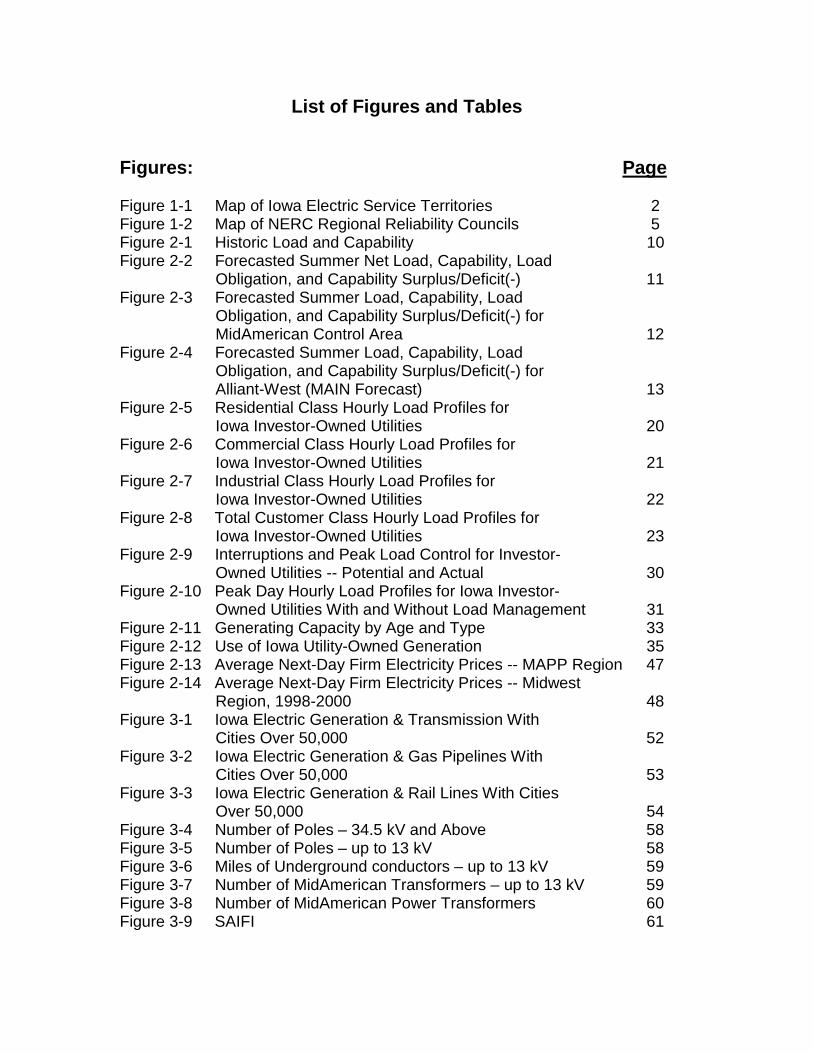
List of Figures and Tables
Figures: Page
Figure 1-1 Map of Iowa Electric Service Territories 2Figure 1-2 Map of NERC Regional Reliability Councils 5Figure 2-1 Historic Load and Capability 10Figure 2-2 Forecasted Summer Net Load, Capability, Load
Obligation, and Capability Surplus/Deficit(-) 11Figure 2-3 Forecasted Summer Load, Capability, Load
Obligation, and Capability Surplus/Deficit(-) forMidAmerican Control Area 12
Figure 2-4 Forecasted Summer Load, Capability, LoadObligation, and Capability Surplus/Deficit(-) forAlliant-West (MAIN Forecast) 13
Figure 2-5 Residential Class Hourly Load Profiles forIowa Investor-Owned Utilities 20
Figure 2-6 Commercial Class Hourly Load Profiles forIowa Investor-Owned Utilities 21
Figure 2-7 Industrial Class Hourly Load Profiles forIowa Investor-Owned Utilities 22
Figure 2-8 Total Customer Class Hourly Load Profiles forIowa Investor-Owned Utilities 23
Figure 2-9 Interruptions and Peak Load Control for Investor-Owned Utilities -- Potential and Actual 30
Figure 2-10 Peak Day Hourly Load Profiles for Iowa Investor-Owned Utilities With and Without Load Management 31
Figure 2-11 Generating Capacity by Age and Type 33Figure 2-12 Use of Iowa Utility-Owned Generation 35Figure 2-13 Average Next-Day Firm Electricity Prices -- MAPP Region 47Figure 2-14 Average Next-Day Firm Electricity Prices -- Midwest
Region, 1998-2000 48Figure 3-1 Iowa Electric Generation & Transmission With
Cities Over 50,000 52Figure 3-2 Iowa Electric Generation & Gas Pipelines With
Cities Over 50,000 53Figure 3-3 Iowa Electric Generation & Rail Lines With Cities
Over 50,000 54Figure 3-4 Number of Poles – 34.5 kV and Above 58Figure 3-5 Number of Poles – up to 13 kV 58Figure 3-6 Miles of Underground conductors – up to 13 kV 59Figure 3-7 Number of MidAmerican Transformers – up to 13 kV 59Figure 3-8 Number of MidAmerican Power Transformers 60Figure 3-9 SAIFI 61

List of Figures and Tables ContinuedPage
Figure 3-10 SAIDI and CAIDI 62Figure 3-11 MAPP Constrained Interfaces 64Figure 3-12 MAPP Refusal of Firm Capacity Transmission Service 65
Tables:
Table 1-1 Basic Statistics by Type of Utility Company 3Table 2-1 Forecast of Summer Peak Load Requirements for
Iowa MAPP Utilities and Alliant-West 14Table 2-2 Historical Summer Peak Load Requirements for
MidAmerican Energy and Alliant-West Control Areas 14Table 2-3 Forecast of Annual Energy Requirements for
Iowa MAPP Utilities and Alliant-West 15Table 2-4 Historical Annual Energy Requirements for
MidAmerican Energy And Alliant-West Control Areas 15Table 2-5 Forecast of Peak Load and Annual Energy
Requirements for Iowa Cooperatives 16Table 2-6 Historical Peak Load and Annual Energy Requirements
for Iowa Cooperatives 17Table 2-7 Historical Peak Load and Annual Energy Requirements
for Iowa Municipal Utilities 18Table 2-8 Historical Iowa Electric Load Factors 19Table 2-9 Iowa Historical Electric Sales by Metropolitan Area
and for the State as a Whole 24Table 2-10 Investor-Owned Utilities - MW Savings Due to
Energy Efficiency 26Table 2-11 Investor-Owned Utilities - MW Savings Due to
Load Management 26Table 2-12 Rural Electric Cooperatives - MW Savings Due to
Voluntary Energy Efficiency 26Table 2-13 Rural Electric Cooperatives - MW Savings Due to
Voluntary Load Management 27Table 2-14 Municipal Utilities - MW Savings Due to Voluntary
Energy Efficiency 27Table 2-15 Municipal Utilities - MW Savings Due to Voluntary
Load Management 27Table 2-16 Investor-Owned Utilities - MWH Savings Due to
Energy Efficiency 28Table 2-17 Rural Electric Cooperatives - MWH Savings Due to
Voluntary Energy Efficiency 28Table 2-18 Municipal Utilities - MWH Savings Due to Voluntary
Energy Efficiency 28

List of Figures and Tables ContinuedPage
Table 2-19 Total Investor-Owned Utility Energy Efficiency and Load Management Expenditures 28
Table 2-20 Total Rural Electric Cooperative Voluntary EnergyEfficiency and Load Management Expenditures - Revised toInclude Eastern Iowa REC 29
Table 2-21 Total Municipal Utility Voluntary Energy Efficiencyand Load Management Expenditures 29
Table 2-22 Generating Capacity of Iowa Utility Owned-Generationplus the IOU Wind Contracts 34
Table 2-23 Typical Use of Iowa Utility Owned-Generation andIOU Wind Contracts 35
Table 2-24 Total Iowa Electric Utility Owned-Generation by Plant Type 37Table 2-25 Capacity Factors by Utility Plant Type for Iowa
Utility Owned-Generation 38Table 2-26 Percent of Heat Input by Fuel Type - Iowa Utility-
Owned Generation 38Table 2-27 U.S. Energy Consumption for Electric Generators and
Annual Average Change in Consumption from 1998 to 2010 39Table 2-28 U.S. Energy Consumption for Electric Generators –
Type of Fuel Used as a Percentage of Total Fuelfor Generation 40
Table 2-29 Generation Cost per MWh by Fuel Type - Iowa Generation 41Table 2-30 Historical and Projected Purchased Power Commitments 42Table 2-31 Renewable Energy Purchases by Iowa Utilities 45Table 2-32 Planned Generation Additions in the Midwest 49Table 2-33 Planned Midwest Capacity Additions by Fuel Type 50Table 2-34 Coal-Fired Unit Emissions 51Table 3-1 Miles of Line by Age 57Table 3-2 115 kV/161 kV/345 kV Pole Miles Owned by RECs 60

Acknowledgements
This report represents a contributory effort of the staff of the Policy DevelopmentSection of the Iowa Utilities Board (IUB), MidAmerican Energy Company(MidAmerican), Alliant Energy (Alliant), the Iowa Association of ElectricCooperatives (IAEC), and the Iowa Association of Municipal Utilities (IAMU). TheIUB extends its sincere appreciation for the hard work, cooperation, and patienceneeded to make this report a reality in an expedited timeframe.
1
1.0 INTRODUCTION AND BACKGROUND
Basic characteristics of electricity supply and demand include the following:1
• electricity must usually be generated at the same time that it is consumedsince storing electricity is difficult and expensive;
• electricity consumption varies widely depending on the time of day, theseason, and the weather;
• electricity moves at the speed of light and many operational decisions mustbe implemented very quickly or automatically;
• changes anywhere in the interconnected electrical system impact all otherpoints of the system;
• electric system conditions are constantly changing with changes in demand,generation, and transmission;
• the addition of new electric infrastructure is capital intensive and subject tolong lead times; and
• a reliable supply of electricity is essential to economic development andhuman satisfaction.
These characteristics require a complex and extensive state and regional electricutility infrastructure to efficiently provide reliable electric service. The datapresented in this report characterize this electric utility infrastructure for the stateof Iowa. This characterization is the first step in assessing and evaluating theproduction, delivery, and use of electricity in Iowa. Any stakeholder group mayuse the data compiled in this report to determine policy implications andrecommendations for Iowa’s electric utility industry. This report does not assessor evaluate the data.
1.1 Background
In order to understand the data presented in the report, it is important to have abasic understanding of the electric utility industry including the different types ofutility companies and the interconnected transmission grid. Subsection 1.1provides this basic information.
1.1.1 Types of Utilities
Iowa’s electric customers are served by three basic utility types: investor-ownedutilities (IOUs), rural electric cooperatives (RECs), and municipal (or publiclyowned) utilities. Each utility company serves an exclusive service territory.Figure 1-1 shows the service territories served by each type of utility. 1 The characteristics are, in part, gleaned from the “Draft Working Model for Restructuring theElectric Utility Industry in Virginia, Chapter 2: Reliability,” November 1997.

2
IOUs are publicly held, for-profit companies primarily serving urban areas of thestate. Iowa is served by two IOUs - Alliant Energy (Alliant) and MidAmericanEnergy Company (MidAmerican). Alliant is comprised of three operatingcompanies: Interstate Power (Interstate), IES Utilities (IES), and WisconsinPower and Light (WPL). Interstate and IES primarily serve Iowa and arecharacterized throughout the report as Alliant-West. Data incorporating WPL(which does not serve Iowa) are removed where possible. IOU retail rates andservice are regulated by the IUB. Wholesale rates are regulated by the FederalEnergy Regulatory Commission (FERC).
RECs are locally owned, not-for-profit utilities controlled by a board of directorselected by the consumers they serve. Iowa’s RECs provide electric service tomore than 180,000 homes, farms, and businesses primarily in the rural areas ofall 99 counties. Two types of electric cooperatives operate in Iowa: generationand transmission cooperatives (G&Ts) and distribution cooperatives. Distributioncooperatives purchase wholesale electricity from the G&T and distribute and sellthis electricity to their members. Both the G&T and the distribution cooperativesare governed through a local board of directors elected by their members. Bothtypes of RECs set their rates through the local governance process. The IUBsets the safety and service regulations that apply to the RECs. RECs securingany capital needs from the Rural Utility Service (RUS—formerly REA) are subjectto RUS regulations at the federal level. If a cooperative is no longer under RUSjurisdiction, then a cooperative becomes FERC jurisdictional for its transmissiontariffs and for wholesale transactions. Appendix A to this report provides a

3
complete list of distribution cooperatives serving Iowa customers and the G&Tsserving those distribution cooperatives.
Iowa has 137 communities that operate electric utilities as a function of localgovernment. Iowa has more municipal electric utilities than any other state,many of which have been in continuous operation for over 100 years. Municipalutilities are locally regulated through city councils or through boards of trusteesappointed by the mayor and approved by the city council. All municipal utilitiesoperate distribution systems that serve the local community and, in some cases,portions of outlying rural areas. Eighty-nine municipal utilities own and operategenerating facilities that supply most or all of their energy needs. Muscatine,Ames, and Pella produce all or most of their electricity at local coal- or gas-fueledunits. Forty municipal utilities are joint-owners of generating plants operated byother utilities. Seventy-three municipal utilities own backup or peakinggeneration and purchase their primary power supplies from municipal joint actionentities or from other wholesale suppliers. Eight municipals own wind turbinesand 1 (Waverly) owns and operates a small hydro facility. Forty-five municipalutilities purchase at least some of their power from the Western Area PowerAdministration (WAPA), the federal agency that operates hydroelectric facilitieson the upper Missouri River Basin. Appendix B to this report provides acomplete list of municipal electric utilities in Iowa.
Table 1-1 provides some basic statistics by type of utility for Iowa and the UnitedStates (U.S.). The rural nature of the territory served by Iowa’s RECs is evidentfrom these data.
Table 1-1 Basic Statistics by Type of Utility Company
% of 1998 ElectricMWh Sales
% of Miles ofDistribution Line
(1998)
Consumers Per Mileof Distribution Line
(1998)Iowa U.S.* Iowa U.S. Iowa U.S.
Investor-Owned 76% 75% 42% 49% 25 35REC 11% 9% 54% 43% 3 6Municipal 13% 15% 4% 8% NR 39Note: * The remaining one-percent is supplied by federally owned utilities. The data reflectingconsumers per mile of distribution line for publicly owned utilities in Iowa was not consideredreliable (NR) by the IAMU.Sources: Electric Sales 1998, DOE/EIA-0540(98), October 1999, pp. 174-177 as compiled byIUB Staff; Remaining Data: 1998 Electrical World Directory as Compiled by the IAEC
1.1.2 Reliability Over Regional Grids and the Emergence of the WholesaleElectric Market
The modern electric power industry is characterized by an interconnected grid ofhigh voltage lines (referred to as transmission lines) over which utility generatingunits are economically dispatched. Economic dispatch refers to bringing on-linegenerating units within a service or control area on a least-cost basis until all
4
demand is served.2 The control area operator determines the dispatch order byfuel costs, unit efficiency, and variable operation and maintenance costs. On areal-time basis, the control area operator is the entity ultimately responsible forensuring reliability within its control area through the dispatch of generating unitsand transmission facilities. The regional interaction of generating units,transmission facilities, and control area operators comprise the bulk powersystem.
The North American Electric Reliability Council (NERC) has the primaryresponsibility for establishing and encouraging compliance with reliabilityguidelines for the bulk power system. NERC defines reliability as “the degree towhich the performance of the elements of [an electrical] system results in powerbeing delivered to consumers within accepted standards and in the amountdesired.” NERC’s definition encompasses what the industry refers to asadequacy and security. Adequacy relates to long-term planning which requiressufficient generating and transmission resources to meet projected demand inthe region. Security implies that the system will continue to operate even aftergenerating plant or transmission outages occur. NERC is comprised of regionalreliability councils. Although the regional reliability councils follow NERC’sguidelines, they often have different reliability requirements and enforcementmeasures.
The North American bulk power system includes three major transmissioninterconnections: ERCOT (which encompasses a large part of Texas), theWestern Interconnect (which includes the western states), and the EasternInterconnect (which includes the midwest, south, east, and parts of Canada).Within the major interconnections are regional reliability councils and controlareas. Figure 1-2 shows the locations of the three major transmissioninterconnections and the 10 regional reliability councils. Theoretically, power canflow from any point within the interconnection to any other point within theinterconnection. Practically, power can only flow to a very limited degreebetween the interconnections.
2 Exceptions to economic dispatch may be made as a result of transmission constraints,requirements for generation for voltage support, and differences in cost methodologies.

5
Figure 1-2HYDRO QUEBEC
30GW1 Control Area
Eastern470 GW
103 Control Areas
WSCC ERCOT120 GW 47 GW33 Control Areas 9 Control Areas
Until recently, most of Iowa’s major utilities have been part of MAPP’s regionalreliability council. MAPP (which refers to the Mid-Continent Area Power Pool) isa voluntary association of electric utility stakeholders who do business in theupper midwest.3 Reliability in the MAPP region is maintained by membersadhering to planning and operating rules that were developed by MAPPmembers and by NERC. For example, MAPP enforces reliability by requiring itsmember utilities to do reserve planning and by assessing after-the-fact penaltiesto member utilities failing to meet reserve requirements. Each utility’s generatingcapacity, adjusted for power purchases and sales, for each month, must be equalto or more than its peak demand plus a 15 percent reserve margin. Each utility isalso required to provide sufficient transmission capacity to serve its load withoutrelying on or without imposing an undue burden on other systems. To minimizethe effects of the sudden loss of a generating unit or transmission line, MAPP 3 MAPP provides many functions. It is a power pool, regional reliability council, regional securitycoordinator, regional transmission group, and a power and energy market. In addition, itmaintains an open access OASIS node.
6
utilities are required to maintain operating reserves. The operating reserve forthe MAPP system is the amount of generation sufficient to cover the loss of thelargest generation or transmission resource in the region. Utilities are allocatedtheir share of operating reserves based on their peak demand.
In May 2000, Alliant-West left MAPP’s regional reliability council and joinedMAIN’s reliability council. MAIN refers to the Mid-American InterconnectedNetwork. As part of the agreement reached with MAPP, Alliant-West willmaintain its operating reserves for the benefit of MAPP members until May 2001.All other reliability functions have been transferred to MAIN. MAPP and MAINalso have plans to merge their reliability functions by the end of 2001 and form anew, larger reliability region.
The merging of MAPP’s and MAIN’s reliability functions is one result of the manychanges occurring in the electric utility industry since the passage of the EnergyPolicy Act in 1992 (EPACT). The EPACT opened the door to competition in thewholesale electricity markets by authorizing non-utility generators to build andoperate power plants and requiring the FERC to ensure nondiscriminatory, openaccess to utility transmission systems.
In response to the EPACT, the FERC issued Order 888 in April 1996, requiringIOUs to file tariffs for open-access transmission. Order 888 also encouragedutilities to form and join independent system operators (ISOs) to operate regionaltransmission systems and be independent of all market participants. Within thelast few years, several ISOs that own neither generation nor transmission havetaken over regional transmission functions in California, New England, New York,and the mid-Atlantic (PJM) region.
Regional Transmission Organizations (RTOs) were the next step in the ISOevolution. In December 1999, FERC issued Order No. 2000 on RTOs requiringIOUs to file with FERC, by October 2000, proposals for joining a RTO or anexplanation of why the utility cannot join such a regional organization. AlliantEnergy is a transmission owning member of the Midwest Independent SystemOperation (MISO). The MISO intends to meet all of the requirements to becomean RTO in the timeframe outlined by FERC.
With all the legislative and regulatory changes occurring over the last severalyears, it is not surprising that the transmission system is being used for purposesfor which it was not designed. The system was designed to connect an individualutility’s generating units to its customer load centers and to interconnect with itsneighbor utilities. The transmission system is now being used to promote acompetitive wholesale market that is fueled by 700 FERC-approved powermarketers.4
4 Eric Hirst, Ph.D., Electric Reliability: Potential Problems and Possible Solutions, May 2000.

7
While the wholesale market in electricity is increasingly becoming open tocompetition, many retail markets are not (including Iowa’s retail market). Thisraises issues of jurisdiction over transmission pricing. In states that have notopened their markets, retail rates continue to be set on a bundled basis. Bundledrates include the costs of generation, transmission, distribution, and customerservices. At the time a state opens its retail markets, rates are unbundled andFERC assumes jurisdiction over transmission pricing. The state regulatorycommission continues to price distribution service for IOUs. As such, unbundlingrequires the jurisdictional separation of transmission and distribution facilities.Transmission lines are typically high voltage lines that deliver electricity betweengenerating plants or to wholesale customers. Distribution lines are typically low-voltage lines that connect the transmission system to the ultimate customer.
The FERC, in Order 888, established a seven-factor test as a guide for makingthis jurisdictional delineation. FERC gave the state commissions deference inapplying the seven-factor test. On November 12, 1998, MidAmerican filed withthe IUB a “Petition for Order Recommending Delineation of Transmission andLocal Distribution Facilities,” which was later approved by the IUB. On July 30,1999, MidAmerican filed its proposed delineation with FERC. On February 4,2000, the FERC issued an order approving the delineation. In accordance withthese filings, MidAmerican’s lines at 69kV and below and approximately 11percent of MidAmerican’s 161 kV lines are determined to have local distributioncharacteristics in accordance with the test of FERC’s seven factors for localdistribution. Alliant-West has not filed with either the IUB or FERC fortransmission/distribution delineation using the seven-factor test.
1.2 Organization of the Report
As with any product or service, the provision of electricity involves the interactionof supply and demand. Consumers demand electricity and Iowa’s electric utilitiessupply it. Section 2.0 of this report provides information on the supply anddemand for electricity and the various elements that comprise both. The need togenerate electricity coincident with its consumption, coupled with the extensivetime and capital required to build new electricity infrastructure, makes itnecessary to plan for adequate supply to meet forecasted demand. Subsection2.1 provides historical and forecasted data on the adequacy of supply for MAPPutilities serving Iowa and Alliant-West. Subsection 2.2 details the unique aspectsof electricity demand including customer load characteristics. An importantdistinction must be made between electric load and energy requirements.Electric load refers to customer demand at the time of the utility’s peak demand.Since utility systems are designed and built to serve peak load, this factor is anessential element in future capacity planning. Energy requirements reflectcustomer consumption of kilowatt-hours (kWhs) in a given year. Demand-sidemanagement programs affect both peak load and energy requirements.Subsection 2.2.3 discusses utility demand-side management programs includingprogram descriptions, results, and expenditures. Subsection 2.3 details electric
8
supply by characterizing Iowa’s major generating units by historical fuel use,efficiency, and diversity, in addition to cost per kWh of energy produced.
Subsection 2.3.2 looks at another major source of supply for Iowa’s utilitycompanies – purchased power. Data are provided on historical powerpurchases from alternate energy sources and historical and future purchasesfrom conventional generating sources. In addition, this subsection discusses thespot market for wholesale supply that was essentially created through FERCOrder 888. Subsection 2.3 concludes with information regarding regional supplyconsiderations, air emissions from conventional generating sources (primarilycoal, oil, and natural gas), and a brief description of the requirements that mustbe met before a new generating plant is built in Iowa.
The delivery of electricity to the ultimate customer is accomplished through bothtransmission and distribution lines. Section 3.0 of the report looks at Iowa’sdelivery system including the location of vital infrastructure, the age and conditionof the state’s transmission and distribution infrastructure, and the historicalreliability of the regional delivery systems. The section concludes with adiscussion of future changes to the transmission and distribution system, as wellas a description of the state’s transmission siting requirements.
Section 4.0 provides a brief description of how customer service systems havechanged over the last few years. Customer service includes metering, billing,and customer contact.
1.3 Limitations of the Report
While it is understood customers are concerned with both the reliability and costof their electric supply, the data in this report concentrate more on the reliabilityof electric supply and the characteristics comprising electric demand. As such,utility rates are not compiled and reported. In addition, the report does notattempt to assess, evaluate, or analyze the data provided.

9
2.0 ELECTRIC LOAD AND SUPPLY CONDITIONS
The use of electricity places “load” on an electric utility system. Load ismeasured in kilowatts (kW or 1,000 watts), megawatts (MW or 1,000 kW) orgigawatts (GW or 1,000 MW). Electric load varies depending on the number andsize of devices using electricity at a given time. When the sum of individualloads reaches a maximum level, the utility experiences system "peak load." InIowa, most peak loads occur during hot summer days when air conditioning usereaches maximum levels. A utility’s “capability” for meeting its peak load isbased on its electric generating capacity, either owned or available throughpurchase.
Section 2.1 compares historical and projected load for Iowa utilities and theadequacy of available supply to meet that load. Section 2.2 details electricdemand including load and energy requirements. Section 2.1 details the variouselements of electric supply.
2.1 Adequacy of Supply in Meeting Current and Projected LoadRequirements
This subsection compares Iowa peak loads and capabilities, both historic andforecasted, based on data reported by Iowa utilities to MAPP and data reportedby Alliant-West. Most large Iowa utilities are (or have recently been) MAPPmembers. MAPP member utilities and Alliant-West account for the vast majorityof Iowa’s electricity sales. Therefore, comparisons based on MAPP utilities andAlliant-West should provide a reasonably accurate representation of Iowa as awhole. Some MAPP utilities, principally MidAmerican and Alliant-West, alsoserve smaller areas in adjacent states. The comparisons in this section involveno adjustments to derive Iowa-only data from total system data. Since utilitiesplan on a system-wide rather than state-by-state basis, such adjustments wouldadd little in meaning or accuracy to the results. Similarly, no adjustments aremade to account for the diversity of different times each utility reaches itsrespective system peak.5
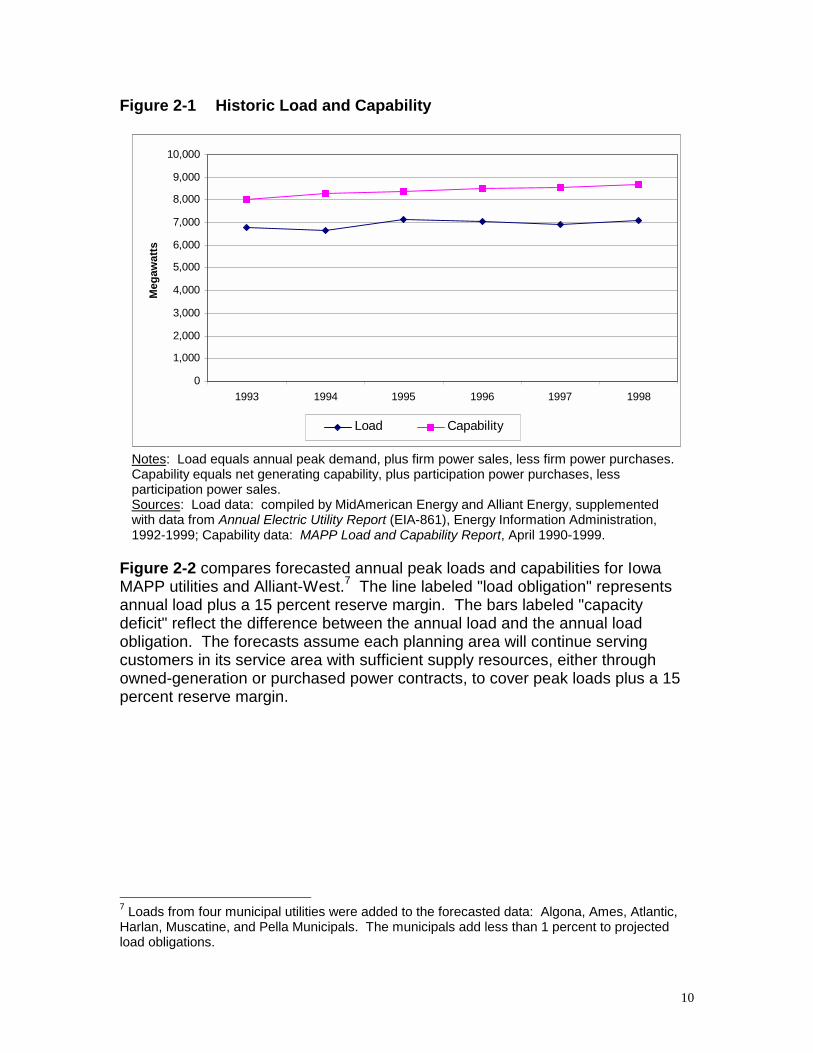
Figure 2-1 compares historic annual peak loads and capabilities for most IowaMAPP utilities and Alliant-West.6
5 Reporting utilities seem to regard such adjustments as minor. For example, MidAmerican hasestimated the diversity adjustment within its control area at 1 percent or less, and Alliant estimatesthe diversity between its east and west systems at less than 1 percent.6 Appendix C provides a detailed list of utilities included in Figures 2-1 and 2-2.
10
Figure 2-1 Historic Load and Capability
0
1,000
2,000
3,000
4,000
5,000
6,000
7,000
8,000
9,000
10,000
1993 1994 1995 1996 1997 1998
Meg
awat
ts
Load Capability
Notes: Load equals annual peak demand, plus firm power sales, less firm power purchases.Capability equals net generating capability, plus participation power purchases, lessparticipation power sales.Sources: Load data: compiled by MidAmerican Energy and Alliant Energy, supplementedwith data from Annual Electric Utility Report (EIA-861), Energy Information Administration,1992-1999; Capability data: MAPP Load and Capability Report, April 1990-1999.
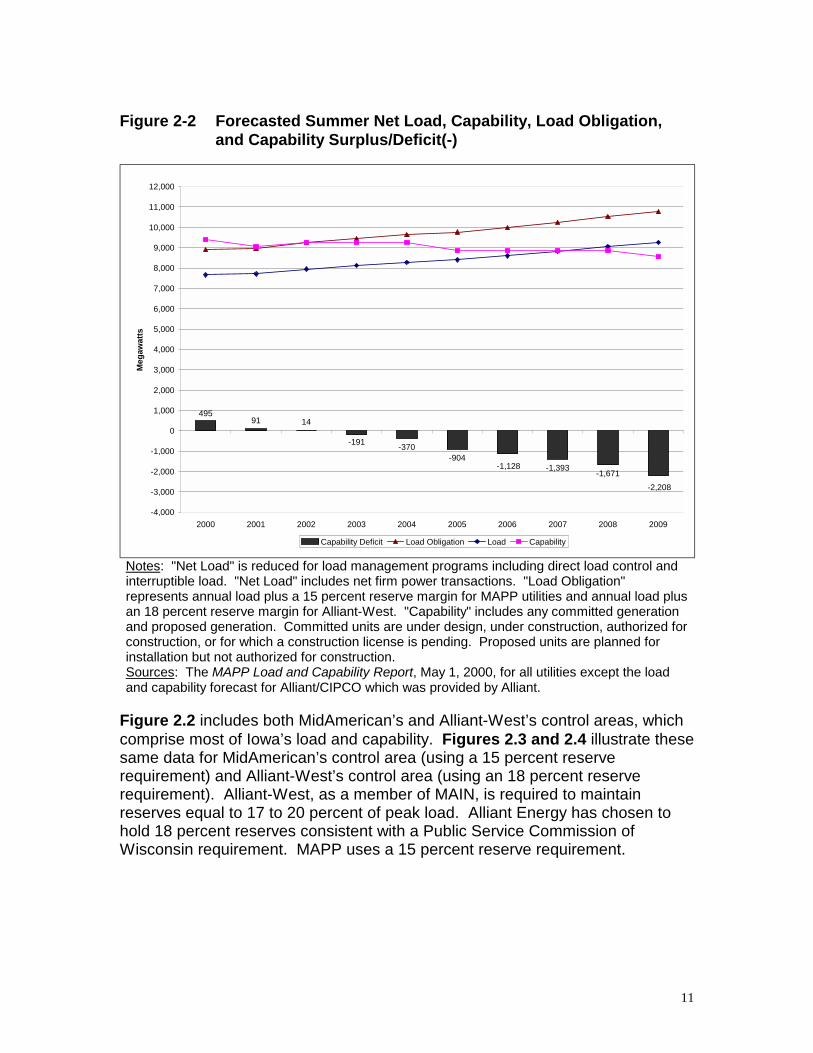
Figure 2-2 compares forecasted annual peak loads and capabilities for IowaMAPP utilities and Alliant-West.7 The line labeled "load obligation" representsannual load plus a 15 percent reserve margin. The bars labeled "capacitydeficit" reflect the difference between the annual load and the annual loadobligation. The forecasts assume each planning area will continue servingcustomers in its service area with sufficient supply resources, either throughowned-generation or purchased power contracts, to cover peak loads plus a 15percent reserve margin.
7 Loads from four municipal utilities were added to the forecasted data: Algona, Ames, Atlantic,Harlan, Muscatine, and Pella Municipals. The municipals add less than 1 percent to projectedload obligations.
11
Figure 2-2 Forecasted Summer Net Load, Capability, Load Obligation,and Capability Surplus/Deficit(-)
91 14
-370-904
-1,393 -1,671-1,128
-2,208
-191
495
-4,000
-3,000
-2,000
-1,000
0
1,000
2,000
3,000
4,000
5,000
6,000
7,000
8,000
9,000
10,000
11,000
12,000
2000 2001 2002 2003 2004 2005 2006 2007 2008 2009
Meg
awat
ts
Capability Deficit Load Obligation Load Capability
Notes: "Net Load" is reduced for load management programs including direct load control andinterruptible load. "Net Load" includes net firm power transactions. "Load Obligation"represents annual load plus a 15 percent reserve margin for MAPP utilities and annual load plusan 18 percent reserve margin for Alliant-West. "Capability" includes any committed generationand proposed generation. Committed units are under design, under construction, authorized forconstruction, or for which a construction license is pending. Proposed units are planned forinstallation but not authorized for construction.Sources: The MAPP Load and Capability Report, May 1, 2000, for all utilities except the loadand capability forecast for Alliant/CIPCO which was provided by Alliant.
Figure 2.2 includes both MidAmerican’s and Alliant-West’s control areas, whichcomprise most of Iowa’s load and capability. Figures 2.3 and 2.4 illustrate thesesame data for MidAmerican’s control area (using a 15 percent reserverequirement) and Alliant-West’s control area (using an 18 percent reserverequirement). Alliant-West, as a member of MAIN, is required to maintainreserves equal to 17 to 20 percent of peak load. Alliant Energy has chosen tohold 18 percent reserves consistent with a Public Service Commission ofWisconsin requirement. MAPP uses a 15 percent reserve requirement.

12
Figure 2-3 Forecasted Summer Load, Capability, Load Obligation, andCapability Surplus/Deficit(-) for MidAmerican Control Area
202 64380
-172-621 -940 -1,138
-64
-1,293-757
-4,000
-3,000
-2,000
-1,000
0
1,000
2,000
3,000
4,000
5,000
6,000
7,000
8,000
9,000
10,000
11,000
12,000
2000 2001 2002 2003 2004 2005 2006 2007 2008 2009
Meg
awat
ts
Capability Deficit Load Obligation Load Capability
Notes: See Figure 2-2.Sources: See Figure 2-2.
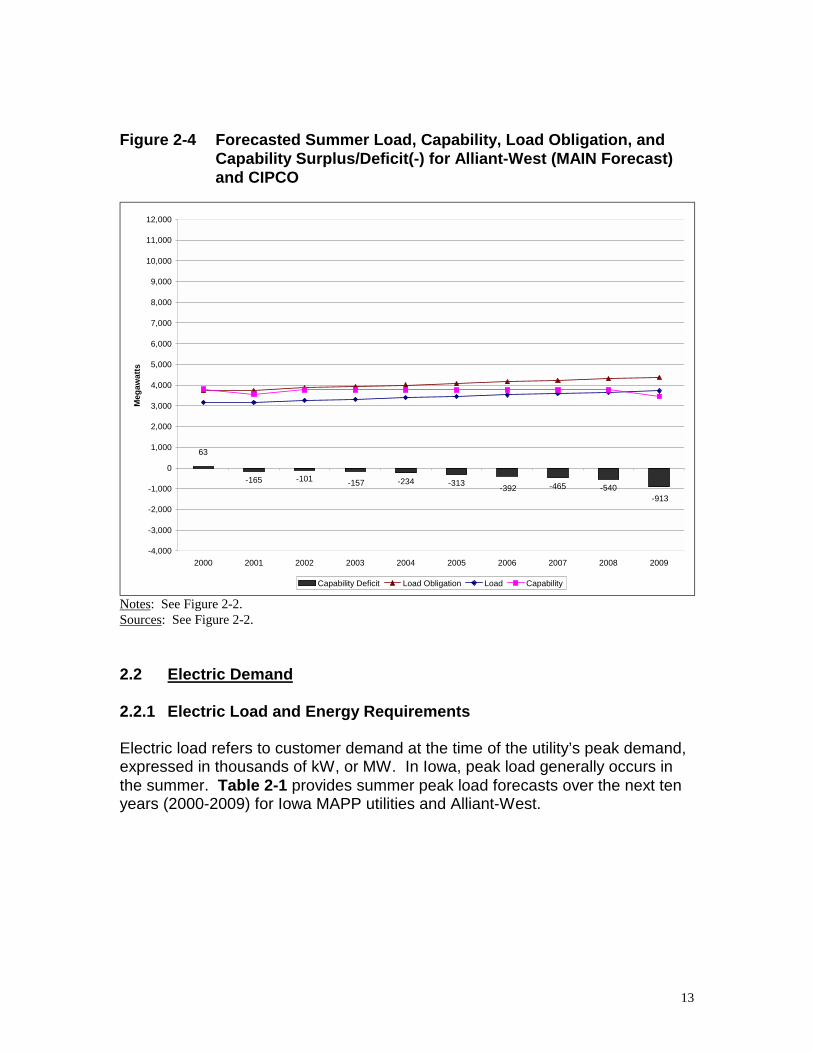
13
Figure 2-4 Forecasted Summer Load, Capability, Load Obligation, andCapability Surplus/Deficit(-) for Alliant-West (MAIN Forecast)and CIPCO
-165 -101 -234 -313 -465 -540-392-913
-157
63
-4,000
-3,000
-2,000
-1,000
0
1,000
2,000
3,000
4,000
5,000
6,000
7,000
8,000
9,000
10,000
11,000
12,000
2000 2001 2002 2003 2004 2005 2006 2007 2008 2009
Meg
awat
ts
Capability Deficit Load Obligation Load Capability
Notes: See Figure 2-2.Sources: See Figure 2-2.
2.2 Electric Demand
2.2.1 Electric Load and Energy Requirements
Electric load refers to customer demand at the time of the utility’s peak demand,expressed in thousands of kW, or MW. In Iowa, peak load generally occurs inthe summer. Table 2-1 provides summer peak load forecasts over the next tenyears (2000-2009) for Iowa MAPP utilities and Alliant-West.
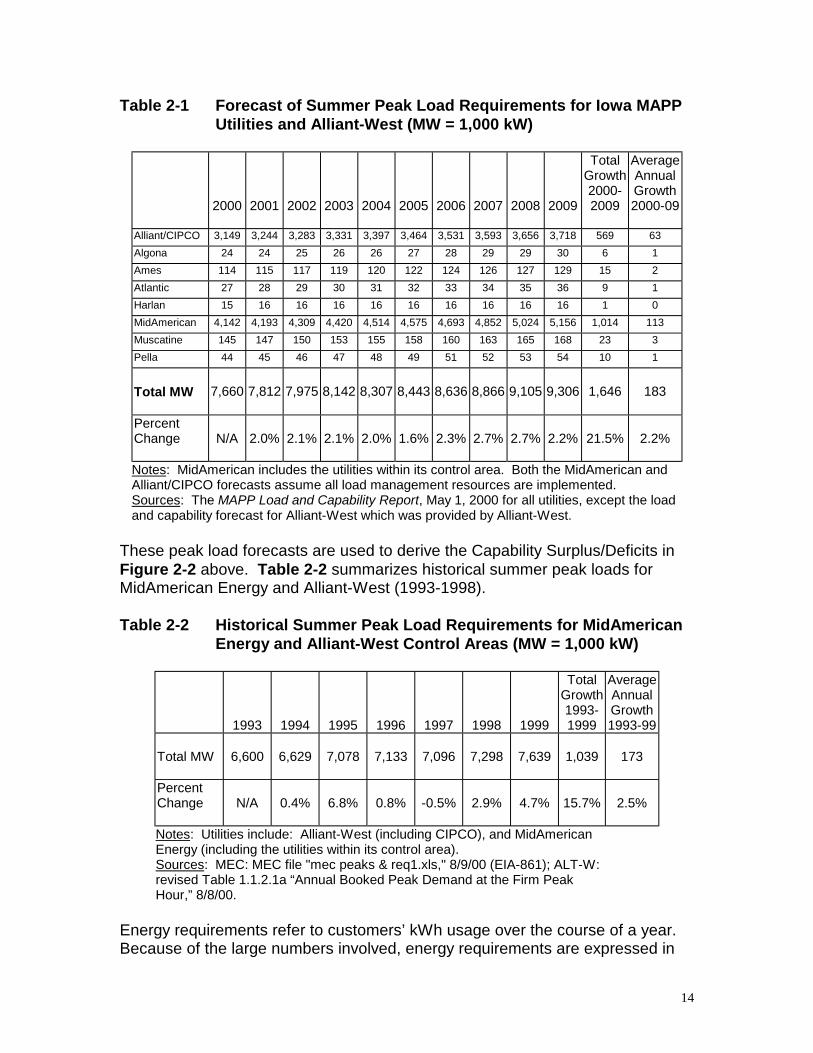
14
Table 2-1 Forecast of Summer Peak Load Requirements for Iowa MAPPUtilities and Alliant-West (MW = 1,000 kW)
2000 2001 2002 2003 2004 2005 2006 2007 2008 2009
TotalGrowth2000-2009
AverageAnnualGrowth2000-09
Alliant/CIPCO 3,149 3,244 3,283 3,331 3,397 3,464 3,531 3,593 3,656 3,718 569 63Algona 24 24 25 26 26 27 28 29 29 30 6 1Ames 114 115 117 119 120 122 124 126 127 129 15 2Atlantic 27 28 29 30 31 32 33 34 35 36 9 1Harlan 15 16 16 16 16 16 16 16 16 16 1 0MidAmerican 4,142 4,193 4,309 4,420 4,514 4,575 4,693 4,852 5,024 5,156 1,014 113Muscatine 145 147 150 153 155 158 160 163 165 168 23 3Pella 44 45 46 47 48 49 51 52 53 54 10 1
Total MW 7,660 7,812 7,975 8,142 8,307 8,443 8,636 8,866 9,105 9,306 1,646 183
PercentChange N/A 2.0% 2.1% 2.1% 2.0% 1.6% 2.3% 2.7% 2.7% 2.2% 21.5% 2.2%
Notes: MidAmerican includes the utilities within its control area. Both the MidAmerican andAlliant/CIPCO forecasts assume all load management resources are implemented.Sources: The MAPP Load and Capability Report, May 1, 2000 for all utilities, except the loadand capability forecast for Alliant-West which was provided by Alliant-West.
These peak load forecasts are used to derive the Capability Surplus/Deficits inFigure 2-2 above. Table 2-2 summarizes historical summer peak loads forMidAmerican Energy and Alliant-West (1993-1998).
Table 2-2 Historical Summer Peak Load Requirements for MidAmericanEnergy and Alliant-West Control Areas (MW = 1,000 kW)
1993 1994 1995 1996 1997 1998 1999
TotalGrowth1993-1999
AverageAnnualGrowth1993-99
Total MW 6,600 6,629 7,078 7,133 7,096 7,298 7,639 1,039 173
PercentChange N/A 0.4% 6.8% 0.8% -0.5% 2.9% 4.7% 15.7% 2.5%
Notes: Utilities include: Alliant-West (including CIPCO), and MidAmericanEnergy (including the utilities within its control area).Sources: MEC: MEC file "mec peaks & req1.xls," 8/9/00 (EIA-861); ALT-W:revised Table 1.1.2.1a “Annual Booked Peak Demand at the Firm PeakHour,” 8/8/00.
Energy requirements refer to customers’ kWh usage over the course of a year.Because of the large numbers involved, energy requirements are expressed in
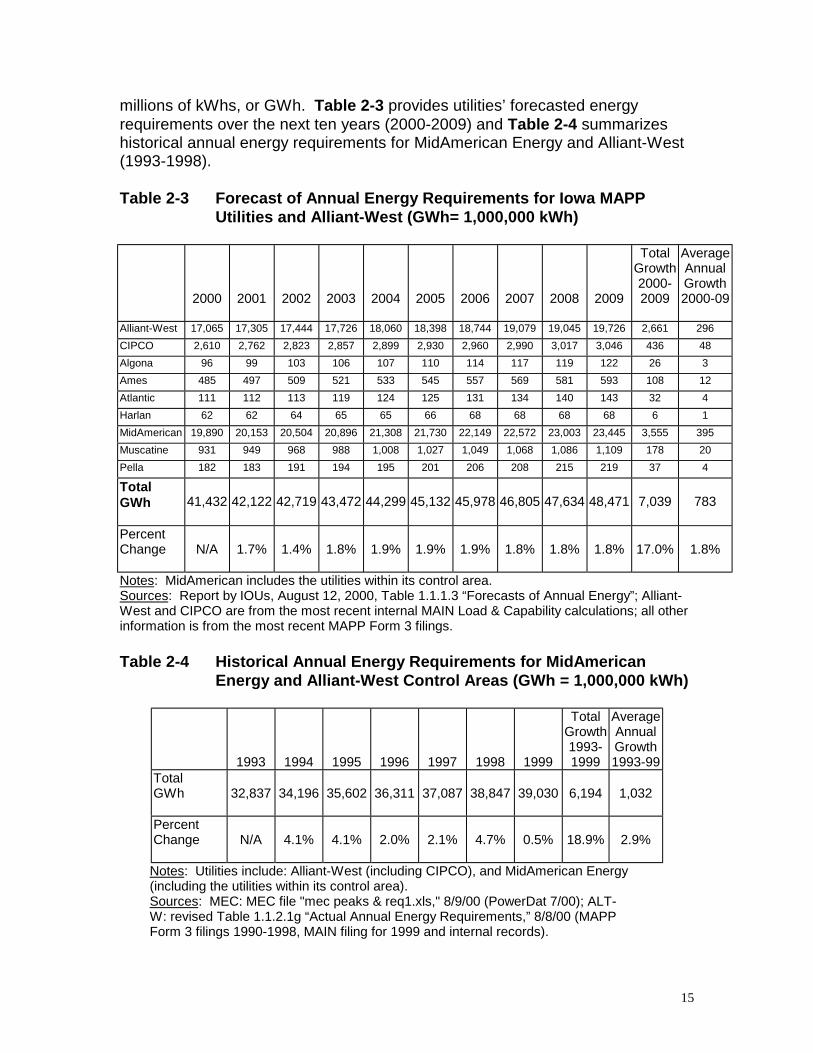
15
millions of kWhs, or GWh. Table 2-3 provides utilities’ forecasted energyrequirements over the next ten years (2000-2009) and Table 2-4 summarizeshistorical annual energy requirements for MidAmerican Energy and Alliant-West(1993-1998).
Table 2-3 Forecast of Annual Energy Requirements for Iowa MAPPUtilities and Alliant-West (GWh= 1,000,000 kWh)
2000 2001 2002 2003 2004 2005 2006 2007 2008 2009
TotalGrowth2000-2009
AverageAnnualGrowth2000-09
Alliant-West 17,065 17,305 17,444 17,726 18,060 18,398 18,744 19,079 19,045 19,726 2,661 296CIPCO 2,610 2,762 2,823 2,857 2,899 2,930 2,960 2,990 3,017 3,046 436 48Algona 96 99 103 106 107 110 114 117 119 122 26 3Ames 485 497 509 521 533 545 557 569 581 593 108 12Atlantic 111 112 113 119 124 125 131 134 140 143 32 4Harlan 62 62 64 65 65 66 68 68 68 68 6 1MidAmerican 19,890 20,153 20,504 20,896 21,308 21,730 22,149 22,572 23,003 23,445 3,555 395Muscatine 931 949 968 988 1,008 1,027 1,049 1,068 1,086 1,109 178 20Pella 182 183 191 194 195 201 206 208 215 219 37 4
TotalGWh 41,432 42,122 42,719 43,472 44,299 45,132 45,978 46,805 47,634 48,471 7,039 783
PercentChange N/A 1.7% 1.4% 1.8% 1.9% 1.9% 1.9% 1.8% 1.8% 1.8% 17.0% 1.8%
Notes: MidAmerican includes the utilities within its control area.Sources: Report by IOUs, August 12, 2000, Table 1.1.1.3 “Forecasts of Annual Energy”; Alliant-West and CIPCO are from the most recent internal MAIN Load & Capability calculations; all otherinformation is from the most recent MAPP Form 3 filings.
Table 2-4 Historical Annual Energy Requirements for MidAmericanEnergy and Alliant-West Control Areas (GWh = 1,000,000 kWh)
1993 1994 1995 1996 1997 1998 1999
TotalGrowth1993-1999
AverageAnnualGrowth1993-99
TotalGWh 32,837 34,196 35,602 36,311 37,087 38,847 39,030 6,194 1,032
PercentChange N/A 4.1% 4.1% 2.0% 2.1% 4.7% 0.5% 18.9% 2.9%
Notes: Utilities include: Alliant-West (including CIPCO), and MidAmerican Energy(including the utilities within its control area).Sources: MEC: MEC file "mec peaks & req1.xls," 8/9/00 (PowerDat 7/00); ALT-W: revised Table 1.1.2.1g “Actual Annual Energy Requirements,” 8/8/00 (MAPPForm 3 filings 1990-1998, MAIN filing for 1999 and internal records).
16
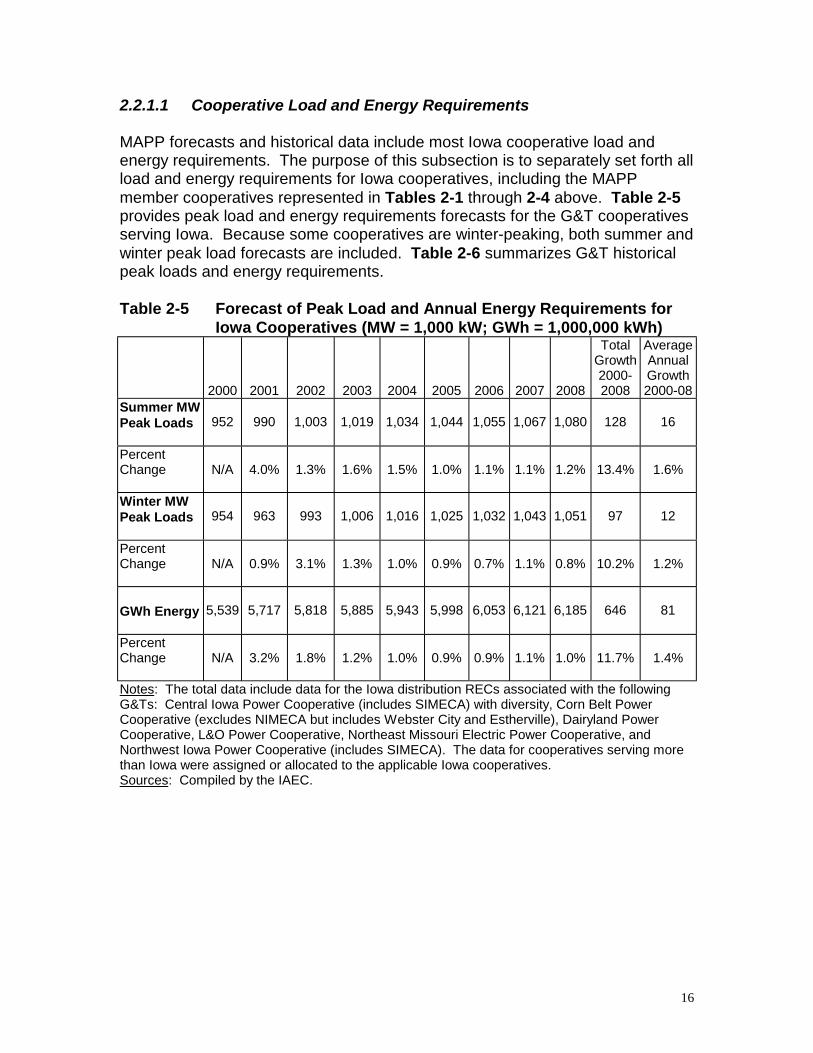
2.2.1.1 Cooperative Load and Energy Requirements
MAPP forecasts and historical data include most Iowa cooperative load andenergy requirements. The purpose of this subsection is to separately set forth allload and energy requirements for Iowa cooperatives, including the MAPPmember cooperatives represented in Tables 2-1 through 2-4 above. Table 2-5provides peak load and energy requirements forecasts for the G&T cooperativesserving Iowa. Because some cooperatives are winter-peaking, both summer andwinter peak load forecasts are included. Table 2-6 summarizes G&T historicalpeak loads and energy requirements.
Table 2-5 Forecast of Peak Load and Annual Energy Requirements forIowa Cooperatives (MW = 1,000 kW; GWh = 1,000,000 kWh)
2000 2001 2002 2003 2004 2005 2006 2007 2008
TotalGrowth2000-2008
AverageAnnualGrowth2000-08
Summer MWPeak Loads 952 990 1,003 1,019 1,034 1,044 1,055 1,067 1,080 128 16
PercentChange N/A 4.0% 1.3% 1.6% 1.5% 1.0% 1.1% 1.1% 1.2% 13.4% 1.6%
Winter MWPeak Loads 954 963 993 1,006 1,016 1,025 1,032 1,043 1,051 97 12
PercentChange N/A 0.9% 3.1% 1.3% 1.0% 0.9% 0.7% 1.1% 0.8% 10.2% 1.2%
GWh Energy 5,539 5,717 5,818 5,885 5,943 5,998 6,053 6,121 6,185 646 81
PercentChange N/A 3.2% 1.8% 1.2% 1.0% 0.9% 0.9% 1.1% 1.0% 11.7% 1.4%
Notes: The total data include data for the Iowa distribution RECs associated with the followingG&Ts: Central Iowa Power Cooperative (includes SIMECA) with diversity, Corn Belt PowerCooperative (excludes NIMECA but includes Webster City and Estherville), Dairyland PowerCooperative, L&O Power Cooperative, Northeast Missouri Electric Power Cooperative, andNorthwest Iowa Power Cooperative (includes SIMECA). The data for cooperatives serving morethan Iowa were assigned or allocated to the applicable Iowa cooperatives.Sources: Compiled by the IAEC.

17
Table 2-6 Historical Peak Load and Annual Energy Requirements forIowa Cooperatives (MW = 1,000 kW; GWh = 1,000,000 kWh)
1995 1996 1997 1998 1999
TotalGrowth1995-1999
AverageAnnualGrowth1995-99
MW PeakLoads 855 888 916 958 997 142 36
PercentChange N/A 3.9% 3.2% 4.6% 4.1% 16.6% 3.9%
GWhEnergy 4,149 4,382 4,603 5,138 5,333 1,184 296
PercentChange N/A 5.6% 5.0% 11.6% 3.8% 28.5% 6.5%
Notes: The total data include data for the Iowa distribution ruralelectric cooperatives associated with the following G&Ts: CentralIowa Power Cooperative (includes SIMECA) with diversity, CornBelt Power Cooperative (excludes NIMECA but includes WebsterCity and Estherville), Dairyland Power Cooperative, L&O PowerCooperative, Northeast Missouri Electric Power Cooperative andNorthwest Iowa Power Cooperative (includes SIMECA). The datafor cooperatives serving more than Iowa were assigned orallocated to the applicable Iowa cooperatives.Sources: Compiled by the IAEC.
2.2.1.2 Municipal Utility Load and Energy Requirements
The purpose of this subsection is to separately set forth all electric load andenergy requirements for Iowa municipal utilities, including MAPP member loadand energy requirements represented in Tables 2-1 through 2-4 above. Table2-7 summarizes total historical peak load and annual energy requirements forIowa municipal utilities, for the period 1993-1998.
18
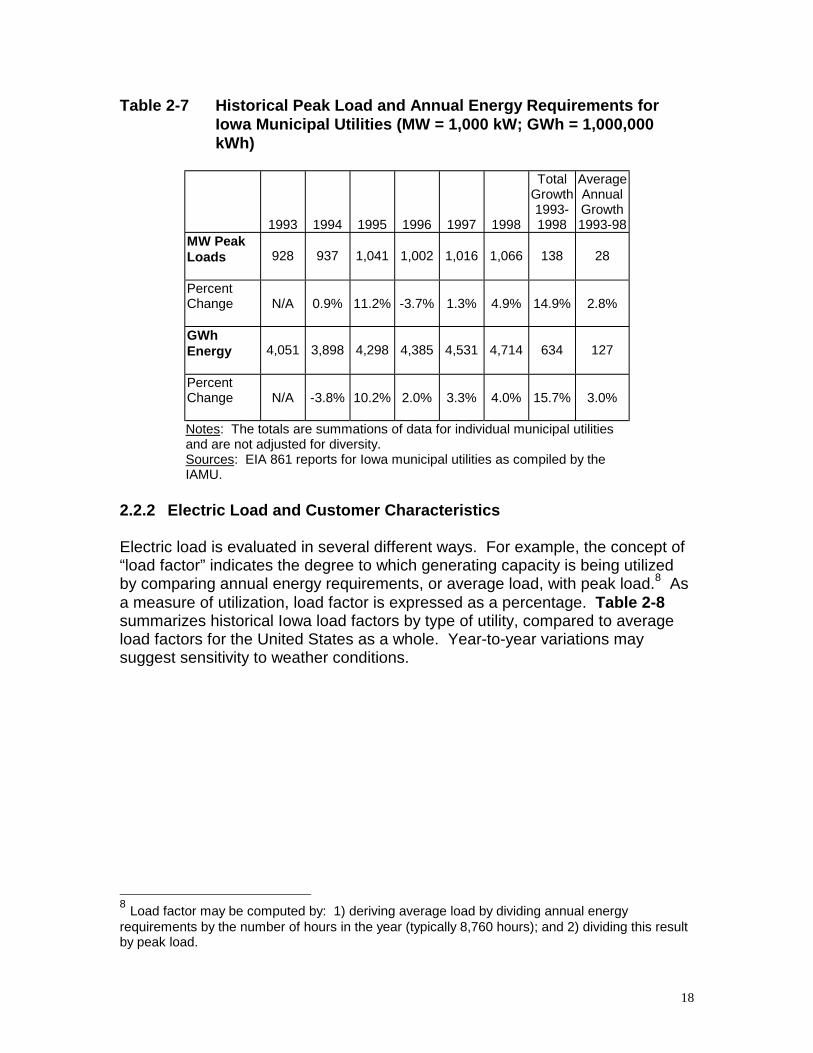
Table 2-7 Historical Peak Load and Annual Energy Requirements forIowa Municipal Utilities (MW = 1,000 kW; GWh = 1,000,000kWh)
1993 1994 1995 1996 1997 1998
TotalGrowth1993-1998
AverageAnnualGrowth1993-98
MW PeakLoads 928 937 1,041 1,002 1,016 1,066 138 28
PercentChange N/A 0.9% 11.2% -3.7% 1.3% 4.9% 14.9% 2.8%
GWhEnergy 4,051 3,898 4,298 4,385 4,531 4,714 634 127
PercentChange N/A -3.8% 10.2% 2.0% 3.3% 4.0% 15.7% 3.0%
Notes: The totals are summations of data for individual municipal utilitiesand are not adjusted for diversity.Sources: EIA 861 reports for Iowa municipal utilities as compiled by theIAMU.
2.2.2 Electric Load and Customer Characteristics
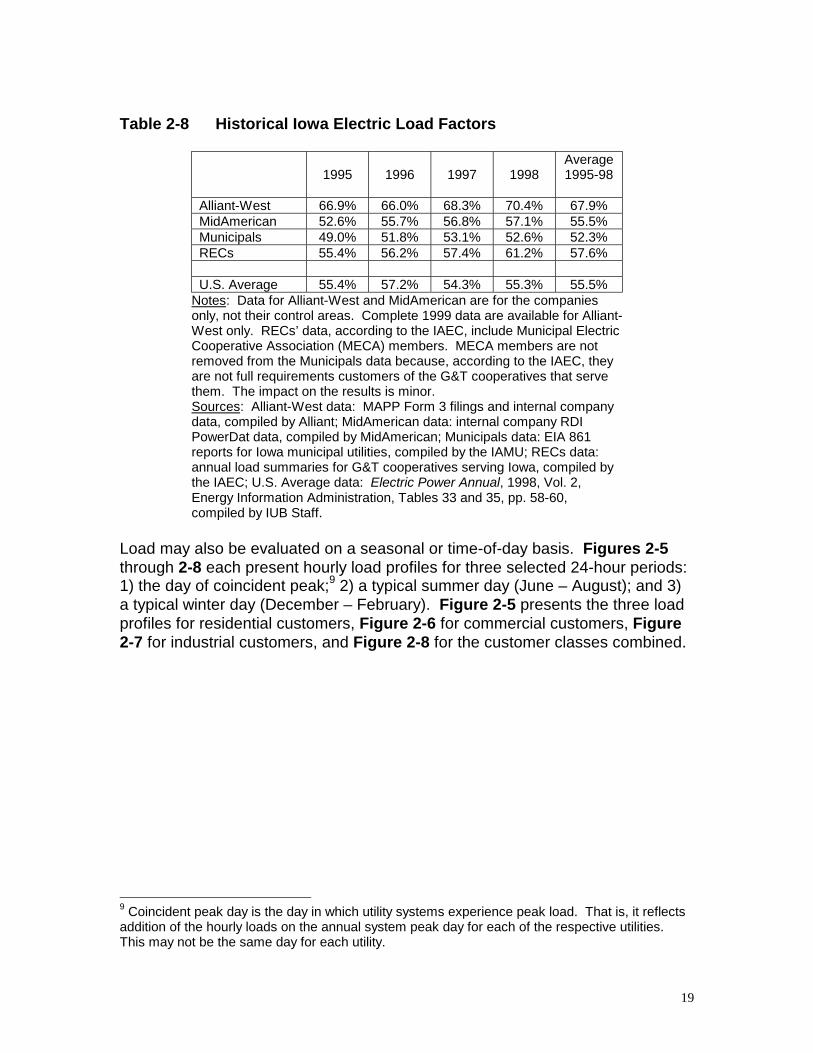
Electric load is evaluated in several different ways. For example, the concept of“load factor” indicates the degree to which generating capacity is being utilizedby comparing annual energy requirements, or average load, with peak load.8 Asa measure of utilization, load factor is expressed as a percentage. Table 2-8summarizes historical Iowa load factors by type of utility, compared to averageload factors for the United States as a whole. Year-to-year variations maysuggest sensitivity to weather conditions.
8 Load factor may be computed by: 1) deriving average load by dividing annual energyrequirements by the number of hours in the year (typically 8,760 hours); and 2) dividing this resultby peak load.
19
Table 2-8 Historical Iowa Electric Load Factors
1995 1996 1997 1998Average1995-98
Alliant-West 66.9% 66.0% 68.3% 70.4% 67.9% MidAmerican 52.6% 55.7% 56.8% 57.1% 55.5% Municipals 49.0% 51.8% 53.1% 52.6% 52.3% RECs 55.4% 56.2% 57.4% 61.2% 57.6%
U.S. Average 55.4% 57.2% 54.3% 55.3% 55.5%Notes: Data for Alliant-West and MidAmerican are for the companiesonly, not their control areas. Complete 1999 data are available for Alliant-West only. RECs’ data, according to the IAEC, include Municipal ElectricCooperative Association (MECA) members. MECA members are notremoved from the Municipals data because, according to the IAEC, theyare not full requirements customers of the G&T cooperatives that servethem. The impact on the results is minor.Sources: Alliant-West data: MAPP Form 3 filings and internal companydata, compiled by Alliant; MidAmerican data: internal company RDIPowerDat data, compiled by MidAmerican; Municipals data: EIA 861reports for Iowa municipal utilities, compiled by the IAMU; RECs data:annual load summaries for G&T cooperatives serving Iowa, compiled bythe IAEC; U.S. Average data: Electric Power Annual, 1998, Vol. 2,Energy Information Administration, Tables 33 and 35, pp. 58-60,compiled by IUB Staff.
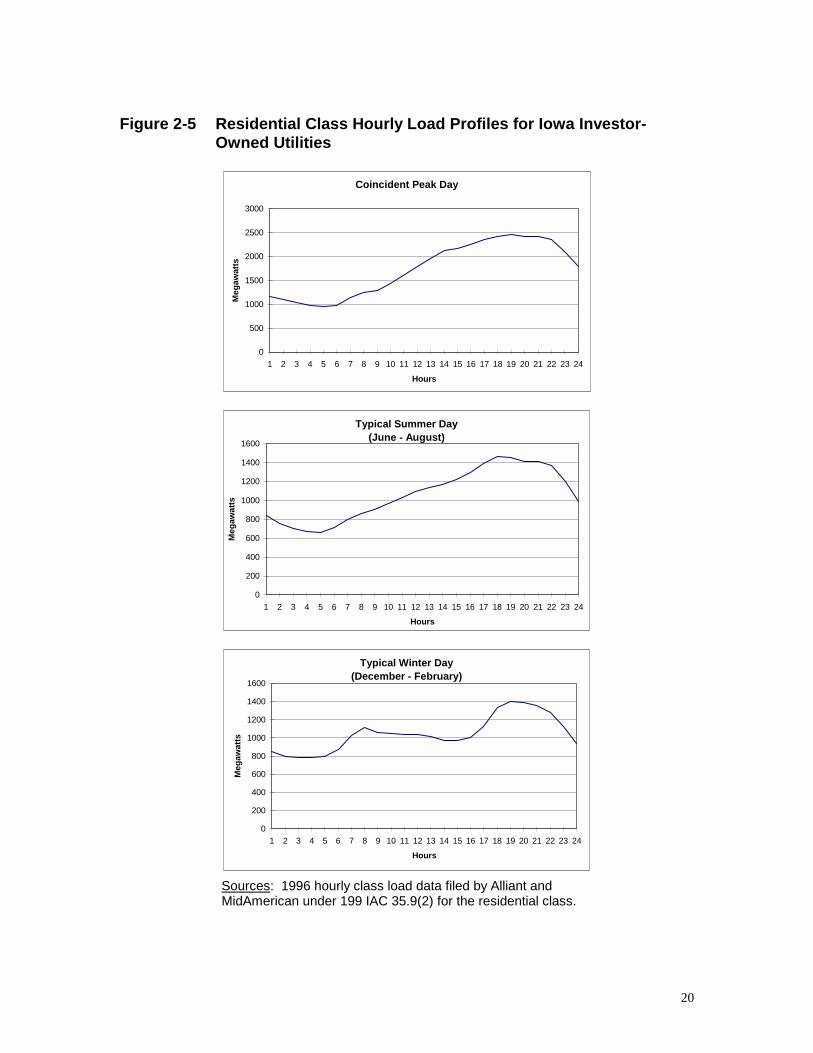
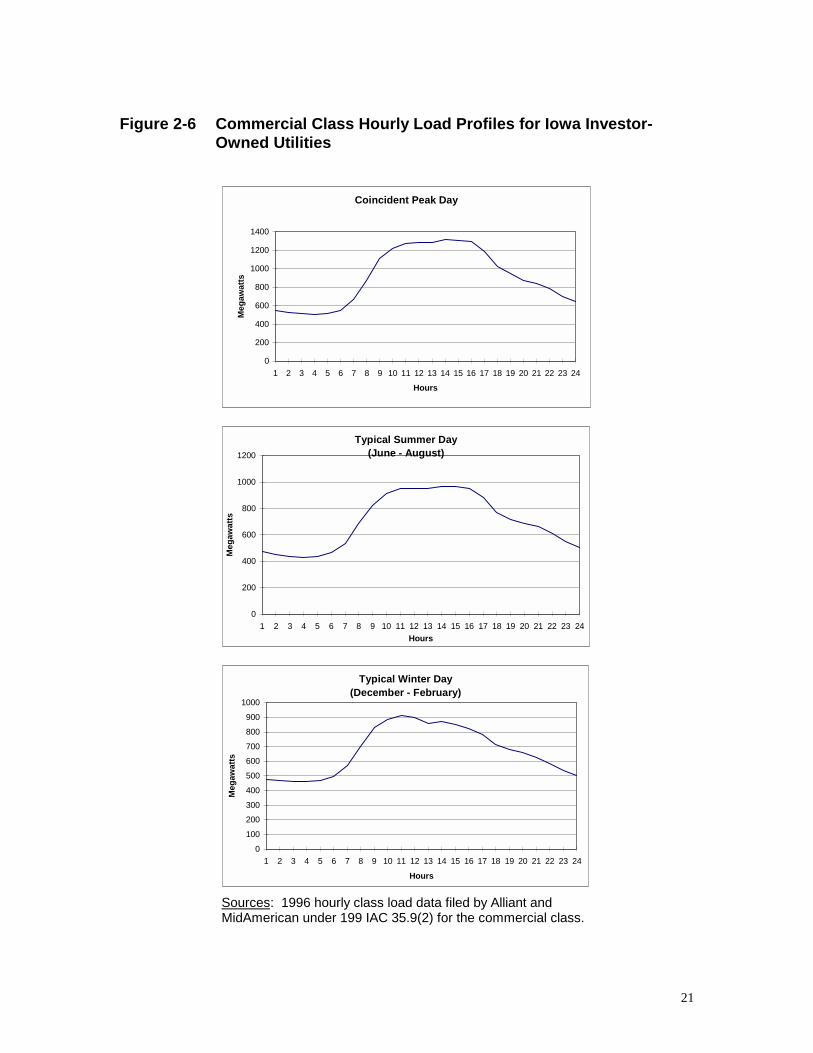
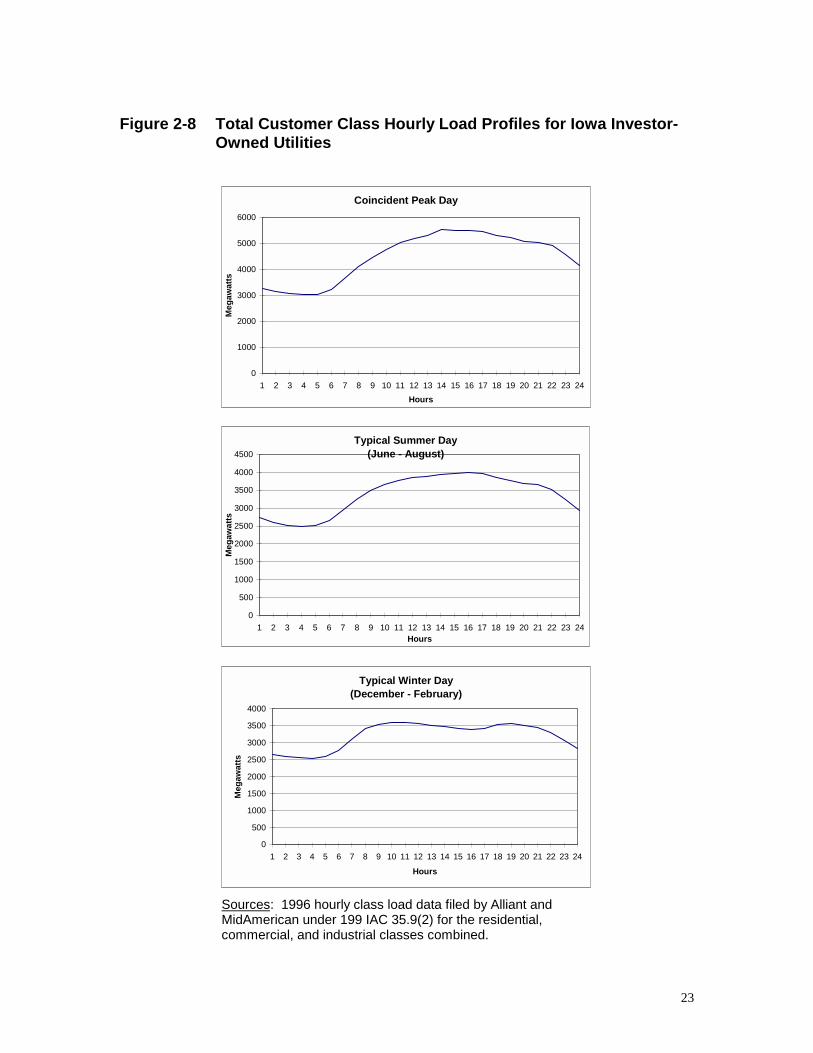
Load may also be evaluated on a seasonal or time-of-day basis. Figures 2-5through 2-8 each present hourly load profiles for three selected 24-hour periods:1) the day of coincident peak;9 2) a typical summer day (June – August); and 3)a typical winter day (December – February). Figure 2-5 presents the three loadprofiles for residential customers, Figure 2-6 for commercial customers, Figure2-7 for industrial customers, and Figure 2-8 for the customer classes combined.
9 Coincident peak day is the day in which utility systems experience peak load. That is, it reflectsaddition of the hourly loads on the annual system peak day for each of the respective utilities.This may not be the same day for each utility.
20
Figure 2-5 Residential Class Hourly Load Profiles for Iowa Investor-Owned Utilities
Typical Summer Day(June - August)
0
200
400
600
800
1000
1200
1400
1600
1 2 3 4 5 6 7 8 9 10 11 12 13 14 15 16 17 18 19 20 21 22 23 24
Hours
Meg
awat
ts
Typical Winter Day(December - February)
0
200
400
600
800
1000
1200
1400
1600
1 2 3 4 5 6 7 8 9 10 11 12 13 14 15 16 17 18 19 20 21 22 23 24
Hours
Meg
awat
ts
Coincident Peak Day
0
500
1000
1500
2000
2500
3000
1 2 3 4 5 6 7 8 9 10 11 12 13 14 15 16 17 18 19 20 21 22 23 24
Hours
Meg
awat
ts
Sources: 1996 hourly class load data filed by Alliant andMidAmerican under 199 IAC 35.9(2) for the residential class.
21
Figure 2-6 Commercial Class Hourly Load Profiles for Iowa Investor-Owned Utilities
Typical Summer Day(June - August)
0
200
400
600
800
1000
1200
1 2 3 4 5 6 7 8 9 10 11 12 13 14 15 16 17 18 19 20 21 22 23 24Hours
Meg
awat
ts
Typical Winter Day(December - February)
0
100
200
300
400
500
600
700
800
900
1000
1 2 3 4 5 6 7 8 9 10 11 12 13 14 15 16 17 18 19 20 21 22 23 24
Hours
Meg
awat
ts
Coincident Peak Day
0
200
400
600
800
1000
1200
1400
1 2 3 4 5 6 7 8 9 10 11 12 13 14 15 16 17 18 19 20 21 22 23 24
Hours
Meg
awat
ts
Sources: 1996 hourly class load data filed by Alliant andMidAmerican under 199 IAC 35.9(2) for the commercial class.

22
Figure 2-7 Industrial Class Hourly Load Profiles for Iowa Investor-OwnedUtilities
Typical Summer Day(June - August)
0
200
400
600
800
1000
1200
1400
1600
1800
2000
1 2 3 4 5 6 7 8 9 10 11 12 13 14 15 16 17 18 19 20 21 22 23 24Hours
Meg
awat
ts
Typical Winter Day(December - February)
0
200
400
600
800
1000
1200
1400
1600
1800
1 2 3 4 5 6 7 8 9 10 11 12 13 14 15 16 17 18 19 20 21 22 23 24
Hours
Meg
awat
ts
Coincident Peak Day
0
500
1000
1500
2000
2500
1 2 3 4 5 6 7 8 9 10 11 12 13 14 15 16 17 18 19 20 21 22 23 24
Hours
Meg
awat
ts
Sources: 1996 hourly class load data filed by Alliant andMidAmerican under 199 IAC 35.9(2) for the industrial class.
23
Figure 2-8 Total Customer Class Hourly Load Profiles for Iowa Investor-Owned Utilities
Typical Summer Day(June - August)
0
500
1000
1500
2000
2500
3000
3500
4000
4500
1 2 3 4 5 6 7 8 9 10 11 12 13 14 15 16 17 18 19 20 21 22 23 24Hours
Meg
awat
ts
Typical Winter Day(December - February)
0
500
1000
1500
2000
2500
3000
3500
4000
1 2 3 4 5 6 7 8 9 10 11 12 13 14 15 16 17 18 19 20 21 22 23 24
Hours
Meg
awat
ts
Coincident Peak Day
0
1000
2000
3000
4000
5000
6000
1 2 3 4 5 6 7 8 9 10 11 12 13 14 15 16 17 18 19 20 21 22 23 24Hours
Meg
awat
ts
Sources: 1996 hourly class load data filed by Alliant andMidAmerican under 199 IAC 35.9(2) for the residential,commercial, and industrial classes combined.

24
Load and energy requirements can also vary by geographic area. Table 2-9shows differences in historical electric sales for the largest Iowa metropolitanareas served by IOUs (Alliant-West and MidAmerican) and by municipal utilities.
Table 2-9 Iowa Historical Electric Sales by Metropolitan Area and for theState As a Whole (GWH = 1,000,000 kWh)
MetropolitanArea
ServingUtility
1995GWH
1996GWH
1997GWH
1998GWH
1999GWH
AverageAnnualGrowth1995-98
AverageAnnualGrowth1995-99
Cedar Rapids Alliant 2,268 2,479 2,690 2,767 2,801 6.9% 5.4%Council Bluffs MidAm 541 596 595 620 621 4.6% 3.5%Davenport MidAm 1,719 1,722 1,762 1,730 1,993 0.2% 3.8%Des Moines MidAm 4,010 4,083 4,185 4,302 4,435 2.4% 2.6%Dubuque Alliant 981 960 982 992 981 0.4% 0.0%Iowa City MidAm 779 785 789 809 924 1.3% 4.4%Sioux City MidAm 910 917 938 963 974 1.9% 1.7%Waterloo MidAm 1,236 1,222 1,240 1,340 1,254 2.7% 0.4%
Ames Muni 386 412 473 502 N/A 9.2% N/ACedar Falls Muni 330 330 339 351 N/A 2.0% N/ADenison Muni 122 123 129 133 N/A 2.9% N/AMuscatine Muni 819 841 856 889 N/A 2.8% N/APella Muni 146 154 161 170 N/A 5.3% N/ASpencer Muni 127 131 135 134 N/A 1.9% N/AWaverly Muni 99 104 107 112 N/A 4.3% N/AWebster City Muni 119 123 124 134 N/A 3.9% N/A
State of Iowa All 34,301 34,999 36,148 37,318 N/A 2.8% N/ASources: Alliant-West data: compiled by Alliant; MidAmerican data: compiled by MidAmerican; Municipaldata: EIA 861 reports for Iowa municipal utilities, compiled by the IAMU; State of Iowa data: ElectricPower Annual, 1995-98, Energy Information Administration, compiled by IUB Staff.
2.2.3 Energy Efficiency and Load Management
2.2.3.1 Program Descriptions and Discussion
Iowa Code Sections 476.6(17) and 476.6(19) authorize a variety of initiativesintended to improve the energy efficiency of Iowa homes and businesses.Energy Efficiency Programs now being implemented by IOUs include:
• Energy savings or Energy Efficiency programs save annual use of energy(kWh) and reduce peak load (kW). Examples include: 1) residentialprograms providing rebates and loans for home insulation, high efficiencyfurnaces, air conditioners, and other appliances; and 2) nonresidentialprograms providing rebates for commercial lighting, heating, cooling and
25
refrigeration, or high-efficiency industrial motors and improvements tomanufacturing processes.
• Low-Income programs target low-income customers for weatherization andother energy efficiency measures.
• Tree Planting programs provide assistance to customers and communitiesto plant and care for trees.
• Load management programs provide incentives to customers to changetheir patterns of energy use, shifting load away from expensive peak periods.Typical programs include: 1) direct control of air conditioners; 2) discountsfor industrial customers willing to interrupt their usage during peak periods;and 3) time-of-use rates that shift peak period usage by pricing higher duringpeak periods and lower during off-peak periods.
• Research and development programs are carried out through the IowaEnergy Center and the Center for Global and Regional EnvironmentalResearch. These programs are funded by a surcharge on all utilities,including municipal utilities and RECs.
Load management by utilities is typically achieved through programs that offercustomers lower rates or rebates for reducing the customer's use of electricity ata future point in time. The customer allows the utility to directly shut off part ofthe customer's load (direct load control) or agrees to reduce load by a certainamount (interruptible load) when the utility calls on the customer to do so,typically during peak load periods.
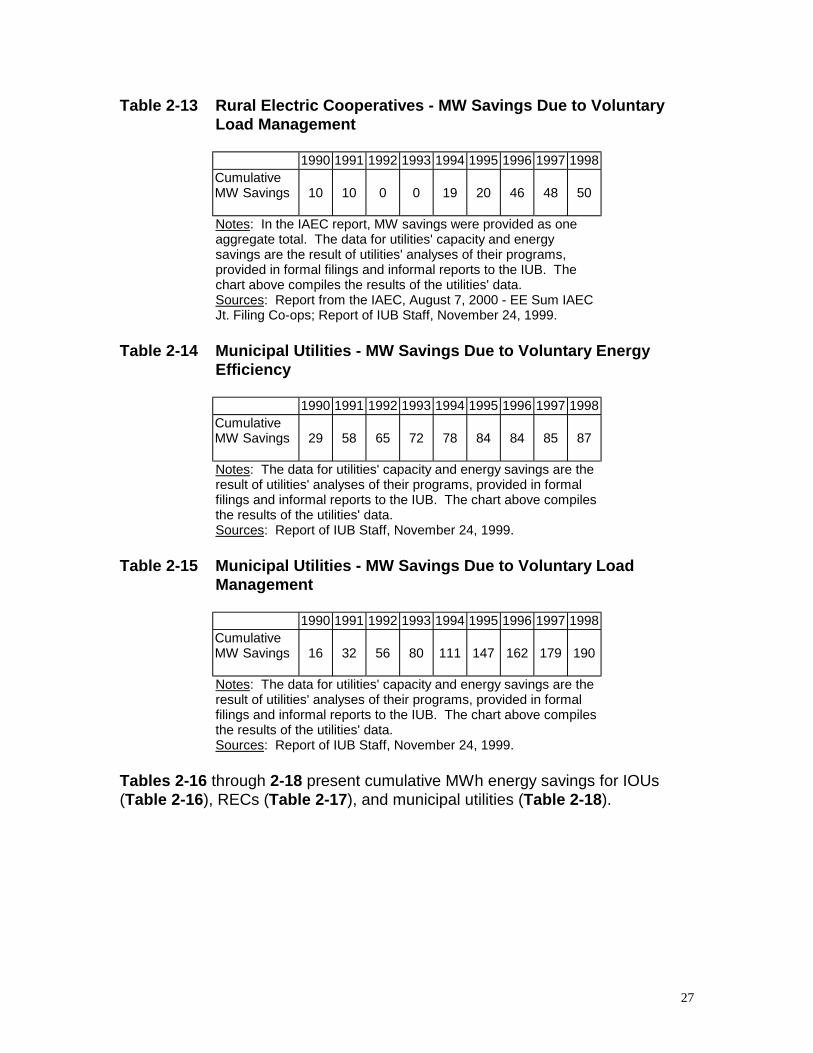
2.2.3.2 Energy Efficiency and Load Management Savings
Energy efficiency and load management have succeeded in reducing both loadand energy requirements for Iowa electric utilities. Tables 2-10 through 2-15present cumulative MW load savings from both energy efficiency and loadmanagement programs for IOUs (Tables 2-10 and 2-11), RECs (Tables 2-12and 2-13), and municipal utilities (Tables 2-14 and 2-15).

26
Table 2-10 Investor-Owned Utilities - MW Savings Due To EnergyEfficiency
1990 1991 1992 1993 1994 1995 1996 1997 1998CumulativeMW Savings 3 9 19 37 63 93 123 142 159
Notes: The table above reflects only MW savings for energyefficiency. IOU source data included savings due to loadmanagement.Sources: Report by IOUs, August 12, 2000, Tables 1.4.1.2.c and1.4.1.2.d; IUB MW Data - IUB Staff Report of November 24,1999.
Table 2-11 Investor-Owned Utilities - MW Savings Due To LoadManagement
1990 1991 1992 1993 1994 1995 1996 1997 1998CumulativeMW Savings 176 192 246 451 514 565 582 655 704
Notes: IOU data includes 99 MW of interruptible load for IESUtilities prior to the initiation of DSM programs. IOU dataincludes savings associated with all load management programs,including 1997-1999 curtailments for the former Iowa-Illinois Gasand Electric. A comparison with the data provided by IOUs forthe IUB Report of November 24, 1999 shows approximately 175MW of load management savings existing prior to 1990 andcredited to Energy Efficiency through 1998. The comparison alsoshows additional IOU load management of 14 MW in 1997 and47 MW in 1998.Sources: Report by IOUs, August 12, 2000, Tables 1.4.1.2.c and1.4.1.2.d; IUB MW Data - IUB Staff Report of November 24,1999.
Table 2-12 Rural Electric Cooperatives - MW Savings Due to VoluntaryEnergy Efficiency
1990 1991 1992 1993 1994 1995 1996 1997 1998CumulativeMW Savings 12 17 26 35 15 17 14 17 18
Notes: In the IAEC report, MW savings were provided as oneaggregate total. The data for utilities' capacity and energysavings are the result of utilities' analyses of their programs,provided in formal filings and informal reports to the IUB. Thechart above compiles the results of the utilities' data.Sources: Data from the IAEC- EE Sum IAEC Jt. Filing Co-ops;Report of IUB Staff, November 24, 1999.
27
Table 2-13 Rural Electric Cooperatives - MW Savings Due to VoluntaryLoad Management
1990 1991 1992 1993 1994 1995 1996 1997 1998CumulativeMW Savings 10 10 0 0 19 20 46 48 50
Notes: In the IAEC report, MW savings were provided as oneaggregate total. The data for utilities' capacity and energysavings are the result of utilities' analyses of their programs,provided in formal filings and informal reports to the IUB. Thechart above compiles the results of the utilities' data.Sources: Report from the IAEC, August 7, 2000 - EE Sum IAECJt. Filing Co-ops; Report of IUB Staff, November 24, 1999.
Table 2-14 Municipal Utilities - MW Savings Due to Voluntary EnergyEfficiency
1990 1991 1992 1993 1994 1995 1996 1997 1998CumulativeMW Savings 29 58 65 72 78 84 84 85 87
Notes: The data for utilities' capacity and energy savings are theresult of utilities' analyses of their programs, provided in formalfilings and informal reports to the IUB. The chart above compilesthe results of the utilities' data.Sources: Report of IUB Staff, November 24, 1999.
Table 2-15 Municipal Utilities - MW Savings Due to Voluntary LoadManagement
1990 1991 1992 1993 1994 1995 1996 1997 1998CumulativeMW Savings 16 32 56 80 111 147 162 179 190
Notes: The data for utilities' capacity and energy savings are theresult of utilities' analyses of their programs, provided in formalfilings and informal reports to the IUB. The chart above compilesthe results of the utilities' data.Sources: Report of IUB Staff, November 24, 1999.
Tables 2-16 through 2-18 present cumulative MWh energy savings for IOUs(Table 2-16), RECs (Table 2-17), and municipal utilities (Table 2-18).

28
Table 2-16 Investor-Owned Utilities - MWh Savings Due to EnergyEfficiency
1990 1991 1992 1993 1994 1995 1996 1997 1998 1999CumulativeMWhSavings
6,821 31,172 66,386 145,805 258,202 390,799 499,586 592,874 654,607 696,039
Notes: Comparison of the total of the IOU tables with data provided for the IUB Staff Report ofNovember 24, 1999 shows very good correspondence among the numbers. The data for utilities'capacity and energy savings are the result of utilities' analyses of their programs, provided informal filings and informal reports to the IUB. The chart above compiles the results of the utilities'data.Sources: Report by IOUs, August 12, 2000, Tables 1.4.1.2.a and 1.4.1.2.b.
Table 2-17 Rural Electric Cooperatives - MWh Savings Due to VoluntaryEnergy Efficiency
1990 1991 1992 1993 1994 1995 1996 1997 1998CumulativeMWh Savings 13,902 19,585 22,697 28,464 38,817 46,765 58,923 68,672 76,031
Notes: The data for utilities' capacity and energy savings are the result of utilities'analyses of their programs, provided in formal filings and informal reports to theIUB. The chart above compiles the results of the utilities' data.Sources: Report of IUB Staff, November 24, 1999.
Table 2-18 Municipal Utilities - MWh Savings Due to Voluntary EnergyEfficiency
1990 1991 1992 1993 1994 1995 1996 1997 1998CumulativeMWh Savings 23,645 47,290 55,656 64,021 73,820 83,227 89,925 96,882 100,010
Notes: The data for utilities' capacity and energy savings are the result of utilities'analyses of their programs, provided in formal filings and informal reports to the IUB.The chart above compiles the results of the utilities' data.Sources: Report of IUB Staff, November 24, 1999.
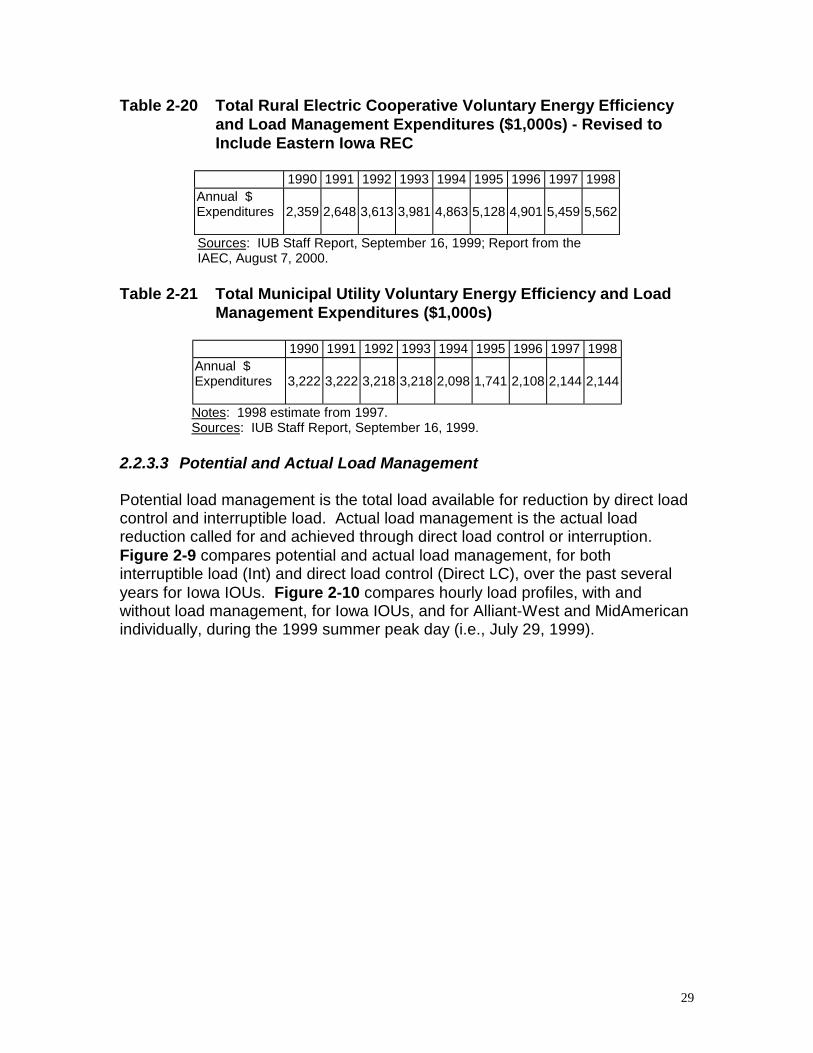
Tables 2-19 through 2-21 present annual expenditures for energy efficiency andload management by IOUs (Table 2-19), RECs (Table 2-20), and municipalutilities (Table 2-21).
Table 2-19 Total Investor-Owned Utility Energy Efficiency and LoadManagement Expenditures ($1,000s)
1990 1991 1992 1993 1994 1995 1996 1997 1998 1999Annual $Expenditures 3,185 13,146 19,921 30,775 41,855 45,859 42,743 31,359 30,460 27,433
Sources: IOU Report, August 2, 2000, Tables 1.4.1.1.a and 1.4.1.1.b.
29
Table 2-20 Total Rural Electric Cooperative Voluntary Energy Efficiencyand Load Management Expenditures ($1,000s) - Revised toInclude Eastern Iowa REC
1990 1991 1992 1993 1994 1995 1996 1997 1998Annual $Expenditures 2,359 2,648 3,613 3,981 4,863 5,128 4,901 5,459 5,562
Sources: IUB Staff Report, September 16, 1999; Report from theIAEC, August 7, 2000.
Table 2-21 Total Municipal Utility Voluntary Energy Efficiency and LoadManagement Expenditures ($1,000s)
1990 1991 1992 1993 1994 1995 1996 1997 1998Annual $Expenditures 3,222 3,222 3,218 3,218 2,098 1,741 2,108 2,144 2,144
Notes: 1998 estimate from 1997.Sources: IUB Staff Report, September 16, 1999.
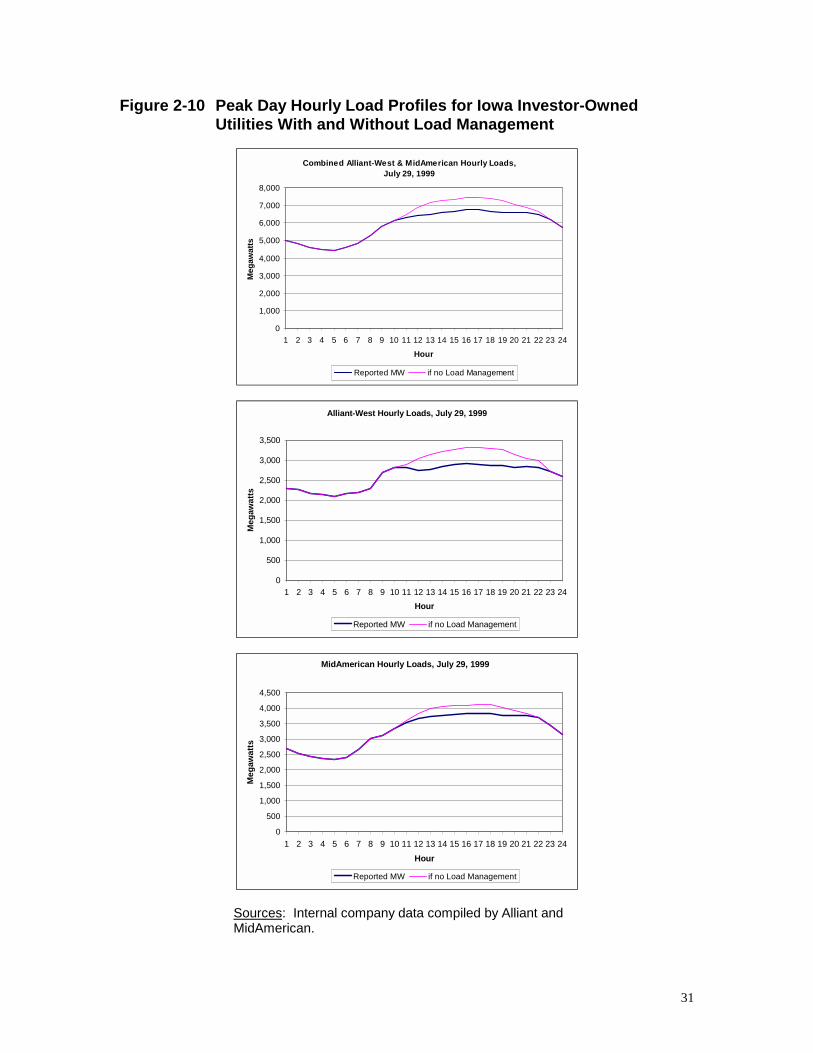
2.2.3.3 Potential and Actual Load Management
Potential load management is the total load available for reduction by direct loadcontrol and interruptible load. Actual load management is the actual loadreduction called for and achieved through direct load control or interruption.Figure 2-9 compares potential and actual load management, for bothinterruptible load (Int) and direct load control (Direct LC), over the past severalyears for Iowa IOUs. Figure 2-10 compares hourly load profiles, with andwithout load management, for Iowa IOUs, and for Alliant-West and MidAmericanindividually, during the 1999 summer peak day (i.e., July 29, 1999).

30
Figure 2-9 Interruptions and Peak Load Control for Investor-OwnedUtilities -- Potential and Actual
Electric Peak Load Interrupted - IOUs - Total Potential and Actual Interruption
0
100
200
300
400
500
600
700
800
900
1990 1991 1992 1993 1994 1995 1996 1997 1998 1999
Peak
MW
Total IntNotCalled
Total IntCalled
Electric Peak MW - IOUS - Direct Load Control - Potential and Actual
0
10
20
30
40
50
60
70
80
90
1990 1991 1992 1993 1994 1995 1996 1997 1998 1999
Peak
MW
DirectLC NotCalled
DirectLoadControlCalled
Sources: Report by IOUs, August 12, 2000, Table 1.1.2.1b “Estimated Interruption Called(MWs),” Table 1.1.2.1c “Estimated Interruption Not Called (MWs),” Table 1.1.2.1d “Estimated AirConditioner/Water Heating Called (MWs),” Table 1.1.2.1e “Estimated Air Conditioner/WaterHeating Not Called (MWs).”
31
Figure 2-10 Peak Day Hourly Load Profiles for Iowa Investor-OwnedUtilities With and Without Load Management
Combined Alliant-West & MidAmerican Hourly Loads,July 29, 1999
0
1,000
2,000
3,000
4,000
5,000
6,000
7,000
8,000
1 2 3 4 5 6 7 8 9 10 11 12 13 14 15 16 17 18 19 20 21 22 23 24
Hour
Meg
awat
ts
Reported MW if no Load Management
Alliant-West Hourly Loads, July 29, 1999
0
500
1,000
1,500
2,000
2,500
3,000
3,500
1 2 3 4 5 6 7 8 9 10 11 12 13 14 15 16 17 18 19 20 21 22 23 24Hour
Meg
awat
ts
Reported MW if no Load Management
MidAmerican Hourly Loads, July 29, 1999
0
500
1,000
1,500
2,000
2,500
3,000
3,500
4,000
4,500
1 2 3 4 5 6 7 8 9 10 11 12 13 14 15 16 17 18 19 20 21 22 23 24Hour
Meg
awat
ts
Reported MW if no Load Management
Sources: Internal company data compiled by Alliant andMidAmerican.
32
2.3 Electric Supply
Several sources of supply are available to meet the customer demand describedin subsection 2.2. An Iowa utility may generate its own power for use by itsconsumers or it may purchase power from another utility or power marketereither in or outside the state. Subsection 2.3 provides data on the owned-generation of Iowa’s utilities and IOU data related to purchased powercommitments. Price data from the emerging wholesale market is provided, aswell as other regional supply considerations. Limited data on the air emissionsfrom fossil-fuel-fired generation are also presented. The subsection concludeswith a brief discussion of Iowa’s generation siting requirements.
2.3.1 Existing Generating Plants
Generating plants use a variety of fuel sources including water (or hydro),uranium (or nuclear), coal, gas, oil, biomass, and wind. Generating units usingcoal, gas, or oil are referred to as fossil-fuel-fired generating units. The size of agenerating unit is commonly defined in megawatts (MW). The MW designationrefers to the generating capacity of the unit. MW capacity multiplied by thenumber of hours in the year (8760) provides the maximum amount of electricityin megawatt hours (MWh) the plant is capable of producing in a given yearassuming the unit is never unavailable due to maintenance or forced outage.Appendix D provides a list of utility generators providing power to Iowaconsumers. Appendix E provides a list of non-utility generators providing powerto Iowa consumers.10
This subsection provides historical information for all generating units owned byAlliant-West, all units owned by MidAmerican, and generating units owned byother Iowa utilities. Throughout this subsection, these generating units, plusMidAmerican’s long-term capacity purchase from Nebraska Public PowerDistrict’s Cooper Station (“Cooper Contract”), will be labeled “Iowa utility owned-generation.” With the exception of the Cooper Contract, the data do not includepurchased power commitments unless explicitly noted.11 In addition, the plantdata do not include generating facilities owned by non-Iowa entities selling powerto Iowa utilities such as the generating facilities of Associated ElectricCooperative, Inc., Dairyland Power Cooperative, Ameren, the Western AreaPower Administration, Basin Electric Power Cooperative, and Missouri RiverEnergy Services.12 Since purchased power (with the noted exceptions) is notincluded in these data, it would be inappropriate to use these data to 10 These lists are not all inclusive.11 In noted cases, the data include IOU wind contracts.12 Iowa municipal utilities that are members of Missouri River Energy Services (MRES) have rightsof ownership in the Laramie River Station through MRES. The figures and tables in subsection2.3 do not include this owned-generation. According to the IAMU, in 1999, Iowa utility sales fromMRES equaled 185,419,770 kWh. This is less than one-half of one percent of total Iowa sales in1999.
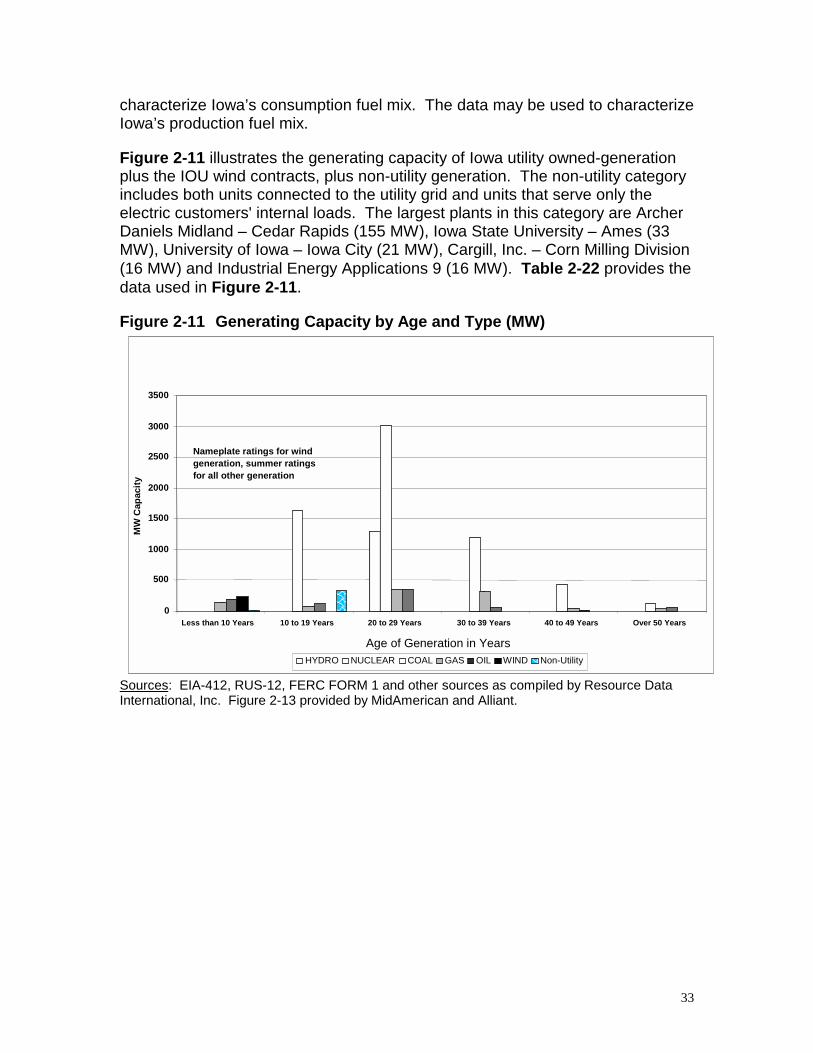
33
characterize Iowa’s consumption fuel mix. The data may be used to characterizeIowa’s production fuel mix.
Figure 2-11 illustrates the generating capacity of Iowa utility owned-generationplus the IOU wind contracts, plus non-utility generation. The non-utility categoryincludes both units connected to the utility grid and units that serve only theelectric customers' internal loads. The largest plants in this category are ArcherDaniels Midland – Cedar Rapids (155 MW), Iowa State University – Ames (33MW), University of Iowa – Iowa City (21 MW), Cargill, Inc. – Corn Milling Division(16 MW) and Industrial Energy Applications 9 (16 MW). Table 2-22 provides thedata used in Figure 2-11.
Figure 2-11 Generating Capacity by Age and Type (MW)
Sources: EIA-412, RUS-12, FERC FORM 1 and other sources as compiled by Resource DataInternational, Inc. Figure 2-13 provided by MidAmerican and Alliant.
0
500
1000
1500
2000
2500
3000
3500
Less than 10 Years 10 to 19 Years 20 to 29 Years 30 to 39 Years 40 to 49 Years Over 50 Years
Age of Generation in Years
MW
Cap
acity
HYDRO NUCLEAR COAL GAS OIL WIND Non-Utility
Nameplate ratings for windgeneration, summer ratingsfor all other generation
34
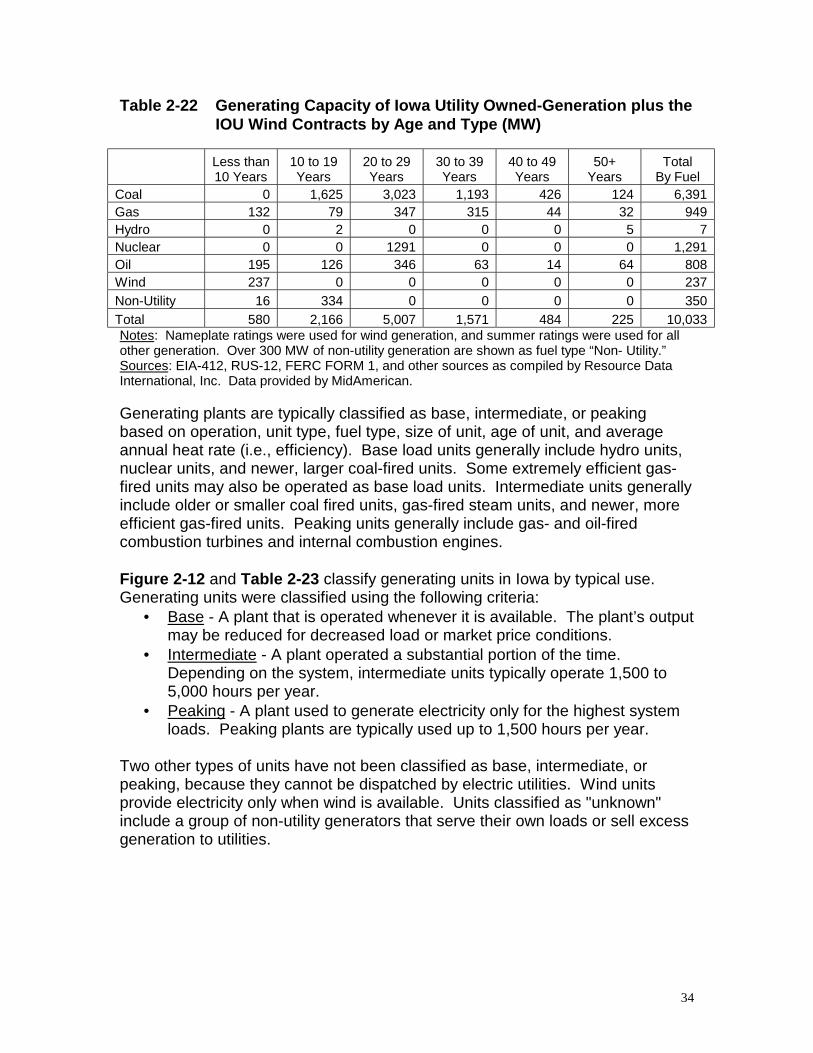
Table 2-22 Generating Capacity of Iowa Utility Owned-Generation plus theIOU Wind Contracts by Age and Type (MW)
Less than10 Years
10 to 19Years
20 to 29Years
30 to 39Years
40 to 49Years
50+Years
TotalBy Fuel
Coal 0 1,625 3,023 1,193 426 124 6,391Gas 132 79 347 315 44 32 949Hydro 0 2 0 0 0 5 7Nuclear 0 0 1291 0 0 0 1,291Oil 195 126 346 63 14 64 808Wind 237 0 0 0 0 0 237Non-Utility 16 334 0 0 0 0 350Total 580 2,166 5,007 1,571 484 225 10,033Notes: Nameplate ratings were used for wind generation, and summer ratings were used for allother generation. Over 300 MW of non-utility generation are shown as fuel type “Non- Utility.”Sources: EIA-412, RUS-12, FERC FORM 1, and other sources as compiled by Resource DataInternational, Inc. Data provided by MidAmerican.
Generating plants are typically classified as base, intermediate, or peakingbased on operation, unit type, fuel type, size of unit, age of unit, and averageannual heat rate (i.e., efficiency). Base load units generally include hydro units,nuclear units, and newer, larger coal-fired units. Some extremely efficient gas-fired units may also be operated as base load units. Intermediate units generallyinclude older or smaller coal fired units, gas-fired steam units, and newer, moreefficient gas-fired units. Peaking units generally include gas- and oil-firedcombustion turbines and internal combustion engines.
Figure 2-12 and Table 2-23 classify generating units in Iowa by typical use.Generating units were classified using the following criteria:
• Base - A plant that is operated whenever it is available. The plant’s outputmay be reduced for decreased load or market price conditions.
• Intermediate - A plant operated a substantial portion of the time.Depending on the system, intermediate units typically operate 1,500 to5,000 hours per year.
• Peaking - A plant used to generate electricity only for the highest systemloads. Peaking plants are typically used up to 1,500 hours per year.
Two other types of units have not been classified as base, intermediate, orpeaking, because they cannot be dispatched by electric utilities. Wind unitsprovide electricity only when wind is available. Units classified as "unknown"include a group of non-utility generators that serve their own loads or sell excessgeneration to utilities.

35
Figure 2-12 Use of Iowa Utility Owned-Generation
Sources: EIA-412, RUS-12, FERC FORM 1 and other sources as compiled by Resource DataInternational; Data Provided by MidAmerican/Illustrated by IUB Staff.
Table 2-23 Typical Use of Iowa Utility Owned-Generation
Type of Use Fuel TypeCapacity
(MW)
Base HYDRO 8Base URANIUM 1,291Base COAL 3,254
Intermediate COAL 3,137
Intermediate GAS 40
Peak GAS 909Peak OIL 808
Sources: EIA-412, RUS-12, FERC FORM 1, and othersources as compiled by Resource Data International, Inc.;Data provided by MidAmerican.
2.3.1.1 Historical Fuel Use and Efficiency
The goal of economic dispatch is to efficiently dispatch the available mix ofgenerating units on an electric system to provide the least-cost electric energy toserve a range of system demands. Since fuel cost is the largest portion of the
0
500
1,000
1,500
2,000
2,500
3,000
3,500
4,000
4,500
5,000
Base Intermediate Peak
Meg
awat
ts
OilGasCoalUraniumHydro

36
cost to operate a generating unit (except for wind and hydro generation), fuelcost may be used to develop a preliminary order of units to be dispatched toserve load. Since the fuel costs for uranium are lower than fossil fuel, nuclearunits are normally dispatched after hydro units and before any fossil-fuel-firedunits. Coal-fired units are generally brought on-line before any gas- or oil-firedgeneration is brought on-line because coal is the lowest cost fossil fuel. Windturbines are used whenever available.
Unit efficiency may change the preliminary unit dispatch order based on fuelcost. Unit efficiency is measured by the unit heat rate. The heat rate equals thequantity of energy input (measured in British thermal units, or Btus) divided bythe quantity of energy output (measured in kWhs). The lower the heat rate, themore efficient the unit. The measured heat rates for units vary depending on thedesign, age, and condition of the unit, ambient temperature, and the level ofoperation.13 High efficiency, combined cycle gas units may have heat rates wellbelow coal-fired steam units. Even though the cost of gas is currentlysubstantially higher than the cost of coal, there is a crossover point based on therelative cost of gas and coal where a high efficiency combined cycle gas unitwould have a lower input fuel cost than a low-efficiency coal unit. In this case,the coal unit would move higher in the dispatch ranking than the combined cyclegas unit.
Additional factors that may change the system-wide economic dispatching ofgenerating units include:• Area Protection – Provide support to the transmission system in an area.• Transmission Relief – Adjust transmission line flows by changing generation
levels to ease transmission congestion.• Must-Run Units – Keep a unit on-line in order to minimize the unit’s cost of
operation, startup, shutdown costs, and “wear and tear” costs, or forconditions requiring continuous operation of those units. Conditions thatmight require continued unit operation include unit testing or a need to burncoal from in-plant storage.
• Limited Operating Hours – Restrict a unit’s operation to comply withenvironmental restrictions.
13 Each generating unit’s heat rate varies over the normal operating range of the unit. Nearly allunits are less efficient as the capacity approaches the unit’s minimum generation level, and mostefficient near the maximum generation level. As a result, the cost to operate a generating unit,assuming a constant fuel cost, will decrease in terms of cents per kilowatt-hour as the unit’soutput is increased. Warmer ambient temperatures generally reduce the operating capability ofgenerating units.

37
Table 2-24 provides historical annual generation for Iowa utility owned-generation by unit type. In this case, generation is characterized in GWh.Steam (fossil) generation (as presented in the table) is typically fueled by coal,gas, or oil.
Table 2-24 Iowa Electric Utility Owned-Generation by Plant Type (GWh)
Year
SteamGeneration
GWh
NuclearGeneration
GWh
HydroGeneration
GWh
OtherGeneration
GWh
TotalGeneration
GWh1990 22,850 7,192 25 72 30,1391991 23,843 7,629 24 125 31,6211992 24,191 8,656 26 26 32,8991993 25,638 6,878 12 97 32,6251994 26,135 6,671 23 107 32,9361995 28,201 7,921 21 104 36,2471996 28,034 8,941 20 69 37,0641997 28,721 8,923 19 254 37,9171998 31,403 9,001 20 436 40,8601999 31,407 10,144 23 391 41,965
Notes: Includes all generating units located in Iowa and other units owned and operated byAlliant-West located outside Iowa. Also includes MidAmerican's share of the Quad Citiesnuclear station in Illinois and MidAmerican's 50 percent share of output from the Coopernuclear station in Nebraska. Does not include non-utility generation, such as wind.Sources: EIA-412, RUS-12, FERC FORM 1 and other sources as compiled by Resource DataInternational, Inc.; Data provided by MidAmerican.
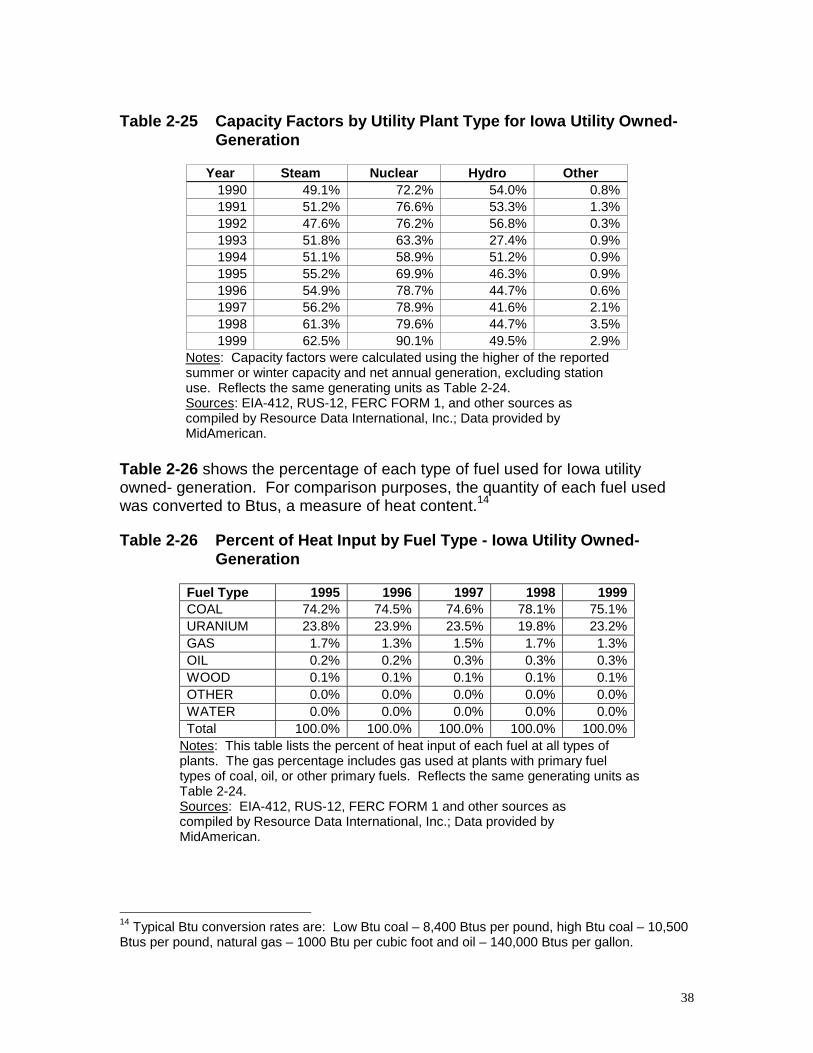
Table 2-25 shows historical capacity factors by plant type. The capacity factor ofa generating plant, or group of plants, represents the percentage of electricity theplant actually generated compared to electricity it is capable of generating for aspecific time period.
Factors that may affect the capacity factor of each type of plant include:• Economic dispatch – Use of the lowest-cost generation to serve load.• Load following – Adjustments to the amount of total generation to
match the load. Loads, including customer loads plus sales lesspurchases, change almost constantly. These changes requirechanges to the mix of generating units producing electricity.
• Scheduled Maintenance – Periods when units are out of service formaintenance.
• Forced outage – Periods when the unit must be shut down orgeneration must be reduced to perform unscheduled maintenance andrepairs.
The increase in capacity factors for coal and nuclear units are primarily due toincreases in native load energy requirements and increased energy sales toother utilities. Increased unit availability of nuclear units also results in highercapacity factors for those units.
38
Table 2-25 Capacity Factors by Utility Plant Type for Iowa Utility Owned-Generation
Year Steam Nuclear Hydro Other1990 49.1% 72.2% 54.0% 0.8%1991 51.2% 76.6% 53.3% 1.3%1992 47.6% 76.2% 56.8% 0.3%1993 51.8% 63.3% 27.4% 0.9%1994 51.1% 58.9% 51.2% 0.9%1995 55.2% 69.9% 46.3% 0.9%1996 54.9% 78.7% 44.7% 0.6%1997 56.2% 78.9% 41.6% 2.1%1998 61.3% 79.6% 44.7% 3.5%1999 62.5% 90.1% 49.5% 2.9%
Notes: Capacity factors were calculated using the higher of the reportedsummer or winter capacity and net annual generation, excluding stationuse. Reflects the same generating units as Table 2-24.Sources: EIA-412, RUS-12, FERC FORM 1, and other sources ascompiled by Resource Data International, Inc.; Data provided byMidAmerican.
Table 2-26 shows the percentage of each type of fuel used for Iowa utilityowned- generation. For comparison purposes, the quantity of each fuel usedwas converted to Btus, a measure of heat content.14
Table 2-26 Percent of Heat Input by Fuel Type - Iowa Utility Owned-Generation
Fuel Type 1995 1996 1997 1998 1999COAL 74.2% 74.5% 74.6% 78.1% 75.1%URANIUM 23.8% 23.9% 23.5% 19.8% 23.2%GAS 1.7% 1.3% 1.5% 1.7% 1.3%OIL 0.2% 0.2% 0.3% 0.3% 0.3%WOOD 0.1% 0.1% 0.1% 0.1% 0.1%OTHER 0.0% 0.0% 0.0% 0.0% 0.0%WATER 0.0% 0.0% 0.0% 0.0% 0.0%Total 100.0% 100.0% 100.0% 100.0% 100.0%
Notes: This table lists the percent of heat input of each fuel at all types ofplants. The gas percentage includes gas used at plants with primary fueltypes of coal, oil, or other primary fuels. Reflects the same generating units asTable 2-24.Sources: EIA-412, RUS-12, FERC FORM 1 and other sources ascompiled by Resource Data International, Inc.; Data provided byMidAmerican.
14 Typical Btu conversion rates are: Low Btu coal – 8,400 Btus per pound, high Btu coal – 10,500Btus per pound, natural gas – 1000 Btu per cubic foot and oil – 140,000 Btus per gallon.

39
2.3.1.2 Projected Fuel Diversity
The Energy Information Administration (EIA) conducts energy forecasts for theU.S. The EIA15 produced estimates of U.S. energy consumption by sector forthree scenarios: a reference case, a low economic growth case, and a higheconomic growth case. Table 2-27 shows the EIA value for actual Btus used in1998 and the forecast of the number of Btus used to produce electricity in 2010.Table 2-27 also shows the annual average growth in the use of each type of fuelfrom 1998 to 2010 under each EIA growth scenario.
Table 2-27 U.S. Energy Consumption for Electric Generators (QuadrillionBtu per year) and Annual Average Change in Consumptionfrom 1998 to 2010
1998Reference
2010 LowEconomic
Growth2010
Reference
2010 HighEconomic
GrowthOil Consumption 1.2 0.4 0.5 0.7
Annual change -9.5% -8.0% -4.6%
Natural Gas Consumption 3.8 6.1 6.6 7.3Annual change 4.5% 4.8% 5.7%
Steam Coal Consumption 19.0 22.2 22.5 23.2Annual change 1.3% 1.4% 1.7%
Nuclear Consumption 7.2 6.7 6.7 6.7Annual change -0.6% -0.6% -0.6%
Renewable Consumption 4.1 4.4 4.4 4.4Annual change 0.6% 0.6% 0.6%
Sources: Energy Information Administration, Annual Energy Outlook 2000, Table b2. EnergyConsumption by Sector and Source, pp. 146-147.
Table 2-28 shows EIA's forecasted change in the percent of fuel heat input usedto generate electricity.
15 Energy Information Administration, Annual Energy Outlook 2000, Table b2. EnergyConsumption by Sector and Source, pp. 146-147
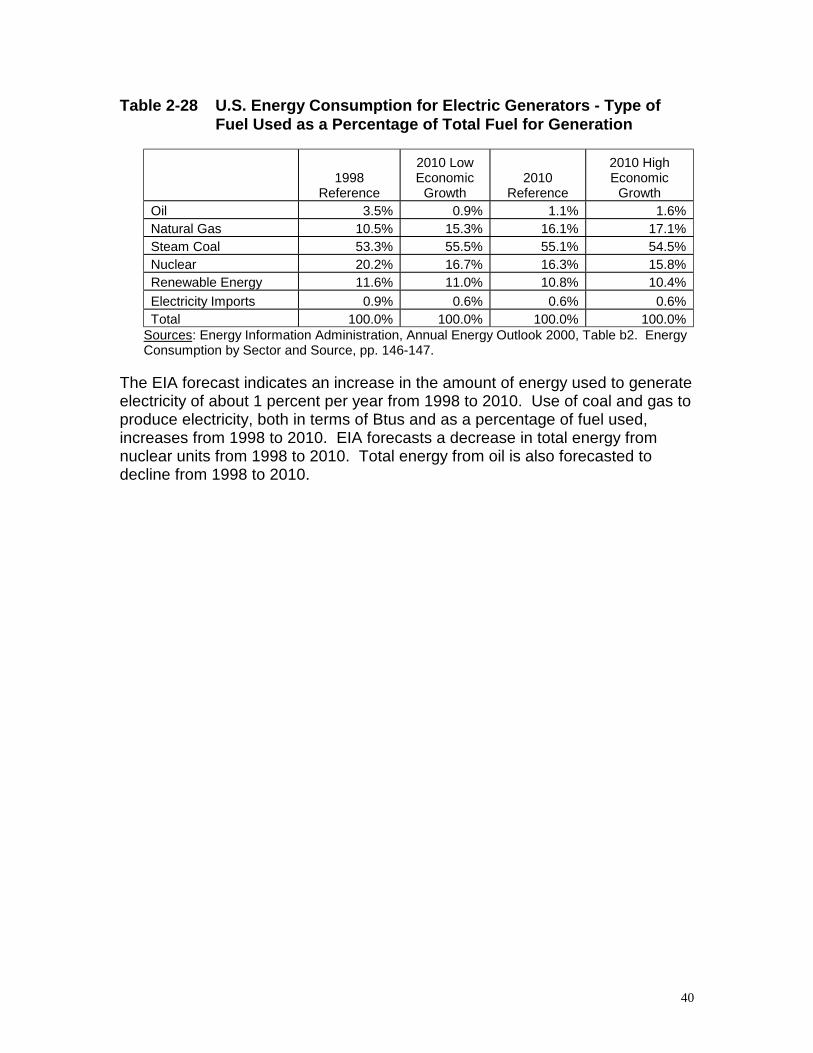
40
Table 2-28 U.S. Energy Consumption for Electric Generators - Type ofFuel Used as a Percentage of Total Fuel for Generation
1998Reference
2010 LowEconomic
Growth2010
Reference
2010 HighEconomic
GrowthOil 3.5% 0.9% 1.1% 1.6%Natural Gas 10.5% 15.3% 16.1% 17.1%Steam Coal 53.3% 55.5% 55.1% 54.5%Nuclear 20.2% 16.7% 16.3% 15.8%Renewable Energy 11.6% 11.0% 10.8% 10.4%Electricity Imports 0.9% 0.6% 0.6% 0.6%Total 100.0% 100.0% 100.0% 100.0%
Sources: Energy Information Administration, Annual Energy Outlook 2000, Table b2. EnergyConsumption by Sector and Source, pp. 146-147.
The EIA forecast indicates an increase in the amount of energy used to generateelectricity of about 1 percent per year from 1998 to 2010. Use of coal and gas toproduce electricity, both in terms of Btus and as a percentage of fuel used,increases from 1998 to 2010. EIA forecasts a decrease in total energy fromnuclear units from 1998 to 2010. Total energy from oil is also forecasted todecline from 1998 to 2010.

41
2.3.1.3 Cost of Generation
Table 2-29 presents historical costs per MWh delineated by fuel type andexpense category.16 Generation expenses are often categorized as fuel andnon-fuel. As stated previously, fuel is the primary cost component of fossil-fuel-fired generation. Non-fuel expenses play a larger role in nuclear and hydrogeneration.
Table 2-29 Generation Cost per MWh by Fuel Type - Iowa Generation
Steam Generation ($/MWh) Nuclear Generation($/MWh)
Hydro Generation ($/MWh)
Year FuelNon-Fuel Total Fuel
Non-Fuel Total
WaterExpense
Non-Water
Expense Total1990 13.45 3.56 17.00 6.10 15.45 21.55 0.16 8.88 9.041991 13.64 3.82 17.45 5.96 15.07 21.03 0.04 10.58 10.631992 13.08 4.10 17.17 5.32 16.24 21.56 0.00 11.46 11.461993 12.45 4.01 16.46 5.67 21.29 26.96 0.00 14.83 14.831994 12.06 4.05 16.11 6.34 25.29 31.63 0.00 10.52 10.521995 11.88 3.43 15.31 6.49 20.88 27.37 0.00 9.05 9.051996 11.79 3.43 15.22 6.38 16.16 22.55 0.00 10.75 10.751997 11.73 3.62 15.36 6.20 18.29 24.49 0.00 33.47 33.471998 10.73 3.48 14.21 5.21 16.89 22.10 0.00 17.70 17.701999 10.01 3.54 13.55 5.50 14.72 20.22 0.00 24.61 24.61
Sources: EIA-412, RUS-12, FERC FORM 1 and other sources as complied by Resource DataInternational, Inc.; Base data provided by MidAmerican and presented by IUB staff.
2.3.2 Purchased Power
Purchased power is another source of supply used to serve Iowa’s load andenergy requirements. This subsection presents: 1) historical and projectedpurchased power commitments as accredited with MAPP; 2) a discussion anddelineation of IOU purchases from alternate energy sources (more commonlyknown as renewable energy sources); and 3) summary data from the Midwest’swholesale spot electricity market.
16 These costs do not include capital costs, depreciation expenses, taxes, or generation overhead.

42
2.3.2.1 Purchased Power Commitments for Iowa’s IOUs
Table 2-30 provides historical and projected purchased power commitments forMidAmerican and Alliant-West including the total of summer firm andparticipation sales accredited with MAPP.
Table 2-30 Historical and Projected Purchased Power Commitments (MW)
MidAmerican Energy Alliant-WestTotal
Purch.TotalSales
NetPurch.
TotalPurch.
TotalSales
NetPurch.
1990 551 338 213 236 20 2161991 561 384 177 206 0 2061992 847 570 277 374 10 3641993 792 605 187 406 75 3311994 786 571 215 416 75 3411995 756 556 200 446 75 3711996 672 406 266 426 75 3511997 634 299 335 455 60 3951998 630 287 343 425 0 4251999 620 289 331 530 7 523
2000 809 256 553 585 162 4232001 439 5 434 237 7 2302002 429 0 429 361 7 3542003 429 0 429 361 7 3542004 429 0 429 336 7 3292005 50 0 50 336 7 3292006 50 0 50 336 7 3292007 50 0 50 336 7 3292008 50 0 50 336 7 3292009 46 0 46 36 7 29
Notes: Total purchases and sales equal total firm and participation power transactionsaccredited with MAPP. MidAmerican purchases include approximately 385 MW participationpower purchase contract with Cooper Power Station each year from 1990 through 2004. Netpurchases equal total purchases less total sales. In 2000, MidAmerican reported for utilitiesincluded in Appendix C plus Estherville Municipal Utility. Alliant-West reported for IES,Interstate, and Central Iowa Power Cooperative.Sources: Historical: MAPP Annual Load & Capability Reports, 1990-1999; Forecast: MAPPLoad & Capability Report, May 2000 for MidAmerican Energy, and Alliant-West.
MidAmerican’s firm purchase power contract with Cooper Power Station isincluded in both Table 2-30 and in the data labeled Iowa utility owned-generationin subsection 2.3.2. As such, adding the MW capacity in Table 2-22 with MWnet purchases in Table 2-30 would overstate MidAmerican’s existing capacity.

43
2.3.2.2 Power Purchases from Alternate Energy Sources (Background andSummary Table)
The Alternate Energy Production (AEP) statute (Iowa Code Section 476.41 –476.45) was enacted in 1983 to encourage development of AEP facilities byestablishing special incentive rates for AEP purchases by IOUs. Federal lawrequires utilities to purchase AEP at rates based on the utilities' incrementalavoided costs.17 However, avoided-cost rates were not considered high enoughto encourage AEP development, so the Iowa AEP statute was designed toprovide higher incentive rates.
The first IUB rulemaking implementing the AEP statute was initiated in 1983(Docket No. RMU-83-30) and provided for a statewide utility purchase rate of 6.5cents per kWh for AEP. The statewide rate was challenged by Iowa’s electricutility companies and eventually overturned by the Iowa Supreme Court in 1987.The Court ruled that the Board's rules went beyond the AEP statute, because itset a statewide AEP purchase rate rather than utility-specific rates, and becausethe Board disregarded rate-determining factors specified in the AEP statute. TheCourt also ruled that the AEP statute could not be applied to non-rate regulatedutilities (i.e., municipal utilities and RECs).
The Board proposed new rules in January 1988 (Docket No. RMU-88-4),attempting to establish utility purchase rates that would encourage AEPdevelopment, while being based on the AEP statute’s rate-determining factors.However, both these criteria could not be satisfied under current statute.Changes in the statute’s rate-determining factors were needed to designsufficient incentive rates.
These statutory changes were enacted in 1990, making it possible for the Boardto design utility purchase rates high enough to encourage AEP development.18
The Board implemented these changes through rules effective June 1991(Docket No. RMU-90-35). The rules established statewide utility purchase ratesfor AEP capacity and energy based on revised rate-determining factors. Therates were adjustable according to the length of the AEP contract, up to amaximum combined rate of approximately 6-cents per kWh.
In 1992, the statutory 15 MW purchase obligation for each utility was changed toa proportional share of 105 MW, based on each utility's share of the utilities’ 17 The cost the utility would otherwise incur in producing the power itself or purchasing it fromother sources.18 Specifically, the changes: 1) permitted the Board to set statewide AEP purchase rates based onrepresentative data; 2) changed the definition of "next generating plant" to be the "electric utility'snext coal-fired base load electric generating plant, whether planned or not, based on currenttechnology and undiscounted current cost;" and 3) allowed the Board to consider environmentaland economic externality factors. A further provision limited each utility's AEP purchase obligationto 15 MW.

44
combined Iowa electric peak demand. The IUB implemented this changethrough rules effective July 1993 (Docket No. RMU-92-16).
In 1996, the Alternate Energy Revolving Loan Program (Iowa Code Section476.46) was enacted to provide low-interest loan incentives for AEPdevelopment. This program is administered by the Iowa Energy Center.
In 1995, an Iowa utility petitioned the FERC to overturn the AEP statute and IUBrules to the extent they required utilities to pay more than their avoided costs forAEP (FERC Docket No. EL95-51-000). The FERC responded in January 1997by overturning the Board’s incentive purchase rates for AEP. However, theFERC also ruled that, under the AEP statute, the Board could require utilities topurchase alternate energy. Therefore, in the context of a contested proceeding(Docket Nos. AEP-95-1 through AEP-95-5), the Board required Iowa’s IOUs tofulfill the remainder of their AEP purchase obligations by a date certain. TheIOUs responded by issuing requests for proposals (RFPs) and awardingrenewable energy purchase contracts for AEP projects intended to fulfill theirstatutory purchase obligation. Most of these projects became commerciallyoperational in 1999.
Table 2-31 shows historical renewable energy purchases by Iowa utilities overthe past five years (1995-99). The amounts shown include hydropower from theWestern Area Power Administration (WAPA) and Southwestern PowerAdministration (SWPA), purchased voluntarily by IOUs, RECs, and municipalutilities, apart from the requirements of the AEP statute.

45
Table 2-31 Renewable Energy Purchases by Iowa Utilities(MWh = 1,000 kWh)
1995MWh
1996MWh
1997MWh
1998MWh
1999MWh
Wind 1,006 1,442 3,266 9,069 475,28019
Hydro 13,643 19,740 22,170 22,641 20,646WAPA Hydro20 1,472,505 1,986,982 2,696,261 1,800,177 N/ASWPA Hydro21 38,000 38,000 38,000 38,000 38,000Biomass 42,513 47,683 46,410 55,055 85,367Other 2,521 4,128 2,901 1,984 2,167
Total 1,570,188 2,097,705 2,809,008 1,926,926 621,46022
25 Hz Hydro23 308,953 277,337 130,233 37,731 37,436
Total Including25 Hz Hydro 1,879,141 2,375,042 2,939,241 1,964,657 658,89624
Total IowaMWh Sales 34,301,000 34,999,000 36,148,000 37,318,000 N/A
RenewablePurchases as aPercent of TotalIowa MWh Sales
5.5% 6.8% 8.1% 5.3% N/A
Sources: Internal company data compiled by Alliant and MidAmerican, and data compiled by theIowa Association of Electric Cooperatives (IAEC) and the Iowa Association of Municipal Utilities(IAMU); total Iowa MWh sales are from Electric Power Annual, Vol. II, 1996-98, EnergyInformation Administration (EIA), Table 4, compiled by IUB Staff.
19 Reflects approximately seven months purchases from large wind farms, beginning in thesecond quarter of 1999, plus 10,936 MWH of wind generation and wind purchases by municipalutilities. For the period July 1999 through June 2000, investor-owned utility wind purchasestotaled 620,073 MWH.20 Hydropower purchases from WAPA by Iowa IOUs, RECs, and municipal utilities. Note thatsome groups do not characterize large hydro as renewable.21 Hydropower purchases from SWPA by Iowa RECs. Note that some groups do not characterizelarge hydro as renewable.22 Total does not include WAPA hydropower purchases – data not available for 1999.23 The 25 Hz hydro purchases present a unique situation that warrants separate mention, becauseit is based on older technology, not usable by most customers (60 Hz generation is the currentindustry standard). The 25 Hz hydro plant is owned by Union Electric Company. IES Utilities (partof Alliant-West) purchases the power from Union Electric under special arrangement to serve its25 Hz industrial customers, acquired when IES purchased Union Electric’s southeast Iowa serviceterritory. As previous contracts expire between IES and its remaining 25 Hz customers, thecustomers are converted to standard 60 Hz power. Thus, IES’s 25 Hz hydropower purchases aresteadily phased out over time.24 Total does not include WAPA hydropower purchases – data not available for 1999.
46
2.3.2.3 Wholesale Spot Market
As described in subsection 1.2 – Background, the Energy Policy Act of 1992(EPACT), coupled with FERC Order 888, created a wholesale spot market inelectricity. Specifically, the EPACT advanced the growth of non-utility powerproducers by creating a new class of non-utility generators called "exemptwholesale generators" (EWGs). The EPACT allowed companies, includingpublic utility holding companies, to develop and operate EWGs anywhere in theworld. EWGs may sell wholesale power at market rates and are exempt fromthe cost-of-service regulation to which utilities are subject. Utilities must providewholesale power transmission service to EWGs and other third parties at cost-based rates, under the same open access transmission regulations as any othercapacity. The impact of the EPACT can be seen in the growth in the number ofnon-utility generating facilities. From 1997 to 1998, the total installed capacity ofnon-utility generating facilities grew 32.5 percent.25 Non-utility capacity in 1998was equivalent to 12.6 percent of the total U.S. electric industry capacity26
compared to 7 percent in 1991.27 The FERC implemented the provisions of theEPACT, in part, through FERC Order 888.
The EPACT and Order 888 enabled new organizations, such as powermarketers, to purchase, transmit and resell electric power across traditionalelectric utility borders. Power marketers, like traditional utilities, buy and sellelectric power in the wholesale market. Some of these power marketers owngeneration, however none of them own transmission or distribution facilities. Thenumber of registered power marketers with wholesale rates approved by theFERC has grown substantially in the past few years from 11 in 1993 toapproximately 400 in 1998, of which about 90 are affiliated with traditionalelectric utilities.28
The wholesale spot market in electricity is another source of supply to serveIowa’s load and energy requirements. Figure 2-13 tracks the wholesale marketprices in the MAPP region for the summer in the years 1998, 1999, and 2000.Figure 2-14 provides average next day firm prices for different regions of theMidwest by year. Spikes in wholesale spot prices for electricity occur whencapacity and/or energy in the region is in short supply.
25 Electric Power Annual 1998, Vol. II, Energy Information Administration, December 1999, p. 10.Much of the increase was caused by the sale of utility generating facilities to non-utilitycompanies.26 Electric Power Annual 1998, Vol. II, Energy Information Administration, December 1999, p. 10.27 Electric Power Annual 1991, Energy Information Administration (EIA-0348(91)), February 1993,p. 9.28 Electric Sales and Revenue 1998, Energy Information Administration, pp. 247-248. However,fewer than half of those registered with the FERC in 1998 actually conducted wholesaletransactions.
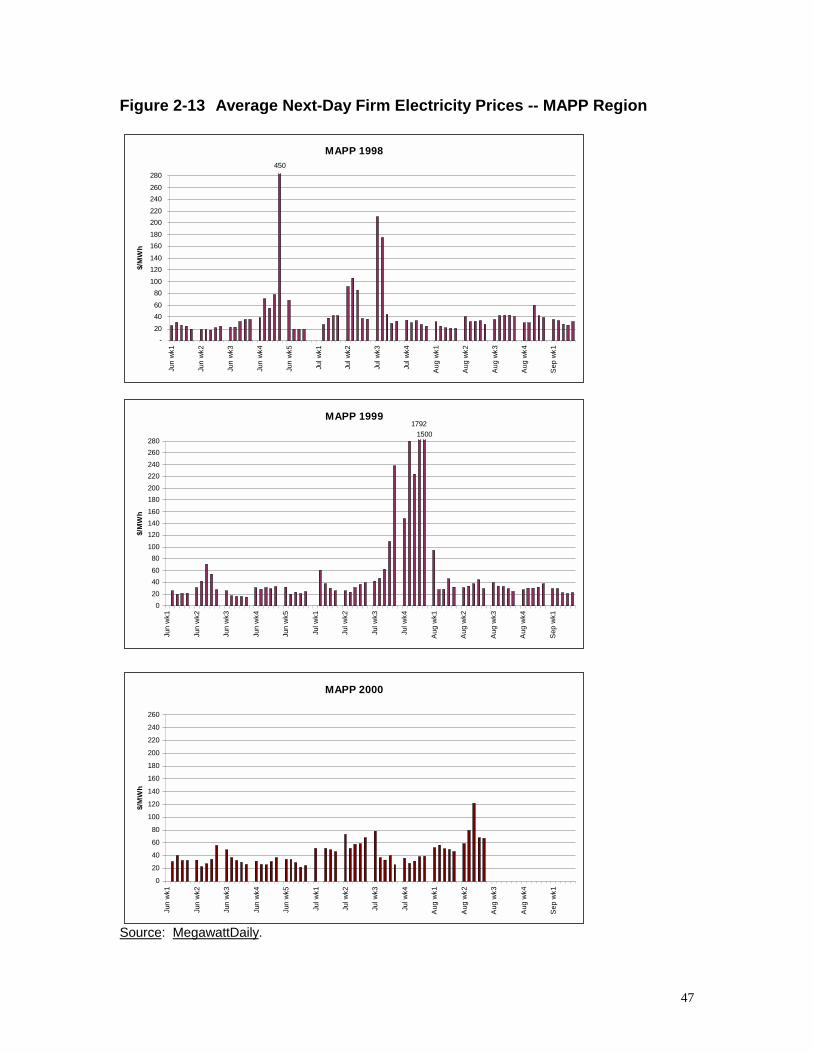
47
Figure 2-13 Average Next-Day Firm Electricity Prices -- MAPP Region
Source: MegawattDaily.
MAPP 1998 450
-20406080
100120140160180200220240260280
Jun
wk1
Jun
wk2
Jun
wk3
Jun
wk4
Jun
wk5
Jul w
k1
Jul w
k2
Jul w
k3
Jul w
k4
Aug
wk1
Aug
wk2
Aug
wk3
Aug
wk4
Sep
wk1
$/M
Wh
MAPP 19991500
1792
020406080
100120140160180200220240260280
Jun
wk1
Jun
wk2
Jun
wk3
Jun
wk4
Jun
wk5
Jul w
k1
Jul w
k2
Jul w
k3
Jul w
k4
Aug
wk1
Aug
wk2
Aug
wk3
Aug
wk4
Sep
wk1
$/M
Wh
MAPP 2000
0
20
40
60
80
100
120
140
160
180
200
220
240
260
Jun
wk1
Jun
wk2
Jun
wk3
Jun
wk4
Jun
wk5
Jul w
k1
Jul w
k2
Jul w
k3
Jul w
k4
Aug
wk1
Aug
wk2
Aug
wk3
Aug
wk4
Sep
wk1
$/M
Wh
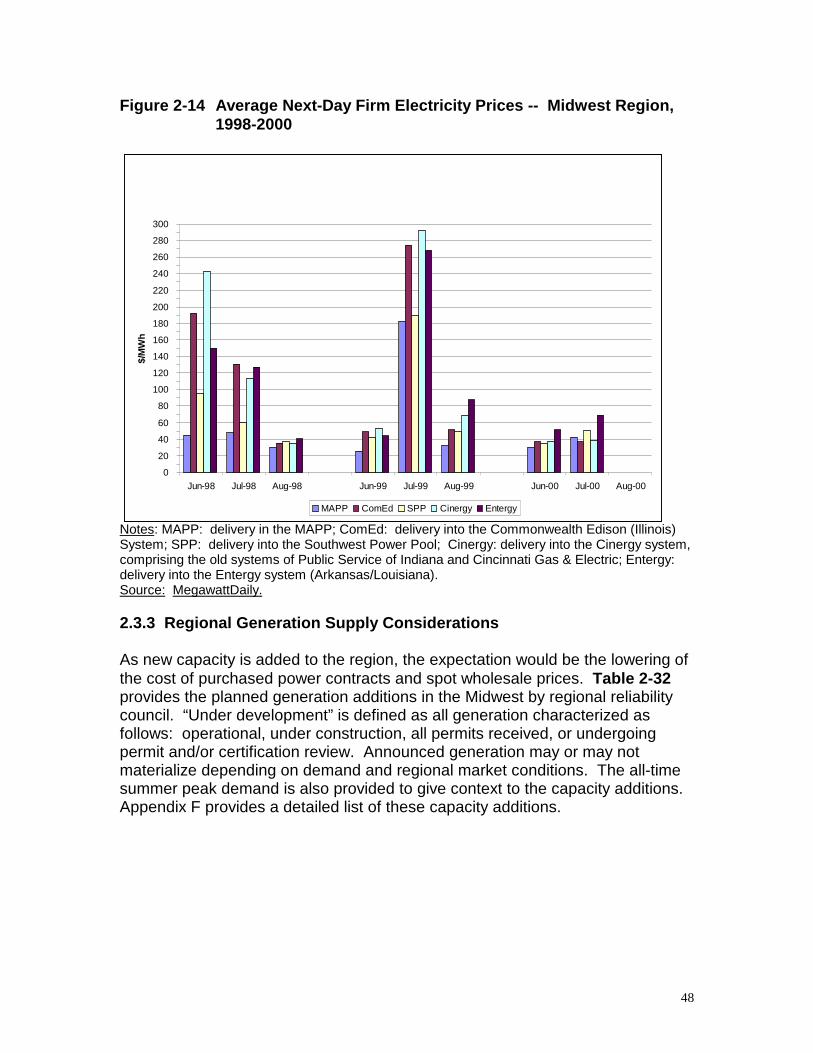
48
Figure 2-14 Average Next-Day Firm Electricity Prices -- Midwest Region,1998-2000
Notes: MAPP: delivery in the MAPP; ComEd: delivery into the Commonwealth Edison (Illinois)System; SPP: delivery into the Southwest Power Pool; Cinergy: delivery into the Cinergy system,comprising the old systems of Public Service of Indiana and Cincinnati Gas & Electric; Entergy:delivery into the Entergy system (Arkansas/Louisiana).Source: MegawattDaily.
2.3.3 Regional Generation Supply Considerations
As new capacity is added to the region, the expectation would be the lowering ofthe cost of purchased power contracts and spot wholesale prices. Table 2-32provides the planned generation additions in the Midwest by regional reliabilitycouncil. “Under development” is defined as all generation characterized asfollows: operational, under construction, all permits received, or undergoingpermit and/or certification review. Announced generation may or may notmaterialize depending on demand and regional market conditions. The all-timesummer peak demand is also provided to give context to the capacity additions.Appendix F provides a detailed list of these capacity additions.
0
20
40
60
80
100
120
140
160
180
200
220
240
260
280
300
Jun-98 Jul-98 Aug-98 Jun-99 Jul-99 Aug-99 Jun-00 Jul-00 Aug-00
$/M
Wh
MAPP ComEd SPP Cinergy Entergy

49
Table 2-32 Planned Generation Additions in the Midwest (MW)
Projected Operational Start Date
NERCRegion 2000 2001 2002 2003
>2003 orunknown Totals
All-timeSummer
PeakDemand
ECAR Underdevelopment 3,713 2,790 4,240 2,100 1,350 14,193Announced 894 3,110 5,580 4,080 6,430 20,094Total 4,607 5,900 9,820 6,180 7,780 34,287 96,149
MAIN Underdevelopment 4,068 4,867 2,210 0 6,794 17,939Announced 326 900 775 2,450 910 5,361Total 4,394 5,767 2,985 2,450 7,704 23,300 49,027
MAPP Underdevelopment 300 1,147 0 0 114 1,561Announced 505 90 430 89 1,114Total 300 1,652 90 430 203 2,675 37,196
SPP &Entergy
Underdevelopment 1,949 3,841 7,142 0 320 13,252Announced 699 1,639 1,950 1,100 1,160 6,548Total 2,648 5,480 9,092 1,100 1,480 19,800 58,473
TotalMidwest
Underdevelopment 10,030 12,645 13,592 2,100 8,578 46,945Announced 1,919 6,154 8,395 8,060 8,589 33,117Total 11,949 18,799 21,987 10,160 17,167 80,062
Notes: Under Development = Operational, Under Construction, All Permits Received, or UndergoingPermit and/or Certification ReviewSources: All-Time Peak Demand - North American Electric Reliability Council 2000 Summer Assessment.For each region, the all-time summer peak demand occurred in 1999.Proposed Projects - Numerous sources including: Company news releases, Electric Utility Week,MegawattDaily, Illinois Environmental Protection Agency, Wisconsin Department of Natural Resources,Ohio Power Siting Board, Minnesota Environmental Quality Board Monitor, Oklahoma Department ofEnvironmental Quality, Mississippi Public Utility Commission, Indiana Environmental Protection Agency,Michigan Department of Environment Quality, and the North American Electric Reliability Council 2000Summer Assessment.
Table 2-33 provides the planned Midwest MW capacity additions by fuel type.The table also provides the total of historical additions (years 1992-1999) by fueltype including the percent of total.

50
Table 2-33 Planned Midwest Capacity Additions by Fuel Type (MW)
Primary Fuel 2000 2001 2002 2003>2003 orunknown
Percent ofTotal –
Historical1992-99
Percentof TotalPlanned>1999
Natural Gas 11,318 18,245 21,222 9,760 13,361 87.0% 92.3%Oil 374 33 6.2% 0.5%Coal 74 26 540 400 1,045 0.5% 2.6%Uranium 53 178 225 0.0% 0.6%Wind 30 350 2.9% 0.5%Pumped Storage 1.2% 0.0%Hydro 80 2.2% 0.1%Compressed Air 2,700 0.0% 3.4%Solid Waste 20 0.0% 0.0%Unknown 28 0.0% 0.0%Notes: “Planned” addition includes projects that are operational, under construction, all permitsreceived, undergoing permit review, and announced. Additions are not net of unit retirements.Sources: Company news releases, Electric Utility Week, MegawattDaily, Illinois EnvironmentalProtection Agency, Wisconsin Department of Natural Resources, Ohio Power Siting Board,Minnesota Environmental Quality Board Monitor, Oklahoma Department of Environmental Quality,Mississippi Public Utility Commission, Indiana Environmental Protection Agency, MichiganDepartment of Environment Quality, and the North American Electric Reliability Council 2000Summer Assessment.
2.3.4 SO2 and NOx Emissions from Fossil-Fuel-Fired Generation
Sulfur Dioxide (SO2) and oxides of nitrogen (NOx) are emitted when electricity isproduced through the burning of fossil fuels. SO2 and NOx (in combination) areprecursors to acid rain.
On November 15, 1990, President Bush signed into law the Clean Air ActAmendments of 1990 (CAAA). Title 4 of the CAAA calls for a ten million-tonreduction in utility emissions of SO2 and a two million-ton reduction in NOx. TheSO2 reduction was achieved in two phases. Phase 1 began on January 1, 1995,whereupon 265 generating units were required to reduce their emissions to arate of 2.5 pounds of SO2/mmBtu (i.e., million Btus) multiplied by their averageannual fuel consumption in Btus for the years 1985 through 1987 (the unit’s“baseline”). Six Iowa units were affected under Phase I: Burlington GeneratingStation, Des Moines Energy Center Unit 729, George Neal Unit 1, M.L. Kapp Unit2, Prairie Creek Unit 4, and Riverside Generating Station Unit 5. Phase II beganon January 1, 2000, with all existing utility generating units required to reduceSO2 emissions to a level not to exceed 1.2 lbs/mmBtu multiplied by the unit’sbaseline. Phase II reduction levels are calculated so that total utility emissionsnever exceed approximately 8.9 million tons annually. This level of emissions ispermanent, meaning that all new generating units cannot emit any SO2 unless
29 The Des Moines Energy Center Unit 7 has since been retired and dismantled.

51
the owner acquires emission allowances from the allowance trading market orthe United States Environmental Protection Agency (EPA).30
The CAAA also required unit owners and/or operators to install low NOx burnersat each unit compatible with the technology. Units were required to comply withthe CAAA’s NOx requirements at the same time they were required to complywith the SO2 requirements.
Table 2-34 provides SO2 and NOx historical emission rates (in lbs/mmBtus) andtonnage from fossil-fuel-fired generation in Iowa. The table also provides annualheat input in Btus for the previous five years.
Table 2-34 Coal-Fired Unit Emissions
1995 1996 1997 1998 1999% Change1995-1999
Annual Heat Input1012 Btu
345.723 343.287 350.841 386.370 388.147 + 12%
Annual NOXEmissions (Tons)
84,189 79,159 75,090 81,081 80,283 - 5%
Annual NOXEmission Rate(lb/mmBtu)
0.479 0.454 0.424 0.416 0.414 - 14%
Annual SO2Emissions (Tons)
175,595 151,528 155,645 171,733 156,075 - 11%
Annual SO2 EmissionRate, (lb/mmBtu)
1.016 0.883 0.887 0.889 0.804 - 21%
Source: U.S. Environmental Protection Agency; Compiled by MidAmerican.
2.3.5 Generation Siting Requirements
The siting of new generation in the region depends, in part, on state rules andregulations governing certification. IOWA CODE 476A requires that a personshall not commence construction of an electric generating facility unless theBoard has issued a certificate of public convenience, use, and necessity.Certification of all electric power generating plants or a combination of plants at asingle site with a total nameplate capacity of 25 MW or more is required. TheBoard, if it determines that the public interest would not be adversely affected,may waive the certificate requirements for facilities with a capacity of up to 100MW. A certificate is issued if the Board finds all of the following:
1. The services and operations resulting from the construction of the facility arerequired by the present or future public convenience, use, and necessity.
30 The CAAA established a system by which utility emitters of SO2 can trade “allowances.” Anallowance is essentially an EPA-issued license to emit one annual ton of SO2. The owner(s) ofnew generating facilities must obtain allowances to offset new SO2 emissions or, alternatively,reduce generation from other sources that have been issued allowances.

52
2. The applicant is willing to perform such services and construct, maintain, andoperate the facility pursuant to the provisions of the certificate.
3. The construction, maintenance, and operation of the facility will causeminimum adverse land use, environmental, and aesthetic impact and areconsonant with reasonable utilization of air, land, and water resources forbeneficial purposes considering available technology and the economics ofavailable alternatives.
4. The applicant, if a utility, has a comprehensive energy management program.
A comprehensive energy management plan is not applicable to merchant plantswhich are non-utility generators where all or a portion of the electric output fromthe generating plant is sold into competitive electric markets and is notdependent upon long-term sales contracts with electric utilities.
IOWA CODE 476A also requires the applicants to meet permitting, licensing,and zoning requirements of other agencies. The Iowa Department of NaturalResources (IDNR) reviews all air construction permit applications to see if asource or modification may cause or contribute to a violation of the nationalambient air quality standards. The IDNR rule 567 Iowa Administrative Code 22.1requires “an air construction permit before installation, construction, ormodification of any equipment or control equipment which emits regulatedpollutants to the air outside of buildings.”
New source performance standards apply to affected facilities and resourceslisted in IDNR rule 23.1(2). Some of the affected facilities in this list are: 1)electric utility steam generating units capable of combusting more than 250MMBtu/hour (73 MW) heat input of fossil fuel in the steam generator; 2) anelectric utility combined cycle gas turbine capable of combusting more than 250MMBtu per hour; 3) industrial-commercial-institutional steam generating unitswith a heat input capacity from fuels combusted in the steam generating unit ofgreater than 29 MW; and 4) industrial-commercial-institutional steam generatingunits with a maximum design heat input capacity of 29 MW (100 MMBtu/hour) orless, but greater than or equal to 2.9 MW (10 MMBtu/hour).
IDNR rule 22.4 regulations require a Prevention of Significant Deterioration(PSD) permit. A PSD permit is required for large sources in the attainmentareas.31 A PSD permit requires the source use “the best available controltechnology.” The level of air pollution control is determined on a case-by-casebasis taking into account all costs and impacts to determine what is achievablefor facility emission reductions. Fossil-fueled steam electric plants of more than250 MMBtu/hour heat input and fossil-fuel boilers totaling more than 250MMBtu/hour heat input require a PSD permit and are subject to a 100 tons peryear threshold for air pollutants. 31 Under PSD regulations, areas that have relatively clean air are referred to as attainment areas,or as being in attainment with the national ambient air quality standards. All of Iowa is currently inattainment except for one area near Muscatine.
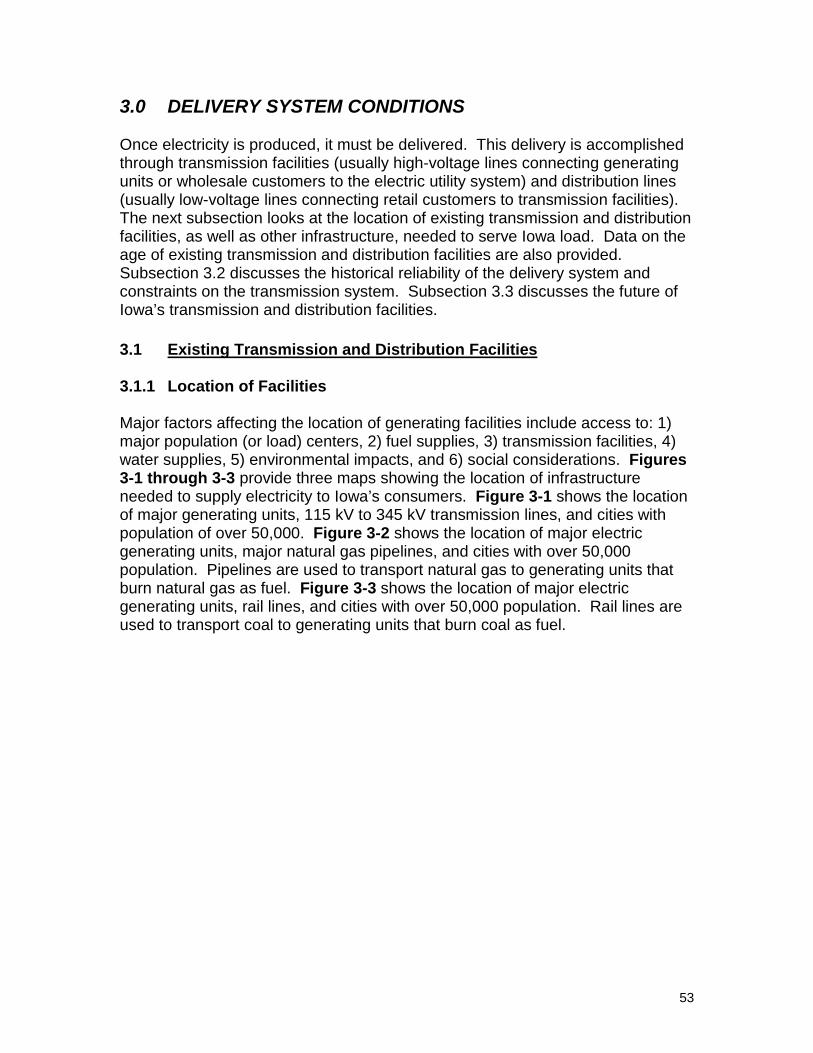
53
3.0 DELIVERY SYSTEM CONDITIONS
Once electricity is produced, it must be delivered. This delivery is accomplishedthrough transmission facilities (usually high-voltage lines connecting generatingunits or wholesale customers to the electric utility system) and distribution lines(usually low-voltage lines connecting retail customers to transmission facilities).The next subsection looks at the location of existing transmission and distributionfacilities, as well as other infrastructure, needed to serve Iowa load. Data on theage of existing transmission and distribution facilities are also provided.Subsection 3.2 discusses the historical reliability of the delivery system andconstraints on the transmission system. Subsection 3.3 discusses the future ofIowa’s transmission and distribution facilities.
3.1 Existing Transmission and Distribution Facilities
3.1.1 Location of Facilities
Major factors affecting the location of generating facilities include access to: 1)major population (or load) centers, 2) fuel supplies, 3) transmission facilities, 4)water supplies, 5) environmental impacts, and 6) social considerations. Figures3-1 through 3-3 provide three maps showing the location of infrastructureneeded to supply electricity to Iowa’s consumers. Figure 3-1 shows the locationof major generating units, 115 kV to 345 kV transmission lines, and cities withpopulation of over 50,000. Figure 3-2 shows the location of major electricgenerating units, major natural gas pipelines, and cities with over 50,000population. Pipelines are used to transport natural gas to generating units thatburn natural gas as fuel. Figure 3-3 shows the location of major electricgenerating units, rail lines, and cities with over 50,000 population. Rail lines areused to transport coal to generating units that burn coal as fuel.

Figure 3-1
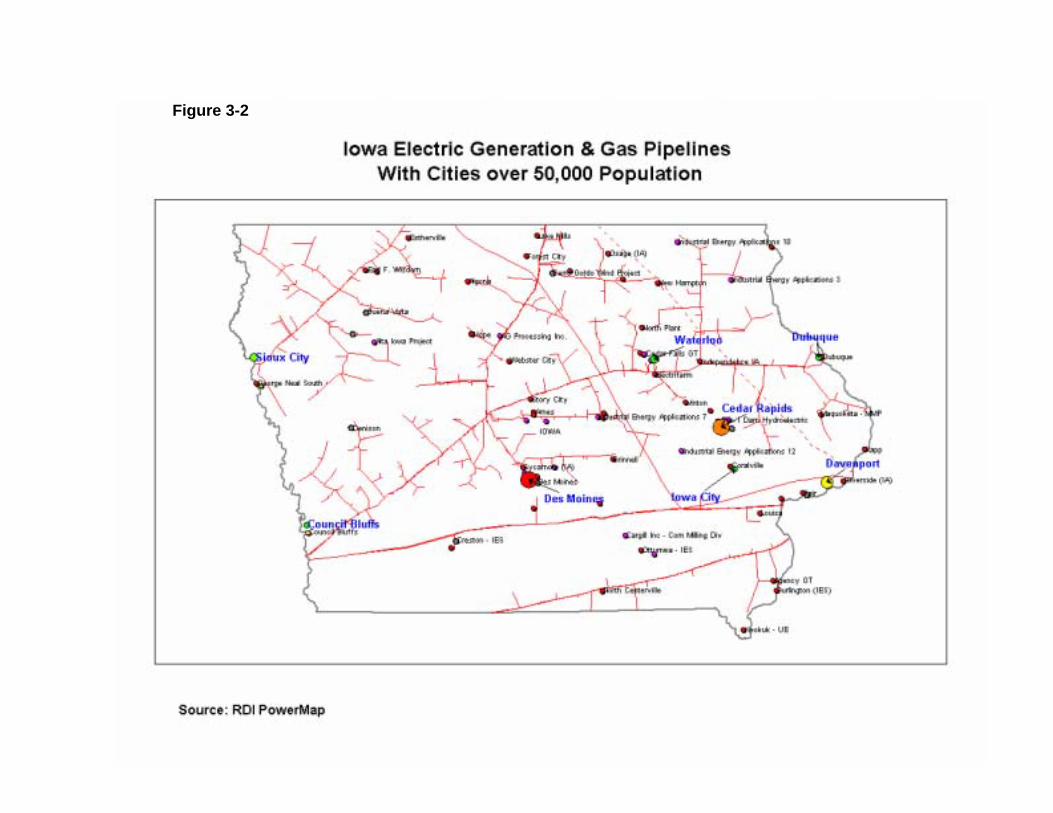
Figure 3-2

Figure 3-3

57
3.1.2 Age of Existing Facilities
Iowa’s existing transmission and distribution systems have been constructed andoperated since the early 1900’s. The transmission and distribution facilities areoperated at nominal voltages of 345 kV, 230 kV, 161 kV, 115 kV, 69 kV, 34.5 kV,25 kV, 13 kV, and 4 kV.
The vintages of MidAmerican’s and Alliant’s transmission and distributionsystems are provided in Table 3-1 and Figures 3-4 through 3-10. The age offacilities in Table 3-1 corresponds to the dates when these facilities wereoriginally built or completely rebuilt. Accounting records were used to determinethe ages of facilities in the figures. Due to accounting procedures, these figuresmay underestimate the actual ages of facilities that remain in-service. A smallpercentage of these data include facilities outside of Iowa.
Table 3-1 provides information concerning the vintage of MidAmerican’s andAlliant-IES’ high voltage lines.
Table 3-1 Miles of Line by Age
Age in Years => 0-9 10-19 20-29 30-39 40-49 50+ TotalMidAmerican 125 109 173 489 896345 kVAlliant-West 36 36MidAmerican 70 36 169 268 490 268 1301161 kVAlliant-West 17 112 178 217 524MidAmerican115 kVAlliant-West 3 25 215 133 376MidAmerican 128 175 416 495 389 175 177869 kVAlliant-West 37 193 296 194 210 79 1009MidAmerican 16 9 19 1 50 125 22034.5 kVAlliant-West 117 216 391 464 410 662 2260
Notes: The total may exclude miles of line of unknown age. For MidAmerican, the age of 34.5kV lines with 40 or more years of service is estimated. The numbers represent MidAmerican’sand Alliant’s equivalent share of jointly owned lines.Sources: Information provided by MidAmerican and Alliant.
Figures 3-4, 3-5 and 3-6 provide vintages for poles and conductors for variousvoltage levels for MidAmerican and Alliant-IES. Figures 3-7 and 3-8 provide theage of certain transformers for MidAmerican.

58
Age in Years
Sources: Information provided by MidAmerican and Alliant.
Sources: Information provided by MidAmerican and Alliant.
Figure 3-4 Number of Poles - 34.5 kV and Above
0
2,000
4,000
6,000
8,000
10,000
12,000
14,000
16,000
18,000
20,000
0 to 9 10 to 19 20 to 29 30 to 39 40 to 49 50 or more
MidAmerican Alliant - West
Figure 3-5 Number of Poles - 13 kV and Below
0
20,000
40,000
60,000
80,000
100,000
120,000
140,000
160,000
180,000
200,000
0 to 9 10 to 19 20 to 29 30 to 39 40 to 49 50 or more
Age in Years
MidAmerican Alliant-West

59
Figure 3.1e Miles of Underground Conductor - 13 kV and Below
0
500
1,000
1,500
2,000
2,500
3,000
3,500
4,000
0 to 9 10 to 19 20 to 29 30 to 39 40 to 49 50 or more
Age in Years
MidAmerican Alliant Energy
Source: Information provided by MidAmerican.
Notes: This type of transformer is typically used to transform distribution circuit primary voltage tocustomer utilization voltageSources: Information provided by MidAmerican.
Figure 3-7 Number of MidAmerican Transformers - Up to 13 kV
0
10,000
20,000
30,000
40,000
50,000
60,000
70,000
80,000
0 to 9 10 to 19 20 to 29 30 to 39 40 to 49 50 or more
Age in Years
Overhead Pad Mount
Figure 3-6 Miles of up to 13 kV Underground Conductor
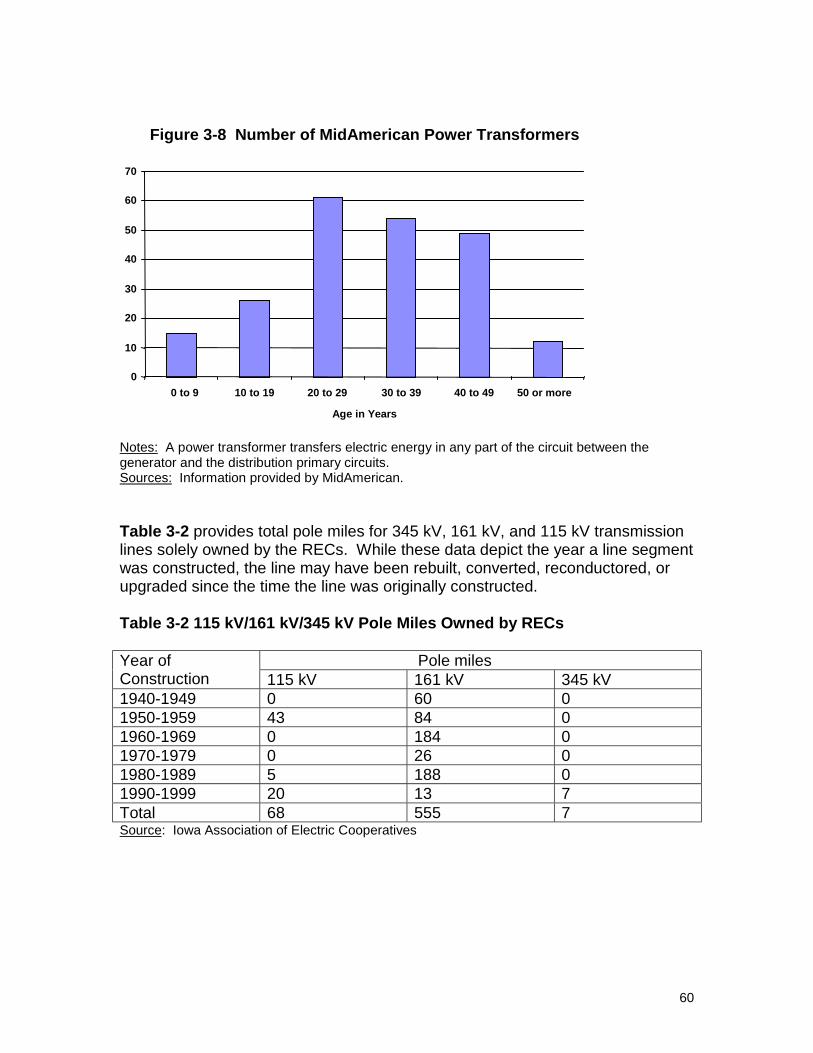
60
Notes: A power transformer transfers electric energy in any part of the circuit between thegenerator and the distribution primary circuits.Sources: Information provided by MidAmerican.
Table 3-2 provides total pole miles for 345 kV, 161 kV, and 115 kV transmissionlines solely owned by the RECs. While these data depict the year a line segmentwas constructed, the line may have been rebuilt, converted, reconductored, orupgraded since the time the line was originally constructed.
Table 3-2 115 kV/161 kV/345 kV Pole Miles Owned by RECs
Pole milesYear ofConstruction 115 kV 161 kV 345 kV1940-1949 0 60 01950-1959 43 84 01960-1969 0 184 01970-1979 0 26 01980-1989 5 188 01990-1999 20 13 7Total 68 555 7Source: Iowa Association of Electric Cooperatives
Figure 3-8 Number of MidAmerican Power Transformers
0
10
20
30
40
50
60
70
0 to 9 10 to 19 20 to 29 30 to 39 40 to 49 50 or more
Age in Years

61
3.2 Reliability of Delivery Systems
3.2.1 Reliability Indices
Reliability indices are used to indicate the reliability of electric service. Theseindices include:• System Average Interruption Frequency Index (SAIFI) – SAIFI indicates the
average number of service interruptions per customer. It is calculated as theratio of the total number of customer interruptions to the total number ofcustomers served.
• System Average Interruption Duration Index (SAIDI) – SAIDI indicates theaverage time that customers are interrupted. It is calculated as the ratio ofthe sum of customer interruption duration divided by the total number ofcustomers served.
• Customer Average Interruption Duration Index (CAIDI) – CAIDI indicates theaverage time required to restore service to the average customer. It iscalculated as the sum of customer interruption duration divided by the totalnumber of interruptions.
Figures 3-9 and 3-10 give the SAIFI, SAIDI, and CAIDI for MidAmerican andAlliant-West since 1995. These indices include portions of MidAmerican’s andAlliant-West’s systems located outside of Iowa. Outages due to storms and othermajor events are also included. The statistics are compiled from data availablefrom automatic outage data systems that are not fully operational.
Figure 3-9 SAIFI
0.00
0.50
1.00
1.50
2.00
2.50
1995 1996 1997 1998 1999
MidAmerican Alliant West
Notes: Differences in yearly indices are largely due to weather.Sources: Information provided by MidAmerican and Alliant.
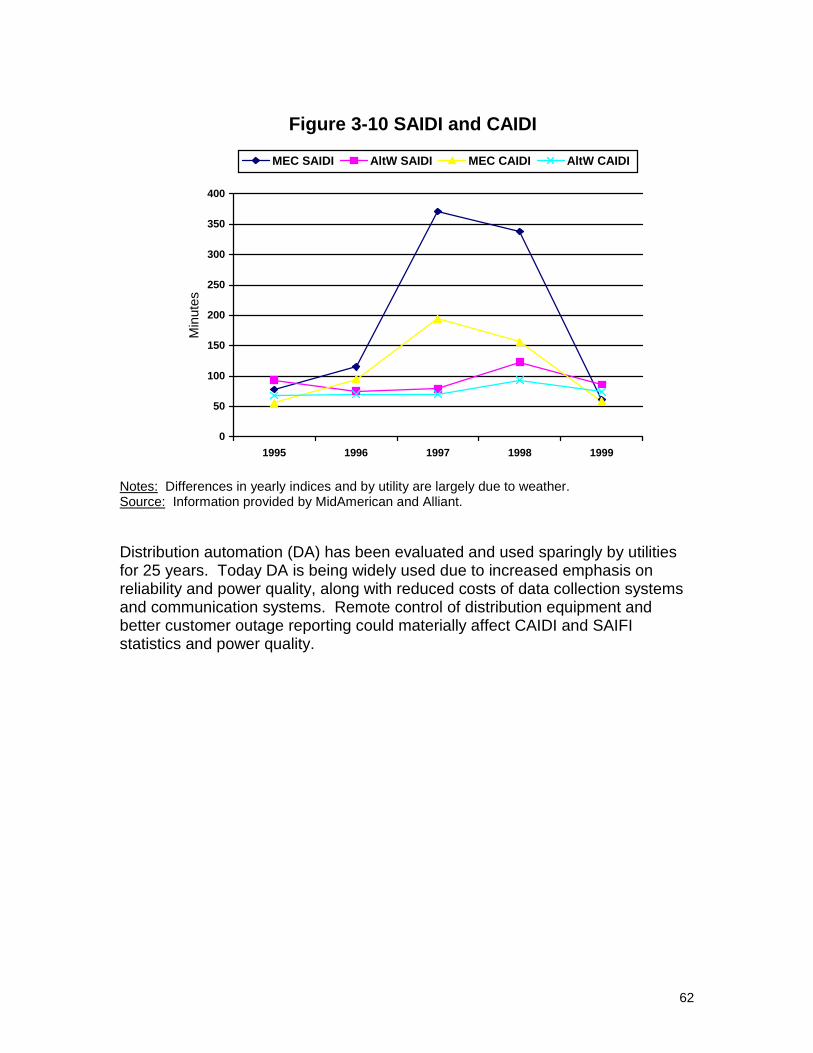
62
Figure 3-10 SAIDI and CAIDI
0
50
100
150
200
250
300
350
400
1995 1996 1997 1998 1999
Min
utes
MEC SAIDI AltW SAIDI MEC CAIDI AltW CAIDI
Notes: Differences in yearly indices and by utility are largely due to weather.Source: Information provided by MidAmerican and Alliant.
Distribution automation (DA) has been evaluated and used sparingly by utilitiesfor 25 years. Today DA is being widely used due to increased emphasis onreliability and power quality, along with reduced costs of data collection systemsand communication systems. Remote control of distribution equipment andbetter customer outage reporting could materially affect CAIDI and SAIFIstatistics and power quality.

63
3.2.2 Bulk Transmission System Outage Report
The MAPP Composite System Reliability Working Group issued a report in June2000 entitled ”Bulk Transmission System Outage Report.” This report provideshistorical performance information for MAPP’s 500 kV, 345 kV, and 230 kVsystems for the 1990-1999 timeframe and for the year 1999 alone. The reportindicates there were fewer 345 kV forced outages with shorter duration in 1999compared to 1998. In 1999, the causes for forced outages were:32
Weather 62%Terminal equipment failure 15%Foreign interference 7%Contamination 6%Transmission line equipment failure 5%Human error 5%
For 345 kV lines, there were more planned outages with shorter duration in 1999as compared to 1998. Some of the major causes were:33
Transmission line maintenance 35%Terminal maintenance 26%Construction 14%
3.2.3 MAPP Constraints
Transmission facilities have limited capability, similar to generating units. Whena transmission line reaches its capability it is considered “constrained.”Constrained transmission interfaces limit the flow of power within the region andbetween regions.
Power typically flows on Iowa’s transmission system from Nebraska to the eastand from Minnesota to the south across the state primarily due to the lower-costgeneration in North Dakota, Nebraska, and MAPP-Canada. Also, there havebeen active power markets in MAIN and the Southwest Power Pool (SPP).
Figure 3-11 is a map of the current MAPP Constrained Interfaces.
32 Forced outages refer to outages that were unplanned. Forced outages may relate togenerating units, transmission, or distribution facilities.33 Planned outages refer to outages purposefully caused by the utility in order to performmaintenance or refuel (in the case of nuclear units).
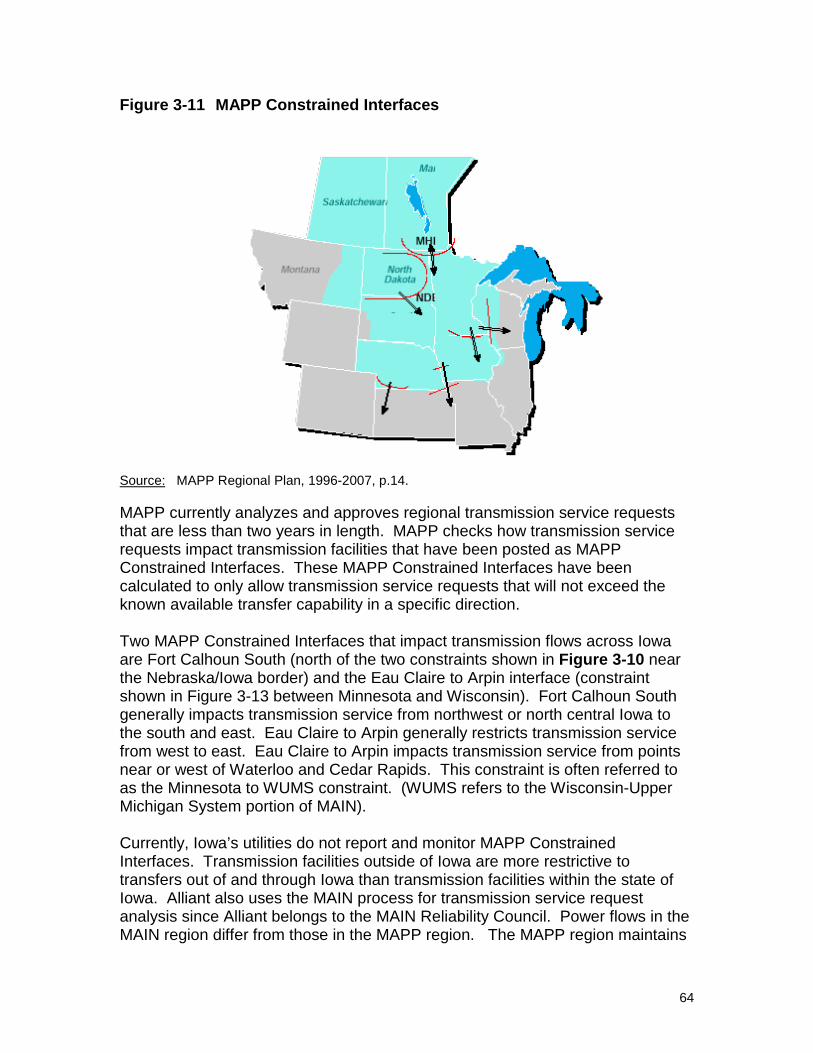
64
Figure 3-11 MAPP Constrained Interfaces
Source: MAPP Regional Plan, 1996-2007, p.14.
MAPP currently analyzes and approves regional transmission service requeststhat are less than two years in length. MAPP checks how transmission servicerequests impact transmission facilities that have been posted as MAPPConstrained Interfaces. These MAPP Constrained Interfaces have beencalculated to only allow transmission service requests that will not exceed theknown available transfer capability in a specific direction.
Two MAPP Constrained Interfaces that impact transmission flows across Iowaare Fort Calhoun South (north of the two constraints shown in Figure 3-10 nearthe Nebraska/Iowa border) and the Eau Claire to Arpin interface (constraintshown in Figure 3-13 between Minnesota and Wisconsin). Fort Calhoun Southgenerally impacts transmission service from northwest or north central Iowa tothe south and east. Eau Claire to Arpin generally restricts transmission servicefrom west to east. Eau Claire to Arpin impacts transmission service from pointsnear or west of Waterloo and Cedar Rapids. This constraint is often referred toas the Minnesota to WUMS constraint. (WUMS refers to the Wisconsin-UpperMichigan System portion of MAIN).
Currently, Iowa’s utilities do not report and monitor MAPP ConstrainedInterfaces. Transmission facilities outside of Iowa are more restrictive totransfers out of and through Iowa than transmission facilities within the state ofIowa. Alliant also uses the MAIN process for transmission service requestanalysis since Alliant belongs to the MAIN Reliability Council. Power flows in theMAIN region differ from those in the MAPP region. The MAPP region maintains

65
a predominant direction of power flow throughout the year, while, in the MAINregion, the predominant power flow often changes directions.
Figure 3-12 provides Firm Capacity Transmission Service (FCTS) refusals byMAPP from November 1997 through January 2000. Refusals are made bypriority group. Firm transmission service has priority over non-firm service.MAPP evaluates the impact of each transmission service request based on howthe request affects all MAPP transmission interfaces.
Figure 3-12
Source: Information provided by MidAmerican.
Curtailments are also made by priority group with firm service given priority overnon-firm service. A properly sized and operational transmission system shouldhave few firm capacity curtailments unless the cost to relieve the constraints istoo high. A highly constrained transmission system may have numerous firmcurtailments.
3.2.4 Potential Constraints in Iowa
The Iowa Transmission Working Group’s (ITWG’s)34 most recent Sub-RegionalTransmission Plan identified the following 115 kV-161 kV facilities in Iowa aspotential constraints to power transfers. These facilities typically constrain powertransfers after MAPP constraints have already taken place. These facilities aremonitored to ensure they do not become more limiting than transmission facilitieslocated outside of Iowa.
34 ITWG is made up of representatives from Iowa utilities that own transmission. The ITWGrecommendations are combined with recommendations from other regional transmission workinggroups to form the MAPP regional transmission plan. A representative from the IUB staff typicallyattends the ITWG meetings.
M AP P R efusal o f F irm C apacity Transm ission S ervice
0
50
100
150
200
Nov
-97
Jan-
98
Mar
-98
May
-98
Jul-9
8
Sep-
98
Nov
-98
Jan-
99
Mar
-99
May
-99
Jul-9
9
Sep-
99
Nov
-99
Jan-
00
M onth W hen R efu sa l W as Issued
Num
ber o
f Ref
usal
s

66
⇒ Lime Creek – Emery 161 kV line (Alliant): This line was first identified in arecent study (not conducted by the ITWG) of the interface between MAPPand MAIN as a potential limiting element.
⇒ Council Bluffs - Bunge 161 kV line (MidAmerican): The Council Bluffs-Bunge161 kV line has shown an overload under heavy power transfers duringoutage conditions. Under typical load conditions at Bunge, the line does notoverload.
⇒ Clinton Area Facilities (Alliant): The Clinton Iowa area transmission system isidentified as an area that needs review. The loading in this area, coupled withsystem transfers across Iowa to MAIN, can cause system violations.
⇒ Denison Area Facilities (Western Area Power Administration): Results fromthe contingency screening study indicate that overloads or low voltages oflower voltage elements occur in the Denison and Creston areas for singlecontingency outages of certain 230 and 161 kV elements. Transmissionadditions in the Denison area are planned in 2003.
⇒ Neal-Monona-Carroll-Grand Jct. 161 kV line (MidAmerican): Although notidentified in the ITWG Sub-Regional Transmission Plan, this 161 kV lineoverloads under outage conditions and heavy power transfers. The Neal toMonona line section is equipped with line tension monitors that allow therating of the line to be increased if the outside temperature is below thehottest temperatures of the summer.
3.3 Future of the State’s Transmission and Distribution Systems
3.3.1 Scheduled Transmission System Construction
The most recent ITWG Sub-Regional Transmission plan lists plannedtransmission projects and upgrades. Based on current conditions, the ITWGstudy concluded that few additional problems occur for Iowa facilities sized at100 kV and above over the next 10 years. The following projects (at 100 kV andabove) are currently scheduled:
⇒ Twin Rivers to Viele 161 kV line (Alliant): This 161 kV, 12.5 mile line will bebuilt by Alliant to increase reliability in the Keokuk, Iowa, region. The line willloop the existing radial 161 kV line that serves the area. The current in-service date for the line is May 1, 2003.
⇒ Salem-Mosalem-Eighth Street 161kV line: This 161 kV, eleven mile line willbe built by Alliant in the Dubuque, Iowa, area to increase system security andreliability. Dubuque is currently served by a double circuit 161 kV line fromSalem Substation. Loss of the double circuit can cause undesirable system

67
operation. The addition of this line will maintain needed support from SalemSubstation. The current in-service date for the line is May 1, 2003.
⇒ LeMars South 161/69 kV Substation and Plymouth to LeMars South 161 kVtransmission line: This 161/69 kV substation will be built by MidAmerican.The substation will be located in the southeast corner of LeMars to serveprojected load increases. The current in-service date for this substation andtransmission line is June 1, 2001.
⇒ Marshalltown to Iowa Falls 115 kV Line Section: Alliant is scheduled to doseveral system upgrades in the Iowa Falls and Wellsburg area. Much of the34.5 kV system in the Iowa Falls and Wellsburg area will be upgraded to 69kV over the next 10 years.
3.3.2 Transmission Siting Requirements
IOWA CODE Chapter 478 requires a franchise from the IUB to construct, erect,maintain, or operate an electric transmission line capable of operating at 34,500volts or more. To obtain a franchise, a petition containing route, design, andpurpose data must be filed with the IUB. If over one mile of private propertywould be affected, a public information meeting must be held not less than 30days before the petition is filed. Before granting a franchise, the IUB must findthat the project is necessary to serve public use and bears a reasonablerelationship to an overall plan of transmitting electricity in the public interest. TheBoard must also accept the proposed route, and may grant the right of eminentdomain where necessary. Notice of the petition is published in a newspaper inthe project area, and a public hearing is required if objections are filed or if thepetitioner seeks the right of eminent domain.
3.3.3 Distributed Generation
Distributed generation is modular electric generation or storage located near thepoint of electric use. Distributed systems include biomass-based generators,combustion turbines, concentrating solar power and photovoltaic systems, fuelcells, wind turbines, microturbines, engine/generator sets, and storage andcontrol technologies. Distributed generation may be used at decentralizedlocations across the transmission and distribution system. These generators caneither be grid connected or operate independently of the grid. Distributedgeneration can reduce effective customer demand on the utility system andpotentially export energy to the grid to compliment existing electric generation.Distributed generation can be customer- or utility-owned generation. Distributedgeneration technologies such as gas turbines, photovoltaics, wind, and fuel cellsare becoming available at a higher level of efficiency and in smaller sizes. Incontrast to large, central-station power plants, distributed power systems typicallyrange from less than a kilowatt (kW) to tens of megawatts (MW) in size. Themost pressing concern at the present time is the lack of national uniform
68
technical standards for interconnecting distributed generation to the electric utilitysystem. Work is underway by the Institute of Electrical and ElectronicsEngineers to develop a “Standard for Distributed Resources Connected toElectric Power Systems.”
In April 2000, MidAmerican completed installation of 28 diesel generators with acapacity of 2 MW each to help meet peak load during the summer of 2000. Eachgenerator, built by Caterpillar, is enclosed within a semi-trailer. In Iowa,MidAmerican installed these distributed generators at company-ownedsubstations in Knoxville, Shenandoah, and Waterloo, where they connect into theelectric grid.
3.3.4 Regional Reliability and Transmission Studies
MAPP 1998 Regional Plan and 1999 Update: MAPP prepared a regionaltransmission planning study for the period 1998 through 2007. The studyproposed construction of several transmission facilities. The study focusedprimarily on local transmission problems. A major recommendation was to builda transmission line to improve the flow of power from the MAPP region intoeastern Wisconsin. Twenty-one different transactions (or power transfersbetween pairs of electric supply and usage points) that experience constraints inthe existing system were considered. The 1999 update to the plan considered695 miles of transmission improvement. The majority of the addition consisted oftwo projects -- an Arrowhead (Duluth, Minnesota) to Weston (Wausau,Wisconsin) 345 kV line, and a Harvey (North Dakota) to Glenboro (Manitoba) 230kV line. Most of the remaining transmission enhancements are required toensure reliable transmission to serve load.
Wisconsin Interface Reliability Enhancement (WIRE) Study: In 1998 and1999, a group consisting primarily of Wisconsin utilities studied Wisconsin’sfuture power import capability known as the WIRE study. The study focused onthe summer of 2002 and identified several transmission improvements that couldincrease power import capability into Wisconsin to 3000 MW. The imports wouldcome from MAPP and Illinois utilities. The study also concluded that already-planned construction could improve the import capability up to 2000 MW, butwould not eliminate concerns regarding operational limits of some existing lines.
The second phase of the project studied a sub-set of the phase-one lines indetail. The study formed the basis to build a transmission line from Arrowheadsubstation in Duluth to the Weston power plant near Wausau. Minnesota andWisconsin regulators are currently considering the application for this line.

69
4.0 Customer Service
Customer service primarily refers to billing, metering, and customer contact. Thissection of the report provides a brief description of recent changes in billing, metering,and outage reporting systems used by the IOUs, the RECs, and the municipal utilities.
4.1 Billing Systems
Technological changes in the U.S. economy are changing the manner in whichbusinesses bill their customers for the services they provide. Technological changesare also having an impact on customer access to the data points that are used in thebilling process and the billing medium (i.e., paper or electronic).
Alliant: Alliant is considering implementation of a front-end enterprise application thatwill allow it to access data, regardless of the legacy system that houses the data. Oncethe front-end implementation is in place, this tool will enable Alliant-West to select andinstall customer billing applications/systems to meet billing needs in a changingindustry. Alliant Energy will begin the functional analysis early next year, with systemselection and implementation to follow. Alliant’s current systems are able to bill for gas,electric and steam commodity, and a minimal level of other services.
MidAmerican: MidAmerican implemented a new Customer Service System (CSS) inNovember 1998. The new system replaced legacy systems. The conversion processtook approximately two years and was a collaborative effort between AndersonConsulting, MidAmerican's Information Technology Department, and subject matterexperts from MidAmerican's customer service, accounting, and other departments.CSS has the capability of billing gas, electricity, lighting, and any non-service productoffered by the MidAmerican. CSS currently bills over 1.2 million service points eachmonth and has the ability to bill several times that amount. Scalability is limited only bythe current processor capacity and disk space.
RECs: Many of Iowa’s RECs outsource some or all of the services related to billing.This is accomplished primarily to achieve economies of scale, to leverage investment intechnological changes, and to leverage experts in computer programming. Electronicbilling via the internet is another option that is being considered by several RECs.
Municipals: Consumers of Iowa’s municipals are billed utilizing either a paper billmailed within an envelope or a postcard type bill. The systems supporting these billingprocesses vary from utility to utility. Some utilities utilize their own billing systems andprocesses while other utilities use a wide variety of systems and processes. Electronicbilling is an option that is being investigated by some municipals.
70
4.2 Metering
Alliant: The Alliant meter reading functions are managed as part of its customer careorganization. This organization houses customer information and manages customercontact. Alliant is currently assessing and expanding the use of metering technology.Alliant currently uses hand-held devices for meter reading and has implemented somepilot automated meter reading (AMR) programs. A web-enabled information center atthe customer premise is an option being explored.
MidAmerican: MidAmerican has approximately 600,000 meters installed within Iowa.Approximately 90 percent of those meters are residential installations. Meterinformation is collected through various technologies such as handheld computers,radio technology, and power-line-carrier. MidAmerican presents meter information onthe internet via a web site and is looking to expand those capabilities. Additionally,AMR technology has been studied and will be pursued if a solid business case presentsitself.
RECs: Iowa’s RECs have meters in all 99 counties of Iowa. Meter data are collectedusing a variety of processes, varying from AMR technologies to handheld meter readingdevices to allow member-consumers the option to read their meter. Most of Iowa’sRECs have either deployed AMR technologies or are in the process of implementing orinvestigating various AMR systems. Changes in metering practices are dependent oncustomer acceptance of such practices.
Municipals: Iowa municipal electric utilities serve nearly 200,000 customers or meters.A variety of hand-held and automated meter reading systems are in-place amongmunicipal utilities.
4.3 Automatic Outage Reporting
Alliant Energy: Alliant’s Distribution Management System (DMS) analyzes outages onthe distribution system and aids in the development of switching plans. The systemuses incoming calls generated from within the Customer Information System to conductthe outage analysis. The application calculates the probable outage device based onthe location of the incident(s) on the electric system. As more trouble calls are received,the application will automatically recalculate the probable outage device based on theoutage analysis rules. Once the outage is confirmed and service is restored, a callbacklist is generated for the customer service consultants to verify the service has beenrestored. Also, when an outage is confirmed, the dispatcher may enter the cause andestimated restoration time. This information is entered into all affected customers’account histories. This provides consultants near real time information as well ashistorical information for individual customers. Outage data is collected and archivedwithin a reporting tool. The reporting tool provides a restored outage history and allowsoutages to be reviewed and filtered in a variety of ways for additional analysis (i.e.,
71
outage type, outage ID, cause, substation, feeder number, etc.). The DMS also aids inthe development of switching plans. Plans may be submitted within a test mode to helpdetermine validity and flag any operational concerns.
MidAmerican: MidAmerican’s Electric Outage Management System (EOMS) providesboth real-time and historical customer outage information. Outage data collectedinclude location, cause, start date and time, end date and time, and customers affected.The real-time and historical outage statistics may be interrogated and summarized bydistrict, service center, substation, circuit, or customer. This allows for calculation ofboth frequency and duration of outage related statistics. The data collected are basedupon incoming customer calls. In real time, the EOMS system aids the outagerestoration process as it automatically groups associated customer outages together todetermine the location of the device that opened. A summary of outage orders and thestatus or such orders is displayed on-line. As each order progresses through thevarious stages (order assigned, crew dispatched, crew arrives on site, estimated servicerestoration, actual service restoration, and order completed), dates and times areentered for each stage and displayed on-line. As orders are completed, the outageoccurrence, cause, action taken, and any crew remarks are noted and become part ofthe outage history. This provides the customer service associates both real time andhistorical information.
RECs: Some RECs have undertaken a distribution automation project calledSupervisory Control and Data Acquisition. When completed, this system will allowmonitoring and control from the central office of many substations, substation devices,and line switching applications. This monitoring will allow operators to view informationin the field without dispatching a crew. The control aspect will allow some protectivedevices to be controlled in the office so, when an outage occurs, the problem can beresolved in a much quicker manner. Line crews can fix the problem without going backto the substation to reactivate the protective device. The system will also provide moredetailed information for planning and targeting system upgrades.
Cooperatives that borrow money from Rural Utility Service (RUS--formerly REA) arerequired to annually report certain data regarding outages. Because of the smallnumber of consumers, physical locale to the member, the inherent accountability to themember-consumer, and the accountability to RUS, many cooperatives have relied onmore traditional processes of outage reporting.

List of Acronyms
AEP – Alternate Energy Production
AMR – Automated Meter Reading
Btu – British Thermal Unit
CAAA – Clean Air Act Amendments
CAIDI – Customer Average Interruption Duration Index
DMS – Distribution Management System
EIA – Energy Information Administration
EOMS – Electric Outage Management System
EPACT – Energy Policy Act
FCTS – Firm Capacity Transmission Service
FERC - Federal Energy Regulatory Commission
FPA - Federal Power Act
G&T - Generation and Transmission Cooperative
GW – Gigawatt
GWh – Gigawatt Hour
IAC - Iowa Administrative Code
IAEC - Iowa Association of Electric Cooperatives
IAMU - Iowa Association of Municipal Utilities
IDNR – Iowa Department of Natural Resources
IESC - Iowa Electrical Safety Code
ITWG – Iowa Transmission Working Group
IUB – Iowa Utilities Board
IOU - Investor-Owned Utility
ISO - Independent System Operator
IES - IES Utilities Inc.
KV - Kilovolt
kW - Kilowatt
kWh – Kilowatt Hour
LC – Load Control
List of Acronyms ContinuedMAIN - Mid-American Interconnected Network
MAPP - Mid-Continent Area Power Pool
MEC – MidAmerican Energy Company
MISO – Midwest Independent System Operation
MW – Megawatt
MWh – Megawatt Hour
NERC - North American Electric Reliability Council
NIMECA – North Iowa Municipal Electric Cooperative Association
NIPCO - Northwest Iowa Power Cooperative
NOx – Oxides of Nitrogen
OMS - Outage Management System
PBR - Performance-Based Regulation
PDS – Prevention of Significant Deterioration
PJM – Pennsylvania, New Jersey, Maryland Power Pool
PUC - Public Utilities Commission
REA – Rural Electric Association
REC - Rural Electric Cooperative
RTO – Regional Transmission Organization
RUS – Rural Utility Service
SAIDI – System Average Interruption Duration Index
SAIFI – System Average Interruption Frequency Index
SIMECA – South Iowa Municipal Electric Cooperative Association
SO2 – Sulfur Dioxide
SPP – Southwest Power Pool
WAPA – Western Area Power Administration
WIRE – Wisconsin Interface Reliability Enhancement
WUMS – Wisconsin-Upper Michigan System
WPL – Wisconsin Power and Light
Glossary of Terms
Alternative Energy Producer (AEP) – An AEP is an electric facility that derives 75percent or more of its energy input from solar energy, wind, hydro, wastemanagement, resource recovery, refuse-derived fuel, agricultural crops orresidues, or wood.
Base Load Capacity – Base-load units run near full capacity continuously dayand night, all year long. Base-load units have high first costs and low fuel costs.Typically coal fired, nuclear, and hydroelectric units are base-load units.
Billing Services – Billing and collection for delivery services.
Bulk Power Market – Power transactions among utilities, or from a WholesalePower Supply Provider to a Delivery Service Provider, power marketer or broker,or other wholesale entity.
Bulk Power System – The electrical system consisting of generation and theinterconnected transmission system that moves bulk power to distribution ordelivery systems.
Bulk Power System Reliability – There are two aspects of bulk power systemreliability: adequacy and security. Adequacy is the ability of the electric systemto supply the demand and energy requirements of the End-Use Consumers at alltimes, taking into account all outages of system elements. Security is the abilityof the system to withstand sudden disturbances.
Curtailment – A reduction in the scheduled capacity or energy.
Customer – A person that consumes or uses electric energy.
Demand – Electric power measured in kilowatts.
Deregulation – The elimination of regulation from a previously regulated industryor sector of an industry.
Distribution Service – Electricity service provided over low-voltage lines to retailconsumers.
Economic Dispatch – Distribution of total generation requirements amongalternative generator sources for optimum system economy taking into accountboth incremental generating costs and incremental transmission costs.
Electric Cooperative – An electric utility service provider formed or organized asan Electric Cooperative under the laws of Iowa or elsewhere.
Glossary of Terms Continued
Energy – Electic energy measured in kilowatt-hours (kWh).
FERC – The Federal Energy Regulatory Commission (FERC) regulateswholesale power and transmission services.
Firm Power – Power which is intended to have assured availability to the End –Use Consumer to meet all or any agreed-upon portion of his load requirements.
Generation and Transmission Electric Cooperative (G&T) – A non-profitcorporation, owned and controlled by Rural Electric Cooperatives (RECs)providing distribution service, that supplies wholesale power and transmissionservices to its members.
Independent System Operator (ISO) – An ISO is an independent entity thatpolices, monitors, and has overall decision-making authority over electrictransmission operations. The purpose of an ISO is to provide reasonable andequitable access to the transmission system, to operate the transmission systemsafely and reliably, and to prevent the transmission system from becoming afactor in enhancing market power in an electricity market.
Interconnected System -- A system consisting of two or more individual electricsystems that normally operate in synchronism and have connecting tie lines.
Interface -- The specific set of transmission elements between two areas orbetween two areas comprising one or more electrical systems.
Intermediate Load Capacity -- Intermediate load units fit between base loadcapacity and peaking capacity in both first costs and fuel costs. Intermediateload units are designed to be “cycled,” that is turned off regularly at night or onweekends and loaded up and down rapidly during the time it is on the line inorder to take the load swings on the system. Older smaller base-load units andhydro units with restrictions on water use are some times used as intermediateunits. Natural gas and oil fired units are also used as intermediate units.Load Factor – The average load of a customer, a group of customers, or thesystem divided by the maximum load. For example, assuming 48 kWh of usagefor the day, the average load is 48/24 or 2 KW. If the maximum load is 4 KW, theload factor is 2/4 = 50 percent.
Municipal Utility – A city enterprise engaged in the production, delivery, service,or sales of energy established pursuant to Code of Iowa Chapter 388. MunicipalUtility includes a combined utility system.
Power Transformer – A power transformer transfers electric energy in any part ofthe circuit between the generator and the distribution primary circuits.
Glossary of Terms Continued
Peaking Capacity – Peaking units are run only during daily peak load periodsduring seasonal peak times and during emergencies. Peaking units generallyhave low first and high fuel costs. Combustion turbines and pumped-storagehydro units are the typical peaking units.
Tie Line - A circuit connecting two or more control areas or systems of an electricsystem.
Time-of-Day Rate Structure – A rate structure that allows the price of electricity tothe end-user to change at predetermined intervals (e.g., every half-hour) throughout the day.
Transformer (up to 13 kV) – Transformer is an electric device, which when used,will raise or lower the voltage of alternating current of the original source. Thistype of transformer is typically used to transform distribution circuit primaryvoltage to customer utilization voltage.
Transmission Grid (System) – An interconnected group of electric transmissionlines and associated equipment for the movement or transfer of electric energy inbulk between points of supply and points of delivery.
Transmission-Line Capacity – The maximum continuous rating of a transmissionline. The rating may be limited by thermal considerations, capacity of associatedequipment, voltage regulation, system stability, or other factors.
Transmission-Line Constraint – Limits on the transmission line because ofphysical or system requirements.
Utility – A person owning or operating facilities for furnishing electric services tothe public for compensation and subject to rate or service jurisdiction of theBoard pursuant to Code of Iowa Chapter 476.
LIST OF APPENDICES
Appendix A – List of Municipal UtilitiesAppendix B – List of Rural Electric CooperativesAppendix C – Investor-Owned Utilities’ Reporting to MAPPAppendix D – Iowa Utility GeneratorsAppendix E – Iowa Non-Utility GeneratorsAppendix F -- New Generation (Operational and Announced)
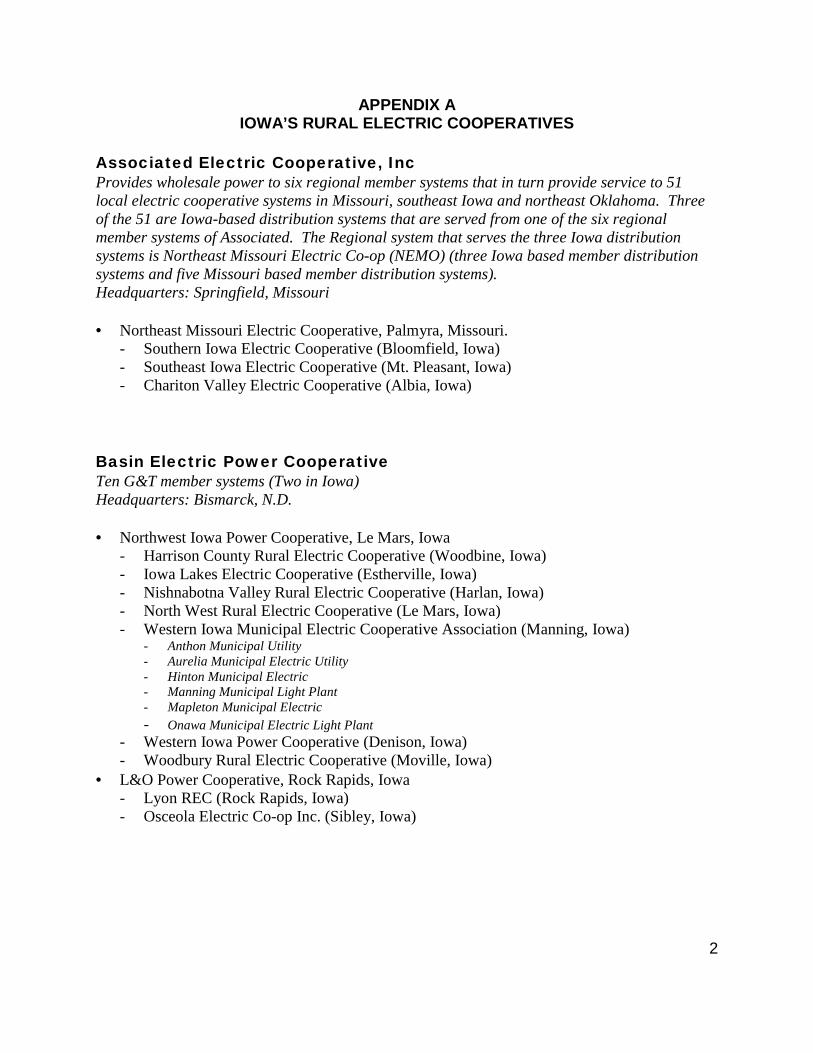
2
APPENDIX AIOWA’S RURAL ELECTRIC COOPERATIVES
Associated Electric Cooperative, IncProvides wholesale power to six regional member systems that in turn provide service to 51local electric cooperative systems in Missouri, southeast Iowa and northeast Oklahoma. Threeof the 51 are Iowa-based distribution systems that are served from one of the six regionalmember systems of Associated. The Regional system that serves the three Iowa distributionsystems is Northeast Missouri Electric Co-op (NEMO) (three Iowa based member distributionsystems and five Missouri based member distribution systems).Headquarters: Springfield, Missouri
• Northeast Missouri Electric Cooperative, Palmyra, Missouri.- Southern Iowa Electric Cooperative (Bloomfield, Iowa)- Southeast Iowa Electric Cooperative (Mt. Pleasant, Iowa)- Chariton Valley Electric Cooperative (Albia, Iowa)
Basin Electric Power CooperativeTen G&T member systems (Two in Iowa)Headquarters: Bismarck, N.D.
• Northwest Iowa Power Cooperative, Le Mars, Iowa- Harrison County Rural Electric Cooperative (Woodbine, Iowa)- Iowa Lakes Electric Cooperative (Estherville, Iowa)- Nishnabotna Valley Rural Electric Cooperative (Harlan, Iowa)- North West Rural Electric Cooperative (Le Mars, Iowa)- Western Iowa Municipal Electric Cooperative Association (Manning, Iowa)
- Anthon Municipal Utility- Aurelia Municipal Electric Utility- Hinton Municipal Electric- Manning Municipal Light Plant- Mapleton Municipal Electric- Onawa Municipal Electric Light Plant
- Western Iowa Power Cooperative (Denison, Iowa)- Woodbury Rural Electric Cooperative (Moville, Iowa)
• L&O Power Cooperative, Rock Rapids, Iowa- Lyon REC (Rock Rapids, Iowa)- Osceola Electric Co-op Inc. (Sibley, Iowa)
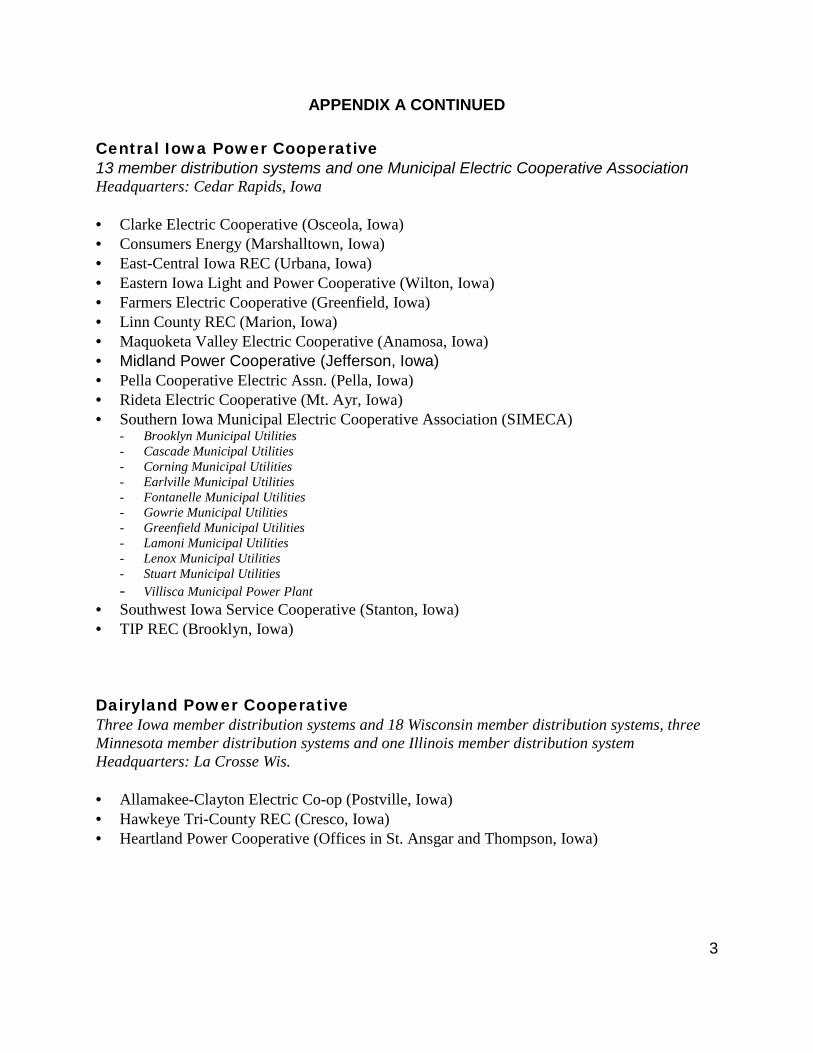
3
APPENDIX A CONTINUED
Central Iowa Power Cooperative13 member distribution systems and one Municipal Electric Cooperative AssociationHeadquarters: Cedar Rapids, Iowa
• Clarke Electric Cooperative (Osceola, Iowa)• Consumers Energy (Marshalltown, Iowa)• East-Central Iowa REC (Urbana, Iowa)• Eastern Iowa Light and Power Cooperative (Wilton, Iowa)• Farmers Electric Cooperative (Greenfield, Iowa)• Linn County REC (Marion, Iowa)• Maquoketa Valley Electric Cooperative (Anamosa, Iowa)• Midland Power Cooperative (Jefferson, Iowa)• Pella Cooperative Electric Assn. (Pella, Iowa)• Rideta Electric Cooperative (Mt. Ayr, Iowa)• Southern Iowa Municipal Electric Cooperative Association (SIMECA)
- Brooklyn Municipal Utilities- Cascade Municipal Utilities- Corning Municipal Utilities- Earlville Municipal Utilities- Fontanelle Municipal Utilities- Gowrie Municipal Utilities- Greenfield Municipal Utilities- Lamoni Municipal Utilities- Lenox Municipal Utilities- Stuart Municipal Utilities- Villisca Municipal Power Plant
• Southwest Iowa Service Cooperative (Stanton, Iowa)• TIP REC (Brooklyn, Iowa)
Dairyland Power CooperativeThree Iowa member distribution systems and 18 Wisconsin member distribution systems, threeMinnesota member distribution systems and one Illinois member distribution systemHeadquarters: La Crosse Wis.
• Allamakee-Clayton Electric Co-op (Postville, Iowa)• Hawkeye Tri-County REC (Cresco, Iowa)• Heartland Power Cooperative (Offices in St. Ansgar and Thompson, Iowa)
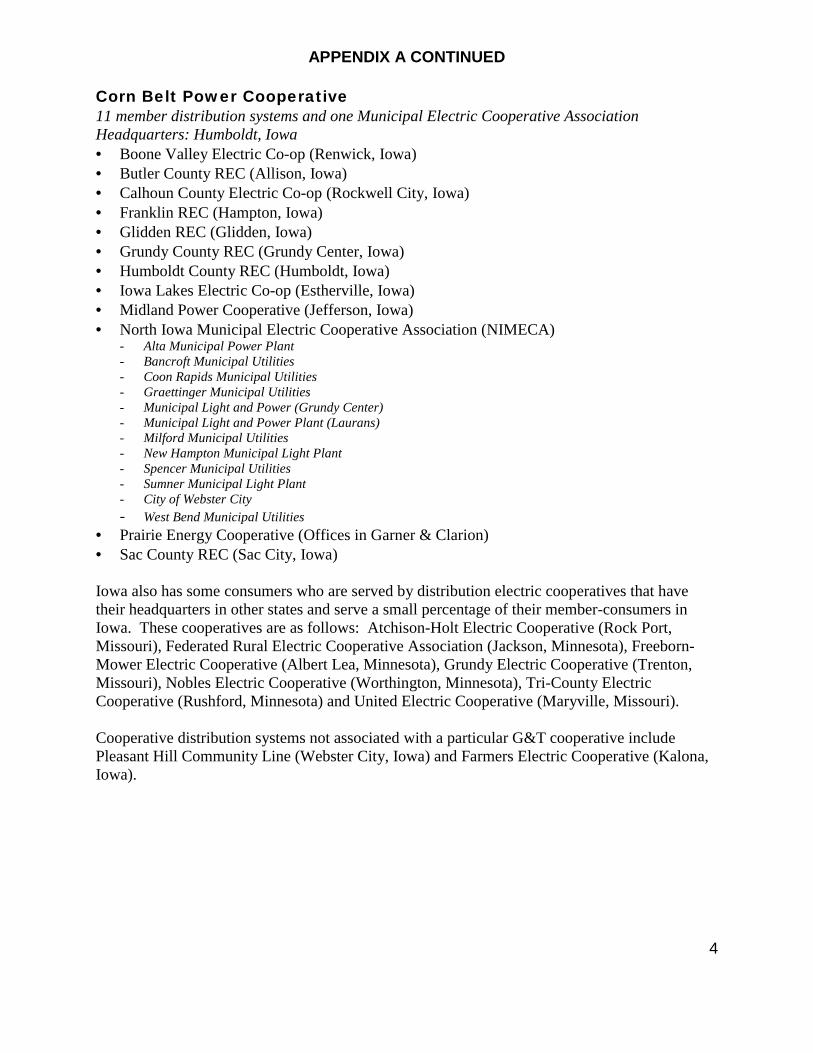
4
APPENDIX A CONTINUED
Corn Belt Power Cooperative11 member distribution systems and one Municipal Electric Cooperative AssociationHeadquarters: Humboldt, Iowa• Boone Valley Electric Co-op (Renwick, Iowa)• Butler County REC (Allison, Iowa)• Calhoun County Electric Co-op (Rockwell City, Iowa)• Franklin REC (Hampton, Iowa)• Glidden REC (Glidden, Iowa)• Grundy County REC (Grundy Center, Iowa)• Humboldt County REC (Humboldt, Iowa)• Iowa Lakes Electric Co-op (Estherville, Iowa)• Midland Power Cooperative (Jefferson, Iowa)• North Iowa Municipal Electric Cooperative Association (NIMECA)
- Alta Municipal Power Plant- Bancroft Municipal Utilities- Coon Rapids Municipal Utilities- Graettinger Municipal Utilities- Municipal Light and Power (Grundy Center)- Municipal Light and Power Plant (Laurans)- Milford Municipal Utilities- New Hampton Municipal Light Plant- Spencer Municipal Utilities- Sumner Municipal Light Plant- City of Webster City- West Bend Municipal Utilities
• Prairie Energy Cooperative (Offices in Garner & Clarion)• Sac County REC (Sac City, Iowa)
Iowa also has some consumers who are served by distribution electric cooperatives that havetheir headquarters in other states and serve a small percentage of their member-consumers inIowa. These cooperatives are as follows: Atchison-Holt Electric Cooperative (Rock Port,Missouri), Federated Rural Electric Cooperative Association (Jackson, Minnesota), Freeborn-Mower Electric Cooperative (Albert Lea, Minnesota), Grundy Electric Cooperative (Trenton,Missouri), Nobles Electric Cooperative (Worthington, Minnesota), Tri-County ElectricCooperative (Rushford, Minnesota) and United Electric Cooperative (Maryville, Missouri).
Cooperative distribution systems not associated with a particular G&T cooperative includePleasant Hill Community Line (Webster City, Iowa) and Farmers Electric Cooperative (Kalona,Iowa).

5
APPENDIX B – IOWA’S MUNICIPAL UTILITIES
1. Afton City of 38. Ellsworth City of 75. Long Grove City of 112. Spencer City of2. Akron City of 39. Estherville City of 76. Manilla Town of 113. Stanhope City of3. Algona City of 40. Fairbank City of 77. Manning City of 114. Stanton City of4. Alta City of 41. Farnhamville City of 78. Mapleton City of 115. State Center City of5. Alta Vista City of 42. Fonda City of 79. Maquoketa City of 116. Story City City of6. Alton City of 43. Fontanelle City of 80. Marathon City of 117. Stratford City of7. Ames City of 44. Forest City City of 81. McGregor City of 118. Strawberry Point City
of8. Anita City of 45. Fredericksburg City of 82. Milford City of 119. Stuart City of9. Anthon City of 46. Glidden City of 83. Montezuma City of 120. Sumner City of10. Aplington City of 47. Gowrie City of 84. Mt Pleasant City of 121. Tennant City of11. Atlantic City of 48. Graettinger City of 85. Muscatine City of 122. Tipton City of12. Auburn City of 49. Grafton City of 86. Neola City of 123. Traer City of13. Aurelia City of 50. Grand Junction City of 87. New Hampton City
of124. Villisca City of
14. Bancroft MunicipalUtilities
51. Greenfield City of 88. New LondonMunicipal Utilities
125. Vinton City of
15. Bellevue City of 52. Grundy Center City of 89. Ogden City of 126. Wall Lake City of16. Bloomfield City of 53. Guttenberg City of 90. Onawa City of 127. Waverly City of17. Breda City of 54. Harlan City of 91. Orange City City of 128. Webster City City of18. Brooklyn City of 55. Hartley City of 92. Orient City of 129. West Bend City of19. Buffalo City of 56. Hawarden City of 93. Osage City of 130. West Liberty City of20. Burt City of 57. Hinton City of 94. Panora City of 131. West Point City of21. Callender City of 58. Hopkinton City of 95. Paton City of 132. Westfield Town of22. Carlisle City of 59. Hudson City of 96. Paullina City of 133. Whittemore City of23. Cascade City of 60. Independence City of 97. Pella City of 134. Wilton City of24. Cedar Falls City of 61. Indianola City of 98. Pocahontas City of 135. Winterset City of25. Coggon City of 62. Keosauqua City of 99 Preston City of 136. Woodbine City of26. Coon Rapids City of 63. Kimballton City of 100. Primghar City of 137. Woolstock City of27. Corning City of 64. La Porte City City of 101. Readlyn City of28. Corwith City of 65. Lake Mills City of 102. Remsen City of29. Danville City of 66. Lake Park City of 103. Renwick City of30. Dayton City of 67. Lake View City of 104. Rock Rapids City of31. Denison City of 68. Lamoni City of 105. Rockford City of32. Denver City of 69. Larchwood City of 106. Sabula City of33. Dike City of 70. Laurens City of 107. Sanborn City of34. Durant City of 71. Lawler City of 108. Sergeant Bluff City
of35. Dysart City of 72. Lehigh City of 109. Shelby City of36. Earlville City of 73. Lenox City of 110. Sibley City of37. Eldridge City of 74. Livermore City of 111. Sioux Center City of
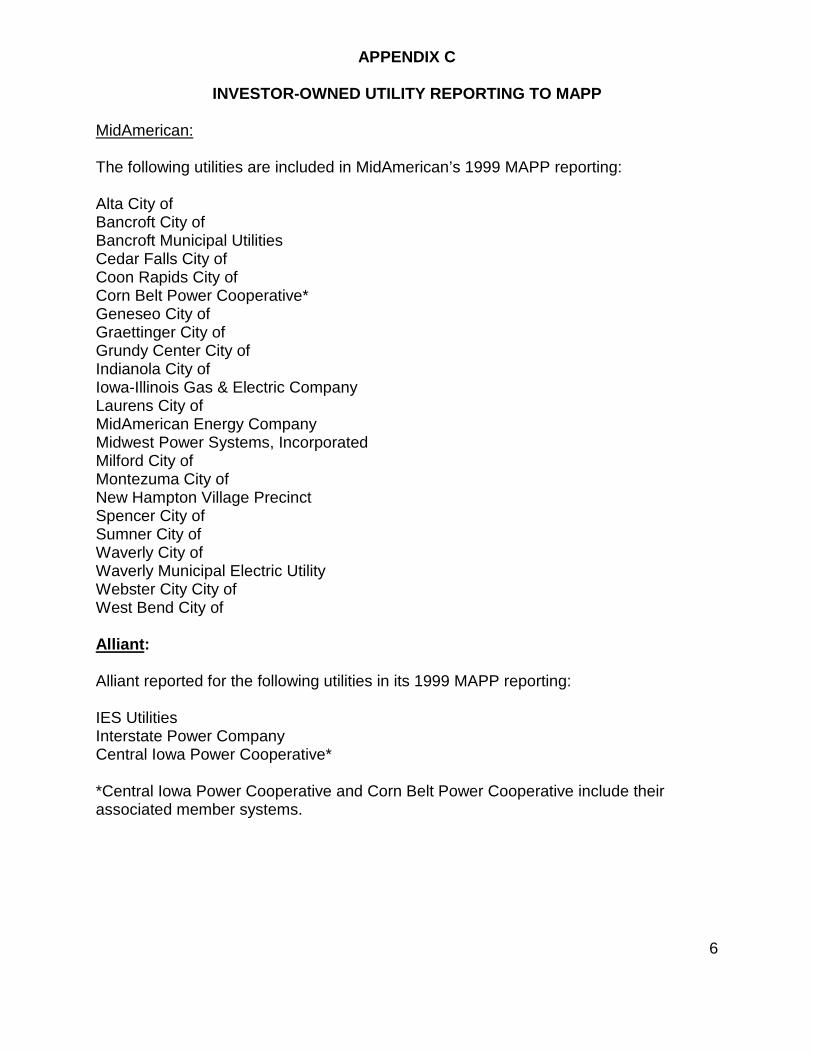
6
APPENDIX C
INVESTOR-OWNED UTILITY REPORTING TO MAPP
MidAmerican:
The following utilities are included in MidAmerican’s 1999 MAPP reporting:
Alta City ofBancroft City ofBancroft Municipal UtilitiesCedar Falls City ofCoon Rapids City ofCorn Belt Power Cooperative*Geneseo City ofGraettinger City ofGrundy Center City ofIndianola City ofIowa-Illinois Gas & Electric CompanyLaurens City ofMidAmerican Energy CompanyMidwest Power Systems, IncorporatedMilford City ofMontezuma City ofNew Hampton Village PrecinctSpencer City ofSumner City ofWaverly City ofWaverly Municipal Electric UtilityWebster City City ofWest Bend City of
Alliant:
Alliant reported for the following utilities in its 1999 MAPP reporting:
IES UtilitiesInterstate Power CompanyCentral Iowa Power Cooperative*
*Central Iowa Power Cooperative and Corn Belt Power Cooperative include theirassociated member systems.
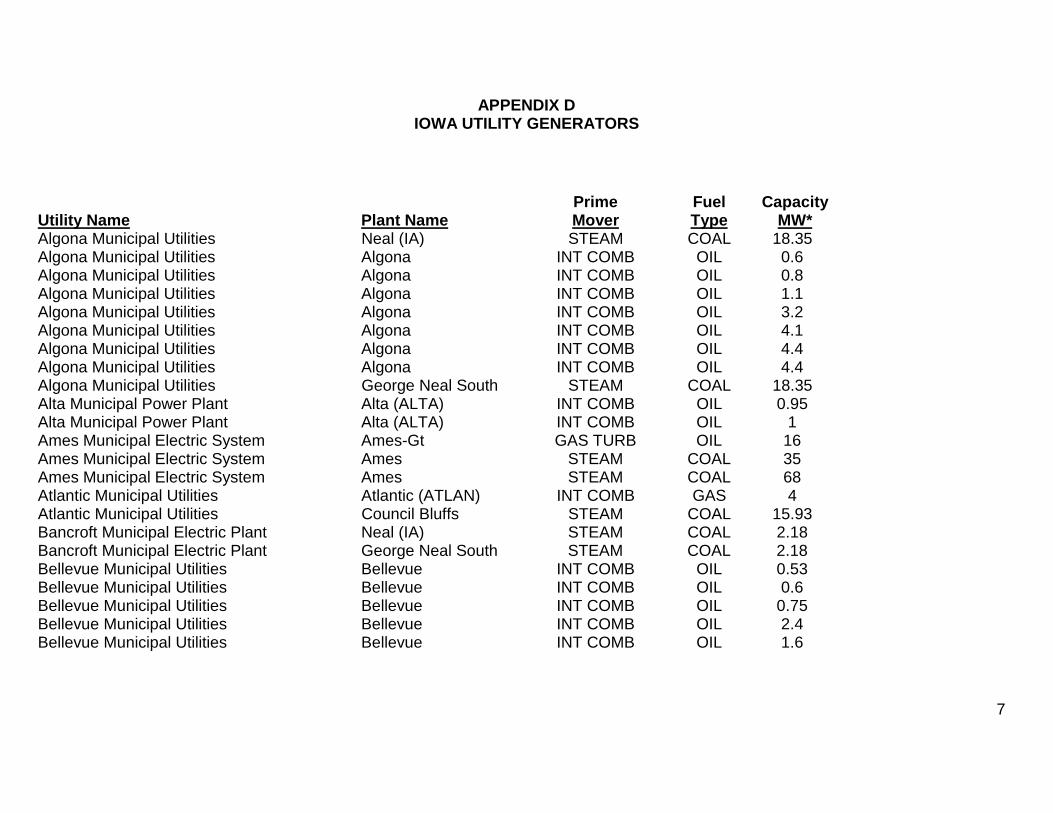
7
APPENDIX DIOWA UTILITY GENERATORS
Utility Name Plant NamePrimeMover
FuelType
CapacityMW*
Algona Municipal Utilities Neal (IA) STEAM COAL 18.35Algona Municipal Utilities Algona INT COMB OIL 0.6Algona Municipal Utilities Algona INT COMB OIL 0.8Algona Municipal Utilities Algona INT COMB OIL 1.1Algona Municipal Utilities Algona INT COMB OIL 3.2Algona Municipal Utilities Algona INT COMB OIL 4.1Algona Municipal Utilities Algona INT COMB OIL 4.4Algona Municipal Utilities Algona INT COMB OIL 4.4Algona Municipal Utilities George Neal South STEAM COAL 18.35Alta Municipal Power Plant Alta (ALTA) INT COMB OIL 0.95Alta Municipal Power Plant Alta (ALTA) INT COMB OIL 1Ames Municipal Electric System Ames-Gt GAS TURB OIL 16Ames Municipal Electric System Ames STEAM COAL 35Ames Municipal Electric System Ames STEAM COAL 68Atlantic Municipal Utilities Atlantic (ATLAN) INT COMB GAS 4Atlantic Municipal Utilities Council Bluffs STEAM COAL 15.93Bancroft Municipal Electric Plant Neal (IA) STEAM COAL 2.18Bancroft Municipal Electric Plant George Neal South STEAM COAL 2.18Bellevue Municipal Utilities Bellevue INT COMB OIL 0.53Bellevue Municipal Utilities Bellevue INT COMB OIL 0.6Bellevue Municipal Utilities Bellevue INT COMB OIL 0.75Bellevue Municipal Utilities Bellevue INT COMB OIL 2.4Bellevue Municipal Utilities Bellevue INT COMB OIL 1.6
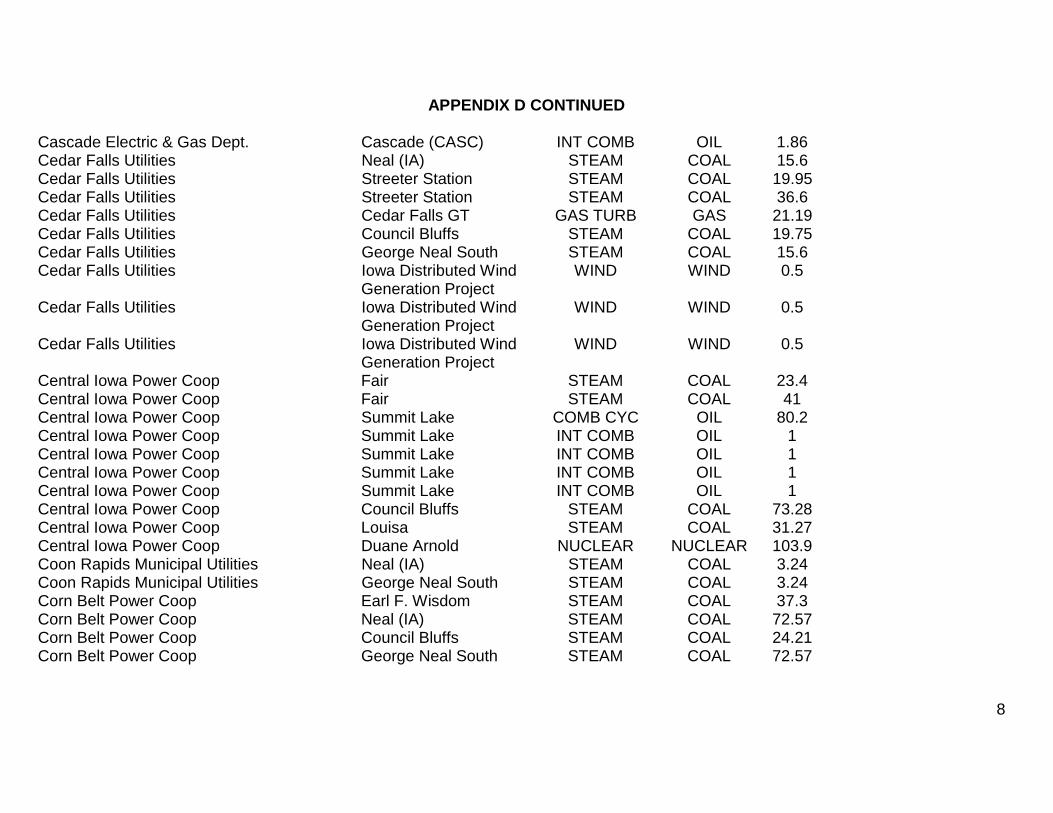
8
APPENDIX D CONTINUED
Cascade Electric & Gas Dept. Cascade (CASC) INT COMB OIL 1.86Cedar Falls Utilities Neal (IA) STEAM COAL 15.6Cedar Falls Utilities Streeter Station STEAM COAL 19.95Cedar Falls Utilities Streeter Station STEAM COAL 36.6Cedar Falls Utilities Cedar Falls GT GAS TURB GAS 21.19Cedar Falls Utilities Council Bluffs STEAM COAL 19.75Cedar Falls Utilities George Neal South STEAM COAL 15.6Cedar Falls Utilities Iowa Distributed Wind
Generation ProjectWIND WIND 0.5
Cedar Falls Utilities Iowa Distributed WindGeneration Project
WIND WIND 0.5
Cedar Falls Utilities Iowa Distributed WindGeneration Project
WIND WIND 0.5
Central Iowa Power Coop Fair STEAM COAL 23.4Central Iowa Power Coop Fair STEAM COAL 41Central Iowa Power Coop Summit Lake COMB CYC OIL 80.2Central Iowa Power Coop Summit Lake INT COMB OIL 1Central Iowa Power Coop Summit Lake INT COMB OIL 1Central Iowa Power Coop Summit Lake INT COMB OIL 1Central Iowa Power Coop Summit Lake INT COMB OIL 1Central Iowa Power Coop Council Bluffs STEAM COAL 73.28Central Iowa Power Coop Louisa STEAM COAL 31.27Central Iowa Power Coop Duane Arnold NUCLEAR NUCLEAR 103.9Coon Rapids Municipal Utilities Neal (IA) STEAM COAL 3.24Coon Rapids Municipal Utilities George Neal South STEAM COAL 3.24Corn Belt Power Coop Earl F. Wisdom STEAM COAL 37.3Corn Belt Power Coop Neal (IA) STEAM COAL 72.57Corn Belt Power Coop Council Bluffs STEAM COAL 24.21Corn Belt Power Coop George Neal South STEAM COAL 72.57
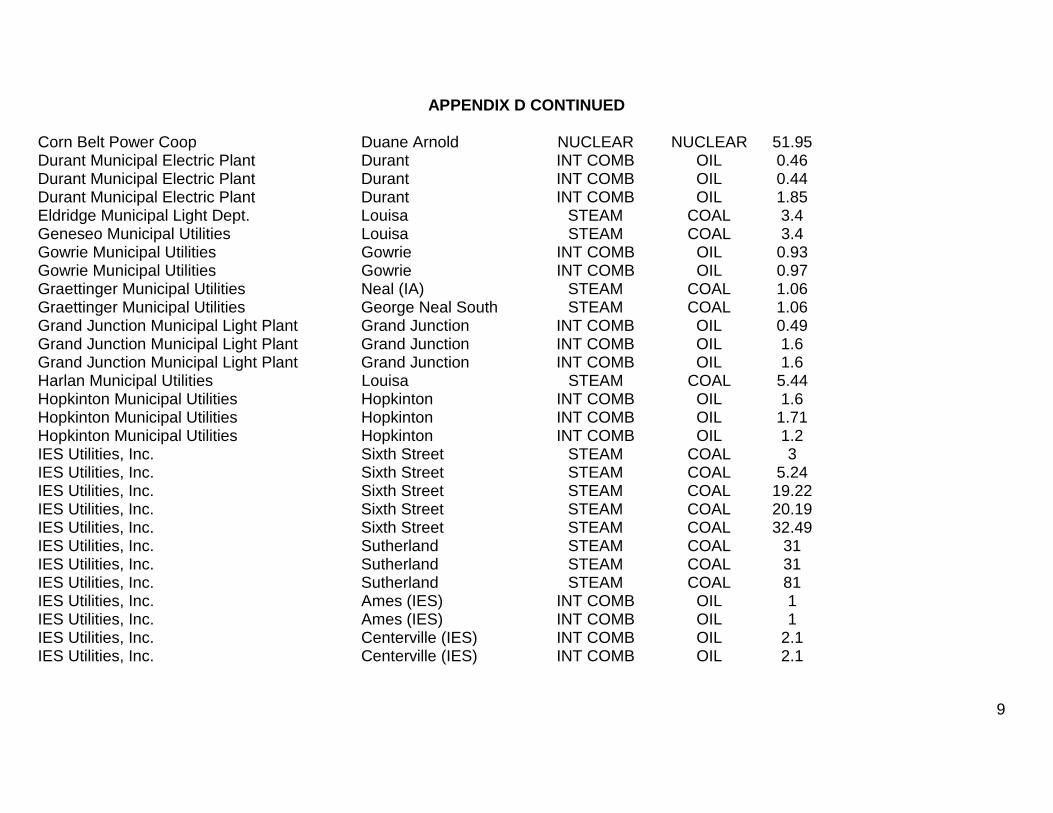
9
APPENDIX D CONTINUED
Corn Belt Power Coop Duane Arnold NUCLEAR NUCLEAR 51.95Durant Municipal Electric Plant Durant INT COMB OIL 0.46Durant Municipal Electric Plant Durant INT COMB OIL 0.44Durant Municipal Electric Plant Durant INT COMB OIL 1.85Eldridge Municipal Light Dept. Louisa STEAM COAL 3.4Geneseo Municipal Utilities Louisa STEAM COAL 3.4Gowrie Municipal Utilities Gowrie INT COMB OIL 0.93Gowrie Municipal Utilities Gowrie INT COMB OIL 0.97Graettinger Municipal Utilities Neal (IA) STEAM COAL 1.06Graettinger Municipal Utilities George Neal South STEAM COAL 1.06Grand Junction Municipal Light Plant Grand Junction INT COMB OIL 0.49Grand Junction Municipal Light Plant Grand Junction INT COMB OIL 1.6Grand Junction Municipal Light Plant Grand Junction INT COMB OIL 1.6Harlan Municipal Utilities Louisa STEAM COAL 5.44Hopkinton Municipal Utilities Hopkinton INT COMB OIL 1.6Hopkinton Municipal Utilities Hopkinton INT COMB OIL 1.71Hopkinton Municipal Utilities Hopkinton INT COMB OIL 1.2IES Utilities, Inc. Sixth Street STEAM COAL 3IES Utilities, Inc. Sixth Street STEAM COAL 5.24IES Utilities, Inc. Sixth Street STEAM COAL 19.22IES Utilities, Inc. Sixth Street STEAM COAL 20.19IES Utilities, Inc. Sixth Street STEAM COAL 32.49IES Utilities, Inc. Sutherland STEAM COAL 31IES Utilities, Inc. Sutherland STEAM COAL 31IES Utilities, Inc. Sutherland STEAM COAL 81IES Utilities, Inc. Ames (IES) INT COMB OIL 1IES Utilities, Inc. Ames (IES) INT COMB OIL 1IES Utilities, Inc. Centerville (IES) INT COMB OIL 2.1IES Utilities, Inc. Centerville (IES) INT COMB OIL 2.1
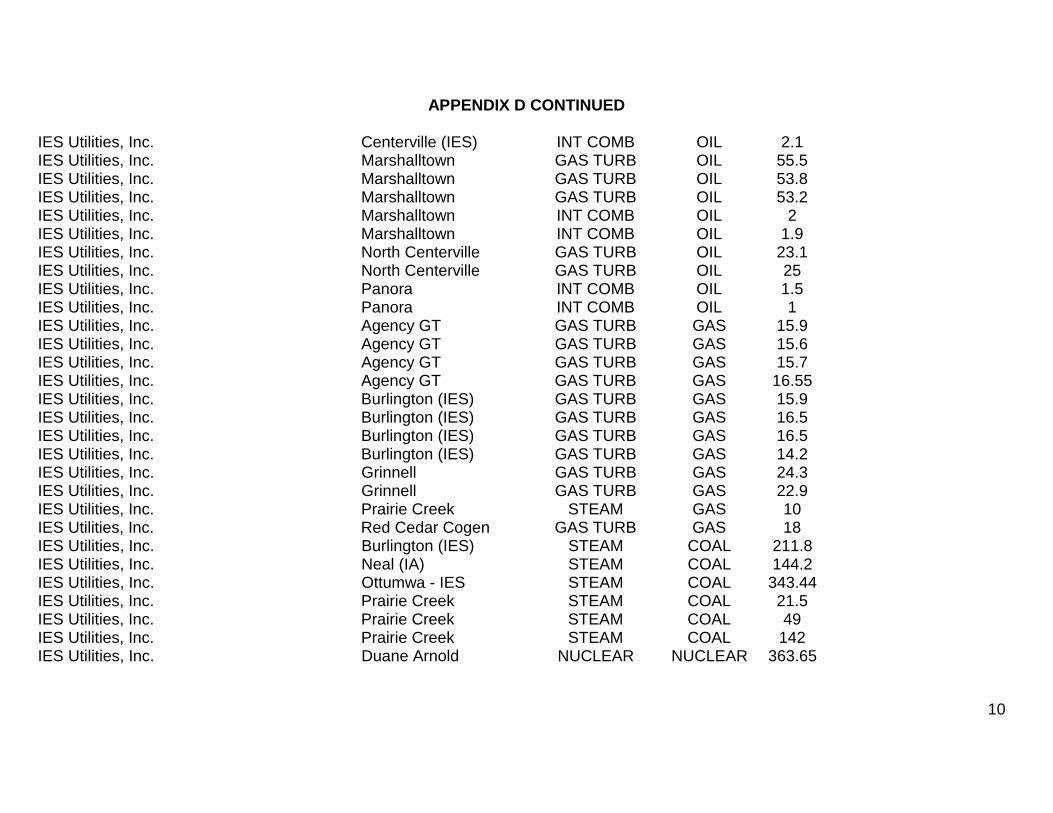
10
APPENDIX D CONTINUED
IES Utilities, Inc. Centerville (IES) INT COMB OIL 2.1IES Utilities, Inc. Marshalltown GAS TURB OIL 55.5IES Utilities, Inc. Marshalltown GAS TURB OIL 53.8IES Utilities, Inc. Marshalltown GAS TURB OIL 53.2IES Utilities, Inc. Marshalltown INT COMB OIL 2IES Utilities, Inc. Marshalltown INT COMB OIL 1.9IES Utilities, Inc. North Centerville GAS TURB OIL 23.1IES Utilities, Inc. North Centerville GAS TURB OIL 25IES Utilities, Inc. Panora INT COMB OIL 1.5IES Utilities, Inc. Panora INT COMB OIL 1IES Utilities, Inc. Agency GT GAS TURB GAS 15.9IES Utilities, Inc. Agency GT GAS TURB GAS 15.6IES Utilities, Inc. Agency GT GAS TURB GAS 15.7IES Utilities, Inc. Agency GT GAS TURB GAS 16.55IES Utilities, Inc. Burlington (IES) GAS TURB GAS 15.9IES Utilities, Inc. Burlington (IES) GAS TURB GAS 16.5IES Utilities, Inc. Burlington (IES) GAS TURB GAS 16.5IES Utilities, Inc. Burlington (IES) GAS TURB GAS 14.2IES Utilities, Inc. Grinnell GAS TURB GAS 24.3IES Utilities, Inc. Grinnell GAS TURB GAS 22.9IES Utilities, Inc. Prairie Creek STEAM GAS 10IES Utilities, Inc. Red Cedar Cogen GAS TURB GAS 18IES Utilities, Inc. Burlington (IES) STEAM COAL 211.8IES Utilities, Inc. Neal (IA) STEAM COAL 144.2IES Utilities, Inc. Ottumwa - IES STEAM COAL 343.44IES Utilities, Inc. Prairie Creek STEAM COAL 21.5IES Utilities, Inc. Prairie Creek STEAM COAL 49IES Utilities, Inc. Prairie Creek STEAM COAL 142IES Utilities, Inc. Duane Arnold NUCLEAR NUCLEAR 363.65
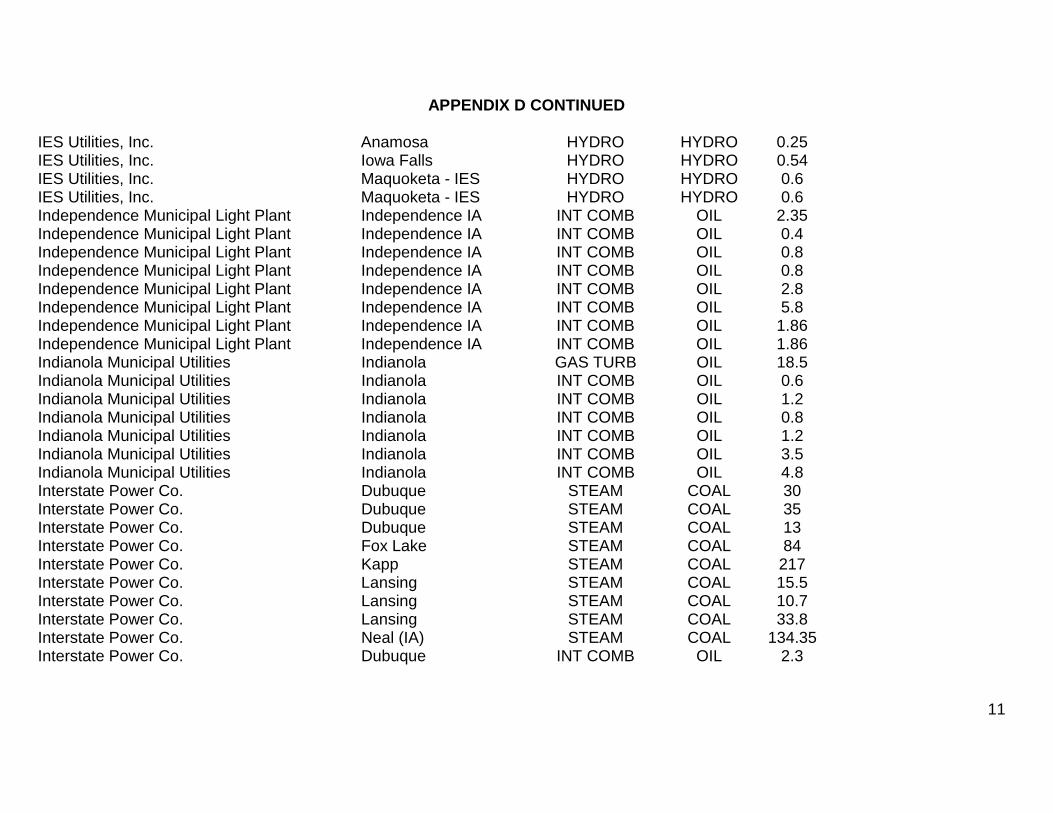
11
APPENDIX D CONTINUED
IES Utilities, Inc. Anamosa HYDRO HYDRO 0.25IES Utilities, Inc. Iowa Falls HYDRO HYDRO 0.54IES Utilities, Inc. Maquoketa - IES HYDRO HYDRO 0.6IES Utilities, Inc. Maquoketa - IES HYDRO HYDRO 0.6Independence Municipal Light Plant Independence IA INT COMB OIL 2.35Independence Municipal Light Plant Independence IA INT COMB OIL 0.4Independence Municipal Light Plant Independence IA INT COMB OIL 0.8Independence Municipal Light Plant Independence IA INT COMB OIL 0.8Independence Municipal Light Plant Independence IA INT COMB OIL 2.8Independence Municipal Light Plant Independence IA INT COMB OIL 5.8Independence Municipal Light Plant Independence IA INT COMB OIL 1.86Independence Municipal Light Plant Independence IA INT COMB OIL 1.86Indianola Municipal Utilities Indianola GAS TURB OIL 18.5Indianola Municipal Utilities Indianola INT COMB OIL 0.6Indianola Municipal Utilities Indianola INT COMB OIL 1.2Indianola Municipal Utilities Indianola INT COMB OIL 0.8Indianola Municipal Utilities Indianola INT COMB OIL 1.2Indianola Municipal Utilities Indianola INT COMB OIL 3.5Indianola Municipal Utilities Indianola INT COMB OIL 4.8Interstate Power Co. Dubuque STEAM COAL 30Interstate Power Co. Dubuque STEAM COAL 35Interstate Power Co. Dubuque STEAM COAL 13Interstate Power Co. Fox Lake STEAM COAL 84Interstate Power Co. Kapp STEAM COAL 217Interstate Power Co. Lansing STEAM COAL 15.5Interstate Power Co. Lansing STEAM COAL 10.7Interstate Power Co. Lansing STEAM COAL 33.8Interstate Power Co. Neal (IA) STEAM COAL 134.35Interstate Power Co. Dubuque INT COMB OIL 2.3
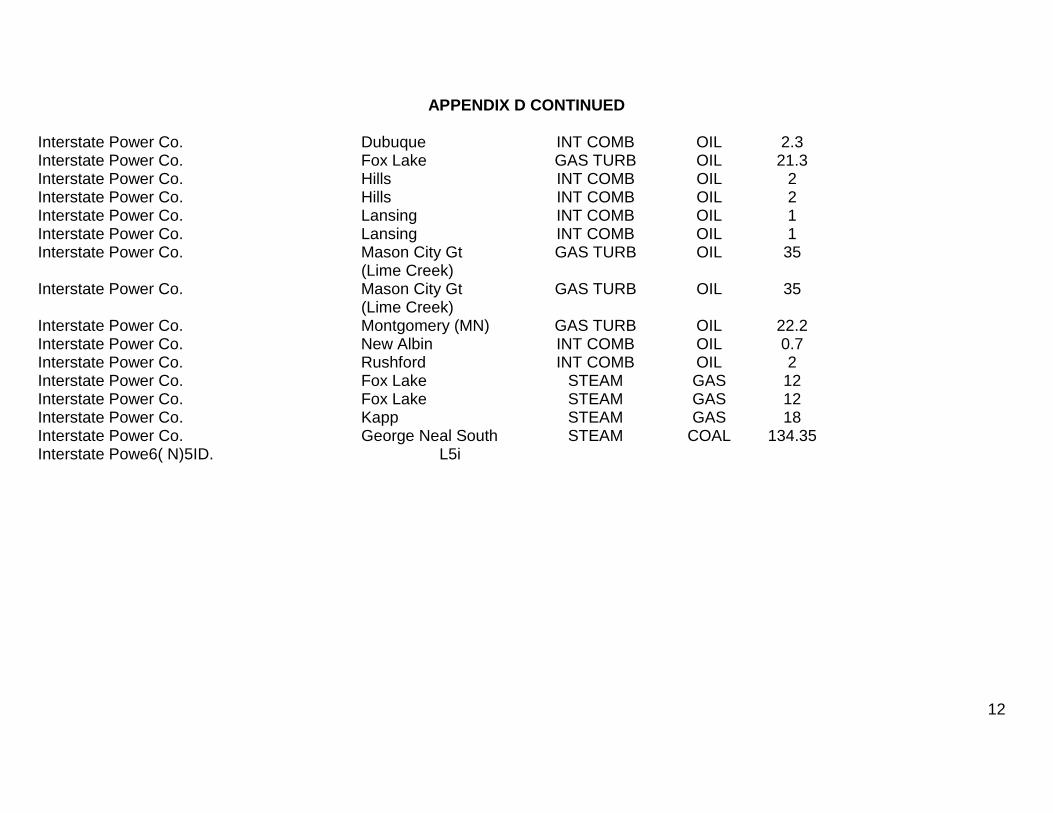
12
APPENDIX D CONTINUED
Interstate Power Co. Dubuque INT COMB OIL 2.3Interstate Power Co. Fox Lake GAS TURB OIL 21.3Interstate Power Co. Hills INT COMB OIL 2Interstate Power Co. Hills INT COMB OIL 2Interstate Power Co. Lansing INT COMB OIL 1Interstate Power Co. Lansing INT COMB OIL 1Interstate Power Co. Mason City Gt
(Lime Creek)GAS TURB OIL 35
Interstate Power Co. Mason City Gt(Lime Creek)
GAS TURB OIL 35
Interstate Power Co. Montgomery (MN) GAS TURB OIL 22.2Interstate Power Co. New Albin INT COMB OIL 0.7Interstate Power Co. Rushford INT COMB OIL 2Interstate Power Co. Fox Lake STEAM GAS 12Interstate Power Co. Fox Lake STEAM GAS 12Interstate Power Co. Kapp STEAM GAS 18Interstate Power Co. George Neal South STEAM COAL 134.35
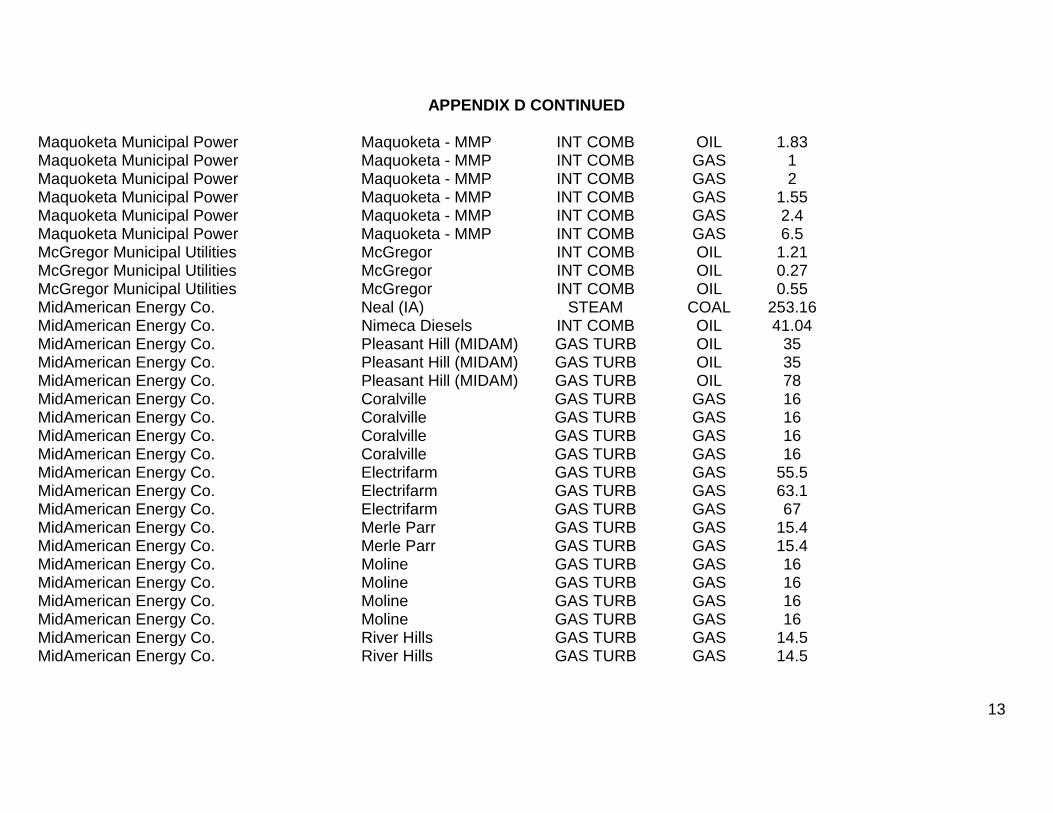
13
APPENDIX D CONTINUED
Maquoketa Municipal Power Maquoketa - MMP INT COMB OIL 1.83Maquoketa Municipal Power Maquoketa - MMP INT COMB GAS 1Maquoketa Municipal Power Maquoketa - MMP INT COMB GAS 2Maquoketa Municipal Power Maquoketa - MMP INT COMB GAS 1.55Maquoketa Municipal Power Maquoketa - MMP INT COMB GAS 2.4Maquoketa Municipal Power Maquoketa - MMP INT COMB GAS 6.5McGregor Municipal Utilities McGregor INT COMB OIL 1.21McGregor Municipal Utilities McGregor INT COMB OIL 0.27McGregor Municipal Utilities McGregor INT COMB OIL 0.55MidAmerican Energy Co. Neal (IA) STEAM COAL 253.16MidAmerican Energy Co. Nimeca Diesels INT COMB OIL 41.04MidAmerican Energy Co. Pleasant Hill (MIDAM) GAS TURB OIL 35MidAmerican Energy Co. Pleasant Hill (MIDAM) GAS TURB OIL 35MidAmerican Energy Co. Pleasant Hill (MIDAM) GAS TURB OIL 78MidAmerican Energy Co. Coralville GAS TURB GAS 16MidAmerican Energy Co. Coralville GAS TURB GAS 16MidAmerican Energy Co. Coralville GAS TURB GAS 16MidAmerican Energy Co. Coralville GAS TURB GAS 16MidAmerican Energy Co. Electrifarm GAS TURB GAS 55.5MidAmerican Energy Co. Electrifarm GAS TURB GAS 63.1MidAmerican Energy Co. Electrifarm GAS TURB GAS 67MidAmerican Energy Co. Merle Parr GAS TURB GAS 15.4MidAmerican Energy Co. Merle Parr GAS TURB GAS 15.4MidAmerican Energy Co. Moline GAS TURB GAS 16MidAmerican Energy Co. Moline GAS TURB GAS 16MidAmerican Energy Co. Moline GAS TURB GAS 16MidAmerican Energy Co. Moline GAS TURB GAS 16MidAmerican Energy Co. River Hills GAS TURB GAS 14.5MidAmerican Energy Co. River Hills GAS TURB GAS 14.5
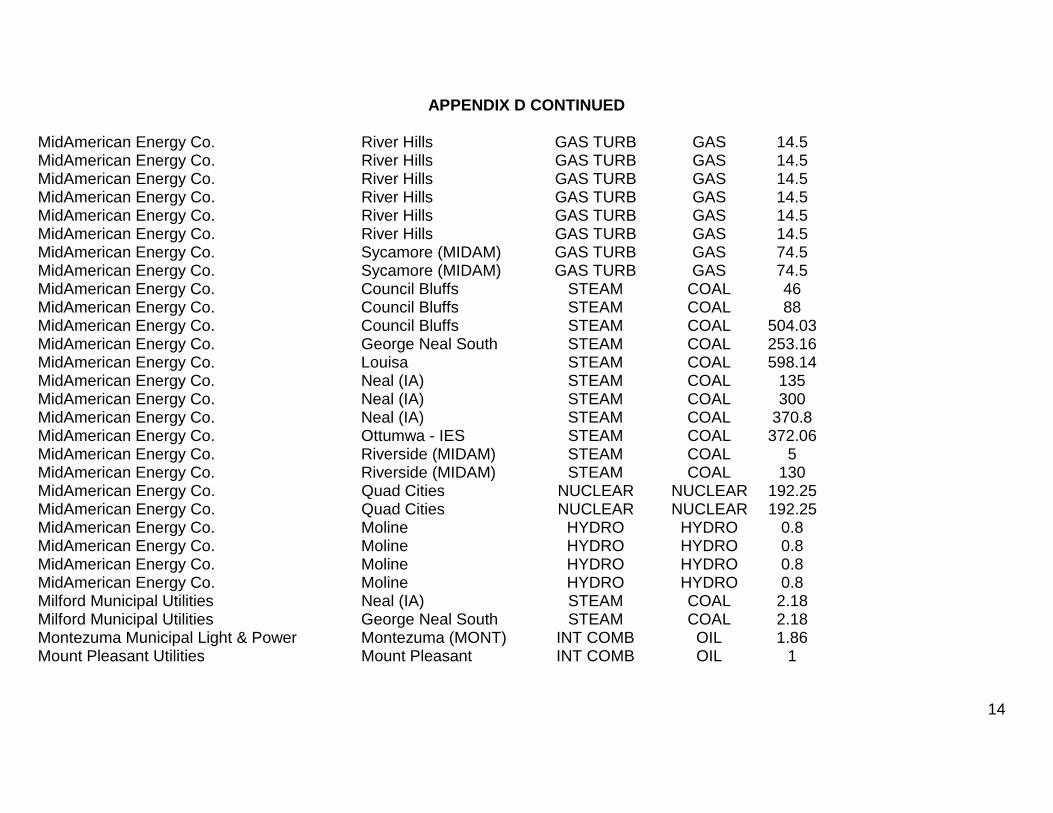
14
APPENDIX D CONTINUED
MidAmerican Energy Co. River Hills GAS TURB GAS 14.5MidAmerican Energy Co. River Hills GAS TURB GAS 14.5MidAmerican Energy Co. River Hills GAS TURB GAS 14.5MidAmerican Energy Co. River Hills GAS TURB GAS 14.5MidAmerican Energy Co. River Hills GAS TURB GAS 14.5MidAmerican Energy Co. River Hills GAS TURB GAS 14.5MidAmerican Energy Co. Sycamore (MIDAM) GAS TURB GAS 74.5MidAmerican Energy Co. Sycamore (MIDAM) GAS TURB GAS 74.5MidAmerican Energy Co. Council Bluffs STEAM COAL 46MidAmerican Energy Co. Council Bluffs STEAM COAL 88MidAmerican Energy Co. Council Bluffs STEAM COAL 504.03MidAmerican Energy Co. George Neal South STEAM COAL 253.16MidAmerican Energy Co. Louisa STEAM COAL 598.14MidAmerican Energy Co. Neal (IA) STEAM COAL 135MidAmerican Energy Co. Neal (IA) STEAM COAL 300MidAmerican Energy Co. Neal (IA) STEAM COAL 370.8MidAmerican Energy Co. Ottumwa - IES STEAM COAL 372.06MidAmerican Energy Co. Riverside (MIDAM) STEAM COAL 5MidAmerican Energy Co. Riverside (MIDAM) STEAM COAL 130MidAmerican Energy Co. Quad Cities NUCLEAR NUCLEAR 192.25MidAmerican Energy Co. Quad Cities NUCLEAR NUCLEAR 192.25MidAmerican Energy Co. Moline HYDRO HYDRO 0.8MidAmerican Energy Co. Moline HYDRO HYDRO 0.8MidAmerican Energy Co. Moline HYDRO HYDRO 0.8MidAmerican Energy Co. Moline HYDRO HYDRO 0.8Milford Municipal Utilities Neal (IA) STEAM COAL 2.18Milford Municipal Utilities George Neal South STEAM COAL 2.18Montezuma Municipal Light & Power Montezuma (MONT) INT COMB OIL 1.86Mount Pleasant Utilities Mount Pleasant INT COMB OIL 1

15
APPENDIX D CONTINUED
Muscatine Power & Water Muscatine STEAM COAL 83.72Muscatine Power & Water Muscatine STEAM GAS 25.4Muscatine Power & Water Muscatine STEAM COAL 162New Hampton Municipal Light Plant New Hampton INT COMB GAS 3.5New Hampton Municipal Light Plant New Hampton INT COMB GAS 5New Hampton Municipal Light Plant New Hampton INT COMB GAS 5Northwest Iowa Power Coop Neal (IA) STEAM COAL 56.35Northwest Iowa Power Coop George Neal South STEAM COAL 56.35NorthWestern Public Service Neal (IA) STEAM COAL 54.16NorthWestern Public Service George Neal South STEAM COAL 54.16Osage Municipal Light & Power Dept. Osage (OSAG) INT COMB OIL 3.13Osage Municipal Light & Power Dept. Osage (OSAG) INT COMB OIL 6.07Osage Municipal Light & Power Dept. Osage (OSAG) INT COMB OIL 3.64Osage Municipal Light & Power Dept. Osage (OSAG) INT COMB OIL 3.64Pella Municipal Power & Light Dept. Pella STEAM COAL 12.5Pella Municipal Power & Light Dept. Pella STEAM COAL 26.5Rockford Municipal Light Plant Rockford INT COMB OIL 1.6Spencer Municipal Utilities Neal (IA) STEAM COAL 7.55Spencer Municipal Utilities Spencer (SPENCE) JET ENG OIL 20Spencer Municipal Utilities George Neal South STEAM COAL 7.55State Center Municipal Electric Light State Center INT COMB OIL 0.6State Center Municipal Electric Light State Center INT COMB OIL 0.6State Center Municipal Electric Light State Center INT COMB OIL 1.36State Center Municipal Electric Light State Center INT COMB OIL 1.36State Center Municipal Electric Light State Center INT COMB GAS 2.5Strawberry Point Municipal Light Strawberry Point INT COMB OIL 0.85Strawberry Point Municipal Light Strawberry Point INT COMB OIL 0.37Strawberry Point Municipal Light Strawberry Point INT COMB OIL 1.03Tipton Municipal Utilities Louisa STEAM COAL 3.4
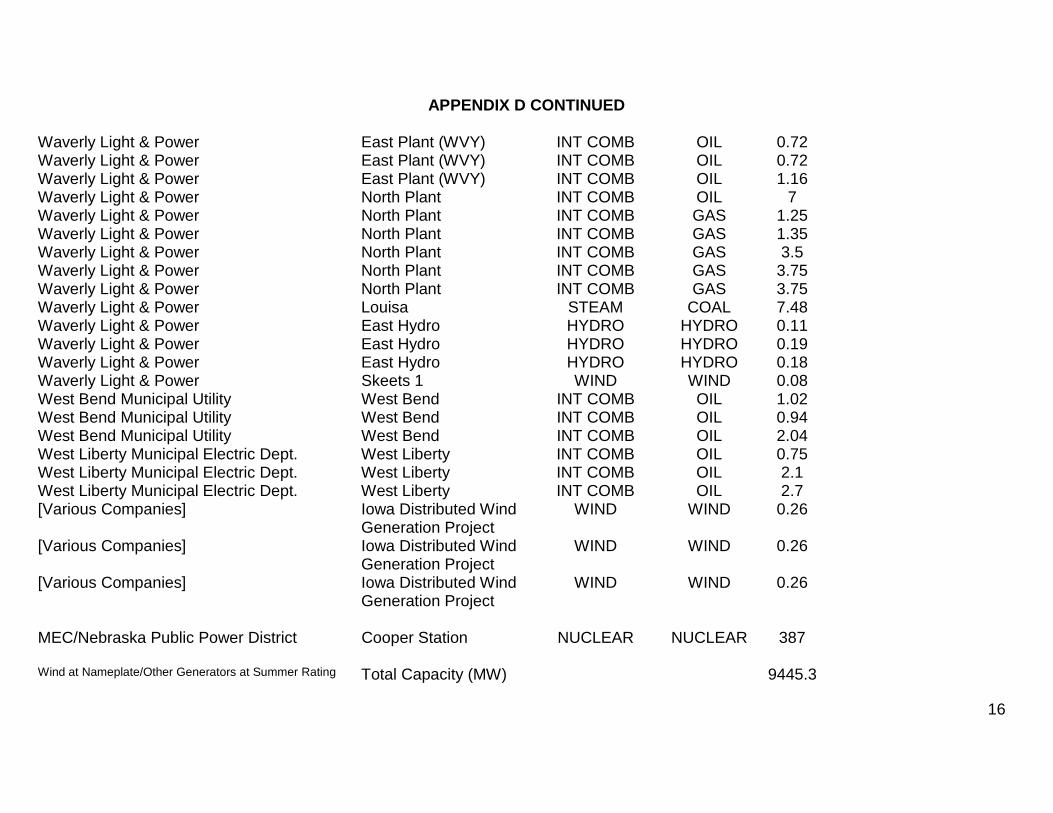
16
APPENDIX D CONTINUED
Waverly Light & Power East Plant (WVY) INT COMB OIL 0.72Waverly Light & Power East Plant (WVY) INT COMB OIL 0.72Waverly Light & Power East Plant (WVY) INT COMB OIL 1.16Waverly Light & Power North Plant INT COMB OIL 7Waverly Light & Power North Plant INT COMB GAS 1.25Waverly Light & Power North Plant INT COMB GAS 1.35Waverly Light & Power North Plant INT COMB GAS 3.5Waverly Light & Power North Plant INT COMB GAS 3.75Waverly Light & Power North Plant INT COMB GAS 3.75Waverly Light & Power Louisa STEAM COAL 7.48Waverly Light & Power East Hydro HYDRO HYDRO 0.11Waverly Light & Power East Hydro HYDRO HYDRO 0.19Waverly Light & Power East Hydro HYDRO HYDRO 0.18Waverly Light & Power Skeets 1 WIND WIND 0.08West Bend Municipal Utility West Bend INT COMB OIL 1.02West Bend Municipal Utility West Bend INT COMB OIL 0.94West Bend Municipal Utility West Bend INT COMB OIL 2.04West Liberty Municipal Electric Dept. West Liberty INT COMB OIL 0.75West Liberty Municipal Electric Dept. West Liberty INT COMB OIL 2.1West Liberty Municipal Electric Dept. West Liberty INT COMB OIL 2.7[Various Companies] Iowa Distributed Wind
Generation ProjectWIND WIND 0.26
[Various Companies] Iowa Distributed WindGeneration Project
WIND WIND 0.26
[Various Companies] Iowa Distributed WindGeneration Project
WIND WIND 0.26
MEC/Nebraska Public Power District Cooper Station NUCLEAR NUCLEAR 387
Wind at Nameplate/Other Generators at Summer Rating Total Capacity (MW) 9445.3
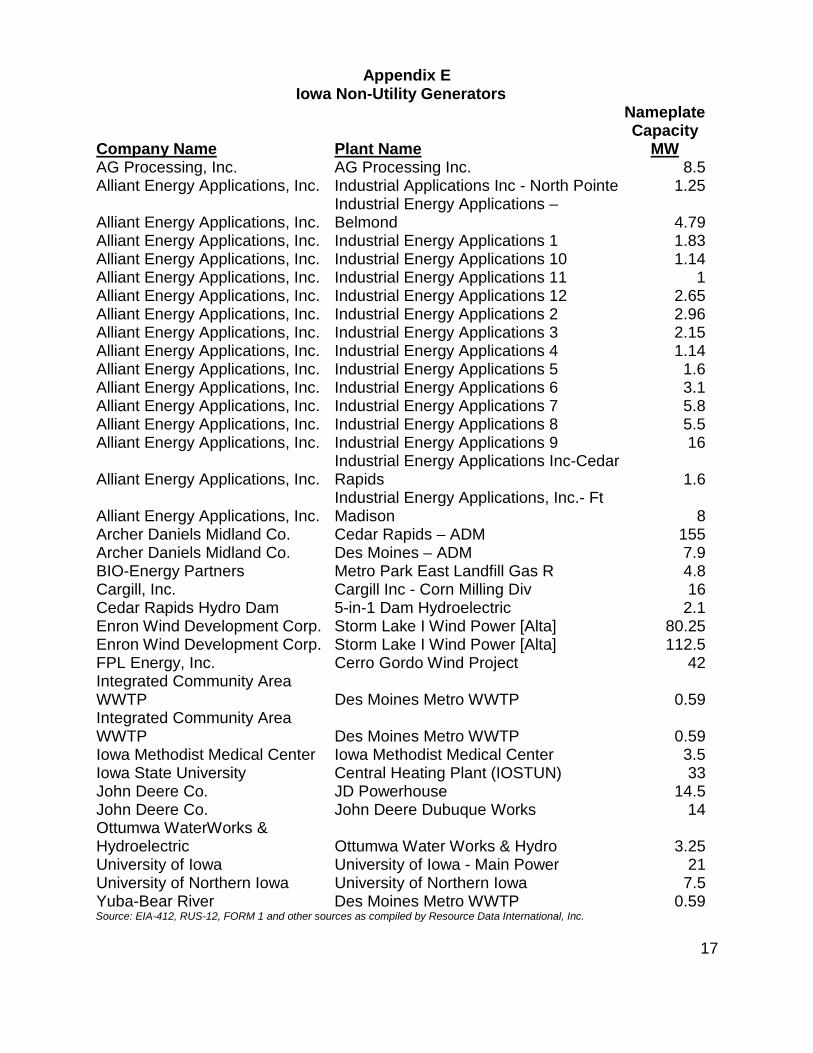
17
Appendix EIowa Non-Utility Generators
Company Name Plant Name
NameplateCapacity
MWAG Processing, Inc. AG Processing Inc. 8.5Alliant Energy Applications, Inc. Industrial Applications Inc - North Pointe 1.25
Alliant Energy Applications, Inc.Industrial Energy Applications –Belmond 4.79
Alliant Energy Applications, Inc. Industrial Energy Applications 1 1.83Alliant Energy Applications, Inc. Industrial Energy Applications 10 1.14Alliant Energy Applications, Inc. Industrial Energy Applications 11 1Alliant Energy Applications, Inc. Industrial Energy Applications 12 2.65Alliant Energy Applications, Inc. Industrial Energy Applications 2 2.96Alliant Energy Applications, Inc. Industrial Energy Applications 3 2.15Alliant Energy Applications, Inc. Industrial Energy Applications 4 1.14Alliant Energy Applications, Inc. Industrial Energy Applications 5 1.6Alliant Energy Applications, Inc. Industrial Energy Applications 6 3.1Alliant Energy Applications, Inc. Industrial Energy Applications 7 5.8Alliant Energy Applications, Inc. Industrial Energy Applications 8 5.5Alliant Energy Applications, Inc. Industrial Energy Applications 9 16
Alliant Energy Applications, Inc.Industrial Energy Applications Inc-CedarRapids 1.6
Alliant Energy Applications, Inc.Industrial Energy Applications, Inc.- FtMadison 8
Archer Daniels Midland Co. Cedar Rapids – ADM 155Archer Daniels Midland Co. Des Moines – ADM 7.9BIO-Energy Partners Metro Park East Landfill Gas R 4.8Cargill, Inc. Cargill Inc - Corn Milling Div 16Cedar Rapids Hydro Dam 5-in-1 Dam Hydroelectric 2.1Enron Wind Development Corp. Storm Lake I Wind Power [Alta] 80.25Enron Wind Development Corp. Storm Lake I Wind Power [Alta] 112.5FPL Energy, Inc. Cerro Gordo Wind Project 42Integrated Community AreaWWTP Des Moines Metro WWTP 0.59Integrated Community AreaWWTP Des Moines Metro WWTP 0.59Iowa Methodist Medical Center Iowa Methodist Medical Center 3.5Iowa State University Central Heating Plant (IOSTUN) 33John Deere Co. JD Powerhouse 14.5John Deere Co. John Deere Dubuque Works 14Ottumwa WaterWorks &Hydroelectric Ottumwa Water Works & Hydro 3.25University of Iowa University of Iowa - Main Power 21University of Northern Iowa University of Northern Iowa 7.5Yuba-Bear River Des Moines Metro WWTP 0.59Source: EIA-412, RUS-12, FORM 1 and other sources as compiled by Resource Data International, Inc.

18
APPENDIX FNEW GENERATION (OPERATIONAL AND ANNOUNCED)
NERC OperatingState Region Name of Facility MW Type Owner/Operator Start Date
Arkansas SPP 153 CT Arkansas Electric Cooperative Sum 2001Arkansas SPP Union Power Partners 2720 Panda Energy Spr 2002Arkansas SPP 550 CC Southern Energy (Southern Company) (51%)/
Kinder Morgan Power(49%)Arkansas SPP Thomas B. Fitzhugh 110 CT Arkansas Electric CooperativeArkansas SPP Pine Bluff Energy Center 228 Cogen SkyGen Energy / Coral Energy Sum 2001Arkansas SPP Dam 2 108 HY Arkansas Electric Coop 1999Illinois MAIN Grand Prairie Energy 500 CC ABB Energy VenturesIllinois MAIN Grand Tower Power Station 528 CC Ameren CIPS Spr 2001Illinois MAIN Gibson City Power Plant 234 CT Ameren Sum 2000Illinois MAIN Kinmundy Power Plant 234 CT Ameren June-05Illinois MAIN 176 CT Ameren June-00Illinois MAIN Equistar Chemical Morris 50 CC-Cogen Calpine June-00Illinois MAIN 270 CT Calumet Power (Peoples Energy/Enron) Sum 2001Illinois MAIN 305 CT Calumet EnergyIllinois MAIN Medina Cogeneration Plant 36 Cogen CILCO (AES) Sum 2001Illinois MAIN Fox River Peaking Station 345 CT Coastal PowerIllinois MAIN La Salle County Station 53 Nuclear Commonwealth Edison Co. Sum 2001Illinois MAIN University Park Energy 300 CT Constellation Power Sum 2001Illinois MAIN 537 CC Cordova Energy (MidAmerican Energy) 2001Illinois MAIN Duke Energy Lee 640 CT Duke Energy Sum 2001Illinois MAIN Des Plaines Green Land Develop. 664 CT Enron 2000Illinois MAIN Holland 680 CC Holland EnergyIllinois MAIN Libertyville 300 CT IndeckIllinois MAIN Pleasant Valley 300 IndeckIllinois MAIN Holiday Hills 300 CT IndeckIllinois MAIN Rockford 300 CT IndeckIllinois MAIN Lincoln Energy Center 664 CT Kendall New Century Development (Enron) 2000Illinois MAIN Kendall County Generation Facility 1160 CC LS Power Spr 2002Illinois MAIN LSP Nelson Energy 1100 CC LS PowerIllinois MAIN Joppa Power Station 318 CT MidWest Electric Power (Electric Energy)Illinois MAIN Elwood 1900 CC/CT Peoples Energy/Dominion EnergyIllinois MAIN Elwood 600 CT Peoples Energy/Dominion Energy Sum 2001Illinois MAIN Reliant Energy Aurora 950 CT Reliant Energy Sum 2000

19
APPENDIX F CONTINUED
Illinois MAIN Reliant Energy McHenry County 510 CT Reliant Energy September-00Illinois MAIN Cardinal Energy 634 CC-Cogen Reliant Energy 2001Illinois MAIN Reliant Energy Shelby County 115 CT Reliant Energy 2000Illinois MAIN Crab Orchard 328 CT Reliant EnergyIllinois MAIN 45 CT Southwestern Electric Coop June-00Illinois MAIN North Chicago Power Project 78 CT Unicom Power (ComEd)Illinois MAIN Argo Power 750 CC-Cogen Alliant Energy 2003Illinois MAIN 13 CILCO (AES) 2000Illinois MAIN 13 CILCO (AES) 2000Illinois MAIN Byron/Braidwood 225 Nuclear Commonwealth Edison Co. 2002Illinois MAIN 300 CT Indeck June-00Illinois MAIN 110 MidWest GenerationIllinois MAIN 800 Standard Power & LightIllinois MAIN La Salle County Station 53 Nuclear Commonwealth Edison Co. 1999Illinois MAIN Rocky Road Power Plant 100 CT Dynegy/NRG Energy 2000Illinois MAIN Reliant Energy Shelby County 225 CT Reliant Energy 2000Illinois MAIN Various portable & temporary 213 GT ComEd 1999Illinois MAIN Rocky Road Power Plant 250 CT Dynegy/NRG Energy 1999Illinois MAIN Tilton Energy Center 176 Illinois Power 1999Illinois MAIN Havana Power Station 235 Illinois Power 1999Illinois MAIN 600 Peoples Energy/Dominion Energy 1999Illinois MAIN 100 CT Soyland Power Coop 1999Indiana ECAR AES Greenfield 180 CT Matrix Power Sum 2000Indiana ECAR CinCap VII 135 CT Cinergy Sum 2000Indiana ECAR Vermillion Generating Station 640 CT Cinergy / Duke Energy Sum 2000Indiana ECAR Georgetown Road 240 CT Indianapolis Power & Light (33%) / DTE Energy
(67%)Sum 2000
Indiana ECAR 70 Portable Indianapolis Power & Light (IPALCO) Sum 2000Indiana ECAR 200 CT Indianapolis Power & Light (IPALCO) Sum 2001Indiana ECAR Whiting Refinery 525 Cogen Primary Energy (NiSource) Sum 2001Indiana ECAR 1150 CC PSEG Gobal Sum 2002Indiana ECAR 514 CT West Fork Land Development (Enron) June-00Indiana ECAR 500 Cogentrix Energy Late 2002Indiana ECAR 200 CT DPL (Dayton Power & Light) June-01Indiana ECAR 640 CT DukeIndiana ECAR 1100 CC LS Power 2002Indiana ECAR Indiana Harbor Works 50 Cogen Primary Energy (NiSource) Fall 2001Indiana ECAR 180 PSEG Gobal June-01

20
APPENDIX F CONTINUED
Indiana ECAR Sugar Creek 300 Southern Company 2002Indiana ECAR State Line 550 CC Southern Company January-03Indiana ECAR 830 CC Tenaska Fall 2003Iowa MAPP Duane Arnold 65 Nuclear IES Utilities (Alliant Energy) Spr 2001Iowa MAPP 15.6 IC MidAmerican Energy 2000Iowa MAPP 19.5 IC MidAmerican Energy 2000Iowa MAPP 19.5 IC MidAmerican Energy 2000Iowa MAPP Storm Lake 193 WT Enron Wind 1999Iowa MAPP Cerro Gordo Wind Farm 42 WT FPL Energy 1999Iowa MAPP Lake Mills 7.6 IC Lake Mills, City of 1999Iowa MAPP New Hampton 10.6 IC New Hampton, City of 1999Kansas MAPP Gordon Evans Energy Center 150 CT Kansas Gas & Electric (Western Resources) Sum 2000Kansas MAPP Gordon Evans Energy Center 150 CT Kansas Gas & Electric (Western Resources) Sum 2001Kansas SPP Erie 22 IC Erie, City of 1999Kentucky ECAR 86 Cinergy June-01Kentucky ECAR 500 Columbia Electric (Columbia Energy)Kentucky ECAR 640 Duke Energy June-01Kentucky ECAR Bluegrass 324 Dynegy Sum 2001Kentucky ECAR 500 CT Dynegy Power 2001Kentucky ECAR 500 CT Enron June-00Kentucky ECAR Kentucky Pioneer 400 CC Global Energy (AEP) Spr 2003Kentucky ECAR 245 Perry County Coal/East Kentucky Power CoopKentucky ECAR 500 Kentucky Mountain Power (EnviroPower) January-03Kentucky ECAR JK Smith 330 GT East Kentucky Power 1999Kentucky ECAR EW Brown 328 GT Kentucky Utilities 1999Louisiana SPP Acadia Power Project 1000 CC Cleco Corp. / Calpine Sum 2002Louisiana SPP 900 Cogen AEPLouisiana SPP Calcasieu 165 CT Dynegy June-01Louisiana SPP 540 Enron June-01Louisiana SPP PPG Industries 500 Cogen Entergy / PPG Sum 2002Louisiana SPP 530 SkyGen Energy 2001Louisiana SPP 550 CC Southern Company / Cleco Sum 2002Louisiana SPP 150 CT Southern Company / Cleco Sum 2001Louisiana SPP Calcasieu 155 CT Dynegy 2000Louisiana SPP Evangeline 480 CT Cleco 2000Michigan ECAR 550 Cogen CMS Energy(70%) / DTE Energy(30%) July-01

21
APPENDIX F CONTINUED
Michigan ECAR B.C. Cobb 1 and 3 120 Consumers Energy June-00Michigan ECAR Gallagher Road 550 Indeck EnergyMichigan ECAR 510 CT Kinder Morgan Power June-02Michigan ECAR 300 CC Southern Energy June-01Michigan ECAR 530 CC Southern Energy June-03Michigan ECAR River Rouge 1 225 Detroit Edison Sum 2000Michigan ECAR 20 Constellation Power/D.B. Riley 1999Michigan ECAR 500 Decker Energy International 2001Michigan ECAR 1100 Indeck Energy Sum 2003Michigan ECAR 480 Nordic Electric September-01Michigan ECAR Panda Tallmadge Power 1000 Panda Energy Late 2004Michigan ECAR 1000 NG US Generating / PG&E Generating 2002Michigan ECAR Delray 139.4 GT Detroit Edison 2000Michigan ECAR Dearborn Industrial Generation 160 CT CMS Generation (CMS Energy) 1999Michigan ECAR Livingston Generating Station 136 GT CMS Generation (CMS Energy) 1999Michigan ECAR Kalamazoo River Gen. Station 63 GT CMS Generation (CMS Energy) 1999Michigan ECAR Belle River 216 GT Detroit Edison 1999Michigan ECAR Greenwood 226 GT Detroit Edison 1999Michigan ECAR Conners Creek 15-16 300 Detroit Edison 1999Michigan ECAR Delray 124 CT Detroit Edison 1999Michigan ECAR Trenton Channel 7-9 34 ST Detroit Edison 1999Minnesota MAPP Pleasant Valley Station 435 CT Great River Energy May-01Minnesota MAPP Lakefield Junction 534 CT NRG Energy (NSP) / Tenaska Sum 2001Minnesota MAPP Black Dog 114 CC NSPMinnesota MAPP 49 CT Minnesota Municipal Power AgencyMinnesota MAPP 350 Northern Alternative Energy Late 2001Mississippi SERC 800 Cogentrix Sum 2002Mississippi SERC Attala Energy Facility 500 CC Duke Energy June-01Mississippi SERC Hinds Energy Facility 500 CC Duke Energy June-01Mississippi SERC Baxter Wilson Power Plant 300 Entergy Sum 2001Mississippi SERC Batesville Gen Facility 643.8 CC Cogentrix / LS Power 2000Missouri SPP Aries Power Plant 600 CC Aquila Energy (Utilicorp) / Calpine June-01Missouri SPP State Line 150 CT Empire District / Westar May-01Missouri SPP State Line 200 CC-ST Empire District / Westar May-01Missouri SPP Hawthorn Station (#4) 140 CC Kansas City Power & Light Sum 2000Missouri SPP 45 CT Springfield, City of June-01Missouri MAIN St. Francis II 260 CC-ST Associated Electric Coop / Duke Energy June-01

22
APPENDIX F CONTINUED
Missouri MAIN 640 Duke Energy Sum 2001Missouri MAIN Panda Montgomery Power 1000 CC Panda Energy Fall 2003Missouri SPP Hawthorn Station #7 & #8 154 CT Kansas City Power & Light Sum 2000Missouri SPP Hawthorn Station #5 26 ST Kansas City Power & Light Sum 2001Missouri SPP 150 CT Springfield, City ofMissouri MAIN Taum Sauk 100 Pump Stor Ameren 1999Missouri SPP Nodaway 183 GT Associated Electric Coop 1999Missouri SPP Essex 113 GT Associated Electric Coop 1999Missouri SPP St. Francis I 260 CC-ST Associated Electric Coop / Duke Energy 1999Missouri SPP Hawthorn Station #6 148 CT Kansas City Power & Light 1999Nebraska MAPP Rokeby Station 28 CT Lincoln Electric 2001Nebraska MAPP Sarpy 95 NPPD Sum 2000Nebraska MAPP Rokeby #3 90 CT Lincoln Electric 2001Nebraska MAPP 100 CC Lincoln Electric Late 2003Nebraska MAPP 40 CT Lincoln Electric Sum 2004Nebraska MAPP 330 CT Omaha Public Power District 2003Ohio ECAR 510 CT AEP 2002Ohio ECAR Madison Generating Station 640 CT Cinergy / Duke Energy Sum 2000Ohio ECAR 1070 CC Cogentrix Energy Sum 2003Ohio ECAR South side 220 CT Columbus Power Partners / MCN Energy June-00Ohio ECAR Greenville Electric Generation
Station200 CT DPL Energy Sum 2000
Ohio ECAR Darby 480 CT DPL EnergyOhio ECAR FM Tait 320 CT DPL EnergyOhio ECAR Lancaster Generating Station 200 DPL Energy Sum 2001Ohio ECAR 500 CC Dresden Energy (Duke?) June-03Ohio ECAR 620 CC Duke Energy June-02Ohio ECAR Richland sub site 390 CT MidAtlantic Energy Group Sum 2000Ohio ECAR West Lorain 425 CT Ohio Edison (First Energy) 2001Ohio ECAR Napoleon Gen Facility 45 CT PG&E Generating June-01Ohio ECAR Bowling Green Gen Facility 45 CT PG&E Generating Sum 2001Ohio ECAR 600 CT Troy Energy (Dominion / CNG Power) 2002Ohio ECAR 850 CC Waterford Energy (PSEG Global?) May-02Ohio ECAR Fremont Energy Center 700 CC Calpine Sum 2003Ohio ECAR 90 Cinergy June-01Ohio ECAR Norton Energy Storage, Phase I 300 Compressed Air Energy Storage/
Norton Energy Storage
23
APPENDIX F CONTINUED
Ohio ECAR Norton Energy Storage, Phase II 2400 Compressed Air Energy Storage/Norton Energy Storage
2006
Ohio ECAR 600 CT Dominion Resources / Consolidated Natural Gas 2002Ohio ECAR 640 CT Entergy Sum 2002Ohio ECAR Perry Plant site 60 UR First Energy June-05Ohio ECAR 540 CC Global Energy (AEP) Sum 2002Ohio ECAR Galion Gen Facility 45 CT PG&E GeneratingOhio ECAR various peaking 36.6 IC American Municipal Power-Ohio 1999Ohio ECAR Bowling Green / Hamilton 64 CT American Municipal Power-Ohio 1999Ohio ECAR 10 CT American Municipal Power-Ohio 1999Ohio ECAR Various 250 CT Dayton Power & Light 1999Oklahoma SPP Green Country Energy Project 800 CC Cogentrix January-02Oklahoma SPP McClain Energy Facility - Newcastle 520 CC Duke Energy Sum 2001Oklahoma SPP 300 CT ONEOK June-01Oklahoma SPP Oneta 1000 CC Calpine Spr 2002Oklahoma SPP Northeastern 320 CC Public Service Co. of Oklahoma (Central &
South West)Oklahoma SPP 1100 Energetix 2003Oklahoma SPP 900 Kiowa Power Partners (Power Resources Group) 2002Oklahoma SPP Mustang 1 & 2 115 Oklahoma Gas & Electric Sum 2000Oklahoma SPP Chouteau 530 CC Associated Electric Coop / KAMO Power 2000Pennsylvania ECAR 450 CT Dominion Resources / Consolidated Natural Gas 2002Pennsylvania ECAR Various 220 Allegheny Energy Sum 2000Pennsylvania ECAR Allegheny Units 1 & 2 88 CT Allegheny Energy 1999Texas SPP Tenaska Gateway Generating
Station845 CC Tenaska Spr 2001
Texas SPP 430 Texas Eastman Sum 2000West Virginia ECAR 500 CT Twelvepole Creek (Columbia Electric) Sum 2001West Virginia ECAR Anker EnergyWest Virginia ECAR Anker EnergyWest Virginia ECAR 450 CT Dominion Resources / Consolidated Natural Gas 2002West Virginia ECAR 80 Hydro Gauley River Power Partners/Catamount Energy 2000West Virginia ECAR 300 MCNWest Virginia ECAR 74 Virginia Power 1999West Virginia ECAR Panda Culloden 1000 GT Panda Energy Spr 2004West Virginia ECAR Belleville 42 HY American Municipal Power-Ohio 1999Wisconsin MAIN Various 223 Summer Power Source (SkyGen) Sum 2000

24
APPENDIX F CONTINUED
Wisconsin MAIN Gordon Diesel Plant 5.4 IC Dahlberg Light & PowerWisconsin MAIN Wisconsin Wind Farm 30 WT FPL Energy December-00Wisconsin MAIN Various Madison Gas & ElectricWisconsin MAIN Frederic 6 Northwestern Wisconsin ElectricWisconsin MAIN Wheaton 22 CT Northern States PowerWisconsin MAIN 1050 CC PG&E Generating 2002Wisconsin MAIN Junction 6.6 River Falls Municipal UtilitiesWisconsin MAIN RockGen Energy Center 525 CT SkyGen Energy 2001Wisconsin MAIN Germantown 85 CT Wisconsin Electric (Wisconsin Energy) June-00Wisconsin MAIN Germantown 52 CT Wisconsin Electric (Wisconsin Energy) June-00Wisconsin MAIN 102 CT Wisconsin Public Service June-00Wisconsin MAIN Various Wisconsin Public Service Sum 2000Wisconsin MAIN 500 CalEnergy Sum 2003Wisconsin MAIN [Phase I] 300 CT Wisconsin Power & Light (Alliant Energy) June-02Wisconsin MAIN [Phase II] 200 CC Wisconsin Power & Light (Alliant Energy) June-03Wisconsin MAIN Stoneman 250 CC Mid-American Power/WPS Power(Wisconsin
Public Service)2002
Wisconsin MAPP 90 CT Minnesota Power 2002Wisconsin MAIN 300 CT Southern Energy 2000Wisconsin MAIN 11 WT Madison Gas & Electric 1999Wisconsin MAIN Huiskamp/Middleton 20 IC Madison Gas & Electric 1999Wisconsin MAIN Custer Energy Center 17 CT Manitowoc Public Utilities 1999Wisconsin MAIN 170 CT US Generating 1999Wisconsin MAIN Concord 44 GT Wisconsin Electric Power 1999Wisconsin MAIN Paris 44 GT Wisconsin Electric Power 1999