Fosun International Limited Annual Results 2011 March 2012.
38
Fosun International Limited Annual Results 2011 March 2012
-
Upload
shannon-thomas -
Category
Documents
-
view
217 -
download
3
Transcript of Fosun International Limited Annual Results 2011 March 2012.

Fosun International Limited
Annual Results 2011
March 2012
This presentation and the presentation materials distributed herewith include forward-
looking statements. All statements, other than statements of historical facts, that
address activities, events or developments that Fosun International Limited (the
“Company”) expects or anticipates will or may occur in the future (including but not
limited to projections, targets, estimates and business plans) are forward-looking
statements. The Company’s actual results or developments may differ materially from
those indicated by these forward-looking statements as a result of various factors and
uncertainties, and other risks and factors beyond our control. In addition, the Company
makes the forward-looking statements referred to herein as of today and undertakes no
obligation to update these statements. The exchange rates used in this PPT are as of
2011/12/31 (USD/CNY=6.30090 EUR/CNY=8.16250 HKD/CNY=0.81070), unless
otherwise stated.
Disclaimer
2

Content
• Overview
• Fosun International: on its way to a premium investment group with a focus on China Momentum
P4
• China Opportunity P5
• Growth Engine
• Business Model P6
• Industrial Operations P7
• Investments P8-9
• Asset Management P10
• Fosun as a Corporate Citizen P11
• Competitive Advantage
• Team P12
• Value Creation P13
• Strategy P14
• Case Study P15
• Growth Driver
• Industrial Operation P16
• Investment P17
• Asset Management P18
• Insurance P19
• Financial Results P20– P23
3

• As of 31 December 2012, Fosun’s book value reached a record high at RMB 31.8Bn, 6.6% higher than the previous year; representing a CAGR of 55.3% over a seven-year period
• As of 31 December 2012, Fosun’s net portfolio value reached RMB 35.0Bn, representing a CAGR of 21.1% over a seven-year period
• In 2011, we helped 7 investment projects to go public, making a total number of IPOs launched in either on China’s domestic A share market or The Stock Exchange of Hong Kong until end-2011 to 20
NPV 7-yr CAGR: 21.1%
BV 7-yr CAGR: 55.3%
Fosun InternationalOn its way to a premium investment group with a focus on china momentum
RMB Bn
2004 2005 2006 2007 2008 2009 2010 2011
9.18 9.4713.08
27.12
18.73
36.09
41.94
35.02
1.46 2.83 3.98
19.83 19.87
24.48
29.8731.83
NPV(as of period end) BV(as of period end)
4

China OpportunityFrom a big power in manufacturing to a big power in consumption and capital
China is becoming one of the top capital markets in the world
China’s household spending has been growing fast Growing importance of the China market for MNCs
Trillion in US$
1995年 2000年 2005年 2010年0.0
2.0
4.0
6.0
8.0
10.0
12.0
-40%
-20%
0%
20%
40%
60%
80%
100%
120%
140%
160%
1.5 1.1 1.6 1.9
2.9 2.6 2.6 3.2
0.3 0.6 0.9
2.1
5.0
6.8
8.8
10.4
Germany Japan China US Germany growthJapan growth China growth US growth
China/US/Japan/Germany household consumption and growth-World Bank
Fastest Growing Asset Management Market • With the growth of total wealth, AUM will grow as well. Asset
management business will have a great potential.
Higher demand for China’s manufacturing capacities with promising investment future
• In the last 10 years, China’s equipment manufacturing industry saw a CAGR of 26%, with its scale topped the world now• In China’s industrial upgrade process, manufacturing will see an even higher demand, along with more demand for resources• Challenge: being free from low-cost dependence, integration and consolidation process featuring technological innovation and increasing value-adds,
higher efficiency of the whole supply chain
• Also, more and more Chinese companies focusing only on the local market are climbing up to the world’s top 10 enterprises in their respective segment.
YUM
Apple
GM
• During 2011, China exchanges continues to lead the world IPO market in terms of capital raised ($80.6 bn), while US ranked 2nd ($35.6 bn)
• During 2011, there were 356 IPOs of China enterprises raising a total of USD61.532 billion, accounting for 41.9% in count and 52.1% in amount of all IPOs in the world
Best Investment Opportunities
China business/network as percentage of global
Yum 2011 Revenue
2011 Net Sales 2011 Net Sales 2011 Sales (units)0%
5%
10%
15%
20%
25%
30%
35%
40%
45%
50% 44%
21%
12%
28%Prada
5

Business Model – Unique to Fosun
Industrial Operations
Investment(Including Strategic
Investments)Insurance
• Pramerica-Fosun Life Insurance (in a preparatory stage)
• Yong An Insurance
• Fosun Pharma
• Forte
• NISCO
• Hainan Mining
• Yu Yuan
• Focus Media
• CMBC
• Club Med
• Folli Follie
Asset Management
• Fosun Wealth PE Fund
• Fosun Grand PE Fund
• Star Capital
• Fosun-Carlyle Fund
• Prudential-Fosun Fund
• Forte series funds & others
6

2004 2005 2006 2007 2008 2009 2010 20110
1,000
2,000
3,000
4,000
5,000
595 594 459
2,404
1,337
2,3682,699
3,189*
Mill
ion
RMB
2004 – 2011 Profit from Industrial Operations
Growth Engine 1: Industrial Operations
7-year CAGR at 27.0%
Drug Manufacturing: completed an
acquisition of a controlling stake in
Dalian Aleph Biomedical Co. Ltd. and
Jinzhou Aohong Yaoye Co., Ltd.Medical Service: invested in Yueyang
Guangji and Anhui Jimin Cancer
HospitalSinopharm sales exceeded RMB 10tn
for the first time
Output volume reached a record
high of 3.76Mn tons, up by 13.0%Sales volume reached 3.67Mn
sq.m, increased by 8.1%
Attributable contract sales reached
0.897Mn sq.m, up by 3.2%New land reserves: 2.695Mn sq.mSales promotion in 2nd-tier cities
Sales volume of Pipeline steel and steel
for wind-generator towers increased by
29% and 198% respectivelySteel plates for oil storage tanks and alloy
pipeline steel such as T91 secured the
biggest market shares in the country
• Despite weaknesses in the world economy, profit from our industrial investment operations reached a record high of RMB 3,169Mn, 18.9% higher than the previous year, representing a 7-year CAGR of 27.0%
Fosun Pharma NISCOForte Hainan
Mining48.05%*
99%*
50.3%*
60%*
Fosun Pharma Forte NISCO Hainan
Mining560.35 1,617.63 204.27 661.91
* As at 2011/12/31
*Including offset: 124Mn
7

Growth Engine 2: Investments
7-yr CAGR: 7.4%
Return on Investments
Breakdown of Return on Investments (RMB Mn)
• Our returns on investment in 2011 saw a decline from the previous year, amounting only to RMB 1,383Mn mainly attributable to the loss on fair value adjustments of equity investments in the secondary market including Focus Media.
Partial interests in associates (Yu Yuan, Jianlong Group, Huaxia Mining, Shanjiaowuling)
451.66
Gain on sales of shares 1,029.4
Gain on fair value move of shares -740.76
Other equity investment 642.59
2004 2005 2006 2007 2008 2009 2010 20110
1,000
2,000
3,000
4,000
5,000
840
325
1,245884
290
2,510
2,033
1,383
Mill
ion
RMB
8
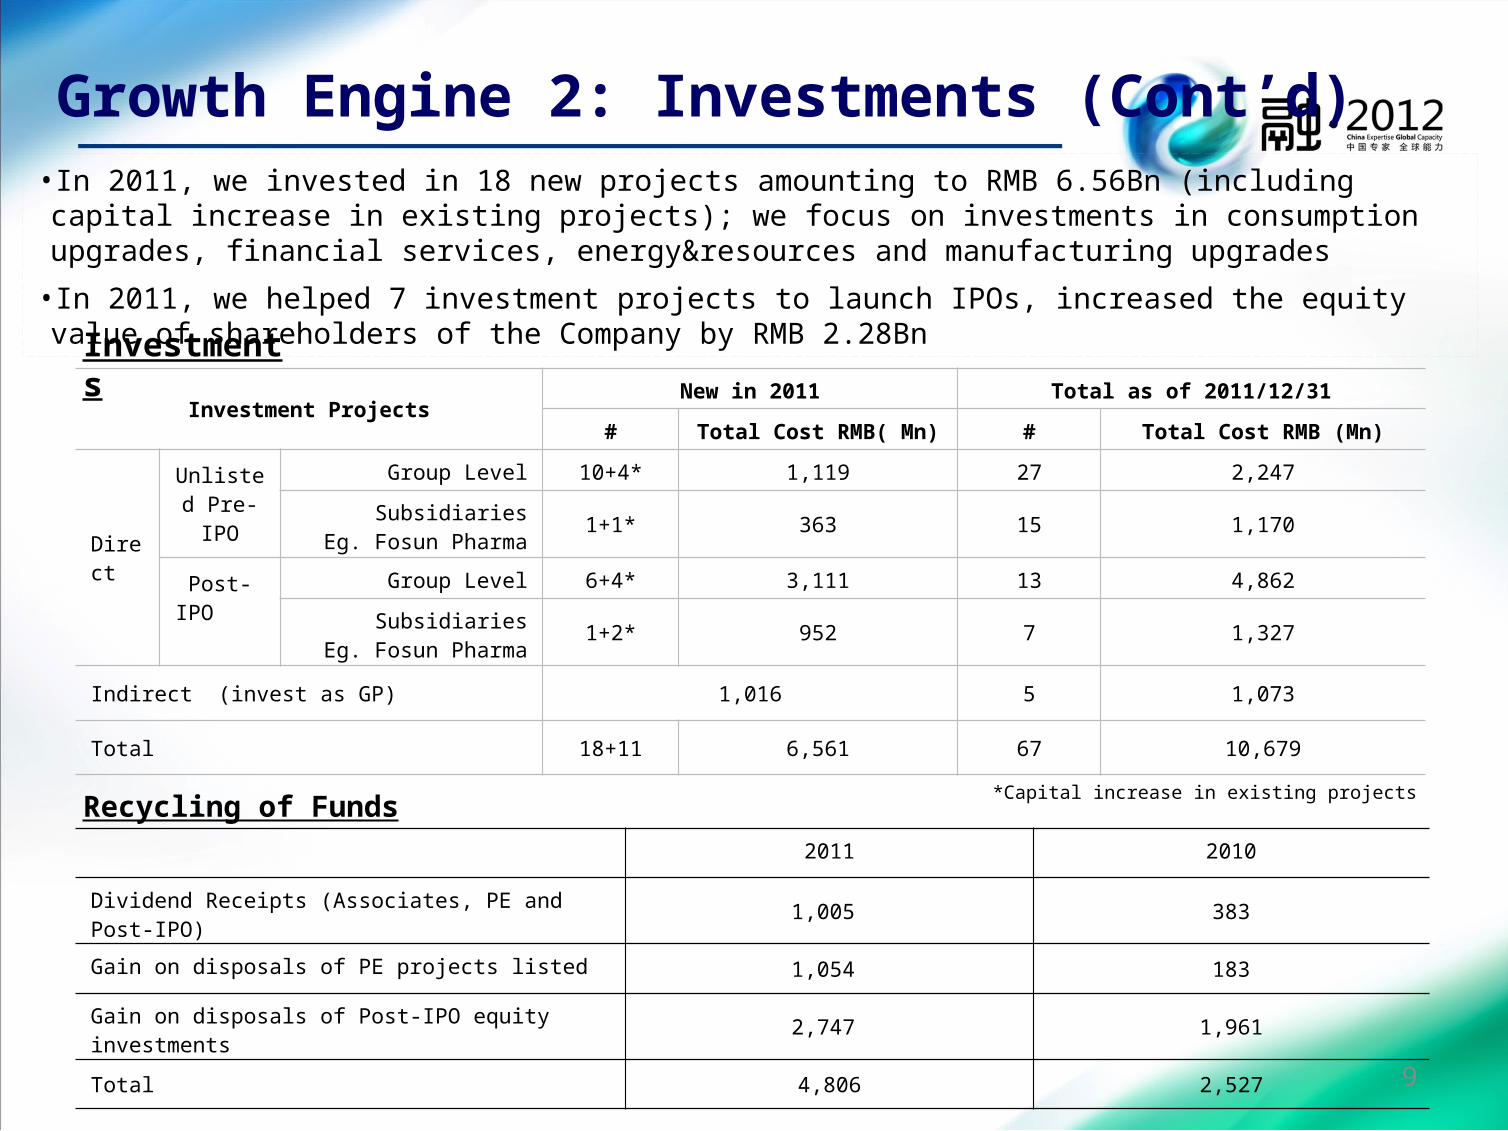
Investments
Growth Engine 2: Investments (Cont’d)
Recycling of Funds
• In 2011, we invested in 18 new projects amounting to RMB 6.56Bn (including capital increase in existing projects); we focus on investments in consumption upgrades, financial services, energy&resources and manufacturing upgrades
• In 2011, we helped 7 investment projects to launch IPOs, increased the equity value of shareholders of the Company by RMB 2.28Bn
2011 2010
Dividend Receipts (Associates, PE and Post-IPO) 1,005 383
Gain on disposals of PE projects listed 1,054 183
Gain on disposals of Post-IPO equity investments 2,747 1,961
Total 4,806 2,527
Investment ProjectsNew in 2011 Total as of 2011/12/31
# Total Cost RMB( Mn) # Total Cost RMB (Mn)
Direct
Unlisted Pre-IPO
Group Level 10+4* 1,119 27 2,247
SubsidiariesEg. Fosun Pharma 1+1* 363 15 1,170
Post-IPO
Group Level 6+4* 3,111 13 4,862
SubsidiariesEg. Fosun Pharma 1+2* 952 7 1,327
Indirect (invest as GP) 1,016 5 1,073
Total 18+11 6,561 67 10,679
*Capital increase in existing projects
9

•As of 31 December 2011, our AUM amounted to RMB 13.3Bn, among which RMB 2.7Bn is from Fosun Group. In 2011, the asset management business achieved a net profit of RMB 121Mn
•In 2011, we invested in 15 projects amounting to RMB 5.2Bn
•The Carlyle-Fosun JV became one of the first batch funds to be qualified as a QFLP in China; Prudential Group invested US$500 Mn and became the first international LP in China Opportunity Fund.
•Participating in the selection the first time, Fosun Capital ranked eight among the top 30 PE investment institutions in China in 2011 (by Zero2IPO Group)
Asset Management Structure as of 31 December 2011
Fosun Asset Management
Star CapitalRMB 3.6Bn
Fosun Wealth PE Fund
RMB 1.5Bn
Fosun Grand PE Fund
RMB 1.5Bn
Fosun-Carlyle Fund
USD 100Mn
Prudential-Fosun FundUSD 600Mn
Growth Engine 3: Asset Management
Forte series funds & others
RMB 2.2Bn
10
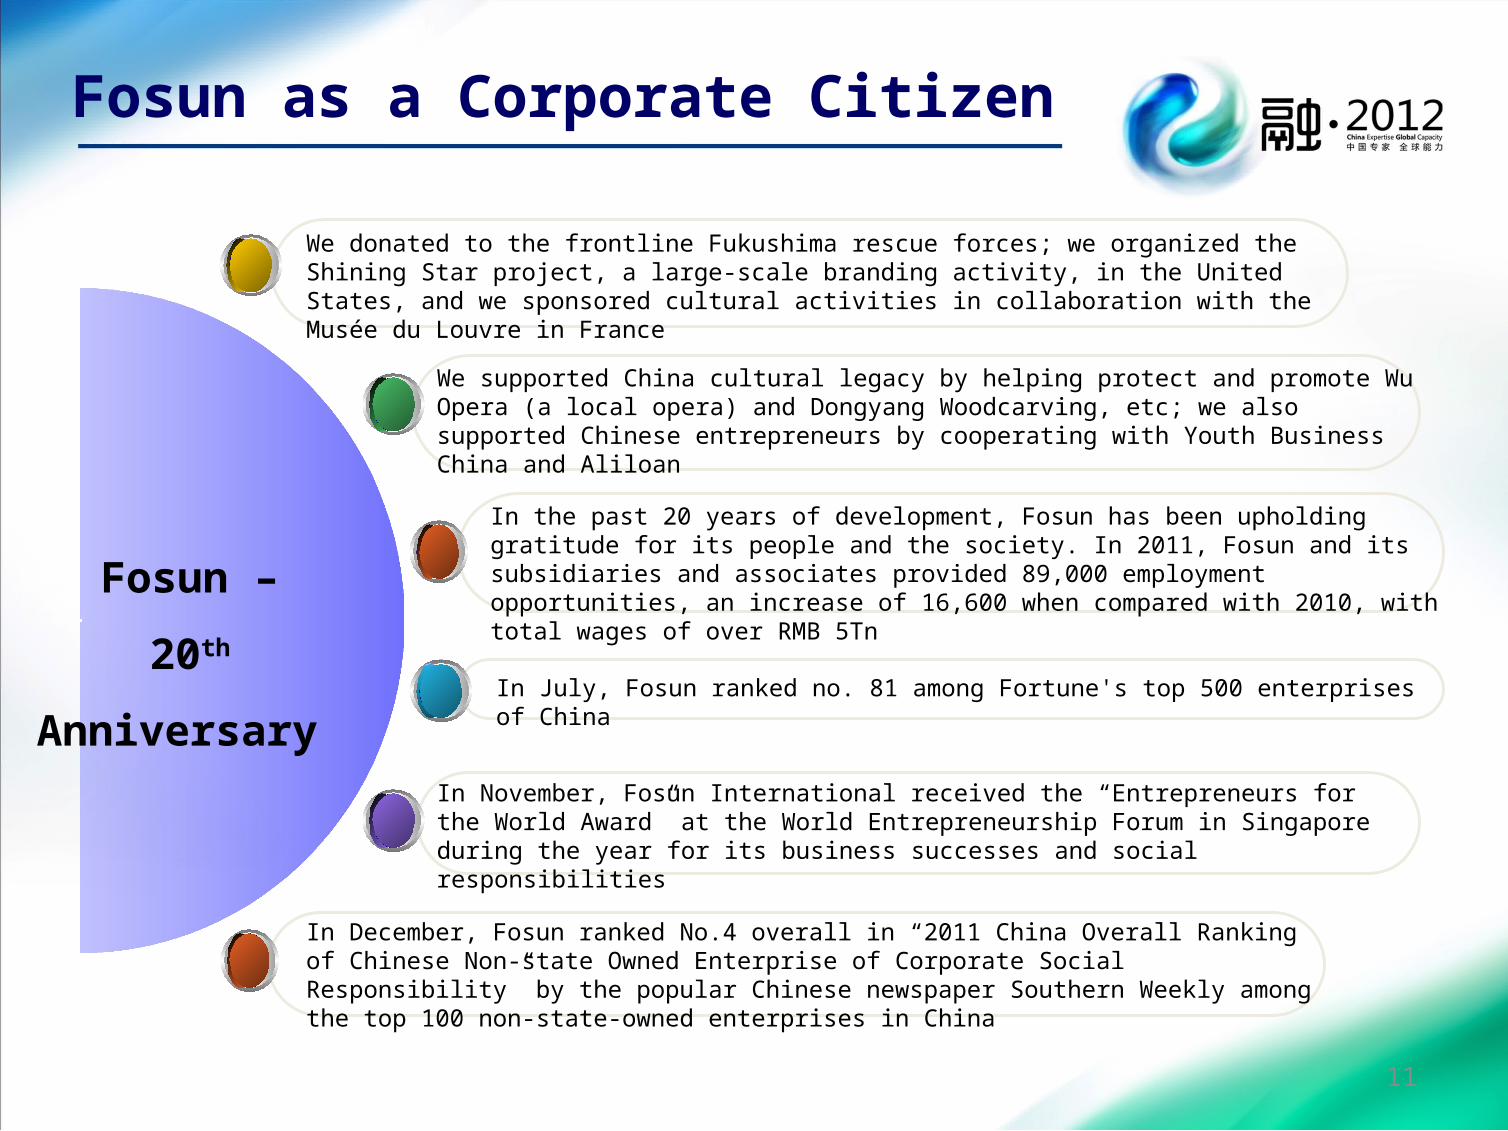
Fosun as a Corporate Citizen
We donated to the frontline Fukushima rescue forces; we organized the Shining Star project, a large-scale branding activity, in the United States, and we sponsored cultural activities in collaboration with the Musée du Louvre in France
We supported China cultural legacy by helping protect and promote Wu Opera (a local opera) and Dongyang Woodcarving, etc; we also supported Chinese entrepreneurs by cooperating with Youth Business China and Aliloan
In November, Fosun International received the “Entrepreneurs for the World Award” at the World Entrepreneurship Forum in Singapore during the year for its business successes and social responsibilities
In December, Fosun ranked No.4 overall in “2011 China Overall Ranking of Chinese Non-state Owned Enterprise of Corporate Social Responsibility” by the popular Chinese newspaper Southern Weekly among the top 100 non-state-owned enterprises in China
In July, Fosun ranked no. 81 among Fortune's top 500 enterprises of China
Fosun –
20th Anniversary
In the past 20 years of development, Fosun has been upholding gratitude for its people and the society. In 2011, Fosun and its subsidiaries and associates provided 89,000 employment opportunities, an increase of 16,600 when compared with 2010, with total wages of over RMB 5Tn
11

Competitive Advantage 1: Team—a Stable Partnership with Proven Track Record
The founders have been participating in all operation and investment activities throughout Fosun’s 20 years of development
Name Age Position Years of Service in FosunGuo,Guangchang 45 Chairman, Executive Director 20
Liang,Xinjun 44 Vice Chairman, Executive Director, CEO 20Wang,Qunbing 43 Executive Director, President 19
Fan,Wei 43 Executive Director, associate Co-president 19Ding,Guoqi 43 Executive Director, Senior VP, CFO 17
Wu,Ping 48 Executive Director, Senior VP 17Qin,Xuetang 49 Executive Director, Senior VP 17
Founders / the key decision-making team have a partnership of over 17 years, holding in a 79.46% stake in Fosun International. Their interests are aligned with that of the public shareholders
2003: NISCO(IRR:26%) 2010: Club Med2007: Hainan Mining
(IRR:60%) 2011: Folli Follie1994: Fosun Pharma(IRR:41%) and Forte(IRR:45%)
2002: Yu Yuan (IRR:25%), Jianlong Group(IRR:27%)
2004: Zhaojin Mining(IRR:49%)
2008: Focus Media(IRR:51%)
1992: Set-up2011: A large group benefiting from China ‘s growth
12
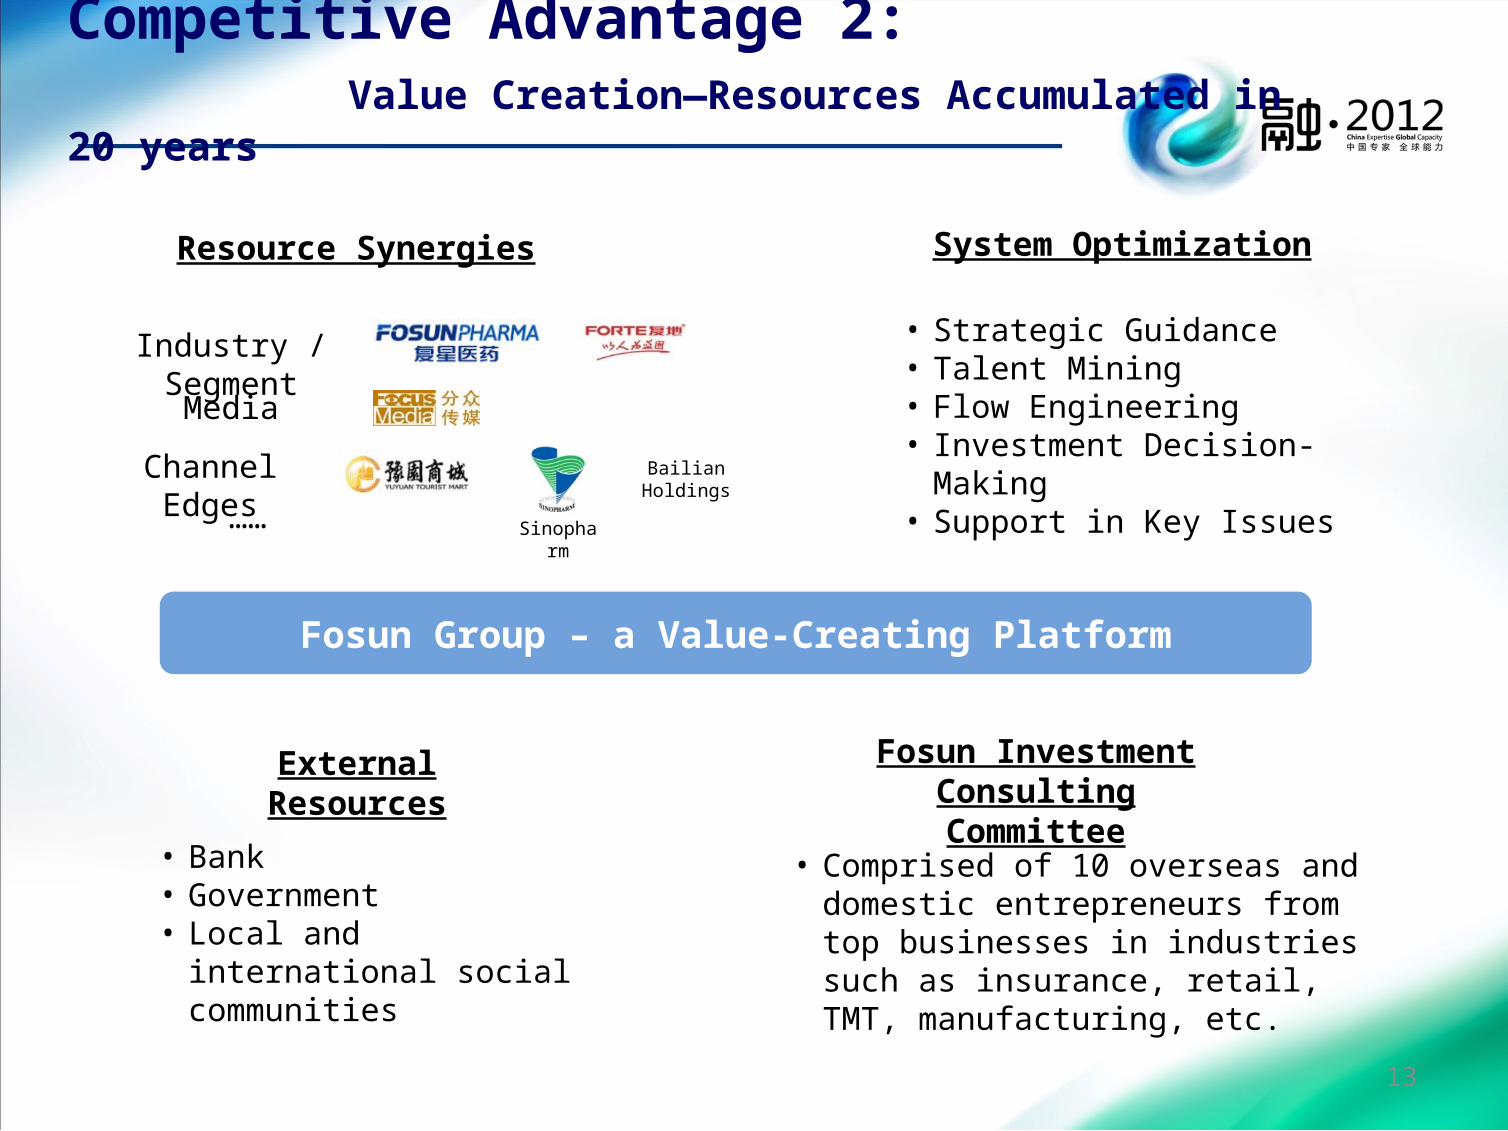
Competitive Advantage 2: Value Creation—Resources Accumulated in 20 years
Fosun Investment Consulting Committee
• Strategic Guidance• Talent Mining• Flow Engineering• Investment Decision-Making• Support in Key Issues
System OptimizationResource Synergies
Industry / Segment
Channel Edges
Media
……
External Resources
Fosun Group – a Value-Creating Platform
• Comprised of 10 overseas and domestic entrepreneurs from top businesses in industries such as insurance, retail, TMT, manufacturing, etc.
• Bank • Government • Local and international social
communities
13
Sinopharm
Bailian Holdings

Competitive Advantage 3: Strategy – China Expert + Global Capacity
Global CapacityChina Expert Maximize Investment Value
Club MedFolli Follie
PrudentialCarlyle
Investment Strategy: China expertise with global capacity Investment Concept: Value-created investment making the best of China’s growth Investment Model: Help foreign businesses grow in China, thereby enhancing their global performance Help local businesses establish a global vision and a capability of integrating global resources For foreign companies desiring for Chinese market: help with sales, brand promotion, copyright protection
• Business covering 27 provinces in mainland China
• Nearly 89,000 employment opportunities created across major businesses
14
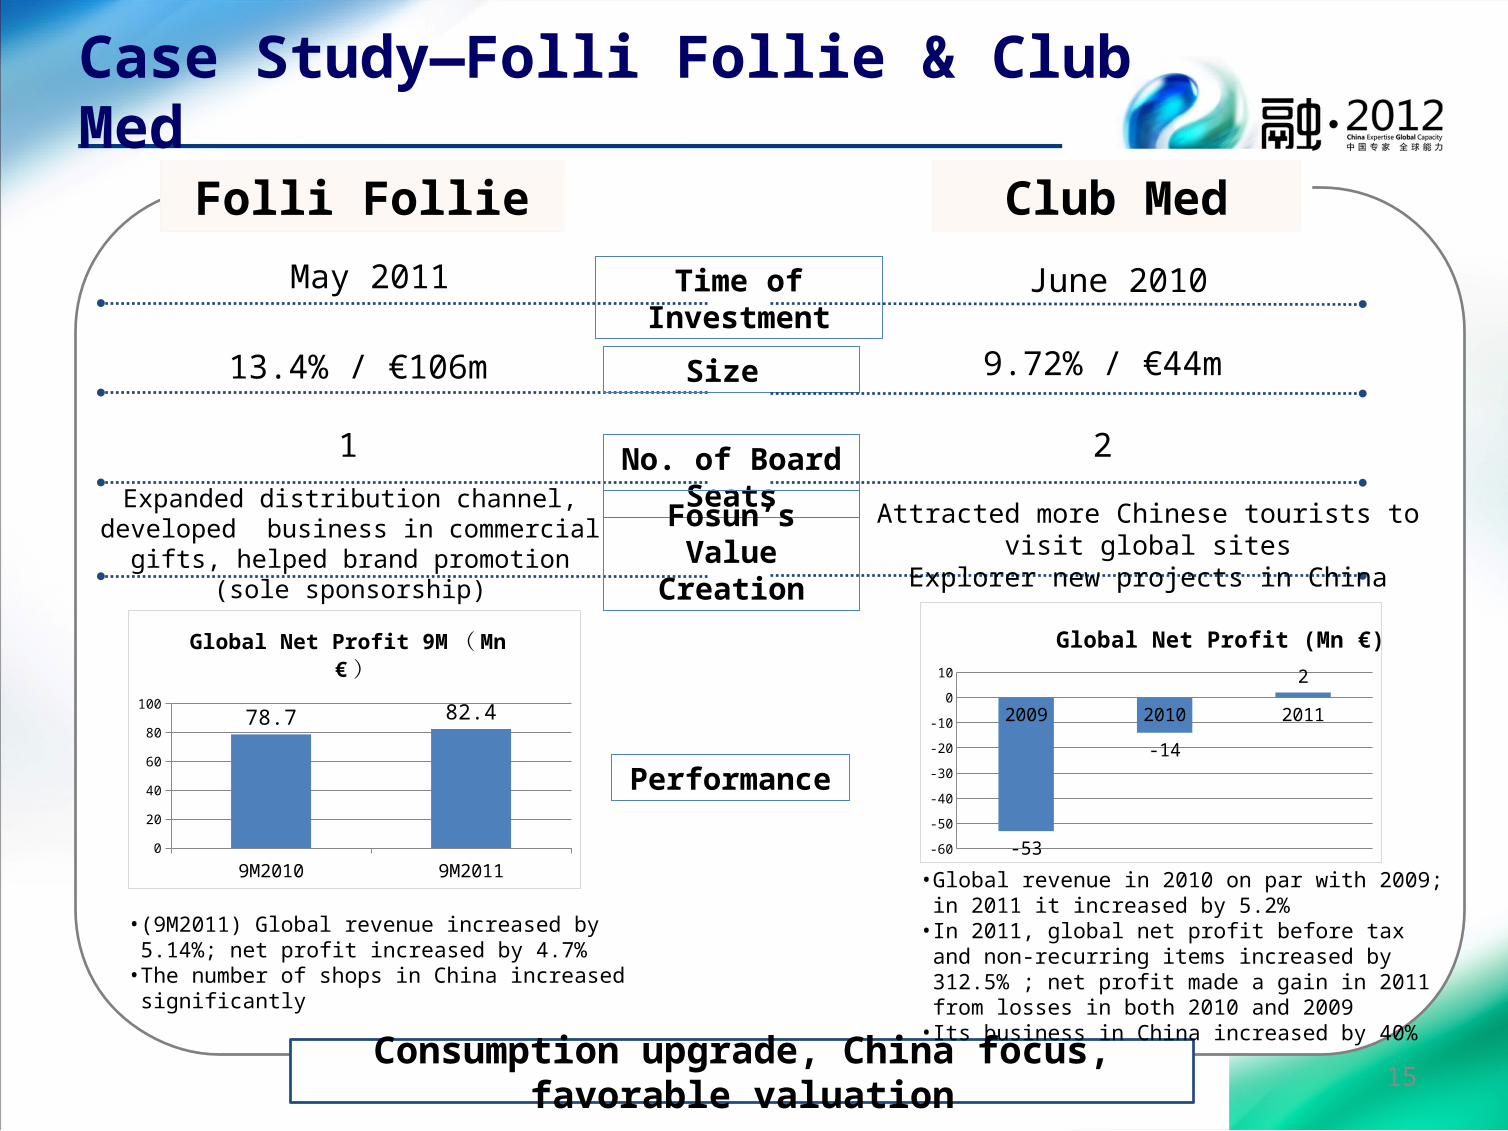
Case Study—Folli Follie & Club Med
May 2011 Time of Investment
13.4% / €106m Size 9.72% / €44m
1 No. of Board Seats 2Expanded distribution channel, developed business in commercial gifts, helped brand
promotion (sole sponsorship)
Fosun’s Value Creation
Attracted more Chinese tourists to visit global sitesExplorer new projects in China
Folli Follie
June 2010
Club Med
Consumption upgrade, China focus, favorable valuation
Performance
• (9M2011) Global revenue increased by 5.14%; net profit increased by 4.7%
• The number of shops in China increased significantly
• Global revenue in 2010 on par with 2009; in 2011 it increased by 5.2%
• In 2011, global net profit before tax and non-recurring items increased by 312.5% ; net profit made a gain in 2011 from losses in both 2010 and 2009
• Its business in China increased by 40%
2009 2010 2011
-60
-50
-40
-30
-20
-10
0
10
-53
-14
2
Global Net Profit (Mn €)
9M2010 9M20110
10
20
30
40
50
60
70
80
90 78.7 82.4Global Net Profit 9M ( Mn € )
15
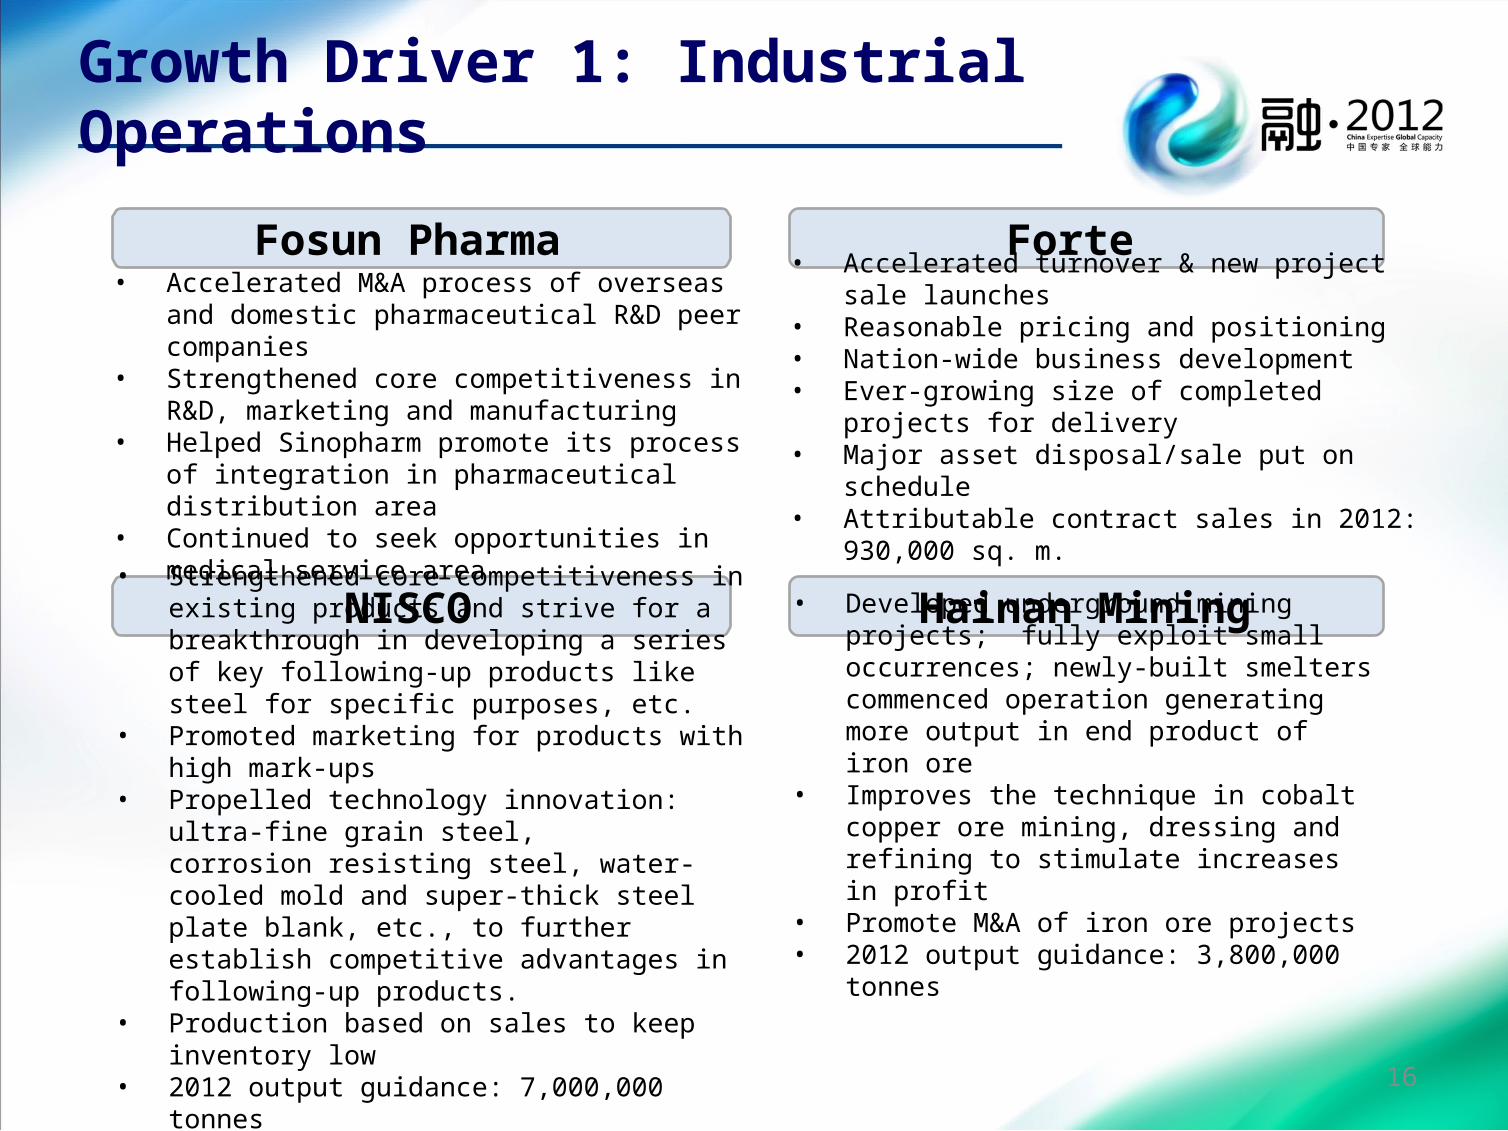
Growth Driver 1: Industrial Operations
Fosun Pharma
• Accelerated turnover & new project sale launches • Reasonable pricing and positioning• Nation-wide business development • Ever-growing size of completed projects for delivery• Major asset disposal/sale put on schedule• Attributable contract sales in 2012: 930,000 sq. m.
• Strengthened core competitiveness in existing products and strive for a breakthrough in developing a series of key following-up products like steel for specific purposes, etc.
• Promoted marketing for products with high mark-ups• Propelled technology innovation: ultra-fine grain
steel, corrosion resisting steel, water-cooled mold and super-thick steel plate blank, etc., to further establish competitive advantages in following-up products.
• Production based on sales to keep inventory low• 2012 output guidance: 7,000,000 tonnes
• Developed underground mining projects; fully exploit small occurrences; newly-built smelters commenced operation generating more output in end product of iron ore
• Improves the technique in cobalt copper ore mining, dressing and refining to stimulate increases in profit
• Promote M&A of iron ore projects• 2012 output guidance: 3,800,000 tonnes
• Accelerated M&A process of overseas and domestic pharmaceutical R&D peer companies
• Strengthened core competitiveness in R&D, marketing and manufacturing
• Helped Sinopharm promote its process of integration in pharmaceutical distribution area
• Continued to seek opportunities in medical service area
Forte
NISCO Hainan Mining
16
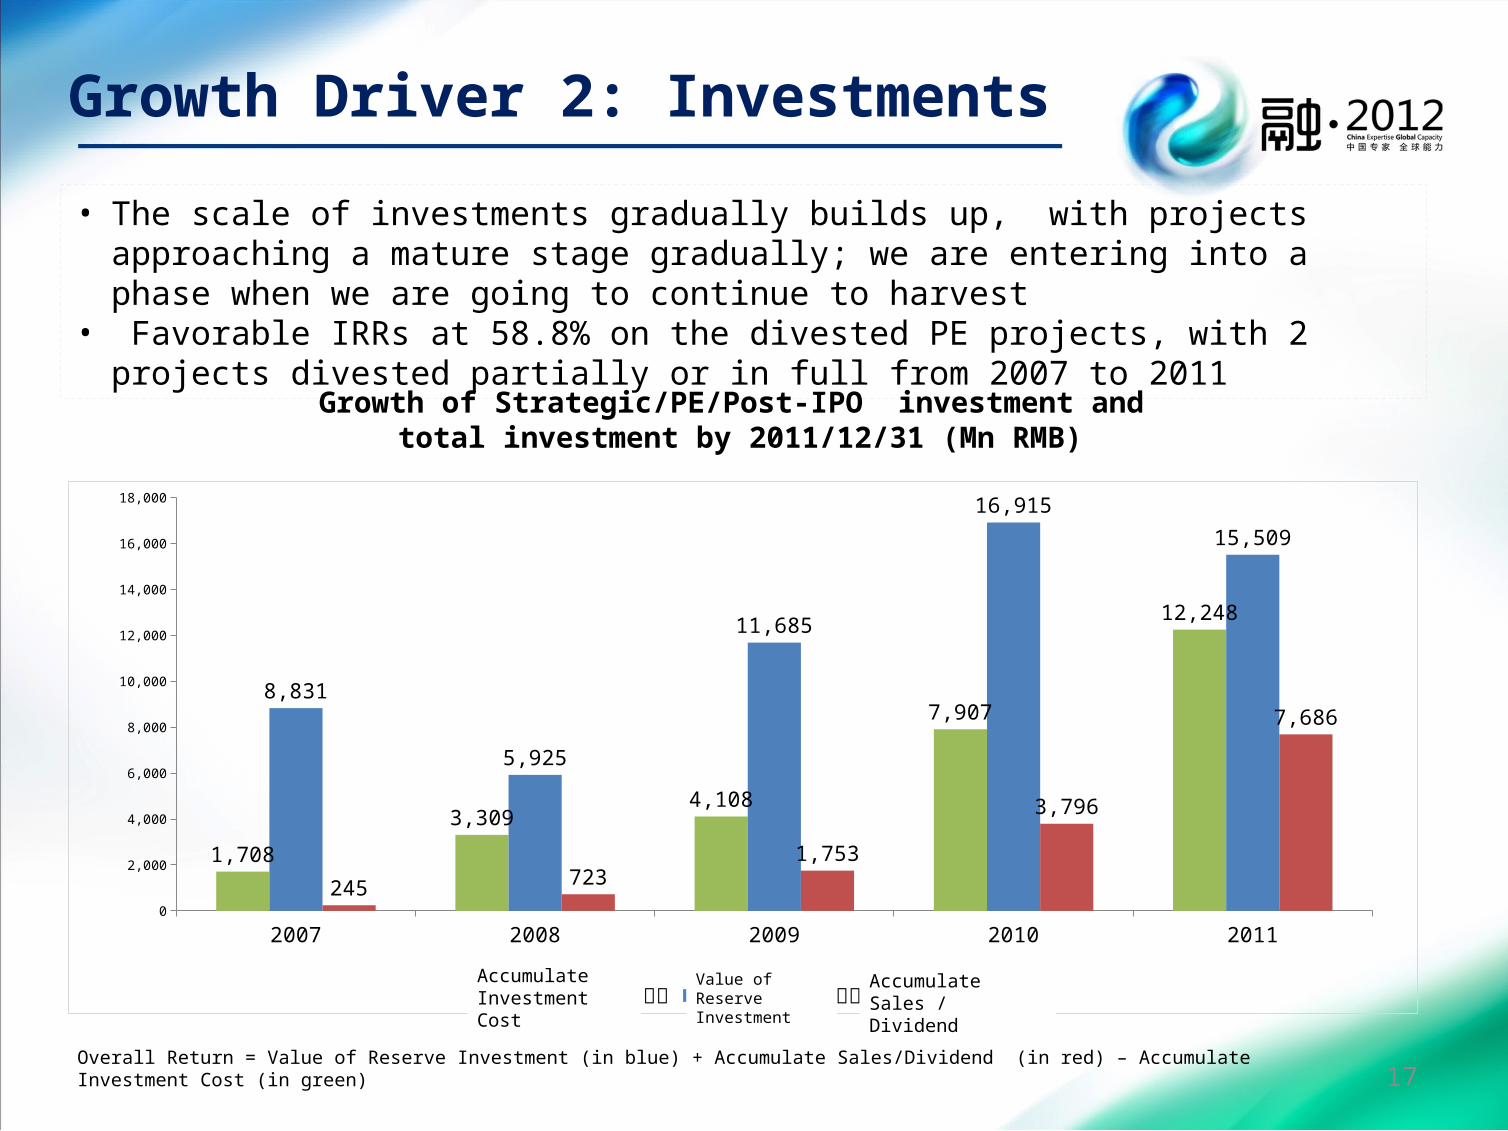
Growth Driver 2: Investments
• The scale of investments gradually builds up, with projects approaching a mature stage gradually; we are entering into a phase when we are going to continue to harvest
• Favorable IRRs at 58.8% on the divested PE projects, with 2 projects divested partially or in full from 2007 to 2011
Growth of Strategic/PE/Post-IPO investment and total investment by 2011/12/31 (Mn RMB)
2007 2008 2009 2010 20110
2,000
4,000
6,000
8,000
10,000
12,000
14,000
16,000
18,000
1,708
3,3094,108
7,907
12,248
8,831
5,925
11,685
16,91515,509
245 7231,753
3,796
7,686
累计项目投资成本 存量项目价值 累计退出金额 /分红Accumulate Investment Cost
Value of Reserve Investment
Accumulate Sales / Dividend
Overall Return = Value of Reserve Investment (in blue) + Accumulate Sales/Dividend (in red) – Accumulate Investment Cost (in green)17
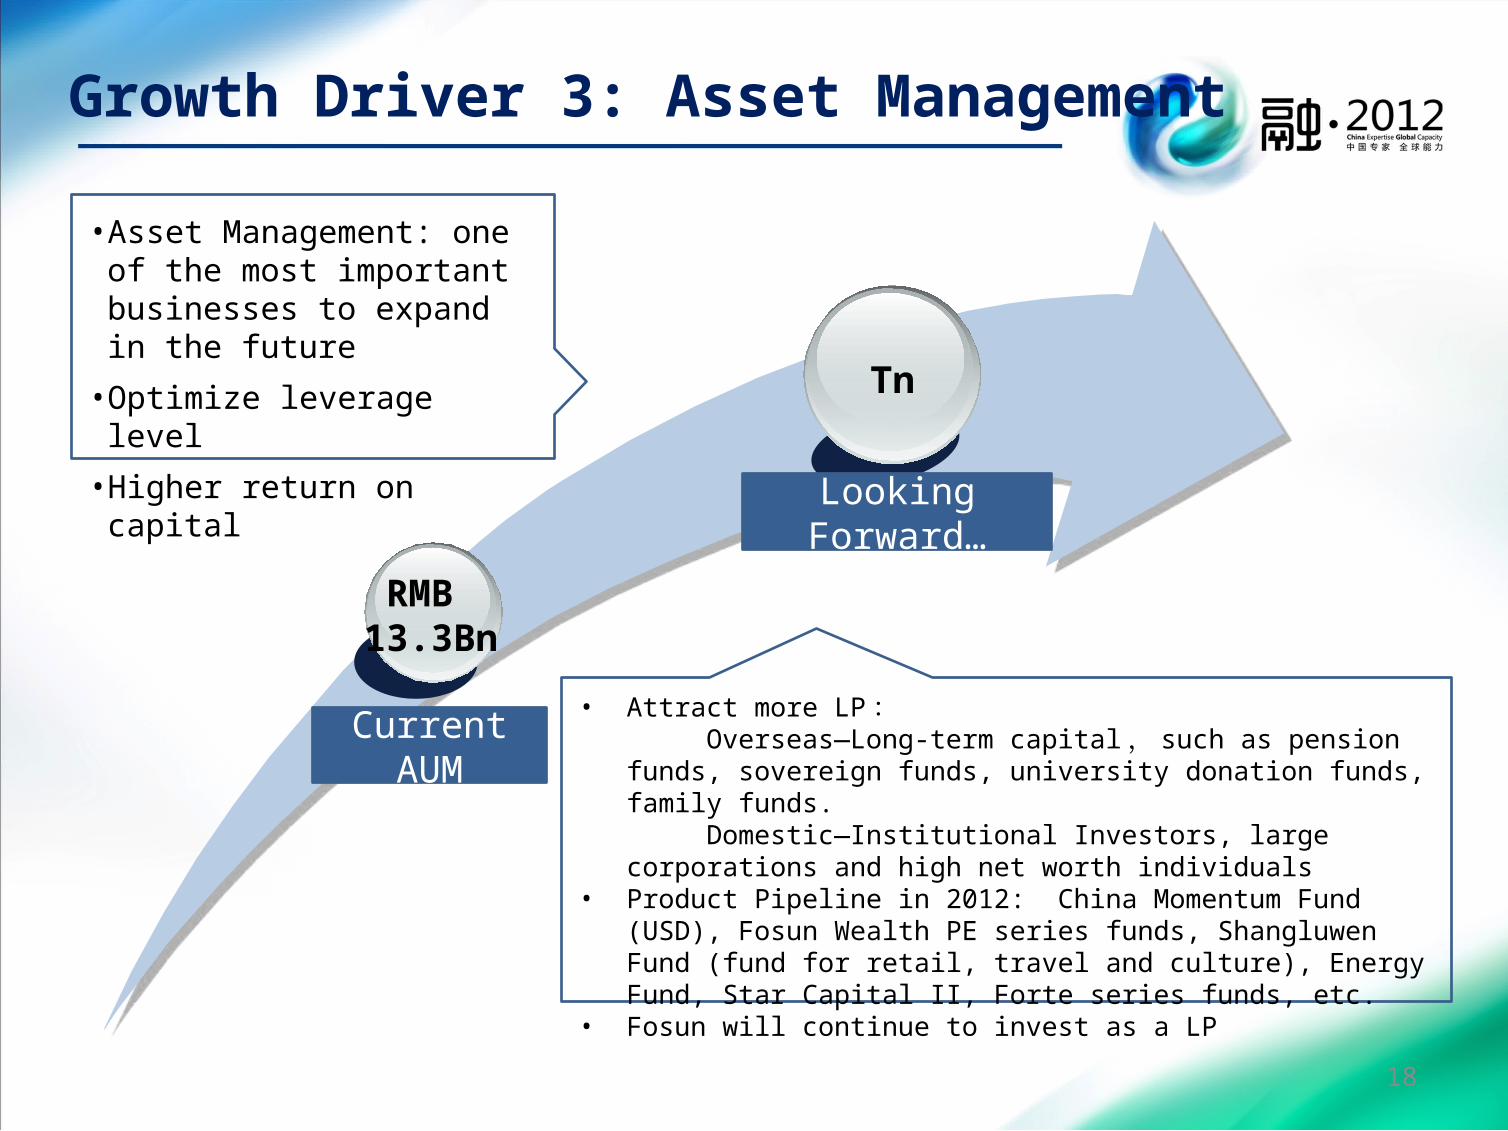
Growth Driver 3: Asset Management
Tn
RMB 13.3Bn
Current AUM• Attract more LP: Overseas—Long-term capital, such as pension funds, sovereign funds,
university donation funds, family funds. Domestic—Institutional Investors, large corporations and high net worth
individuals• Product Pipeline in 2012: China Momentum Fund (USD), Fosun Wealth PE
series funds, Shangluwen Fund (fund for retail, travel and culture), Energy Fund, Star Capital II, Forte series funds, etc.
• Fosun will continue to invest as a LP
Looking Forward…
• Asset Management: one of the most important businesses to expand in the future
• Optimize leverage level
• Higher return on capital
18
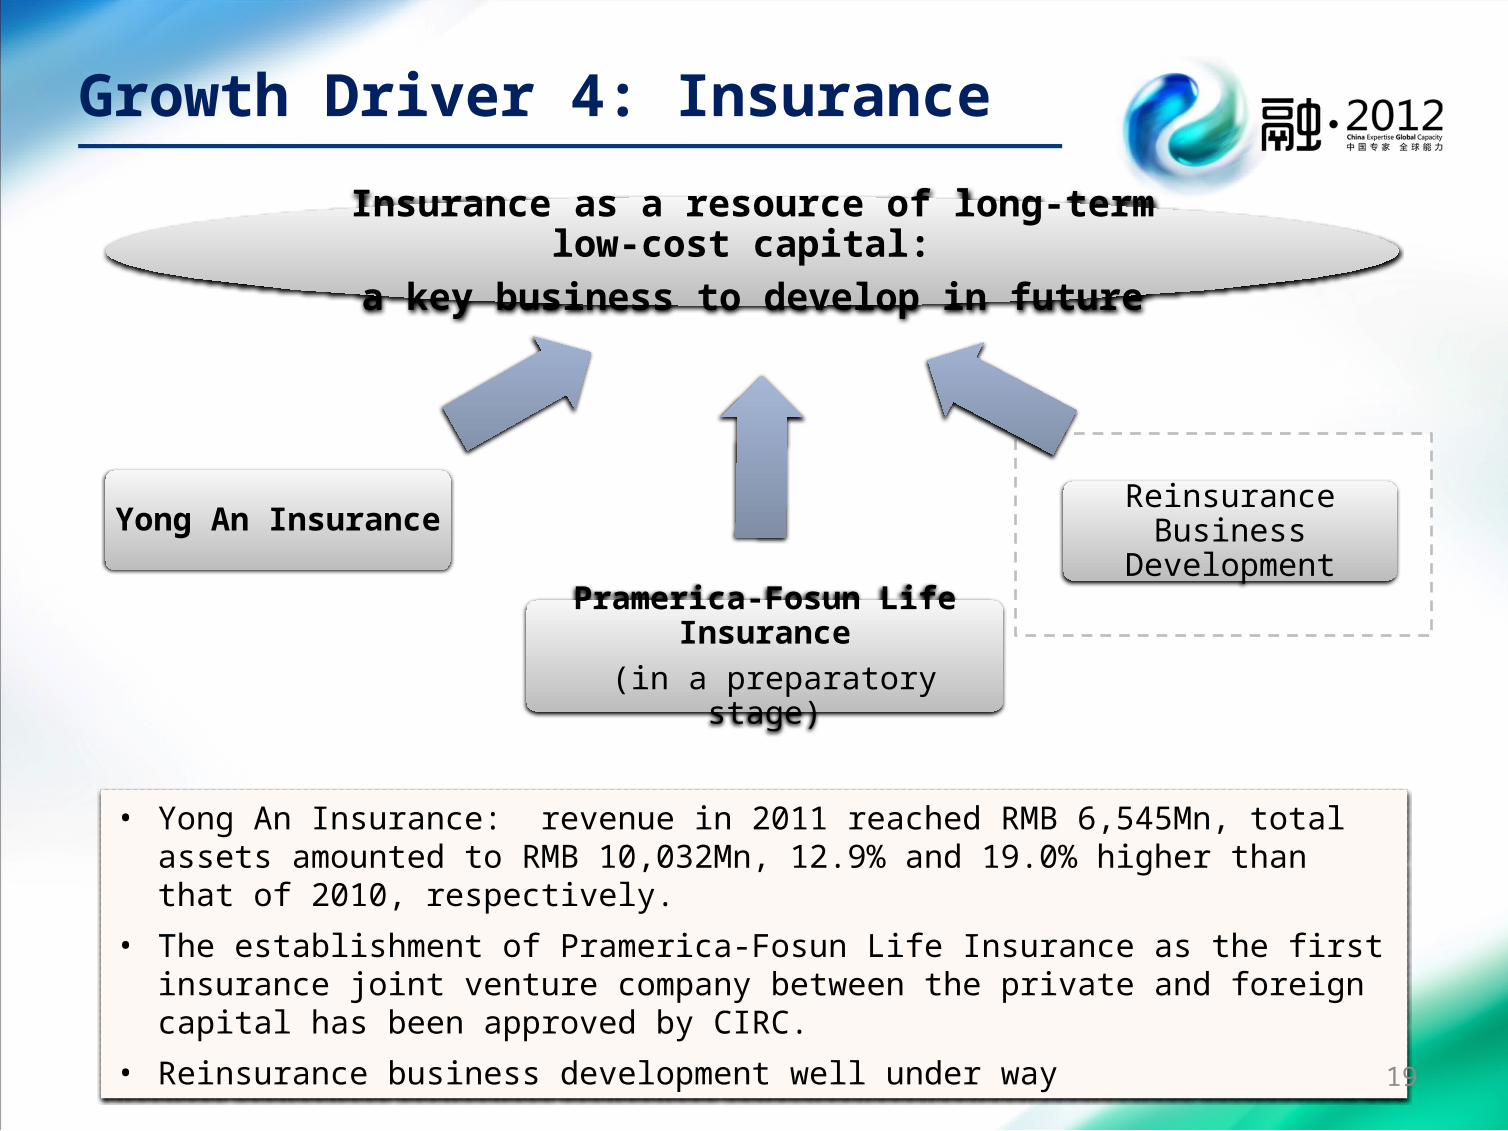
Growth Driver 4: Insurance
Insurance as a resource of long-term low-cost capital: a key business to develop in future
Yong An Insurance
Pramerica-Fosun Life Insurance (in a preparatory stage)
Reinsurance Business Development
• Yong An Insurance: revenue in 2011 reached RMB 6,545Mn, total assets amounted to RMB 10,032Mn, 12.9% and 19.0% higher than that of 2010, respectively.
• The establishment of Pramerica-Fosun Life Insurance as the first insurance joint venture company between the private and foreign capital has been approved by CIRC.
• Reinsurance business development well under way
19
Financial Results
20

RMB (in million) 2011 2010 YOYRevenue 56,816.2 44,643.7 27.3%
Gross profit 10,566.3 9,366.5 12.8%
Net profit attributable to shareholders 3,403.6 4,227.1 -19.5%
EBITDA 11,460.5 12,014.5 -4.6%
EPS(RMB) 0.53 0.66 -19.5%
Facing an uncertain and volatile market, we delivered stable industrial profit.
Net Profit (RMB million) 2011 2010 YOY
Industrial Operations 3,169.0 2,665.4 18.9%
Investments 1,382.9 2,092.4 -33.9%
Asset Management 121.0 6.5 1772.5%
12/31/2011 12/31/2010
BVPS (RMB) 4.96 4.65
DPS(HKD) 0.157 0.17
21
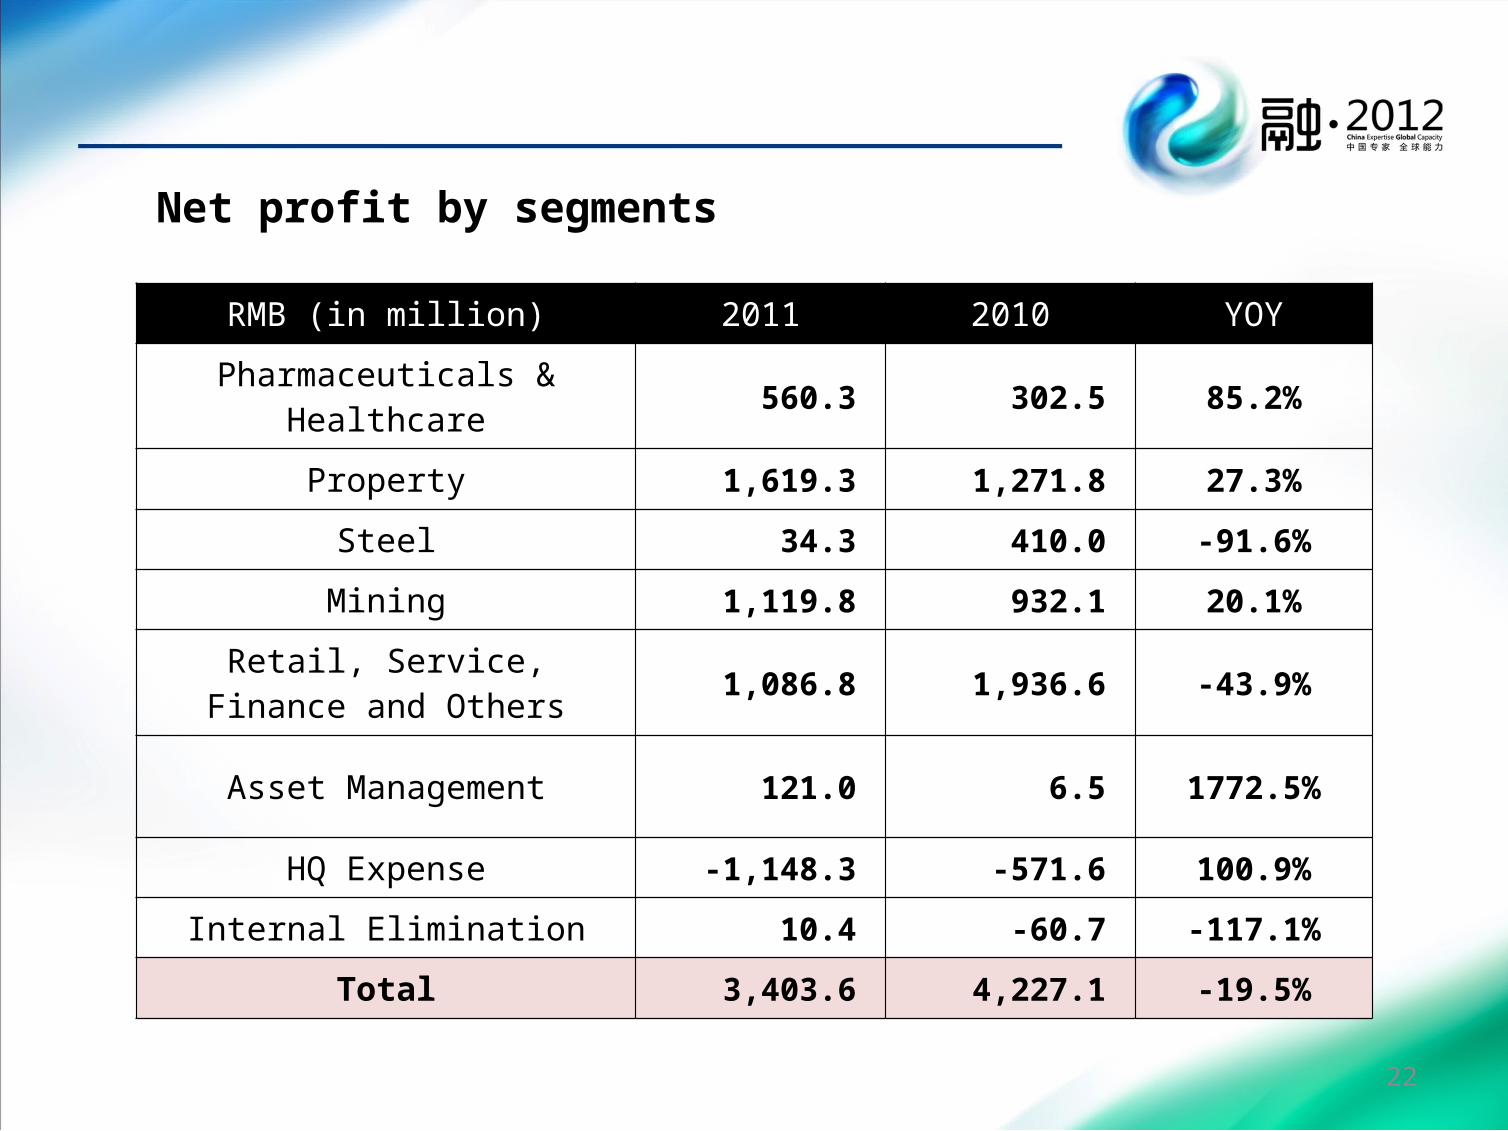
RMB (in million) 2011 2010 YOY
Pharmaceuticals & Healthcare 560.3 302.5 85.2%
Property 1,619.3 1,271.8 27.3%
Steel 34.3 410.0 -91.6%
Mining 1,119.8 932.1 20.1%
Retail, Service, Finance and Others 1,086.8 1,936.6 -43.9%
Asset Management 121.0 6.5 1772.5%
HQ Expense -1,148.3 -571.6 100.9%
Internal Elimination 10.4 -60.7 -117.1%
Total 3,403.6 4,227.1 -19.5%
Net profit by segments
22

RMB (in million) 2011/12/31 2010/12/31 Change
Cash & bank balance 16,777.8 21,335.0 -21.4%
Unused bank credit facility 40,275.7 25,464.0 58.2%
Total assets 137,537.6 118,374.8 16.2%
Net assets 31,830.2 29,873.1 6.6%
Total debt/Total capitalization(1) 52.7% 49.4% Up by 3.3 % pts
Net debt/net capitalization(2) 43.5% 33.4% Up by 10.1 % pts
Mid-to-long term debt/total debt 56.2% 49.6% Up by 6.6 % pts
Notes: 1. Total Debt = current & non-current interest-bearing borrowings + interest-free loans from related
parties; Total Capitalization = total equity + total debt
2. Net Debt = total debt – cash & bank balance; Net Capitalization = total equity + net debt
23

www.fosun-international.com
www.fosun-international.com24

Appendix
―Valuation Summary―Structure
―Debt & Credit―Fosun Pharma
―Forte―NISCO
―Hainan Mining―2012 Target figures for main operations
25

Valuation Summary
Market Cap (2011/12/31): 26.07 Bn HKD
Book Value (2011/12/31): 31.83 Bn RMB / 39.26 Bn HKD Book Value per Share
(2011/12/31): 4.96 RMB / 6.11 HKD
Net Portfolio Value (2011/12/31): 35.02 Bn RMB / 43.20 Bn HKD Net Portfolio Value per
Share (2011/12/31): 5.45 RMB / 6.73 HKD
Net Portfolio Value Breakdown Bn RMB Bn HKD
Group level listed investments by attributable market cap as of 2011/12/31:
of which:
Industrial Investments (Fosun Pharma/NISCO) 13.23 16.32
Strategic Investments (Yuyuan/Focus Media/Club Med) 5.60 6.90
Listed Pre-IPO Investments (ShannGu Power/YOTRIO & Others) 1.45 1.79
Other Listed Investments 3.67 4.53
Group level unlisted investment by Book Value
of which:
Subsidiaries and strategic associates (Forte/Hainan Mining/Haizhimen & Others) 19.29 23.79
Unlisted Pre-IPO Investments (Jinhe Industrial & Others) 2.23 2.75
Other unlisted investments (Yong’An insurance & Others) 2.02 2.49
Net debt at the Group Level 12.46 15.37
Net portfolio value at the Group Level 35.02 43.20
Asset Under Management (Committed Funds) 13.27 16.36
26
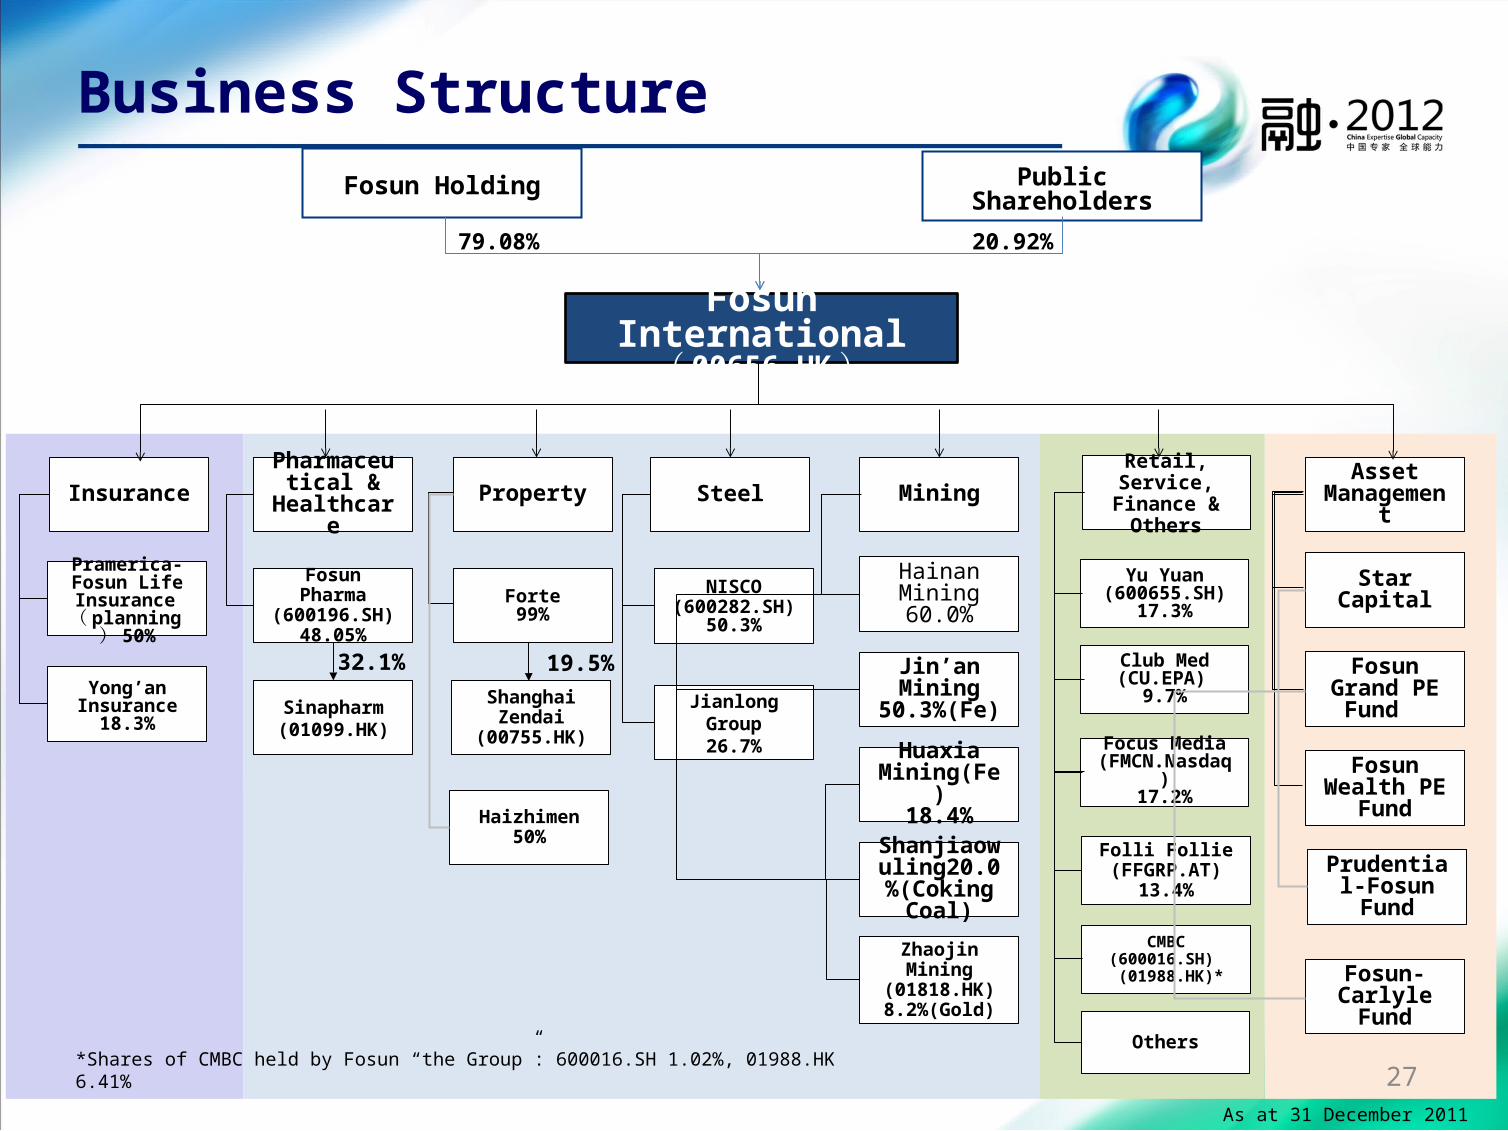
Public ShareholdersFosun Holding
32.1% 19.5%
Fosun Pharma(600196.SH)
48.05%
Sinapharm(01099.HK)
Steel
NISCO(600282.SH)
50.3%
Mining
Jianlong Group26.7%
Property
Forte99%
Pharmaceutical &
Healthcare
Zhaojin Mining(01818.HK)8.2%(Gold)
Shanghai Zendai(00755.HK)
Fosun International( 00656.HK)
Insurance Asset Management
Yong’an Insurance
18.3%
Star Capital
Prudential-Fosun Fund
Fosun Grand PE Fund
Fosun Wealth PE Fund
Fosun-Carlyle Fund
Pramerica-Fosun Life Insurance( planning) 5
0%
Focus Media(FMCN.Nasdaq)
17.2%
Retail, Service, Finance &
Others
Yu Yuan(600655.SH)
17.3%
Others
Club Med(CU.EPA)
9.7%
Folli Follie(FFGRP.AT)
13.4%
CMBC(600016.SH) (01988.HK)*
Hainan Mining60.0%
Jin’an Mining50.3%(Fe)
Huaxia Mining(Fe)
18.4%
Shanjiaowuling20.0%
(Coking Coal)
Business Structure
79.08% 20.92%
Haizhimen50%
*Shares of CMBC held by Fosun “the Group”: 600016.SH 1.02%, 01988.HK 6.41%
As at 31 December 2011
Hainan Mining60.0%
27

• A debt structure being optimized constantly:mid-to-long term debt to total debt ratio has increased for the 5th consecutive year
• Cash balance and unused bank facilities have been on the rise by year
RMB 00Mn
2007 2008 2009 2010 20110%
10%20%30%40%50%60%70%80%90%
100%
短期债务中长期债务Mid-long term
debt
Short term debt
2007 2008 2009 2010 20110.0
100.0
200.0
300.0
400.0
500.0
600.0
未用银行信贷 现金及银行余额
Unused bank credit facility
Cash & bank balance
Optimized Debt Structure
28

Fosun Pharma
• Premium private healthcare service• Global strategy• ......
R&DManufacturing
Distribution(Sinopharm)
Retail Pharmacies (~1500 branches)
Future Promising
components
Fosun Pharma: to build an integrated industrial chain, encompassing major sectors of health-related industry.
29
Fosun Pharma
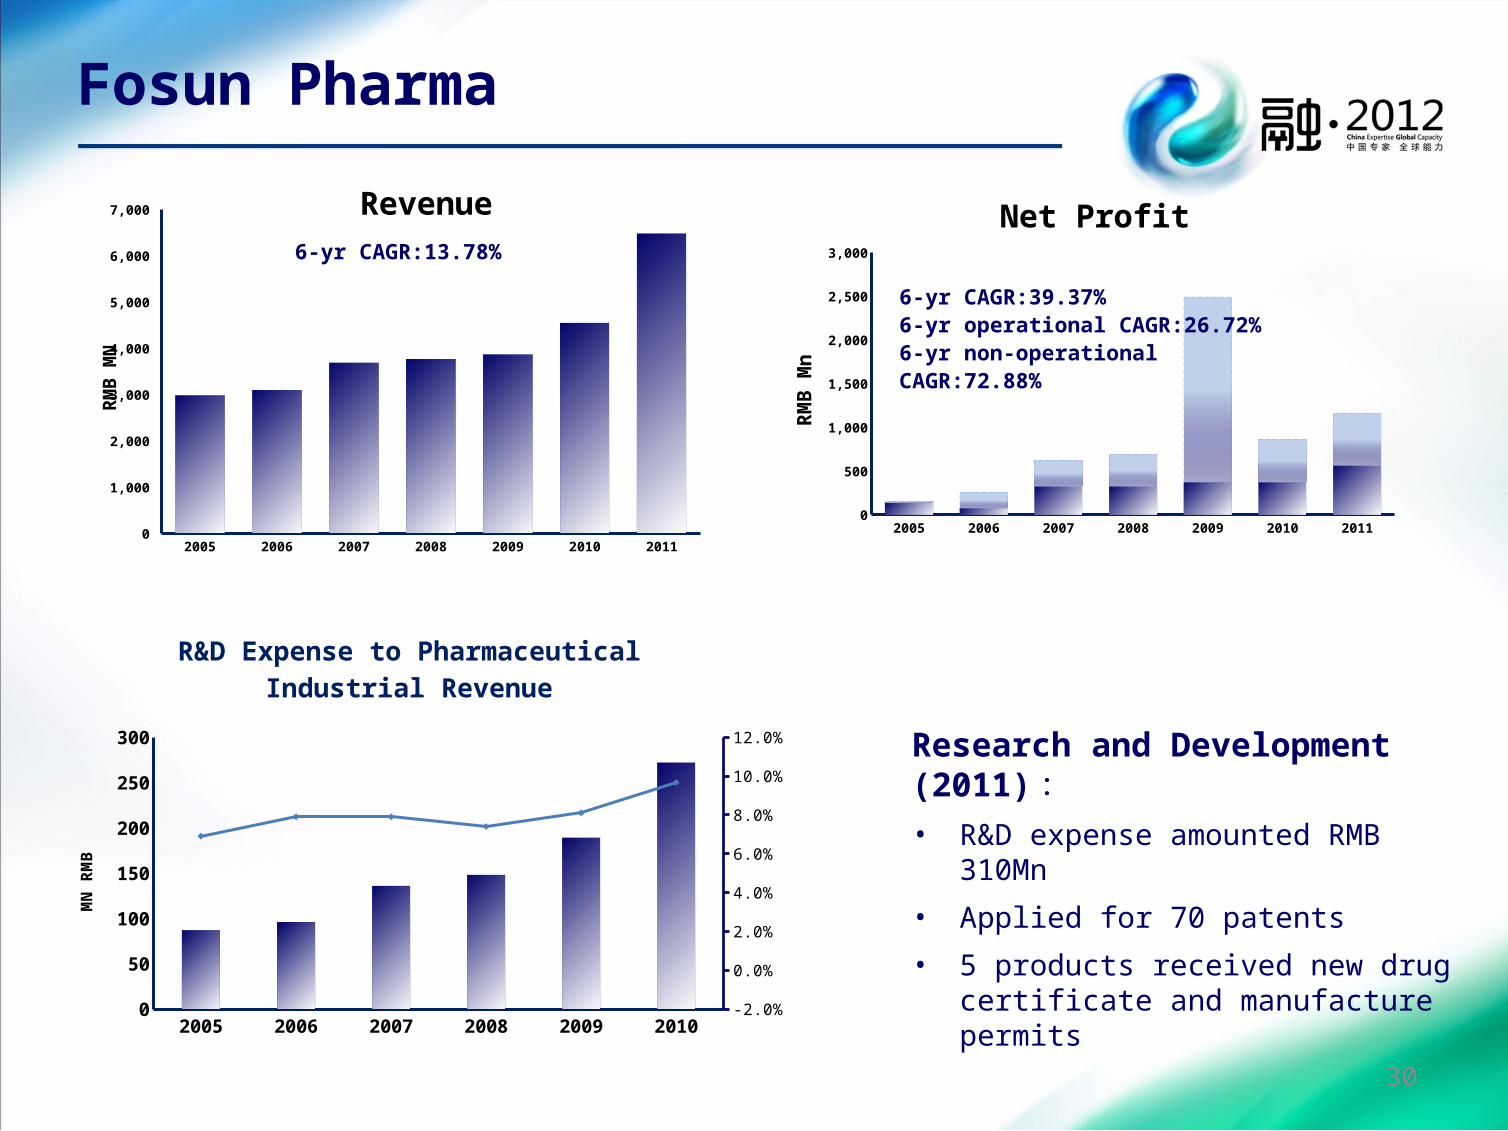
Research and Development (2011):• R&D expense amounted RMB 310Mn
• Applied for 70 patents
• 5 products received new drug certificate and manufacture permits
2005 2006 2007 2008 2009 20100
50
100
150
200
250
300
-2.0%
0.0%
2.0%
4.0%
6.0%
8.0%
10.0%
12.0%
R&D Expense to Pharmaceutical Industrial Revenue
MN
RM
B
2005 2006 2007 2008 2009 2010 20110
1,000
2,000
3,000
4,000
5,000
6,000
7,000 Revenue
RM
B M
N
6-yr CAGR:13.78%
2005 2006 2007 2008 2009 2010 20110
500
1,000
1,500
2,000
2,500
3,000
Net Profit
RM
B M
n
6-yr CAGR:39.37%6-yr operational CAGR:26.72%6-yr non-operational CAGR:72.88%
30
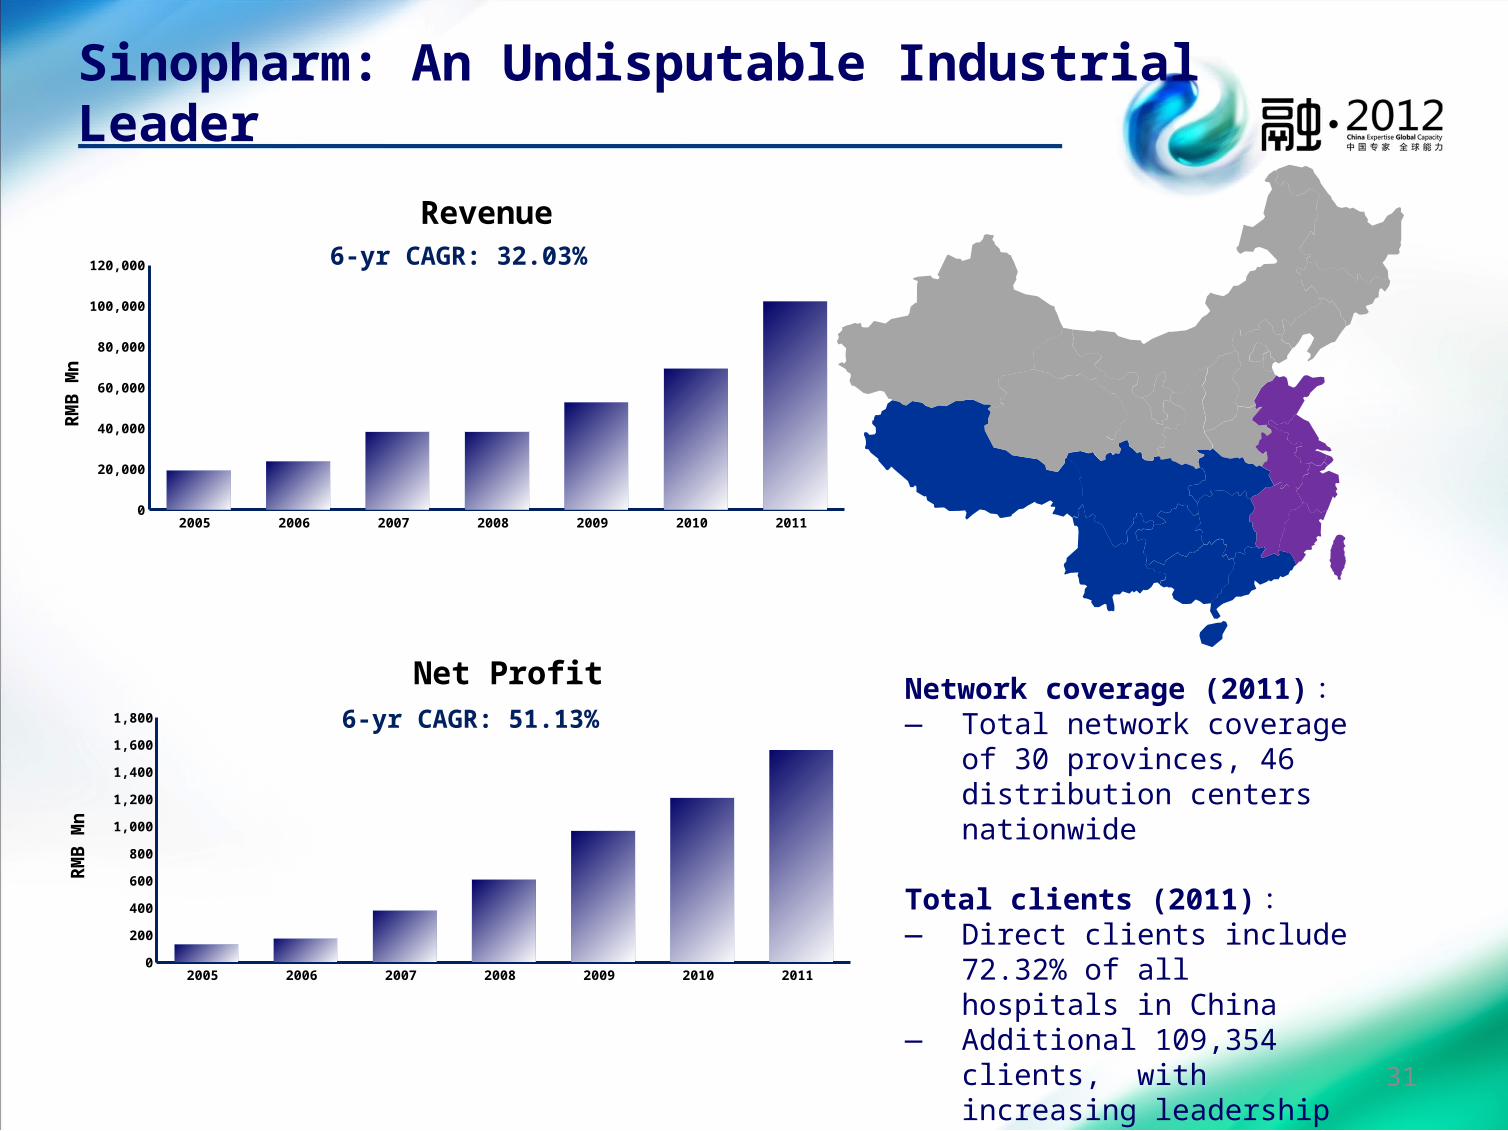
Network coverage (2011):― Total network coverage of 30
provinces, 46 distribution centers nationwide
Total clients (2011):― Direct clients include 72.32% of
all hospitals in China― Additional 109,354 clients, with
increasing leadership gap
Sinopharm: An Undisputable Industrial Leader
6-yr CAGR: 32.03%
6-yr CAGR: 51.13%
2005 2006 2007 2008 2009 2010 2011 0
20,000
40,000
60,000
80,000
100,000
120,000
Revenue
RMB
Mn
2005 2006 2007 2008 2009 2010 2011 0
200
400
600
800
1,000
1,200
1,400
1,600
1,800
Net Profit
RMB
Mn
31

Shanghai
14%
Bei j i ng
2%
Yangt z Ri ver
23%
Nor t her n Ci t i es
12%
Mi d- West er n
Ci t i es
49%
Forte: A Nationwide Property Developer
Region Attributable GFA (‘000 sq.m.)
Shanghai 1,457
Cities in Jiang Su and Zhe Jiang provinces 2,458
Mid western cities 4,599
Northern citis 2,602
Hainan 52
Total 11,168
2005 2006 2007 2008 2009 2010 20110
200
400
600
800
1,000
1,200
1,400
1,600
1,800
2,000
Net Profit
RMB
Mn
32
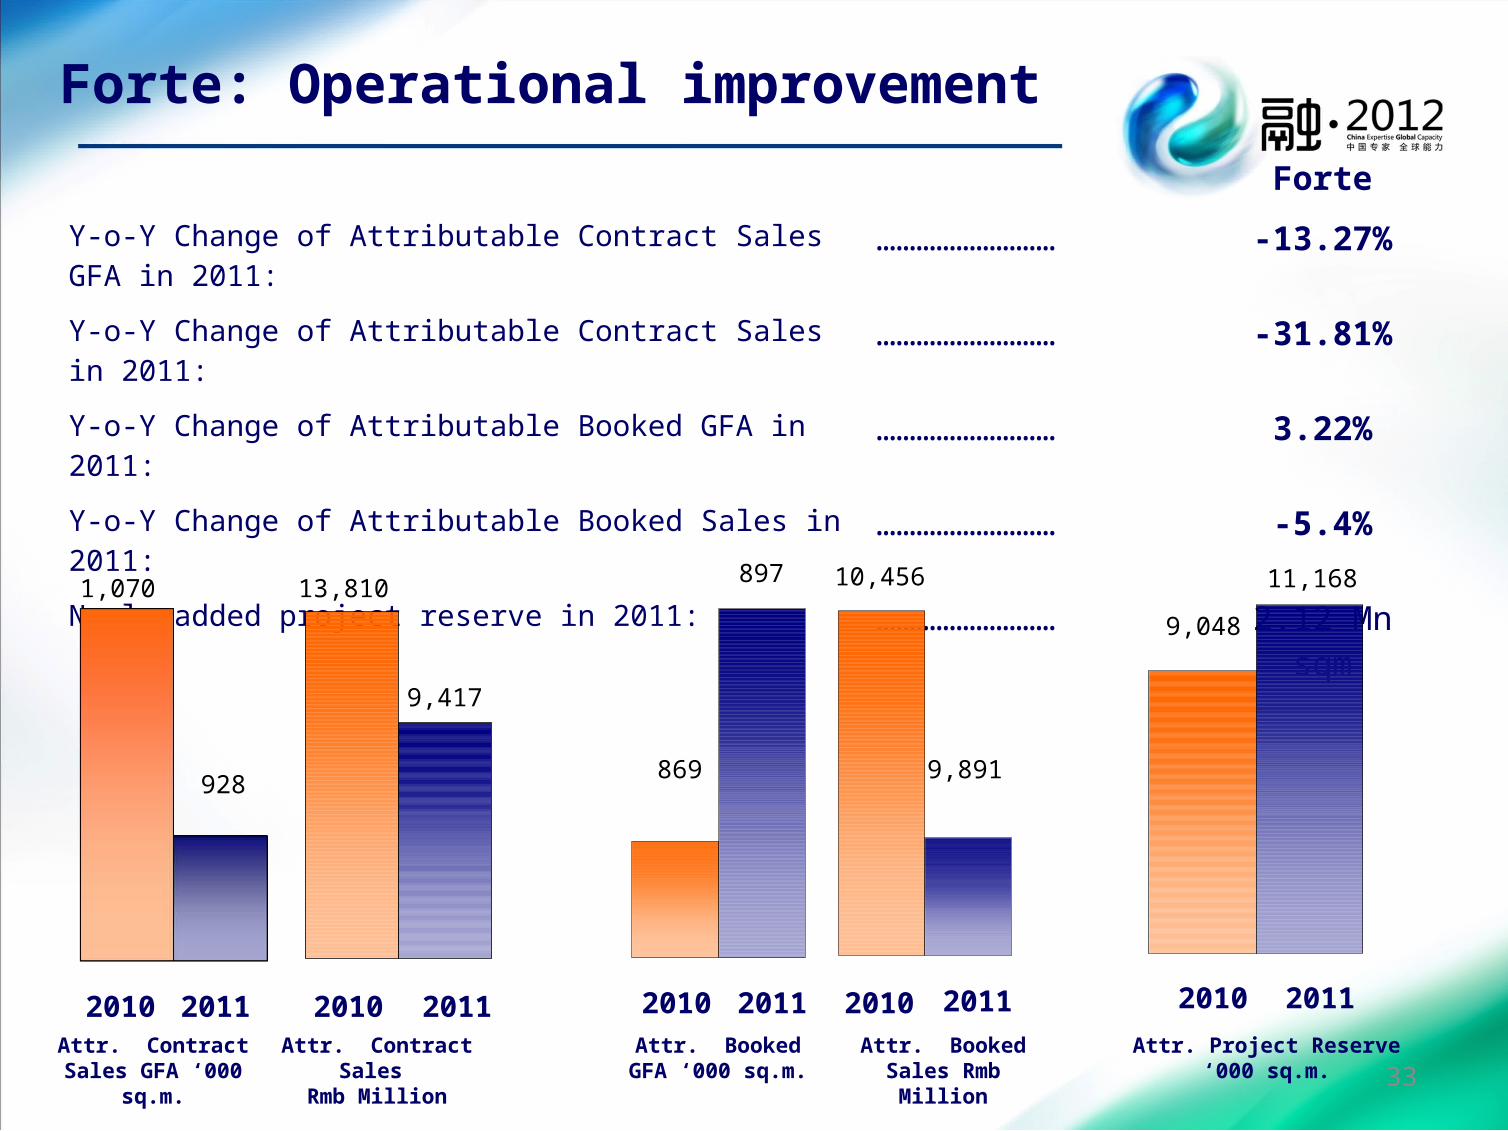
Forte
Y-o-Y Change of Attributable Contract Sales GFA in 2011: ……………………… -13.27%
Y-o-Y Change of Attributable Contract Sales in 2011: ……………………… -31.81%
Y-o-Y Change of Attributable Booked GFA in 2011: ……………………… 3.22%
Y-o-Y Change of Attributable Booked Sales in 2011: ……………………… -5.4%
Newly added project reserve in 2011: ……………………… 2.12 Mn sqm
Forte: Operational improvement
Attr. Contract Sales GFA ‘000 sq.m.
Attr. Contract Sales
Rmb Million
Attr. Booked GFA ‘000 sq.m.
Attr. Booked Sales Rmb Million
Attr. Project Reserve‘000 sq.m.
2010 2011 2010 2011 2010 2011 2010 2011 2010 2011
13,810
9,417
10,456
9,891
1,070
869
897
9,048
11,168
928
33

NISCO:To become the manufacturing base for premium medium and heavy plates and special qualified bars and wire rods.
NISCO: China’s Leading Steel Enterprise
Overview of current product portfolioSteel Sheet Bar Shape Steel
―Ship Plate―Low Alloy Plate―Bridge Plate―Pressure Vessel Plate
―Round Steel―Deformed Steel Bar―Bearing Bar―Tube
―Spherical―L-Angle Steel―Unequal Angle Steel……
…… ……Band Steel Wire Rod
―Band Steel Q345 etc―Spring Steel Strip―Steel for Special Purposes……
―General Line―High Carbon Wire―Alloy Welded Steel……
34

RMB/ton 2011 2010 change
ASP of steel products ………………………… 4,699 4,202 12%
Average purchasing cost of iron ore ………………………… 1,190 962 24%
Average purchasing cost of coking coal ………………………… 1,460 1,350 8%
Competitive strength:
― One of China’s most efficient steel makers
― High product quality
― Technology-led development
― Upstream industry integration
― One-stop customer service
― Synergy from mining business
― Responsible and accountable
NISCO: China’s Leading Steel Enterprise
Prices of steel products and raw materials
Note:1. Our subsidiary Nanjing Steel United (NSU) completed overall listing of steel-related assets in October 2010. In the chart above, figures prior to
September (including September) 2010 are attributable historical figures from NSU. Figures after September 2010 are the attributable figures of NISCO after completion of asset restructure.
2005 2006 2007 2008 2009 2010 20110
200
400
600
800
1,000
Output
10,0
00 T
on
35
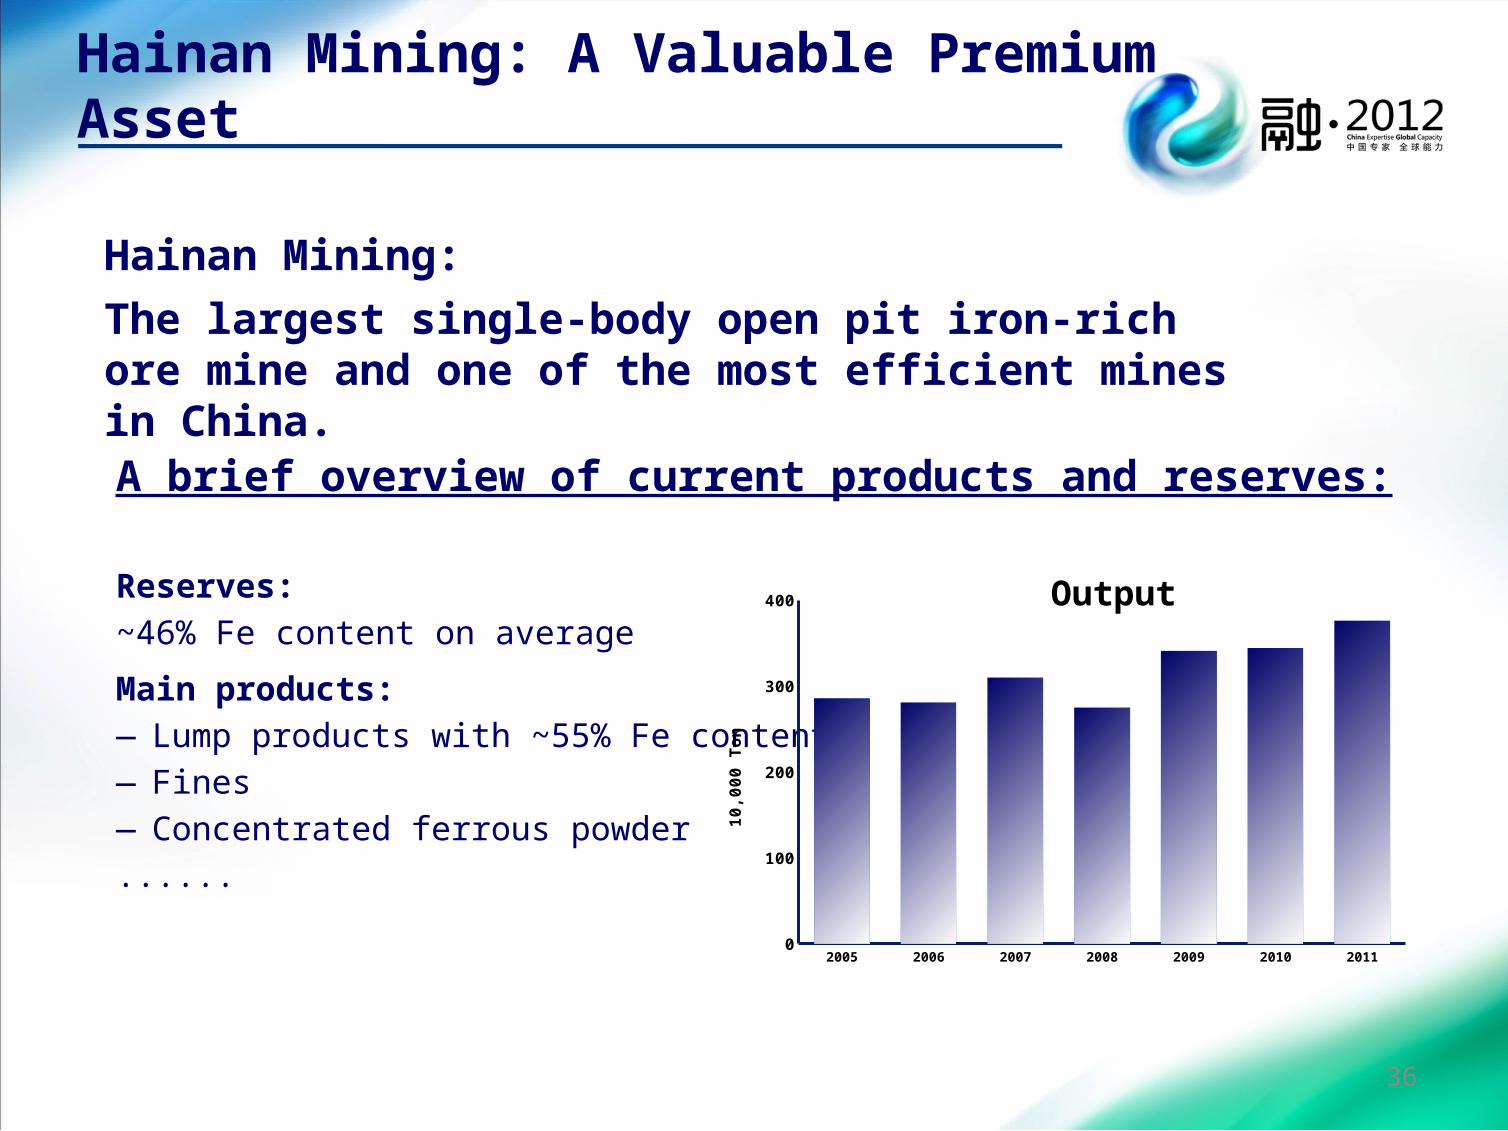
A brief overview of current products and reserves:
Reserves:
~46% Fe content on average
Main products:
―Lump products with ~55% Fe content
―Fines
―Concentrated ferrous powder
......
Hainan Mining:
The largest single-body open pit iron-rich ore mine and one of the most efficient mines in China.
Hainan Mining: A Valuable Premium Asset
2005 2006 2007 2008 2009 2010 20110
100
200
300
400Output
10,0
00 T
on
36
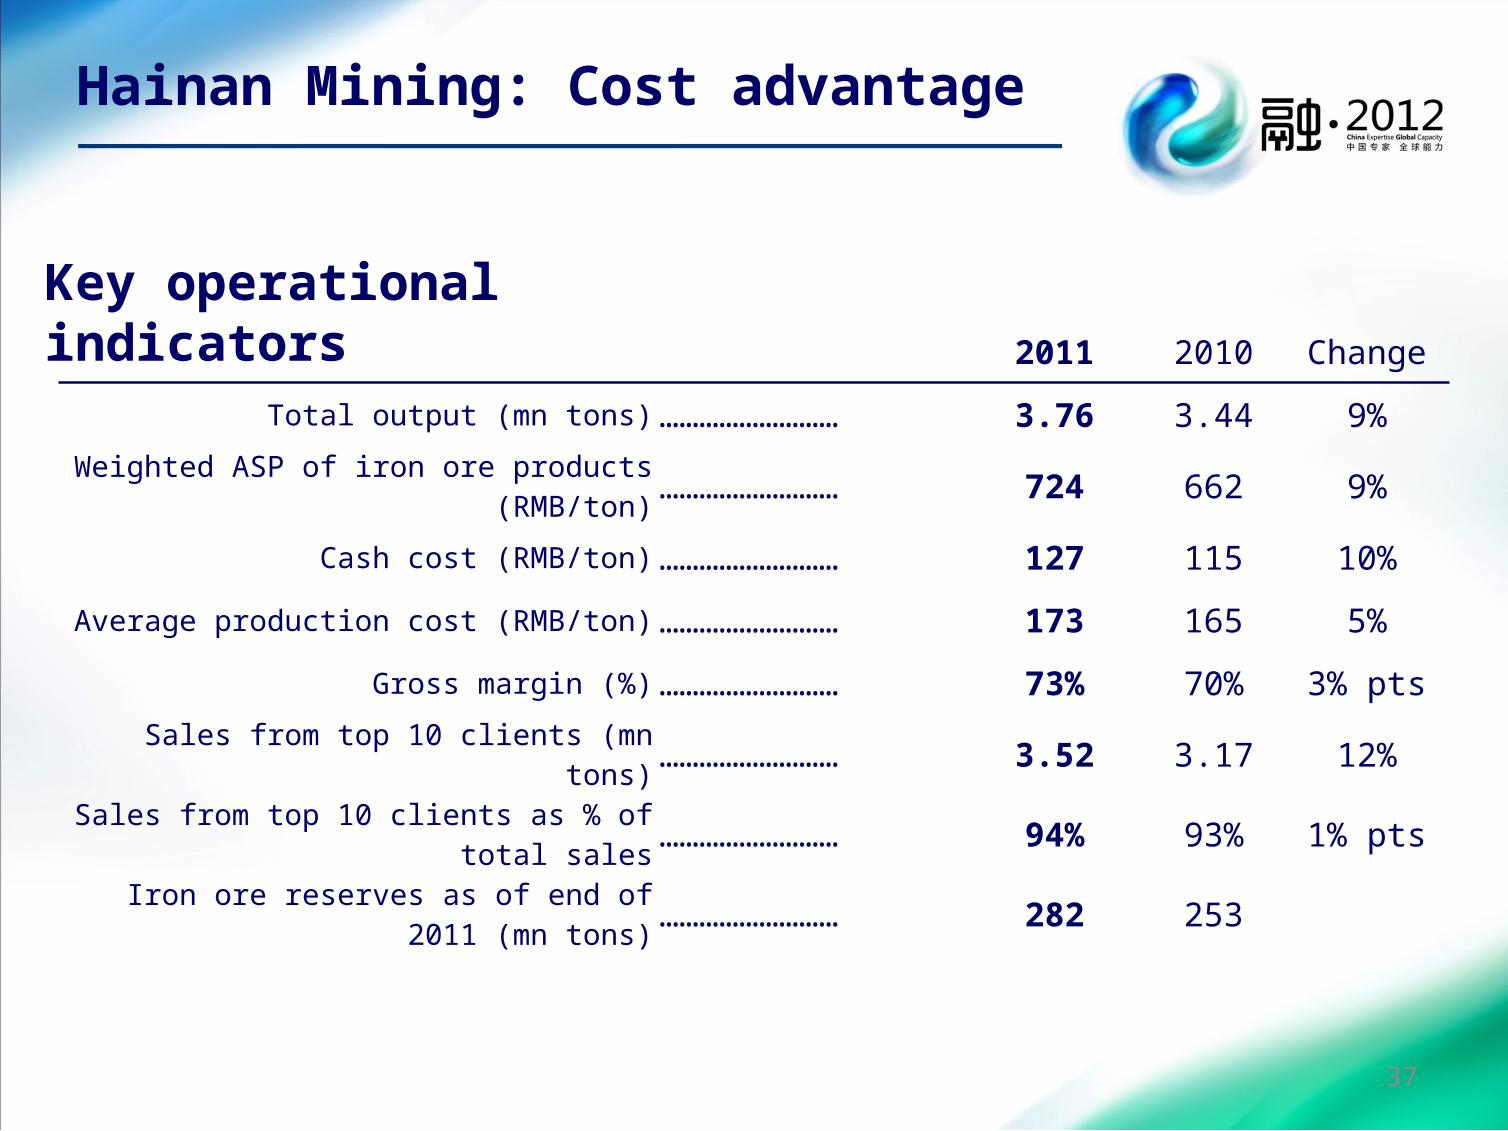
2011 2010 Change
Total output (mn tons) ……………………… 3.76 3.44 9%
Weighted ASP of iron ore products (RMB/ton) ……………………… 724 662 9%
Cash cost (RMB/ton) ……………………… 127 115 10%
Average production cost (RMB/ton) ……………………… 173 165 5%
Gross margin (%) ……………………… 73% 70% 3% pts
Sales from top 10 clients (mn tons) ……………………… 3.52 3.17 12%
Sales from top 10 clients as % of total sales ……………………… 94% 93% 1% pts
Iron ore reserves as of end of 2011 (mn tons) ……………………… 282 253
Key operational indicators
Hainan Mining: Cost advantage
37
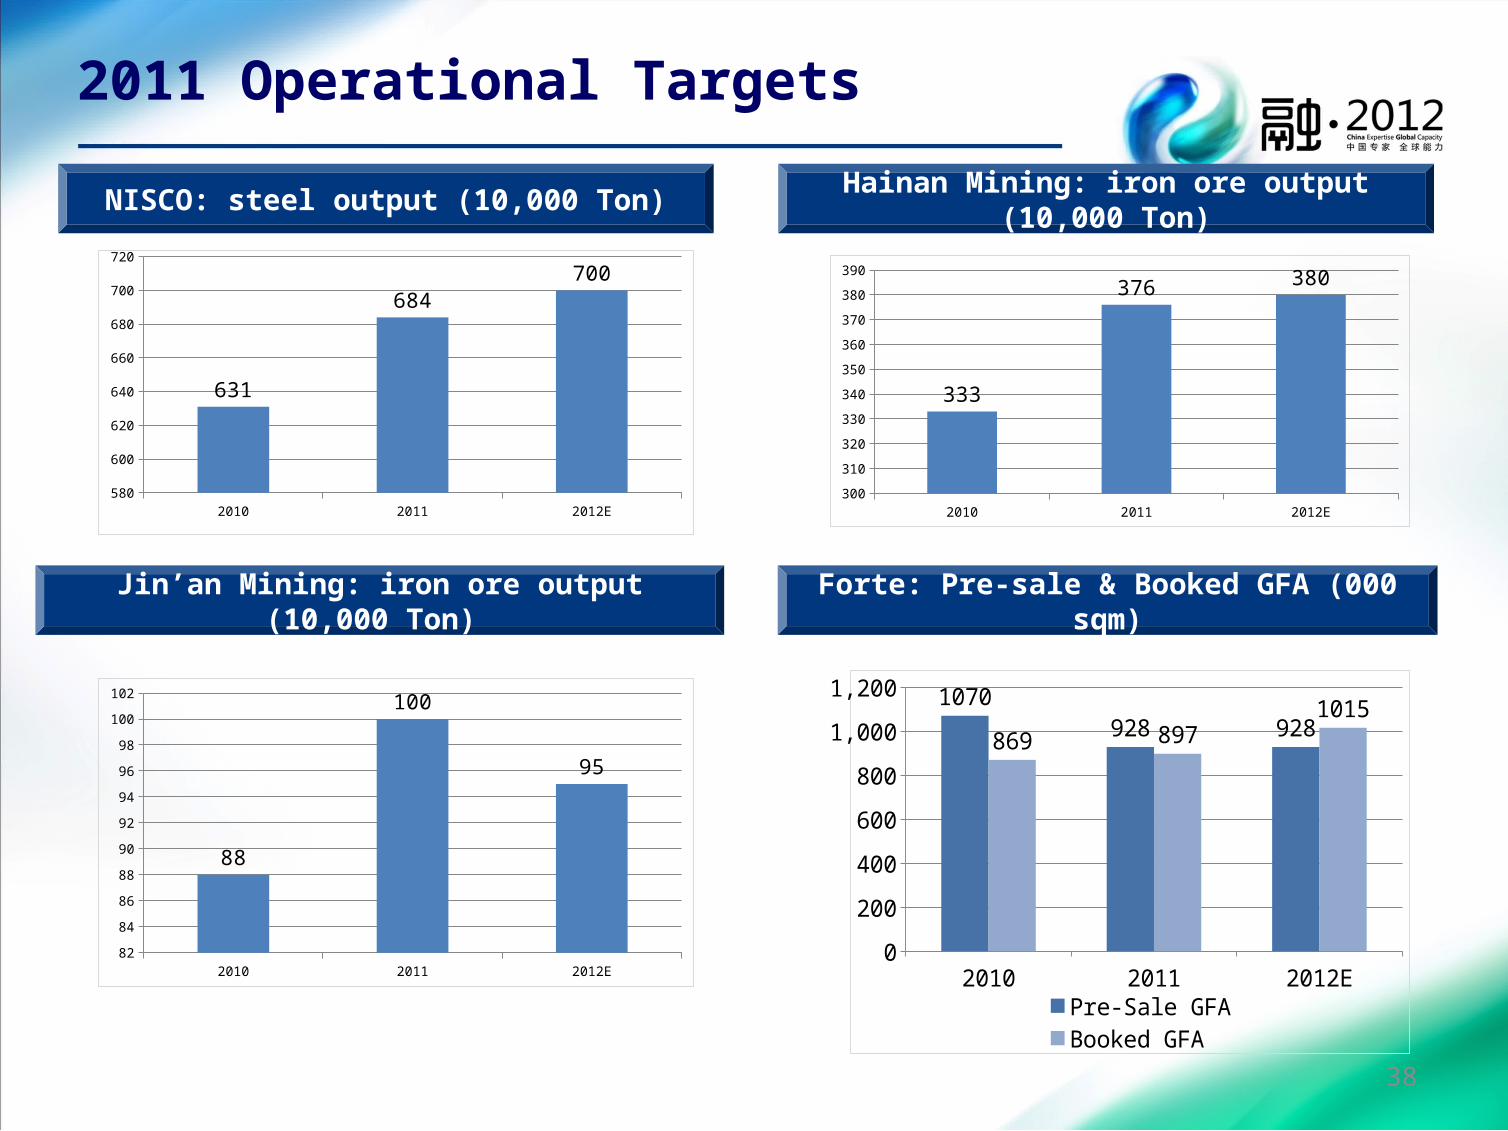
NISCO: steel output (10,000 Ton) Hainan Mining: iron ore output (10,000 Ton)
Jin’an Mining: iron ore output (10,000 Ton) Forte: Pre-sale & Booked GFA (000 sqm)
2011 Operational Targets
2010 2011 2012E580
600
620
640
660
680
700
720
631
684700
2010 2011 2012E300
310
320
330
340
350
360
370
380
390
333
376 380
2010 2011 2012E0
200
400
600
800
1,000
1,200 1070928 928869 897
1015
Pre-Sale GFA Booked GFA
2010 2011 2012E82
84
86
88
90
92
94
96
98
100
102
88
100
95
38