FORT PIERCE UTILITIES AUTHORITY · Muscular Dystrophy Association St. Lucie County Fair Association...
103
Transcript of FORT PIERCE UTILITIES AUTHORITY · Muscular Dystrophy Association St. Lucie County Fair Association...

FORT PIERCE UTILITIES AUTHORITY A Component Unit of the City of Fort Pierce, Florida
COMPREHENSIVE ANNUAL FINANCIAL REPORT For the Fiscal Year Ended September 30, 2016
Prepared by Department of Finance
Nina B. Penick, CPA Director of Financial Services
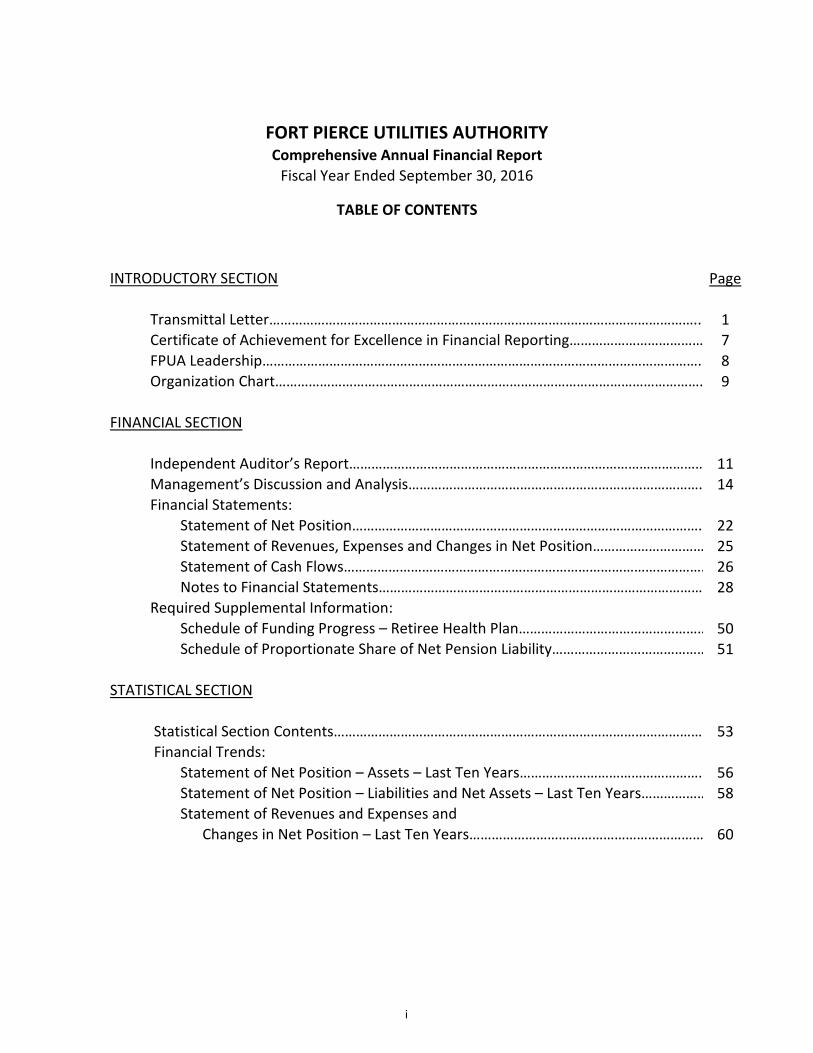
FORT PIERCE UTILITIES AUTHORITY Comprehensive Annual Financial Report
Fiscal Year Ended September 30, 2016
TABLE OF CONTENTS
INTRODUCTORY SECTION Page
Transmittal Letter…………………………………………………………………………………………………….. 1
Certificate of Achievement for Excellence in Financial Reporting……………………………… 7
FPUA Leadership………………………………………………………………………………………………………. 8
Organization Chart……………………………………………………………………………………………………. 9
FINANCIAL SECTION
Independent Auditor’s Report…………………………………………………………………………………… 11
Financial Statements:
Required Supplemental Information:
Management’s Discussion and Analysis……………………………………………………………………. 14
Statement of Net Position…………………………………………………………………………………… 22
Statement of Revenues, Expenses and Changes in Net Position………………………… 25
Statement of Cash Flows……………………………………………………………………………………… 26
Notes to Financial Statements……………………………………………………………………………… 28
Schedule of Funding Progress – Retiree Health Plan…………………………………………… 50
Schedule of Proportionate Share of Net Pension Liability…………………………………… 51
STATISTICAL SECTION
Statistical Section Contents……………………………………………………………………………………… 53
Financial Trends:
Statement of Revenues and Expenses and
Statement of Net Position – Assets – Last Ten Years…………………………………………… 56
Statement of Net Position – Liabilities and Net Assets – Last Ten Years……………… 58
Changes in Net Position – Last Ten Years……………………………………………………… 60
i
FORT PIERCE UTILITIES AUTHORITY Comprehensive Annual Financial Report
Fiscal Year Ended September 30, 2016
TABLE OF CONTENTS
STATISTICAL SECTION (continued) Page
Revenue Capacity:
Average Number of Services Billed by System – Last Ten Years…………………………… 65
Debt Capacity:
Demographic and Economic Information:
Operating Information:
Operating Revenues by System – Last Ten Years………………………………………………… 66
Unit Sales by System – Last Ten Years………………………………………………………………… 68
Ten Year Rate Analysis – Residential Rates………………………………………………………… 70
Average Monthly Residential Bill (Chart) – Last Ten Years………………………………….. 71
System Rate Increases – Last Ten Years……………………………………………………………… 72
Ratios of Outstanding Debt by Type – Last Ten Years………………………………………… 74
Principal Payments Payable on All Debt Issues Through Fiscal Year 2030…………… 75
Computation of Debt Service Coverage – Last Ten Years…………………………………… 76
Legal Debt Margin Information…………………………………………………………………………… 77
Demographic and Economic Information – Last Ten Years………………………………… 80
Principal Employers……………………………………………………………………………………………… 81
Expenses by System – Last Ten Years…………………………………………………………………… 84
Performance Indicators – Last Ten Years……………………………………………………………… 86
Electric Energy Sources, Water and Wastewater Statistics – Last Ten Years………… 88
Authorized Full Time Positions by Department – Last Ten Years………………………… 90
Ten Largest Customers – Fiscal Year 2016…………………………………………………………… 92
COMPLIANCE SECTION
Report on Internal Control Over Financial Reporting and on Compliance and Other
Matters Based on an Audit of Financial Statements Performed in Accordance
With Government Auditing Standards………………………………………………………………… 93
ii

TeamUA - Over 2,700
MARY R ADAMS
JAMES D ADAMS
DALBERT LEE ALEXANDER
CHARLES ALFORD
KATHARINE ANNE ALFORD
WILLIAM A ANDERSON
TINA ATTEY
ROBERT G AUSTIN
ANDREW AVERS
CHRISTOPHER A BACK
MAURICE BACON
JEFFREY W BAKER
RAUL L BARRERA
JAMES PATRICK BARRY
RYAN D BASTINE
LORI L BATTIPAGLIA
MEREDITH L BENNETT
KARYL RENEE BERTRAM
LORI BIANCO
JO-ANN BILYK
QUINN RIELLY BINFORD
MARCUS E BOECKEL
S LANCE BRICK
NOAH BENJAMIN BRODE
DANIEL BROLMANN
WILLIAM BROOKS
ROGER CLAUDE BROWN
MELISSA R BRUNO
KIMBERLY BUCHHOLZ
CANDACE HINZE BUCZINSKY
VICTOR JOSEPH BURRIS
ANDREW D BYRD
JOSHUA CALANDRO
JOHN C CANARD
DADE CORY CAPPAR
JAMES CARNES
GLYNDA W CAVALCANTI
MICHAEL CHATMAN
MICHAEL PAUL CHIDGEY
JAVIER CISNEROS
LINDA CLARK
ANDRE DENELL CLEVELAND
LEE ROY COMBS
WILLIAM CONAVAY
CHARLES D CONNELL
BRETT D CORBETT
FRANK COX
CRAIG A CRAWFORD
WILBURN L CRAWFORD
JONATHAN D CRUMBLEY
CHRISTOPHER CRUMBLEY
JENNIFFER CUEVAS FERMIN
ROBYN CURLEY
MICHAEL W CURRID
THOMAS M DAROZA
ALDONIO DASILVA
ROBERT P DAVIS
JOEL DAVIS
LUGEY DAWSON
RAE LYNN DE BOER
D WAYNE DEARMAN
DANIEL DEIULIO
JAMES SEAN DENMAN
SCOTT DENNIS
OWEN A DENNIS
GARY DEPASTINO
ANDREW J. DIGIACOMO
SEDDRICK LEVONE DIXON
CHARLES A DONNON
THOMAS A DRISKELL
JASON D DROST
PETER DUNCAN
SCOTT DYKEMA
JASON A ERWIN
ROBERT R ESCHMANN
STEVEN SCOTT FERGUSON
JULIO V FIGUEROA
DENISE E FOUNTAIN
SHARI G FRANCO
MARY C FRIER
THOMAS A FRYAR
NORIEL FUMERO
JOSEPH MICHAEL FUORE
SHERRY L FURGERSON
FREDERICK C GADDIS
STEVEN F GATINS
BARBARA J GIBSON
MICHAEL R GIFT
PATRICK E GILLESPIE
GARY J GILLETTE
KEVIN GILLETTE
PATRICIA L GILSINAN
JOSEPH T GILSON
GARY K GLANCY
MICHAEL GOLDSMITH
SONIA V GOMEZ
ANTONIO GONZALEZ
WILLIAM GOODWIN
MICHAEL GORDON
CROSBY GORE
RONALD L HAGWOOD
GEORGE R HALL
DIANE HARRIS
MICHELE S HARRIS
JAMES E HARRIS
GORDON E HAYMAN
STEVE HERDEMAN
ADAM R HOFFER
JASON VAN HOFFMAN
ESTELA Q HOLMAN
KYLE HOLMAN
DEWEY W HUDMAN
LINDA HUDSON
TIMOTHY J HUGHES
LESTER C HUMMEL
BOWDOIN G HUTCHINSON
MARCUS T JACKSON
EDDIE LEWIS JACKSON
PAUL A JAKUBCZAK
SIDNEY L JERGER
SIDNEY LEVON JERGER
CAROL JOHNSON
CHONTAE L JOHNSON
CHRISTOPHER JOHNSON
ANA MARIA JOHNSON
TERRY RODNEY JOHNSON
MICHAEL D JONES
ROBERT JONES
WILLIAM R KAEFF
TERRY L KECK
ADAM KEE
MARTHA ANNE KERR
iii

Years of Dedicated Service
EUGENE D KNIGHT
MARK KOBBE
JENNIFER KRIP
KUPER KRUEGER
ALICE M LADOMIRAK
PAUL LAGUERRE
JOSEPH L LAMMERS
DONALD T. E. LANDIN
DOMINIC F LANE
EDWARD S LEONGOMEZ
JOHN RICHARD LILLY
CLAYTON W LINDSTROM
ERIN B LOMAX
THELMA PATRICIA LOPEZ
SCOTT LOVEN
PAUL C LUGARA
ALAN LUNA
PAUL L MADSEN
WANDA MAGNUSON
WILLIAM H MAIN
TAMMY R MALIN
GLEN P MANCHESTER
FRED MANN
LAURIE ANN MARTIN
MICHAEL J MARTIN
MELISSA MARTIN
FLORINDA K MAZZARELLA
TOMMIE V MC CARTHY
NANCY L MC CONKEY
TERRANCE MC MILLON
KEVIN SERON MCDONALD
DANIEL MCKINLEY
JOHN W MCMILLIAN
STONEY X MCPEEK
BARBARA A MIKA
GEORGE E MILLER
JOSHUA J MILLER
JASON M MITTLER
REGINA D MORRIS
KENNETH JERROD MORRIS
LARRY MIKEL MORRISON
STEVEN MOSELY
MICHAEL J MULVANEY
STEVEN MURTO
CHRISTELLE MYRICK
RUFUS NELSON
DINO G NESSELRODE
WILLIAM D NORTON
KIMBERLY E OKUBO
PAUL JOHN OLEKOSKI
SHANNON ONDERLINDE
JOHNNY ORTIZ
SHANE OSTRANDER
NANCY J PALKA
THOMAS E PARKER
SHELIA LAVERNE PARNELL
KEVIN W PARRISH
EDWARD L PATRICK
DARIN PATTERSON
ERIC PEARSON OLIVO
NINA B PENICK
MICHAEL A PERRI
RICHARD G PETERSEN
RONNIE PREBILSKY
TONY TREAYMAN PRICE
QUINCY ALLEN PRICE
JOSHUA ORMOND PRINE
DOUGLAS A PUPARD
CHARLES D PUTNAM
FRANCISCO RAMOS
STEPHANIE RAULERSON
J KEVIN RHODEN
TIMOTHY W RICHARDS
EDWIN RICHBERG
HEATHER MARIE RICUCCI
ROBERTO S RIGUAL
TESSA KATHLEEN ROBERTS
WILLIAM ROLLE
DAVION LEON ROLLE
SAMANTHA ROWLAND
VALERIE A SCHULTE
SAL ANTHONY SCIMECA
JOHN M SHEPPARD
HARRY SHERVA
JOSHUA SHOLANDER
JACK R SHONK
DONNA SHURR
CARMELO SIGNORELLI
STERLING R SIMMONS
IRA SINGH
VALENTIME C SIRMONS
JULIE Z SIZEMORE
SHAWN SMITH
EILEEN SNOBERGER
CIRO E SOTELO
JOEL SPADES
CHARLES J STANG
ANGELA M STEPHENS
BRIAN KEITH STEPHENS
KURTIS D STRAND
CHARLES S SWINDLE
TONYA LYNN TARDIF
WILLIAM TAYLOR
KIMBERLY L TAYLOR
DEBRA THERIAULT
MARY E THOMAS
DARRYL R THOMAS-BEY
JOSEPH ROBERT TIETZ
DANIEL D TILLMAN
THELMA TIPTON
NICOLE HONESTY TIPTON
JOHN K TOMPECK
LARRY W TYNDALL
MASON TERRELL URSO
OSVALDO VALDES
LOUDWIN VASQUEZ
ROBERT W VAUGHN
CHRISTOPHER VELARDO
EVELYN I WALKER
KARISSA NASTASHIA WARE
PETER WICINSKI
JUDITH ANN WIDMAYER
EDMOND WILLIAMS
STACEY WILLIAMS
ESTELA M WILSON
OLIVER C WINT
ERIC R WINTERSTEIN
LOIS A WOLFE
SHARON WOLKOWICZ
iv
Fort Pierce Utilities Authority "To provide our customers with economical, reliable and friendly service
Fort Pierce Utilities Authority employees have “enhanced the quality of life in our
2-1-1 Treasure Coast Early Learning Coalition
4-H St. Lucie County Elks Little League Field
Agape Senior Citizen Recreational Center Engineering Ministries International
Alzheimer's Community Care Exchange Club
American Cancer Society Family Fun Day Lawnwood Stadium
American Diabetes Association Family Meals
American Legion Florida Army National Guard
American Red Cross Florida's Blood Centers
Angel Food Ministries Florida Engineering Society
ARC of St. Lucie County Florida March of Dimes Foundation
ASA Girls Fast Pitch Softball Florida Water Environment Assoc. (FWEA)
Backus Gallery Food for Families
Bat and Ball Club of St. Lucie County Girl Scouts of the USA
Big Brothers/Big Sisters Great American Cleanup
BlueBird Educational Foundation Green Committee
Bowling for Kids Sake Groovin' & Tastin'
Boys & Girls Club of St. Lucie County H.A.N.D.S.
Boy Scouts of America Habitat for Humanity
Calvary Chapel Harvest Food & Outreach Center
C.A.S.T.L.E. Healthy Start Coalition of St. Lucie County
Children Home Society's WaveCREST Heathcote Botanical Gardens
Shelter Hibiscus Children's Center
Children's Miracle Network Highwaymen
Children's Servics Council Hospice of the Treasure Coast
Christ Family Church Jack and Jill of America
Club Utilitas, Inc. Teen Center Kids Crossing Playground Build
Common Ground Vineyard Church Kids at Hope
Conservation Alliance of SLC Kiwanis Clubs
Council On Aging of St. Lucie County Knights of Columbus
Deaf & Hard of Hearing Services of the TC Leadership Saint Lucie
Dogs & Cats Forever Life Builders of the TC
Downtown Business Association Lincoln Park Main Street
Drug Abuse Treatment Main Street Fort Pierce
Association, Inc. (DATA) Marine Corp League
v

Mission Statement in a continuous effort to enhance the quality of life in our community"
community" by contributing their time and service to the following organizations:
Manatee Observation and Education St. Lucie County Chamber
Center (MOEC) St. Lucie County School Board
Moore's Creek Clean Up St. Lucie County Economic
Multicultural Resource Center Development Council
Muscular Dystrophy Association St. Lucie County Fair Association
Mustard Seed Ministries St. Lucie County Harbor Advisory Committee
Nature Fest St. Lucie County Harbor Advisory
Navy UDT-SEAL Museum Committee
Northside Bat and Ball Club St. Lucie County Human Resources
Oxbow Eco-Center Association
Oyster Fest St. Lucie County Schools
PACE Center for Girls, TC St. Lucie County Sheriff
Parent Academy St. Lucie County Toys for Tots
Pilot Club of Fort Pierce St. Lucie Panthers Softball Organization
Police Athletic League (PAL) Sea-Life Habitat Improvement Project
Port St. Lucie Athletic Association Southwestern Port St. Lucie Little League
Port St. Lucie American Little League Susan G Komen - Strides Against Breast Cancer
Port St. Lucie National Little League The Parent Academy
Port St. Lucie Police Department The Royal Palms of St. Lucie
Port St. Lucie Power Squadron The Van Duzer Foundation
Pregnancy Resources The Worship Center International Ministries
Relay for Life Toastmasters International
Restoring the Village Treasure Coast Blood Bank
Rotary Clubs Treasure Coast Education & Research
Roundtable of St. Lucie County Development
Safe Space of St Lucie Treasure Coast Environmental
SAFER SLC Education Council
Saint James Christian Academy Treasure Coast Food Bank
Salvation Army Christmas Angels Treasure Coast Manatee Foundation
Sandy Shoe Festival Treasure Coast Renegades Youth Football
Sarah's Kitchen Treasure Coast Waterway Clean Up
Save Our Children Tri County Animal Hospital
Save the Chimps United Way of St. Lucie County
St. Jude Children's Research Hospital Winners Walk Tall
vi

500 Boston Avenue (34950) PO Box 3191, Fort Pierce , FL 34948
R1:1 Reliable Public • Power Provider
"Committed to Quality'
Phone: 772.466.1600, Ext. 3298 Fax:: 772.467.2504
Director of Financial Services
March 15, 2017
Board Members Fort Pierce Utilities Authority
The Comprehensive Annual Financial Report (CAFR) of Fort Pierce Utilities Authority (FPUA) for the fiscal year ended September 30, 2016, is submitted herewith pursuant to the City of Fort Pierce Charter, Article XII, Section 176 (12) and the bond covenants of FPUA’s outstanding revenue bonds.
Management assumes full responsibility for the completeness and reliability of the information contained in this report, based upon a comprehensive framework of internal control it has established for this purpose. Because the cost of internal control should not exceed anticipated benefits, the objective is to provide reasonable, rather than absolute, assurance the financial statements are free of any material misstatements.
DiBartolomeo, McBee, Hartley & Barnes, P.A., Certified Public Accountants, have issued an unqualified (“clean”) opinion on FPUA’s financial statements for the fiscal year ended September 30, 2016. The independent auditor’s report is located at the front of the financial section of this report.
Management’s Discussion and Analysis (MD&A) immediately follows the independent auditor’s report and provides a narrative introduction, overview, and analysis of the basic financial statements. MD&A complements this letter of transmittal and should be read in conjunction with it.
FPUA PROFILE
FPUA was established in accordance with provisions of the City Charter, confirmed by an election held on May 30, 1972. The City Charter, Article XII, Section 169, states that FPUA shall be responsible for the development, production, purchase, distribution, and collection of all electricity, water, wastewater, natural gas, and such other utility services as may be designated by resolution by the City Commission. FPUA is a component unit of the City of Fort Pierce, Florida and this report includes all systems of FPUA. This report does not include the financial activities of the City of Fort Pierce. Reference should be made to the City’s report published separately.
www.fpua.com
Our mission is to provide our customers with economical, reliable and friendly service
in a continuous effort to enhance the quality of life in our community.
The FPUA Board consists of five members, one of whom is the Mayor-Commissioner of the City, who serves on the Board as long as he or she holds such office. The other four members are appointed by the City Commission for four-year overlapping terms, limited to two consecutive terms of office.
The Electric, Water, Wastewater, and Gas Utility Systems, Manatee Observation and Education Center (MOEC), and FPUAnet Communications are managed and operated for the City by FPUA. FPUA also operates the Treasure Coast Energy Center (TCEC) for the Florida Municipal Power Agency (FMPA) on a contract basis, utilizing FPUA employees.
The Electric System serves the City of Fort Pierce and the immediately surrounding area, encompassing approximately 35 square miles, with an average of 28,299 services billed during the fiscal year ended September 30, 2016. FPUA currently has 16 miles of 69kV and 7.5 miles of 138kV transmission lines. The 69kV lines interconnect six sub-transmission substations and the 138kV lines connect two transmission substations to FPL and the City of Vero Beach. FPUA and the City of Vero Beach jointly own the 138kV line from Emerson Substation to County Line Substation. FPUA primary distribution has approximately 266 miles of overhead and 151 miles of underground cable which operates at 13.2kV. FPUA and FPL have a territorial agreement approved by the Florida Public Service Commission.
On December 16, 1997, FPUA agreed to participate in the FMPA All-Requirements Power Supply Project (ARP). In doing so, FPUA is one of 13 municipally owned utilities in the ARP. The principal benefits of ARP are:
1. Lower operating costs through utilization of the most efficient generation available. 2. Future generation will be planned for the collective systems, as needed, by FMPA. 3. Economies of scale in operating, planning, and financing. 4. Lower risk with more units and more cities working together.
As of January 1, 1998, FPUA assigned its resources to the ARP and agreed to purchase its total power requirements from the ARP. FPUA’s resources, which have been assigned, include the contracts with FMPA related to Stanton Unit No. 1 (Stanton and Tri-City Projects) and Stanton Unit No. 2. The contracts related to the St. Lucie Nuclear Project have not been assigned.
The Water System serves the City of Fort Pierce and the immediately surrounding area, encompassing approximately 32 square miles, with an average of 20,079 services billed during the fiscal year ended September 30, 2016. Water supply is obtained from 36 surficial aquifer wells (shallow) and 11 Floridan aquifer wells (deep). FPUA currently has a Water Use Permit from the South Florida Water Management District to withdraw an annual daily average not to exceed 21.13 million gallons of ground water. Treatment of the raw ground water is presently accomplished through a 20 million gallons per day (MGD) conventional Lime Softening Water Treatment Plant and a 10.3 MGD Reverse Osmosis Water Treatment Plant. FPUA owns and operates a 13.3 MGD air stripping system which services the lime-softening portion of FPUA's Water Treatment Facility. FPUA meets all federal and state drinking water standards. FPUA has 9 million gallons of storage capacity. The water distribution system is composed of 385 miles of water mains, remote pumping facilities, ground storage tanks, hydrants, and valves.
2
The Wastewater System serves the City of Fort Pierce and the immediately surrounding area, encompassing approximately 30 square miles, with an average of 15,069 services billed during the fiscal year ended September 30, 2016. The wastewater collection system consists of 116 lift stations, 172 miles of gravity sewer lines ranging from 4 to 48 inches in diameter, and approximately 97 miles of force mains ranging in size from 1.5 to 24 inches in diameter. The Island Water Reclamation Facility (IWRF) currently has a permitted capacity of 10 MGD for Annual Average Daily Flow and 11.5 MGD for 3-Month Annual Average Daily Flow. On December 11, 2012, the Florida Department of Environmental Protection issued the operating permit, which is anticipated to be adequate through December 10, 2017.
FPUA has one domestic deep injection well at the IWRF plant site. A pumping station injects treated effluent into the 3,300-foot deep injection well for disposal. The permit for the IWRF IW-1 well, a twenty-four inch domestic well, is currently being renewed for the next 5-year permit cycle through 2022. There are two deep injection wells located on the site of the future Mainland Water Reclamation Facility (MWRF), in the southwest corner of the service area. IW-1 is an 18-inch industrial deep injection well and IW-2 is a 24-inch domestic deep injection well. IW-1 accommodates the TCEC’s industrial wastewater stream and St. Lucie County landfill leachate, and is permitted through August 4, 2020. The IW-2 well is currently not in operation and therefore is not permitted. Both wells can be utilized for disposal of MWRF effluent when that facility is constructed.
The Gas System serves the City of Fort Pierce and the immediately surrounding area, encompassing approximately 27 square miles, with an average of 4,166 services billed during the fiscal year ended September 30, 2016. The Gas System purchases firm gas for resale through Florida Gas Utility (FGU). FGU has a contract with Florida Gas Transmission for the transportation of gas to FPUA’s system. Gas purchases are supplied by FGU under an all requirements agreement. The Gas Operations Department is responsible for the installation and maintenance of all gas mains and service lines. The department also employs a staff of qualified gas service technicians to maintain and repair customers’ natural gas appliances.
FPUAnet Communications provides high quality, state-of-the-art fiber optic and wireless communication services, including Dedicated Fiber Internet Access and Optical Fiber Links, such as Dark Fiber and Bandwidth Connections to businesses and institutions. Wireless Broadband Internet and Wireless Bandwidth Connections are offered at less cost than fiber services, for applications with less stringent requirements. As founder and leading member of the Research Coast Communications Technology Alliance, FPUAnet Communications seeks to interconnect the five-county region.
FPUA operates the Manatee Observation & Education Center (MOEC), which is located on Moore’s Creek east of Indian River Drive. MOEC’s mission is to promote understanding and responsible actions for the protection of the fragile ecosystems in the Treasure Coast Region and its inhabitants. It provides a clean and safe facility for viewing manatees and other inhabitants of the Indian River Lagoon. Over 39,257 visitors from all over the world visited the Center during fiscal year 2016. A total of 438 manatees were sighted. Volunteers provided a substantial donation to the Center with a total of 12,199 hours of volunteer time.
3
FPUA is required to prepare, adopt, and furnish a copy to the City Commission of the City of Fort Pierce an annual budget at least 45 days prior to the beginning of the next fiscal year. The annual budget and any amendments thereto shall be in effect when approved by FPUA and when any line item expense has not been disapproved by four-fifths (4/5) vote of the City Commission within 30 days of submission. The budget is prepared on the accrual basis. The budget and amendments thereto for the year ended September 30, 2016, have been approved according to the above procedures.
LOCAL ECONOMY
Fort Pierce is located on Florida’s east coast, 120 miles north of Miami and 220 miles south of Jacksonville. The estimated 2016 populations of the City of Fort Pierce and St. Lucie County were 42,489 and 292,826 respectively. Fort Pierce is the commercial center of the county, with approximately 24.5 square miles in land area. Its metropolitan area includes a transportation network comprised of Interstate 95, Florida’s Turnpike, U.S. Highway 1, State Roads 68 and 70, Florida East Coast Railway, Treasure Coast International Airport, and the Port of Fort Pierce.
FPUA’s service area includes both the area within the corporate limits of the City of Fort Pierce and the Town of St. Lucie Village, and portions of unincorporated St. Lucie County. Approximately 81% of the system revenues are derived from services provided within the City of Fort Pierce, and 19% from services provided in the Town of St. Lucie Village and unincorporated St. Lucie County.
The economy of Fort Pierce and surrounding St. Lucie County is primarily based upon government, agriculture, construction, retail and wholesale trade, light manufacturing, tourism, biotechnology, and sport and commercial fishing. There are several telemarketing service centers, commercial centers, research institutions, and a Walmart Distribution Center located in the area.
St. Lucie County continues to develop a 1,800-acre State recognized Research and Education Park in FPUA’s service territory. Florida State University has a Regional Medical School Campus located at Indian River State College, which now offers numerous Bachelor’s Degree Programs.
FPUA’s service area is developing into an educational and research center featuring the following facilities:
Indian River State College (IRSC)
Florida Atlantic University (FAU)/Harbor Branch Oceanographic Institution
Smithsonian Fort Pierce Marine Station
Smithsonian Marine Ecosystem Exhibit
U.S. Department of Agriculture/Horticultural Research Laboratory
University of Florida/Institute of Food and Agricultural Sciences (UF/IFAS) Research and Education Center
Manatee Observation and Education Center
4
The real estate market has shown some signs of improvement during fiscal year 2016. Although current development activity in the area is limited, FPUA is optimistic about growth in the long term. Even though many properties remain vacant, sales activity has picked up and some properties are being renovated and subsequently occupied. Improvements such as major roadwork, continued beautification of the downtown area, and private investment make the area attractive to new residents. Reconstruction of the City Marina outer docks damaged in the 2004 hurricanes is expected to provide an economic boost to the downtown area.
LONG-TERM FINANCIAL PLANNING AND MAJOR INITIATIVES
Rate Planning Rate sufficiency has been projected for the upcoming five years. Rate adjustments will be made in future years to ensure FPUA’s electric, water, wastewater, and natural gas utilities each generate sufficient revenue to cover their respective expenses, while maintaining a minimum 45 days of operating cash as defined by FPUA bond covenants. A power cost adjustment (PCA) and purchased gas adjustment (PGA) are adopted as needed by the FPUA Board to ensure FPUA is recovering the cost of energy, and stabilize the amounts billed to customers.
Capital Planning FPUA’s capital renewal, expansion, and improvements continue. Capital plans are projected for the upcoming five years, and are primarily driven by replacement of aging infrastructure, as well as street and highway reconstruction projects. The multiplicity of requirements by regulatory agencies increases the amount FPUA budgets for those improvements. Most replacements increase costs and provide no additional revenue, but are expected to have a positive impact on operations and maintenance expenses. Receipt of contributed capital helps fund the infrastructure needed to support growth in the future. In an effort to strategically expend FPUA’s limited resources, Department Heads meet periodically with other governmental agencies to discuss and update capital plans and coordinate implementation of those plans.
Strategic Management Planning FPUA’s Strategic Plan continues to promote communication and cooperation, and encourages increased employee involvement in achieving company goals that support FPUA’s Mission Statement:
“To provide our customers with economical, reliable, and friendly service in a continuous effort to enhance the quality of life in our community.”
Periodically, workshops are held to re-evaluate the key result areas (KRA’s) for FPUA focus, as the organization moves forward. Participants in the workshop include the FPUA Board, key FPUA staff, and members of the Fort Pierce City Commission. KRA’s and the corresponding goals and objectives most recently identified are as follows:
Improve Efficiency and Cost Effectiveness – Efforts continue toward automating workflows and eliminating redundant processes where possible. As FPUA strives to build a competitive attitude within the organization, it has been recognized that the benefits of past efforts have resulted in the ability to lower electric rates.
5
Improve Customer Education and Outreach – Regardless of the positive changes made at FPUA over recent years, public perception of the organization may not be fully aligned with reality. It is important to effectively communicate actions FPUA is taking to achieve goals associated with the mission statement. This may be accomplished by promoting community involvement through educational programs and environmental stewardship.
Increase Revenues – Although FPUA has successfully cut costs throughout the organization, staff recognizes that the same impact on the bottom line can be achieved by increasing revenues. Some areas to be considered are developing new services and products, as well as encouraging development and re-development of areas within the FPUA service territory. This will be accomplished through more aggressive marketing programs and implementation of economic development incentives.
Workforce Development – As FPUA’s workforce ages, it is critical to attract, retain and promote the most qualified employees within the organization. It is also important to improve motivation and morale as staff is continually being asked to do more with less.
AWARDS AND ACKNOWLEDGEMENTS
The Government Finance Officers Association of the United States and Canada (GFOA) awarded a Certificate of Achievement for Excellence in Financial Reporting to FPUA for its CAFR for the fiscal year ended September 30, 2015. This was the 22nd consecutive year FPUA has achieved this prestigious award. In order to be awarded a Certificate of Achievement, a governmental unit must publish an easily readable and efficiently organized CAFR that satisfies both generally accepted accounting principles and applicable program requirements.
A Certificate of Achievement for Excellence in Financial Reporting is valid for a period of one year only. However, we believe our current CAFR continues to meet the Certificate of Achievement for Excellence in Financial Reporting Program’s requirements, and it will be submitted to the GFOA to determine its eligibility for another certificate.
FPUA also received the GFOA’s Distinguished Budget Presentation Award for its annual budget document dated July 25, 2016. To qualify for the Distinguished Budget Presentation Award, FPUA’s budget document had to be judged proficient as a policy document, a financial plan, an operations guide, and a communications device.
The preparation of this report could not have been accomplished without the skill, effort, and dedication of the entire staff of FPUA’s Department of Finance. I would also like to express my thanks to the Board, the Director of Utilities, and the entire FPUA staff for their interest and support in planning and conducting the financial operations in a responsible and progressive manner.
Respectfully submitted,
Nina B. Penick, CPA Director of Financial Services
6
Government Finance Officers Association .·--··._
Certificate of Achievement for Excellenc.e~.•
in Financial Reporting
Presented to
Fort Pierce Utilities Aµthority
Florida
For its Comprehensive Annp~ Financial Report
for the Fiscal Year Endeµ
September 30, 201§
Executive Director/CEO .
rf

FPUA Leadership Board Members
Michael A. Perri, Jr. Glynda Cavalcanti, CPA Daniel M. Delulio, CPA Chairman Vice Chairman Secretary
Darryl Thomas-Bey Linda Hudson Deputy Secretary Mayor
Management Team
Clayton W. Lindstrom, P.E., Director of Utilities Paul A. Jakubczak, P.E., Director of Electric & Gas Systems
Valerie A. Schulte, P.E., Acting Director of Water/Wastewater Systems Evelyn I. Walker, Director of Shared Services
Nina B. Penick, CPA, Director of Financial Services
Counsel
R.N. Koblegard, III, Esquire
Independent Certified Public Accountants
DiBartolomeo, McBee, Hartley & Barnes
8
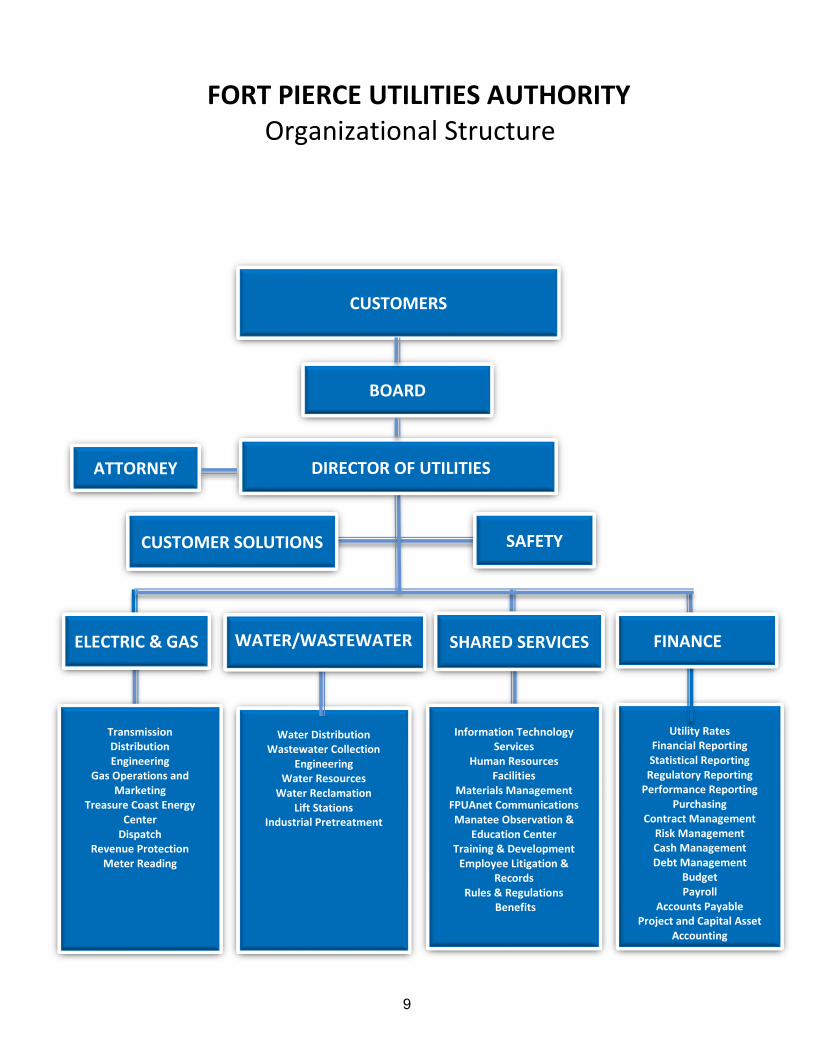
CUSTOMER SOLUTIONS SAFETY
ELECTRIC & GAS SHARED SERVICES FINANCE
DIRECTOR OF UTILITIES
WATER/WASTEWATER
ATTORNEY
FORT PIERCE UTILITIES AUTHORITY Organizational Structure
CUSTOMERS
BOARD
Transmission Distribution Engineering
Gas Operations and Marketing
Treasure Coast Energy Center
Dispatch Revenue Protection
Meter Reading
Water Distribution Wastewater Collection
Engineering Water Resources
Water Reclamation Lift Stations
Industrial Pretreatment
Information Technology Services
Human Resources Facilities
Materials Management FPUAnet Communications Manatee Observation &
Education Center Training & Development
Employee Litigation & Records
Rules & Regulations Benefits
Utility Rates Financial Reporting Statistical Reporting
Regulatory Reporting Performance Reporting
Purchasing Contract Management
Risk Management Cash Management Debt Management
Budget Payroll
Accounts Payable Project and Capital Asset
Accounting
9

INDEPENDENT AUDITOR’S REPORT
Board Members Fort Pierce Utilities Authority Fort Pierce, Florida
Report on the Financial Statements
We have audited the accompanying financial statements of Fort Pierce Utilities Authority (“FPUA”), as of and for the year ended September 30, 2016, and the related notes to the financial statements, which collectively comprise FPUA’s basic financial statements as listed in the table of contents.
Management’s Responsibility for the Financial Statements
Management is responsible for the preparation and fair presentation of these financial statements in accordance with accounting principles generally accepted in the United States of America; this includes the design, implementation, and maintenance of internal control relevant to the preparation and fair presentation of financial statements that are free from material misstatement, whether due to fraud or error.
Auditor’s Responsibility
Our responsibility is to express opinions on these financial statements based on our audit. We conducted our audit in accordance with auditing standards generally accepted in the United States of America and the standards applicable to financial audits contained in Government Auditing Standards, issued by the Comptroller General of the United States. Those standards require that we plan and perform the audit to obtain reasonable assurance about whether the financial statements are free from material misstatement.
An audit involves performing procedures to obtain audit evidence about the amounts and disclosures in the financial statements. The procedures selected depend on the auditor’s judgment, including the assessment of the risks of material misstatement of the financial statements, whether due to fraud or error. In making those risk assessments, the auditor considers internal control relevant to FPUA’s preparation and fair presentation of the financial statements in order to design audit procedures that are appropriate in the circumstances, but not for the purpose of expressing an opinion on the effectiveness of FPUA’s internal control. Accordingly, we express no such opinion. An audit also includes evaluating the appropriateness of accounting policies used and the reasonableness of significant accounting estimates made by management, as well as evaluating the overall presentation of the financial statements.
We believe that the audit evidence we have obtained is sufficient and appropriate to provide a basis for our audit opinions.
christina
LETTERHEAD

Opinions
In our opinion, the financial statements referred to above present fairly, in all material respects, the respective financial position of FPUA, as of September 30, 2016, and the respective changes in financial position and the cash flows for the year then ended in accordance with accounting principles generally accepted in the United States of America.
Other Matters
Required Supplementary Information
Accounting principles generally accepted in the United States of America require that the management’s discussion and analysis be presented to supplement the basic financial statements. Such information, although not a part of the basic financial statements, is required by the Governmental Accounting Standards Board, who considers it to be an essential part of financial reporting for placing the basic financial statements in an appropriate operational, economic, or historical context. We have applied certain limited procedures to the required supplementary information in accordance with auditing standards generally accepted in the United States of America, which consisted of inquiries of management about the methods of preparing the information and comparing the information for consistency with management’s responses to our inquiries, the basic financial statements, and other knowledge we obtained during our audit of the basic financial statements. We do not express an opinion or provide any assurance on the information because the limited procedures do not provide us with sufficient evidence to express an opinion or provide any assurance.
Other Information
The introductory and statistical sections have not been subjected to the auditing procedures applied in the audit of the basic financial statements and accordingly, we do not express an opinion or provide any assurance on them.
Other Reporting Required by Government Auditing Standards
In accordance with Government Auditing Standards, we have also issued our report dated February 23, 2017, on our consideration of FPUA’s internal control over financial reporting and on our tests of its compliance with certain provisions of laws, regulations, contracts, and grant agreements and other matters. The purpose of that report is to describe the scope of our testing of internal control over financial reporting and compliance and the results of that testing, and not to provide an opinion on internal control over financial reporting or on compliance. That report is an integral part of an audit performed in accordance with Government Auditing Standards in considering FPUA’s internal control over financial reporting and compliance.
DiBartolomeo, McBee, Hartley & Barnes, P.A. Fort Pierce, Florida February 23, 2017
christina
SIGNATURE

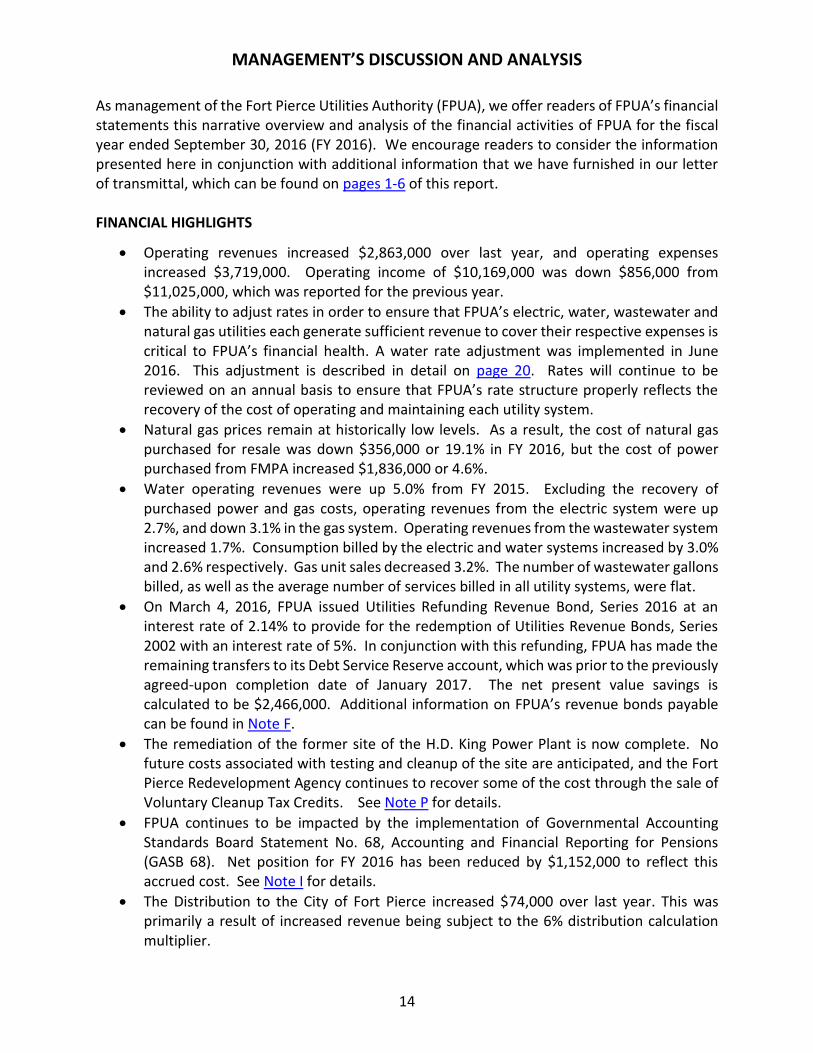
MANAGEMENT’S DISCUSSION AND ANALYSIS
As management of the Fort Pierce Utilities Authority (FPUA), we offer readers of FPUA’s financial statements this narrative overview and analysis of the financial activities of FPUA for the fiscal year ended September 30, 2016 (FY 2016). We encourage readers to consider the information presented here in conjunction with additional information that we have furnished in our letter of transmittal, which can be found on pages 1-6 of this report.
FINANCIAL HIGHLIGHTS
Operating revenues increased $2,863,000 over last year, and operating expenses increased $3,719,000. Operating income of $10,169,000 was down $856,000 from $11,025,000, which was reported for the previous year.
The ability to adjust rates in order to ensure that FPUA’s electric, water, wastewater and natural gas utilities each generate sufficient revenue to cover their respective expenses is critical to FPUA’s financial health. A water rate adjustment was implemented in June 2016. This adjustment is described in detail on page 20. Rates will continue to be reviewed on an annual basis to ensure that FPUA’s rate structure properly reflects the recovery of the cost of operating and maintaining each utility system.
Natural gas prices remain at historically low levels. As a result, the cost of natural gas purchased for resale was down $356,000 or 19.1% in FY 2016, but the cost of power purchased from FMPA increased $1,836,000 or 4.6%.
Water operating revenues were up 5.0% from FY 2015. Excluding the recovery of purchased power and gas costs, operating revenues from the electric system were up 2.7%, and down 3.1% in the gas system. Operating revenues from the wastewater system increased 1.7%. Consumption billed by the electric and water systems increased by 3.0% and 2.6% respectively. Gas unit sales decreased 3.2%. The number of wastewater gallons billed, as well as the average number of services billed in all utility systems, were flat.
On March 4, 2016, FPUA issued Utilities Refunding Revenue Bond, Series 2016 at an interest rate of 2.14% to provide for the redemption of Utilities Revenue Bonds, Series 2002 with an interest rate of 5%. In conjunction with this refunding, FPUA has made the remaining transfers to its Debt Service Reserve account, which was prior to the previously agreed-upon completion date of January 2017. The net present value savings is calculated to be $2,466,000. Additional information on FPUA’s revenue bonds payable can be found in Note F.
The remediation of the former site of the H.D. King Power Plant is now complete. No future costs associated with testing and cleanup of the site are anticipated, and the Fort Pierce Redevelopment Agency continues to recover some of the cost through the sale of Voluntary Cleanup Tax Credits. See Note P for details.
FPUA continues to be impacted by the implementation of Governmental Accounting Standards Board Statement No. 68, Accounting and Financial Reporting for Pensions (GASB 68). Net position for FY 2016 has been reduced by $1,152,000 to reflect this accrued cost. See Note I for details.
The Distribution to the City of Fort Pierce increased $74,000 over last year. This was primarily a result of increased revenue being subject to the 6% distribution calculation multiplier.
14
OVERVIEW OF THE FINANCIAL STATEMENTS
FPUA is a single enterprise fund even though it provides various utility services. FPUA’s basic financial statements consist of fund financial statements and the notes to financial statements. This report also includes supplementary information intended to furnish additional detail to support the basic financial statements themselves.
The financial statements are designed to provide readers with a broad overview of FPUA’s finances, in a manner similar to a private-sector business. The Statement of Net Position presents financial information on all of FPUA’s assets, liabilities, and deferred inflows/outflows of resources, with the difference reported as net position. Over time, increases or decreases in net position may serve as a useful indicator of whether the financial position of FPUA is improving or deteriorating.
The Statement of Revenues, Expenses and Changes in Net Position presents information showing how FPUA’s net position changed during the two most recent fiscal years. All changes in net position are reported as soon as the underlying event giving rise to the change occurs, regardless of the timing of related cash flows. Thus, revenues and expenses are reported for some items that will only result in cash flows in future fiscal periods (e.g., uncollected utility billings and earned but unused vacation leave).
The enterprise fund activities of FPUA are intended to recover all or a significant portion of its costs through user fees and charges, and include providing electric, water, wastewater, natural gas, and communication services. FPUA also operates the Treasure Coast Energy Center (TCEC) for the Florida Municipal Power Agency (FMPA), as well as the Manatee Observation and Education Center (MOEC) for the City of Fort Pierce. FPUA’s financial information is presented in the CAFR prepared by the City of Fort Pierce, as a component unit.
The Notes to the Financial Statements provide additional information that is necessary to acquire a full understanding of the data provided in the financial statements. The notes can be found on pages 28-49 of this report.
In addition to the basic financial statements and accompanying notes, this report also presents Required Supplementary Information concerning FPUA’s progress in funding its obligation to provide pension and OPEB benefits to its employees. Required supplementary information can be found on pages 50-51 of this report.
FINANCIAL ANALYSIS OF FPUA AS A WHOLE
As noted earlier, net position over time, may serve as a useful indicator of a government’s financial position. FPUA’s assets and deferred outflows of resources exceeded liabilities and deferred inflows of resources by $184,998,000 at the close of the most recent fiscal year.
15
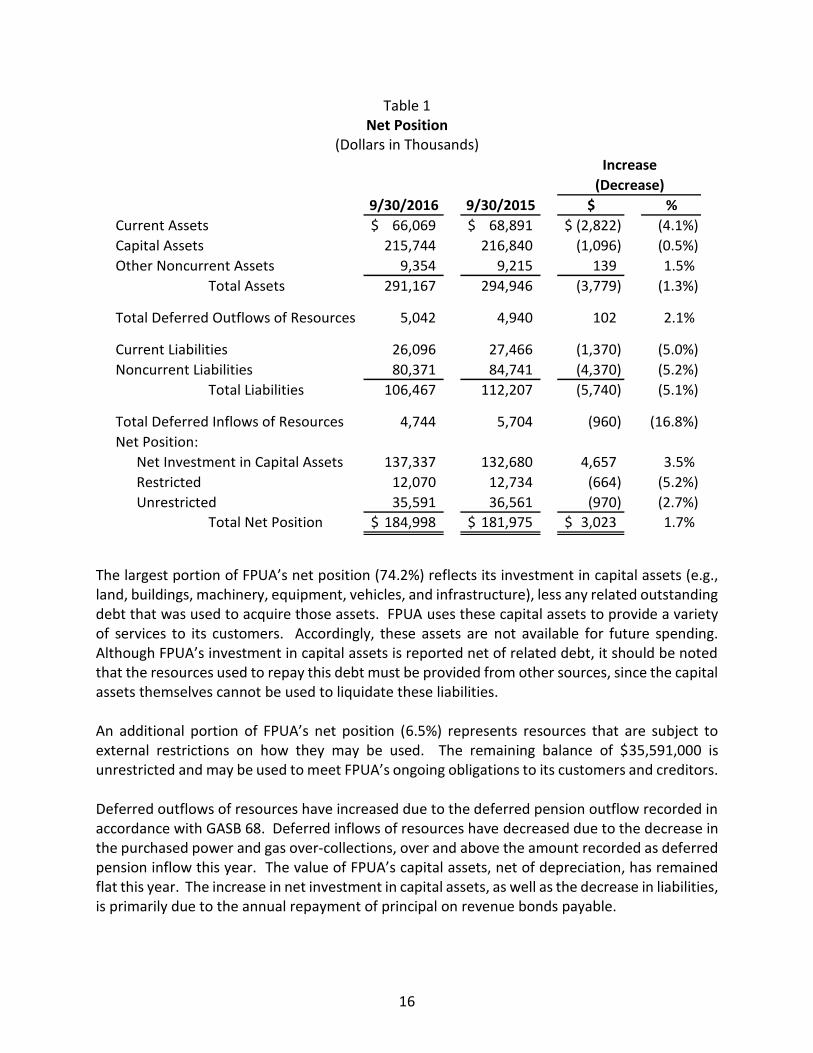
Table 1 Net Position
(Dollars in Thousands)
9/30/2016 9/30/2015 $ %
Current Assets 66,069$ 68,891$ (2,822)$ (4.1%)
Capital Assets 215,744 216,840 (1,096) (0.5%)
Other Noncurrent Assets 9,354 9,215 139 1.5%
Total Assets 291,167 294,946 (3,779) (1.3%)
Total Deferred Outflows of Resources 5,042 4,940 102 2.1%
Current Liabilities 26,096 27,466 (1,370) (5.0%)
Noncurrent Liabilities 80,371 84,741 (4,370) (5.2%)
Total Liabilities 106,467 112,207 (5,740) (5.1%)
Total Deferred Inflows of Resources 4,744 5,704 (960) (16.8%)
Net Position:
Net Investment in Capital Assets 137,337 132,680 4,657 3.5%
Restricted 12,070 12,734 (664) (5.2%)
Unrestricted 35,591 36,561 (970) (2.7%)
Total Net Position 184,998$ 181,975$ 3,023$ 1.7%
Increase
(Decrease)
The largest portion of FPUA’s net position (74.2%) reflects its investment in capital assets (e.g., land, buildings, machinery, equipment, vehicles, and infrastructure), less any related outstanding debt that was used to acquire those assets. FPUA uses these capital assets to provide a variety of services to its customers. Accordingly, these assets are not available for future spending. Although FPUA’s investment in capital assets is reported net of related debt, it should be noted that the resources used to repay this debt must be provided from other sources, since the capital assets themselves cannot be used to liquidate these liabilities.
An additional portion of FPUA’s net position (6.5%) represents resources that are subject to external restrictions on how they may be used. The remaining balance of $35,591,000 is unrestricted and may be used to meet FPUA’s ongoing obligations to its customers and creditors.
Deferred outflows of resources have increased due to the deferred pension outflow recorded in accordance with GASB 68. Deferred inflows of resources have decreased due to the decrease in the purchased power and gas over-collections, over and above the amount recorded as deferred pension inflow this year. The value of FPUA’s capital assets, net of depreciation, has remained flat this year. The increase in net investment in capital assets, as well as the decrease in liabilities, is primarily due to the annual repayment of principal on revenue bonds payable.
16
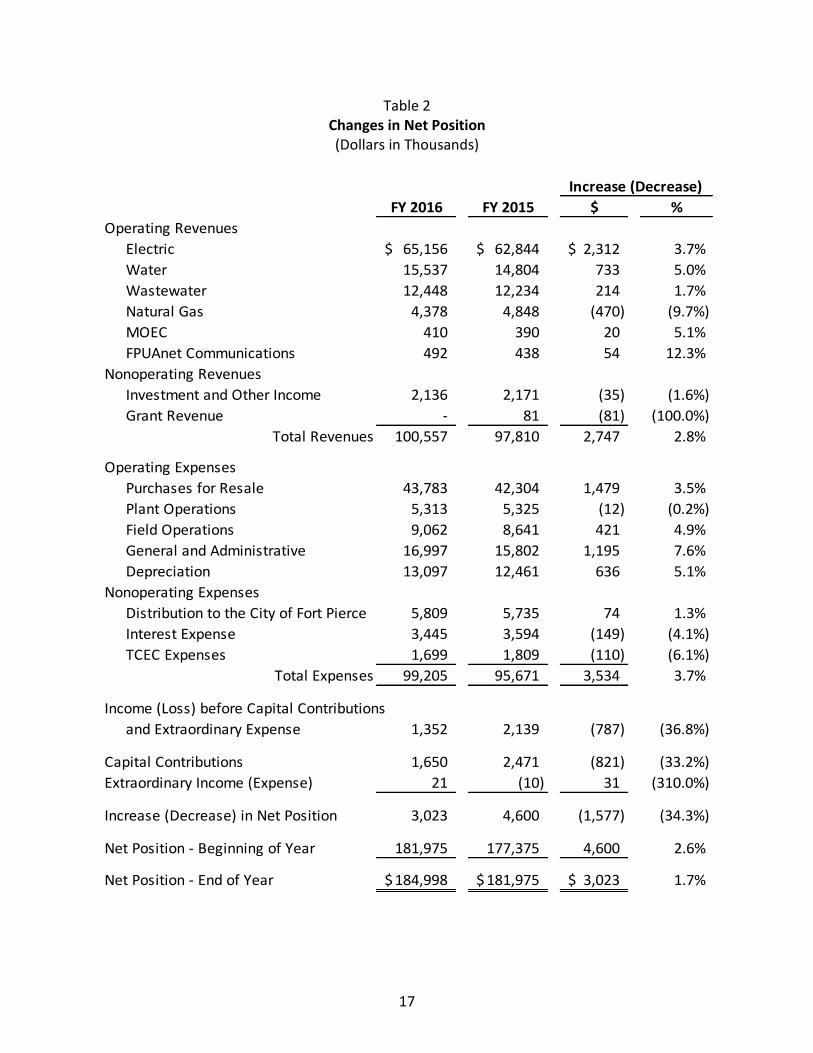
Table 2 Changes in Net Position (Dollars in Thousands)
Increase (Decrease)
FY 2016 FY 2015 $ %
Operating Revenues
Electric 65,156$ 62,844$ 2,312$ 3.7%
Water 15,537 14,804 733 5.0%
Wastewater 12,448 12,234 214 1.7%
Natural Gas 4,378 4,848 (470) (9.7%)
MOEC 410 390 20 5.1%
FPUAnet Communications 492 438 54 12.3%
Nonoperating Revenues
Investment and Other Income 2,136 2,171 (35) (1.6%)
Grant Revenue - 81 (81) (100.0%)
Total Revenues 100,557 97,810 2,747 2.8%
Operating Expenses
Purchases for Resale 43,783 42,304 1,479 3.5%
Plant Operations 5,313 5,325 (12) (0.2%)
Field Operations 9,062 8,641 421 4.9%
General and Administrative 16,997 15,802 1,195 7.6%
Depreciation 13,097 12,461 636 5.1%
Nonoperating Expenses
Distribution to the City of Fort Pierce 5,809 5,735 74 1.3%
Interest Expense 3,445 3,594 (149) (4.1%)
TCEC Expenses 1,699 1,809 (110) (6.1%)
Total Expenses 99,205 95,671 3,534 3.7%
Income (Loss) before Capital Contributions
and Extraordinary Expense 1,352 2,139 (787) (36.8%)
Capital Contributions 1,650 2,471 (821) (33.2%)
Extraordinary Income (Expense) 21 (10) 31 (310.0%)
Increase (Decrease) in Net Position 3,023 4,600 (1,577) (34.3%)
Net Position - Beginning of Year 181,975 177,375 4,600 2.6%
Net Position - End of Year 184,998$ 181,975$ 3,023$ 1.7%
17
In addition to the increases in operating revenues, purchased power, and pension expense discussed previously in the financial highlights, the increase in general and administrative expenses were a result of many factors. Depreciation expense is increasing as costly capital projects are closed and begin to depreciate. The acidization of the Mainland Deep Injection Well, as well as the low pressure incident experienced in the Gas system were unanticipated costs in FY 2016. The decrease in capital contributions as compared to FY 2015 actually reflects an increase when compared to fiscal years 2011 through 2014.
The distribution to the City of Fort Pierce, based on FY 2016 revenues, computes to $5,969,000 and will be paid in April 2017 (see Note E for details). Last year’s distribution, based on FY 2015 revenues, totaled $5,809,000, and was paid in April 2016. This increase is a result of higher sales revenues, as well as power cost in excess of the actual amount paid being included in the base electric rate, which are subject to the calculation at 6% of gross revenue.
CAPITAL ASSETS
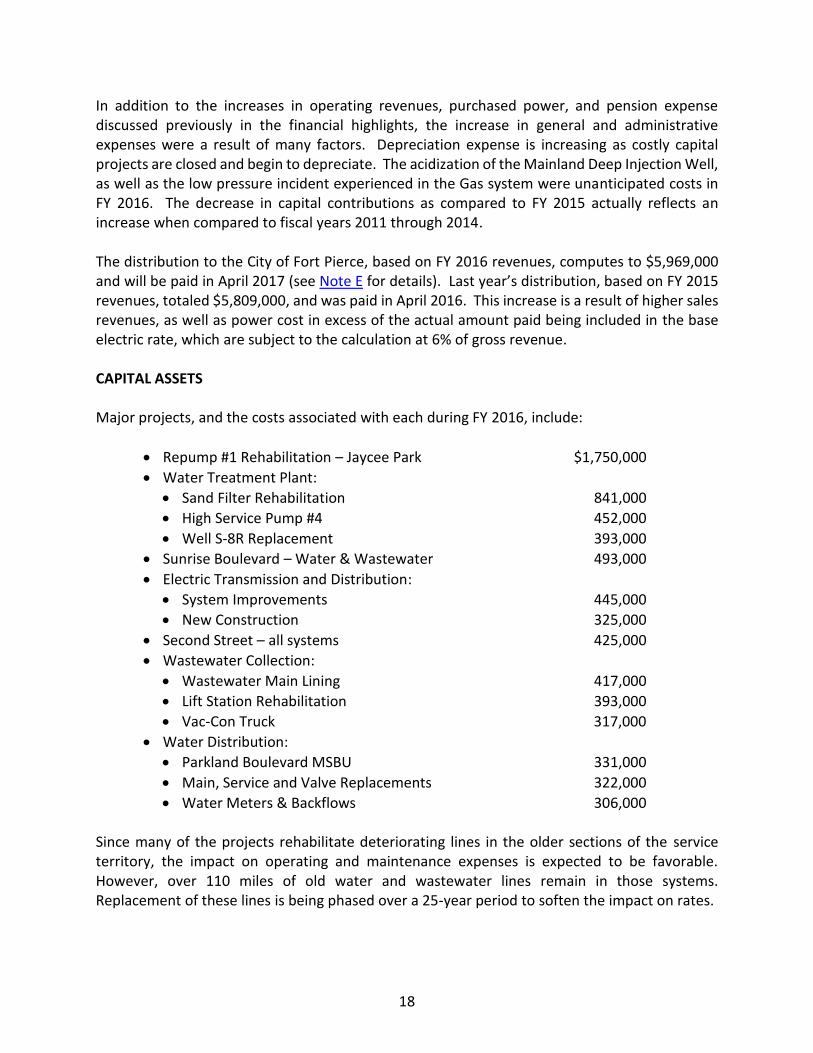
Major projects, and the costs associated with each during FY 2016, include:
Repump #1 Rehabilitation – Jaycee Park $1,750,000
Water Treatment Plant:
Sand Filter Rehabilitation 841,000
High Service Pump #4 452,000
Well S-8R Replacement 393,000
Sunrise Boulevard – Water & Wastewater 493,000
Electric Transmission and Distribution:
System Improvements 445,000
New Construction 325,000
Second Street – all systems 425,000
Wastewater Collection:
Wastewater Main Lining 417,000
Lift Station Rehabilitation 393,000
Vac-Con Truck 317,000
Water Distribution:
Parkland Boulevard MSBU 331,000
Main, Service and Valve Replacements 322,000
Water Meters & Backflows 306,000
Since many of the projects rehabilitate deteriorating lines in the older sections of the service territory, the impact on operating and maintenance expenses is expected to be favorable. However, over 110 miles of old water and wastewater lines remain in those systems. Replacement of these lines is being phased over a 25-year period to soften the impact on rates.
18
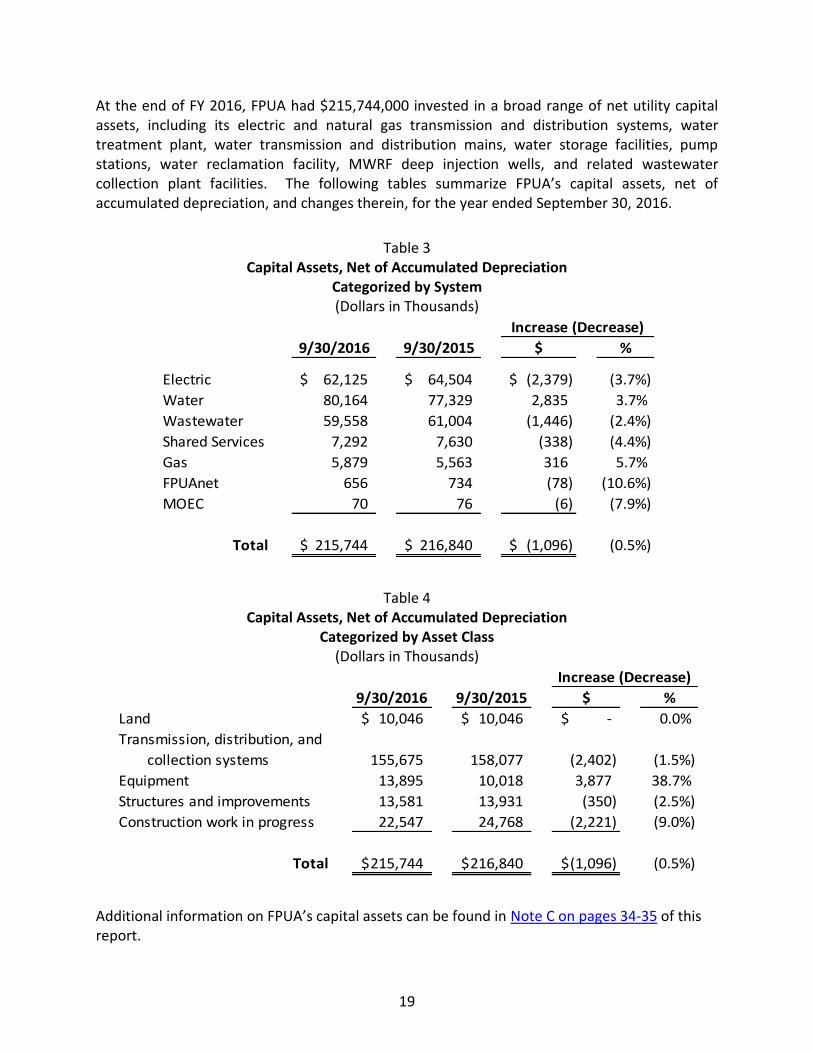
At the end of FY 2016, FPUA had $215,744,000 invested in a broad range of net utility capital assets, including its electric and natural gas transmission and distribution systems, water treatment plant, water transmission and distribution mains, water storage facilities, pump stations, water reclamation facility, MWRF deep injection wells, and related wastewater collection plant facilities. The following tables summarize FPUA’s capital assets, net of accumulated depreciation, and changes therein, for the year ended September 30, 2016.
Table 3 Capital Assets, Net of Accumulated Depreciation
Categorized by System (Dollars in Thousands)
9/30/2016 9/30/2015 $ %
Electric 62,125$ 64,504$ (2,379)$ (3.7%)
Water 80,164 77,329 2,835 3.7%
Wastewater 59,558 61,004 (1,446) (2.4%)
Shared Services 7,292 7,630 (338) (4.4%)
Gas 5,879 5,563 316 5.7%
FPUAnet 656 734 (78) (10.6%)
MOEC 70 76 (6) (7.9%)
Total 215,744$ 216,840$ (1,096)$ (0.5%)
Increase (Decrease)
Table 4 Capital Assets, Net of Accumulated Depreciation
Categorized by Asset Class (Dollars in Thousands)
9/30/2016 9/30/2015 $ %
Land 10,046$ 10,046$ -$ 0.0%
Transmission, distribution, and
collection systems 155,675 158,077 (2,402) (1.5%)
Equipment 13,895 10,018 3,877 38.7%
Structures and improvements 13,581 13,931 (350) (2.5%)
Construction work in progress 22,547 24,768 (2,221) (9.0%)
Total 215,744$ 216,840$ (1,096)$ (0.5%)
Increase (Decrease)
Additional information on FPUA’s capital assets can be found in Note C on pages 34-35 of this report.
19
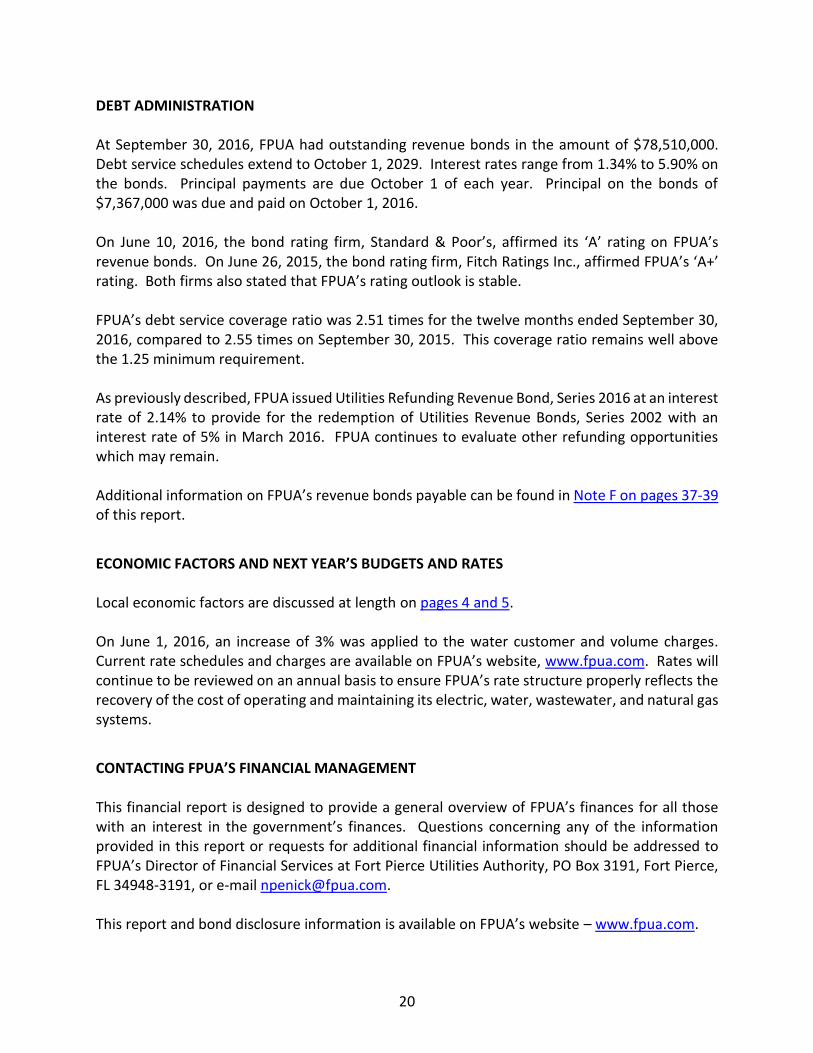
DEBT ADMINISTRATION
At September 30, 2016, FPUA had outstanding revenue bonds in the amount of $78,510,000. Debt service schedules extend to October 1, 2029. Interest rates range from 1.34% to 5.90% on the bonds. Principal payments are due October 1 of each year. Principal on the bonds of $7,367,000 was due and paid on October 1, 2016.
On June 10, 2016, the bond rating firm, Standard & Poor’s, affirmed its ‘A’ rating on FPUA’s revenue bonds. On June 26, 2015, the bond rating firm, Fitch Ratings Inc., affirmed FPUA’s ‘A+’ rating. Both firms also stated that FPUA’s rating outlook is stable.
FPUA’s debt service coverage ratio was 2.51 times for the twelve months ended September 30, 2016, compared to 2.55 times on September 30, 2015. This coverage ratio remains well above the 1.25 minimum requirement.
As previously described, FPUA issued Utilities Refunding Revenue Bond, Series 2016 at an interest rate of 2.14% to provide for the redemption of Utilities Revenue Bonds, Series 2002 with an interest rate of 5% in March 2016. FPUA continues to evaluate other refunding opportunities which may remain.
Additional information on FPUA’s revenue bonds payable can be found in Note F on pages 37-39 of this report.
ECONOMIC FACTORS AND NEXT YEAR’S BUDGETS AND RATES
Local economic factors are discussed at length on pages 4 and 5.
On June 1, 2016, an increase of 3% was applied to the water customer and volume charges. Current rate schedules and charges are available on FPUA’s website, www.fpua.com. Rates will continue to be reviewed on an annual basis to ensure FPUA’s rate structure properly reflects the recovery of the cost of operating and maintaining its electric, water, wastewater, and natural gas systems.
CONTACTING FPUA’S FINANCIAL MANAGEMENT
This financial report is designed to provide a general overview of FPUA’s finances for all those with an interest in the government’s finances. Questions concerning any of the information provided in this report or requests for additional financial information should be addressed to FPUA’s Director of Financial Services at Fort Pierce Utilities Authority, PO Box 3191, Fort Pierce, FL 34948-3191, or e-mail [email protected].
This report and bond disclosure information is available on FPUA’s website – www.fpua.com.
20

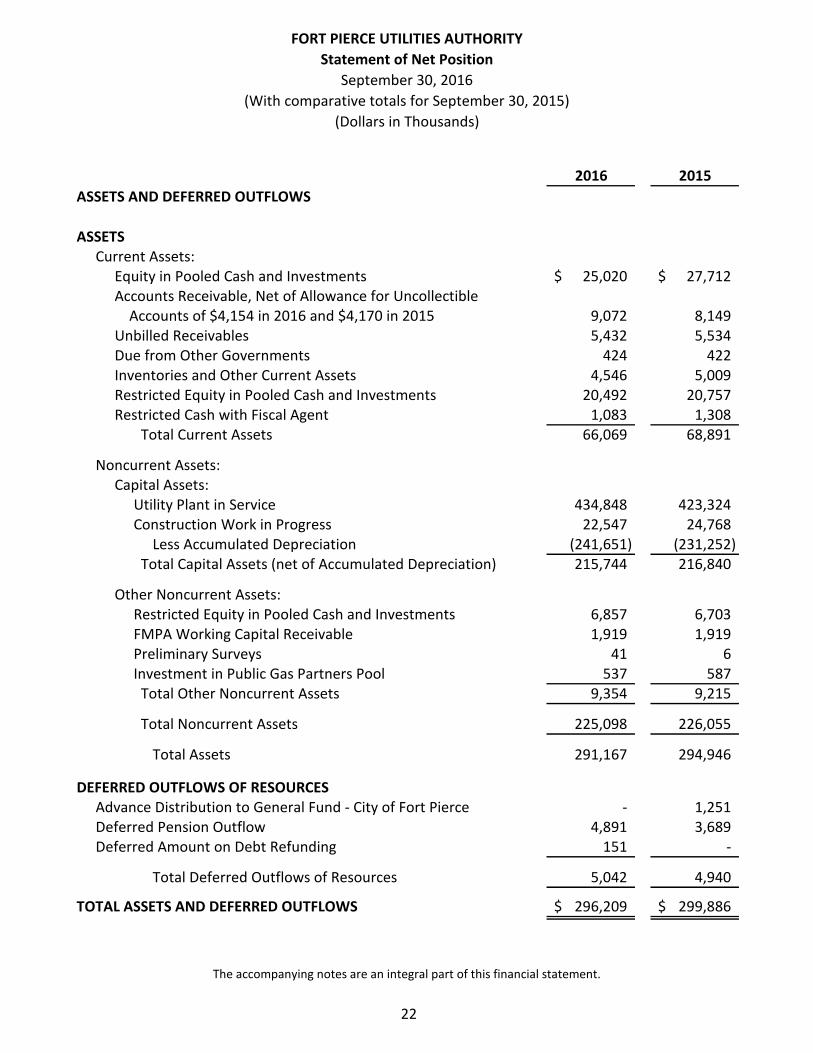
FORT PIERCE UTILITIES AUTHORITY
Statement of Net Position
September 30, 2016
(With comparative totals for September 30, 2015)
(Dollars in Thousands)
2016 2015
ASSETS AND DEFERRED OUTFLOWS
ASSETS Current Assets:
Equity in Pooled Cash and Investments $ 25,020 $ 27,712 Accounts Receivable, Net of Allowance for Uncollectible
Accounts of $4,154 in 2016 and $4,170 in 2015 9,072 8,149 Unbilled Receivables 5,432 5,534 Due from Other Governments 424 422 Inventories and Other Current Assets 4,546 5,009 Restricted Equity in Pooled Cash and Investments 20,492 20,757 Restricted Cash with Fiscal Agent 1,083 1,308
Total Current Assets 66,069 68,891
Noncurrent Assets: Capital Assets:
Utility Plant in Service 434,848 423,324 Construction Work in Progress 22,547 24,768
Less Accumulated Depreciation (241,651) (231,252) Total Capital Assets (net of Accumulated Depreciation) 215,744 216,840
Other Noncurrent Assets: Restricted Equity in Pooled Cash and Investments 6,857 6,703 FMPA Working Capital Receivable 1,919 1,919 Preliminary Surveys 41 6 Investment in Public Gas Partners Pool 537 587
Total Other Noncurrent Assets 9,354 9,215
Total Noncurrent Assets 225,098 226,055
Total Assets 291,167 294,946
DEFERRED OUTFLOWS OF RESOURCES Advance Distribution to General Fund - City of Fort Pierce - 1,251 Deferred Pension Outflow 4,891 3,689 Deferred Amount on Debt Refunding 151 -
Total Deferred Outflows of Resources 5,042 4,940
TOTAL ASSETS AND DEFERRED OUTFLOWS $ 296,209 $ 299,886
The accompanying notes are an integral part of this financial statement.
22

FORT PIERCE UTILITIES AUTHORITY
Statement of Net Position
September 30, 2016
(With comparative totals for September 30, 2015)
(Dollars in Thousands)
2016 2015 LIABILITIES, DEFERRED INFLOWS AND NET POSITION
LIABILITIES Current Liabilites:
Accounts Payable and Accrued Expenses Due to City of Fort Pierce Customer Deposits - restricted assets Revenue Bonds Payable - restriced assets Accrued Interest Payable - restricted assets Accrued Compensated Absences Capital Leases Payable Other Current Liabilities
$ 7,900 913
8,024 7,367
971 24 38
859
$ 9,577 781
7,803 7,086 1,145
170 31
873 Total Current Liabilities 26,096 27,466
Noncurrent Liabilities: Revenue Bonds Payable, Net of Unamortized Discounts Accrued Compensated Absences Other Post Employment Benefit Obligation Net Pension Liability Due to St. Lucie County Capital Leases Payable
Total Noncurrent Liabilities
71,085 1,778
711 6,655
131 11
80,371
76,754 1,592
681 5,528
137 49
84,741
Total Liabilities 106,467 112,207
DEFERRED INFLOWS OF RESOURCES Purchased Power and Gas Over-Recovery Deferred Pension Inflow Deferred Amount on Debt Refunding
3,516 1,228
-
5,694 -
10
Total Deferred Inflows of Resources 4,744 5,704
NET POSITION Net Investment in Capital Assets Restricted Capital Improvement Charges Restricted for Debt Service Restricted for Emergencies Restricted for Renewals and Replacements Unrestricted
137,337 5,213 5,457
900 500
35,591
132,680 6,031 4,930 1,273
500 36,561
Total Net Position 184,998 181,975
TOTAL LIABILITIES, DEFERRED INFLOWS AND NET POSITION $ 296,209 $ 299,886
The accompanying notes are an integral part of this financial statement.
23

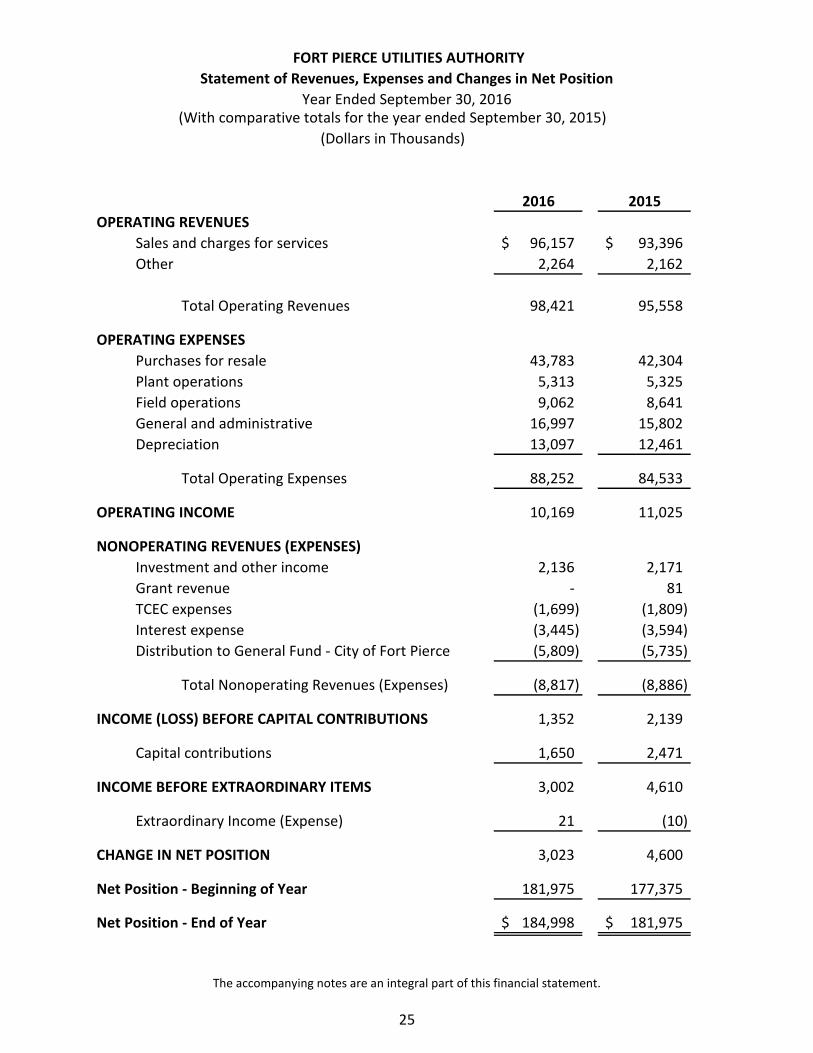
FORT PIERCE UTILITIES AUTHORITY
Statement of Revenues, Expenses and Changes in Net Position
Year Ended September 30, 2016 (With comparative totals for the year ended September 30, 2015)
(Dollars in Thousands)
OPERATING REVENUES
Sales and charges for services
Other
$
2016
96,157
2,264
$
2015
93,396
2,162
Total Operating Revenues 98,421 95,558
OPERATING EXPENSES
Purchases for resale
Plant operations
Field operations
General and administrative
Depreciation
43,783
5,313
9,062
16,997
13,097
42,304
5,325
8,641
15,802
12,461
Total Operating Expenses 88,252 84,533
OPERATING INCOME 10,169 11,025
NONOPERATING REVENUES (EXPENSES)
Investment and other income
Grant revenue
TCEC expenses
Interest expense
Distribution to General Fund - City of Fort Pierce
2,136
-
(1,699)
(3,445)
(5,809)
2,171
81
(1,809)
(3,594)
(5,735)
Total Nonoperating Revenues (Expenses) (8,817) (8,886)
INCOME (LOSS) BEFORE CAPITAL CONTRIBUTIONS 1,352 2,139
Capital contributions 1,650 2,471
INCOME BEFORE EXTRAORDINARY ITEMS 3,002 4,610
Extraordinary Income (Expense) 21 (10)
CHANGE IN NET POSITION 3,023 4,600
Net Position - Beginning of Year 181,975 177,375
Net Position - End of Year $ 184,998 $ 181,975
The accompanying notes are an integral part of this financial statement.
25
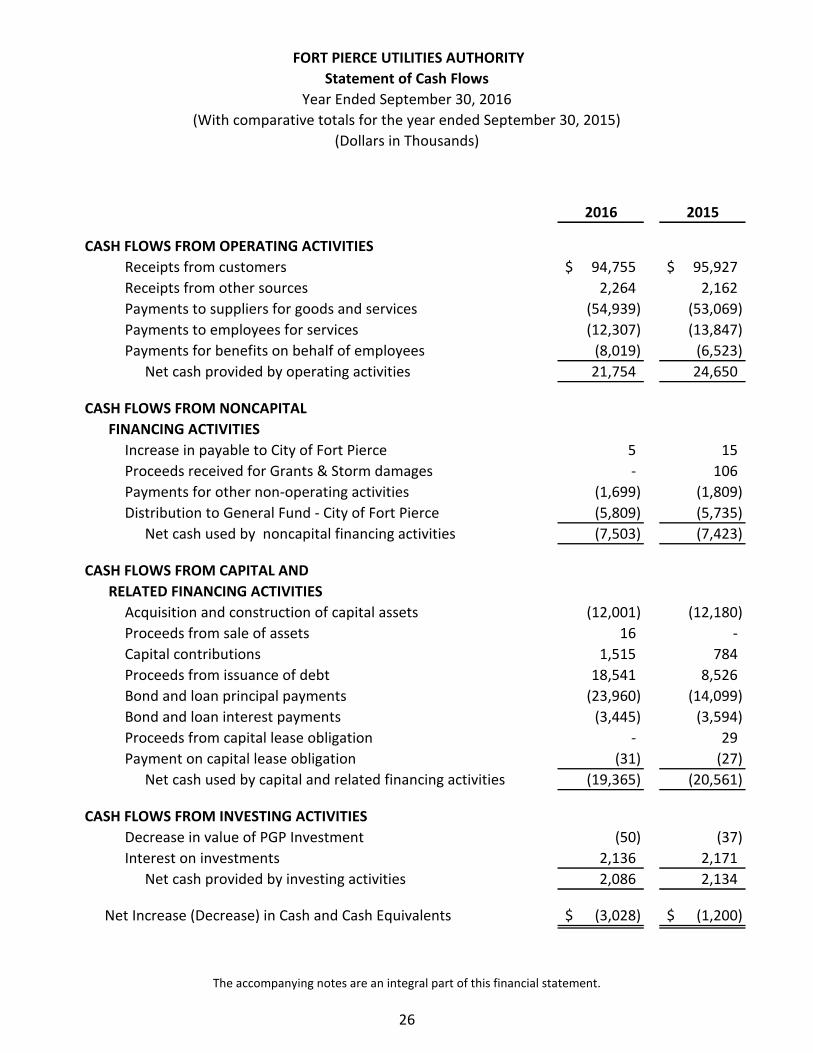
FORT PIERCE UTILITIES AUTHORITY
Statement of Cash Flows
Year Ended September 30, 2016
(With comparative totals for the year ended September 30, 2015)
(Dollars in Thousands)
2016 2015
CASH FLOWS FROM OPERATING ACTIVITIES
Receipts from customers $ 94,755 $ 95,927
Receipts from other sources 2,264 2,162
Payments to suppliers for goods and services (54,939) (53,069)
Payments to employees for services (12,307) (13,847)
Payments for benefits on behalf of employees (8,019) (6,523)
Net cash provided by operating activities 21,754 24,650
CASH FLOWS FROM NONCAPITAL
FINANCING ACTIVITIES
Increase in payable to City of Fort Pierce 5 15
Proceeds received for Grants & Storm damages - 106
Payments for other non-operating activities (1,699) (1,809)
Distribution to General Fund - City of Fort Pierce (5,809) (5,735)
Net cash used by noncapital financing activities (7,503) (7,423)
CASH FLOWS FROM CAPITAL AND
RELATED FINANCING ACTIVITIES
Acquisition and construction of capital assets (12,001) (12,180)
Proceeds from sale of assets 16 -
Capital contributions 1,515 784
Proceeds from issuance of debt 18,541 8,526
Bond and loan principal payments (23,960) (14,099)
Bond and loan interest payments (3,445) (3,594)
Proceeds from capital lease obligation - 29
Payment on capital lease obligation (31) (27)
Net cash used by capital and related financing activities (19,365) (20,561)
CASH FLOWS FROM INVESTING ACTIVITIES
Decrease in value of PGP Investment (50) (37)
Interest on investments 2,136 2,171
Net cash provided by investing activities 2,086 2,134
Net Increase (Decrease) in Cash and Cash Equivalents $ (3,028) $ (1,200)
The accompanying notes are an integral part of this financial statement.
26
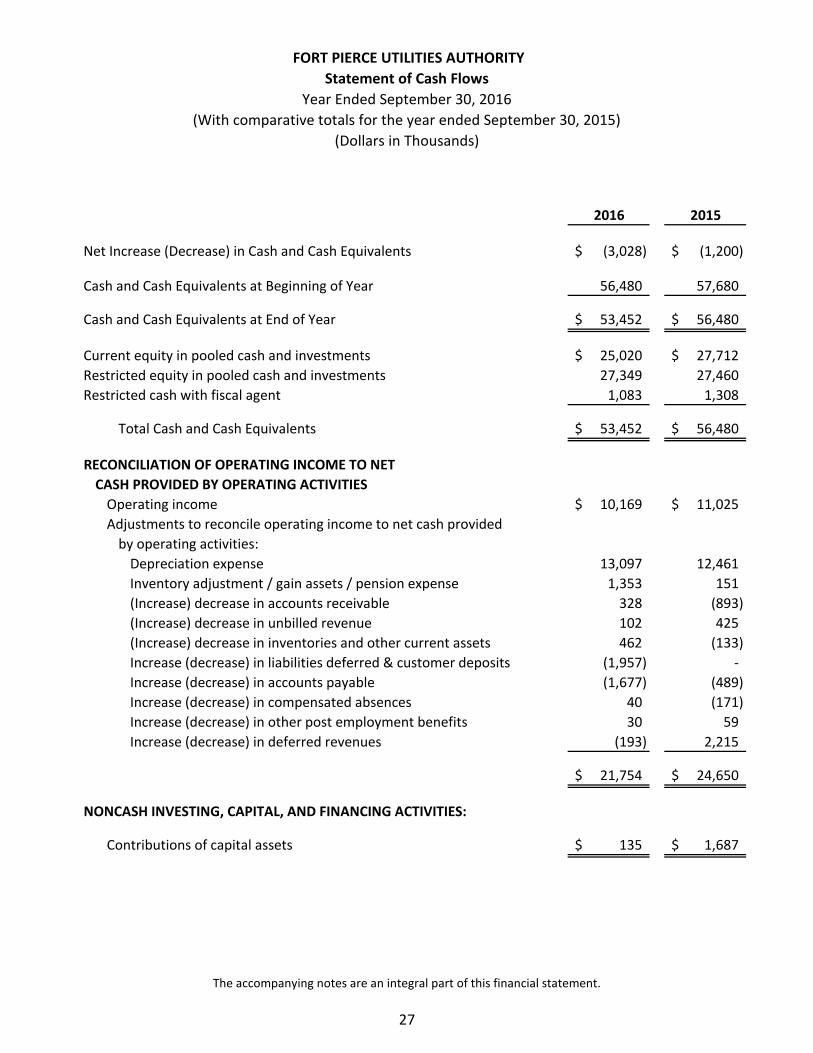
FORT PIERCE UTILITIES AUTHORITY
Statement of Cash Flows
Year Ended September 30, 2016
(With comparative totals for the year ended September 30, 2015)
(Dollars in Thousands)
2016 2015
Net Increase (Decrease) in Cash and Cash Equivalents
Cash and Cash Equivalents at Beginning of Year
Cash and Cash Equivalents at End of Year
$
$
(3,028)
56,480
53,452
$
$
(1,200)
57,680
56,480
Current equity in pooled cash and investments
Restricted equity in pooled cash and investments
Restricted cash with fiscal agent
Total Cash and Cash Equivalents
$
$
25,020
27,349
1,083
53,452
$
$
27,712
27,460
1,308
56,480
RECONCILIATION OF OPERATING INCOME TO NET
CASH PROVIDED BY OPERATING ACTIVITIES
Operating income
Adjustments to reconcile operating income to net cash provided
by operating activities:
Depreciation expense
Inventory adjustment / gain assets / pension expense
(Increase) decrease in accounts receivable
(Increase) decrease in unbilled revenue
(Increase) decrease in inventories and other current assets
Increase (decrease) in liabilities deferred & customer deposits
Increase (decrease) in accounts payable
Increase (decrease) in compensated absences
Increase (decrease) in other post employment benefits
Increase (decrease) in deferred revenues
$
$
10,169
13,097
1,353
328
102
462
(1,957)
(1,677)
40
30
(193)
21,754
$
$
11,025
12,461
151
(893)
425
(133)
-
(489)
(171)
59
2,215
24,650
NONCASH INVESTING, CAPITAL, AND FINANCING ACTIVITIES:
Contributions of capital assets $ 135 $ 1,687
The accompanying notes are an integral part of this financial statement.
27
FORT PIERCE UTILITIES AUTHORITY Notes to Financial Statements
September 30, 2016 (Dollars in Thousands)
NOTE A – SUMMARY OF SIGNIFICANT ACCOUNTING POLICIES
Reporting Entity
The voters of the City of Fort Pierce, Florida authorized the organization of the Fort Pierce Utilities Authority (FPUA) at a special election held May 30, 1972. FPUA commenced operations as of June 30, 1972, and is responsible for management and operation of the combined Electric, Water, Wastewater, and Gas Systems, FPUAnet and the Manatee Observation and Education Center. The City Charter, Article XII, defines the powers, duties, and responsibilities of FPUA. The members of FPUA’s governing board are appointed and may be removed from office by the Fort Pierce City Commission. FPUA’s budget is subject to approval of the City Commission, as are rates for service.
The accounts at September 30, 2016, and for the year then ended, of the various utility systems of FPUA are included as a discretely presented component unit of the City of Fort Pierce, Florida, financial statements. FPUA has no component units.
Basis of Presentation
The accounts of FPUA are an enterprise fund. An enterprise fund is a Proprietary type fund used to account for operations (a) that are financed and operated in a manner similar to private business enterprises -- where the intent of the governing body is that the costs (expenses, including depreciation) of providing goods or services to the general public on a continuing basis be financed or recovered primarily through user charges; or (b) where the governing body has decided that periodic determination of revenues earned, expenses incurred, and/or net income is appropriate for capital maintenance, public policy, management control, accountability, or other purposes.
Measurement Focus, Basis of Accounting, and Financial Statement Presentation
Measurement focus is a term used to describe “which” transactions are recorded within the various financial statements. Basis of accounting refers to “when” transactions are recorded regardless of the measurement focus applied. The accompanying financial statements are reported using the “economic resources measurement focus,” and the “accrual basis of accounting.” Revenues are recorded when earned and expenses are recorded when a liability is incurred, regardless of the timing of related cash flows.
Accounting Standards Adopted
GASB Statement No. 65 – During FY 2014, FPUA implemented GASB Statement No. 65, Items Previously Reported as Assets and Liabilities (GASB 65), that amends or supersedes the accounting and financial reporting guidance for certain items previously required to be reported as assets or liabilities. The objective is to either properly classify certain items that were previously reported as assets and liabilities as deferred outflows of resources or deferred inflows of resources or recognize certain items that were previously reported as assets and liabilities as outflows of resources (expenses) or inflows of resources (revenues).
28
FORT PIERCE UTILITIES AUTHORITY Notes to Financial Statements
September 30, 2016 (Dollars in Thousands)
The impact of the implementation of GASB 65 on FPUA’s financial statements for all periods presented was that certain debt issuance costs are now expensed which were previously recorded as an asset and amortized over the life of the debt.
GASB Statement No. 68 – Fort Pierce Utilities Authority implemented GASB Statement No. 68 Accounting and Financial Reporting for Pensions (GASB 68) for the fiscal year ended September 30, 2015. This statement establishes standards of accounting and financial reporting for pension plans that are administered through a trust that meet certain criteria. Implementation of GASB 68 replaces the requirements of Statements No. 27 and 50.
During fiscal year 2016, three new accounting standards were adopted as follows:
GASB Statement No. 72 – The Fair Value Measurement and Application The Statement improves financial reporting by clarifying the definition of fair value for financial reporting purposes, establishing general principles for measuring fair value, providing additional fair value application guidance, and enhancing disclosures about fair value measurements. These improvements are based in part on the concepts and definitions established in Concepts Statement No. 6, Measurement of Elements of Financial Statements, and other relevant literature.
GASB Statement No. 76 – The Hierarchy of Generally Accepted Accounting Principles for State and Local Governments The Statement identifies, in the context of the current governmental financial reporting environment, the sources of accounting principles used to prepare financial statements of state and local governmental entities in conformity with generally accepted accounting principles (GAAP) and the framework for selecting those principles.
GASB Statement No. 79 – Certain External Investment Pools and Pool Participants This Statement establishes accounting and financial reporting standards for qualifying external investment pools that elect to measure for financial reporting purposes all of their investments at amortized cost. This Statement also establishes accounting and financial reporting standards for state and local governments that participate in a qualifying external investment pool that measures for financial reporting purposes all of its investments at amortized cost.
Operating Revenues and Expenses – Operating revenues and expenses generally result from providing services in connection with FPUA’s principal ongoing operations. The principal operating revenues of FPUA consists of charges to customers for sales of electricity, water and natural gas and services including wastewater collection, operation of the Manatee Observation and Education Center (MOEC) and FPUAnet communications services. Operating expenses include the cost of sales and services, administrative expenses, and depreciation on capital assets. All revenues and expenses not meeting this definition are reported as non-operating revenues and expenses.
29
FORT PIERCE UTILITIES AUTHORITY Notes to Financial Statements
September 30, 2016 (Dollars in Thousands)
NOTE A – continued
Assets, Liabilities, Deferred outflows/inflows of resources, and Net Position
Pooled Cash and Investments - FPUA, for accounting and investment purposes, pools certain cash and investments. Cash and cash equivalents are considered to be cash on hand, certificates of deposit, Local Government Surplus Funds Trust Fund, Overnight Repurchase Agreements, and short-term investments with original maturities of three months or less from the date of acquisition.
In accordance with GASB 31, investments are stated at fair value based on per share prices. The Florida PRIME Investment Pool (LGIP) is considered to be a “2a-7 like” investment, and is accounted for at fair value for financial reporting (See Note B Investments). Florida PRIME has a current rating by Standard and Poor’s of AAAm. There is a risk of loss on these investments based upon the fluctuation of interest rates and lengths of maturity.
Florida PRIME is not a registrant with the Securities and Exchange Commission (SEC); however the Board has adopted operating procedures consistent with the requirements for a 2a-7 fund.
Unbilled Service Receivables - These receivables represent the estimated amount of accounts receivable for services that have not been billed as of the balance sheet date. The amounts are a result of a timing difference between the end of the financial statement cycle (month end) and the billing cycle (various dates within the month for each billing period).
Inventories - Inventories of fuel, supplies, construction materials, and utility plant replacement parts are recorded at lower of weighted average cost or market.
Utility Plant - Utility plant is stated at historical cost for items constructed or acquired by purchase and at estimated fair market value on the date received for contributed capital. Utility plant assets are defined by FPUA as assets with an initial, individual cost of $5,000 or more and an estimated useful life of one year or more. (See Note C for interest capitalization.)
Depreciation of all exhaustible utility plant assets, including those acquired through intergovernmental grants externally restricted to capital acquisitions, is charged as an expense against operations. Accumulated depreciation is reported on the balance sheet.
Depreciation is calculated using the straight line method over the following estimated useful lives: Structures and improvements 3-55 years Equipment 3-40 years Transmission, distribution,
and collection plants 5-60 years
Purchased Power and Gas Adjustments - The rate schedules of the Electric and Gas Systems provide that fuel cost increases, decreases, and credits, as computed under formulas adopted by FPUA, will be passed on to the customers. These charges or credits are recorded as a deferred inflow of revenue. At the end of the fiscal year, FPUA has recorded deferred inflow of resources in the amount of $3,516 for these adjustments.
30
FORT PIERCE UTILITIES AUTHORITY Notes to Financial Statements
September 30, 2016 (Dollars in Thousands)
Long-Term Liabilities – Bonds payable are reported net of any applicable discounts. Bond discounts are deferred and amortized over the life of the bonds using the effective interest method. Bond issuance costs have been recognized as outflows of resources in accordance with GASB No. 65 (see GASB Statement No. 65 in this note).
Deferred outflows/inflows of resources - The financial statement element, deferred outflows of resources, represents a consumption of net position that applies to a future period(s) and so will not be recognized as an outflow of resources (expense) until the period in which the expense belongs arrives. Similarly, deferred inflows of resources, represents a consumption of net position that applies to a future period(s) and so will not be recognized as an inflow of resources (revenue) until FPUA reaches the period to which the resources belong.
FPUA has the following items that qualify for reporting under this section:
Deferred Pension Outflows and Inflows in accordance with the implementation of GASB 68.
Purchased Power and Gas Over-Recovery.
Deferred Amount on the refunding of Revenue Bonds Series 2016.
Net Position – FPUA’s equity is presented as net position and displayed in six components:
Net Investment in Capital Assets – Consists of capital assets, contributed capital assets and capital leases, net of accumulated depreciation and reduced by the outstanding balances of any bonds and related debt that is attributable to the acquisition, construction, or improvement of those assets.
Restricted Capital Improvement Charges – Consists of the unspent Capital Improvement Charges (CIC's) collected in the Electric, Water and Wastewater Systems. The respective balances as of September 30, 2016 are $379, $3,807, and $1,027. Electric CIC’s are used to fund the cash outlay or debt service associated with the expansion of Electric Substations and Electric Transmission & Distribution Systems. In the Water and Wastewater Systems, CIC’s are used to fund the cash outlay or debt service associated with specific expansion and growth related projects.
Restricted for Debt Service – Consists of $5,457 in net position set aside for payment of principal and interest on the 2009 Utilities Revenue Refunding Bonds and additional amounts in accordance with FPUA’s Master Bond Resolution, as revised in 2012.
Restricted for Emergencies – Consists of $900 in net position, set aside for emergencies which is limited to paying for repairs or replacements of FPUA capital assets damaged or destroyed by a disaster.
Restricted for Renewals and Replacements – Consists of $500 in net position which is limited to paying for the cost of extensions, enlargements or additions to or the replacement of FPUA capital assets.
Unrestricted – All other net position that do not meet the definition of “restricted” or “net investment in capital assets”.
31
FORT PIERCE UTILITIES AUTHORITY Notes to Financial Statements
September 30, 2016 (Dollars in Thousands)
NOTE A - continued
Comparative data
Certain reclassifications have been made in order to provide a consistent and comparative understanding of the changes in the financial position and the results of operations of FPUA.
Budget Process
FPUA is required to prepare, adopt, and furnish a copy to the City Commission of the City of Fort Pierce an annual budget at least 45 days prior to the beginning of the next fiscal year. The annual budget and any amendments thereto shall be in effect when approved by FPUA and when any line item expense has not been disapproved by four-fifths (4/5) vote of the City Commission within 30 days of submission. The budget is prepared on the accrual basis. The budget and amendments thereto, for the year ended September 30, 2016, have been approved according to the above procedures.
Subsequent Events
Management has performed an analysis of the activities and transactions subsequent to September 30, 2016 to determine the need for any adjustments to and/or disclosures within the audited financial statements for the year ended September 30, 2016. Management has performed their analysis through February 23, 2017.
NOTE B – CASH AND INVESTMENTS
Cash Deposits - Florida Statutes require state and local governmental units to deposit monies with a financial institution classified as a "Qualified Public Depository," which is a multiple financial institution pool whereby groups of securities pledged by the various financial institutions provide common collateral for their deposits of public funds. This pool is provided as additional insurance to the federal depository insurance and allows for additional assessments against the member institutions, providing full insurance for public deposits. FPUA had deposits only with qualifying institutions as of September 30, 2016, or with banks in which depository insurance was sufficient to cover the deposit balance. At year-end, FPUA’s carrying amount of deposits was $370 and the bank balance was $89.
Investments – The following investments are considered cash equivalents for purposes of the Statement of Cash Flows (see Note A, Pooled Cash and Investments). FPUA categorizes its fair value measurements within the fair value hierarchy established by generally accepted accounting principals as noted in Note A, GASB No. 72, Fair Value Measurement and Application. FPUA’s investments held throughout the year are principally the same as the investments held as of September 30, 2016. Due to fluctuations in cash flows, FPUA maintains investments in overnight repurchase agreements. The interest income generated on these investments including any gain on investment, for the year ended September 30, 2016, was $74.
32
FORT PIERCE UTILITIES AUTHORITY Notes to Financial Statements
September 30, 2016 (Dollars in Thousands)
As of September 30, 2016, FPUA had the following investments:
Investment Fair Value
Seacoast National Bank Sweep 37,968$
PNC Money Market 7,062
Florida State Board of Administration - Florida PRIME
Local Government Surplus Funds Trust Fund (AAAm) 5,236
Harbor Community Bank Certificate of Deposit 1,724
Total 51,990$
Interest Rate Risk - As a means of limiting its exposure to fair value losses arising from fluctuating interest rates, FPUA’s investment policy states that when interest rates are at historically low levels, funds will be placed in short maturities and that when interest rates are at historically high levels, funds may be placed into longer maturities to lock into these yields.
Credit Risk - FPUA is authorized by Resolution to invest in:
(1) Local Government Surplus Funds Trust Funds.
(2) Negotiable direct obligations of the United States Government, or obligations, the principal and interest of which are unconditionally guaranteed by the United States Government.
(3) Obligations of the federal farm credit banks, the Federal Home Loan Mortgage Corporation, including Federal Home Loan Corporation participation certificates, or the Federal Home Loan Bank or its district banks, or obligations guaranteed by the Government National Mortgage Association, U.S. Treasury, agencies, and instrumentalities.
(4) Repurchase agreements secured by the types of investments listed above, restricted as to acquisition, term, and market value.
(5) Interest-bearing time deposits or savings accounts in banks organized under the laws of this state, in national banks organized under the laws of the United States and doing business and situated in this state, in savings and loan associations which are under state supervision, or in federal savings and loan associations located in this state and organized under federal law and federal supervision, provided that any such deposits are secured by collateral as may be prescribed by law.
33
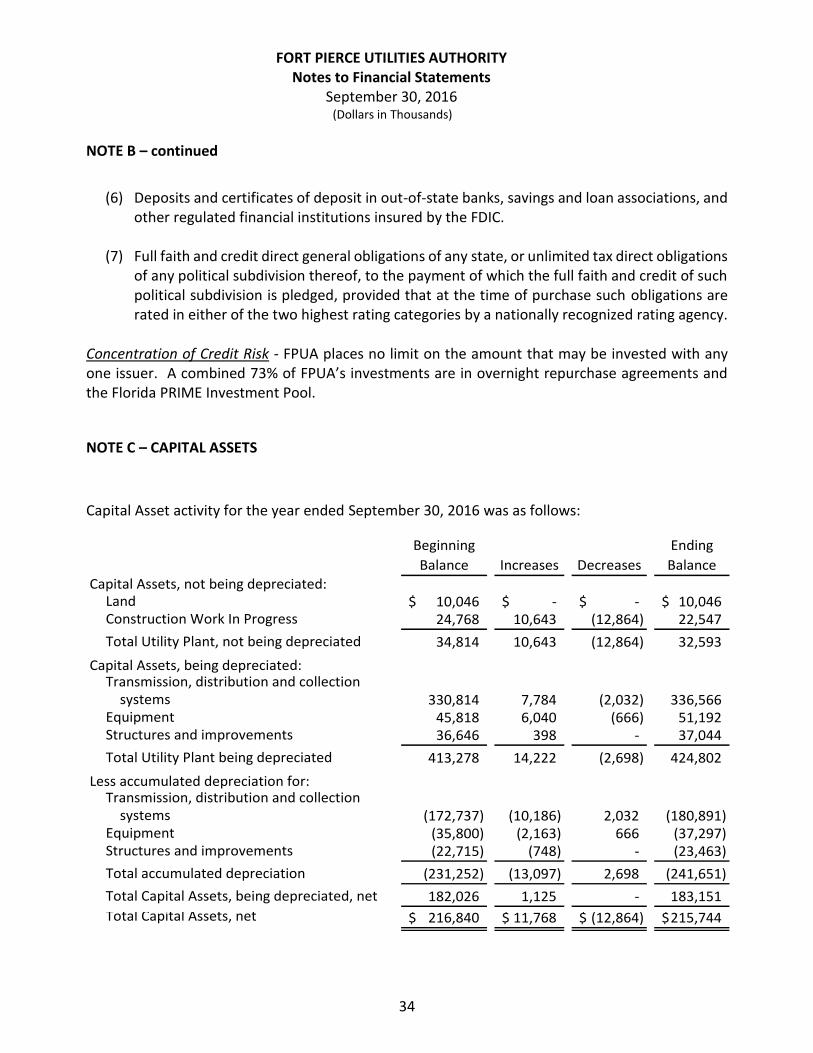
FORT PIERCE UTILITIES AUTHORITY Notes to Financial Statements
September 30, 2016 (Dollars in Thousands)
NOTE B – continued
(6) Deposits and certificates of deposit in out-of-state banks, savings and loan associations, and other regulated financial institutions insured by the FDIC.
(7) Full faith and credit direct general obligations of any state, or unlimited tax direct obligations of any political subdivision thereof, to the payment of which the full faith and credit of such political subdivision is pledged, provided that at the time of purchase such obligations are rated in either of the two highest rating categories by a nationally recognized rating agency.
Concentration of Credit Risk - FPUA places no limit on the amount that may be invested with any one issuer. A combined 73% of FPUA’s investments are in overnight repurchase agreements and the Florida PRIME Investment Pool.
NOTE C – CAPITAL ASSETS
Capital Asset activity for the year ended September 30, 2016 was as follows:
Beginning
Balance Increases Decreases
Ending
Balance
Capital Assets, not being depreciated:Land 10,046$ -$ -$ 10,046$ Construction Work In Progress 24,768 10,643 (12,864) 22,547
Total Utility Plant, not being depreciated 34,814 10,643 (12,864) 32,593
Capital Assets, being depreciated:Transmission, distribution and collection systems 330,814 7,784 (2,032) 336,566 Equipment 45,818 6,040 (666) 51,192 Structures and improvements 36,646 398 - 37,044
Total Utility Plant being depreciated 413,278 14,222 (2,698) 424,802
Less accumulated depreciation for:Transmission, distribution and collection systems (172,737) (10,186) 2,032 (180,891) Equipment (35,800) (2,163) 666 (37,297) Structures and improvements (22,715) (748) - (23,463)
Total accumulated depreciation (231,252) (13,097) 2,698 (241,651)
Total Capital Assets, being depreciated, net 182,026 1,125 - 183,151
Total Capital Assets, net 216,840$ 11,768$ (12,864)$ 215,744$
34

FORT PIERCE UTILITIES AUTHORITY Notes to Financial Statements
September 30, 2016 (Dollars in Thousands)
Depreciation expense was charged to the utility systems as follows:
Electric $ 4,508 Water 4,454 Wastewater 3,743 Gas 313 FPUAnet Communications 73 Manatee Observation and Education Center 6
$13,097
Construction work in progress at September 30, 2016, consists principally of expansions and upgrades to the electric transmission and distribution system, water supply and distribution system, wastewater collection and treatment system, and gas distribution system.
FPUA capitalizes interest costs on funds borrowed to finance the construction of utility plant in conformity with Governmental Accounting Standards Board Statement No. 62. Total interest costs for the year ended September 30, 2016, were $3,445 of which $181 has been capitalized as plant utility construction costs.
FPUA has entered into contracts for the construction or renovation of various system assets as follows:
Required
Upgrade and Project Expended Remaining Further
Expansion Authorization to Date Commitmen Financing
Water 2,875$ 2,018$ 857$ None
Wastewater 820 577 243 None
Gas 190 37 153 None
Electric 7 3 4 None
FPUAnet 5 - 5
3,897$ 2,635$ 1,262$
In addition, FPUA enters into unit price contracts for the construction or renovation of system assets. These contracts are not firm commitments, and the contractors are utilized as needed. As of September 30, 2016, there were no remaining unit price contract commitments for the construction or renovation of FPUA system assets.
35
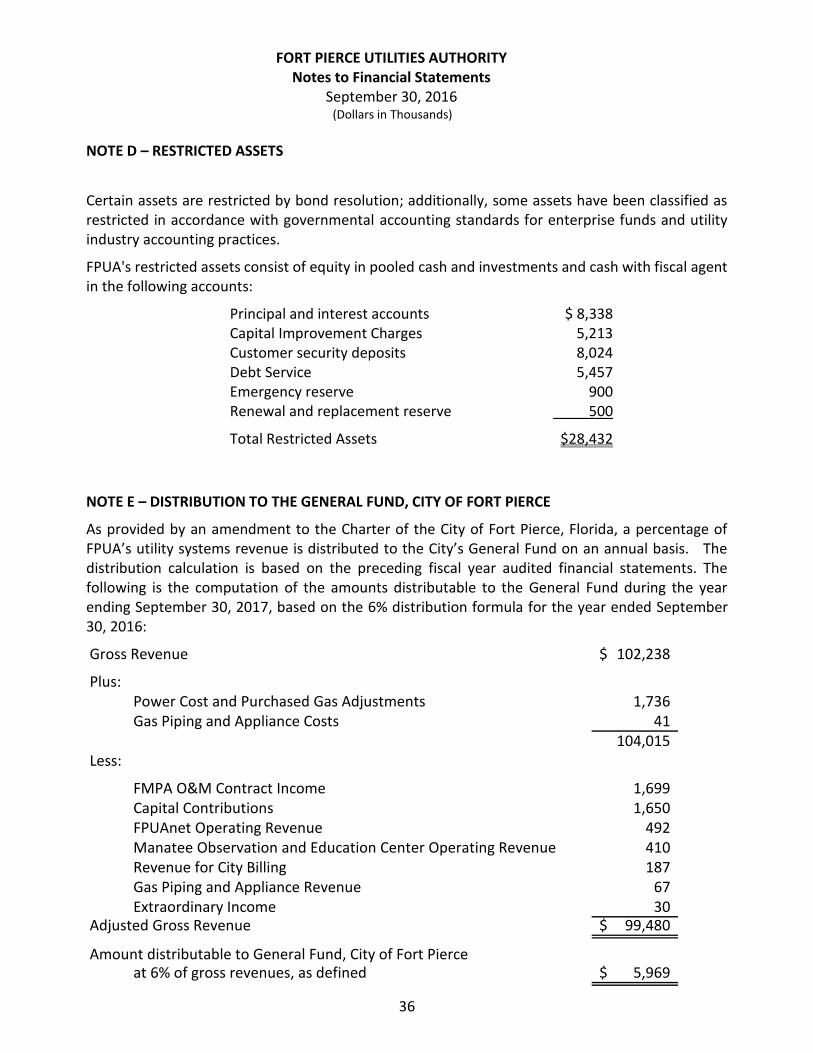
FORT PIERCE UTILITIES AUTHORITY Notes to Financial Statements
September 30, 2016 (Dollars in Thousands)
NOTE D – RESTRICTED ASSETS
Certain assets are restricted by bond resolution; additionally, some assets have been classified as restricted in accordance with governmental accounting standards for enterprise funds and utility industry accounting practices.
FPUA's restricted assets consist of equity in pooled cash and investments and cash with fiscal agent in the following accounts:
Principal and interest accounts $ 8,338 Capital Improvement Charges 5,213 Customer security deposits 8,024 Debt Service 5,457 Emergency reserve 900 Renewal and replacement reserve 500
Total Restricted Assets $28,432
NOTE E – DISTRIBUTION TO THE GENERAL FUND, CITY OF FORT PIERCE
As provided by an amendment to the Charter of the City of Fort Pierce, Florida, a percentage of FPUA’s utility systems revenue is distributed to the City’s General Fund on an annual basis. The distribution calculation is based on the preceding fiscal year audited financial statements. The following is the computation of the amounts distributable to the General Fund during the year ending September 30, 2017, based on the 6% distribution formula for the year ended September 30, 2016:
Gross Revenue 102,238$
Plus:Power Cost and Purchased Gas Adjustments 1,736 Gas Piping and Appliance Costs 41
104,015 Less:
FMPA O&M Contract Income 1,699 Capital Contributions 1,650 FPUAnet Operating Revenue 492 Manatee Observation and Education Center Operating Revenue 410 Revenue for City Billing 187 Gas Piping and Appliance Revenue 67 Extraordinary Income 30
Adjusted Gross Revenue 99,480$
Amount distributable to General Fund, City of Fort Pierceat 6% of gross revenues, as defined 5,969$
36
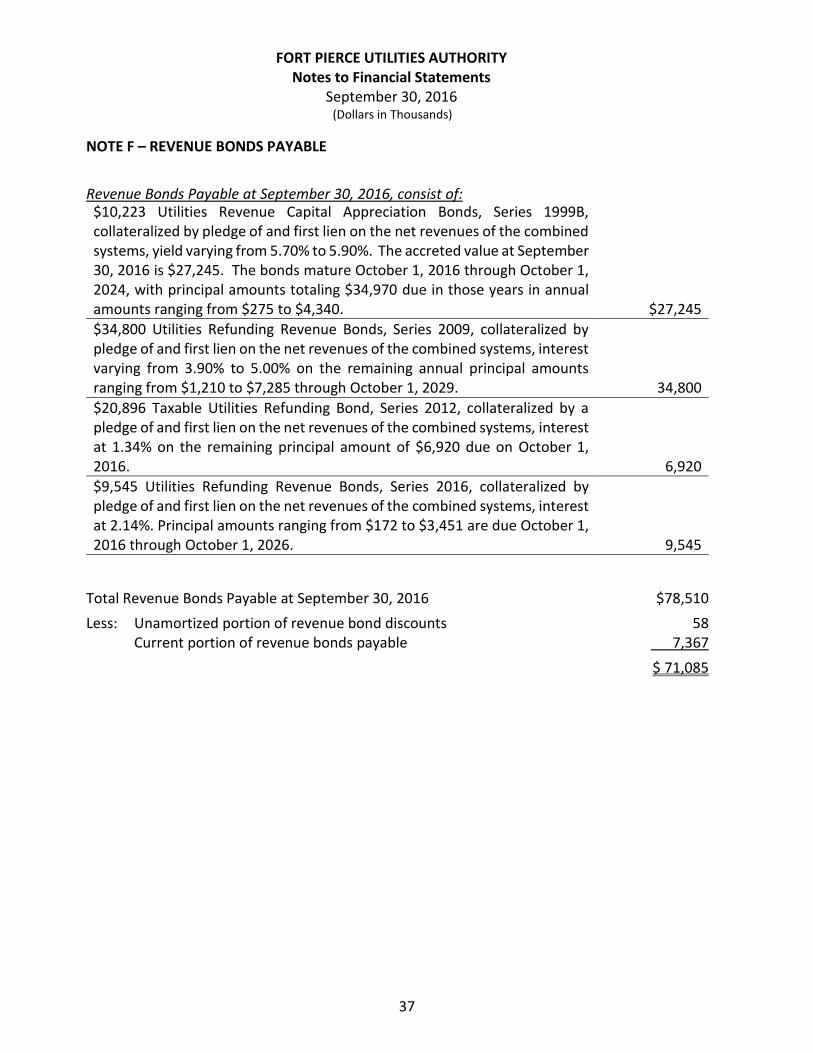
FORT PIERCE UTILITIES AUTHORITY Notes to Financial Statements
September 30, 2016 (Dollars in Thousands)
NOTE F – REVENUE BONDS PAYABLE
Revenue Bonds Payable at September 30, 2016, consist of: $10,223 Utilities Revenue Capital Appreciation Bonds, Series 1999B, collateralized by pledge of and first lien on the net revenues of the combined systems, yield varying from 5.70% to 5.90%. The accreted value at September 30, 2016 is $27,245. The bonds mature October 1, 2016 through October 1, 2024, with principal amounts totaling $34,970 due in those years in annual amounts ranging from $275 to $4,340. $27,245
$34,800 Utilities Refunding Revenue Bonds, Series 2009, collateralized by pledge of and first lien on the net revenues of the combined systems, interest varying from 3.90% to 5.00% on the remaining annual principal amounts ranging from $1,210 to $7,285 through October 1, 2029. 34,800
$20,896 Taxable Utilities Refunding Bond, Series 2012, collateralized by a pledge of and first lien on the net revenues of the combined systems, interest at 1.34% on the remaining principal amount of $6,920 due on October 1, 2016. 6,920
$9,545 Utilities Refunding Revenue Bonds, Series 2016, collateralized by pledge of and first lien on the net revenues of the combined systems, interest at 2.14%. Principal amounts ranging from $172 to $3,451 are due October 1, 2016 through October 1, 2026. 9,545
Total Revenue Bonds Payable at September 30, 2016 $78,510
Less: Unamortized portion of revenue bond discounts 58 Current portion of revenue bonds payable 7,367
$ 71,085
37
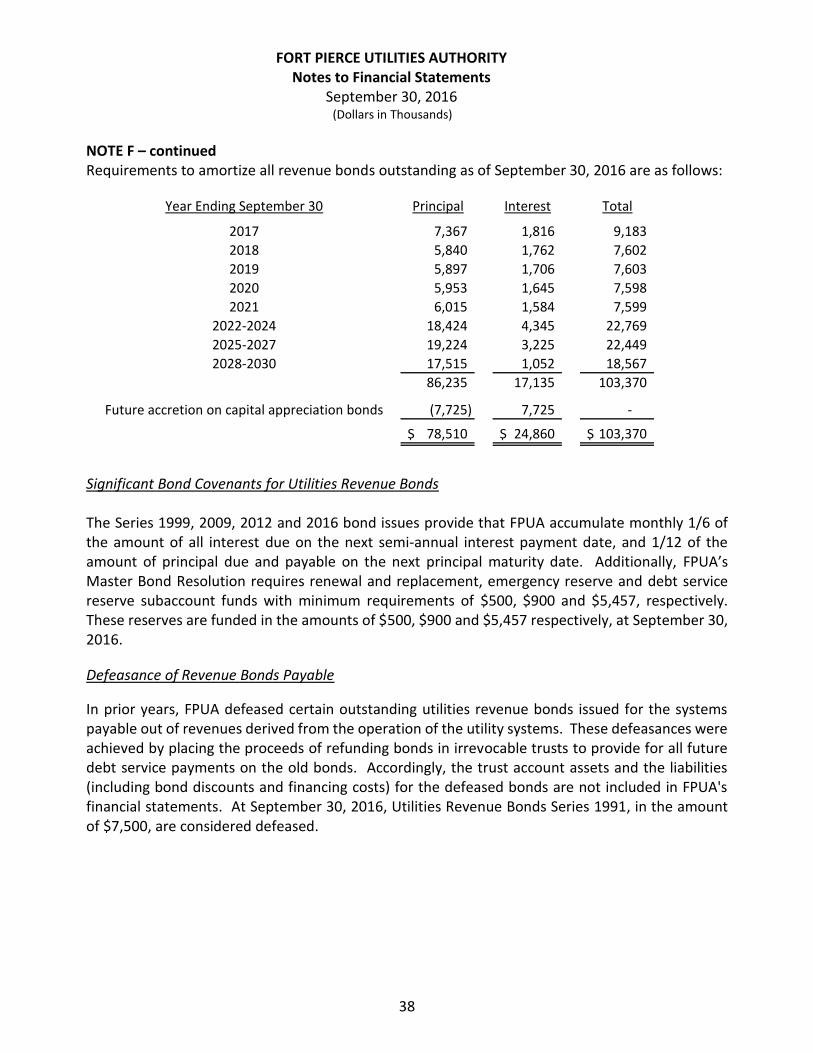
FORT PIERCE UTILITIES AUTHORITY Notes to Financial Statements
September 30, 2016 (Dollars in Thousands)
NOTE F – continued Requirements to amortize all revenue bonds outstanding as of September 30, 2016 are as follows:
Year Ending September 30 Principal Interest Total
2017 7,367 1,816 9,183
2018 5,840 1,762 7,602
2019 5,897 1,706 7,603
2020 5,953 1,645 7,598
2021 6,015 1,584 7,599
2022-2024 18,424 4,345 22,769
2025-2027 19,224 3,225 22,449
2028-2030 17,515 1,052 18,567
86,235 17,135 103,370
Future accretion on capital appreciation bonds (7,725) 7,725 -
78,510$ 24,860$ 103,370$
Significant Bond Covenants for Utilities Revenue Bonds
The Series 1999, 2009, 2012 and 2016 bond issues provide that FPUA accumulate monthly 1/6 of the amount of all interest due on the next semi-annual interest payment date, and 1/12 of the amount of principal due and payable on the next principal maturity date. Additionally, FPUA’s Master Bond Resolution requires renewal and replacement, emergency reserve and debt service reserve subaccount funds with minimum requirements of $500, $900 and $5,457, respectively. These reserves are funded in the amounts of $500, $900 and $5,457 respectively, at September 30, 2016.
Defeasance of Revenue Bonds Payable
In prior years, FPUA defeased certain outstanding utilities revenue bonds issued for the systems payable out of revenues derived from the operation of the utility systems. These defeasances were achieved by placing the proceeds of refunding bonds in irrevocable trusts to provide for all future debt service payments on the old bonds. Accordingly, the trust account assets and the liabilities (including bond discounts and financing costs) for the defeased bonds are not included in FPUA's financial statements. At September 30, 2016, Utilities Revenue Bonds Series 1991, in the amount of $7,500, are considered defeased.
38

FORT PIERCE UTILITIES AUTHORITY Notes to Financial Statements
September 30, 2016 (Dollars in Thousands)
Redemption Options Prior to Maturity
The 2002 Bonds maturing on October 1, 2027 were redeemable prior to their stated date of maturity, at the option of FPUA, beginning April 1, 2012 at par plus accrued interest to the redemption date. On March 4, 2016, FPUA issued Utilities Refunding Revenue Bond, Series 2016, in the amount of $9,545 at a rate of 2.14%, in accordance with the above provision. These Utilities Refunding Bonds carry a deferred amount of $161 at issue date and mature on October 1, 2026. This bond series presents a reduction in interest costs of approximately $2,466 over the life of the bonds. These bonds are redeemable at any time at the option of FPUA. Any full or partial prepayment will carry a fee equal to the greater of (i) 1.00% of the principal balance multiplied by the number of years remaining or (ii) a ‘Yield Maintenance Fee’.
The 2003 Bonds maturing on or after October 1, 2014 were redeemable prior to their stated date of maturity, at the option of FPUA, beginning October 1, 2013 at par. On November 14, 2012, FPUA issued Taxable Utilities Refunding Revenue Bonds, Series 2012 in the amount of $20,896, in order to provide funds for the redemption of $19,940 of the 2003 Bonds, in accordance with the above provisions.
The Series 2009 Bonds maturing on October 1, 2029 with an interest rate of 4.70% are redeemable prior to their stated date of maturity, at the option of FPUA, on or after October 1, 2014 at par plus accrued interest to the redemption date. The Series 2009 Bonds maturing on or after October 1, 2020 (excluding those maturing on October 1, 2029 with an interest rate of 4.70%) are redeemable prior to their stated date of maturity, at the option of FPUA, on or after October 1, 2019 at par plus accrued interest to the redemption date.
NOTE G – CHANGES IN LONG-TERM LIABILITIES Long-term liability activity for the year ended September 30, 2016:
Beginning Ending Due Within
Balance Additions Reductions Balance One Year
Revenue Bonds 84,070$ 18,541$ (24,101)$ 78,510$ 7,367$
Bond Discounts (230) (161) 333 (58) -
Net Pension Liability 5,528 1,127 - 6,655 -
Due to St Lucie County 137 - (6) 131 -
Capital Leases 80 - (31) 49 38
Compensated
Absences 1,762 1,442 (1,402) 1,802 24
Other Post
Employment Benefits 681 61 (31) 711 -
Pollution Remediation 797 - (776) 21 21
Long Term Liabilities 92,825$ 21,010$ (26,014)$ 87,821$ 7,450$
39
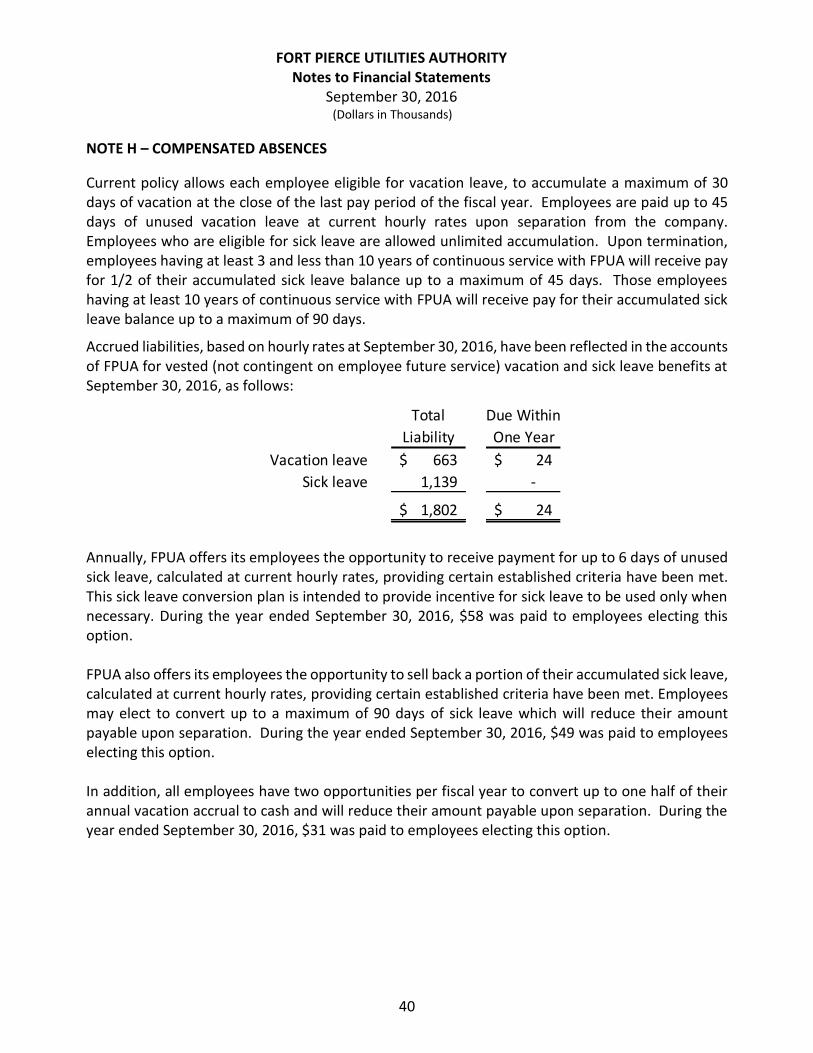
FORT PIERCE UTILITIES AUTHORITY Notes to Financial Statements
September 30, 2016 (Dollars in Thousands)
NOTE H – COMPENSATED ABSENCES
Current policy allows each employee eligible for vacation leave, to accumulate a maximum of 30 days of vacation at the close of the last pay period of the fiscal year. Employees are paid up to 45 days of unused vacation leave at current hourly rates upon separation from the company. Employees who are eligible for sick leave are allowed unlimited accumulation. Upon termination, employees having at least 3 and less than 10 years of continuous service with FPUA will receive pay for 1/2 of their accumulated sick leave balance up to a maximum of 45 days. Those employees having at least 10 years of continuous service with FPUA will receive pay for their accumulated sick leave balance up to a maximum of 90 days.
Accrued liabilities, based on hourly rates at September 30, 2016, have been reflected in the accounts of FPUA for vested (not contingent on employee future service) vacation and sick leave benefits at September 30, 2016, as follows:
Total Due Within
Liability One Year
Vacation leave 663$ 24$
Sick leave 1,139 -
1,802$ 24$
Annually, FPUA offers its employees the opportunity to receive payment for up to 6 days of unused sick leave, calculated at current hourly rates, providing certain established criteria have been met. This sick leave conversion plan is intended to provide incentive for sick leave to be used only when necessary. During the year ended September 30, 2016, $58 was paid to employees electing this option.
FPUA also offers its employees the opportunity to sell back a portion of their accumulated sick leave, calculated at current hourly rates, providing certain established criteria have been met. Employees may elect to convert up to a maximum of 90 days of sick leave which will reduce their amount payable upon separation. During the year ended September 30, 2016, $49 was paid to employees electing this option.
In addition, all employees have two opportunities per fiscal year to convert up to one half of their annual vacation accrual to cash and will reduce their amount payable upon separation. During the year ended September 30, 2016, $31 was paid to employees electing this option.
40
FORT PIERCE UTILITIES AUTHORITY Notes to Financial Statements
September 30, 2016 (Dollars in Thousands)
NOTE I – RETIREMENT AND BENEFIT SYSTEM
Plan Description
The City of Fort Pierce Retirement and Benefit System (the System) is a cost-sharing multiple employer Public Employees Retirement System (PERS) defined benefit plan administered by the City of Fort Pierce, covering all municipal employees, including employees of FPUA. The System does not issue a stand-alone financial report; however the financial information is included in the financial statements of the City of Fort Pierce, which can be obtained by submitting a request to 100 North U.S. Highway 1, Fort Pierce, Florida 34950. Except for the Director of Utilities, participation in the System is compulsory for all employees of FPUA. Employees working more than 25 hours per week are required to participate upon employment.
Per the City of Fort Pierce Code of Ordinances, Ch. 13, Art. II, Div. 1, Sec. 13-40, FPUA employees are required to contribute 6.16% of their annual salary to the System. FPUA is required to contribute amounts actuarially determined annually which, together with member contributions, are sufficient to fund the System. The System also provides death and disability benefits and is governed by state statute and city ordinance. Changes to benefits may be made with the approval of the Fort Pierce City Commission.
Actuarial Methods and Assumptions
GASB Statement No. 68 (GASB 68) identifies the methods and assumptions that should be used to project benefit payments, discount those payments to their present value, and attribute that present value to employee periods of service. The assumptions used in this valuation include the expected rate of return on pension investments to be 8.00%; the long-term municipal bond rate of 3.06%; and the resulting Single Discount Rate of 8.00%. The wage inflation rate assumed was 4.50%. Mortality tables used were the RP-2000 Combined Mortality Tables for males and females with no margin for future improvements. Cost-of-Living Adjustments (COLAs) are granted if the investment return exceeds the investment return assumption and the cumulative actuarial gains and losses since 1995. Based on these assumptions. The pension plan’s Fiduciary Net Position was projected to be available to make all projected future benefit payments of current plan members.
Funding Status and Progress
Employer contributions to the System, based upon the annual covered payroll, made in accordance with actuarially determined requirements was $4,211 (15.4%) for the fiscal year ended September 30, 2016. The two preceding years’ contributions to the System and percent of covered payroll were $4,356 (16.51%) for 2014 and $4,093 (15.66%) for 2015.
41
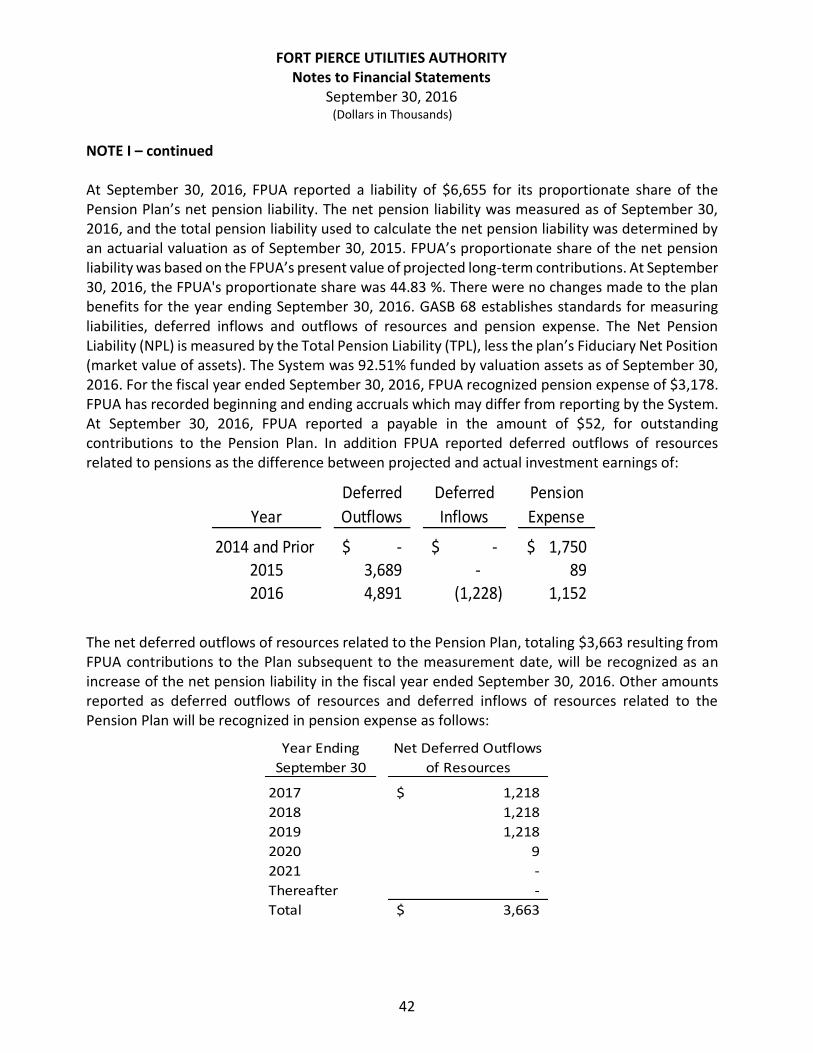
FORT PIERCE UTILITIES AUTHORITY Notes to Financial Statements
September 30, 2016 (Dollars in Thousands)
NOTE I – continued
At September 30, 2016, FPUA reported a liability of $6,655 for its proportionate share of the Pension Plan’s net pension liability. The net pension liability was measured as of September 30, 2016, and the total pension liability used to calculate the net pension liability was determined by an actuarial valuation as of September 30, 2015. FPUA’s proportionate share of the net pension liability was based on the FPUA’s present value of projected long-term contributions. At September 30, 2016, the FPUA's proportionate share was 44.83 %. There were no changes made to the plan benefits for the year ending September 30, 2016. GASB 68 establishes standards for measuring liabilities, deferred inflows and outflows of resources and pension expense. The Net Pension Liability (NPL) is measured by the Total Pension Liability (TPL), less the plan’s Fiduciary Net Position (market value of assets). The System was 92.51% funded by valuation assets as of September 30, 2016. For the fiscal year ended September 30, 2016, FPUA recognized pension expense of $3,178. FPUA has recorded beginning and ending accruals which may differ from reporting by the System. At September 30, 2016, FPUA reported a payable in the amount of $52, for outstanding contributions to the Pension Plan. In addition FPUA reported deferred outflows of resources related to pensions as the difference between projected and actual investment earnings of:
Year
Deferred
Outflows
Deferred
Inflows
Pension
Expense
2014 and Prior -$ -$ 1,750$ 2015 3,689 - 89
2016 4,891 (1,228) 1,152
The net deferred outflows of resources related to the Pension Plan, totaling $3,663 resulting from FPUA contributions to the Plan subsequent to the measurement date, will be recognized as an increase of the net pension liability in the fiscal year ended September 30, 2016. Other amounts reported as deferred outflows of resources and deferred inflows of resources related to the Pension Plan will be recognized in pension expense as follows:
Year Ending
September 30
Net Deferred Outflows
of Resources
2017 1,218$
2018 1,218
2019 1,218
2020 9
2021 -
Thereafter -
Total 3,663$
42
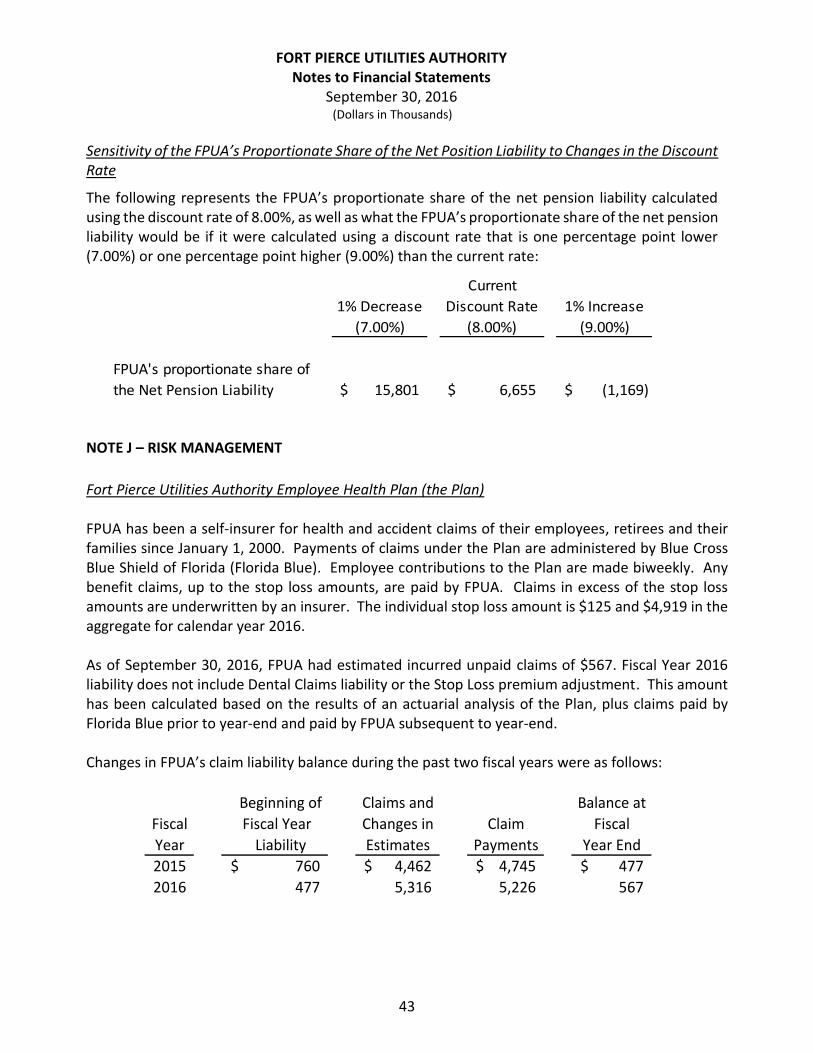
FORT PIERCE UTILITIES AUTHORITY Notes to Financial Statements
September 30, 2016 (Dollars in Thousands)
Sensitivity of the FPUA’s Proportionate Share of the Net Position Liability to Changes in the Discount Rate
The following represents the FPUA’s proportionate share of the net pension liability calculated using the discount rate of 8.00%, as well as what the FPUA’s proportionate share of the net pension liability would be if it were calculated using a discount rate that is one percentage point lower (7.00%) or one percentage point higher (9.00%) than the current rate:
1% Decrease
(7.00%)
Current
Discount Rate
(8.00%)
1% Increase
(9.00%)
FPUA's proportionate share of
the Net Pension Liability 15,801$ 6,655$ (1,169)$
NOTE J – RISK MANAGEMENT
Fort Pierce Utilities Authority Employee Health Plan (the Plan)
FPUA has been a self-insurer for health and accident claims of their employees, retirees and their families since January 1, 2000. Payments of claims under the Plan are administered by Blue Cross Blue Shield of Florida (Florida Blue). Employee contributions to the Plan are made biweekly. Any benefit claims, up to the stop loss amounts, are paid by FPUA. Claims in excess of the stop loss amounts are underwritten by an insurer. The individual stop loss amount is $125 and $4,919 in the aggregate for calendar year 2016.
As of September 30, 2016, FPUA had estimated incurred unpaid claims of $567. Fiscal Year 2016 liability does not include Dental Claims liability or the Stop Loss premium adjustment. This amount has been calculated based on the results of an actuarial analysis of the Plan, plus claims paid by Florida Blue prior to year-end and paid by FPUA subsequent to year-end.
Changes in FPUA’s claim liability balance during the past two fiscal years were as follows:
Beginning of Claims and Balance at
Fiscal Fiscal Year Changes in Claim Fiscal
Year Liability Estimates Payments Year End
2015 760$ 4,462$ 4,745$ 477$
2016 477 5,316 5,226 567
43
FORT PIERCE UTILITIES AUTHORITY Notes to Financial Statements
September 30, 2016 (Dollars in Thousands)
NOTE J – continued
Other Risks of Loss
FPUA is exposed to various other risks of loss related to torts; theft of, damage to, and destruction of assets; errors and omissions; injuries to employees; and natural disasters for which FPUA carries commercial insurance. Settled claims resulting from these risks have not exceeded the commercial insurance coverage plus FEMA and State reimbursements in any of the past three fiscal years.
NOTE K – POSTEMPLOYMENT HEALTH CARE BENEFITS
Benefit Description - FPUA provides certain health care benefits for retired employees and their families, as a single-employer (see Note J). Substantially all FPUA employees may become eligible for those benefits if they reach normal retirement age while working for FPUA. FPUA establishes the benefits provided to its employees and retirees and may amend the benefits as business conditions and statutory requirements change. In accordance with Florida Statutes, FPUA allows their retirees to participate in the same Plan offered to their active employees.
Funding Policy - Contributions to the Plan are made by the 41 participating retirees. The amount of contributions made by retirees is established annually and is an amount equivalent to the contribution made by active employees plus FPUA’s cost, based on a four-tiered benefit structure. During the fiscal year, retirees paid required contributions of $214 for the year then ended. Claims in excess of the aforementioned rates are funded by FPUA on a pay-as-you-go basis.
Annual OPEB Cost and Net OPEB Obligation - FPUA’s annual other postemployment benefit (OPEB) cost (expense) is calculated based on the annual required contribution (ARC) of the employer, an amount actuarially determined in accordance with the parameters of GASB Statement 45. The ARC represents a level of funding that would cover normal costs each year and amortize any unfunded actuarial liabilities (or funding excess) using a level-dollar payment method over a 30-year open period. A separate actuarial valuation report for postemployment benefits is available on FPUA’s website at www.fpua.com.
44
FORT PIERCE UTILITIES AUTHORITY Notes to Financial Statements
September 30, 2016 (Dollars in Thousands)
The following table shows the components of FPUA’s annual OPEB cost for the year, the amount actually contributed to the Plan, and changes in FPUA’s net OPEB obligation:
Annual required contribution 72$
Interest on Net OPEB Obligation 27
Adjustment on annual required contribution (38)
Annual OPEB Cost 61
Contributions made (30)
Interest on contributions (1)
Increase in Net OPEB Obligation 30
Net OPEB Obligation - beginning of year 681
Net OPEB Obligation - end of year 711$
FPUA’s annual OPEB cost, the percentage of annual OPEB cost contributed to the Plan, the net OPEB obligation for FY 2016, and the two preceding years were as follows:
Fiscal Year
Ended Annual
OPEB Cost
Percentage of Annual OPEB
Cost Contributed
Net OPEB (Asset)/
Obligation
2014 2015 2016
$83 84 61
30.1% 29.8% 49.2%
$ 622 681 711
Funded Status and Funding Progress - The net OPEB obligation was not funded as of October 1, 2016, the most recent actuarial valuation date. As a result, the unfunded actuarial accrued liability (UAAL) for benefits was $609. The covered payroll (annual payroll of active employees covered) was $15,032. Therefore, the ratio of the UAAL to the covered payroll was 4.1%.
Actuarial valuations of an ongoing plan involve estimates of the value of reported amounts and assumptions about the probability of occurrence of events far into the future. Examples include assumptions about future employment, mortality, and the healthcare cost trend. Amounts determined regarding the funded status of the Plan and the annual required contributions of the employer are subject to continual revision as actual results are compared with past expectations and new estimates are made about the future. The schedule of funding progress, presented as required supplementary information following the notes to the financial statements, presents multiyear trend information about whether the actuarial value of plan assets is increasing or decreasing over time relative to the actuarial accrued liabilities for benefits.
45
FORT PIERCE UTILITIES AUTHORITY Notes to Financial Statements
September 30, 2016 (Dollars in Thousands)
NOTE K – continued
Actuarial Methods and Assumptions - Projections of benefits for financial reporting purposes are based on the substantive Plan (the Plan as understood by the employer and the plan members) and include the types of benefits provided at the time of each valuation and the historical pattern of sharing of benefit costs between the employer and plan members to that point. The actuarial methods and assumptions used include techniques that are designed to reduce the effects of short-term volatility in actuarial accrued liabilities and the actuarial value of assets, consistent with the long-term perspective of the calculations.
In the October 1, 2016 actuarial valuation, the projected unit credit cost method was used. Under this method, past service liability is determined on an individual basis by applying the ratio of each individual’s past service to his total projected service. The actuarial assumptions included a 4.0% investment rate of return, with 2.75% of this amount being attributed to inflation, based on the expected long-term return on FPUA’s surplus funds. The cost of covered medical services has been assumed to increase at the rate of 5.0% per year, compounded annually. The UAAL is being amortized using a 30-year open level-dollar amortization method.
NOTE L – CAPITAL LEASES
On January 4, 2013, FPUA entered into a lease with Pitney Bowes and committed to a new five-year capital lease for equipment and software used for billing and mailing. The equipment has been capitalized at its fair market value (FMV) of $142. As of September 30, 2016 the FMV less accumulated amortization was $35. The effective interest/maintenance expense for the year ended September 30, 2016 was $12. Future lease payments for this capital lease are as follows:
Year ending September 30 Amount
2017 38
2018 11
$49
NOTE M – TRANSACTIONS WITH THE CITY OF FORT PIERCE
As an enterprise fund of the City of Fort Pierce, transactions occur between FPUA and the City throughout the year in the ordinary course of operations. Below is a summary of significant transactions:
Metered and Non-metered Service Charges - FPUA bills the City on a monthly basis for all non-metered and metered services in the ordinary course of business. Total amounts charged to the City for the year ended September 30, 2016, were $1,600.
46

FORT PIERCE UTILITIES AUTHORITY Notes to Financial Statements
September 30, 2016 (Dollars in Thousands)
Sanitation and Utility Tax Billings - Charges to City residents for sanitation and utility tax are included on FPUA's monthly billing statements to customers as a service to the City. FPUA acts only as an agent, with all cash collections relating to these charges forwarded monthly to the City. The City is charged $187 annually by FPUA to bill, collect and remit payment for sanitation services.
Current accounts receivable from the City at September 30, 2016, totaled $207. Disbursements made to the City by FPUA, including payments of utility tax, sanitation charges collected and other routine charges for the year ended September 30, 2016, were $9021. In addition, FPUA paid the September 30, 2015 General Fund distribution to the City in the amount of $5,809. Amounts payable to the City at September 30, 2016, were $794.
Vehicle Fuel - The City charges FPUA on a monthly basis for fuel used by FPUA vehicles. FPUA’s fueling system reciprocates and can fuel City vehicles at their convenience.
Advance Distribution to the General Fund – FPUA entered into an agreement with the City to provide an advance on future distributions to the General Fund. FPUA disbursed $1,250 during the year ending September 30, 2014. The City repaid this advance in December 2016 including interest accrued at the average interest rate earned by FPUA on its investments. Through September 30, 2016 interest in the amount of $3 has been accrued and is included in the current accounts receivable balance.
NOTE N – CONTRACT COMMITMENTS
FMPA All-Requirements Power Supply Project
As of January 1, 1998, FPUA became a participant in the Florida Municipal Power Agency’s (FMPA) All-Requirements Power Supply Project (hereinafter referred to as ARP). FPUA has agreed to purchase its total bulk power requirements, in excess of certain excluded resources, from the ARP through October 1, 2033.
Prior to being involved in the ARP, FPUA had Project Support Contracts and Power Sales Contracts with FMPA regarding Stanton Unit No. 1 (Stanton and Tri-City Projects) and Stanton Unit No. 2, coal-fired plants constructed by the Orlando Utilities Commission. FPUA’s resources, which have been assigned, include the contracts with FMPA related to Stanton Unit No. 1 and Stanton Unit No. 2, and to part of the contract with Florida Gas Transmission for the purchase of firm capacity natural gas (See below). The contracts related to the St. Lucie Project, also detailed below, have not been assigned; however, as of January 1, 1998, FPUA’s share of transmission costs related to the St. Lucie Project has been assigned to the ARP.
47
FORT PIERCE UTILITIES AUTHORITY Notes to Financial Statements
September 30, 2016 (Dollars in Thousands)
NOTE N – continued
FMPA St. Lucie Project
FPUA has entered into agreements with FMPA, of which it is a member, and with certain other members of FMPA, for entitlement to capacity, energy, and transmission services from Florida Power & Light’s (FP&L) St. Lucie Unit No. 2 (the Unit) which is located on South Hutchinson Island near Fort Pierce, and through a reliability exchange agreement related to St. Lucie Unit No. 1, located at the same site. Pursuant to a Power Sales Contract and a Project Support Contract, FPUA has acquired an entitlement share of FMPA’s allocation of these services. The Power Sales Contract requires payments for each month in which capacity, energy, or transmission services are available from the St. Lucie Project. Payments due each month are based upon an annual budget. Once each year, the excess or deficiency of payments related to actual cost is calculated and applied to the next year’s monthly statements from FMPA to FPUA.
The Power Sales Contract will remain in effect until the latest of (i) the date that the principal, premium, if any, and interest on all bonds have been paid, or funds are set aside for the payment thereof; (ii) the date the Unit is decommissioned or finally disposed of as an electric generating unit pursuant to the Participation Agreement, or FMPA’s interest in the Unit is terminated pursuant to the Participating Agreement or otherwise disposed of; or (iii) the date all obligations of FMPA under the Participation Agreement have been paid, performed, or provided for.
In any month when electric capacity, energy, or transmission services are not made available to FPUA, payment is made to FMPA under a Project Support Contract in a like amount as would have been due under the Power Sales Contract.
Purchases under these contracts are accounted for as operating expenses by FPUA. Total cost included in operating expenses for FY 2015 and FY 2016 was $8,020 and $8,102 respectively. FPUA is committed under the agreements to payments of $7,925 for the year ending September 30, 2016.
Florida Gas Transmission
FPUA executed an All Requirements Gas Services Agreement with Florida Gas Utility (FGU) on January 15, 2002. As a member of the All Requirements project, FPUA is required to purchase natural gas and the firm capacity needed for its delivery through FGU. The firm capacity of natural gas is the availability of the pipeline required to transport the natural gas to FPUA. This agreement will remain in effect until cancelled by FPUA.
On July 3, 2012, FPUA acquired additional firm capacity from the City of Sunrise, Florida in order to meet the needs of new industrial customers. This agreement will remain in effect until July 2, 2017 or until cancelled by FPUA. In FY 2016, additional firm capacity was made available from FGT and FPUA exercised rights to obtain this capacity. An additional 96,800 MMbtu of capacity was obtained. With this additional capacity, the amount of Sunrise capacity was reduced by 45,300 MMbtu via a revised interlocal agreement with the City of Sunrise. In FY 2017, FPUA will be entitled to firm capacity of 566,412 MMbtu, and will be committed to purchase 150,000 MMbtu of natural gas at
48
FORT PIERCE UTILITIES AUTHORITY Notes to Financial Statements
September 30, 2016 (Dollars in Thousands)
an approximate cost of $528. The amounts purchased under these contracts, for FY 2015 and FY 2016 were $1,862 and $1,506 respectively.
FMPA Treasure Coast Energy Center
FPUA has entered into an agreement with FMPA to manage and operate their facility located in St. Lucie County near Fort Pierce. The Treasure Coast Energy Center (TCEC) is a natural gas fueled power generation site. The initial terms of this agreement commenced on July 24, 2007 and expired on September 30, 2011, after which the agreement became a one-year evergreen. The agreement has been extended for the year ended September 30, 2016.
FPUA has been engaged to manage, operate and maintain the TCEC. TCEC employees are on the payroll of FPUA and all costs associated with them are reimbursed bi-weekly by FMPA. TCEC employee costs and revenue for FY 2015 and FY 2016 totaled $1,809 and $1,699 respectively.
NOTE O – EXTRAORDINARY ITEMS
FPUA transferred the ownership of the former site of the Henry D. King Power Plant to the Fort Pierce Redevelopment Agency (FPRA) on October 15, 2009. A grant awarded to the FPRA for the cleanup was not sufficient to cover the cost of remediation. The total actual cost to complete the remediation was slightly less than originally anticipated, as such FPUA has recorded income of $31. Voluntary Cleanup Tax Credits have been estimated to cover $2,285 of the project costs. The remaining amount expected to be paid by FPUA in FY 2017 is $21. Amounts payable to the FPRA at September 30, 2016 were $120. When the work on this project concludes, the final cost will be reevaluated as to the actual amounts received through tax credits.
NOTE P – NONEXCHANGE FINANCIAL GUARANTEES
At September 30, 2016 FPUA had irrevocable letters of credit with Harbor Community Bank, which serve as security for loans from the Treasure Coast Regional Planning Council (TCRPC) to the Fort Pierce Redevelopment Agency (FPRA) for cleanup of environmental contamination at the H.D. King Plant site (See Note O). The remaining balance of these loans as of September 30, 2016 is $702 and will begin to come due on August 20, 2018. No additional loans have been taken as of this report date. The recovery of these funds began in FY 2016 with the sale of the initial Voluntary Cleanup Tax Credits applied for by the FPRA.
49
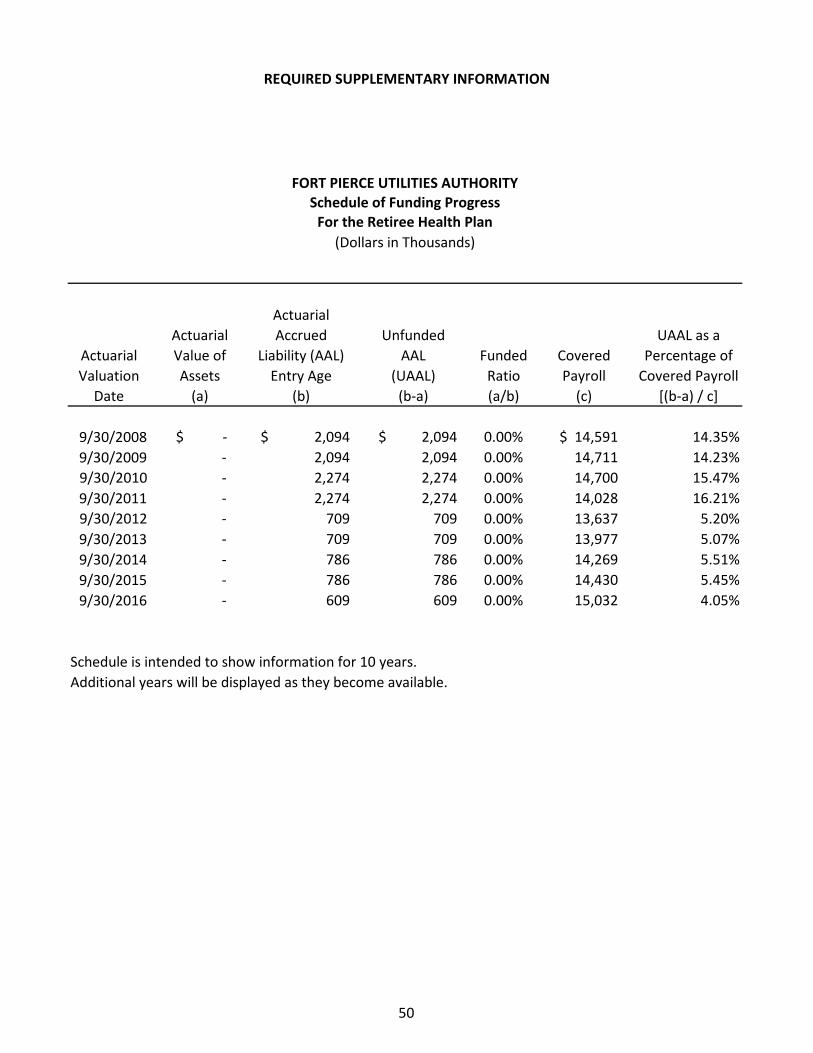
REQUIRED SUPPLEMENTARY INFORMATION
FORT PIERCE UTILITIES AUTHORITY Schedule of Funding Progress
For the Retiree Health Plan
(Dollars in Thousands)
Actuarial
Actuarial Accrued Unfunded UAAL as a
Actuarial Value of Liability (AAL) AAL Funded Covered Percentage of
Valuation Assets Entry Age (UAAL) Ratio Payroll Covered Payroll
Date (a) (b) (b-a) (a/b) (c) [(b-a) / c]
9/30/2008 $ - $ 2,094 $ 2,094 0.00% $ 14,591 14.35%
9/30/2009 - 2,094 2,094 0.00% 14,711 14.23%
9/30/2010 - 2,274 2,274 0.00% 14,700 15.47%
9/30/2011 - 2,274 2,274 0.00% 14,028 16.21%
9/30/2012 - 709 709 0.00% 13,637 5.20%
9/30/2013 - 709 709 0.00% 13,977 5.07%
9/30/2014 - 786 786 0.00% 14,269 5.51%
9/30/2015 - 786 786 0.00% 14,430 5.45%
9/30/2016 - 609 609 0.00% 15,032 4.05%
Schedule is intended to show information for 10 years.
Additional years will be displayed as they become available.
50
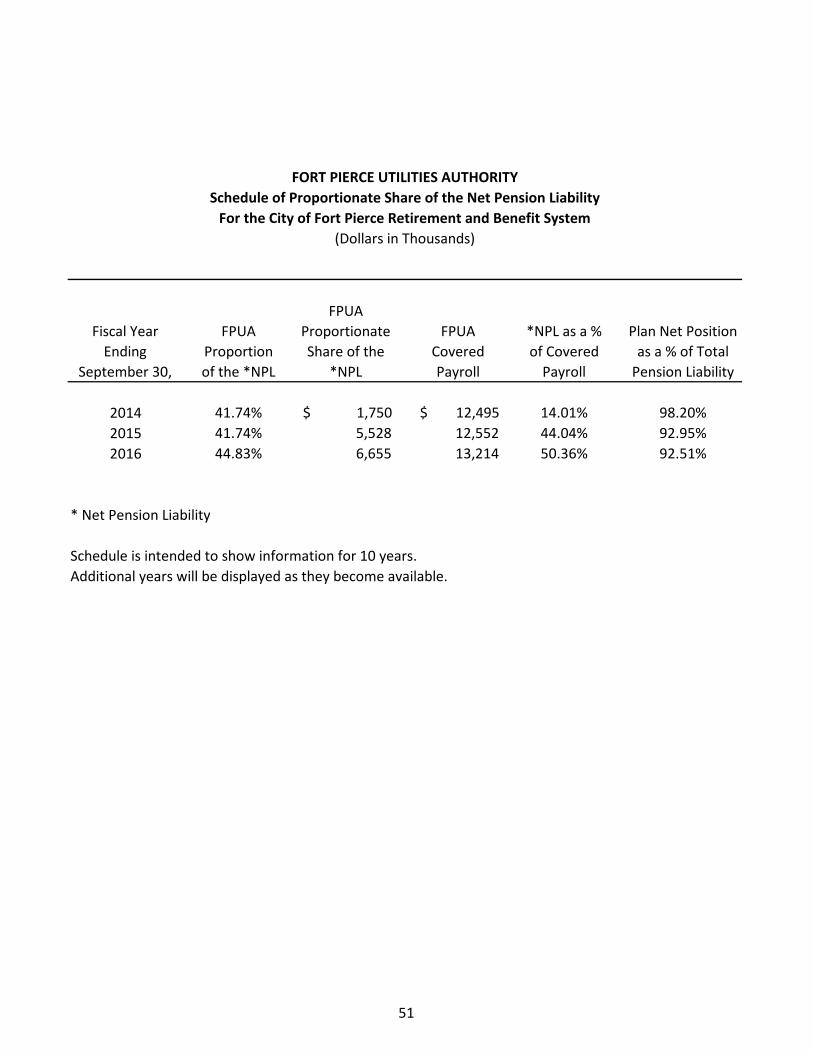
FORT PIERCE UTILITIES AUTHORITY
Schedule of Proportionate Share of the Net Pension Liability
For the City of Fort Pierce Retirement and Benefit System
(Dollars in Thousands)
FPUA
Fiscal Year FPUA Proportionate FPUA *NPL as a % Plan Net Position
Ending Proportion Share of the Covered of Covered as a % of Total
September 30, of the *NPL *NPL Payroll Payroll Pension Liability
2014 41.74% $ 1,750 $ 12,495 14.01% 98.20%
2015 41.74% 5,528 12,552 44.04% 92.95%
2016 44.83% 6,655 13,214 50.36% 92.51%
* Net Pension Liability
Schedule is intended to show information for 10 years.
Additional years will be displayed as they become available.
51

Statistical Section
This part of the Fort Pierce Utilities Authority’s (FPUA) Comprehensive Annual Financial Report presents detailed information as a context for understanding what the information in the financial statements, note disclosure, and required supplementary information says about FPUA’s overall financial health. Statistical information for the current period, as well as nine years prior, is presented in this section. Historical data that is unavailable for the full nine years prior has been presented to include the earliest periods for which that information is readily accessible.
Contents Page
Financial Trends These schedules contain trend information to help the 55-61 reader understand how FPUA’s financial performance and well being has changed over time.
Revenue Capacity These schedules contain information to help the reader 63-72 assess FPUA’s local revenue source.
Debt Capacity These schedules present information to help the reader 73-77 assess FPUA’s debt burden and its ability to issue additional debt in the future.
Demographic and Economic Information This schedule offers demographic and economic 79-81 indicators to help the reader understand the environment in which FPUA’s financial activities take place.
Operating Information These schedules contain service and infrastructure data to 83-92 help the reader understand how the information in FPUA’s financial report relates to the services FPUA provides and the activities it performs.
Sources: Unless otherwise noted, the information in these schedules was obtained from the Comprehensive Annual Financial Reports for the relevant year.
53


Financial Trends
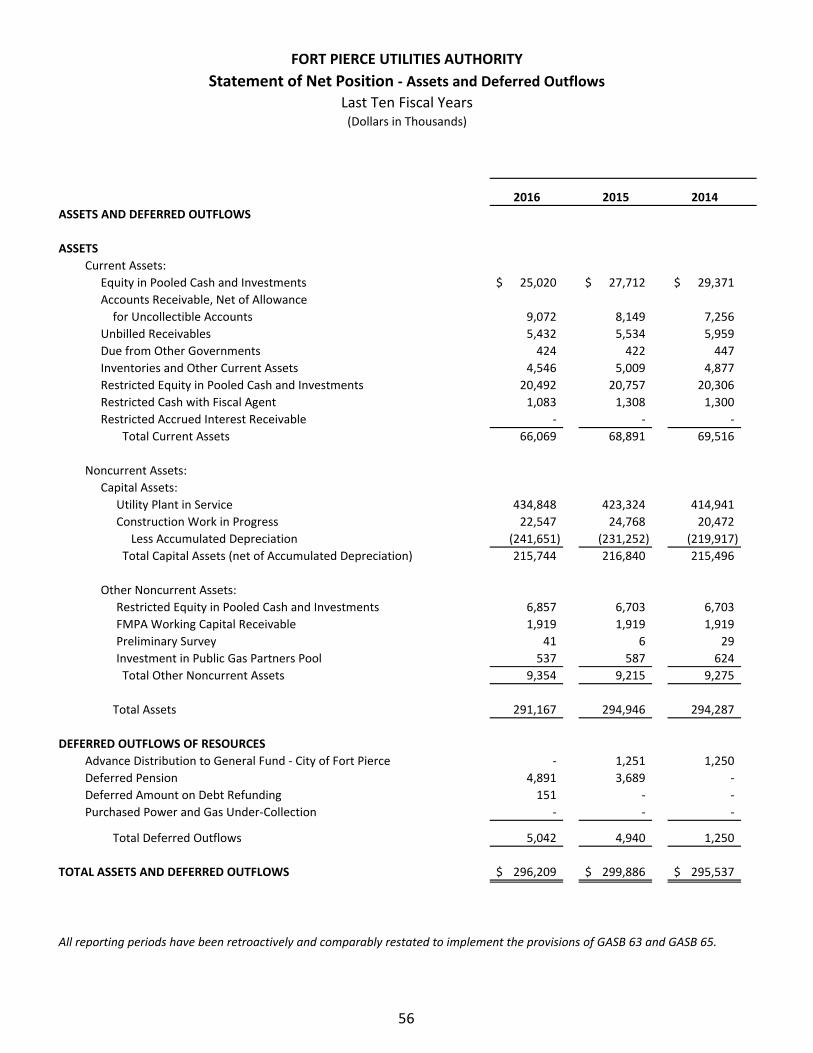
FORT PIERCE UTILITIES AUTHORITY
Statement of Net Position - Assets and Deferred Outflows
Last Ten Fiscal Years (Dollars in Thousands)
2016 2015 2014
ASSETS AND DEFERRED OUTFLOWS
ASSETS
Current Assets:
Equity in Pooled Cash and Investments $ 25,020 $ 27,712 $ 29,371
Accounts Receivable, Net of Allowance
for Uncollectible Accounts 9,072 8,149 7,256
Unbilled Receivables 5,432 5,534 5,959
Due from Other Governments 424 422 447
Inventories and Other Current Assets 4,546 5,009 4,877
Restricted Equity in Pooled Cash and Investments 20,492 20,757 20,306
Restricted Cash with Fiscal Agent 1,083 1,308 1,300
Restricted Accrued Interest Receivable - - -
Total Current Assets 66,069 68,891 69,516
Noncurrent Assets:
Capital Assets:
Utility Plant in Service 434,848 423,324 414,941
Construction Work in Progress 22,547 24,768 20,472
Less Accumulated Depreciation (241,651) (231,252) (219,917)
Total Capital Assets (net of Accumulated Depreciation) 215,744 216,840 215,496
Other Noncurrent Assets:
Restricted Equity in Pooled Cash and Investments 6,857 6,703 6,703
FMPA Working Capital Receivable 1,919 1,919 1,919
Preliminary Survey 41 6 29
Investment in Public Gas Partners Pool 537 587 624
Total Other Noncurrent Assets 9,354 9,215 9,275
Total Assets 291,167 294,946 294,287
DEFERRED OUTFLOWS OF RESOURCES
Advance Distribution to General Fund - City of Fort Pierce - 1,251 1,250
Deferred Pension 4,891 3,689 -
Deferred Amount on Debt Refunding 151 - -
Purchased Power and Gas Under-Collection - - -
Total Deferred Outflows 5,042 4,940 1,250
TOTAL ASSETS AND DEFERRED OUTFLOWS $ 296,209 $ 299,886 $ 295,537
All reporting periods have been retroactively and comparably restated to implement the provisions of GASB 63 and GASB 65.
56
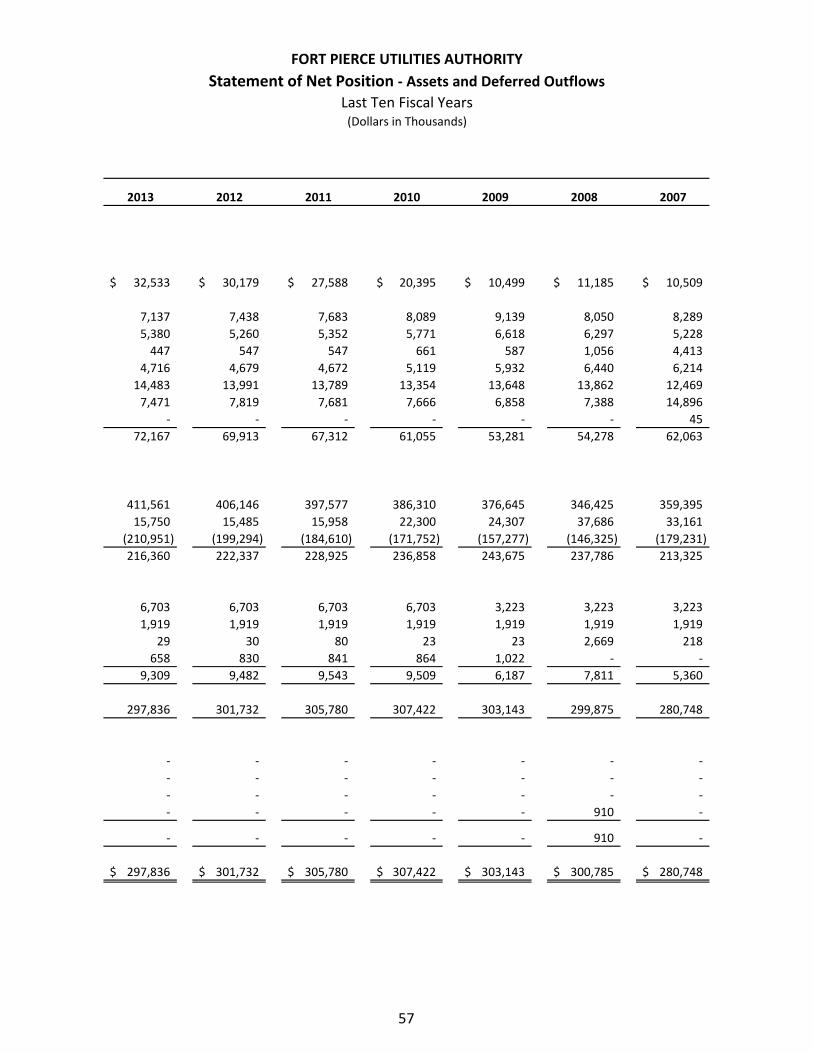
FORT PIERCE UTILITIES AUTHORITY
Statement of Net Position - Assets and Deferred Outflows
Last Ten Fiscal Years (Dollars in Thousands)
2013 2012 2011 2010 2009 2008 2007
$ 32,533 $ 30,179 $ 27,588 $ 20,395 $ 10,499 $ 11,185 $ 10,509
7,137
5,380
447
4,716
14,483
7,471
-
72,167
7,438
5,260
547
4,679
13,991
7,819
-
69,913
7,683
5,352
547
4,672
13,789
7,681
-
67,312
8,089
5,771
661
5,119
13,354
7,666
-
61,055
9,139
6,618
587
5,932
13,648
6,858
-
53,281
8,050
6,297
1,056
6,440
13,862
7,388
-
54,278
8,289
5,228
4,413
6,214
12,469
14,896
45
62,063
411,561
15,750
(210,951)
216,360
406,146
15,485
(199,294)
222,337
397,577
15,958
(184,610)
228,925
386,310
22,300
(171,752)
236,858
376,645
24,307
(157,277)
243,675
346,425
37,686
(146,325)
237,786
359,395
33,161
(179,231)
213,325
6,703
1,919
29
658
9,309
6,703
1,919
30
830
9,482
6,703
1,919
80
841
9,543
6,703
1,919
23
864
9,509
3,223
1,919
23
1,022
6,187
3,223
1,919
2,669
-
7,811
3,223
1,919
218
-
5,360
297,836 301,732 305,780 307,422 303,143 299,875 280,748
-
-
-
-
-
-
-
-
-
-
-
-
-
-
-
-
-
-
-
-
-
-
-
910
-
-
-
-
- - - - - 910 -
$ 297,836 $ 301,732 $ 305,780 $ 307,422 $ 303,143 $ 300,785 $ 280,748
57
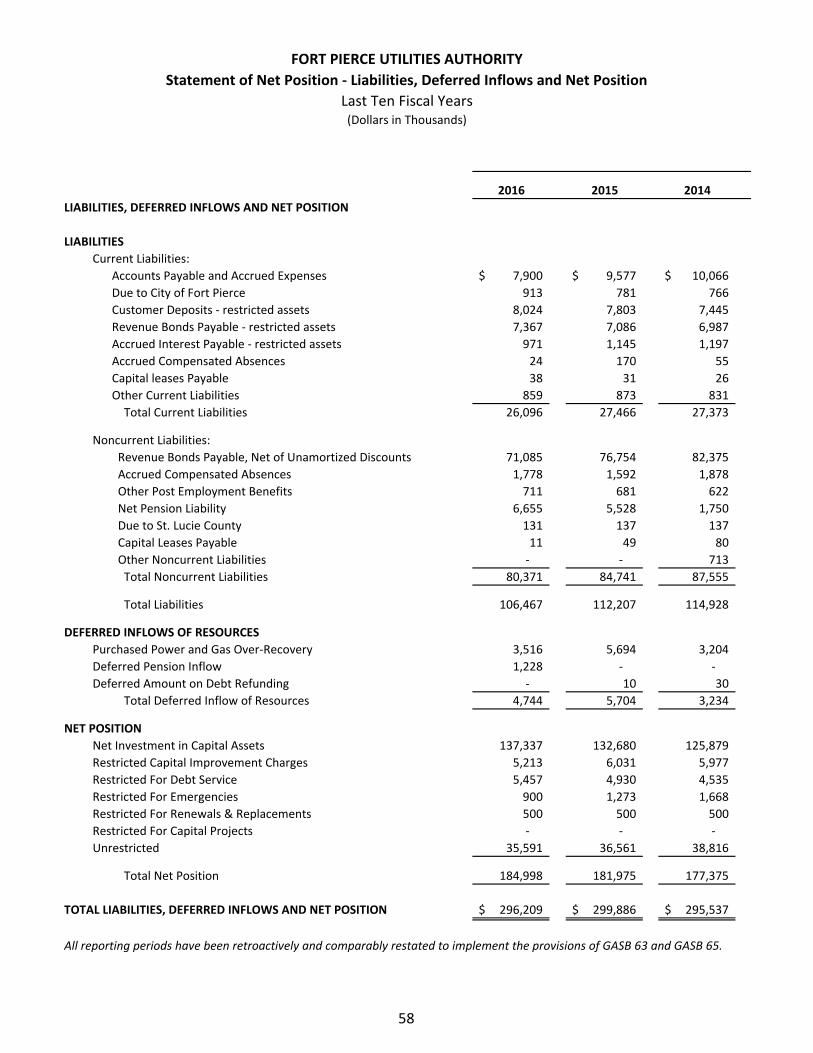
FORT PIERCE UTILITIES AUTHORITY
Statement of Net Position - Liabilities, Deferred Inflows and Net Position
Last Ten Fiscal Years (Dollars in Thousands)
2016 2015 2014
LIABILITIES, DEFERRED INFLOWS AND NET POSITION
LIABILITIES
Current Liabilities:
Accounts Payable and Accrued Expenses $ 7,900 $ 9,577 $ 10,066
Due to City of Fort Pierce 913 781 766
Customer Deposits - restricted assets 8,024 7,803 7,445
Revenue Bonds Payable - restricted assets 7,367 7,086 6,987
Accrued Interest Payable - restricted assets 971 1,145 1,197
Accrued Compensated Absences 24 170 55
Capital leases Payable 38 31 26
Other Current Liabilities 859 873 831
Total Current Liabilities 26,096 27,466 27,373
Noncurrent Liabilities:
Revenue Bonds Payable, Net of Unamortized Discounts 71,085 76,754 82,375
Accrued Compensated Absences 1,778 1,592 1,878
Other Post Employment Benefits 711 681 622
Net Pension Liability 6,655 5,528 1,750
Due to St. Lucie County 131 137 137
Capital Leases Payable 11 49 80
Other Noncurrent Liabilities - - 713
Total Noncurrent Liabilities 80,371 84,741 87,555
Total Liabilities 106,467 112,207 114,928
DEFERRED INFLOWS OF RESOURCES
Purchased Power and Gas Over-Recovery 3,516 5,694 3,204
Deferred Pension Inflow 1,228 - -
Deferred Amount on Debt Refunding - 10 30
Total Deferred Inflow of Resources 4,744 5,704 3,234
NET POSITION
Net Investment in Capital Assets 137,337 132,680 125,879
Restricted Capital Improvement Charges 5,213 6,031 5,977
Restricted For Debt Service 5,457 4,930 4,535
Restricted For Emergencies 900 1,273 1,668
Restricted For Renewals & Replacements 500 500 500
Restricted For Capital Projects - - -
Unrestricted 35,591 36,561 38,816
Total Net Position 184,998 181,975 177,375
TOTAL LIABILITIES, DEFERRED INFLOWS AND NET POSITION $ 296,209 $ 299,886 $ 295,537
All reporting periods have been retroactively and comparably restated to implement the provisions of GASB 63 and GASB 65.
58
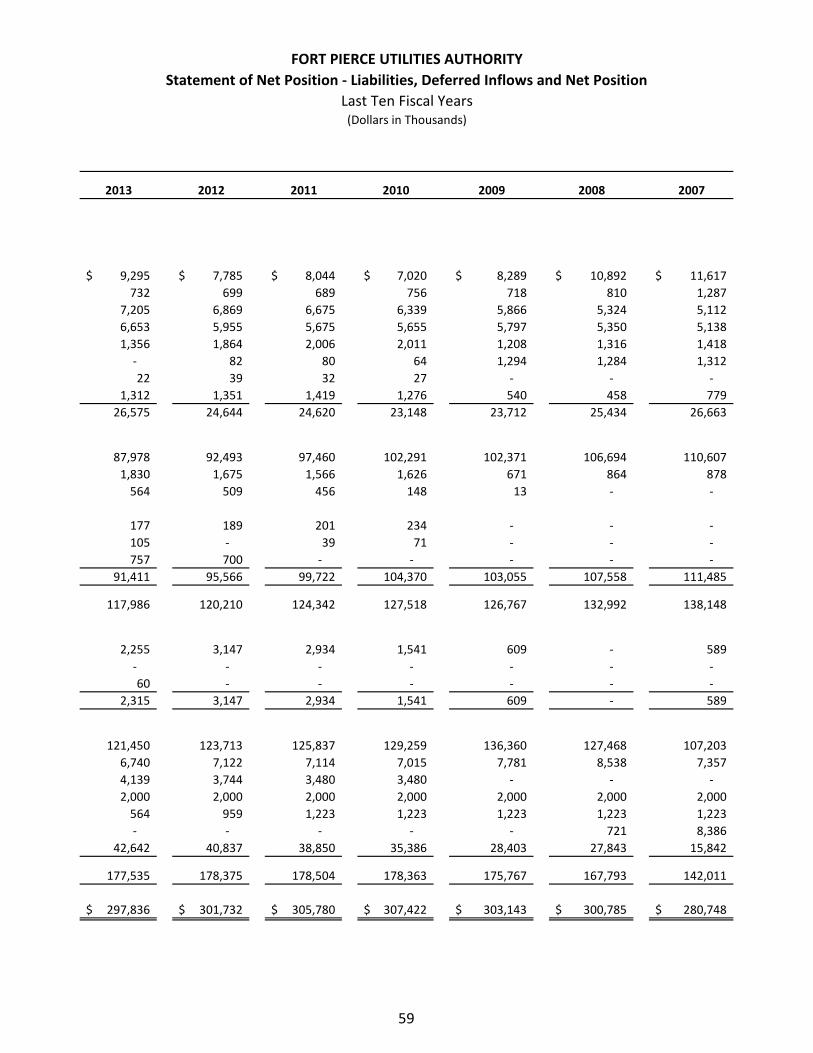
FORT PIERCE UTILITIES AUTHORITY
Statement of Net Position - Liabilities, Deferred Inflows and Net Position
Last Ten Fiscal Years (Dollars in Thousands)
2013 2012 2011 2010 2009 2008 2007
$ 9,295
732
7,205
6,653
1,356
-
22
1,312
26,575
$ 7,785
699
6,869
5,955
1,864
82
39
1,351
24,644
$ 8,044
689
6,675
5,675
2,006
80
32
1,419
24,620
$ 7,020
756
6,339
5,655
2,011
64
27
1,276
23,148
$ 8,289
718
5,866
5,797
1,208
1,294
-
540
23,712
$ 10,892
810
5,324
5,350
1,316
1,284
-
458
25,434
$ 11,617
1,287
5,112
5,138
1,418
1,312
-
779
26,663
87,978
1,830
564
92,493
1,675
509
97,460
1,566
456
102,291
1,626
148
102,371
671
13
106,694
864
-
110,607
878
-
177
105
757
91,411
189
-
700
95,566
201
39
-
99,722
234
71
-
104,370
-
-
-
103,055
-
-
-
107,558
-
-
-
111,485
117,986 120,210 124,342 127,518 126,767 132,992 138,148
2,255
-
3,147
-
2,934
-
1,541
-
609
-
-
-
589
-
60
2,315
-
3,147
-
2,934
-
1,541
-
609
-
-
-
589
121,450
6,740
4,139
2,000
564
-
42,642
123,713
7,122
3,744
2,000
959
-
40,837
125,837
7,114
3,480
2,000
1,223
-
38,850
129,259
7,015
3,480
2,000
1,223
-
35,386
136,360
7,781
-
2,000
1,223
-
28,403
127,468
8,538
-
2,000
1,223
721
27,843
107,203
7,357
-
2,000
1,223
8,386
15,842
177,535 178,375 178,504 178,363 175,767 167,793 142,011
$ 297,836 $ 301,732 $ 305,780 $ 307,422 $ 303,143 $ 300,785 $ 280,748
59
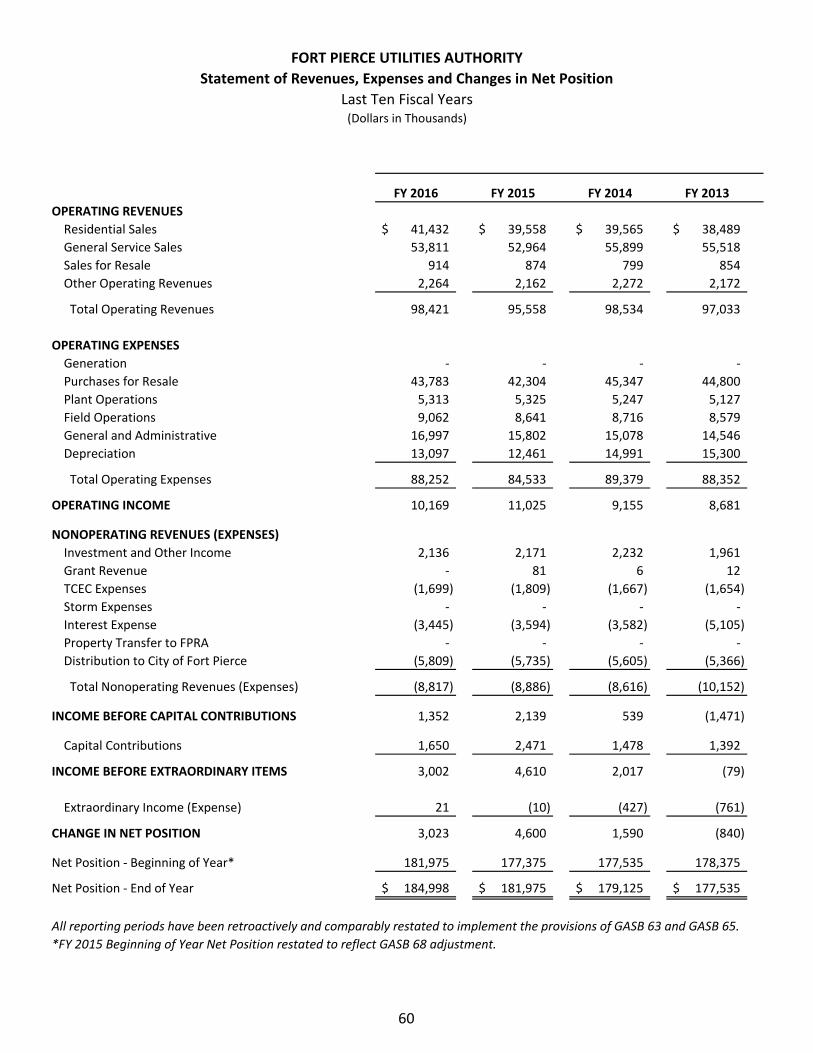
FORT PIERCE UTILITIES AUTHORITY
Statement of Revenues, Expenses and Changes in Net Position
Last Ten Fiscal Years (Dollars in Thousands)
FY 2016 FY 2015 FY 2014 FY 2013
OPERATING REVENUES
Residential Sales $ 41,432 $ 39,558 $ 39,565 $ 38,489
General Service Sales 53,811 52,964 55,899 55,518
Sales for Resale 914 874 799 854
Other Operating Revenues 2,264 2,162 2,272 2,172
Total Operating Revenues 98,421 95,558 98,534 97,033
OPERATING EXPENSES
Generation - - - -
Purchases for Resale 43,783 42,304 45,347 44,800
Plant Operations 5,313 5,325 5,247 5,127
Field Operations 9,062 8,641 8,716 8,579
General and Administrative 16,997 15,802 15,078 14,546
Depreciation 13,097 12,461 14,991 15,300
Total Operating Expenses 88,252 84,533 89,379 88,352
OPERATING INCOME 10,169 11,025 9,155 8,681
NONOPERATING REVENUES (EXPENSES)
Investment and Other Income 2,136 2,171 2,232 1,961
Grant Revenue - 81 6 12
TCEC Expenses (1,699) (1,809) (1,667) (1,654)
Storm Expenses - - - -
Interest Expense (3,445) (3,594) (3,582) (5,105)
Property Transfer to FPRA - - - -
Distribution to City of Fort Pierce (5,809) (5,735) (5,605) (5,366)
Total Nonoperating Revenues (Expenses) (8,817) (8,886) (8,616) (10,152)
INCOME BEFORE CAPITAL CONTRIBUTIONS 1,352 2,139 539 (1,471)
Capital Contributions 1,650 2,471 1,478 1,392
INCOME BEFORE EXTRAORDINARY ITEMS 3,002 4,610 2,017 (79)
Extraordinary Income (Expense) 21 (10) (427) (761)
CHANGE IN NET POSITION 3,023 4,600 1,590 (840)
Net Position - Beginning of Year* 181,975 177,375 177,535 178,375
Net Position - End of Year $ 184,998 $ 181,975 $ 179,125 $ 177,535
All reporting periods have been retroactively and comparably restated to implement the provisions of GASB 63 and GASB 65.
*FY 2015 Beginning of Year Net Position restated to reflect GASB 68 adjustment.
60
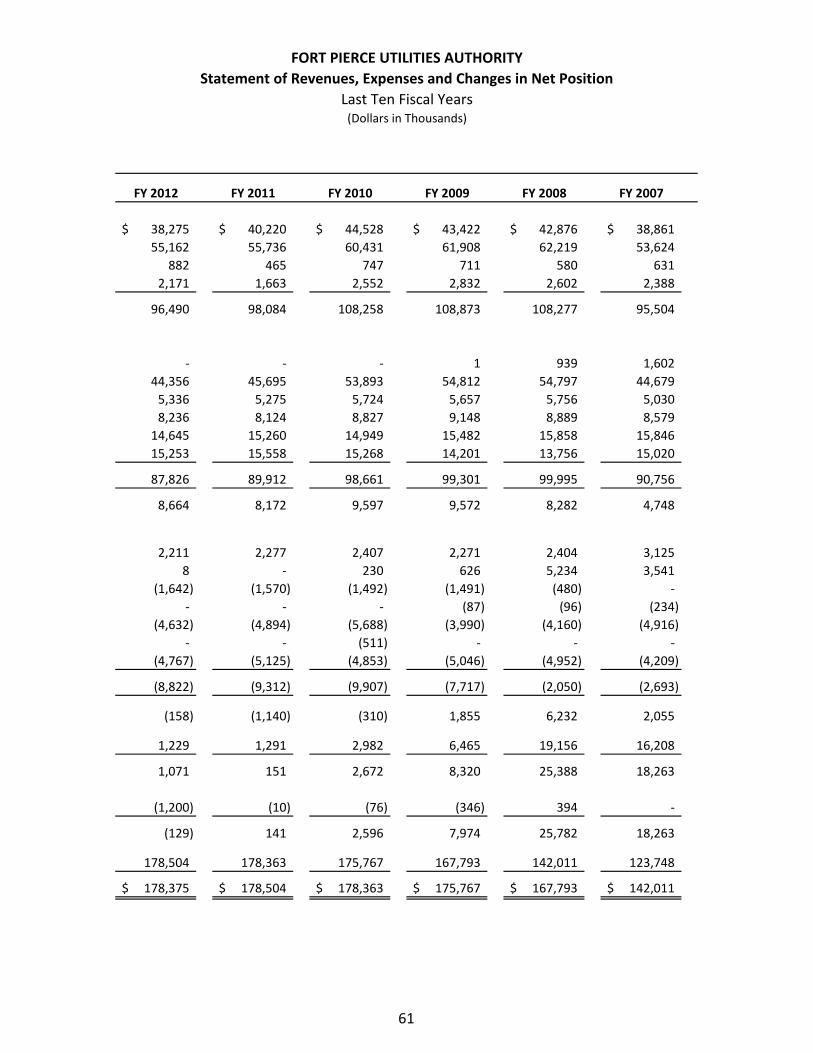
FORT PIERCE UTILITIES AUTHORITY
Statement of Revenues, Expenses and Changes in Net Position
Last Ten Fiscal Years (Dollars in Thousands)
FY 2012 FY 2011 FY 2010 FY 2009 FY 2008 FY 2007
$ 38,275 $ 40,220 $ 44,528 $ 43,422 $ 42,876 $ 38,861
55,162 55,736 60,431 61,908 62,219 53,624
882 465 747 711 580 631
2,171 1,663 2,552 2,832 2,602 2,388
96,490 98,084 108,258 108,873 108,277 95,504
- - - 1 939 1,602
44,356 45,695 53,893 54,812 54,797 44,679
5,336 5,275 5,724 5,657 5,756 5,030
8,236 8,124 8,827 9,148 8,889 8,579
14,645 15,260 14,949 15,482 15,858 15,846
15,253 15,558 15,268 14,201 13,756 15,020
87,826 89,912 98,661 99,301 99,995 90,756
8,664 8,172 9,597 9,572 8,282 4,748
2,211 2,277 2,407 2,271 2,404 3,125
8 - 230 626 5,234 3,541
(1,642) (1,570) (1,492) (1,491) (480) -
- - - (87) (96) (234)
(4,632) (4,894) (5,688) (3,990) (4,160) (4,916)
- - (511) - - -
(4,767) (5,125) (4,853) (5,046) (4,952) (4,209)
(8,822) (9,312) (9,907) (7,717) (2,050) (2,693)
(158) (1,140) (310) 1,855 6,232 2,055
1,229 1,291 2,982 6,465 19,156 16,208
1,071 151 2,672 8,320 25,388 18,263
(1,200) (10) (76) (346) 394 -
(129) 141 2,596 7,974 25,782 18,263
178,504 178,363 175,767 167,793 142,011 123,748
$ 178,375 $ 178,504 $ 178,363 $ 175,767 $ 167,793 $ 142,011
61

Revenue Capacity

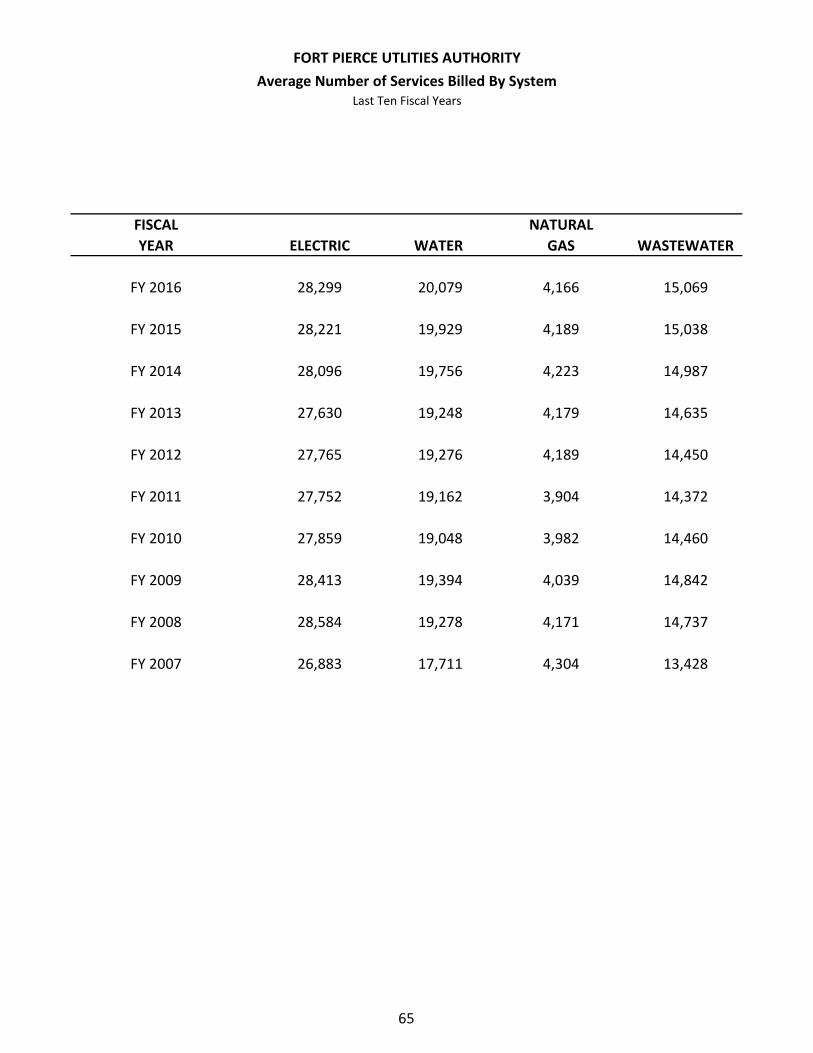
FORT PIERCE UTLITIES AUTHORITY
Average Number of Services Billed By System Last Ten Fiscal Years
FISCAL NATURAL
YEAR ELECTRIC WATER GAS WASTEWATER
FY 2016 28,299 20,079 4,166 15,069
FY 2015 28,221 19,929 4,189 15,038
FY 2014 28,096 19,756 4,223 14,987
FY 2013 27,630 19,248 4,179 14,635
FY 2012 27,765 19,276 4,189 14,450
FY 2011 27,752 19,162 3,904 14,372
FY 2010 27,859 19,048 3,982 14,460
FY 2009 28,413 19,394 4,039 14,842
FY 2008 28,584 19,278 4,171 14,737
FY 2007 26,883 17,711 4,304 13,428
65
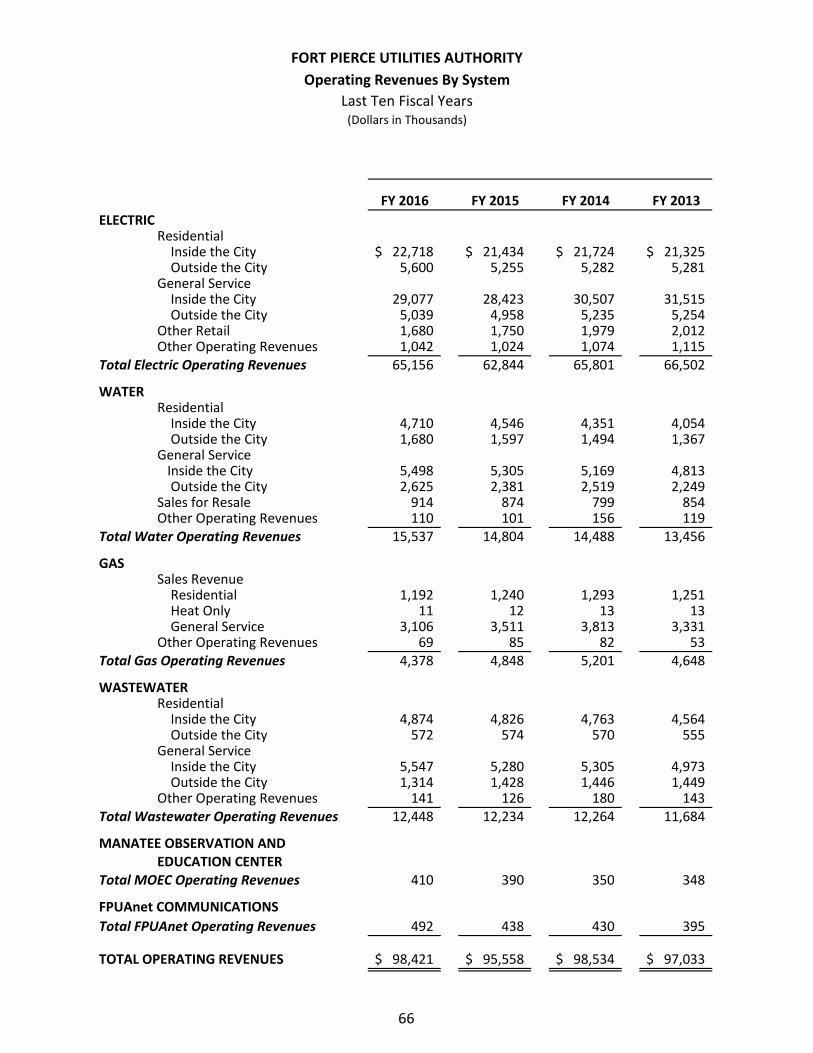
FORT PIERCE UTILITIES AUTHORITY
Operating Revenues By System
Last Ten Fiscal Years (Dollars in Thousands)
FY 2016 FY 2015 FY 2014 FY 2013
ELECTRIC Residential Inside the City $ 22,718 $ 21,434 $ 21,724 $ 21,325 Outside the City 5,600 5,255 5,282 5,281 General Service Inside the City 29,077 28,423 30,507 31,515 Outside the City 5,039 4,958 5,235 5,254 Other Retail 1,680 1,750 1,979 2,012 Other Operating Revenues 1,042 1,024 1,074 1,115
Total Electric Operating Revenues 65,156 62,844 65,801 66,502
WATER Residential Inside the City 4,710 4,546 4,351 4,054 Outside the City 1,680 1,597 1,494 1,367 General Service Inside the City 5,498 5,305 5,169 4,813 Outside the City 2,625 2,381 2,519 2,249 Sales for Resale 914 874 799 854 Other Operating Revenues 110 101 156 119
Total Water Operating Revenues 15,537 14,804 14,488 13,456
GAS Sales Revenue Residential 1,192 1,240 1,293 1,251 Heat Only 11 12 13 13 General Service 3,106 3,511 3,813 3,331 Other Operating Revenues 69 85 82 53
Total Gas Operating Revenues 4,378 4,848 5,201 4,648
WASTEWATER Residential Inside the City 4,874 4,826 4,763 4,564 Outside the City 572 574 570 555 General Service Inside the City 5,547 5,280 5,305 4,973 Outside the City 1,314 1,428 1,446 1,449 Other Operating Revenues 141 126 180 143
Total Wastewater Operating Revenues 12,448 12,234 12,264 11,684
MANATEE OBSERVATION AND EDUCATION CENTER
Total MOEC Operating Revenues 410 390 350 348
FPUAnet COMMUNICATIONS
Total FPUAnet Operating Revenues 492 438 430 395
TOTAL OPERATING REVENUES $ 98,421 $ 95,558 $ 98,534 $ 97,033
66
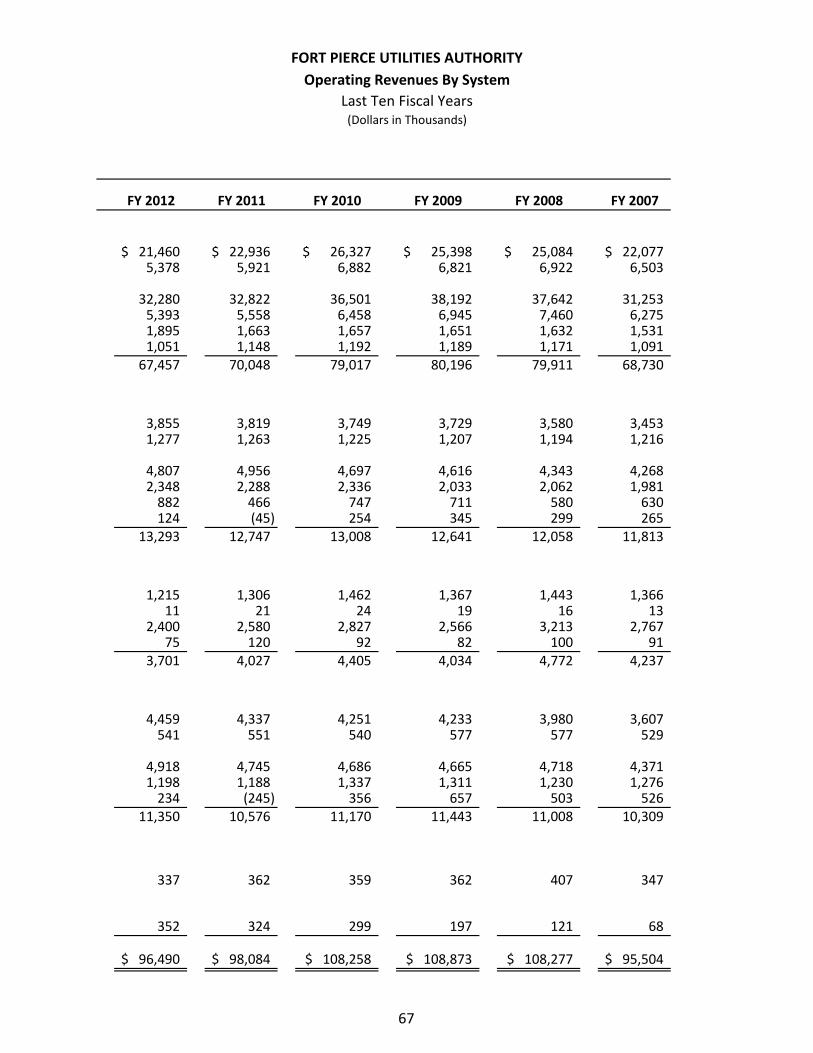
FORT PIERCE UTILITIES AUTHORITY
Operating Revenues By System
Last Ten Fiscal Years (Dollars in Thousands)
FY 2012 FY 2011 FY 2010 FY 2009 FY 2008 FY 2007
$ 21,460 5,378
$ 22,936 5,921
$ 26,327 6,882
$ 25,398 6,821
$ 25,084 6,922
$ 22,077 6,503
32,280 5,393 1,895 1,051
67,457
32,822 5,558 1,663 1,148
70,048
36,501 6,458 1,657 1,192
79,017
38,192 6,945 1,651 1,189
80,196
37,642 7,460 1,632 1,171
79,911
31,253 6,275 1,531 1,091
68,730
3,855 1,277
3,819 1,263
3,749 1,225
3,729 1,207
3,580 1,194
3,453 1,216
4,807 2,348
882 124
13,293
4,956 2,288
466 (45)
12,747
4,697 2,336
747 254
13,008
4,616 2,033
711 345
12,641
4,343 2,062
580 299
12,058
4,268 1,981
630 265
11,813
1,215 11
2,400 75
3,701
1,306 21
2,580 120
4,027
1,462 24
2,827 92
4,405
1,367 19
2,566 82
4,034
1,443 16
3,213 100
4,772
1,366 13
2,767 91
4,237
4,459 541
4,337 551
4,251 540
4,233 577
3,980 577
3,607 529
4,918 1,198
234 11,350
4,745 1,188 (245)
10,576
4,686 1,337
356 11,170
4,665 1,311
657 11,443
4,718 1,230
503 11,008
4,371 1,276
526 10,309
337 362 359 362 407 347
352 324 299 197 121 68
$ 96,490 $ 98,084 $ 108,258 $ 108,873 $ 108,277 $ 95,504
67
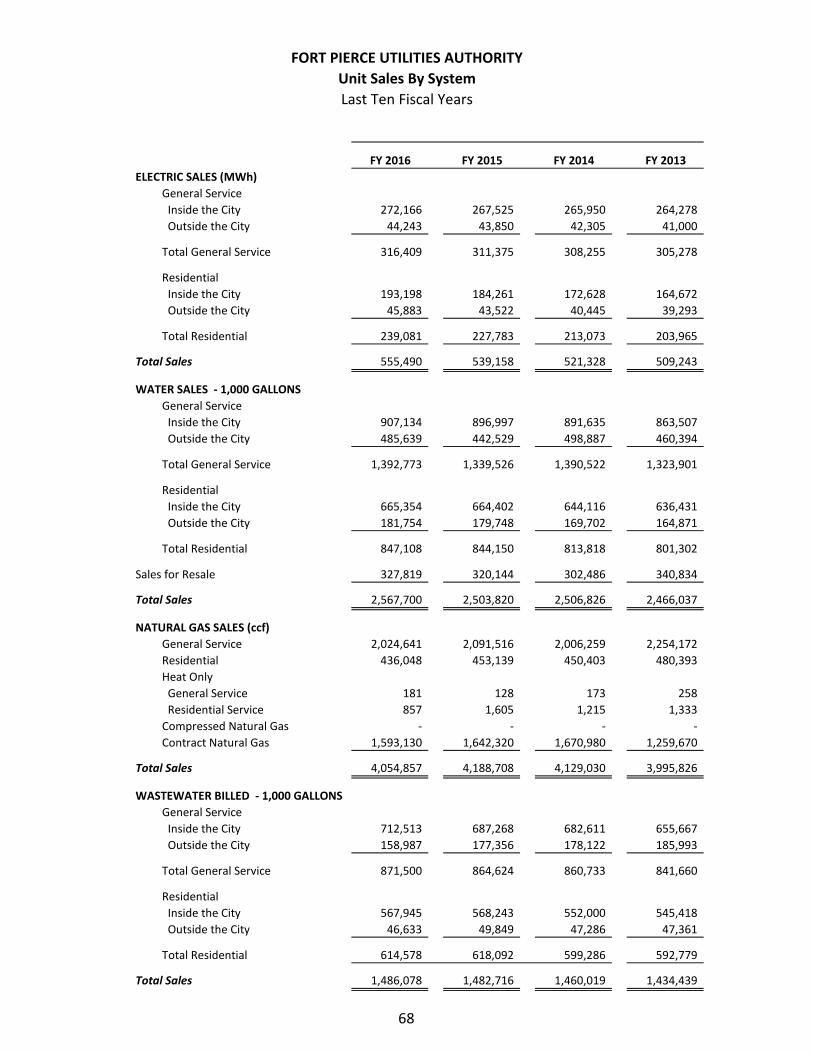
FORT PIERCE UTILITIES AUTHORITY
Unit Sales By System
Last Ten Fiscal Years
FY 2016 FY 2015 FY 2014 FY 2013
ELECTRIC SALES (MWh)
General Service
Inside the City 272,166 267,525 265,950 264,278
Outside the City 44,243 43,850 42,305 41,000
Total General Service 316,409 311,375 308,255 305,278
Residential
Inside the City 193,198 184,261 172,628 164,672
Outside the City 45,883 43,522 40,445 39,293
Total Residential 239,081 227,783 213,073 203,965
Total Sales 555,490 539,158 521,328 509,243
WATER SALES - 1,000 GALLONS
General Service
Inside the City 907,134 896,997 891,635 863,507
Outside the City 485,639 442,529 498,887 460,394
Total General Service 1,392,773 1,339,526 1,390,522 1,323,901
Residential
Inside the City 665,354 664,402 644,116 636,431
Outside the City 181,754 179,748 169,702 164,871
Total Residential 847,108 844,150 813,818 801,302
Sales for Resale 327,819 320,144 302,486 340,834
Total Sales 2,567,700 2,503,820 2,506,826 2,466,037
NATURAL GAS SALES (ccf)
General Service 2,024,641 2,091,516 2,006,259 2,254,172
Residential 436,048 453,139 450,403 480,393
Heat Only
General Service 181 128 173 258
Residential Service 857 1,605 1,215 1,333
Compressed Natural Gas - - - -
Contract Natural Gas 1,593,130 1,642,320 1,670,980 1,259,670
Total Sales 4,054,857 4,188,708 4,129,030 3,995,826
WASTEWATER BILLED - 1,000 GALLONS
General Service
Inside the City 712,513 687,268 682,611 655,667
Outside the City 158,987 177,356 178,122 185,993
Total General Service 871,500 864,624 860,733 841,660
Residential
Inside the City 567,945 568,243 552,000 545,418
Outside the City 46,633 49,849 47,286 47,361
Total Residential 614,578 618,092 599,286 592,779
Total Sales 1,486,078 1,482,716 1,460,019 1,434,439
68
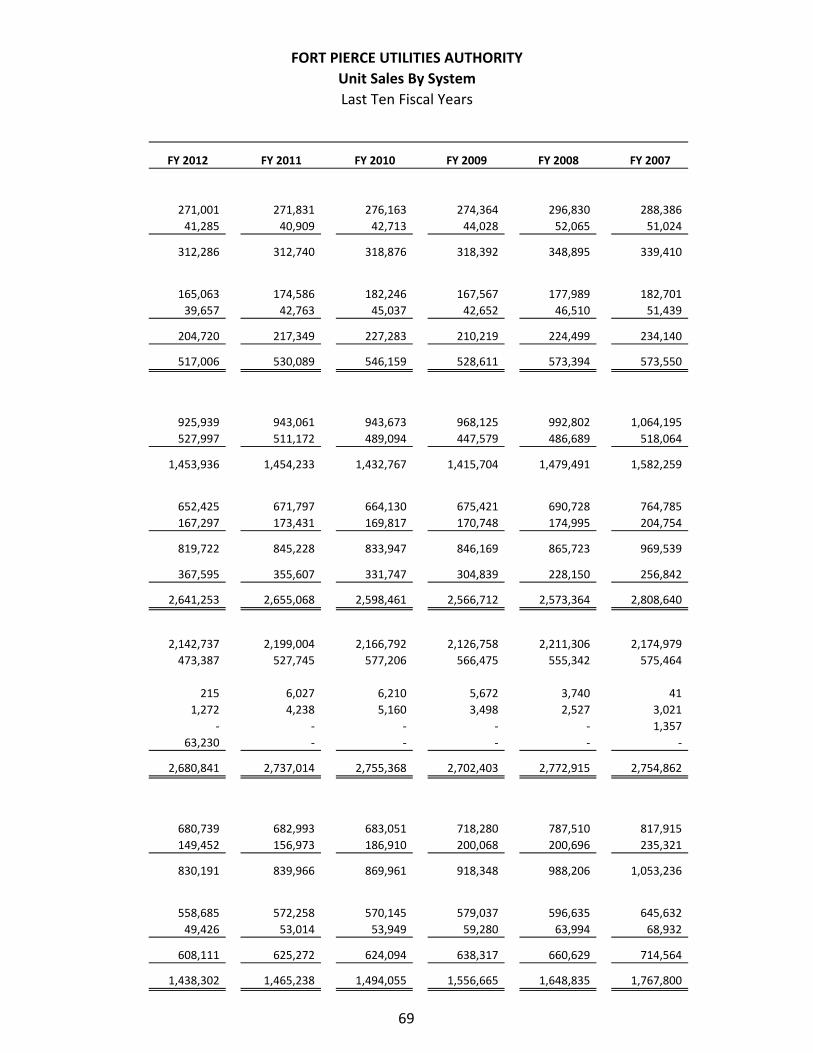
FORT PIERCE UTILITIES AUTHORITY
Unit Sales By System
Last Ten Fiscal Years
FY 2012 FY 2011 FY 2010 FY 2009 FY 2008 FY 2007
271,001
41,285
312,286
271,831
40,909
312,740
276,163
42,713
318,876
274,364
44,028
318,392
296,830
52,065
348,895
288,386
51,024
339,410
165,063
39,657
204,720
517,006
174,586
42,763
217,349
530,089
182,246
45,037
227,283
546,159
167,567
42,652
210,219
528,611
177,989
46,510
224,499
573,394
182,701
51,439
234,140
573,550
925,939
527,997
1,453,936
943,061
511,172
1,454,233
943,673
489,094
1,432,767
968,125
447,579
1,415,704
992,802
486,689
1,479,491
1,064,195
518,064
1,582,259
652,425
167,297
819,722
367,595
2,641,253
671,797
173,431
845,228
355,607
2,655,068
664,130
169,817
833,947
331,747
2,598,461
675,421
170,748
846,169
304,839
2,566,712
690,728
174,995
865,723
228,150
2,573,364
764,785
204,754
969,539
256,842
2,808,640
2,142,737
473,387
2,199,004
527,745
2,166,792
577,206
2,126,758
566,475
2,211,306
555,342
2,174,979
575,464
215
1,272
-
63,230
2,680,841
6,027
4,238
-
-
2,737,014
6,210
5,160
-
-
2,755,368
5,672
3,498
-
-
2,702,403
3,740
2,527
-
-
2,772,915
41
3,021
1,357
-
2,754,862
680,739
149,452
830,191
682,993
156,973
839,966
683,051
186,910
869,961
718,280
200,068
918,348
787,510
200,696
988,206
817,915
235,321
1,053,236
558,685
49,426
608,111
1,438,302
572,258
53,014
625,272
1,465,238
570,145
53,949
624,094
1,494,055
579,037
59,280
638,317
1,556,665
596,635
63,994
660,629
1,648,835
645,632
68,932
714,564
1,767,800
69
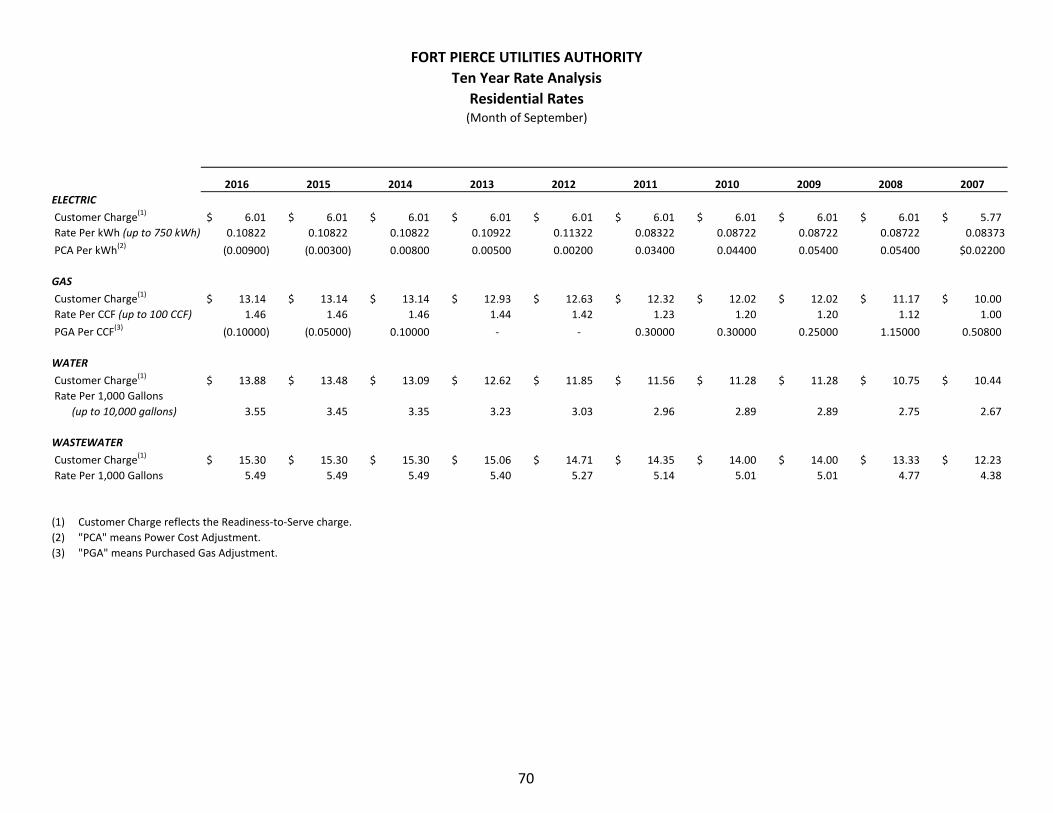
FORT PIERCE UTILITIES AUTHORITY
Ten Year Rate Analysis
Residential Rates (Month of September)
2016 2015
ELECTRIC (1)Customer Charge $ 6.01 $ 6.01
Rate Per kWh (up to 750 kWh) 0.10822 0.10822 (2)PCA Per kWh (0.00900) (0.00300)
$
2014
6.01
0.10822
0.00800
$
2013
6.01
0.10922
0.00500
$
2012
6.01
0.11322
0.00200
$
2011
6.01
0.08322
0.03400
$
2010
6.01
0.08722
0.04400
$
2009
6.01
0.08722
0.05400
$
2008
6.01
0.08722
0.05400
$
2007
5.77
0.08373
$0.02200
GAS (1)Customer Charge
Rate Per CCF (up to 100 CCF) (3)PGA Per CCF
$ 13.14 $ 13.14
1.46 1.46
(0.10000) (0.05000)
$ 13.14
1.46
0.10000
$ 12.93
1.44
-
$ 12.63
1.42
-
$ 12.32
1.23
0.30000
$ 12.02
1.20
0.30000
$ 12.02
1.20
0.25000
$ 11.17
1.12
1.15000
$ 10.00
1.00
0.50800
WATER (1)Customer Charge
Rate Per 1,000 Gallons
(up to 10,000 gallons)
$ 13.88 $ 13.48
3.55 3.45
$ 13.09
3.35
$ 12.62
3.23
$ 11.85
3.03
$ 11.56
2.96
$ 11.28
2.89
$ 11.28
2.89
$ 10.75
2.75
$ 10.44
2.67
WASTEWATER (1)Customer Charge
Rate Per 1,000 Gallons
$ 15.30 $ 15.30
5.49 5.49
$ 15.30
5.49
$ 15.06
5.40
$ 14.71
5.27
$ 14.35
5.14
$ 14.00
5.01
$ 14.00
5.01
$ 13.33
4.77
$ 12.23
4.38
(1) Customer Charge reflects the Readiness-to-Serve charge.
(2) "PCA" means Power Cost Adjustment.
(3) "PGA" means Purchased Gas Adjustment.
70
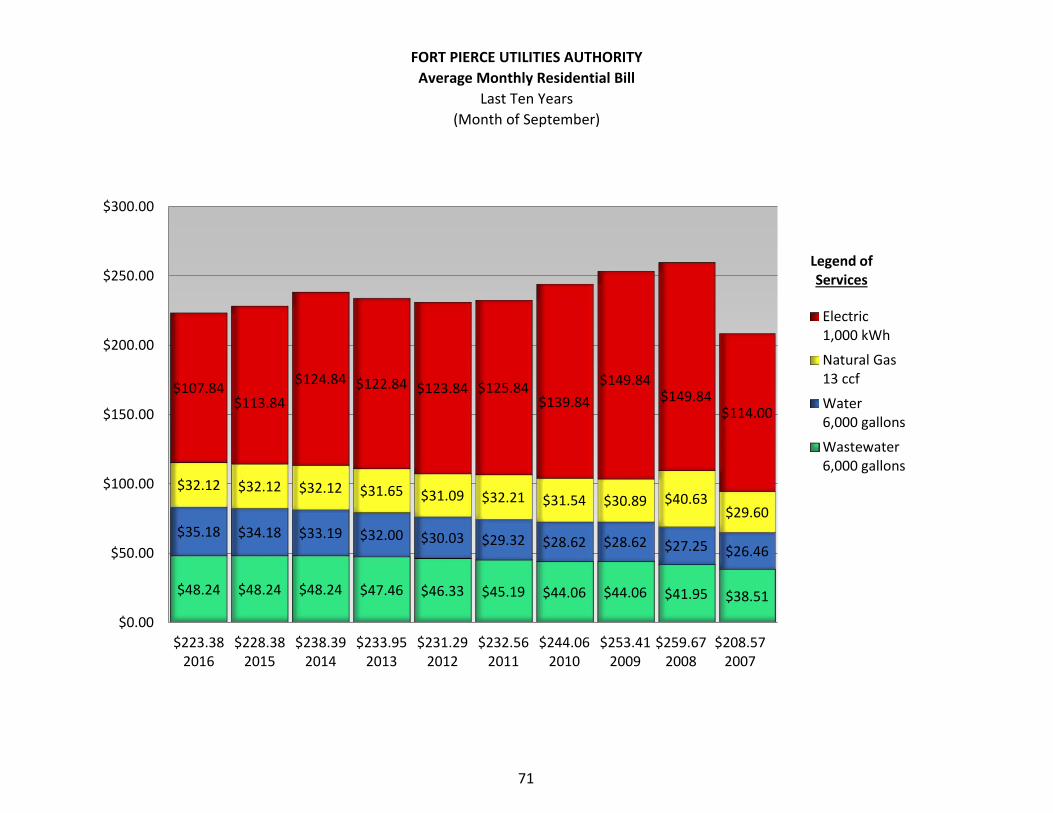
■
□
■
FORT PIERCE UTILITIES AUTHORITY
Average Monthly Residential Bill
Last Ten Years
(Month of September)
$300.00
$107.84 $113.84
$124.84 $122.84 $123.84 $125.84 $139.84
$149.84 $149.84
$114.00
$32.12 $32.12 $32.12 $31.65 $31.09 $32.21 $31.54 $30.89 $40.63 $29.60
$35.18 $34.18 $33.19 $32.00 $30.03 $29.32 $28.62 $28.62 $27.25 $26.46
$48.24 $48.24 $48.24 $47.46 $46.33 $45.19 $44.06 $44.06 $41.95 $38.51
Legend of $250.00 Services
Electric 1,000 kWh
$200.00 Natural Gas 13 ccf
Water $150.00
6,000 gallons
Wastewater 6,000 gallons
$100.00
$50.00
$0.00
$223.38 $228.38 $238.39 $233.95 $231.29 $232.56 $244.06 $253.41 $259.67 $208.57 2016 2015 2014 2013 2012 2011 2010 2009 2008 2007
71
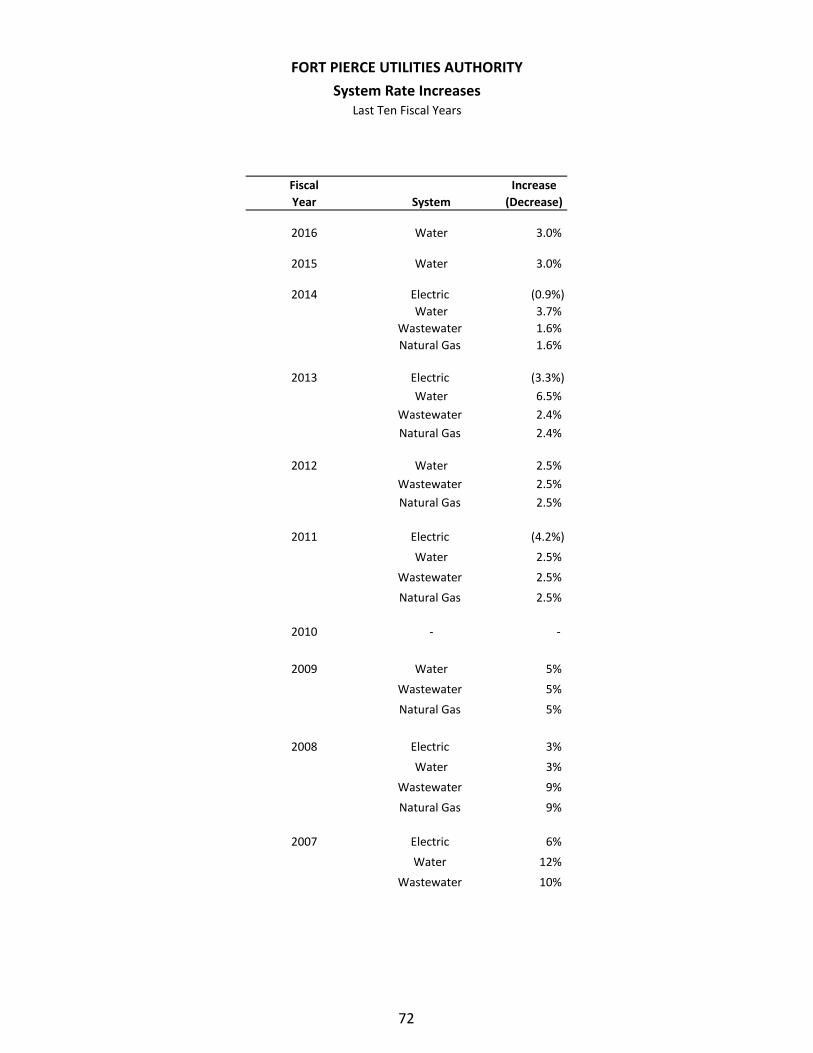
FORT PIERCE UTILITIES AUTHORITY
System Rate Increases Last Ten Fiscal Years
Fiscal
Year System
Increase
(Decrease)
2016 Water 3.0%
2015 Water 3.0%
2014 Electric
Water
Wastewater
Natural Gas
(0.9%)
3.7%
1.6%
1.6%
2013 Electric
Water
Wastewater
Natural Gas
(3.3%)
6.5%
2.4%
2.4%
2012 Water
Wastewater
Natural Gas
2.5%
2.5%
2.5%
2011 Electric
Water
Wastewater
Natural Gas
(4.2%)
2.5%
2.5%
2.5%
2010 - -
2009 Water
Wastewater
Natural Gas
5%
5%
5%
2008 Electric
Water
Wastewater
Natural Gas
3%
3%
9%
9%
2007 Electric
Water
Wastewater
6%
12%
10%
72

Debt Capacity
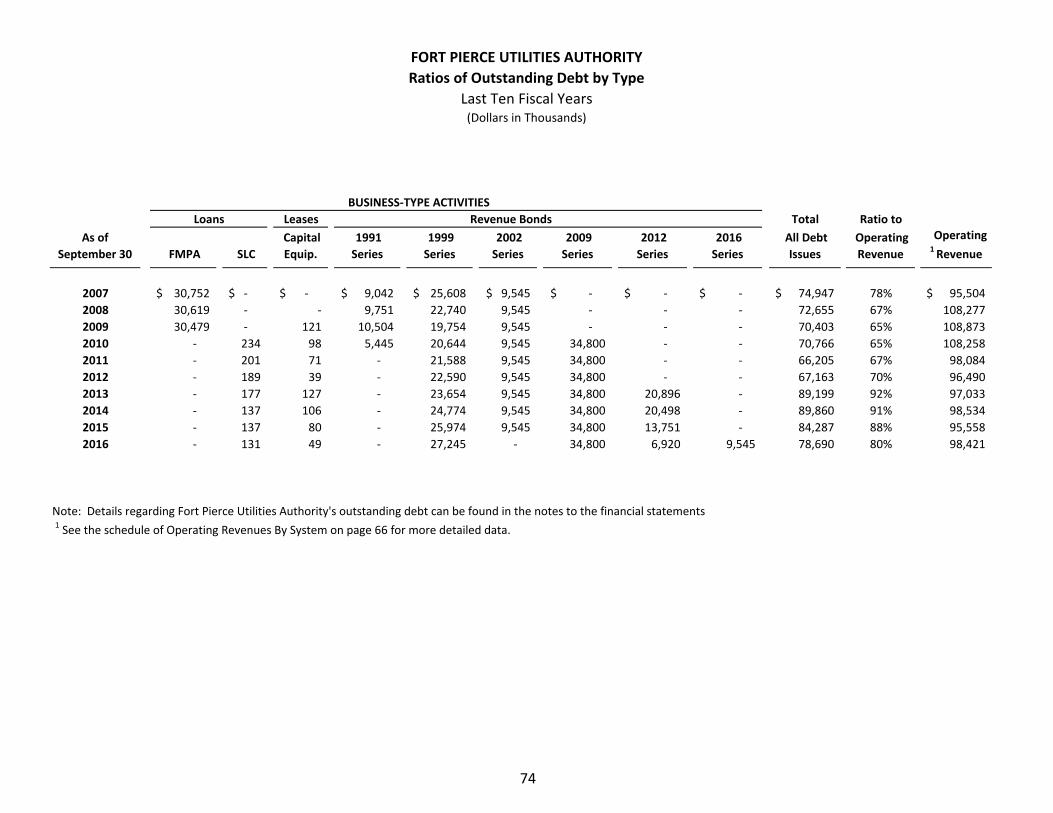
FORT PIERCE UTILITIES AUTHORITY
Ratios of Outstanding Debt by Type
Last Ten Fiscal Years (Dollars in Thousands)
BUSINESS-TYPE ACTIVITIES
Loans Leases Revenue Bonds Total Ratio to
As of Capital 1991 1999 2002 2009 2012 2016 All Debt Operating Operating
September 30 FMPA SLC Equip. Series Series Series Series Series Series Issues Revenue 1 Revenue
2007 $ 30,752 $ - $ - $ 9,042 $ 25,608 $ 9,545 $ - $ - $ - $ 74,947 78% $ 95,504
2008 30,619 - - 9,751 22,740 9,545 - - - 72,655 67% 108,277
2009 30,479 - 121 10,504 19,754 9,545 - - - 70,403 65% 108,873
2010 - 234 98 5,445 20,644 9,545 34,800 - - 70,766 65% 108,258
2011 - 201 71 - 21,588 9,545 34,800 - - 66,205 67% 98,084
2012 - 189 39 - 22,590 9,545 34,800 - - 67,163 70% 96,490
2013 - 177 127 - 23,654 9,545 34,800 20,896 - 89,199 92% 97,033
2014 - 137 106 - 24,774 9,545 34,800 20,498 - 89,860 91% 98,534
2015 - 137 80 - 25,974 9,545 34,800 13,751 - 84,287 88% 95,558
2016 - 131 49 - 27,245 - 34,800 6,920 9,545 78,690 80% 98,421
Note: Details regarding Fort Pierce Utilities Authority's outstanding debt can be found in the notes to the financial statements 1 See the schedule of Operating Revenues By System on page 66 for more detailed data.
74
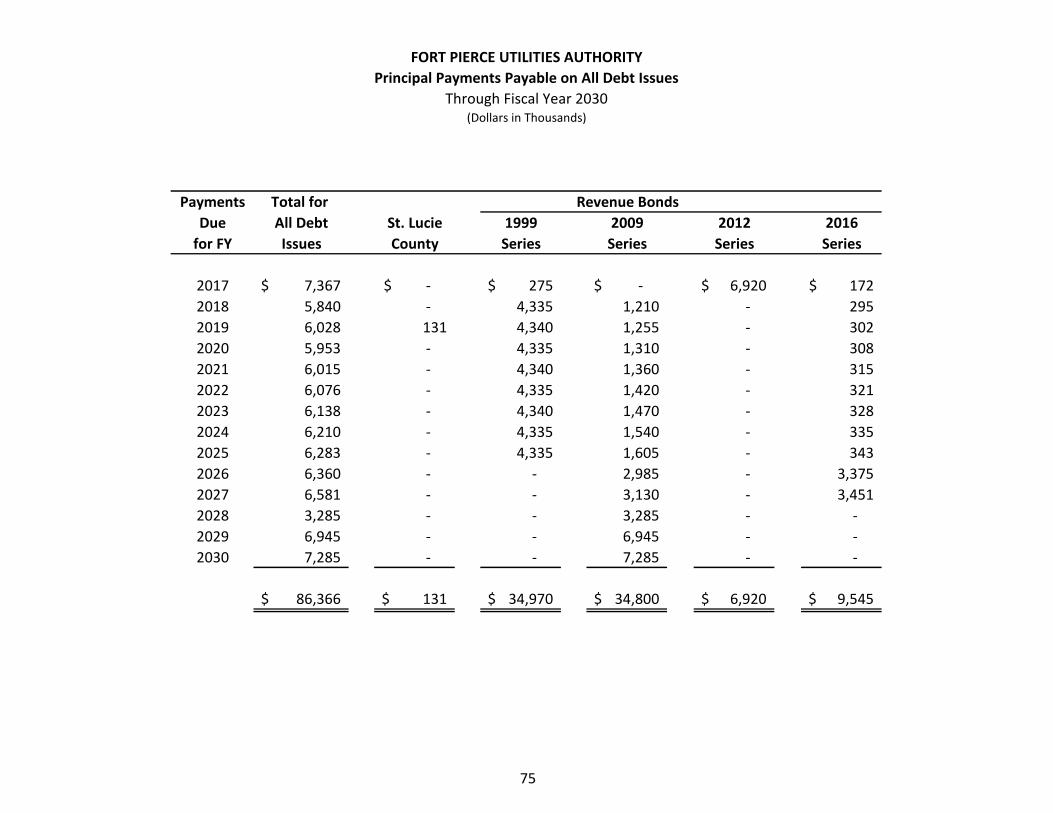
FORT PIERCE UTILITIES AUTHORITY
Principal Payments Payable on All Debt Issues
Through Fiscal Year 2030 (Dollars in Thousands)
Payments
Due
for FY
Total for
All Debt
Issues
St. Lucie
County
1999
Series
Revenue Bonds
2009
Series
2012
Series
2016
Series
2017
2018
2019
2020
2021
2022
2023
2024
2025
2026
2027
2028
2029
2030
$ 7,367
5,840
6,028
5,953
6,015
6,076
6,138
6,210
6,283
6,360
6,581
3,285
6,945
7,285
$ -
-
131
-
-
-
-
-
-
-
-
-
-
-
$ 275
4,335
4,340
4,335
4,340
4,335
4,340
4,335
4,335
-
-
-
-
-
$ -
1,210
1,255
1,310
1,360
1,420
1,470
1,540
1,605
2,985
3,130
3,285
6,945
7,285
$ 6,920
-
-
-
-
-
-
-
-
-
-
-
-
-
$ 172
295
302
308
315
321
328
335
343
3,375
3,451
-
-
-
$ 86,366 $ 131 $ 34,970 $ 34,800 $ 6,920 $ 9,545
75
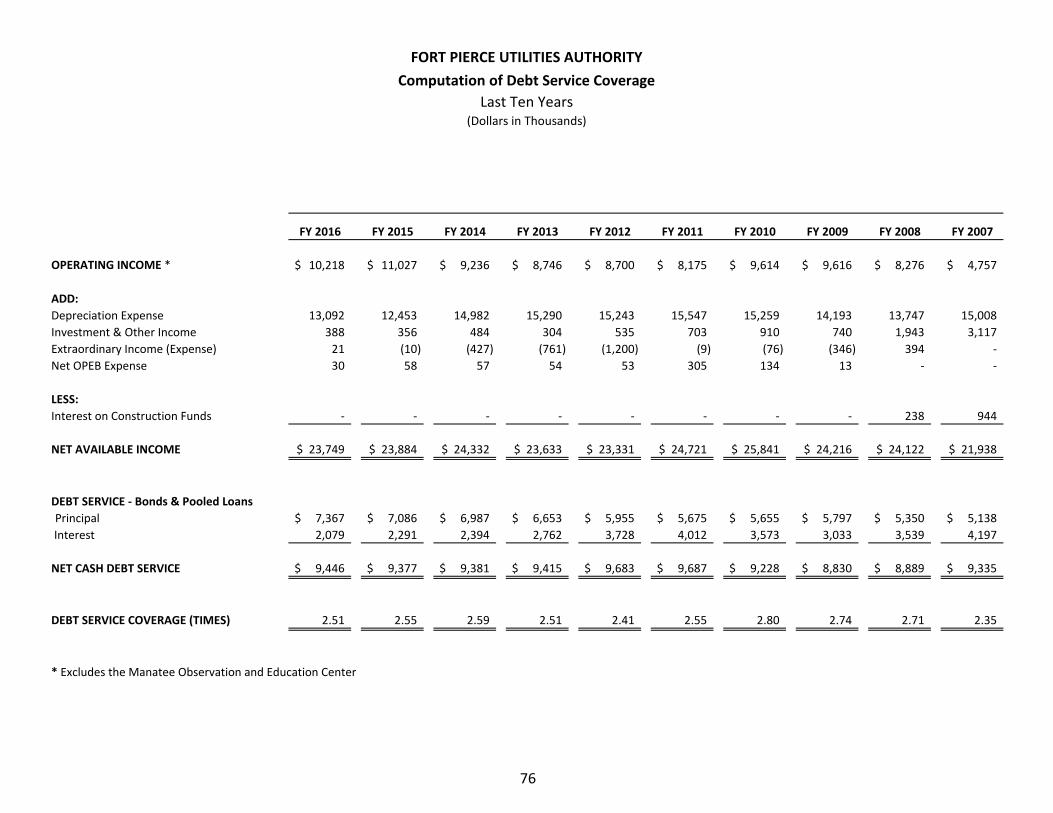
FORT PIERCE UTILITIES AUTHORITY
Computation of Debt Service Coverage
Last Ten Years (Dollars in Thousands)
FY 2016 FY 2015 FY 2014 FY 2013 FY 2012 FY 2011 FY 2010 FY 2009 FY 2008 FY 2007
OPERATING INCOME * $ 10,218 $ 11,027 $ 9,236 $ 8,746 $ 8,700 $ 8,175 $ 9,614 $ 9,616 $ 8,276 $ 4,757
ADD:
Depreciation Expense 13,092 12,453 14,982 15,290 15,243 15,547 15,259 14,193 13,747 15,008
Investment & Other Income 388 356 484 304 535 703 910 740 1,943 3,117
Extraordinary Income (Expense) 21 (10) (427) (761) (1,200) (9) (76) (346) 394 -
Net OPEB Expense 30 58 57 54 53 305 134 13 - -
LESS:
Interest on Construction Funds - - - - - - - - 238 944
NET AVAILABLE INCOME $ 23,749 $ 23,884 $ 24,332 $ 23,633 $ 23,331 $ 24,721 $ 25,841 $ 24,216 $ 24,122 $ 21,938
DEBT SERVICE - Bonds & Pooled Loans
Principal $ 7,367 $ 7,086 $ 6,987 $ 6,653 $ 5,955 $ 5,675 $ 5,655 $ 5,797 $ 5,350 $ 5,138
Interest 2,079 2,291 2,394 2,762 3,728 4,012 3,573 3,033 3,539 4,197
NET CASH DEBT SERVICE $ 9,446 $ 9,377 $ 9,381 $ 9,415 $ 9,683 $ 9,687 $ 9,228 $ 8,830 $ 8,889 $ 9,335
DEBT SERVICE COVERAGE (TIMES) 2.51 2.55 2.59 2.51 2.41 2.55 2.80 2.74 2.71
* Excludes the Manatee Observation and Education Center
76
2.35
LEGAL DEBT MARGIN INFORMATION
Neither the City of Fort Pierce Charter or Code, nor the Florida Statutes
limit the amount of debt the Fort Pierce Utilities Authority can issue.
77


Demographic and Economic Information
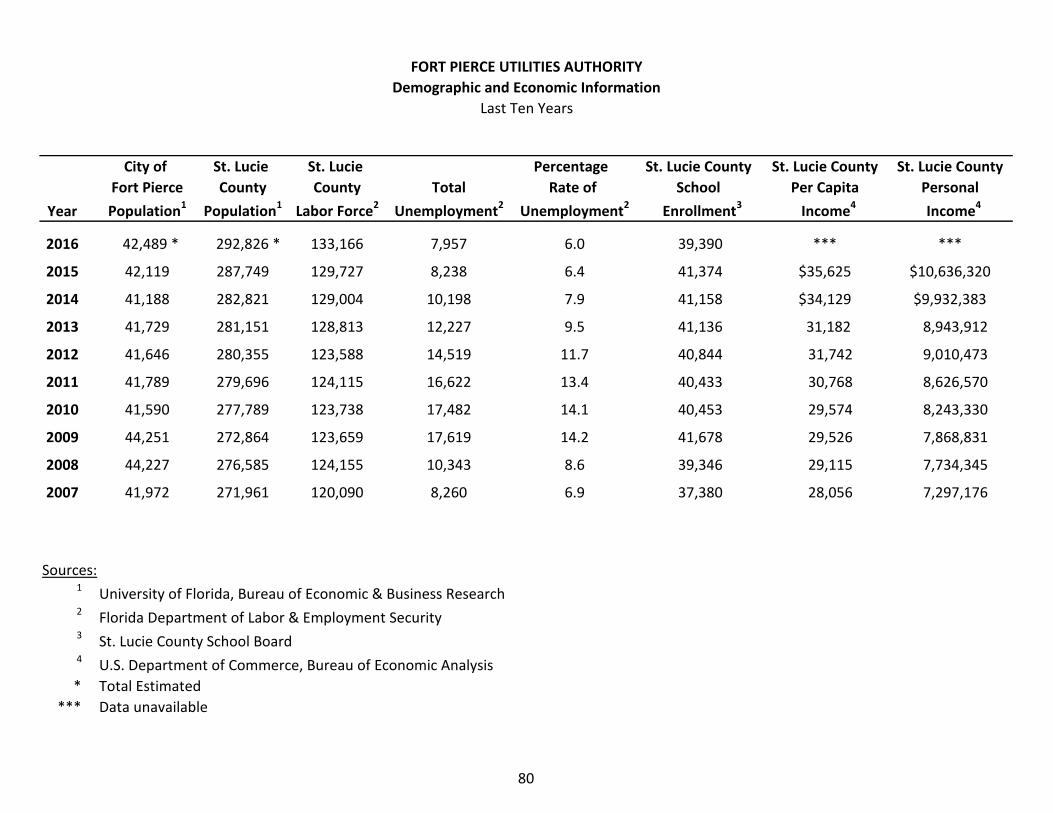
FORT PIERCE UTILITIES AUTHORITY
Demographic and Economic Information
Last Ten Years
City of St. Lucie St. Lucie Percentage St. Lucie County St. Lucie County St. Lucie County
Fort Pierce County County Total Rate of School Per Capita Personal
Year 1Population 1Population 2Labor Force 2Unemployment 2Unemployment 3Enrollment 4Income 4Income
2016 42,489 * 292,826 * 133,166 7,957 6.0 39,390 *** ***
2015 42,119 287,749 129,727 8,238 6.4 41,374 $35,625 $10,636,320
2014 41,188 282,821 129,004 10,198 7.9 41,158 $34,129 $9,932,383
2013 41,729 281,151 128,813 12,227 9.5 41,136 31,182 8,943,912
2012 41,646 280,355 123,588 14,519 11.7 40,844 31,742 9,010,473
2011 41,789 279,696 124,115 16,622 13.4 40,433 30,768 8,626,570
2010 41,590 277,789 123,738 17,482 14.1 40,453 29,574 8,243,330
2009 44,251 272,864 123,659 17,619 14.2 41,678 29,526 7,868,831
2008 44,227 276,585 124,155 10,343 8.6 39,346 29,115 7,734,345
2007 41,972 271,961 120,090 8,260 6.9 37,380 28,056 7,297,176
Sources: 1 University of Florida, Bureau of Economic & Business Research 2 Florida Department of Labor & Employment Security 3 St. Lucie County School Board 4 U.S. Department of Commerce, Bureau of Economic Analysis
* Total Estimated
*** Data unavailable
80

FORT PIERCE UTILITIES AUTHORITY
Principal Employers
Current Year and Eight Years Prior
2016 (1) 2008
Business Number % of City Number % of City
Employer Sector of Employees Rank Population of Employees Rank Population
St. Lucie County School Board Public 5,465 1 12.86% 4,685 1 10.59%
Indian River State College Public 2,338 2 5.50% 2,476 2 5.60%
Lawnwood Regional Medical Center Private 1,339 3 3.15% 1,200 4 2.71%
Convey Health Solutuions Private 950 4 2.24% - - -
Wal-Mart Private 890 5 2.09% 1,235 3 2.79%
St. Lucie County Public 763 6 1.80% 898 6 2.03%
St. Lucie County Fire District Public 434 7 1.02% - - -
Treasure Coast Hospice Private 425 8 1.00% - - -
Blue Goose Growers/Construction Private 400 9 0.94% - - -
New Horizons of the Treasure Coast Private 360 10 0.85% 398 10 0.90%
City of Fort Pierce Public - - - 412 8 0.93% (2)The Home Depot Private - - - 425 7 0.96%
Riverside National Bank of Florida Private - - - 404 9 0.91%
Publix Super Markets Inc Private - - - 1,148 5 2.60%
TOTALS 13,364 31.45% 13,281 30.03%
Source:
Indian River State College, Institutional Advancement (1)
Data is as of February 25, 2017 (2) 2008 data not available, previous year total shown
Historical data not available for years prior to 2008
81


Operating Information
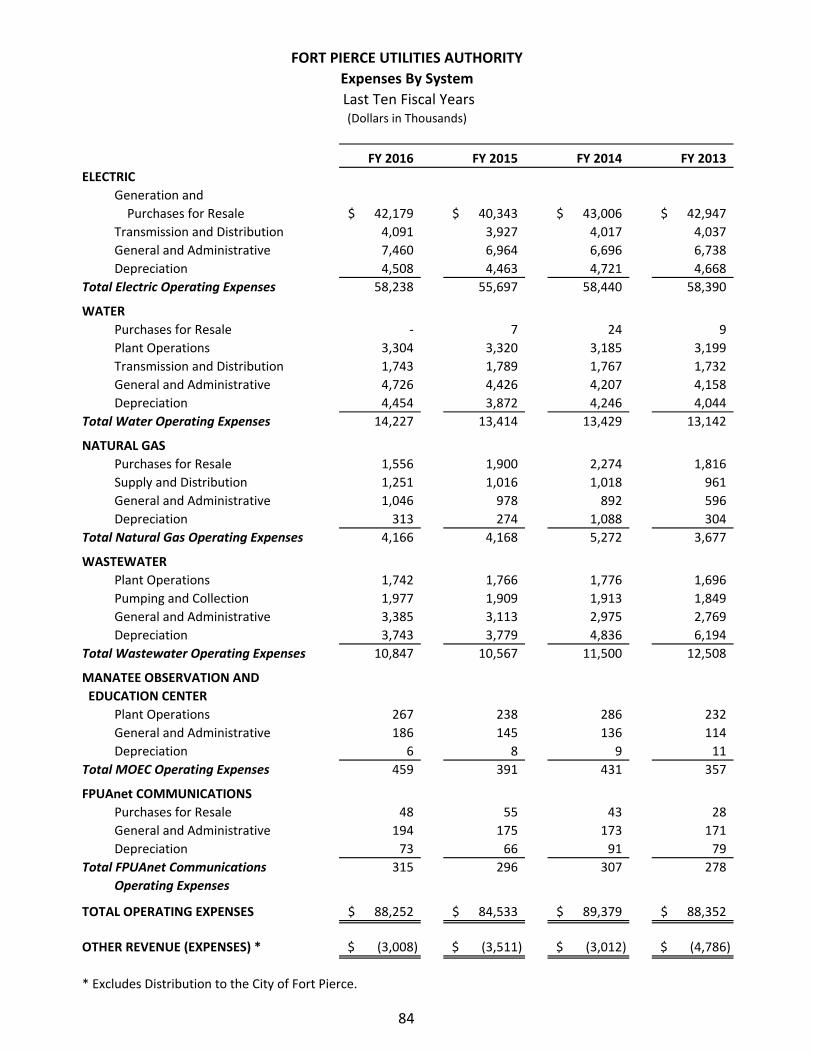
FORT PIERCE UTILITIES AUTHORITY
Expenses By System
Last Ten Fiscal Years (Dollars in Thousands)
FY 2016 FY 2015 FY 2014 FY 2013
ELECTRIC
Generation and
Purchases for Resale $ 42,179 $ 40,343 $ 43,006 $ 42,947
Transmission and Distribution 4,091 3,927 4,017 4,037
General and Administrative 7,460 6,964 6,696 6,738
Depreciation 4,508 4,463 4,721 4,668
Total Electric Operating Expenses 58,238 55,697 58,440 58,390
WATER
Purchases for Resale - 7 24 9
Plant Operations 3,304 3,320 3,185 3,199
Transmission and Distribution 1,743 1,789 1,767 1,732
General and Administrative 4,726 4,426 4,207 4,158
Depreciation 4,454 3,872 4,246 4,044
Total Water Operating Expenses 14,227 13,414 13,429 13,142
NATURAL GAS
Purchases for Resale 1,556 1,900 2,274 1,816
Supply and Distribution 1,251 1,016 1,018 961
General and Administrative 1,046 978 892 596
Depreciation 313 274 1,088 304
Total Natural Gas Operating Expenses 4,166 4,168 5,272 3,677
WASTEWATER
Plant Operations 1,742 1,766 1,776 1,696
Pumping and Collection 1,977 1,909 1,913 1,849
General and Administrative 3,385 3,113 2,975 2,769
Depreciation 3,743 3,779 4,836 6,194
Total Wastewater Operating Expenses 10,847 10,567 11,500 12,508
MANATEE OBSERVATION AND
EDUCATION CENTER
Plant Operations 267 238 286 232
General and Administrative 186 145 136 114
Depreciation 6 8 9 11
Total MOEC Operating Expenses 459 391 431 357
FPUAnet COMMUNICATIONS
Purchases for Resale 48 55 43 28
General and Administrative 194 175 173 171
Depreciation 73 66 91 79
Total FPUAnet Communications 315 296 307 278
Operating Expenses
TOTAL OPERATING EXPENSES $ 88,252 $ 84,533 $ 89,379 $ 88,352
OTHER REVENUE (EXPENSES) * $ (3,008) $ (3,511) $ (3,012) $ (4,786)
* Excludes Distribution to the City of Fort Pierce.
84

FORT PIERCE UTILITIES AUTHORITY
Expenses By System
Last Ten Fiscal Years (Dollars in Thousands)
FY 2012 FY 2011 FY 2010 FY 2009 FY 2008 FY 2007
$ 42,933
3,783
6,885
6,477
60,078
$ 43,976
3,814
7,423
6,420
61,633
$ 51,832
4,299
7,217
4,761
68,109
$ 52,851
4,445
7,605
4,984
69,885
$ 52,959
4,423
8,051
6,960
72,393
$ 43,958
4,259
8,263
8,862
65,342
-
3,309
1,743
4,183
3,726
12,961
6
3,331
1,567
4,268
3,825
12,997
-
3,557
1,722
4,144
6,105
15,528
2
3,348
1,816
4,159
4,953
14,278
18
3,223
1,575
4,116
3,617
12,549
-
2,917
1,533
4,014
3,344
11,808
1,398
875
570
507
3,350
1,676
968
650
303
3,597
2,038
981
607
351
3,977
1,942
983
564
308
3,797
2,744
1,056
525
288
4,613
2,295
939
558
323
4,115
1,779
1,834
2,755
4,446
10,814
1,697
1,776
2,685
4,939
11,097
1,906
1,825
2,747
3,985
10,463
2,010
1,903
2,941
3,936
10,790
2,222
1,836
2,994
2,875
9,927
1,885
1,847
2,883
2,481
9,096
249
115
11
375
246
109
11
366
261
106
9
376
299
99
8
406
310
97
9
416
228
115
12
355
25
137
86
248
37
125
60
222
23
129
56
208
18
115
12
145
15
74
8
97
27
13
-
40
$ 87,826 $ 89,912 $ 98,661 $ 99,301 $ 99,995 $ 90,756
$ (4,147) $ (4,277) $ (4,366) $ (2,702) $ 2,850 $ 1,464
85
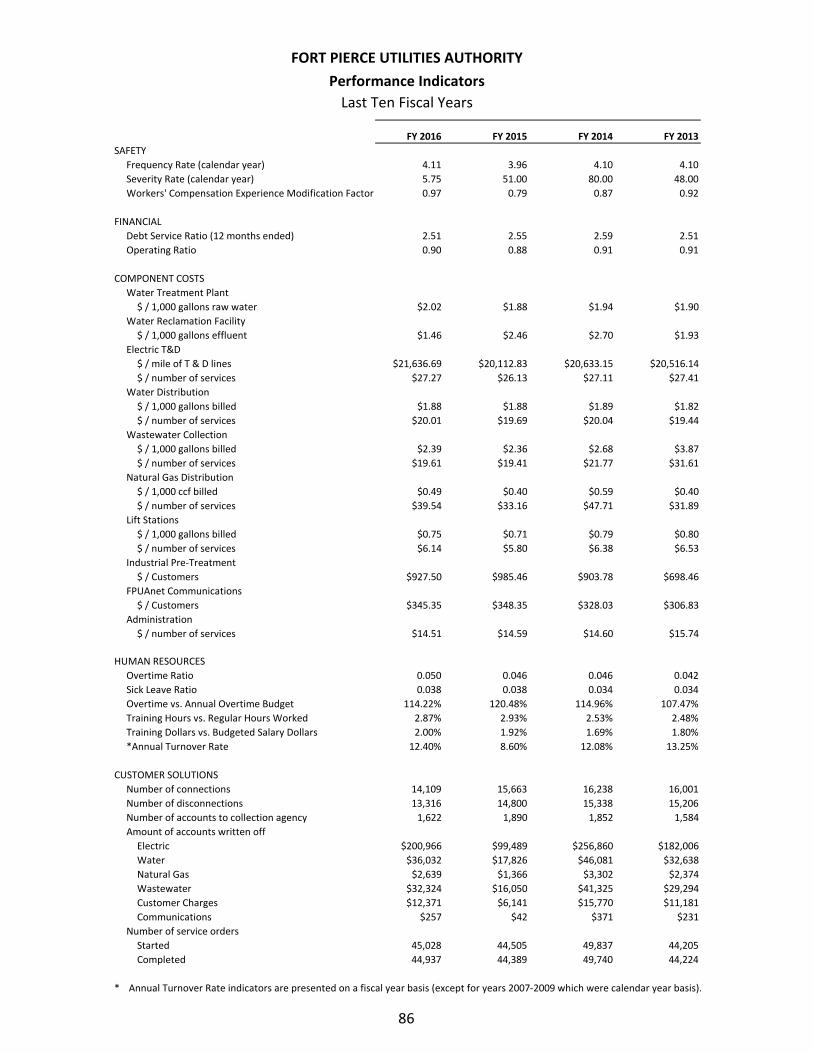
FORT PIERCE UTILITIES AUTHORITY
Performance Indicators
Last Ten Fiscal Years
FY 2016 FY 2015 FY 2014 FY 2013
SAFETY
Frequency Rate (calendar year) 4.11 3.96 4.10 4.10
Severity Rate (calendar year) 5.75 51.00 80.00 48.00
Workers' Compensation Experience Modification Factor 0.97 0.79 0.87 0.92
FINANCIAL
Debt Service Ratio (12 months ended) 2.51 2.55 2.59 2.51
Operating Ratio 0.90 0.88 0.91 0.91
COMPONENT COSTS
Water Treatment Plant
$ / 1,000 gallons raw water $2.02 $1.88 $1.94 $1.90
Water Reclamation Facility
$ / 1,000 gallons effluent $1.46 $2.46 $2.70 $1.93
Electric T&D
$ / mile of T & D lines $21,636.69 $20,112.83 $20,633.15 $20,516.14
$ / number of services $27.27 $26.13 $27.11 $27.41
Water Distribution
$ / 1,000 gallons billed $1.88 $1.88 $1.89 $1.82
$ / number of services $20.01 $19.69 $20.04 $19.44
Wastewater Collection
$ / 1,000 gallons billed $2.39 $2.36 $2.68 $3.87
$ / number of services $19.61 $19.41 $21.77 $31.61
Natural Gas Distribution
$ / 1,000 ccf billed $0.49 $0.40 $0.59 $0.40
$ / number of services $39.54 $33.16 $47.71 $31.89
Lift Stations
$ / 1,000 gallons billed $0.75 $0.71 $0.79 $0.80
$ / number of services $6.14 $5.80 $6.38 $6.53
Industrial Pre-Treatment
$ / Customers $927.50 $985.46 $903.78 $698.46
FPUAnet Communications
$ / Customers $345.35 $348.35 $328.03 $306.83
Administration
$ / number of services $14.51 $14.59 $14.60 $15.74
HUMAN RESOURCES
Overtime Ratio 0.050 0.046 0.046 0.042
Sick Leave Ratio 0.038 0.038 0.034 0.034
Overtime vs. Annual Overtime Budget 114.22% 120.48% 114.96% 107.47%
Training Hours vs. Regular Hours Worked 2.87% 2.93% 2.53% 2.48%
Training Dollars vs. Budgeted Salary Dollars 2.00% 1.92% 1.69% 1.80%
*Annual Turnover Rate 12.40% 8.60% 12.08% 13.25%
CUSTOMER SOLUTIONS
Number of connections 14,109 15,663 16,238 16,001
Number of disconnections 13,316 14,800 15,338 15,206
Number of accounts to collection agency 1,622 1,890 1,852 1,584
Amount of accounts written off
Electric $200,966 $99,489 $256,860 $182,006
Water $36,032 $17,826 $46,081 $32,638
Natural Gas $2,639 $1,366 $3,302 $2,374
Wastewater $32,324 $16,050 $41,325 $29,294
Customer Charges $12,371 $6,141 $15,770 $11,181
Communications $257 $42 $371 $231
Number of service orders
Started 45,028 44,505 49,837 44,205
Completed 44,937 44,389 49,740 44,224
* Annual Turnover Rate indicators are presented on a fiscal year basis (except for years 2007-2009 which were calendar year basis).
86
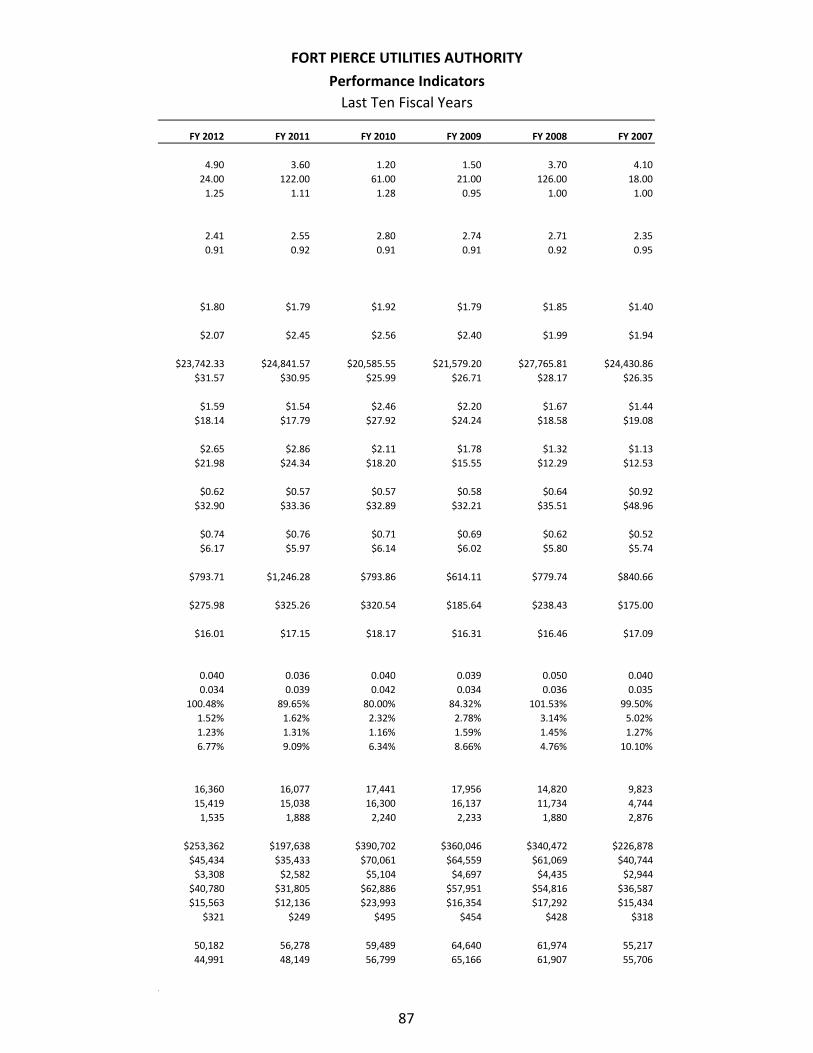
FORT PIERCE UTILITIES AUTHORITY
Performance Indicators
Last Ten Fiscal Years
FY 2012 FY 2011 FY 2010 FY 2009 FY 2008 FY 2007
4.90
24.00
1.25
3.60
122.00
1.11
1.20
61.00
1.28
1.50
21.00
0.95
3.70
126.00
1.00
4.10
18.00
1.00
2.41
0.91
2.55
0.92
2.80
0.91
2.74
0.91
2.71
0.92
2.35
0.95
$1.80 $1.79 $1.92 $1.79 $1.85 $1.40
$2.07 $2.45 $2.56 $2.40 $1.99 $1.94
$23,742.33
$31.57
$24,841.57
$30.95
$20,585.55
$25.99
$21,579.20
$26.71
$27,765.81
$28.17
$24,430.86
$26.35
$1.59
$18.14
$1.54
$17.79
$2.46
$27.92
$2.20
$24.24
$1.67
$18.58
$1.44
$19.08
$2.65
$21.98
$2.86
$24.34
$2.11
$18.20
$1.78
$15.55
$1.32
$12.29
$1.13
$12.53
$0.62
$32.90
$0.57
$33.36
$0.57
$32.89
$0.58
$32.21
$0.64
$35.51
$0.92
$48.96
$0.74
$6.17
$0.76
$5.97
$0.71
$6.14
$0.69
$6.02
$0.62
$5.80
$0.52
$5.74
$793.71 $1,246.28 $793.86 $614.11 $779.74 $840.66
$275.98 $325.26 $320.54 $185.64 $238.43 $175.00
$16.01 $17.15 $18.17 $16.31 $16.46 $17.09
0.040
0.034
100.48%
1.52%
1.23%
6.77%
0.036
0.039
89.65%
1.62%
1.31%
9.09%
0.040
0.042
80.00%
2.32%
1.16%
6.34%
0.039
0.034
84.32%
2.78%
1.59%
8.66%
0.050
0.036
101.53%
3.14%
1.45%
4.76%
0.040
0.035
99.50%
5.02%
1.27%
10.10%
16,360
15,419
1,535
16,077
15,038
1,888
17,441
16,300
2,240
17,956
16,137
2,233
14,820
11,734
1,880
9,823
4,744
2,876
$253,362
$45,434
$3,308
$40,780
$15,563
$321
$197,638
$35,433
$2,582
$31,805
$12,136
$249
$390,702
$70,061
$5,104
$62,886
$23,993
$495
$360,046
$64,559
$4,697
$57,951
$16,354
$454
$340,472
$61,069
$4,435
$54,816
$17,292
$428
$226,878
$40,744
$2,944
$36,587
$15,434
$318
50,182
44,991
56,278
48,149
59,489
56,799
64,640
65,166
61,974
61,907
55,217
55,706
.
87
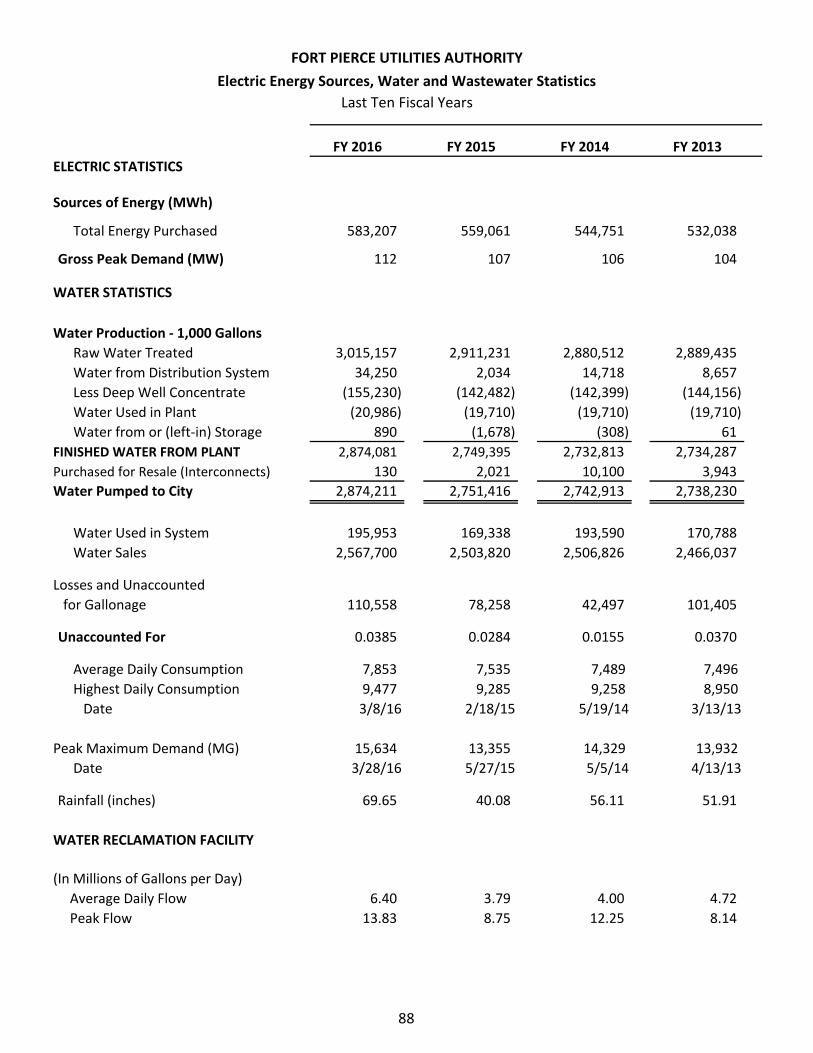
FORT PIERCE UTILITIES AUTHORITY
Electric Energy Sources, Water and Wastewater Statistics
Last Ten Fiscal Years
FY 2016 FY 2015 FY 2014 FY 2013
ELECTRIC STATISTICS
Sources of Energy (MWh)
Total Energy Purchased 583,207 559,061 544,751 532,038
Gross Peak Demand (MW) 112 107 106 104
WATER STATISTICS
Water Production - 1,000 Gallons
Raw Water Treated 3,015,157 2,911,231 2,880,512 2,889,435
Water from Distribution System 34,250 2,034 14,718 8,657
Less Deep Well Concentrate (155,230) (142,482) (142,399) (144,156)
Water Used in Plant (20,986) (19,710) (19,710) (19,710)
Water from or (left-in) Storage 890 (1,678) (308) 61
FINISHED WATER FROM PLANT 2,874,081 2,749,395 2,732,813 2,734,287
Purchased for Resale (Interconnects) 130 2,021 10,100 3,943
Water Pumped to City 2,874,211 2,751,416 2,742,913 2,738,230
Water Used in System 195,953 169,338 193,590 170,788
Water Sales 2,567,700 2,503,820 2,506,826 2,466,037
Losses and Unaccounted
for Gallonage 110,558 78,258 42,497 101,405
Unaccounted For 0.0385 0.0284 0.0155 0.0370
Average Daily Consumption 7,853 7,535 7,489 7,496
Highest Daily Consumption 9,477 9,285 9,258 8,950
Date 3/8/16 2/18/15 5/19/14 3/13/13
Peak Maximum Demand (MG) 15,634 13,355 14,329 13,932
Date 3/28/16 5/27/15 5/5/14 4/13/13
Rainfall (inches) 69.65 40.08 56.11 51.91
WATER RECLAMATION FACILITY
(In Millions of Gallons per Day)
Average Daily Flow 6.40 3.79 4.00 4.72
Peak Flow 13.83 8.75 12.25 8.14
88

FORT PIERCE UTILITIES AUTHORITY
Electric Energy Sources, Water and Wastewater Statistics
Last Ten Fiscal Years
FY 2012 FY 2011 FY 2010 FY 2009 FY 2008 FY 2007
537,115
103
552,427
115
568,637
124
553,487
115
593,686
113
608,967
124
3,088,102
17,644
(174,731)
(19,764)
4,218
2,915,469
-
2,915,469
3,101,048
16,648
(165,498)
(19,710)
6,968
2,939,456
-
2,939,456
3,023,434
16,118
(137,432)
(19,966)
1,100
2,883,254
-
2,883,254
2,993,150
N/A
(137,645)
(8,519)
N/A
2,846,986
-
2,846,986
3,013,208
N/A
(142,365)
(17,873)
N/A
2,852,970
-
2,852,970
3,455,908
N/A
(186,608)
(36,559)
N/A
3,232,741
-
3,232,741
193,707
2,641,253
171,870
2,655,068
175,255
2,598,461
170,369
2,566,712
160,987
2,573,364
132,325
2,808,640
80,509
0.0276
112,518
0.0383
109,538
0.0380
109,905
0.0386
117,619
0.0412
291,776
0.0903
7,990
10,524
4/18/12
8,053
9,741
5/30/11
7,926
9,511
7/1/10
7,827
10,403
5/8/09
7,798
10,336
5/18/08
8,927
11,054
10/23/06
17,437
7/22/12
67.10
17,765
9/14/11
30.24
17,150
5/7/10
40.54
13,304
5/7/09
39.89
13,508
12/2/07
71.72
17,271
2/1/07
42.47
4.86
13.03
3.93
4.75
4.05
5.05
4.95
9.57
6.14
20.23
5.24
7.70
89
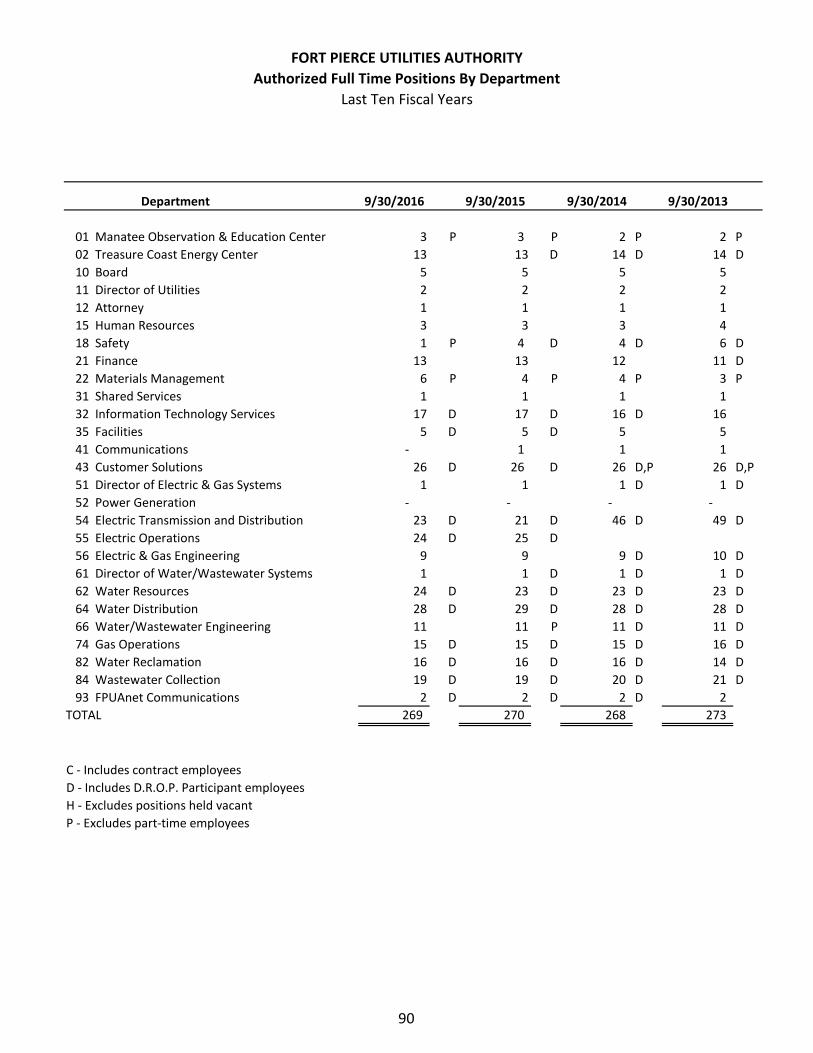
FORT PIERCE UTILITIES AUTHORITY
Authorized Full Time Positions By Department
Last Ten Fiscal Years
Department 9/30/2016 9/30/2015 9/30/2014 9/30/2013
01 Manatee Observation & Education Center 3 P 3 P 2 P 2 P
02 Treasure Coast Energy Center 13 13 D 14 D 14 D
10 Board 5 5 5 5
11 Director of Utilities 2 2 2 2
12 Attorney 1 1 1 1
15 Human Resources 3 3 3 4
18 Safety 1 P 4 D 4 D 6 D
21 Finance 13 13 12 11 D
22 Materials Management 6 P 4 P 4 P 3 P
31 Shared Services 1 1 1 1
32 Information Technology Services 17 D 17 D 16 D 16
35 Facilities 5 D 5 D 5 5
41 Communications - 1 1 1
43 Customer Solutions 26 D 26 D 26 D,P 26 D,P
51 Director of Electric & Gas Systems 1 1 1 D 1 D
52 Power Generation - - - -
54 Electric Transmission and Distribution 23 D 21 D 46 D 49 D
55 Electric Operations 24 D 25 D
56 Electric & Gas Engineering 9 9 9 D 10 D
61 Director of Water/Wastewater Systems 1 1 D 1 D 1 D
62 Water Resources 24 D 23 D 23 D 23 D
64 Water Distribution 28 D 29 D 28 D 28 D
66 Water/Wastewater Engineering 11 11 P 11 D 11 D
74 Gas Operations 15 D 15 D 15 D 16 D
82 Water Reclamation 16 D 16 D 16 D 14 D
84 Wastewater Collection 19 D 19 D 20 D 21 D
93 FPUAnet Communications 2 D 2 D 2 D 2
TOTAL 269 270 268 273
C - Includes contract employees
D - Includes D.R.O.P. Participant employees
H - Excludes positions held vacant
P - Excludes part-time employees
90
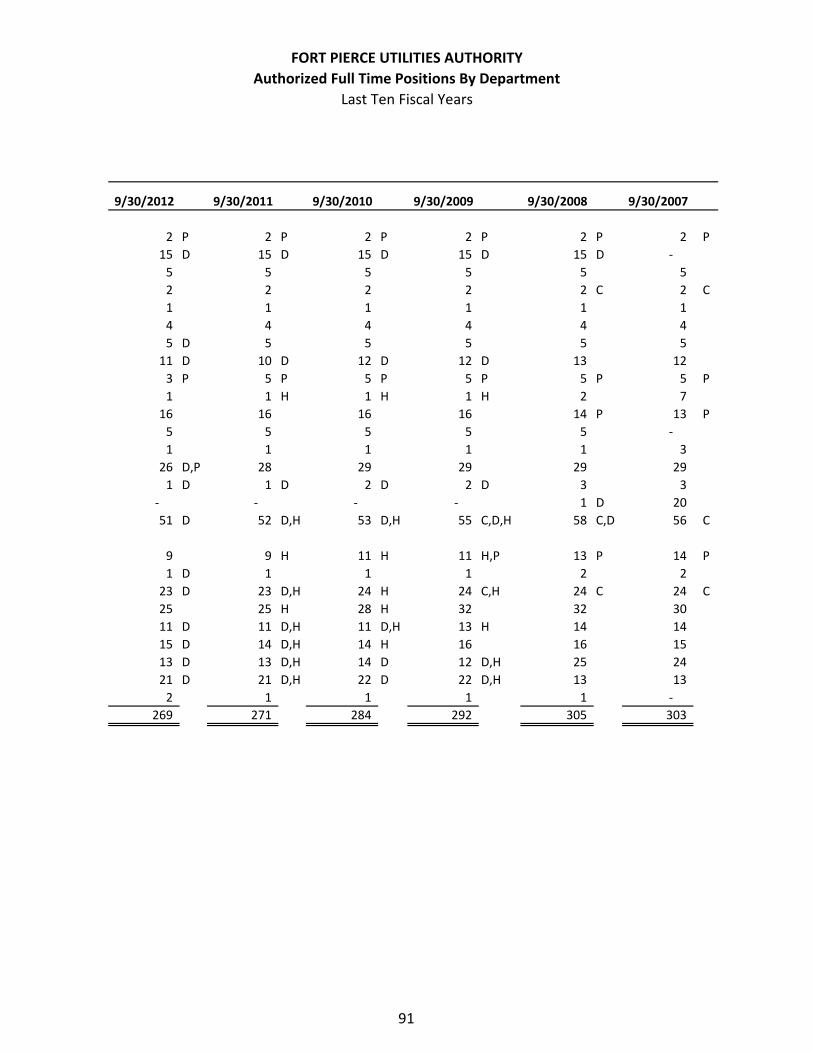
FORT PIERCE UTILITIES AUTHORITY
Authorized Full Time Positions By Department
Last Ten Fiscal Years
9/30/2012 9/30/2011 9/30/2010 9/30/2009 9/30/2008 9/30/2007
2 P 2 P 2 P 2 P 2 P 2 P
15 D 15 D 15 D 15 D 15 D -
5 5 5 5 5 5
2 2 2 2 2 C 2 C
1 1 1 1 1 1
4 4 4 4 4 4
5 D 5 5 5 5 5
11 D 10 D 12 D 12 D 13 12
3 P 5 P 5 P 5 P 5 P 5 P
1 1 H 1 H 1 H 2 7
16 16 16 16 14 P 13 P
5 5 5 5 5 -
1 1 1 1 1 3
26 D,P 28 29 29 29 29
1 D 1 D 2 D 2 D 3 3
- - - - 1 D 20
51 D 52 D,H 53 D,H 55 C,D,H 58 C,D 56 C
9 9 H 11 H 11 H,P 13 P 14 P
1 D 1 1 1 2 2
23 D 23 D,H 24 H 24 C,H 24 C 24 C
25 25 H 28 H 32 32 30
11 D 11 D,H 11 D,H 13 H 14 14
15 D 14 D,H 14 H 16 16 15
13 D 13 D,H 14 D 12 D,H 25 24
21 D 21 D,H 22 D 22 D,H 13 13
2 1 1 1 1 -
269 271 284 292 305 303
91
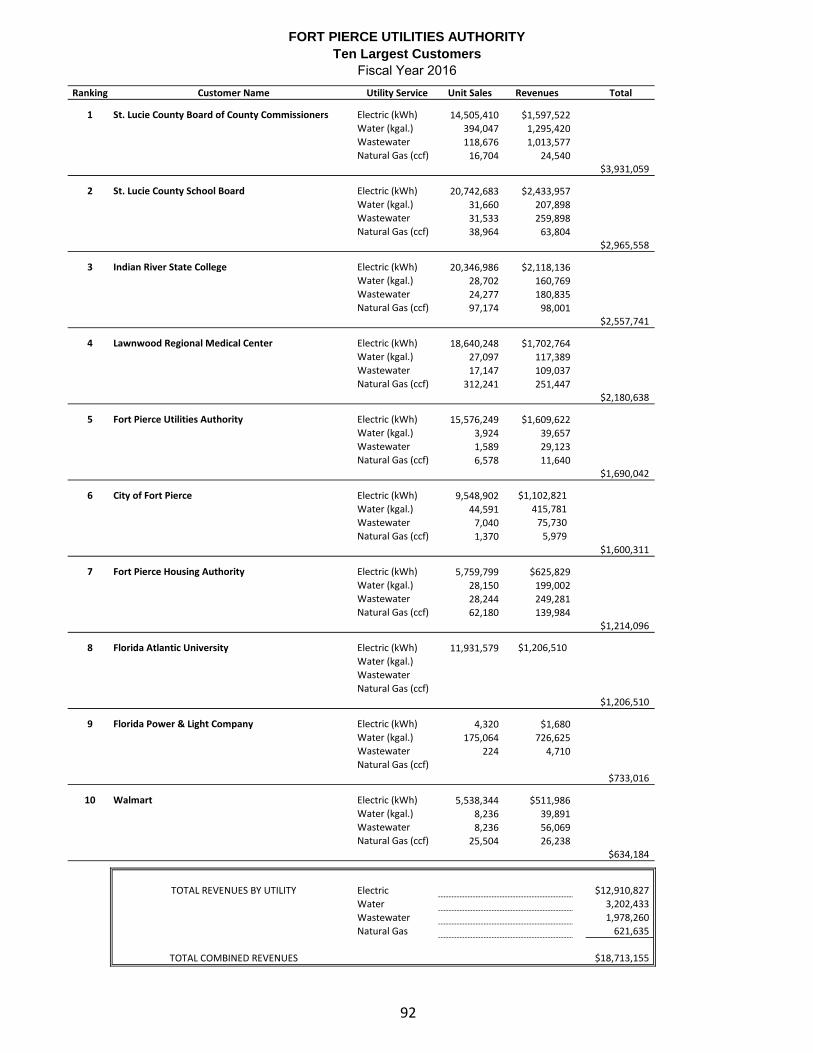
FORT PIERCE UTILITIES AUTHORITY
Ten Largest Customers
Fiscal Year 2016
Ranking Customer Name Utility Service Unit Sales Revenues Total
1 St. Lucie County Board of County Commissioners Electric (kWh)
Water (kgal.)
Wastewater
Natural Gas (ccf)
14,505,410
394,047
118,676
16,704
$1,597,522
1,295,420
1,013,577
24,540 $3,931,059
2 St. Lucie County School Board Electric (kWh)
Water (kgal.)
Wastewater
Natural Gas (ccf)
20,742,683
31,660
31,533
38,964
$2,433,957
207,898
259,898
63,804 $2,965,558
3 Indian River State College Electric (kWh)
Water (kgal.)
Wastewater
Natural Gas (ccf)
20,346,986
28,702
24,277
97,174
$2,118,136
160,769
180,835
98,001 $2,557,741
4 Lawnwood Regional Medical Center Electric (kWh)
Water (kgal.)
Wastewater
Natural Gas (ccf)
18,640,248
27,097
17,147
312,241
$1,702,764
117,389
109,037
251,447 $2,180,638
5 Fort Pierce Utilities Authority Electric (kWh)
Water (kgal.)
Wastewater
Natural Gas (ccf)
15,576,249
3,924
1,589
6,578
$1,609,622
39,657
29,123
11,640 $1,690,042
6 City of Fort Pierce Electric (kWh)
Water (kgal.)
Wastewater
Natural Gas (ccf)
9,548,902
44,591
7,040
1,370
$1,102,821
415,781
75,730
5,979
$1,600,311
7 Fort Pierce Housing Authority Electric (kWh)
Water (kgal.)
Wastewater
Natural Gas (ccf)
5,759,799
28,150
28,244
62,180
$625,829
199,002
249,281
139,984 $1,214,096
8 Florida Atlantic University Electric (kWh)
Water (kgal.)
Wastewater
Natural Gas (ccf)
11,931,579 $1,206,510
$1,206,510
9 Florida Power & Light Company Electric (kWh)
Water (kgal.)
Wastewater
Natural Gas (ccf)
4,320
175,064
224
$1,680
726,625
4,710
$733,016
10 Walmart Electric (kWh)
Water (kgal.)
Wastewater
Natural Gas (ccf)
5,538,344
8,236
8,236
25,504
$511,986
39,891
56,069
26,238 $634,184
TOTAL REVENUES BY UTILITY Electric
Water
Wastewater
Natural Gas
$12,910,827
3,202,433
1,978,260
621,635
TOTAL COMBINED REVENUES $18,713,155
92
INDEPENDENT AUDITOR’S REPORT ON INTERNAL CONTROL OVER FINANCIAL REPORTING AND ON COMPLIANCE AND OTHER MATTERS BASED ON AN AUDIT
OF FINANCIAL STATEMENTS PERFORMED IN ACCORDANCE WITH GOVERNMENT AUDITING STANDARDS
To the Board Members Fort Pierce Utilities Authority Fort Pierce, Florida
We have audited the financial statements of Fort Pierce Utilities Authority (“FPUA”), as of and for the year ended September 30, 2016, which collectively comprise of FPUA’s basic financial statements and have issued our report thereon dated February 23, 2017. We conducted our audit in accordance with auditing standards generally accepted in the United States of America and the standards applicable to financial audits contained in Government Auditing Standards, issued by the Comptroller General of the United States.
Internal Control Over Financial Reporting
In planning and performing our audit, we considered FPUA’s internal control over financial reporting to determine the audit procedures that are appropriate in the circumstances for the purpose of expressing our opinions on the financial statements, but not for the purpose of expressing an opinion on the effectiveness of FPUA’s internal control. Accordingly, we do not express an opinion on the effectiveness of FPUA’s internal control.
A deficiency in internal control exists when the design or operation of a control does not allow management or employees, in the normal course of performing their assigned functions, to prevent or detect misstatements on a timely basis. A material weakness is a deficiency, or a combination of deficiencies, in internal control such that there is a reasonable possibility that a material misstatement of the entity’s financial statements will not be prevented, or detected and corrected on a timely basis. A significant deficiency is a deficiency, or a combination of deficiencies, in internal control that is less severe than a material weakness, yet important enough to merit attention by those charged with governance.
Our consideration of internal control was for the limited purpose described in the first paragraph of this section and was not designed to identify all deficiencies in internal control that might be material weaknesses or, significant deficiencies. Given these limitations, during our audit we did not identify any deficiencies in internal control that we consider to be material weaknesses. However, material weaknesses may exist that have not been identified.
christina
LETTERHEAD

Compliance and Other Matters
As part of obtaining reasonable assurance about whether FPUA’s financial statements are free of material misstatement, we performed tests of its compliance with certain provisions of laws, regulations, contracts, and grant agreements, noncompliance with which could have a direct and material effect on the determination of financial statement amounts. However, providing an opinion on compliance with those provisions was not an objective of our audit, and accordingly, we do not express such an opinion. The results of our tests disclosed no instances of noncompliance or other matters that are required to be reported under Government Auditing Standards.
Purpose of this Report
The purpose of this report is solely to describe the scope of our testing of internal control and compliance and the results of testing, and not to provide an opinion on the effectiveness of the entity’s internal control or on compliance. This report is an integral part of an audit performed in accordance with Government Auditing Standards in considering the entity’s internal control and compliance. Accordingly, this communication is not suitable for any other purpose.
DiBartolomeo, McBee, Hartley & Barnes, P.A. Fort Pierce, Florida February 23, 2017
christina
SIGNATURE