St. Lucie County Transportation Disadvantaged...
96
St. Lucie County Transportation Disadvantaged Service Plan (TDSP) Major Update A Coordinated Public Transit-Human Services Transportation Plan Prepared by: St. Lucie Transportation Planning Organization (TPO) St. Lucie County Community Services Department Community Transit September 2013
-
Upload
nguyenhanh -
Category
Documents
-
view
217 -
download
1
Transcript of St. Lucie County Transportation Disadvantaged...
1
St. Lucie County
Transportation Disadvantaged Service Plan (TDSP)
Major Update
A Coordinated Public Transit-Human Services Transportation Plan
Prepared by:
St. Lucie Transportation Planning Organization (TPO)
St. Lucie County Community Services Department
Community Transit
September 2013

2
This page intentionally left blank
i
Transportation Disadvantaged Service Plan - Major Update 2013
Table of Contents
INTRODUCTION ................................................................................................................. 1
DEVELOPMENT PLAN
A. Introduction to Service Area ............................................................................................. 2
1.Background of the Transportation Disadvantaged (TD) Program ..................................... 2
2.Community Transportation Coordinator (CTC) Designation Date/History ........................... 2
3.Organization Chart ................................................................................................... 2
4.Consistency Review of Other Plans .............................................................................. 4
5.Public Participation ................................................................................................... 7
B. Service Area Profile / Demographics .................................................................................. 8
1.Service Area Description ............................................................................................ 8
2.Demographics .......................................................................................................... 8
a. Land Use ........................................................................................................... 8
b. Population / Composition ................................................................................... 10
c. Transit Orientation Analysis ................................................................................ 12
d. Employment .................................................................................................... 12
e. Major Trip Generators / Attractors ....................................................................... 12
f. Inventory of Available Transportation Services ...................................................... 12
C. Service Analysis ........................................................................................................... 16
1.Estimates and Forecasts of TD Population .................................................................. 16
2.Needs Assessment .................................................................................................. 19
a. Transportation Coordination Network (TCN) Public Survey ...................................... 19
b. Access to Prenatal Care Public Survey ................................................................. 24
3.Barriers to Coordination .......................................................................................... 25
D. Mission Statement, Goals, Objectives, and Strategies ........................................................ 26
E. Implementation Schedule .............................................................................................. 26
ii
Transportation Disadvantaged Service Plan - Major Update 2013
Table of Contents (continued) SERVICE PLAN
A. Operations ................................................................................................................... 29
1.Types, Hours and Days of Service ............................................................................. 29
2.Accessing Services ............................................................................................................ 30
3.Transportation Operators and Coordination Contractors ............................................... 32
4.Public Transit Utilization .......................................................................................... 32
5.School Bus Utilization .............................................................................................. 32
6.Vehicle Inventory .................................................................................................. 32
7.System Safety Program Plan Certification .................................................................. 32
8.Inter-County Services ............................................................................................ 34
9.Emergency Preparedness and Response ................................................................... 34
10.Educational Efforts / Marketing .............................................................................. 34
11.Acceptable Alternatives ........................................................................................ 34
12.Service Standards ................................................................................................ 34
13.Local Complaint and Grievance Procedures / Process ................................................ 38
14.CTC Monitoring Procedures of Operators and Coordination Contractors ......................... 39
15.Coordination Contract Evaluation Criteria ................................................................ 39
B. Cost / Revenue Allocation and Rate Structure Justification .................................................. 39
1.Cost Revenue Allocation .......................................................................................... 39
2.Passenger Fare Structures ....................................................................................... 39
MAPS, FIGURES, and TABLES
Map 1—St. Lucie County Location Map ................................................................................... 8
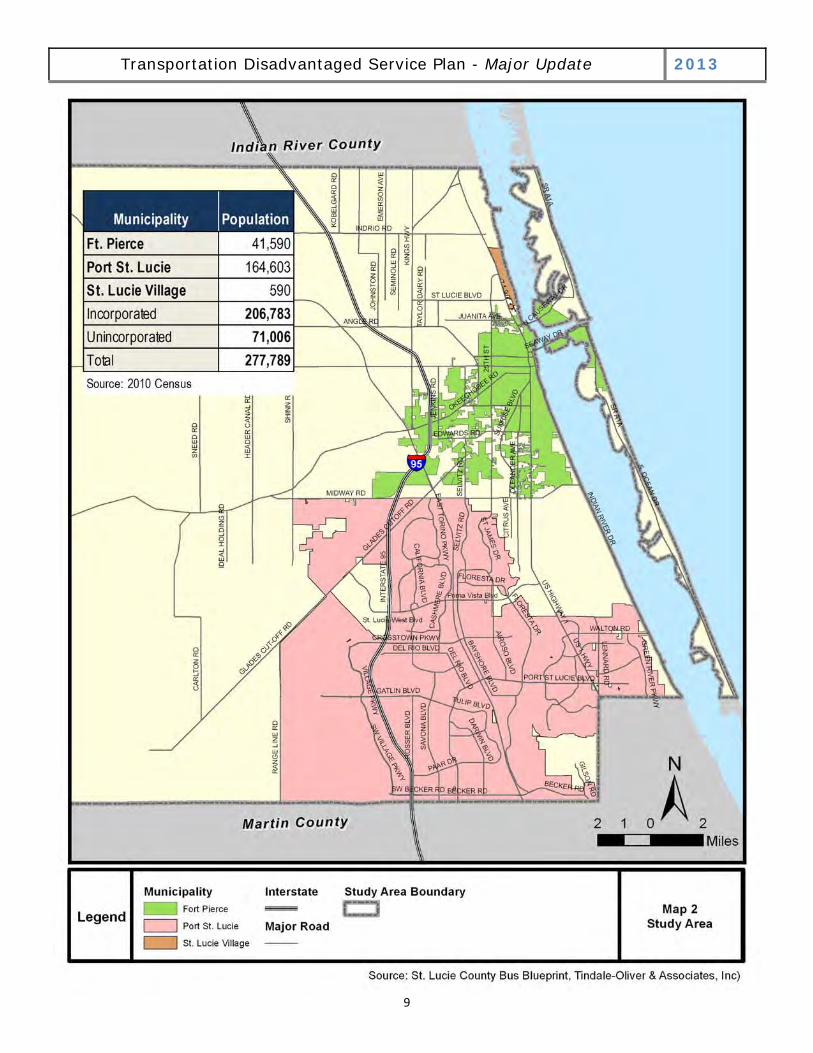
Map 2—Transportation Disadvantaged Service Plan (TDSP) Study Area ...................................... 9
Map 3—Florida Population Density by County........................................................................ 11
Map 4—Transit Orientation Analysis .................................................................................. 13
Map 5—St. Lucie County Zip Code Boundaries ...................................................................... 25
Figure 1—St. Lucie County TD Services Organization Chart ....................................................... 3
Figure 2—TD Population .................................................................................................... 16
Figure 3—TCN Survey: Times Transportation Needed ............................................................ 20
iii
Transportation Disadvantaged Service Plan - Major Update 2013
Table of Contents (continued)
Figure 4—TCN Survey: Current Mode to Destination .............................................................. 21
Figure 5—TCN Survey: Trip Purpose .................................................................................... 21
Figure 6—TCN Survey: Unable to Travel Reason ................................................................... 22
Figure 7—TCN Survey: Assistance Needed for Transportation ................................................. 23
Figure 8—TCN Survey: One-way Ride Trip Cost Willing to Pay ................................................. 23
Figure 9—TCN Survey: Method of Contact ............................................................................ 24
Table 1—Major Employers in St. Lucie County ...................................................................... 14
Table 2—Common TD Trip Destinations ............................................................................... 15
Table 3—General TD Population ......................................................................................... 17
Table 4—Critical Need-Severely Disabled TD Population ......................................................... 17
Table 5—Daily Trips for the Critical Need TD Population ......................................................... 18
Table 6—Ongoing System Improvements and Review ............................................................ 27
Table 7—Implementation Plan—Actions and Strategies .......................................................... 28
Table 8—Transportation Operators and Coordinated Contractors ............................................. 33
Table 9—Fixed Route Fares ................................................................................................ 40
Table 10—Demand Response System Fares .......................................................................... 40
APPENDICES
Appendix A—St. Lucie County Inventory of Available Transportation Services ............................ 41
Appendix B—TD Estimates and Forecast Tables ..................................................................... 44
Appendix C—Mission Statement, Goals, Objectives and Strategies ........................................... 49
Appendix D—Treasure Coast Connector Plus Rider’s Guide ...................................................... 56
Appendix E—Vehicle Inventory ........................................................................................... 67
Appendix F—System Safety Program Plan Certification .......................................................... 69
Appendix G—Local Coordinating Board (LCB) Grievance Procedures ......................................... 71
Appendix H—Rate Model Calculation Spreadsheet .................................................................. 77
Appendix I—Glossary of Terms and Abbreviations ................................................................ 80
Appendix J—TDSP/Coordinated Plan Certification .................................................................. 86
Appendix K—TDSP/Coordinated Plan LCB Roll Call Vote .......................................................... 88
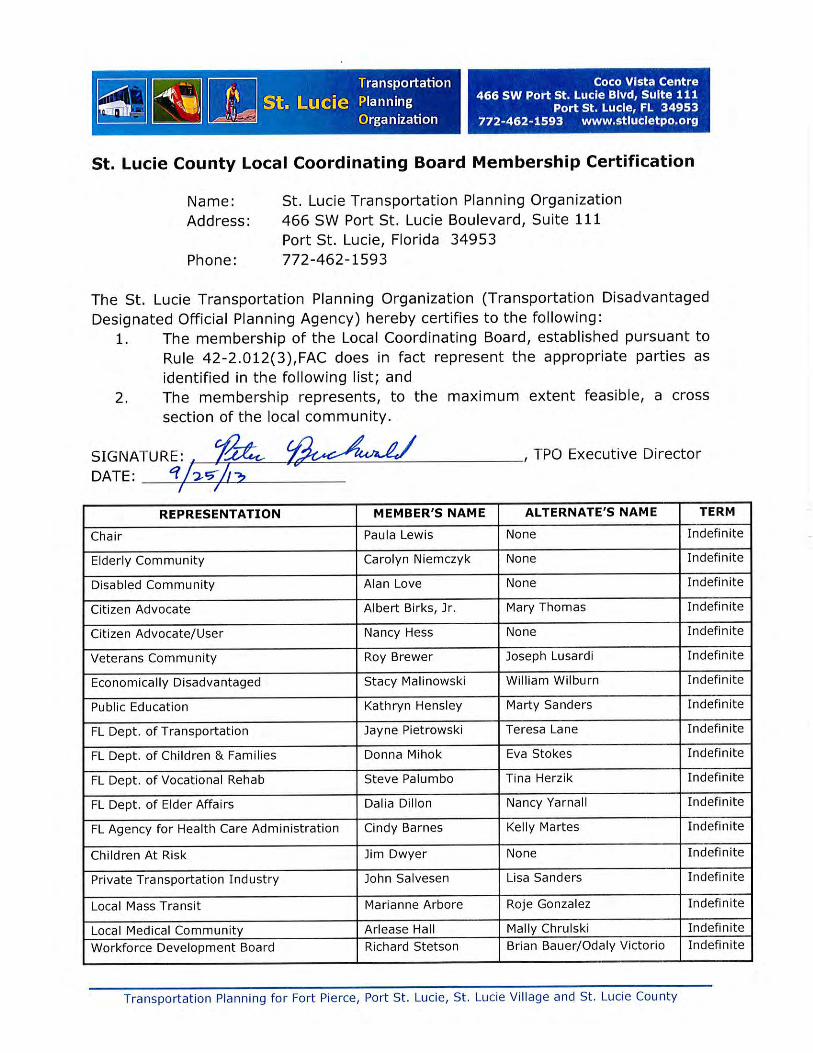
Appendix L—St. Lucie County LCB Membership Certification ................................................... 90
1
Transportation Disadvantaged Service Plan - Major Update 2013
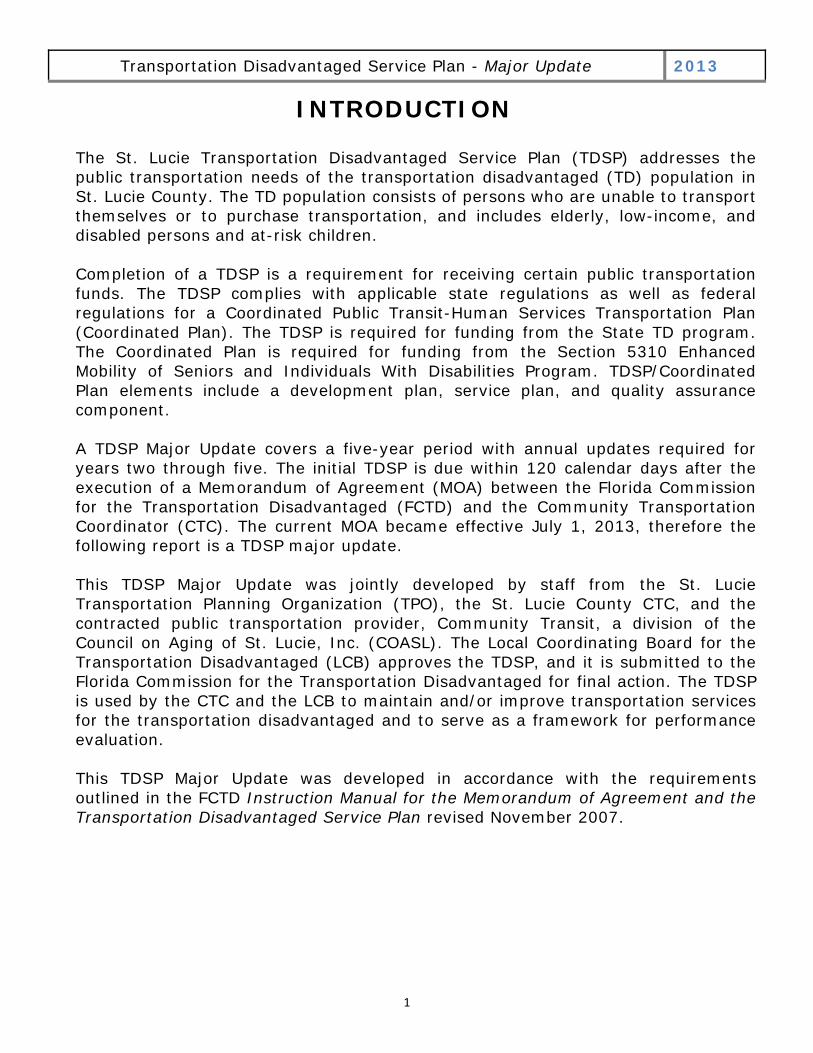
INTRODUCTION The St. Lucie Transportation Disadvantaged Service Plan (TDSP) addresses the public transportation needs of the transportation disadvantaged (TD) population in St. Lucie County. The TD population consists of persons who are unable to transport themselves or to purchase transportation, and includes elderly, low-income, and disabled persons and at-risk children.
Completion of a TDSP is a requirement for receiving certain public transportation funds. The TDSP complies with applicable state regulations as well as federal regulations for a Coordinated Public Transit-Human Services Transportation Plan (Coordinated Plan). The TDSP is required for funding from the State TD program. The Coordinated Plan is required for funding from the Section 5310 Enhanced Mobility of Seniors and Individuals With Disabilities Program. TDSP/Coordinated Plan elements include a development plan, service plan, and quality assurance component.
A TDSP Major Update covers a five-year period with annual updates required for years two through five. The initial TDSP is due within 120 calendar days after the execution of a Memorandum of Agreement (MOA) between the Florida Commission for the Transportation Disadvantaged (FCTD) and the Community Transportation Coordinator (CTC). The current MOA became effective July 1, 2013, therefore the following report is a TDSP major update.
This TDSP Major Update was jointly developed by staff from the St. Lucie Transportation Planning Organization (TPO), the St. Lucie County CTC, and the contracted public transportation provider, Community Transit, a division of the Council on Aging of St. Lucie, Inc. (COASL). The Local Coordinating Board for the Transportation Disadvantaged (LCB) approves the TDSP, and it is submitted to the Florida Commission for the Transportation Disadvantaged for final action. The TDSP is used by the CTC and the LCB to maintain and/or improve transportation services for the transportation disadvantaged and to serve as a framework for performance evaluation. This TDSP Major Update was developed in accordance with the requirements outlined in the FCTD Instruction Manual for the Memorandum of Agreement and the Transportation Disadvantaged Service Plan revised November 2007.
2
Transportation Disadvantaged Service Plan - Major Update 2013
DEVELOPMENT PLAN
A. Introduction to Service Area 1. Background of the TD Program
Chapter 427 of the Florida Statutes establishes the Florida Commission for the Transportation Disadvantaged (FCTD). The FCTD is an independent agency tasked with carrying out the mission of ensuring the availability of efficient, cost-effective and quality transportation services for transportation disadvantaged persons. The FCTD appoints an Executive Director who serves under its direction and supervision. This position employs and oversees personnel who carry out the daily functions of the FCTD. The staff office is located in Tallahassee. Administrative and fiscal services are provided to the FCTD by the Florida Department of Transportation.
At the local level, the FCTD accomplishes its mission through qualified Community Transportation Coordinators (CTCs) and a designated planning agency. Each county within the State of Florida has a CTC whose primary responsibility is the arrangement or provision of transportation services to transportation disadvantaged persons within the service area. A planning agency may serve one or more CTCs. The planning agency provides an avenue to ensure that TD planning is accomplished within the service area and provides staff support and resources to enable the LCB to fulfill its responsibilities.
2. Community Transportation Coordinator Designation Date/History The St. Lucie Board of County Commissioners (BOCC) has been the designated CTC since 1990. The County, through its Community Services Department, contracts with Community Transit/COASL to provide public transportation and transportation disadvantaged services.
In 2013, the FCTD approved the continuation of the County as the St. Lucie County CTC and subsequently entered into a new five-year Memorandum of Agreement with the County.
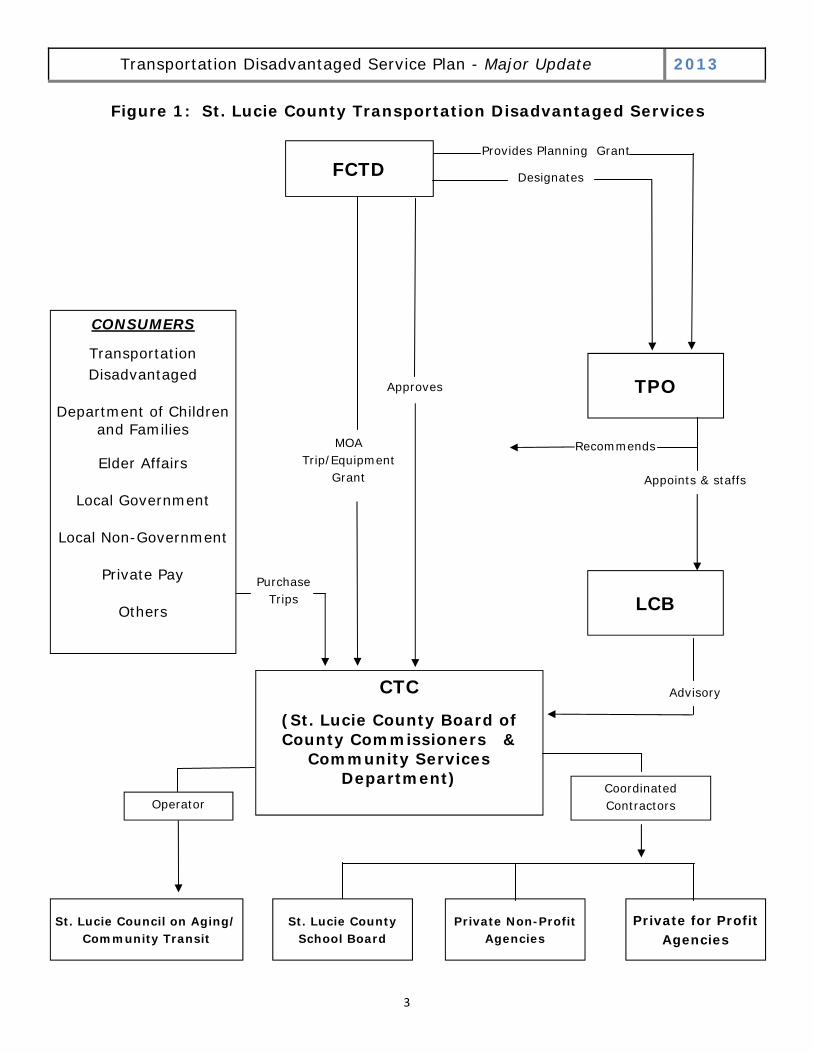
3. Organization Chart
Figure 1 provides an organization chart of the St. Lucie County CTC and FCTD process.
3
FCTD Provides Planning Grant
Designates
LCB
Appoints & staffs
Recommends
CTC
(St. Lucie County Board of County Commissioners &
Community Services Department)
CONSUMERS
Transportation Disadvantaged
Department of Children and Families
Elder Affairs
Local Government
Local Non-Government
Private Pay
Others
St. Lucie Council on Aging/ Community Transit
St. Lucie County School Board
Private Non-Profit Agencies
Private for Profit Agencies
Coordinated Contractors Operator
Approves
MOA Trip/Equipment
Grant
Purchase Trips
Advisory
Figure 1: St. Lucie County Transportation Disadvantaged Services
Transportation Disadvantaged Service Plan - Major Update 2013
TPO
4
Transportation Disadvantaged Service Plan - Major Update 2013
4. Consistency Review of Other Plans The following plans were reviewed in order to determine consistency and identify existing goals, objectives and policies that support TD issues. Below is a list of the documents as well as details on specific policies, where applicable.
St. Lucie County Growth Management Plan
City of Ft. Pierce Comprehensive Plan
City of Port St. Lucie Comprehensive Plan
2035 St. Lucie/Martin Regional Long Range Transportation Plan
St. Lucie/Martin Regional Transit Development Plan
Transportation Improvement Program
Treasure Coast Regional Planning Council Strategic Regional Policy Plan
Commission for the Transportation Disadvantaged 5 and 20 Year Plan
2060 Florida Transportation Plan
U.S. E.P.A. Report: Creating Equitable, Sustainable, and Healthy Communities
Transportation Coordination Network (TCN) Vision Statement
St. Lucie County Comprehensive Plan (2010) Recognizing the need for continued mobility of County residents, as a supplement to road building, the Plan explores multiple scenarios which improve transit service and ridership that were developed as part of the St. Lucie/Martin Regional Transit Development Plan. Scenarios range from expanded hours and days of operation to expanded routes. The Goals, Objectives, and Policies are consistent with the TDSP as well. Objective 2.5.1 specifically addresses the TD population: “Address the provision of efficient public transit services based upon existing and proposed major trip generators and attractors, safe and convenient public transit terminals, land uses and accommodation of the special needs of the transportation disadvantaged in St. Lucie County.” City of Port St. Lucie Comprehensive Plan (2012) There is a focus on the effort to add more sidewalks in the City. Recognizing that sidewalk construction is critical to transit use, the number of bus stops on a road segment is one of the factors used in prioritizing sidewalk construction locations. Specific policy language addressing transit is found in the following Transportation Element Objectives and Policies:
5
Transportation Disadvantaged Service Plan - Major Update 2013
Objective 2.2.2: “In cooperation with the County, review and revise as needed plans to provide transportation services to the transportation disadvantaged.” Policy 2.2.2.1: “In coordination with the St. Lucie County Council on Aging, the City may continue to plan to provide effective service for work, meals, and other necessary trips to the transportation disadvantaged within the City.” Policy 2.2.2.4: “Ensure that all new parking facilities, pedestrian facilities, transit amenities, and all other transportation infrastructure is in compliance with ADA standards.” Policy 2.3.3.3: “Encourage transit services that address the needs of persons with disabilities, elderly, people with special needs, and people who depend on public transit for their mobility.”
City of Fort Pierce Comprehensive Plan (2011) The following policies address St. Lucie County transit and accessibility. Policy 2.12.6: “The LOS [Level of Service] standard for transit shall be consistent with St. Lucie County’s adopted LOS standard for the St. Lucie County Transit System.” Policy 2.13.6: “The City shall prioritize sidewalk improvements within a one-mile area around schools to enhance its “safe routes to school” and to provide handicapped accessible pedestrian connections around all transit stops.” 2035 Regional Long Range Transportation Plan (RLRTP) (2011) In preparation of the 2035 RLRTP, a review of all relevant local and regional transportation studies was conducted. Chapter 3 summarizes the 2008 TDSP and discusses the current and future needs of the transportation disadvantaged, mainly the need to travel across county lines and regionally. St. Lucie/Martin Regional Transit Development Plan (2010) The Regional Transit Development Plan (TDP) is based on demographics such as elderly and low-income populations and the needs of those using transit for travel to work. The transportation disadvantaged population is identified by these demographics. Because the Regional TDP covers St. Lucie County and Martin County, it helps to serve those who live in one county and have essential needs for travel to the other.
6
Transportation Disadvantaged Service Plan - Major Update 2013
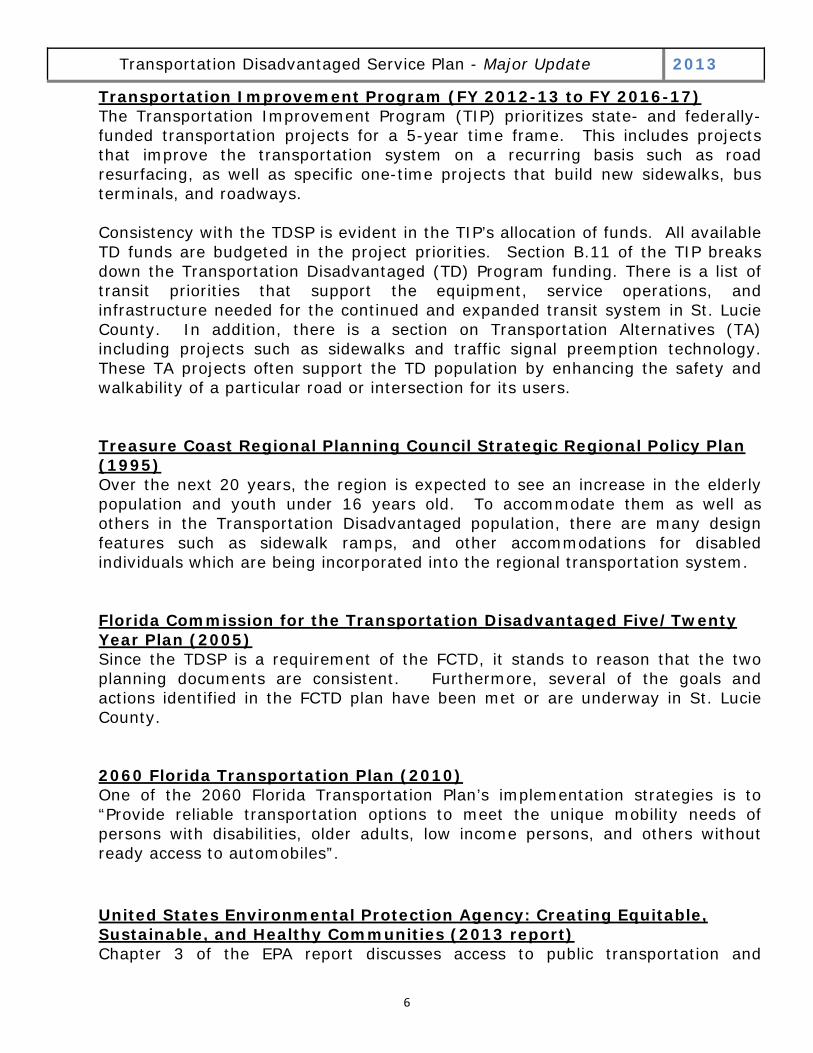
Transportation Improvement Program (FY 2012-13 to FY 2016-17) The Transportation Improvement Program (TIP) prioritizes state- and federally-funded transportation projects for a 5-year time frame. This includes projects that improve the transportation system on a recurring basis such as road resurfacing, as well as specific one-time projects that build new sidewalks, bus terminals, and roadways. Consistency with the TDSP is evident in the TIP’s allocation of funds. All available TD funds are budgeted in the project priorities. Section B.11 of the TIP breaks down the Transportation Disadvantaged (TD) Program funding. There is a list of transit priorities that support the equipment, service operations, and infrastructure needed for the continued and expanded transit system in St. Lucie County. In addition, there is a section on Transportation Alternatives (TA) including projects such as sidewalks and traffic signal preemption technology. These TA projects often support the TD population by enhancing the safety and walkability of a particular road or intersection for its users. Treasure Coast Regional Planning Council Strategic Regional Policy Plan (1995) Over the next 20 years, the region is expected to see an increase in the elderly population and youth under 16 years old. To accommodate them as well as others in the Transportation Disadvantaged population, there are many design features such as sidewalk ramps, and other accommodations for disabled individuals which are being incorporated into the regional transportation system. Florida Commission for the Transportation Disadvantaged Five/Twenty Year Plan (2005) Since the TDSP is a requirement of the FCTD, it stands to reason that the two planning documents are consistent. Furthermore, several of the goals and actions identified in the FCTD plan have been met or are underway in St. Lucie County. 2060 Florida Transportation Plan (2010) One of the 2060 Florida Transportation Plan’s implementation strategies is to “Provide reliable transportation options to meet the unique mobility needs of persons with disabilities, older adults, low income persons, and others without ready access to automobiles”. United States Environmental Protection Agency: Creating Equitable, Sustainable, and Healthy Communities (2013 report) Chapter 3 of the EPA report discusses access to public transportation and
7
Transportation Disadvantaged Service Plan - Major Update 2013
implementing equitable transit oriented development. The report recognizes that “public transportation is especially critical for low-income people, older adults, youth, and individuals with disabilities who might not have other ways of getting around”. In addition, the report encourages Transit Oriented Development (TOD), “Providing affordable housing near transit can significantly lower combined housing and transportation costs”. Vision of the Transportation Coordination Network (TCN) (2012) Established under a technical assistance grant from the Easter Seals Project Action, the TCN is a local network of social service agencies and transportation providers working to bridge gaps in transportation for the transportation disadvantaged. The vision of the TCN is “to develop a safe, comprehensive and accessible transportation network that delivers regional coverage on a sustainable basis by coordinating public, private and non-profit partnerships.” This vision is consistent with the TDSP in that it strives to meet the needs of the TD population by setting up a system that may remain in place indefinitely while utilizing available resources most efficiently.
5. Public Participation
Development of the TDSP represents a coordinated and collaborative effort among transportation providers, passengers, advocates, social service agencies, and other community groups. The public involvement process has been mainly accomplished through the LCB, the Transportation Coordination Network (TCN), the Treasure Coast Transit Meeting (TCTM), and South Florida Commuter Services (SFCS). The LCB consists of elected officials, social services representatives, and citizen advocates who guide and assist the CTC in the coordination of TD services. The TCN is a collaborative of social service agencies and transportation providers. The TCTM is a quarterly meeting of Indian River, Martin, and St. Lucie transit and human services transportation staff. SFCS promotes ride sharing and transit use to improve the public’s access to jobs and job training. The TDSP was prepared with input from the general public which was gathered through meetings with the above-mentioned partners and at the annual LCB public hearing in March 2013. At the public hearing an overview of the TD program and transit operations was provided and the TDSP mission statement, goals, and objectives were reviewed. Public participation also was solicited at the LCB June 2013 and September 2013 regular meetings. Notice was provided for both the public hearing and regular meetings.
8
Transportation Disadvantaged Service Plan - Major Update 2013
An LCB steering committee provided additional input into the development of the TDSP. The Steering Committee reviewed and commented on the Plan during the development of the mission statement, goals, objectives and strategies, and the implementation program. The Steering Committee was composed of TPO staff, the CTC, Community Transit staff, and two LCB members, including one citizen’s advocate. The efforts of the TDSP Steering Committee were coordinated with the process for the Major Update of the St. Lucie County Transit Development Plan which began in Spring 2013 and will conclude in mid 2014.
B. Service Area Profile/Demographics 1. Service Area Description
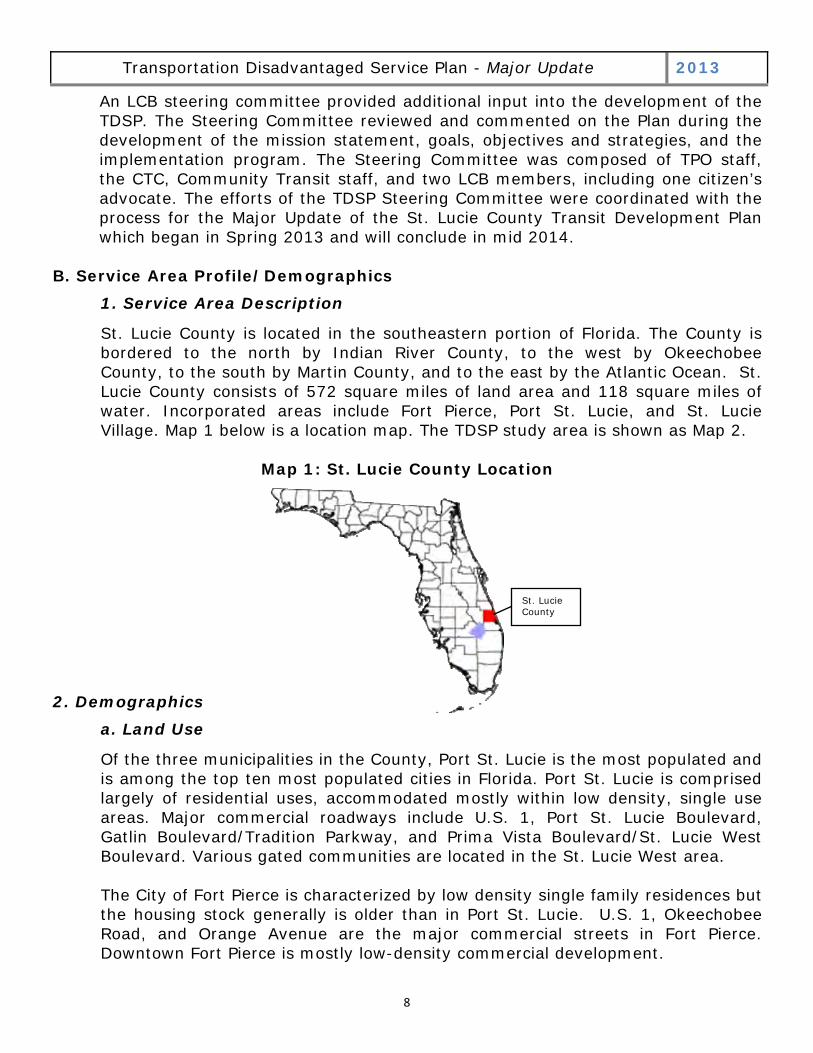
St. Lucie County is located in the southeastern portion of Florida. The County is bordered to the north by Indian River County, to the west by Okeechobee County, to the south by Martin County, and to the east by the Atlantic Ocean. St. Lucie County consists of 572 square miles of land area and 118 square miles of water. Incorporated areas include Fort Pierce, Port St. Lucie, and St. Lucie Village. Map 1 below is a location map. The TDSP study area is shown as Map 2.
Map 1: St. Lucie County Location
2. Demographics
a. Land Use
Of the three municipalities in the County, Port St. Lucie is the most populated and is among the top ten most populated cities in Florida. Port St. Lucie is comprised largely of residential uses, accommodated mostly within low density, single use areas. Major commercial roadways include U.S. 1, Port St. Lucie Boulevard, Gatlin Boulevard/Tradition Parkway, and Prima Vista Boulevard/St. Lucie West Boulevard. Various gated communities are located in the St. Lucie West area. The City of Fort Pierce is characterized by low density single family residences but the housing stock generally is older than in Port St. Lucie. U.S. 1, Okeechobee Road, and Orange Avenue are the major commercial streets in Fort Pierce. Downtown Fort Pierce is mostly low-density commercial development.
St. Lucie County
9
Transportation Disadvantaged Service Plan - Major Update 2013
10
St. Lucie Village is the third incorporated area in St. Lucie County. St. Lucie Village is an enclave of residences located along Old Dixie Highway. Unincorporated St. Lucie County includes various pockets of low-density residential land uses in the northern and central part of the County and agricultural land uses in the western area of the County. A north/south barrier island known as Hutchinson Island generally separates the County from the Atlantic Ocean. Hutchinson Island is characterized by higher density development than found on the mainland. The large geographic size of St. Lucie County combined with the dominance of low density residential land uses presents a challenge to providing demand response service. Map 3 shows the density of St. Lucie County in relationship to other Florida counties.
b. Population / Composition
The U.S. Census Bureau provides annual estimates of population and other demographics at the local level. The 2012 estimated population for St. Lucie County was approximately 284,000 compared with a 2010 population of approximately 278,000 which represents a two percent increase. The percentage of persons 65 years and older was 21 percent, which is slightly higher than the statewide percentage of 18 percent. Nonwhite persons accounted for 40 percent of the County population which is slightly lower than 43 percent statewide. The estimated median household income for St. Lucie County was approximately $45,000 compared to approximately $48,000 statewide. Persons living below the poverty level were 15 percent of the populations both for St. Lucie County and statewide.
Based on a land area of 572 square miles and a 2012 estimated population of approximately 284,000, St. Lucie County has a population density of approximately 495 persons per square mile. While this number would seem to indicate that 495 persons live on each square mile of land area, the density within the county varies dramatically because the majority of the population lives in the eastern part of the county. Therefore, density is only a raw gauge to measure a population's distribution across a land area. Map 3 shows the density of St. Lucie County in relationship to other Florida counties.
The Bureau of Economic and Business Research (BEBR) provides selected trend statistics for St. Lucie County. According to BEBR, the working age population increased from approximately 146,000 in 2006 to approximately 160,000 in 2010, a ten percent increase. During the same time period, the number of 60+ year olds living in poverty increased from approximately 5,500 to approximately 5,700, a four percent increase. Medicare enrollment jumped from approximately 48,000 to approximately 55,000 for a 15 percent increase. And the number of Medicaid
Transportation Disadvantaged Service Plan - Major Update 2013

11
Transportation Disadvantaged Service Plan - Major Update 2013
Map 3: Florida Population Density by County in 2010
12
Transportation Disadvantaged Service Plan - Major Update 2013
recipients increased from approximately 48,000 to 51,000, a six percent increase.
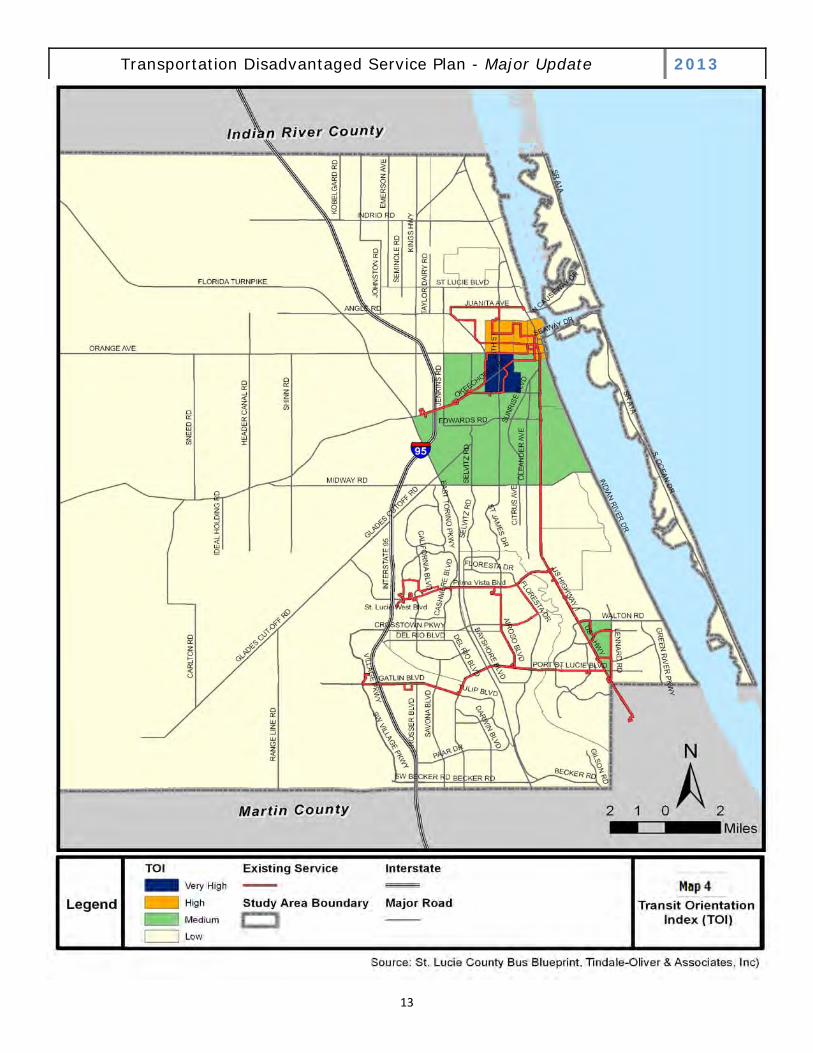
c. Transit Orientation Analysis
A transit orientation analysis was developed to assess the locations of those persons who are more likely to use public transportation. Generally this includes those who, because of their age, cannot drive (or prefer not to drive) automobiles. It also includes those who cannot afford to drive. The analysis is based on the following four demographic categories:
Youth (age < 15)
Elderly (age > 60)
Poverty (Households with income at or lower than the poverty level)
Zero-vehicle households
As Map 4 shows, an area north of Midway Road, particularly in Fort Pierce, has a concentration of persons who would be most likely to use public transportation. In Port St. Lucie, an area with a high concentration of persons likely to use public transportation is located east of U.S. 1. d. Employment
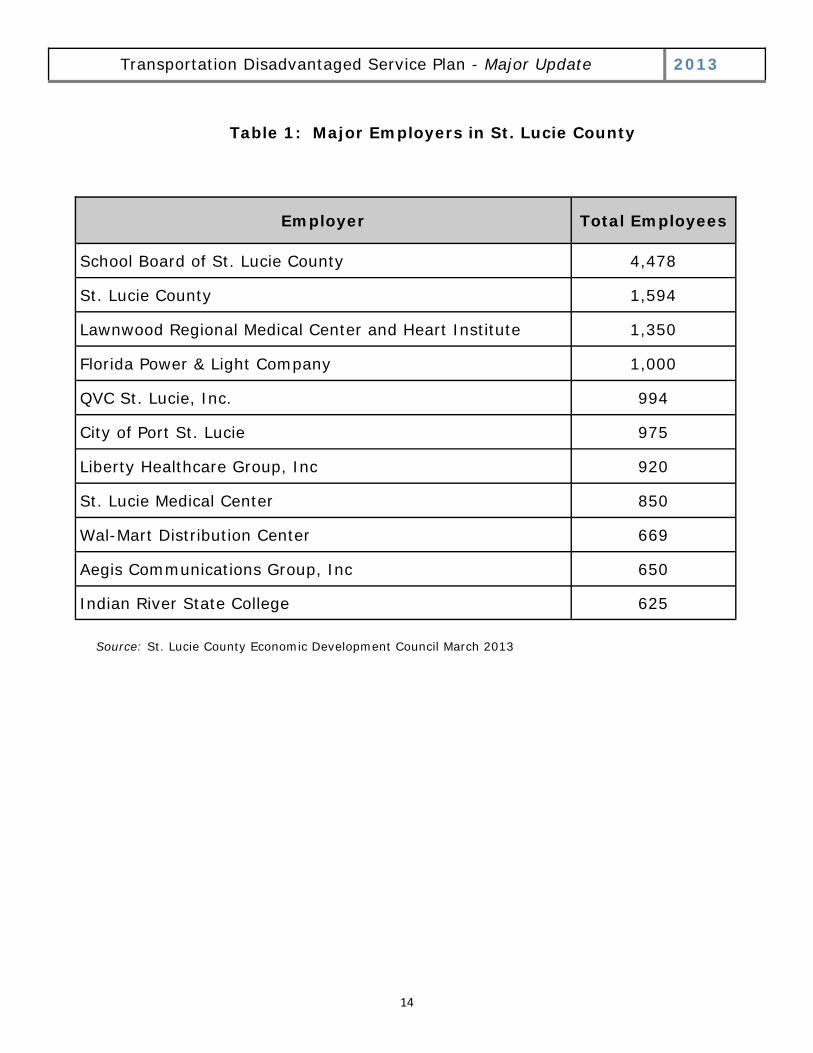
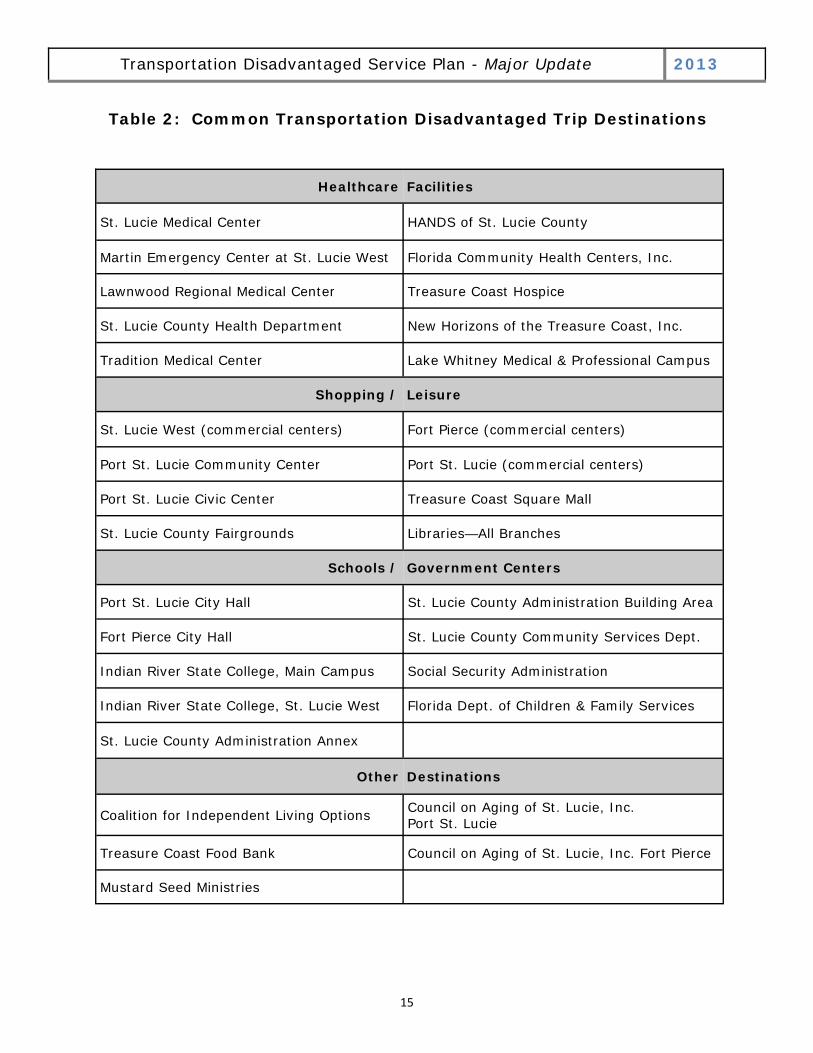
According to the U.S. Census, the mean travel time to work for workers age 16+ for the period between 2007-2011 was 28.2 minutes compared to 25.7 minutes for workers statewide. This reflects the fact that many workers in St. Lucie County travel outside the County for employment. Table 1 lists the major employers in St. Lucie County. Much of this employment is located on sites scattered throughout the County. e. Major Trip Generators/Attractors Major trip generators/attractors in St. Lucie County include Healthcare Facilities, Shopping/Entertainment, and Schools/Government Offices. Because St. Lucie County does not have a regional mall, residents in the south part of the County generally shop at the Treasure Coast Square Mall located in Martin County and residents in northern St. Lucie County shop at the Indian River Mall in Indian River County. A list of Common Transportation Disadvantaged Trip Destinations is shown in Table 2.
f. Inventory of Available Transportation Services
Appendix A contains a list of transportation providers in St. Lucie County.
13
Transportation Disadvantaged Service Plan - Major Update 2013
14
Transportation Disadvantaged Service Plan - Major Update 2013
Employer Total Employees
School Board of St. Lucie County 4,478
St. Lucie County 1,594
Lawnwood Regional Medical Center and Heart Institute 1,350
Florida Power & Light Company 1,000
QVC St. Lucie, Inc. 994
City of Port St. Lucie 975
Liberty Healthcare Group, Inc 920
St. Lucie Medical Center 850
Wal-Mart Distribution Center 669
Aegis Communications Group, Inc 650
Indian River State College 625
Table 1: Major Employers in St. Lucie County
Source: St. Lucie County Economic Development Council March 2013
15
Transportation Disadvantaged Service Plan - Major Update 2013
Table 2: Common Transportation Disadvantaged Trip Destinations
Healthcare Facilities
St. Lucie Medical Center HANDS of St. Lucie County
Martin Emergency Center at St. Lucie West Florida Community Health Centers, Inc.
Lawnwood Regional Medical Center Treasure Coast Hospice
St. Lucie County Health Department New Horizons of the Treasure Coast, Inc.
Tradition Medical Center Lake Whitney Medical & Professional Campus
Shopping / Leisure
St. Lucie West (commercial centers) Fort Pierce (commercial centers)
Port St. Lucie Community Center Port St. Lucie (commercial centers)
Port St. Lucie Civic Center Treasure Coast Square Mall
Schools / Government Centers
Port St. Lucie City Hall St. Lucie County Administration Building Area
Fort Pierce City Hall St. Lucie County Community Services Dept.
Indian River State College, Main Campus Social Security Administration
Indian River State College, St. Lucie West Florida Dept. of Children & Family Services
Other Destinations
Coalition for Independent Living Options Council on Aging of St. Lucie, Inc. Port St. Lucie
Treasure Coast Food Bank Council on Aging of St. Lucie, Inc. Fort Pierce
Mustard Seed Ministries
St. Lucie County Fairgrounds Libraries—All Branches
St. Lucie County Administration Annex
16
Transportation Disadvantaged Service Plan - Major Update 2013
C. Service Analysis
1. Estimates and Forecasts of Transportation Disadvantaged Population
One of the required elements of the service analysis section of the TDSP is the forecast of the TD population for the service area.
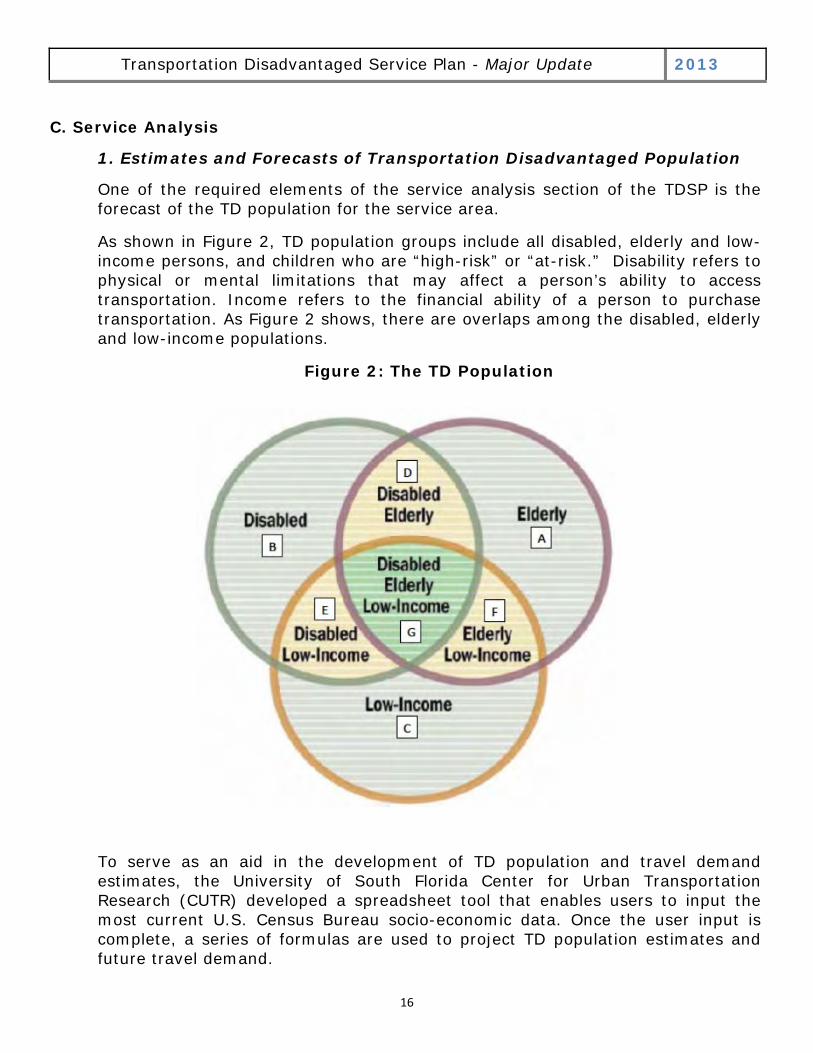
As shown in Figure 2, TD population groups include all disabled, elderly and low-income persons, and children who are “high-risk” or “at-risk.” Disability refers to physical or mental limitations that may affect a person’s ability to access transportation. Income refers to the financial ability of a person to purchase transportation. As Figure 2 shows, there are overlaps among the disabled, elderly and low-income populations.
Figure 2: The TD Population
To serve as an aid in the development of TD population and travel demand estimates, the University of South Florida Center for Urban Transportation Research (CUTR) developed a spreadsheet tool that enables users to input the most current U.S. Census Bureau socio-economic data. Once the user input is complete, a series of formulas are used to project TD population estimates and future travel demand.
17
Table 3: General TD Population
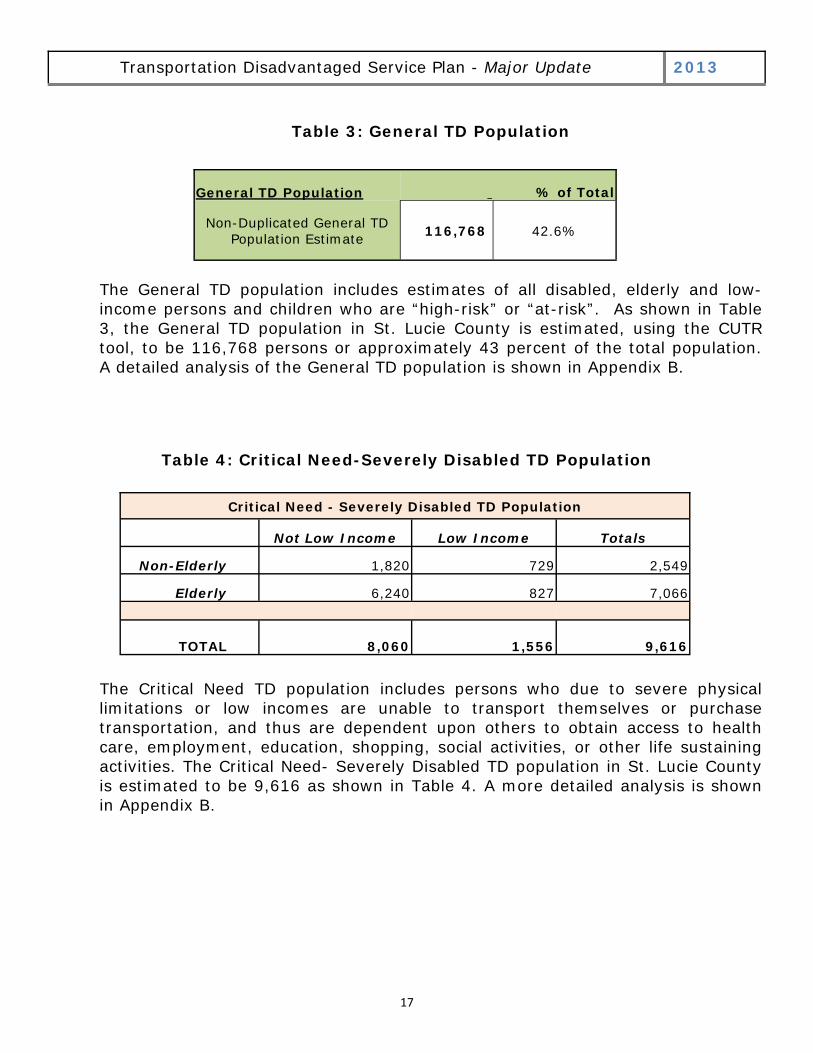
The General TD population includes estimates of all disabled, elderly and low-income persons and children who are “high-risk” or “at-risk”. As shown in Table 3, the General TD population in St. Lucie County is estimated, using the CUTR tool, to be 116,768 persons or approximately 43 percent of the total population. A detailed analysis of the General TD population is shown in Appendix B.
Table 4: Critical Need-Severely Disabled TD Population
The Critical Need TD population includes persons who due to severe physical limitations or low incomes are unable to transport themselves or purchase transportation, and thus are dependent upon others to obtain access to health care, employment, education, shopping, social activities, or other life sustaining activities. The Critical Need- Severely Disabled TD population in St. Lucie County is estimated to be 9,616 as shown in Table 4. A more detailed analysis is shown in Appendix B.
Transportation Disadvantaged Service Plan - Major Update 2013
General TD Population % of Total
Non-Duplicated General TD Population Estimate 116,768 42.6%
Critical Need - Severely Disabled TD Population
Not Low Income Low Income Totals
Non-Elderly 1,820 729 2,549
Elderly 6,240 827 7,066
TOTAL 8,060
1,556 9,616
18
Table 5: Daily Trips for the Critical Need TD Population
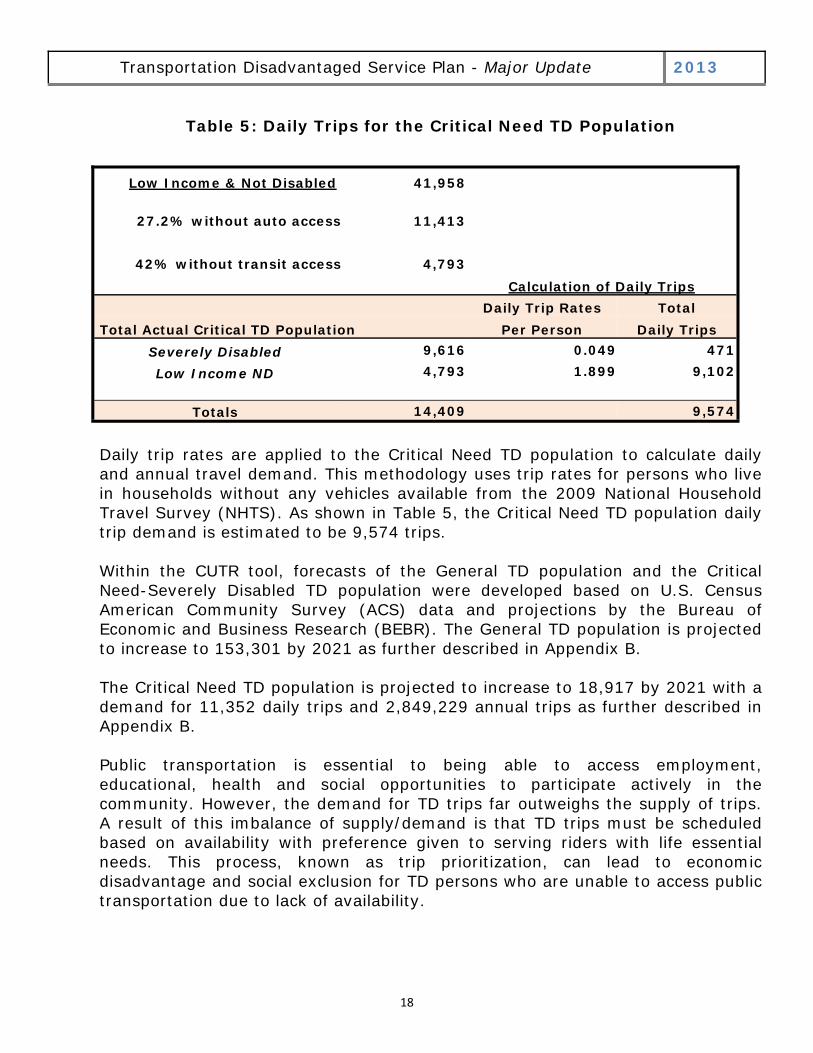
Daily trip rates are applied to the Critical Need TD population to calculate daily and annual travel demand. This methodology uses trip rates for persons who live in households without any vehicles available from the 2009 National Household Travel Survey (NHTS). As shown in Table 5, the Critical Need TD population daily trip demand is estimated to be 9,574 trips. Within the CUTR tool, forecasts of the General TD population and the Critical Need-Severely Disabled TD population were developed based on U.S. Census American Community Survey (ACS) data and projections by the Bureau of Economic and Business Research (BEBR). The General TD population is projected to increase to 153,301 by 2021 as further described in Appendix B. The Critical Need TD population is projected to increase to 18,917 by 2021 with a demand for 11,352 daily trips and 2,849,229 annual trips as further described in Appendix B. Public transportation is essential to being able to access employment, educational, health and social opportunities to participate actively in the community. However, the demand for TD trips far outweighs the supply of trips. A result of this imbalance of supply/demand is that TD trips must be scheduled based on availability with preference given to serving riders with life essential needs. This process, known as trip prioritization, can lead to economic disadvantage and social exclusion for TD persons who are unable to access public transportation due to lack of availability.
Transportation Disadvantaged Service Plan - Major Update 2013
Low Income & Not Disabled 41,958
27.2% without auto access 11,413
42% without transit access 4,793
Calculation of Daily Trips Daily Trip Rates Total Total Actual Critical TD Population Per Person Daily Trips
Severely Disabled 9,616 0.049 471
Low Income ND 4,793 1.899 9,102
Totals 14,409 9,574
19
Transportation Disadvantaged Service Plan - Major Update 2013
2. Needs Assessment
a. Transportation Coordination Network (TCN) Public Survey
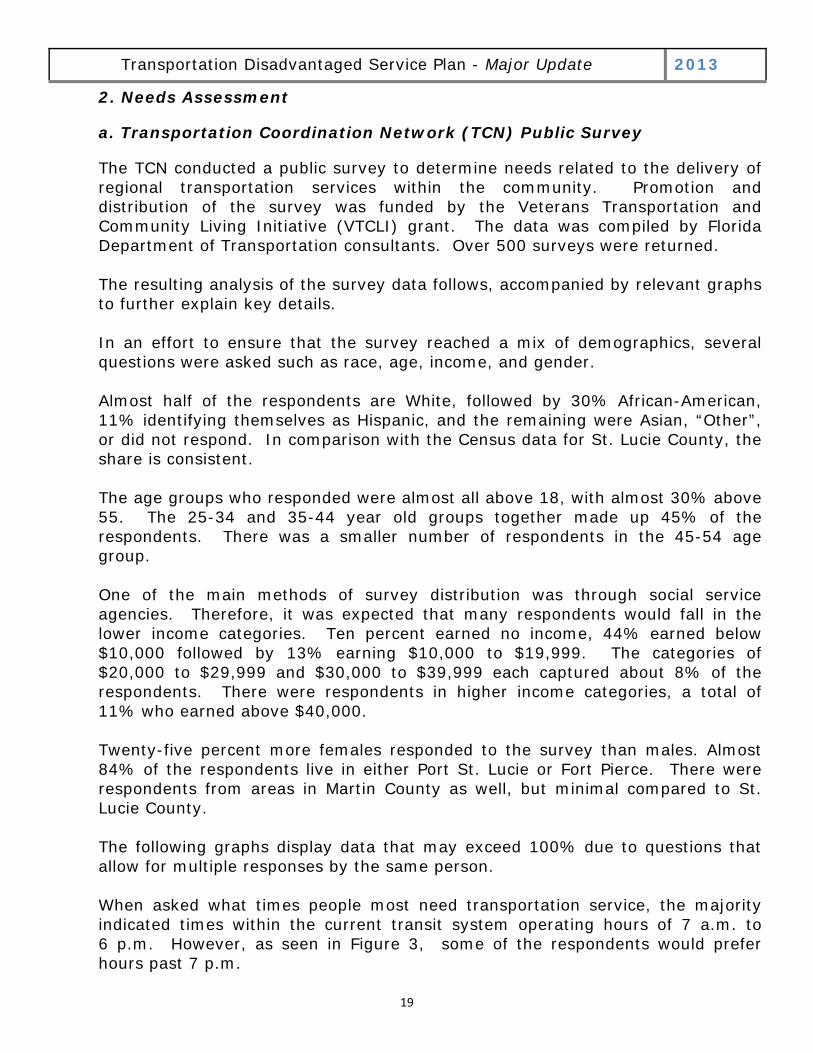
The TCN conducted a public survey to determine needs related to the delivery of regional transportation services within the community. Promotion and distribution of the survey was funded by the Veterans Transportation and Community Living Initiative (VTCLI) grant. The data was compiled by Florida Department of Transportation consultants. Over 500 surveys were returned. The resulting analysis of the survey data follows, accompanied by relevant graphs to further explain key details. In an effort to ensure that the survey reached a mix of demographics, several questions were asked such as race, age, income, and gender. Almost half of the respondents are White, followed by 30% African-American, 11% identifying themselves as Hispanic, and the remaining were Asian, “Other”, or did not respond. In comparison with the Census data for St. Lucie County, the share is consistent. The age groups who responded were almost all above 18, with almost 30% above 55. The 25-34 and 35-44 year old groups together made up 45% of the respondents. There was a smaller number of respondents in the 45-54 age group. One of the main methods of survey distribution was through social service agencies. Therefore, it was expected that many respondents would fall in the lower income categories. Ten percent earned no income, 44% earned below $10,000 followed by 13% earning $10,000 to $19,999. The categories of $20,000 to $29,999 and $30,000 to $39,999 each captured about 8% of the respondents. There were respondents in higher income categories, a total of 11% who earned above $40,000. Twenty-five percent more females responded to the survey than males. Almost 84% of the respondents live in either Port St. Lucie or Fort Pierce. There were respondents from areas in Martin County as well, but minimal compared to St. Lucie County. The following graphs display data that may exceed 100% due to questions that allow for multiple responses by the same person. When asked what times people most need transportation service, the majority indicated times within the current transit system operating hours of 7 a.m. to 6 p.m. However, as seen in Figure 3, some of the respondents would prefer hours past 7 p.m.
20
Transportation Disadvantaged Service Plan - Major Update 2013
Figure 3: Times Transportation Needed
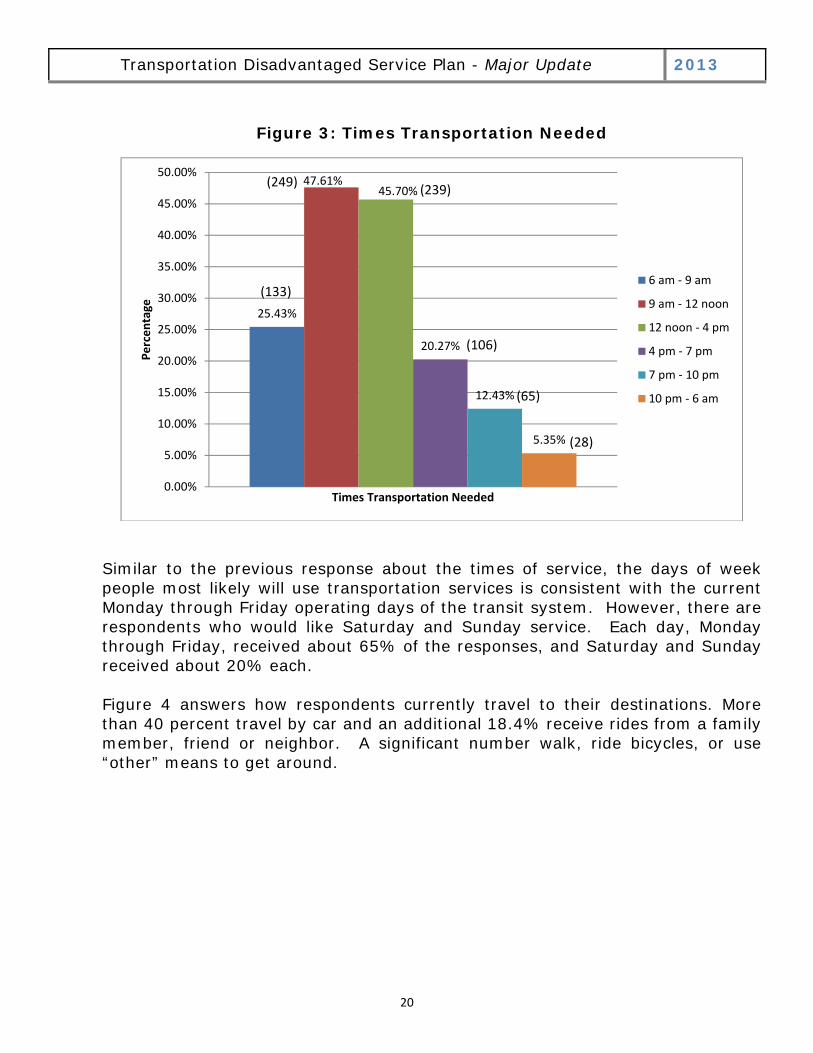
Similar to the previous response about the times of service, the days of week people most likely will use transportation services is consistent with the current Monday through Friday operating days of the transit system. However, there are respondents who would like Saturday and Sunday service. Each day, Monday through Friday, received about 65% of the responses, and Saturday and Sunday received about 20% each. Figure 4 answers how respondents currently travel to their destinations. More than 40 percent travel by car and an additional 18.4% receive rides from a family member, friend or neighbor. A significant number walk, ride bicycles, or use “other” means to get around.
25.43%
47.61%45.70%
20.27%
12.43%
5.35%
0.00%
5.00%
10.00%
15.00%
20.00%
25.00%
30.00%
35.00%
40.00%
45.00%
50.00%
Percentage
Times Transportation Needed
6 am ‐ 9 am
9 am ‐ 12 noon
12 noon ‐ 4 pm
4 pm ‐ 7 pm
7 pm ‐ 10 pm
10 pm ‐ 6 am
(133)
(249)(239)
(106)
(65)
(28)
21
Transportation Disadvantaged Service Plan - Major Update 2013
Figure 4: Current Mode to Destination
Figure 5: Trip Purpose
The main purpose of the trip varies, and many respondents chose “other” or left this question blank, as seen in Figure 5.
21.99%
7.46%
43.40%
4.59%
18.36%
3.06%
8.80%
2.87%
24.86%
0.96%
0.00%
5.00%
10.00%
15.00%
20.00%
25.00%
30.00%
35.00%
40.00%
45.00%
50.00%Percentage
Current Mode to Destination
Walk
Bicycle/Motorcycle
Car
Car pool/Van pool
Ride from Family, friends, or neighbors
Employer provided
Public Transportation
Community Transportation, such asChurch, Agency, etc.
Other
Use Medicaid transportation
(115)
(39)
(227)
(24)
(96)
(16)
(46)
(15)
(130)
(5)
0.19% 0.19%
13.19%
1.15%
6.12%
17.21%
1.15%
5.35%
2.68%
10.90%
0.57%
41.30%
0.00%
5.00%
10.00%
15.00%
20.00%
25.00%
30.00%
35.00%
40.00%
45.00%
Percentage
Trip Purpose
Bank
Childcare
Employment
Groceries/Hot Meal Site/Food Pantry
Medical Appointments
Other
Recreation
School
Shopping
Volunteer Job
Worship Services
(blank)
22
Transportation Disadvantaged Service Plan - Major Update 2013
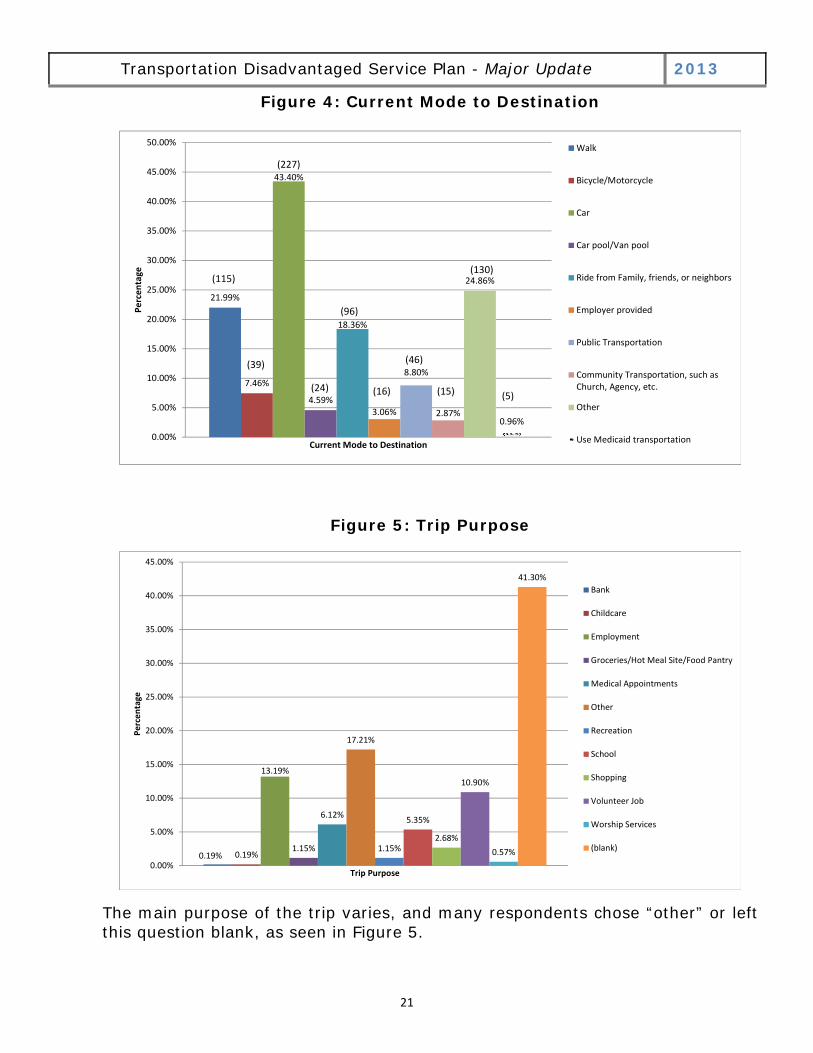
When asked if the respondent or any of their household members are unable to travel alone or purchase transportation due to a variety of situations, disability or health conditions was the main reason as shown in Figure 6. Other reasons chosen were financial (cannot afford a car or gas), and logistical (no license or not near a bus stop).
Figure 6: Unable to Travel Reason
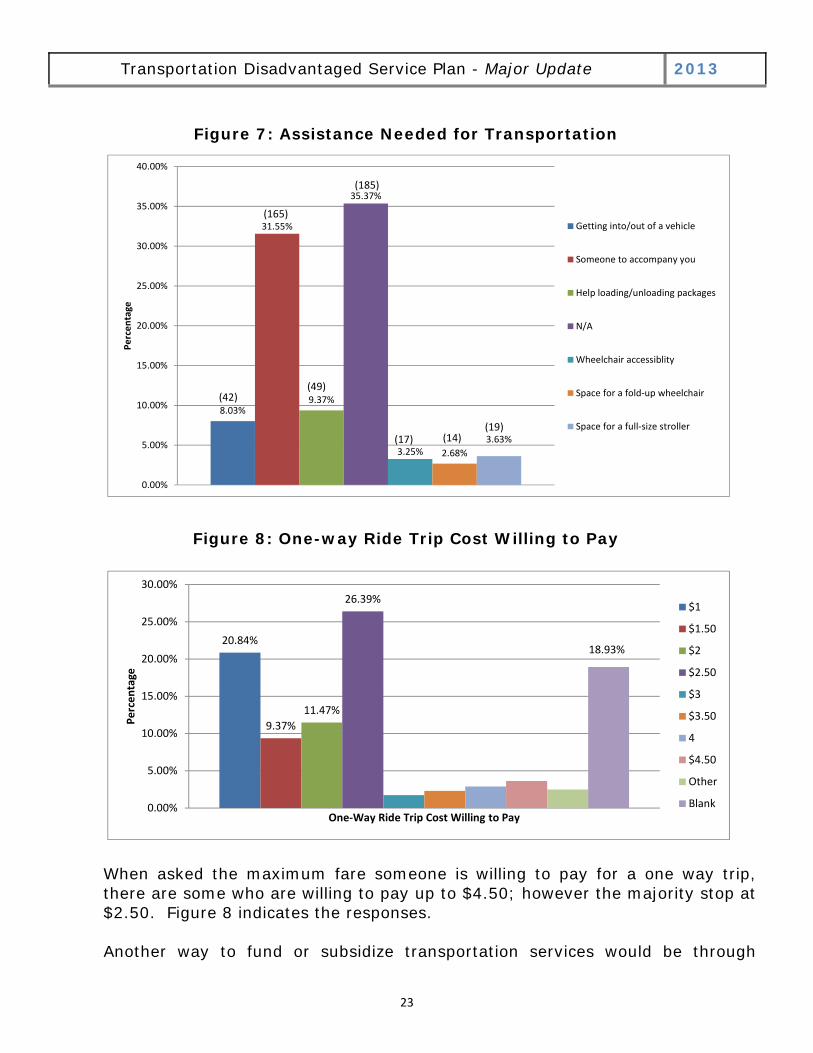
Often people need assistance when they travel. Figure 7 shows that a travel companion is the most needed type of assistance, followed by assistance with carrying packages (groceries). Respondents noted that walkers, followed by canes, and then wheelchairs are the top three mobility aids used. The majority of the respondents did not use any aids.
39.96%
12.81%
10.90%
5.35%
9.75% 9.56%
13.19%
4.21%
19.89%
0.00%
5.00%
10.00%
15.00%
20.00%
25.00%
30.00%
35.00%
40.00%
45.00%
1
Percentage
Unable to Travel Reason
Disability / Health condition
Can't afford gas
Cannot afford a car
No vehicle that works
Do not have a license
No bus stop nearby
Does Not Apply
Other
Blank
(28)
(51) (50)
(69)
(22)
(104)
(209)
(67)
(57)
23
Transportation Disadvantaged Service Plan - Major Update 2013
Figure 7: Assistance Needed for Transportation
Figure 8: One-way Ride Trip Cost Willing to Pay
When asked the maximum fare someone is willing to pay for a one way trip, there are some who are willing to pay up to $4.50; however the majority stop at $2.50. Figure 8 indicates the responses. Another way to fund or subsidize transportation services would be through
8.03%
31.55%
9.37%
35.37%
3.25% 2.68%
3.63%
0.00%
5.00%
10.00%
15.00%
20.00%
25.00%
30.00%
35.00%
40.00%
Percentage
Getting into/out of a vehicle
Someone to accompany you
Help loading/unloading packages
N/A
Wheelchair accessiblity
Space for a fold‐up wheelchair
Space for a full‐size stroller
(42)
(165)
(49)
(185)
(17) (14)(19)
20.84%
9.37%
11.47%
26.39%
18.93%
0.00%
5.00%
10.00%
15.00%
20.00%
25.00%
30.00%
Percentage
One‐Way Ride Trip Cost Willing to Pay
$1
$1.50
$2
$2.50
$3
$3.50
4
$4.50
Other
Blank
24
Transportation Disadvantaged Service Plan - Major Update 2013
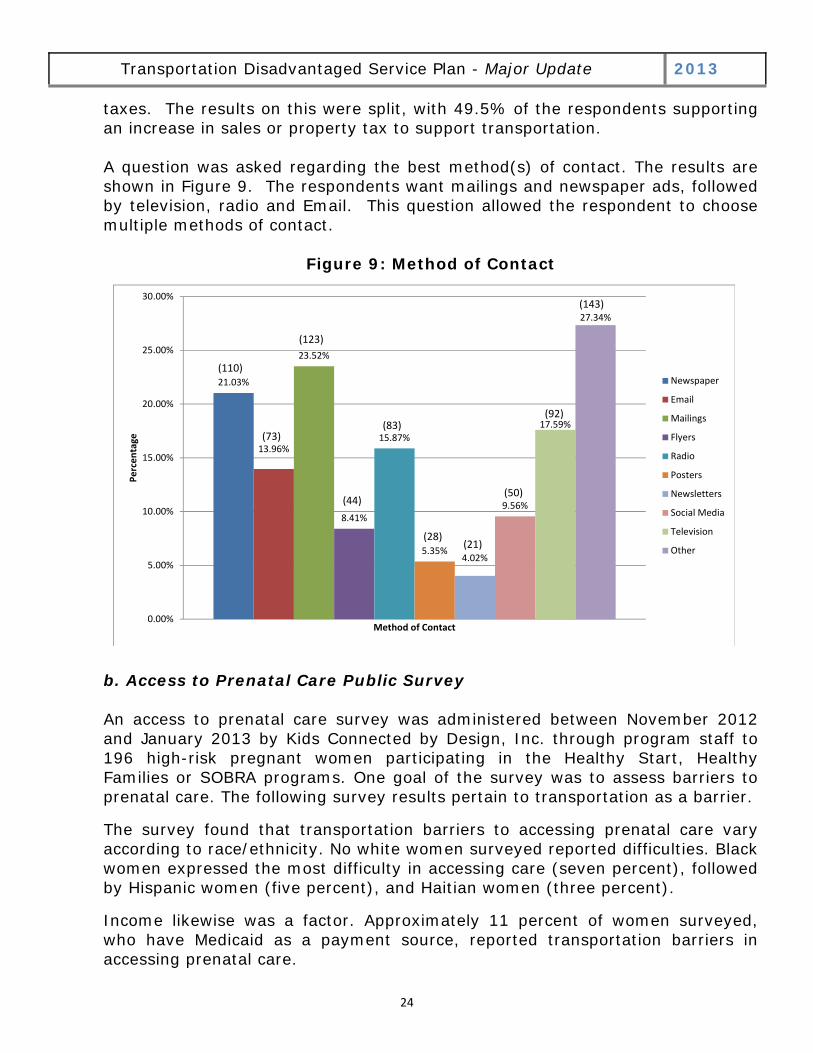
taxes. The results on this were split, with 49.5% of the respondents supporting an increase in sales or property tax to support transportation. A question was asked regarding the best method(s) of contact. The results are shown in Figure 9. The respondents want mailings and newspaper ads, followed by television, radio and Email. This question allowed the respondent to choose multiple methods of contact.
Figure 9: Method of Contact
b. Access to Prenatal Care Public Survey
An access to prenatal care survey was administered between November 2012 and January 2013 by Kids Connected by Design, Inc. through program staff to 196 high-risk pregnant women participating in the Healthy Start, Healthy Families or SOBRA programs. One goal of the survey was to assess barriers to prenatal care. The following survey results pertain to transportation as a barrier.
The survey found that transportation barriers to accessing prenatal care vary according to race/ethnicity. No white women surveyed reported difficulties. Black women expressed the most difficulty in accessing care (seven percent), followed by Hispanic women (five percent), and Haitian women (three percent).
Income likewise was a factor. Approximately 11 percent of women surveyed, who have Medicaid as a payment source, reported transportation barriers in accessing prenatal care.
21.03%
13.96%
23.52%
8.41%
15.87%
5.35%4.02%
9.56%
17.59%
27.34%
0.00%
5.00%
10.00%
15.00%
20.00%
25.00%
30.00%
Percentage
Method of Contact
Newspaper
Mailings
Flyers
Radio
Posters
Newsletters
Social Media
Television
Other
(110)
(73)
(123)
(44)
(83)
(28)(21)
(50)
(92)
(143)
25
Transportation Disadvantaged Service Plan - Major Update 2013
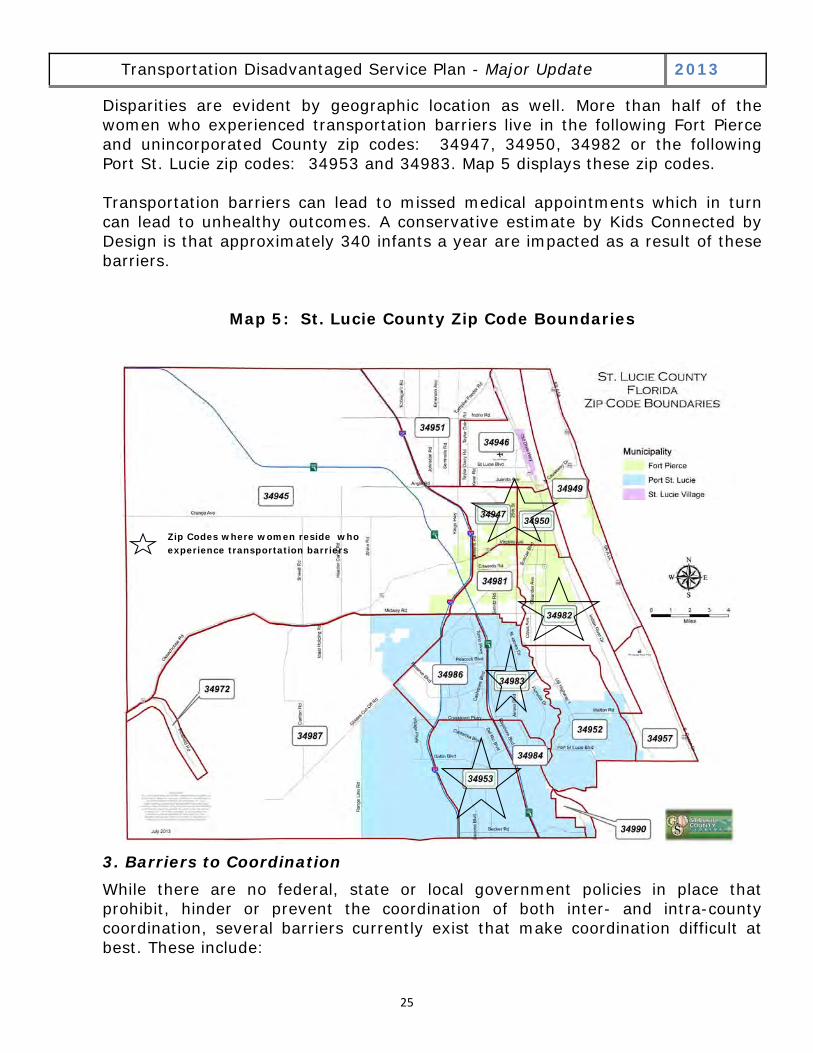
Disparities are evident by geographic location as well. More than half of the women who experienced transportation barriers live in the following Fort Pierce and unincorporated County zip codes: 34947, 34950, 34982 or the following Port St. Lucie zip codes: 34953 and 34983. Map 5 displays these zip codes. Transportation barriers can lead to missed medical appointments which in turn can lead to unhealthy outcomes. A conservative estimate by Kids Connected by Design is that approximately 340 infants a year are impacted as a result of these barriers.
Map 5: St. Lucie County Zip Code Boundaries
3. Barriers to Coordination While there are no federal, state or local government policies in place that prohibit, hinder or prevent the coordination of both inter- and intra-county coordination, several barriers currently exist that make coordination difficult at best. These include:
Zip Codes where women reside who experience transportation barriers
26
Transportation Disadvantaged Service Plan - Major Update 2013
Funding for transportation services has remained relatively constant over the past several years and has not kept up with the ever increasing travel demands. The result is that CTCs are struggling to maintain their existing service levels and do not have the financial resources to pursue and/or expand inter-county service.
The recent downturn in Florida and St. Lucie County economies due to the collapse of real estate values has resulted in budget cutbacks at the local government level. This has resulted in local financial pressure on TD services, including opportunities to promote coordination.
Local, nonprofit and social services agencies also have been adversely impacted by the downturn of the economy and now face increased demand for their services as their funding sources are being reduced. This has resulted in increased demand for transportation disadvantaged travel that cannot be met.
Many St. Lucie County TD clients desire to travel outside the county boundaries. Whereas the Treasure Coast Connector Route #1 provides service into Martin County terminating at the Treasure Coast Square Mall in Jensen Beach, there are no Community Transit transportation disadvantaged services outside St. Lucie County.
Often the lack of adequate pedestrian access to and from bus stops limits the ability of TD passengers to safely access the fixed route transit services.
The elimination of barriers to enhanced integration of the paratransit and fixed-route systems is intended to be addressed through the TD program and other initiatives.
D. Mission Statement, Goals, Objectives and Strategies
The TDSP Mission Statement, Goals, Objectives, and Strategies shown in Appendix C were reviewed in light of several factors that have led to declines in funding for public transportation in St. Lucie County over the past several years. A major factor has been the decline in property values in the County, which has negatively impacted revenue generated from the County’s Municipal Services Taxing Unit (MSTU), a dedicated transit funding source.
E. Implementation Schedule St. Lucie County’s implementation plan, as detailed in Tables 6 and 7, builds upon the County’s program of providing services with modern, clean, and efficient vehicles and equipment by utilizing ongoing upgrades and replacements within available funding capacity. Specific capital projects and activities are listed in the implementation schedule.
27
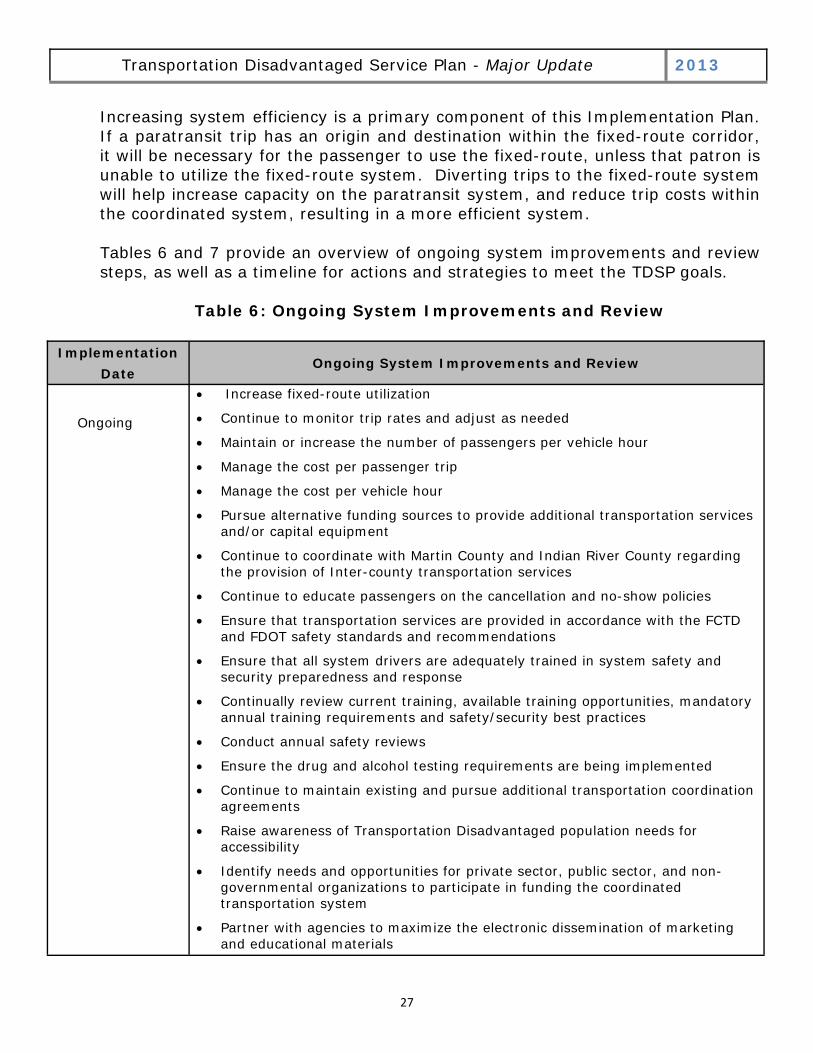
Increasing system efficiency is a primary component of this Implementation Plan. If a paratransit trip has an origin and destination within the fixed-route corridor, it will be necessary for the passenger to use the fixed-route, unless that patron is unable to utilize the fixed-route system. Diverting trips to the fixed-route system will help increase capacity on the paratransit system, and reduce trip costs within the coordinated system, resulting in a more efficient system. Tables 6 and 7 provide an overview of ongoing system improvements and review steps, as well as a timeline for actions and strategies to meet the TDSP goals.
Table 6: Ongoing System Improvements and Review
Transportation Disadvantaged Service Plan - Major Update 2013
Implementation Date
Ongoing System Improvements and Review
Ongoing
Increase fixed-route utilization
Continue to monitor trip rates and adjust as needed
Maintain or increase the number of passengers per vehicle hour
Manage the cost per passenger trip
Manage the cost per vehicle hour
Pursue alternative funding sources to provide additional transportation services and/or capital equipment
Continue to coordinate with Martin County and Indian River County regarding the provision of Inter-county transportation services
Continue to educate passengers on the cancellation and no-show policies
Ensure that transportation services are provided in accordance with the FCTD and FDOT safety standards and recommendations
Ensure that all system drivers are adequately trained in system safety and security preparedness and response
Continually review current training, available training opportunities, mandatory annual training requirements and safety/security best practices
Conduct annual safety reviews
Ensure the drug and alcohol testing requirements are being implemented
Continue to maintain existing and pursue additional transportation coordination agreements
Raise awareness of Transportation Disadvantaged population needs for accessibility
Identify needs and opportunities for private sector, public sector, and non-governmental organizations to participate in funding the coordinated transportation system
Partner with agencies to maximize the electronic dissemination of marketing and educational materials
28
Transportation Disadvantaged Service Plan - Major Update 2013
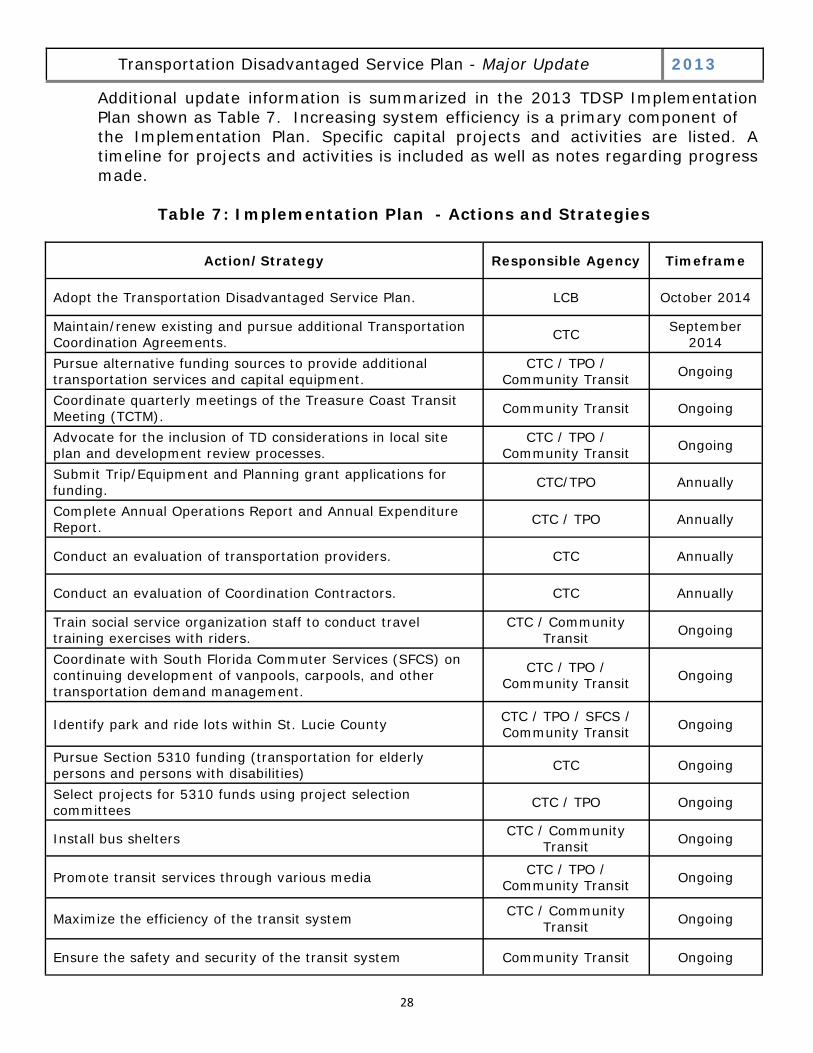
Additional update information is summarized in the 2013 TDSP Implementation Plan shown as Table 7. Increasing system efficiency is a primary component of the Implementation Plan. Specific capital projects and activities are listed. A timeline for projects and activities is included as well as notes regarding progress made.
Table 7: Implementation Plan - Actions and Strategies
Action/Strategy Responsible Agency Timeframe
Adopt the Transportation Disadvantaged Service Plan. LCB October 2014
Maintain/renew existing and pursue additional Transportation Coordination Agreements. CTC September
2014 Pursue alternative funding sources to provide additional transportation services and capital equipment.
CTC / TPO / Community Transit Ongoing
Coordinate quarterly meetings of the Treasure Coast Transit Meeting (TCTM). Community Transit Ongoing
Advocate for the inclusion of TD considerations in local site plan and development review processes.
CTC / TPO / Community Transit Ongoing
Submit Trip/Equipment and Planning grant applications for funding. CTC/TPO Annually
Complete Annual Operations Report and Annual Expenditure Report. CTC / TPO Annually
Conduct an evaluation of transportation providers. CTC Annually
Conduct an evaluation of Coordination Contractors. CTC Annually
Train social service organization staff to conduct travel training exercises with riders.
CTC / Community Transit Ongoing
Coordinate with South Florida Commuter Services (SFCS) on continuing development of vanpools, carpools, and other transportation demand management.
CTC / TPO / Community Transit Ongoing
Identify park and ride lots within St. Lucie County CTC / TPO / SFCS / Community Transit Ongoing
Pursue Section 5310 funding (transportation for elderly persons and persons with disabilities) CTC Ongoing
Select projects for 5310 funds using project selection committees CTC / TPO Ongoing
Install bus shelters CTC / Community Transit Ongoing
Promote transit services through various media CTC / TPO / Community Transit Ongoing
Maximize the efficiency of the transit system CTC / Community
Transit Ongoing
Ensure the safety and security of the transit system Community Transit Ongoing
29
Transportation Disadvantaged Service Plan - Major Update 2013
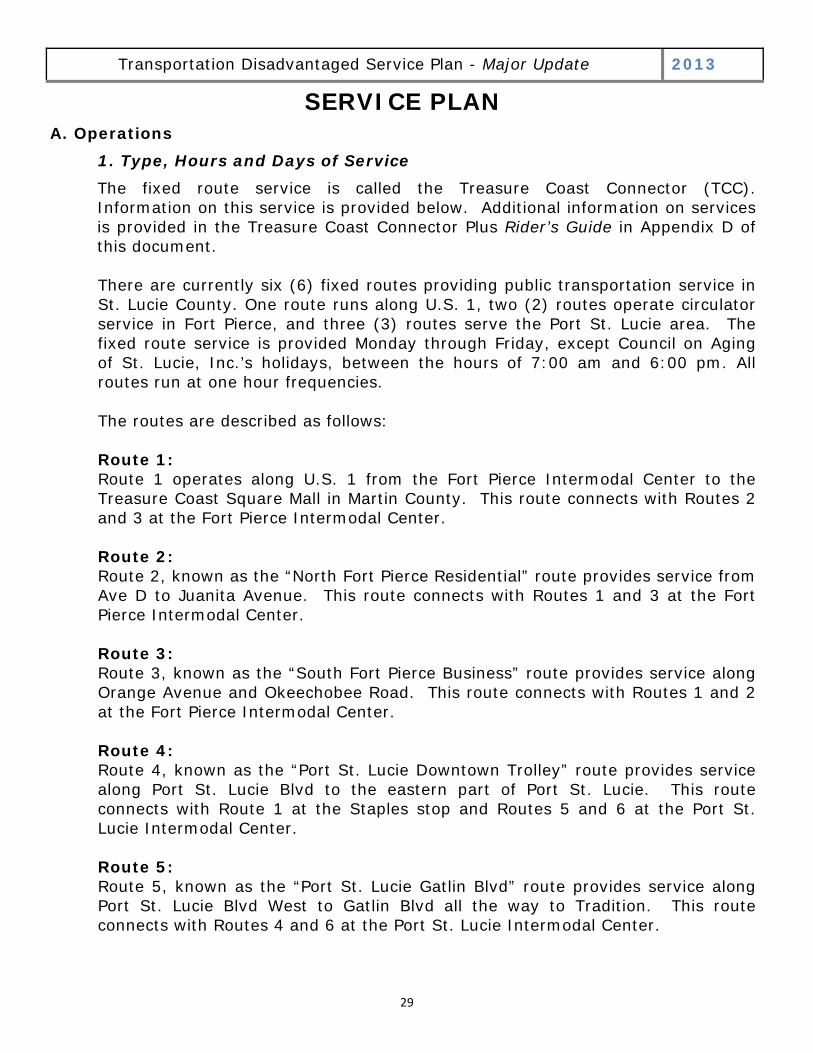
SERVICE PLAN A. Operations 1. Type, Hours and Days of Service
The fixed route service is called the Treasure Coast Connector (TCC). Information on this service is provided below. Additional information on services is provided in the Treasure Coast Connector Plus Rider’s Guide in Appendix D of this document. There are currently six (6) fixed routes providing public transportation service in St. Lucie County. One route runs along U.S. 1, two (2) routes operate circulator service in Fort Pierce, and three (3) routes serve the Port St. Lucie area. The fixed route service is provided Monday through Friday, except Council on Aging of St. Lucie, Inc.’s holidays, between the hours of 7:00 am and 6:00 pm. All routes run at one hour frequencies.
The routes are described as follows:
Route 1: Route 1 operates along U.S. 1 from the Fort Pierce Intermodal Center to the Treasure Coast Square Mall in Martin County. This route connects with Routes 2 and 3 at the Fort Pierce Intermodal Center. Route 2: Route 2, known as the “North Fort Pierce Residential” route provides service from Ave D to Juanita Avenue. This route connects with Routes 1 and 3 at the Fort Pierce Intermodal Center. Route 3: Route 3, known as the “South Fort Pierce Business” route provides service along Orange Avenue and Okeechobee Road. This route connects with Routes 1 and 2 at the Fort Pierce Intermodal Center. Route 4: Route 4, known as the “Port St. Lucie Downtown Trolley” route provides service along Port St. Lucie Blvd to the eastern part of Port St. Lucie. This route connects with Route 1 at the Staples stop and Routes 5 and 6 at the Port St. Lucie Intermodal Center. Route 5: Route 5, known as the “Port St. Lucie Gatlin Blvd” route provides service along Port St. Lucie Blvd West to Gatlin Blvd all the way to Tradition. This route connects with Routes 4 and 6 at the Port St. Lucie Intermodal Center.
30
Transportation Disadvantaged Service Plan - Major Update 2013
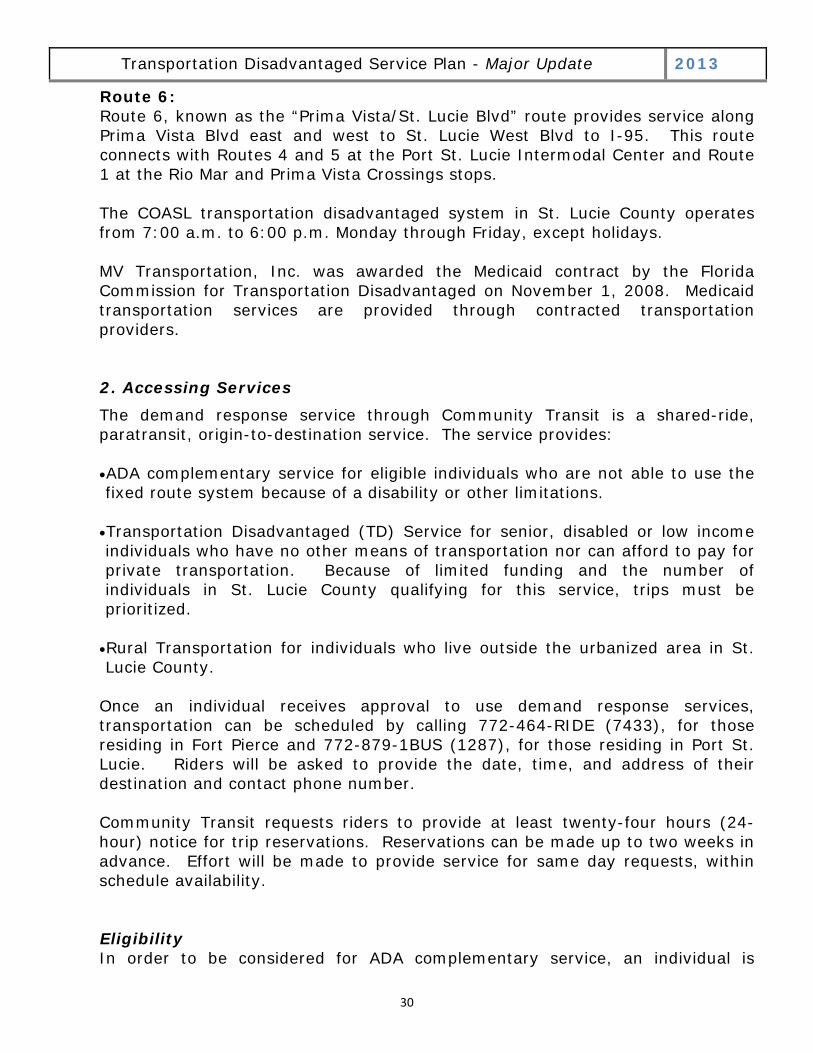
Route 6: Route 6, known as the “Prima Vista/St. Lucie Blvd” route provides service along Prima Vista Blvd east and west to St. Lucie West Blvd to I-95. This route connects with Routes 4 and 5 at the Port St. Lucie Intermodal Center and Route 1 at the Rio Mar and Prima Vista Crossings stops. The COASL transportation disadvantaged system in St. Lucie County operates from 7:00 a.m. to 6:00 p.m. Monday through Friday, except holidays. MV Transportation, Inc. was awarded the Medicaid contract by the Florida Commission for Transportation Disadvantaged on November 1, 2008. Medicaid transportation services are provided through contracted transportation providers.
2. Accessing Services The demand response service through Community Transit is a shared-ride, paratransit, origin-to-destination service. The service provides: ADA complementary service for eligible individuals who are not able to use the fixed route system because of a disability or other limitations.
Transportation Disadvantaged (TD) Service for senior, disabled or low income individuals who have no other means of transportation nor can afford to pay for private transportation. Because of limited funding and the number of individuals in St. Lucie County qualifying for this service, trips must be prioritized.
Rural Transportation for individuals who live outside the urbanized area in St. Lucie County.
Once an individual receives approval to use demand response services, transportation can be scheduled by calling 772-464-RIDE (7433), for those residing in Fort Pierce and 772-879-1BUS (1287), for those residing in Port St. Lucie. Riders will be asked to provide the date, time, and address of their destination and contact phone number. Community Transit requests riders to provide at least twenty-four hours (24-hour) notice for trip reservations. Reservations can be made up to two weeks in advance. Effort will be made to provide service for same day requests, within schedule availability.
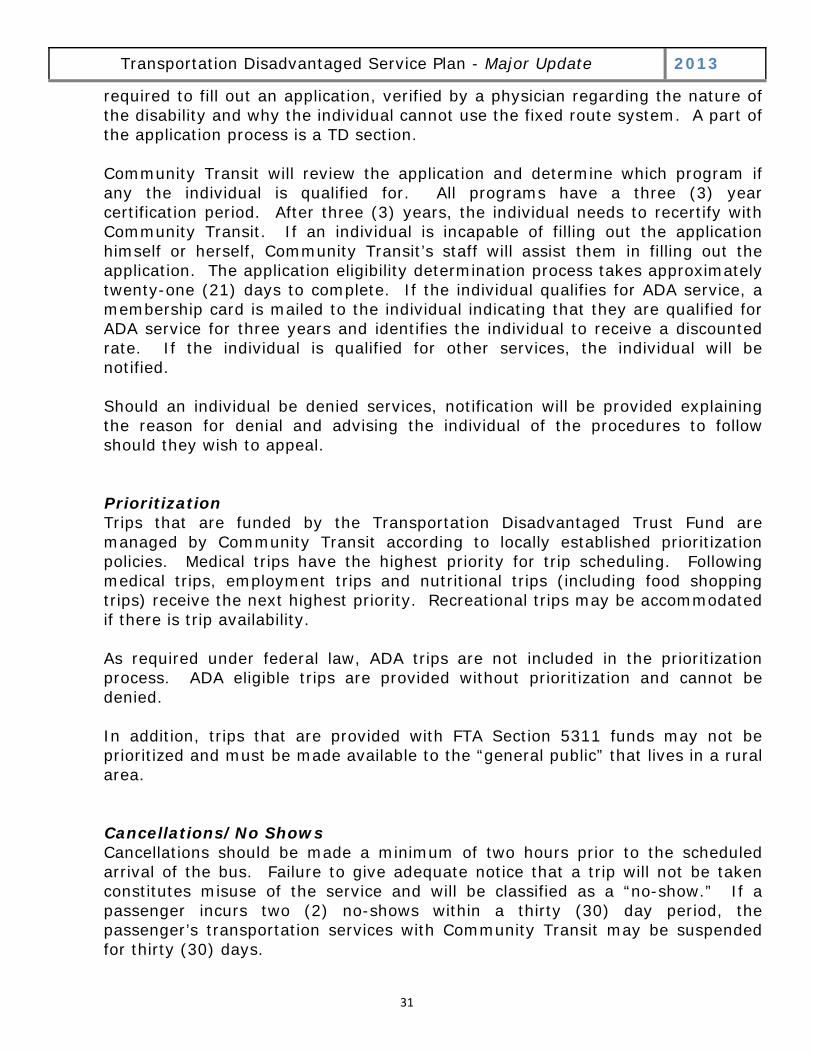
Eligibility In order to be considered for ADA complementary service, an individual is
31
Transportation Disadvantaged Service Plan - Major Update 2013
required to fill out an application, verified by a physician regarding the nature of the disability and why the individual cannot use the fixed route system. A part of the application process is a TD section. Community Transit will review the application and determine which program if any the individual is qualified for. All programs have a three (3) year certification period. After three (3) years, the individual needs to recertify with Community Transit. If an individual is incapable of filling out the application himself or herself, Community Transit’s staff will assist them in filling out the application. The application eligibility determination process takes approximately twenty-one (21) days to complete. If the individual qualifies for ADA service, a membership card is mailed to the individual indicating that they are qualified for ADA service for three years and identifies the individual to receive a discounted rate. If the individual is qualified for other services, the individual will be notified. Should an individual be denied services, notification will be provided explaining the reason for denial and advising the individual of the procedures to follow should they wish to appeal. Prioritization Trips that are funded by the Transportation Disadvantaged Trust Fund are managed by Community Transit according to locally established prioritization policies. Medical trips have the highest priority for trip scheduling. Following medical trips, employment trips and nutritional trips (including food shopping trips) receive the next highest priority. Recreational trips may be accommodated if there is trip availability. As required under federal law, ADA trips are not included in the prioritization process. ADA eligible trips are provided without prioritization and cannot be denied. In addition, trips that are provided with FTA Section 5311 funds may not be prioritized and must be made available to the “general public” that lives in a rural area. Cancellations/No Shows Cancellations should be made a minimum of two hours prior to the scheduled arrival of the bus. Failure to give adequate notice that a trip will not be taken constitutes misuse of the service and will be classified as a “no-show.” If a passenger incurs two (2) no-shows within a thirty (30) day period, the passenger’s transportation services with Community Transit may be suspended for thirty (30) days.
32
Transportation Disadvantaged Service Plan - Major Update 2013
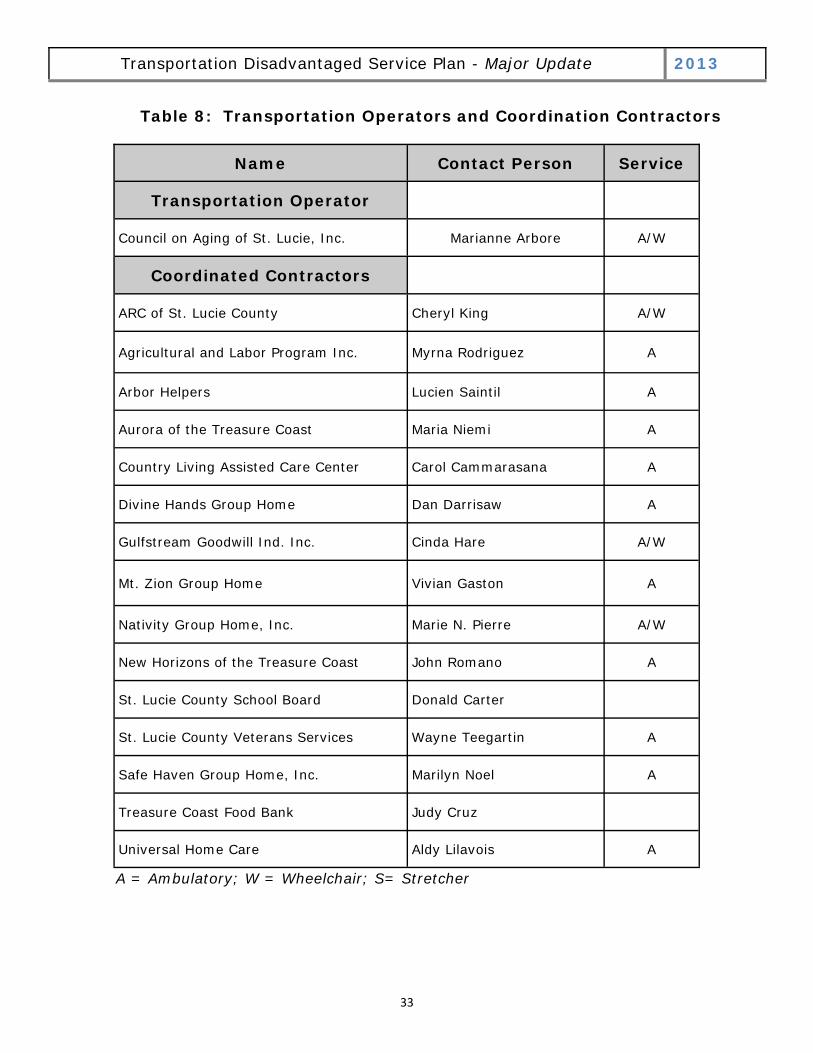
3. Transportation Operators and Coordination Contractors St. Lucie County has an agreement with one transportation operator that provides public transportation services for the fixed route and demand response services. Every five years, the County publishes a Request for Qualifications to identify and select the public transportation provider. St. Lucie County has established coordinated contractual service agreements with specialized transportation providers that offer transportation services to their individual clientele. Table 8 Shows the Transportation Operator and Coordinated Contractors in St. Lucie County.
4. Public Transit Utilization
Public transit utilization is an integral part of the overall CTC network. TD clients, who can utilize the fixed route and whose origin and destination are within the fixed route service area are required to use the fixed-route as their primary mode of transportation.
5. School Bus Utilization The County School Board buses are utilized on a limited basis under the coordination system. Services provide trips for summer camp activities and disaster emergency evacuations.
6. Vehicle Inventory Appendix E contains the fleet inventory.
7. System Safety Program Plan Certification Appendix F contains the System Safety Program Plan certification of Community Transit.
33
Transportation Disadvantaged Service Plan - Major Update 2013
Name Contact Person Service
Transportation Operator
Council on Aging of St. Lucie, Inc. Marianne Arbore A/W
Coordinated Contractors
ARC of St. Lucie County Cheryl King A/W
Agricultural and Labor Program Inc. Myrna Rodriguez A
Arbor Helpers Lucien Saintil A
Aurora of the Treasure Coast Maria Niemi A
Country Living Assisted Care Center Carol Cammarasana A
Divine Hands Group Home Dan Darrisaw A
Gulfstream Goodwill Ind. Inc. Cinda Hare A/W
Mt. Zion Group Home Vivian Gaston A
Nativity Group Home, Inc. Marie N. Pierre A/W
New Horizons of the Treasure Coast John Romano A
St. Lucie County School Board Donald Carter
St. Lucie County Veterans Services Wayne Teegartin A
Safe Haven Group Home, Inc. Marilyn Noel A
Treasure Coast Food Bank Judy Cruz
Universal Home Care Aldy Lilavois A
Table 8: Transportation Operators and Coordination Contractors
A = Ambulatory; W = Wheelchair; S= Stretcher
34
Transportation Disadvantaged Service Plan - Major Update 2013
8. Inter-County Services
St. Lucie County shares an urbanized boundary with Martin County. Federal Transit Administration funding allocations are shared between the counties. Fixed route services are offered by COASL on the U.S. 1 corridor into Martin County, terminating services at the Treasure Coast Mall in Jensen Beach.
9. Emergency Preparedness and Response The CTC participates with the St. Lucie County Public Safety, Division of Emergency Management for natural disaster/emergency preparedness, response and recovery. In addition, the County has developed the “St. Lucie Medical Needs Shelter Plan” that specifically delineates the roles and responsibilities of various County departments in the evacuation and sheltering of special needs residents. Community Transit, working with the County, assists in the provision of transport of special needs residents to shelter locations.
10. Educational Efforts/Marketing The St. Lucie County CTC attends both formal and informal meetings with sponsoring social service agencies, community associations, advocacy groups and others in order to educate potential users and sponsoring agencies. There are brochures/rider guides describing the available transportation services. These materials are distributed to social service agencies, doctors’ offices, and riders. 11. Acceptable Alternatives Acceptable alternatives have been established by the CTC to address existing transportation barriers, through continuing coordination agreements with specialized transportation providers. These additional providers assist in a reduction of duplication of transportation services. In addition, the Florida Department of Transportation is establishing a regulated taxi-service certification process that will provide price-structured options for those with transportation challenges via local private taxi operators. 12. Service Standards In order to assess the quality assurance of the delivery of transportation services, it is necessary to have service standards and policies established. The FCTD has several requirements of its transportation providers. The requirements are the basis for the following standards and policies, which are used in the annual review of the Community Transportation Coordinator by the FCTD and reviewed by the LCB.
35
Transportation Disadvantaged Service Plan - Major Update 2013
Drug and Alcohol Testing The St. Lucie County CTC complies with applicable Federal Transit Administration requirements for all those in safety-sensitive positions. In addition, the CTC maintains a Drug Free Workplace policy. Escorts and Children Children under age 12 or individuals requiring special assistance must have an escort/personal care attendant (PCA). The escort/PCA must be an adult and must be able to provide necessary assistance to the passenger. Child Restraints All passengers under the age of five (5) and/or under 45 pounds must be secured in a child restraint device. If the assigned vehicle does not have a child restraint device, a device must be provided by the passenger’s family or sponsoring agency. Passenger Property Passengers are responsible for all personal property. Only property that can be carried by the passenger in one boarding and safely stowed on the vehicle is allowed. Transfer Points Vehicle transfer points will be located in a safe, secure place. Local Toll Free Phone Number/Consumer Comment The local number for compliments, comments or complaints in Fort Pierce is 772-464-RIDE (7433). In Port St. Lucie the number is 772-879-1BUS (1287). This number is posted on the bus with numbers three inches high. If complaints cannot be resolved locally, individuals do have the option to contact either the CTC office at 772-462-1777 or the statewide Transportation Disadvantaged Ombudsman Hotline at 1-800-983-2435. Out of Service Area Trips Community Transit does not arrange for out of service area trips. Vehicle Cleanliness The interior of all vehicles shall be free from dirt, grime, oil, trash, torn upholstery, damaged or broken seats, protruding metal or other objects or materials that could soil items placed in the vehicle or provide discomfort for the passenger. All vehicles shall be cleaned (interior and exterior) on a regular schedule. Billing All payments to transportation contractors will be made in a timely manner.
36
Passenger/Trip Data For demand response services, the CTC management entity will collect and store in a database the name, phone number, address, funding source, eligibility, and special requirements of each passenger. Seating Vehicle seating will not exceed the manufacturer’s recommended capacity. Driver Identification Drivers are required to wear identification badges. Drivers are also required to wear uniforms. Drivers are required to announce and identify themselves by name and company in a manner that is conducive to communications with specific passengers, except in situations where the driver regularly transports the rider on a recurring basis. Passenger Loading Assistance For demand response services, drivers will assist passengers to and from the ground floor and door-to-door when requested. Drivers will assist all passengers needing assistance from the threshold of their homes to a securely seated position on the vehicle. Drivers will offer their assistance to any passenger who appears to need assistance or who requests assistance with boarding or alighting from the vehicle. Smoking, Drinking and Eating Smoking, eating or drinking on board the vehicle is prohibited. Exceptions are permitted when required due to an existing medical condition. Passenger No-Shows All scheduled trips (reservations) must be cancelled at least two hours prior to the scheduled arrival of the bus. Failure to give adequate notice that a trip will not be taken constitutes misuse of the service and will be classified as a “no-show.” If a passenger incurs two (2) no-shows within a thirty (30) day period, the passenger’s transportation services with Community Transit will be suspended for thirty (30) days.
Communication Equipment All vehicles will be equipped with two-way communication devices. Vehicle Air Conditioning and Heating Equipment All vehicles in the coordinated system must have working air conditioning and heating. Should a vehicle incur a problem, it will be repaired as soon as possible. If a vehicle’s air conditioning or heating is not functioning properly and, if there are no other vehicles available, the passengers will be transported, rather than canceling a trip. Passengers with health conditions affected by air conditioning or lack thereof will be notified if their vehicle’s air conditioning is not working, and
Transportation Disadvantaged Service Plan - Major Update 2013
37
Transportation Disadvantaged Service Plan - Major Update 2013
the passenger will be given an opportunity to decide whether or not to take the trip. First Aid Policy Each Community Transit paratransit vehicle is equipped with a first aid kit. Community Transit drivers are instructed to request 9-1-1 assistance through their dispatcher for any significant passenger incident. Cardiopulmonary Resuscitation Drivers are instructed to request 9-1-1 assistance through their dispatcher for any significant passenger incident. Pick-Up Window The pick-up window is 60 minutes prior to the scheduled appointment time. On-Time Performance The locally developed standard for on-time performance is that 90% of all completed trips will be completed on-time. Advance Reservations There will be a minimum 24-hour notice requirement to schedule trips. Same day trip requests cannot be guaranteed; however, Community Transit will attempt to accommodate the request. Public Transit Ridership As part of the CTC Evaluation, the LCB is required to establish an annual percentage goal increase for the number of trips provided within the public transit system. Complaints The complaint procedure is outlined in the Local Complaint and Grievance Procedures/Process section. Accidents The locally developed standard for accidents is no more than 1.5 accidents per 100,000 miles. Roadcalls The locally developed standard for roadcalls is there should be no less than 10,000 miles between each roadcall. Call-Hold The locally developed standard for answering telephone calls is that all calls should be answered within three rings.
38
Transportation Disadvantaged Service Plan - Major Update 2013
Driver Background Checks All drivers in the coordinated system must have a pre-employment background check through the Florida Department of Law Enforcement (FDLE). Only those drivers with a “favorable” background check from the FDLE (“favorable” as defined by the Department of Children and Families policies and procedures) are hired. Driver Training All operators, supervisors and safety-sensitive positions shall receive drug and alcohol safety training. Additional training shall consist of driver safety, passenger relations, wheelchair securement, fire safety and other topics, as deemed necessary. At a minimum, passenger relations and driver safety training shall be conducted annually. Oxygen Transport Passengers may travel with portable oxygen equipment provided that it can be managed by the passenger, is self-administered, and is small enough that it can be safely stowed when the vehicle is in route. Service Animals Service animals are allowed on-board when accompanying individuals with disabilities. 13. Local Complaint and Grievance Procedures / Process The locally developed standard for complaints is no more than one complaint per 1,000 trips. The LCB annually evaluates the CTC based upon the number of complaints. The local number for compliments, comments or complaints in Fort Pierce is 772-464-RIDE (7433). In Port St. Lucie the number is 772-879-1BUS (1287). This number is posted on all vehicles with numbers three inches high. If complaints cannot be resolved locally, individuals do have the option to contact either the CTC office at 772-462-1777 or the statewide Transportation Disadvantaged Ombudsman Hotline. The number for the Ombudsman is 1-800-983-2435. The St. Lucie County Local Coordinating Board has adopted a grievance procedure. A copy of the Grievance Procedures is provided in Appendix G There has also been a formal grievance process developed by the Florida Commission for Transportation Disadvantaged. This grievance process may be used if all local options have been attempted without resolution. The Commission’s grievance procedures are available at www.dot.state.fl.us/ctd/.
39
Transportation Disadvantaged Service Plan - Major Update 2013
14. Community Transportation Coordinator Monitoring Procedures of Operators and Coordination Contractors The CTC completes annual coordination contractor onsite monitoring, including inspection of operations and insurance documentation to ensure compliance with the FCTD System Safety Program Plan and FDOT standards. The CTC notifies the contractors with recommendations and/or findings. 15. Coordination Contract Evaluation Criteria The CTC requests quarterly operating reports from the coordination contractors to gauge performance throughout the year. If service levels are determined to be ineffective, the CTC may opt to exclude the provider from future contract renewal.
B. Cost / Revenue Allocation and Rate Structure Justification
1. Cost Revenue Allocation A rate structure is developed to show fully allocated costs of providing transportation disadvantaged trips. The rate structure is based on the type of trip in the service area. Wheelchair trips are the most costly due to the amount of time to board and disembark wheelchair individuals. Appendix H contains the proposed Cost Revenue Allocation and Fare Structure Justification worksheets. The current rates are: Ambulatory $15.27 Wheelchair $26.18
2. Passenger Fare Structures
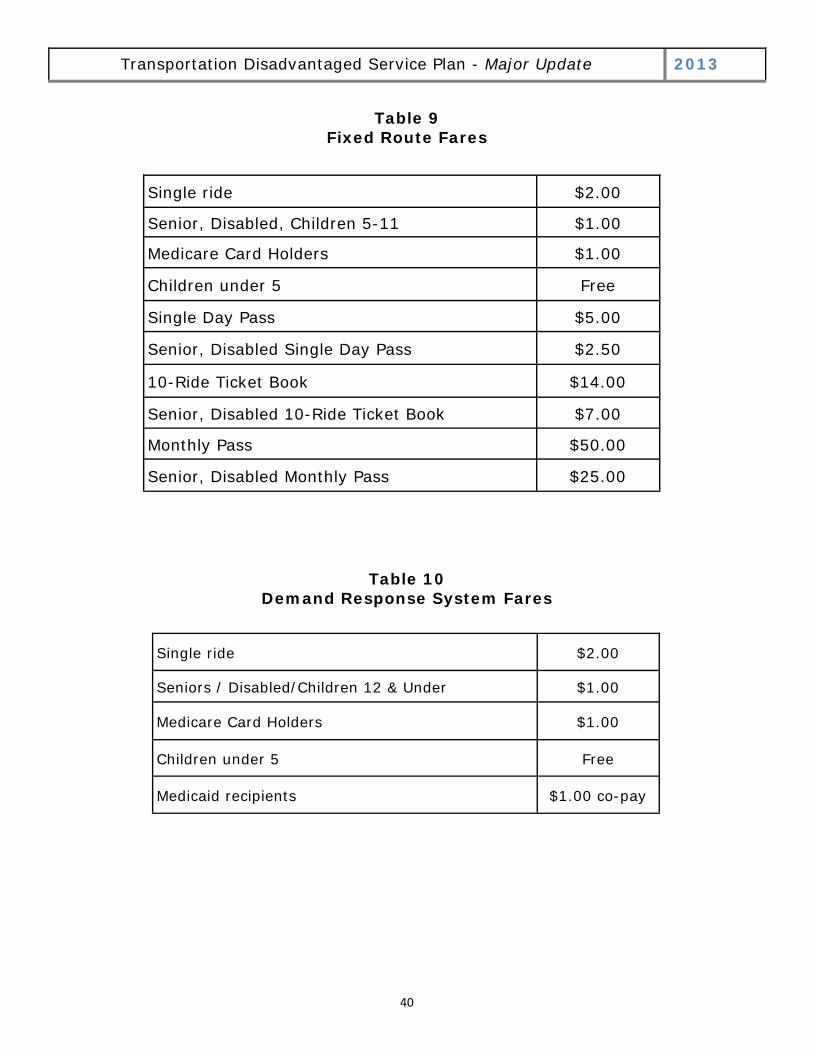
The passenger fares on the fixed-route and the demand response systems are summarized in Tables 9 and 10 below. The passenger fare is the amount the passenger pays for the service and only covers a small part of the true cost of providing the service.
40
Transportation Disadvantaged Service Plan - Major Update 2013
Table 9
Fixed Route Fares
Table 10 Demand Response System Fares
Single ride $2.00
Seniors / Disabled/Children 12 & Under $1.00
Medicare Card Holders $1.00
Children under 5 Free
Medicaid recipients $1.00 co-pay
Single ride $2.00
Senior, Disabled, Children 5-11 $1.00
Medicare Card Holders $1.00
Children under 5 Free
Single Day Pass $5.00
Senior, Disabled Single Day Pass $2.50
10-Ride Ticket Book $14.00
Senior, Disabled 10-Ride Ticket Book $7.00
Monthly Pass $50.00
Senior, Disabled Monthly Pass $25.00
41
Transportation Disadvantaged Service Plan - Major Update 2013
Appendix A
St. Lucie County Inventory of Available Transportation Services
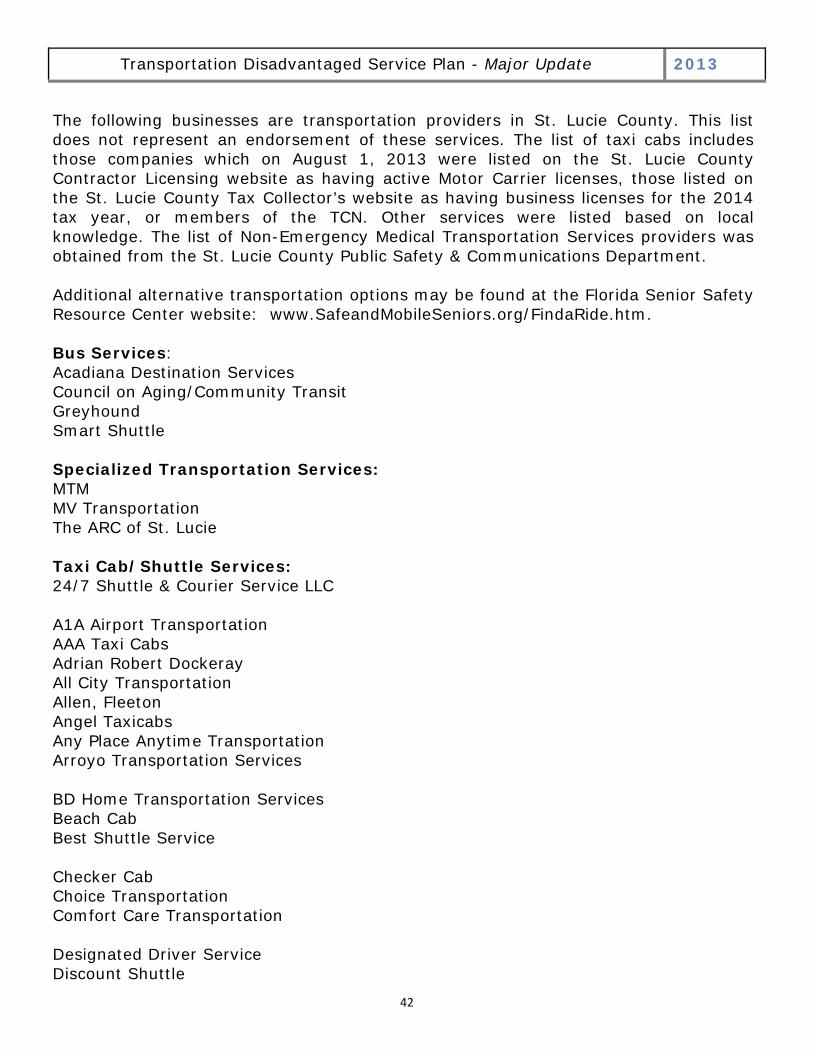
42
Transportation Disadvantaged Service Plan - Major Update 2013
The following businesses are transportation providers in St. Lucie County. This list does not represent an endorsement of these services. The list of taxi cabs includes those companies which on August 1, 2013 were listed on the St. Lucie County Contractor Licensing website as having active Motor Carrier licenses, those listed on the St. Lucie County Tax Collector’s website as having business licenses for the 2014 tax year, or members of the TCN. Other services were listed based on local knowledge. The list of Non-Emergency Medical Transportation Services providers was obtained from the St. Lucie County Public Safety & Communications Department. Additional alternative transportation options may be found at the Florida Senior Safety Resource Center website: www.SafeandMobileSeniors.org/FindaRide.htm. Bus Services: Acadiana Destination Services Council on Aging/Community Transit Greyhound Smart Shuttle Specialized Transportation Services: MTM MV Transportation The ARC of St. Lucie Taxi Cab/Shuttle Services: 24/7 Shuttle & Courier Service LLC A1A Airport Transportation AAA Taxi Cabs Adrian Robert Dockeray All City Transportation Allen, Fleeton Angel Taxicabs Any Place Anytime Transportation Arroyo Transportation Services BD Home Transportation Services Beach Cab Best Shuttle Service Checker Cab Choice Transportation Comfort Care Transportation Designated Driver Service Discount Shuttle
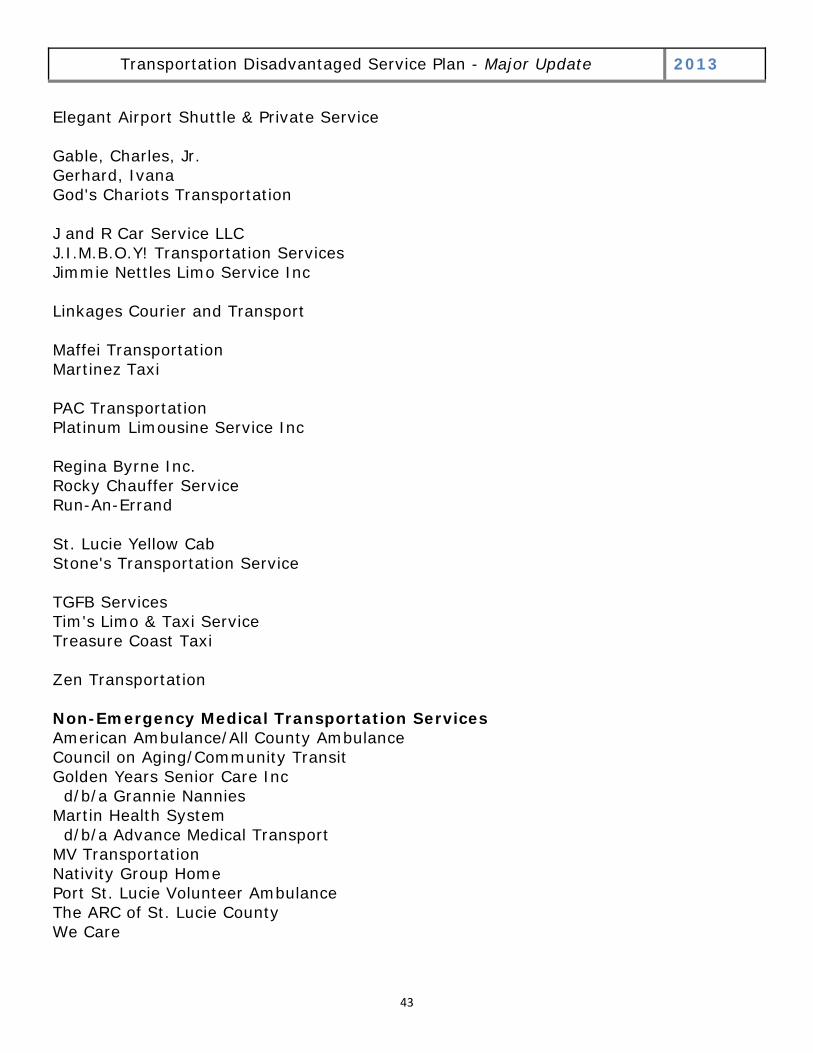
43
Transportation Disadvantaged Service Plan - Major Update 2013
Elegant Airport Shuttle & Private Service Gable, Charles, Jr. Gerhard, Ivana God's Chariots Transportation J and R Car Service LLC J.I.M.B.O.Y! Transportation Services Jimmie Nettles Limo Service Inc Linkages Courier and Transport Maffei Transportation Martinez Taxi PAC Transportation Platinum Limousine Service Inc Regina Byrne Inc. Rocky Chauffer Service Run-An-Errand St. Lucie Yellow Cab Stone's Transportation Service TGFB Services Tim's Limo & Taxi Service Treasure Coast Taxi Zen Transportation Non-Emergency Medical Transportation Services American Ambulance/All County Ambulance Council on Aging/Community Transit Golden Years Senior Care Inc d/b/a Grannie Nannies Martin Health System d/b/a Advance Medical Transport MV Transportation Nativity Group Home Port St. Lucie Volunteer Ambulance The ARC of St. Lucie County We Care
44
Transportation Disadvantaged Service Plan - Major Update 2013
Appendix B
TD Estimate and Forecast Tables
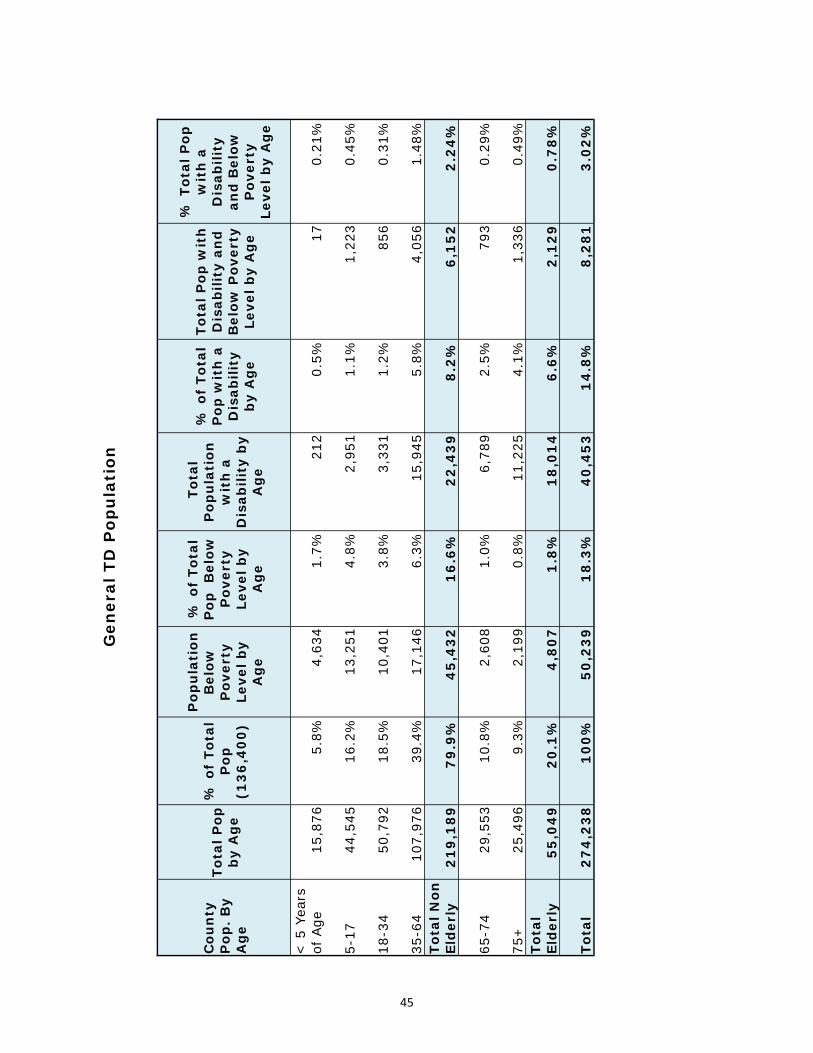
45
Co
un
ty
Pop
. B
y A
ge
Tota
l Pop
b
y A
ge
% o
f To
tal
Po
p
(13
6,4
00
)
Pop
ula
tion
B
elow
P
ove
rty
Leve
l by
Ag
e
% o
f To
tal
Pop
Bel
ow
Pov
erty
Le
vel b
y A
ge
Tot
al
Pop
ula
tion
w
ith
a
Dis
abili
ty b
y A
ge
% o
f To
tal
Pop
wit
h a
D
isab
ility
b
y A
ge
Tota
l Pop
wit
h
Dis
abili
ty a
nd
B
elow
Pov
erty
Le
vel b
y A
ge
% T
otal
Po
p
wit
h a
D
isab
ility
an
d B
elow
P
over
ty
Leve
l by
Ag
e
< 5
Yea
rs
of A
ge
15,8
76
5.8%
4,63
4
1.7%
21
2 0.
5%
17
0.21
%
5-17
44
,545
16
.2%
13
,251
4.
8%
2,95
1 1.
1%
1,22
3 0.
45%
18-3
4 50
,792
18
.5%
10
,401
3.
8%
3,33
1 1.
2%
856
0.31
%
35-6
4 10
7,97
6 39
.4%
17
,146
6.
3%
15,9
45
5.8%
4,
056
1.48
%
Tota
l Non
El
der
ly
21
9,1
89
7
9.9
%
4
5,4
32
1
6.6
%
22
,43
9
8.2
%
6,1
52
2
.24
%
65-7
4 29
,553
10
.8%
2,60
8
1.0%
6,
789
2.5%
79
3 0.
29%
75+
25
,496
9.
3%
2,19
9
0.8%
11
,225
4.
1%
1,33
6 0.
49%
To
tal
El
der
ly
55
,04
9
20
.1%
4
,80
7
1.8
%
18
,01
4
6.6
%
2,1
29
0
.78
%
Tota
l 2
74
,23
8
10
0%
50
,23
9
18
.3%
4
0,4
53
1
4.8
%
8,2
81
3
.02
%
Gen
eral
TD
Pop
ula
tion
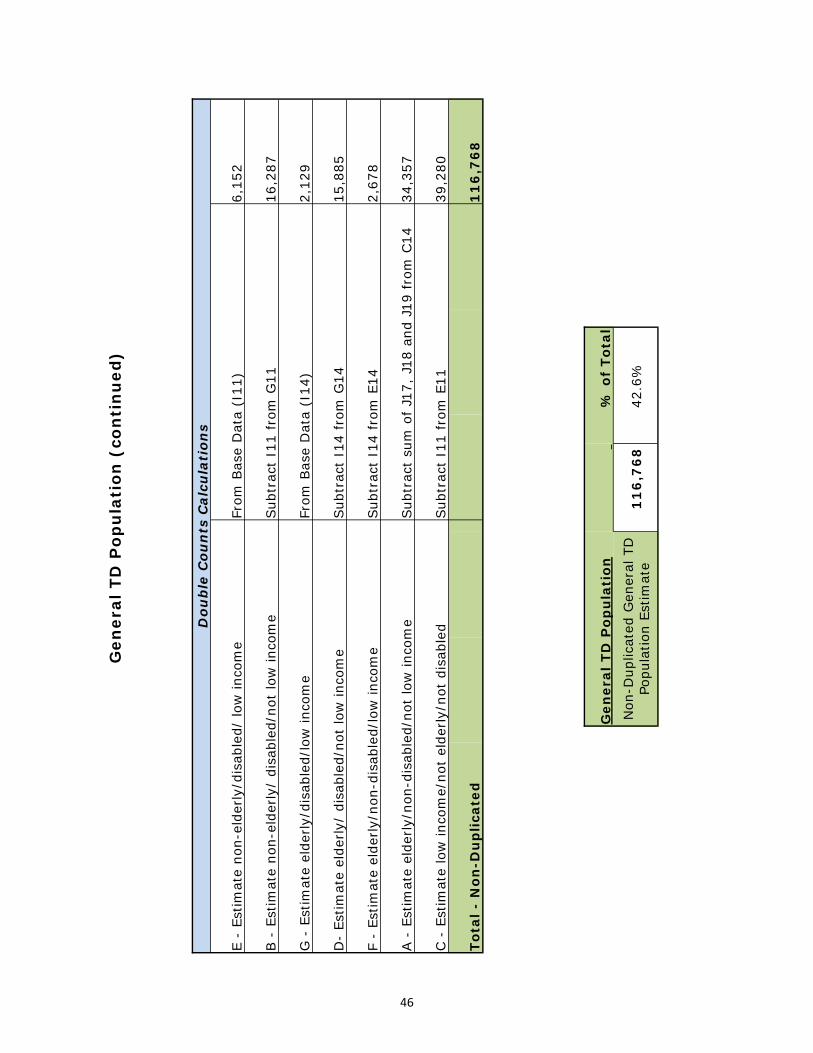
46
Dou
ble
Cou
nts
Cal
cula
tion
s
E -
Estim
ate
non-
elde
rly/
disa
bled
/ lo
w in
com
e
From
Bas
e D
ata
(I11
)
6,15
2
B -
Est
imat
e no
n-el
derly/
dis
able
d/no
t lo
w in
com
e
Sub
trac
t I1
1 fr
om G
11
16,2
87
G -
Est
imat
e el
derly/
disa
bled
/low
inco
me
From
Bas
e D
ata
(I14
)
2,12
9
D-
Estim
ate
elde
rly/
dis
able
d/no
t lo
w in
com
e
Sub
trac
t I1
4 fr
om G
14
15,8
85
F -
Estim
ate
elde
rly/
non-
disa
bled
/low
inco
me
Sub
trac
t I1
4 fr
om E
14
2,67
8
A -
Est
imat
e el
derly/
non-
disa
bled
/not
low
inco
me
Sub
trac
t su
m o
f J1
7, J
18 a
nd J
19 fro
m C
14
34,3
57
C -
Est
imat
e lo
w in
com
e/no
t el
derly/
not
disa
bled
Sub
trac
t I1
1 fr
om E
11
39,2
80
Tota
l - N
on-D
up
licat
ed
1
16
,76
8
Gen
eral
TD
Pop
ula
tion
% o
f To
tal
Non
-Dup
licat
ed G
ener
al T
D
Popu
latio
n Es
timat
e
1
16
,76
8
42.6
%
Gen
eral
TD
Pop
ula
tion
(co
nti
nu
ed)
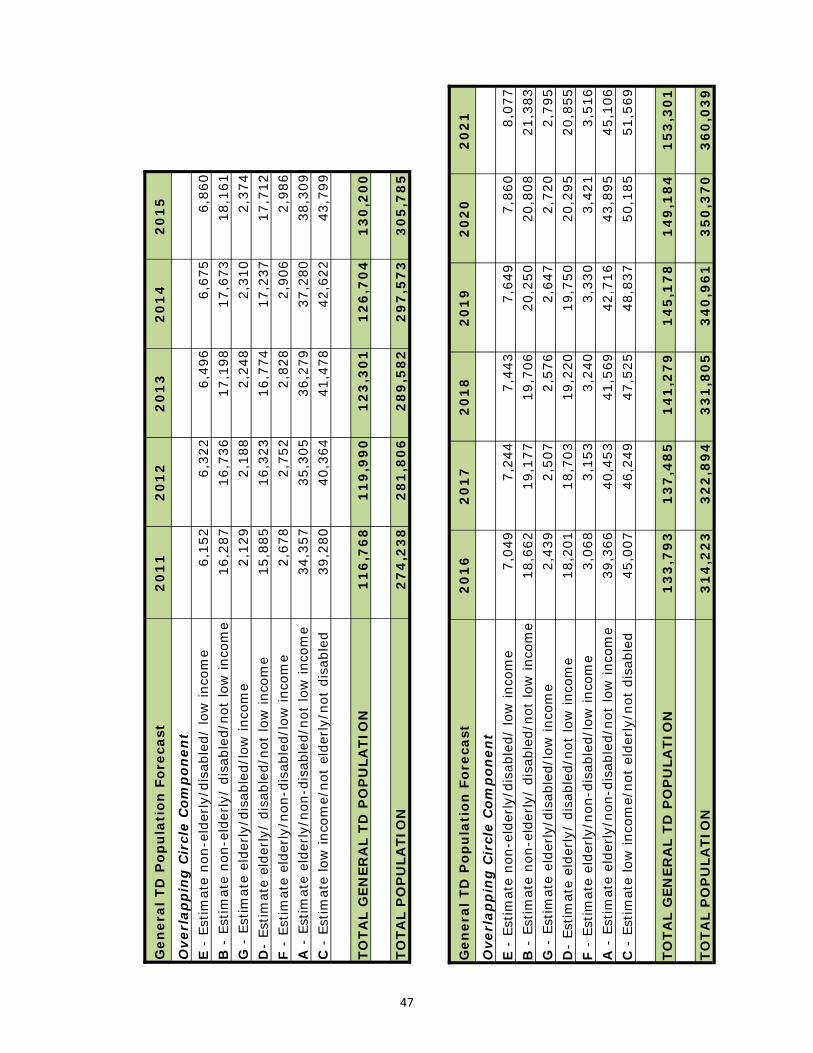
47
Gen
eral
TD
Pop
ula
tion
For
ecas
t 2
01
1
20
12
2
01
3
20
14
2
01
5
Ove
rlap
pin
g C
ircl
e C
omp
onen
t
E -
Estim
ate
non-
elde
rly/
disa
bled
/ lo
w in
com
e 6,
152
6,32
2 6,
496
6,67
5 6,
860
B -
Est
imat
e no
n-el
derly/
dis
able
d/no
t lo
w in
com
e 16
,287
16
,736
17
,198
17
,673
18
,161
G
- E
stim
ate
elde
rly/
disa
bled
/low
inco
me
2,12
9 2,
188
2,24
8 2,
310
2,37
4 D
- Es
timat
e el
derly/
dis
able
d/no
t lo
w in
com
e 15
,885
16
,323
16
,774
17
,237
17
,712
F
- Es
timat
e el
derly/
non-
disa
bled
/low
inco
me
2,67
8 2,
752
2,82
8 2,
906
2,98
6 A
- E
stim
ate
elde
rly/
non-
disa
bled
/not
low
inco
me
34,3
57
35,3
05
36,2
79
37,2
80
38,3
09
C -
Est
imat
e lo
w in
com
e/no
t el
derly/
not
disa
bled
39
,280
40
,364
41
,478
42
,622
43
,799
TO
TAL
GEN
ERA
L TD
PO
PU
LATI
ON
1
16
,76
8
11
9,9
90
1
23
,30
1
12
6,7
04
1
30
,20
0
TOTA
L P
OP
ULA
TIO
N
27
4,2
38
2
81
,80
6
28
9,5
82
2
97
,57
3
30
5,7
85
Gen
eral
TD
Pop
ula
tion
For
ecas
t 2
01
6
20
17
2
01
8
20
19
2
02
0
20
21
Ove
rlap
pin
g C
ircl
e C
omp
onen
t
E
- Es
timat
e no
n-el
derly/
disa
bled
/ lo
w in
com
e 7,
049
7,24
4 7,
443
7,64
9 7,
860
8,07
7 B
- E
stim
ate
non-
elde
rly/
dis
able
d/no
t lo
w in
com
e 18
,662
19
,177
19
,706
20
,250
20
,808
21
,383
G
- E
stim
ate
elde
rly/
disa
bled
/low
inco
me
2,43
9 2,
507
2,57
6 2,
647
2,72
0 2,
795
D-
Estim
ate
elde
rly/
dis
able
d/no
t lo
w in
com
e 18
,201
18
,703
19
,220
19
,750
20
,295
20
,855
F
- Es
timat
e el
derly/
non-
disa
bled
/low
inco
me
3,06
8 3,
153
3,24
0 3,
330
3,42
1 3,
516
A -
Est
imat
e el
derly/
non-
disa
bled
/not
low
inco
me
39,3
66
40,4
53
41,5
69
42,7
16
43,8
95
45,1
06
C -
Est
imat
e lo
w in
com
e/no
t el
derly/
not
disa
bled
45
,007
46
,249
47
,525
48
,837
50
,185
51
,569
TOTA
L G
ENER
AL
TD P
OP
ULA
TIO
N
13
3,7
93
1
37
,48
5
14
1,2
79
1
45
,17
8
14
9,1
84
1
53
,30
1
TO
TAL
PO
PU
LATI
ON
3
14
,22
3
32
2,8
94
3
31
,80
5
34
0,9
61
3
50
,37
0
36
0,0
39
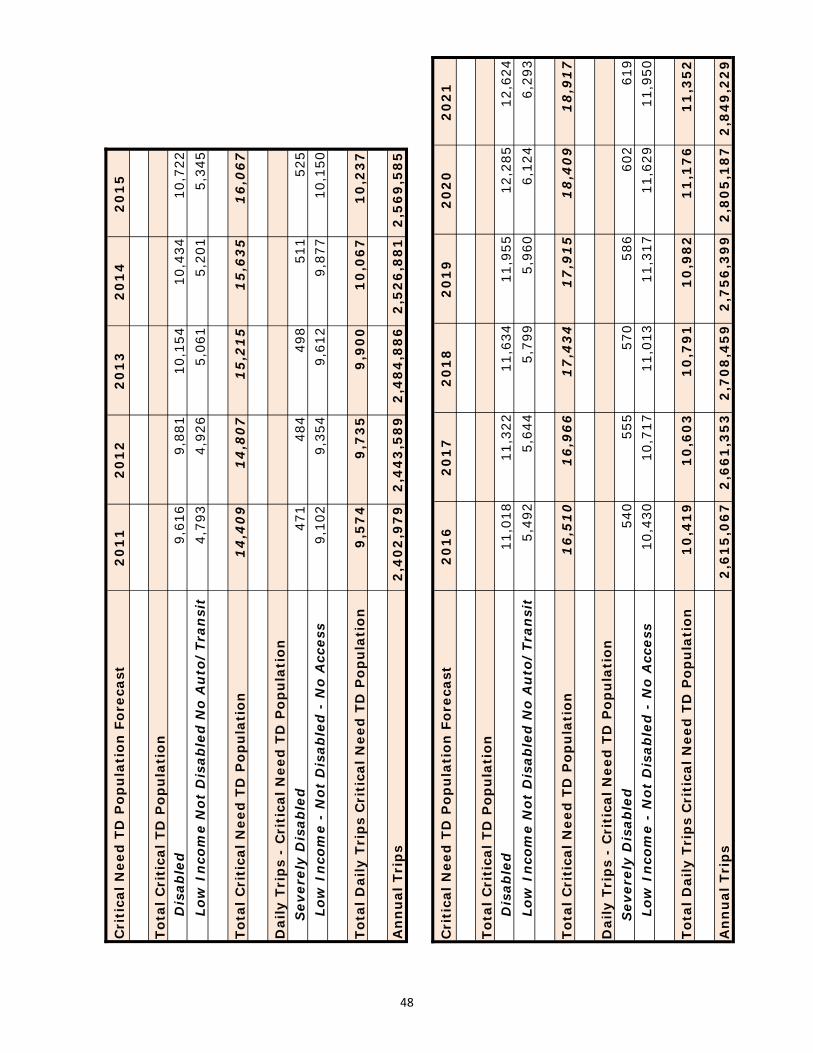
48
Cri
tica
l Nee
d T
D P
opu
lati
on F
orec
ast
20
11
2
01
2
20
13
2
01
4
20
15
To
tal C
riti
cal T
D P
opu
lati
on
Dis
able
d
9,61
6 9,
881
10,1
54
10,4
34
10,7
22
L
ow I
nco
me
Not
Dis
able
d N
o A
uto
/Tr
ansi
t 4,
793
4,92
6 5,
061
5,20
1 5,
345
Tota
l Cri
tica
l Nee
d T
D P
opu
lati
on
14
,40
9
14
,80
7
15
,21
5
15
,63
5
16
,06
7
Dai
ly T
rip
s -
Cri
tica
l Nee
d T
D P
op
ula
tion
S
ever
ely
Dis
able
d
471
484
498
511
525
L
ow I
nco
me
- N
ot D
isab
led
- N
o A
cces
s 9,
102
9,35
4 9,
612
9,87
7 10
,150
To
tal D
aily
Tri
ps
Cri
tica
l Nee
d T
D P
opu
lati
on
9,5
74
9
,73
5
9,9
00
1
0,0
67
1
0,2
37
A
nn
ual
Tri
ps
2,4
02
,97
9
2,4
43
,58
9
2,4
84
,88
6
2,5
26
,88
1
2,5
69
,58
5
Cri
tica
l Nee
d T
D P
opu
lati
on F
orec
ast
20
16
2
01
7
20
18
2
01
9
20
20
2
02
1
To
tal C
riti
cal T
D P
opu
lati
on
D
isab
led
11
,018
11
,322
11
,634
11
,955
12
,285
12
,624
Low
In
com
e N
ot D
isab
led
No
Au
to/
Tran
sit
5,49
2 5,
644
5,79
9 5,
960
6,12
4 6,
293
To
tal C
riti
cal N
eed
TD
Pop
ula
tion
1
6,5
10
1
6,9
66
1
7,4
34
1
7,9
15
1
8,4
09
1
8,9
17
Dai
ly T
rip
s -
Cri
tica
l Nee
d T
D P
op
ula
tion
Sev
erel
y D
isab
led
54
0 55
5 57
0 58
6 60
2 61
9
Low
In
com
e -
Not
Dis
able
d -
No
Acc
ess
10,4
30
10,7
17
11,0
13
11,3
17
11,6
29
11,9
50
To
tal D
aily
Tri
ps
Cri
tica
l Nee
d T
D P
opu
lati
on
10
,41
9
10
,60
3
10
,79
1
10
,98
2
11
,17
6
11
,35
2
A
nn
ual
Tri
ps
2,6
15
,06
7
2,6
61
,35
3
2,7
08
,45
9
2,7
56
,39
9
2,8
05
,18
7
2,8
49
,22
9
49
Transportation Disadvantaged Service Plan - Major Update 2013
Appendix C
Mission Statement,
Goals, Objectives and Strategies
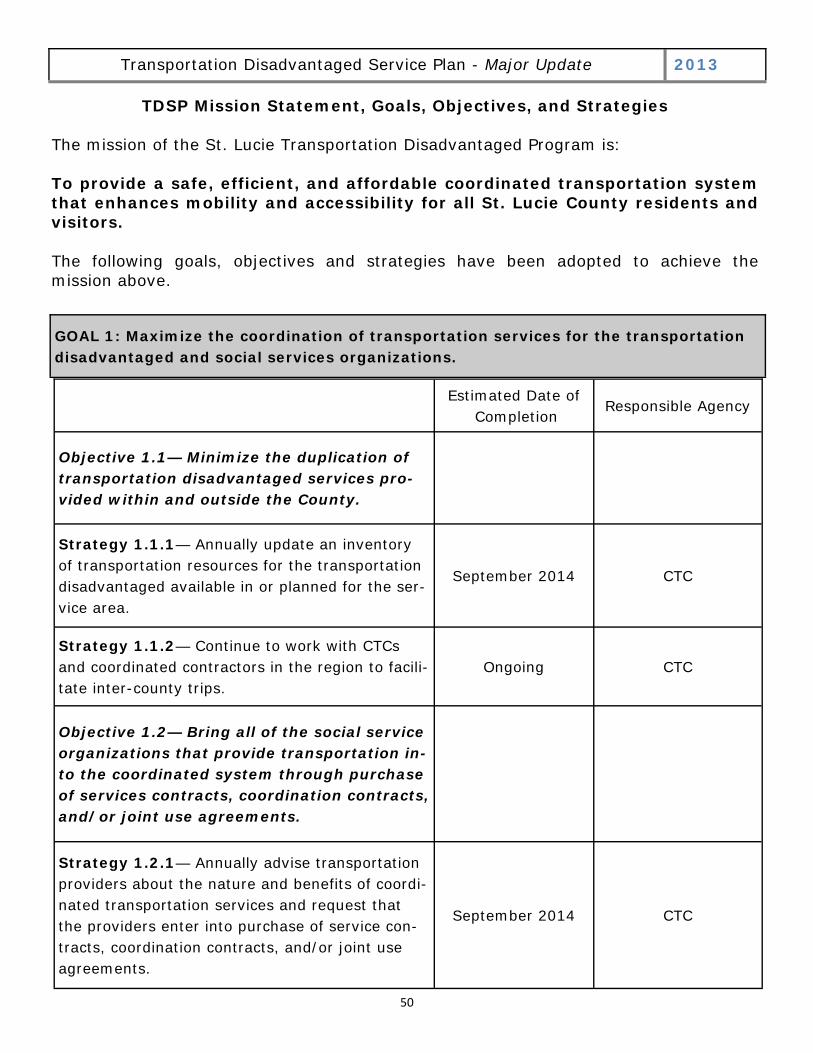
50
Transportation Disadvantaged Service Plan - Major Update 2013
GOAL 1: Maximize the coordination of transportation services for the transportation disadvantaged and social services organizations.
Estimated Date of
Completion Responsible Agency
Objective 1.1— Minimize the duplication of transportation disadvantaged services pro-vided within and outside the County.
Strategy 1.1.1— Annually update an inventory of transportation resources for the transportation disadvantaged available in or planned for the ser-vice area.
September 2014 CTC
Strategy 1.1.2— Continue to work with CTCs and coordinated contractors in the region to facili-tate inter-county trips.
Ongoing CTC
Objective 1.2— Bring all of the social service organizations that provide transportation in-to the coordinated system through purchase of services contracts, coordination contracts, and/or joint use agreements.
Strategy 1.2.1— Annually advise transportation providers about the nature and benefits of coordi-nated transportation services and request that the providers enter into purchase of service con-tracts, coordination contracts, and/or joint use agreements.
September 2014 CTC
TDSP Mission Statement, Goals, Objectives, and Strategies
The mission of the St. Lucie Transportation Disadvantaged Program is: To provide a safe, efficient, and affordable coordinated transportation system that enhances mobility and accessibility for all St. Lucie County residents and visitors. The following goals, objectives and strategies have been adopted to achieve the mission above.
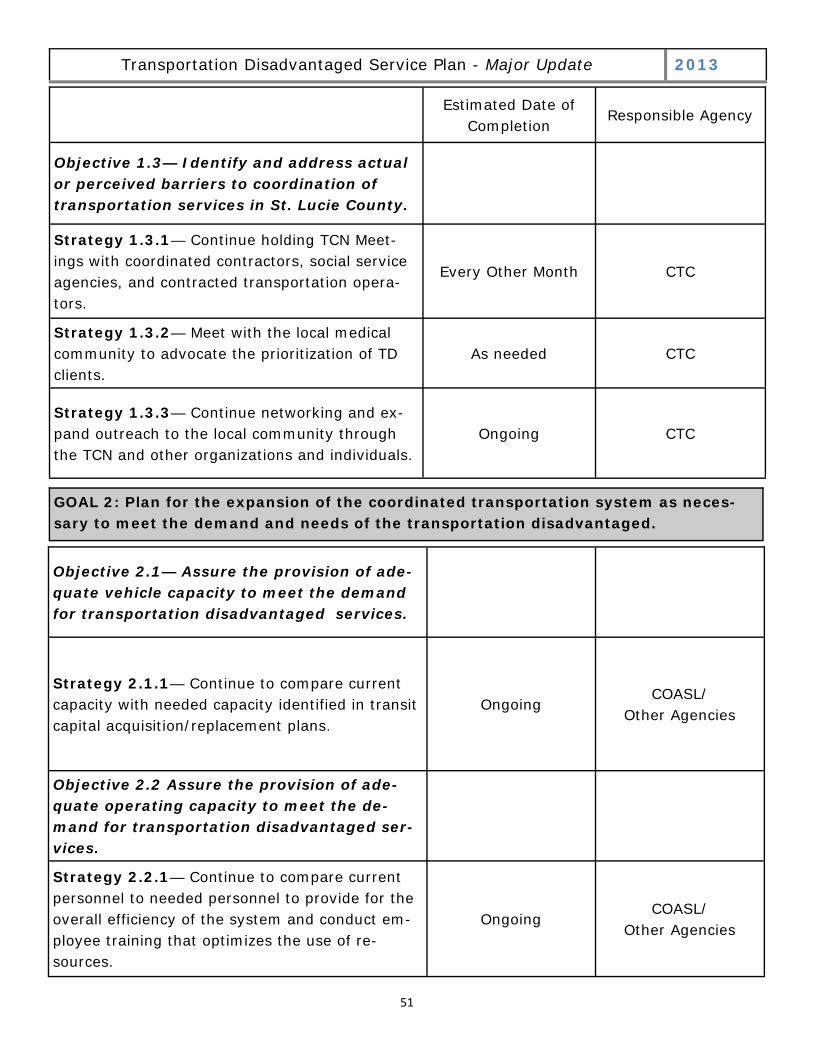
51
Transportation Disadvantaged Service Plan - Major Update 2013
Strategy 1.3.1— Continue holding TCN Meet-ings with coordinated contractors, social service agencies, and contracted transportation opera-tors.
Every Other Month CTC
Strategy 1.3.2— Meet with the local medical community to advocate the prioritization of TD clients.
As needed CTC
Objective 1.3— Identify and address actual or perceived barriers to coordination of transportation services in St. Lucie County.
Strategy 1.3.3— Continue networking and ex-pand outreach to the local community through the TCN and other organizations and individuals.
Ongoing CTC
Estimated Date of
Completion Responsible Agency
GOAL 2: Plan for the expansion of the coordinated transportation system as neces-sary to meet the demand and needs of the transportation disadvantaged.
Objective 2.1— Assure the provision of ade-quate vehicle capacity to meet the demand for transportation disadvantaged services.
Strategy 2.1.1— Continue to compare current capacity with needed capacity identified in transit capital acquisition/replacement plans.
Ongoing COASL/
Other Agencies
Objective 2.2 Assure the provision of ade-quate operating capacity to meet the de-mand for transportation disadvantaged ser-vices.
Strategy 2.2.1— Continue to compare current personnel to needed personnel to provide for the overall efficiency of the system and conduct em-ployee training that optimizes the use of re-sources.
Ongoing COASL/
Other Agencies
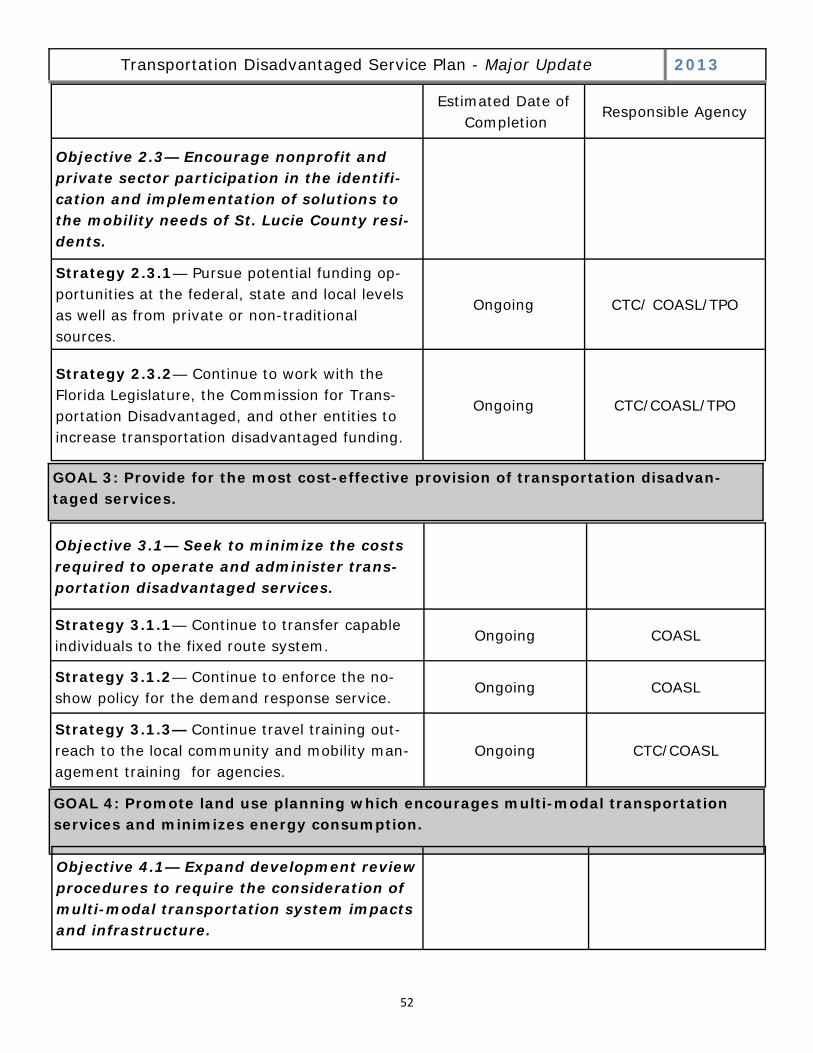
52
Transportation Disadvantaged Service Plan - Major Update 2013
Strategy 2.3.1— Pursue potential funding op-portunities at the federal, state and local levels as well as from private or non-traditional sources.
Ongoing CTC/ COASL/TPO
Strategy 2.3.2— Continue to work with the Florida Legislature, the Commission for Trans-portation Disadvantaged, and other entities to increase transportation disadvantaged funding.
Ongoing CTC/COASL/TPO
Objective 2.3— Encourage nonprofit and private sector participation in the identifi-cation and implementation of solutions to the mobility needs of St. Lucie County resi-dents.
Estimated Date of
Completion Responsible Agency
GOAL 3: Provide for the most cost-effective provision of transportation disadvan-taged services.
Objective 3.1— Seek to minimize the costs required to operate and administer trans-portation disadvantaged services.
Strategy 3.1.1— Continue to transfer capable individuals to the fixed route system.
Ongoing COASL
Strategy 3.1.2— Continue to enforce the no-show policy for the demand response service.
Ongoing COASL
Strategy 3.1.3— Continue travel training out-reach to the local community and mobility man-agement training for agencies.
Ongoing CTC/COASL
GOAL 4: Promote land use planning which encourages multi-modal transportation services and minimizes energy consumption.
Objective 4.1— Expand development review procedures to require the consideration of multi-modal transportation system impacts and infrastructure.
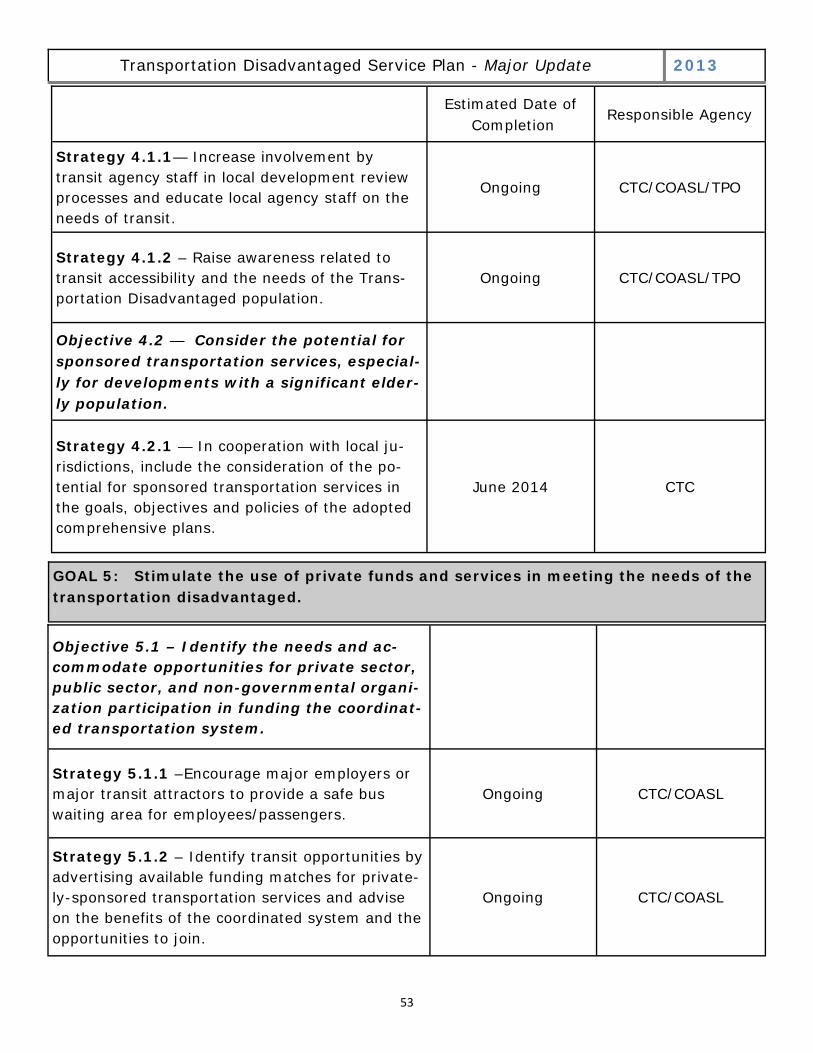
53
Transportation Disadvantaged Service Plan - Major Update 2013
Objective 4.2 — Consider the potential for sponsored transportation services, especial-ly for developments with a significant elder-ly population.
Strategy 4.2.1 — In cooperation with local ju-risdictions, include the consideration of the po-tential for sponsored transportation services in the goals, objectives and policies of the adopted comprehensive plans.
June 2014 CTC
Strategy 4.1.2 – Raise awareness related to transit accessibility and the needs of the Trans-portation Disadvantaged population.
Ongoing CTC/COASL/TPO
Estimated Date of
Completion Responsible Agency
Strategy 4.1.1— Increase involvement by transit agency staff in local development review processes and educate local agency staff on the needs of transit.
Ongoing CTC/COASL/TPO
GOAL 5: Stimulate the use of private funds and services in meeting the needs of the transportation disadvantaged.
Objective 5.1 – Identify the needs and ac-commodate opportunities for private sector, public sector, and non-governmental organi-zation participation in funding the coordinat-ed transportation system.
Strategy 5.1.1 –Encourage major employers or major transit attractors to provide a safe bus waiting area for employees/passengers.
Ongoing CTC/COASL
Strategy 5.1.2 – Identify transit opportunities by advertising available funding matches for private-ly-sponsored transportation services and advise on the benefits of the coordinated system and the opportunities to join.
Ongoing CTC/COASL
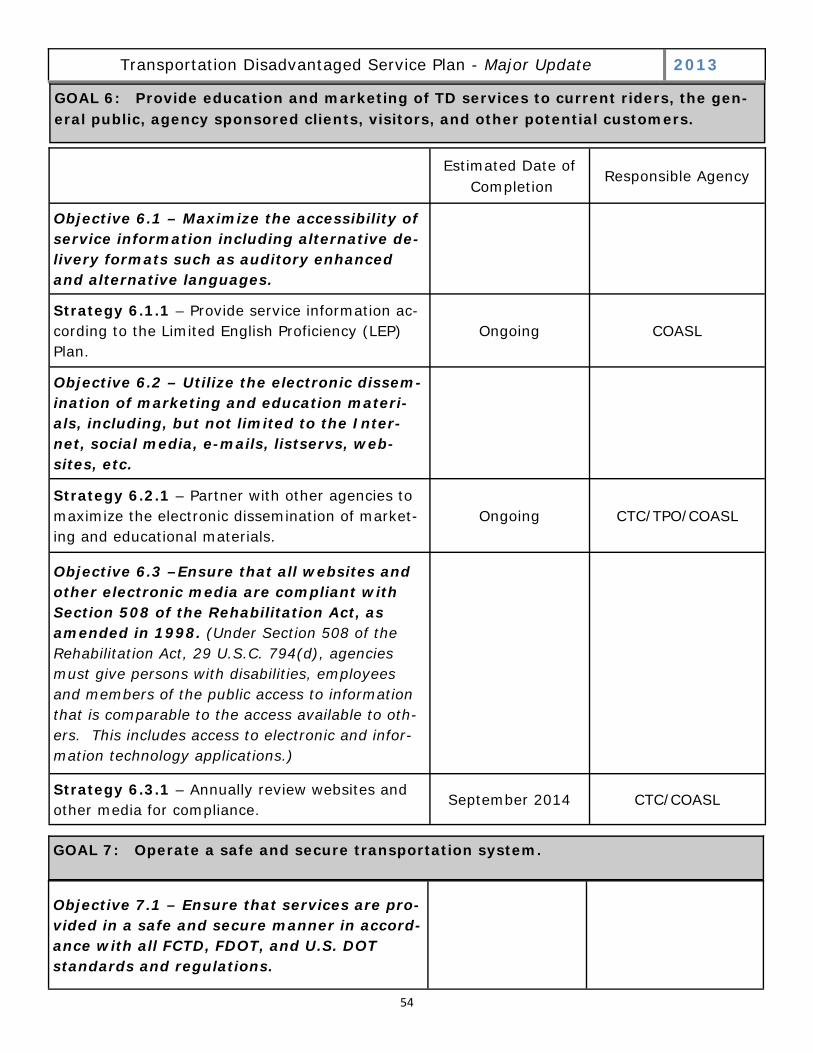
54
Transportation Disadvantaged Service Plan - Major Update 2013
GOAL 6: Provide education and marketing of TD services to current riders, the gen-eral public, agency sponsored clients, visitors, and other potential customers.
Strategy 6.1.1 – Provide service information ac-cording to the Limited English Proficiency (LEP) Plan.
Ongoing COASL
Strategy 6.3.1 – Annually review websites and other media for compliance.
September 2014 CTC/COASL
Objective 6.1 – Maximize the accessibility of service information including alternative de-livery formats such as auditory enhanced and alternative languages.
Estimated Date of
Completion Responsible Agency
Objective 6.2 – Utilize the electronic dissem-ination of marketing and education materi-als, including, but not limited to the Inter-net, social media, e-mails, listservs, web-sites, etc.
Strategy 6.2.1 – Partner with other agencies to maximize the electronic dissemination of market-ing and educational materials.
Ongoing CTC/TPO/COASL
Objective 6.3 –Ensure that all websites and other electronic media are compliant with Section 508 of the Rehabilitation Act, as amended in 1998. (Under Section 508 of the Rehabilitation Act, 29 U.S.C. 794(d), agencies must give persons with disabilities, employees and members of the public access to information that is comparable to the access available to oth-ers. This includes access to electronic and infor-mation technology applications.)
GOAL 7: Operate a safe and secure transportation system.
Objective 7.1 – Ensure that services are pro-vided in a safe and secure manner in accord-ance with all FCTD, FDOT, and U.S. DOT standards and regulations.
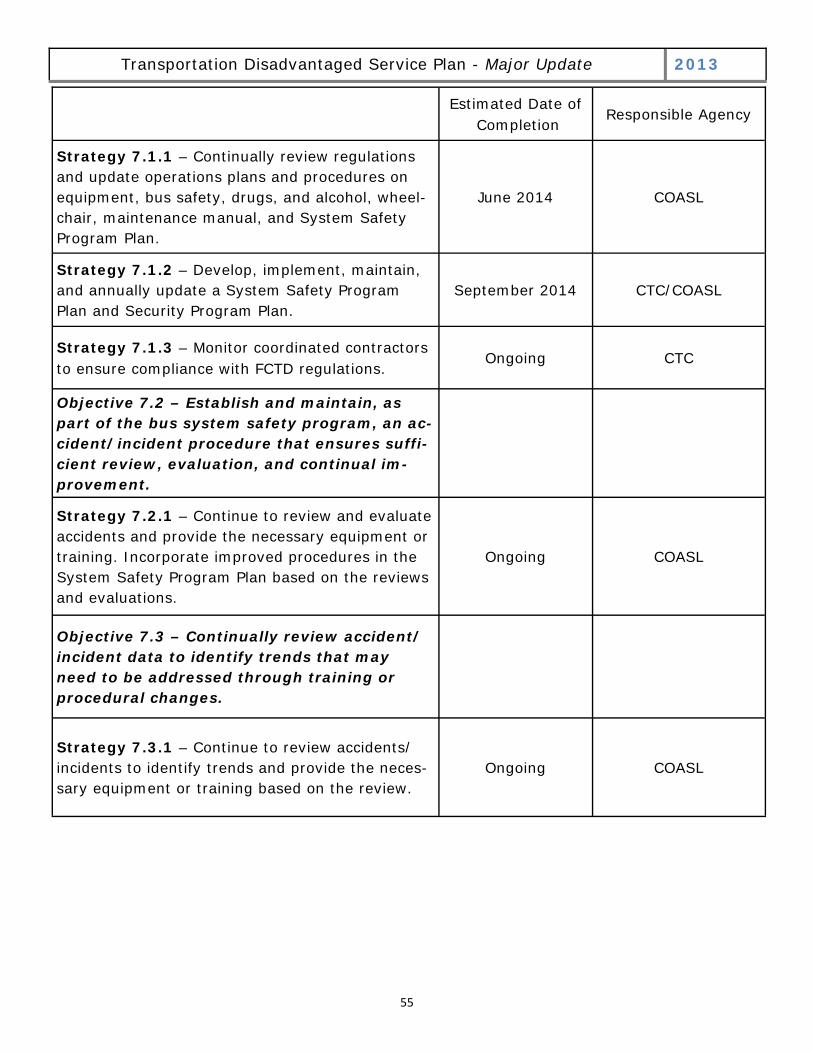
55
Transportation Disadvantaged Service Plan - Major Update 2013
Estimated Date of
Completion Responsible Agency
Strategy 7.1.1 – Continually review regulations and update operations plans and procedures on equipment, bus safety, drugs, and alcohol, wheel-chair, maintenance manual, and System Safety Program Plan.
June 2014 COASL
Strategy 7.1.2 – Develop, implement, maintain, and annually update a System Safety Program Plan and Security Program Plan.
September 2014 CTC/COASL
Strategy 7.1.3 – Monitor coordinated contractors to ensure compliance with FCTD regulations.
Ongoing CTC
Objective 7.2 – Establish and maintain, as part of the bus system safety program, an ac-cident/incident procedure that ensures suffi-cient review, evaluation, and continual im-provement.
Strategy 7.2.1 – Continue to review and evaluate accidents and provide the necessary equipment or training. Incorporate improved procedures in the System Safety Program Plan based on the reviews and evaluations.
Ongoing COASL
Objective 7.3 – Continually review accident/incident data to identify trends that may need to be addressed through training or procedural changes.
Strategy 7.3.1 – Continue to review accidents/incidents to identify trends and provide the neces-sary equipment or training based on the review.
Ongoing COASL
56
Transportation Disadvantaged Service Plan - Major Update 2013
Appendix D
Treasure Coast Connector Plus Rider’s Guide
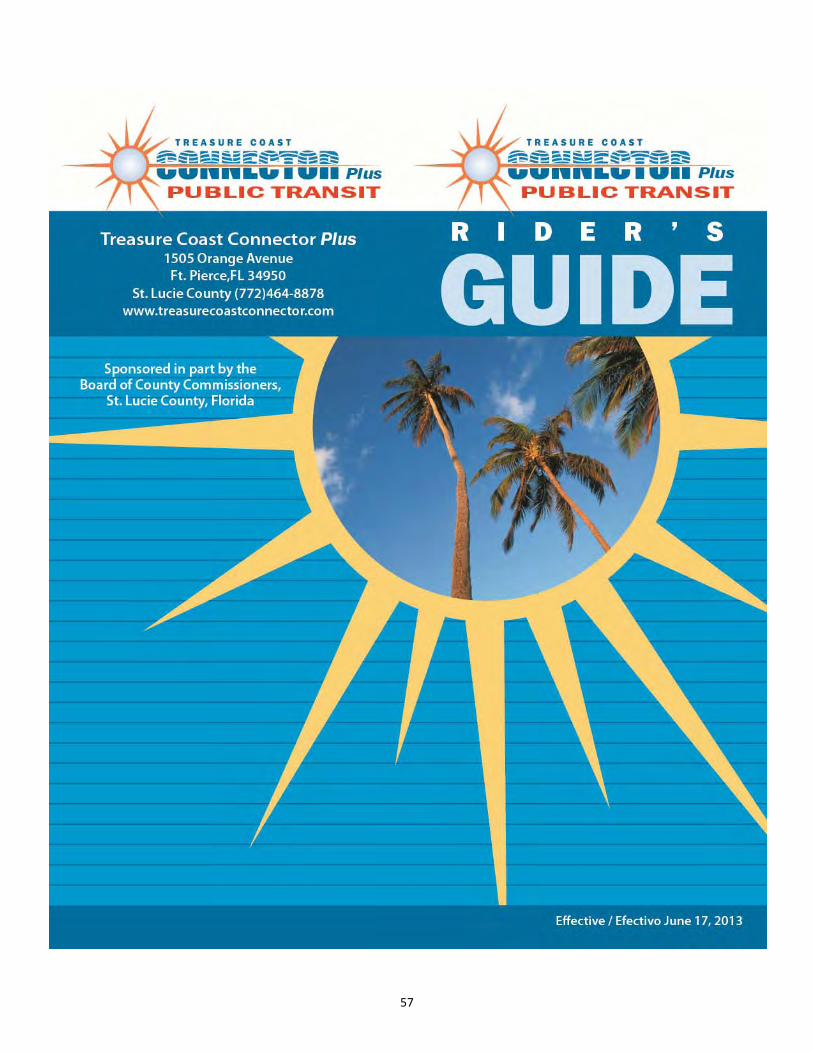
57
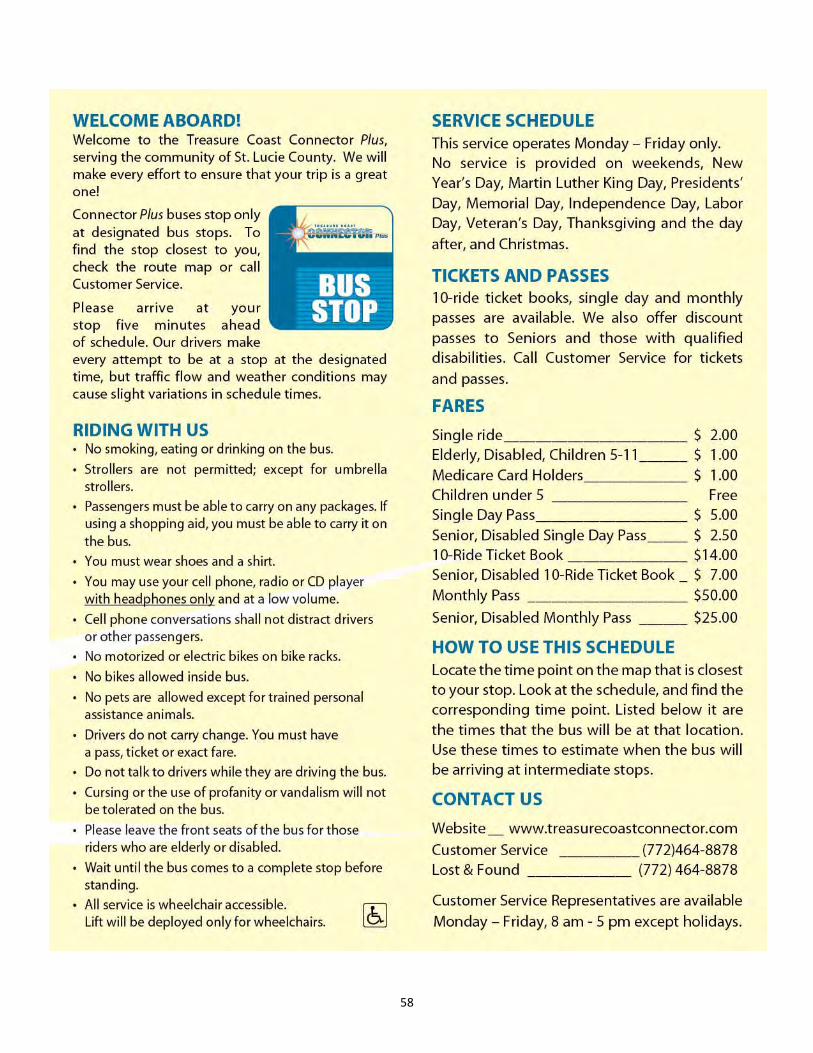
58
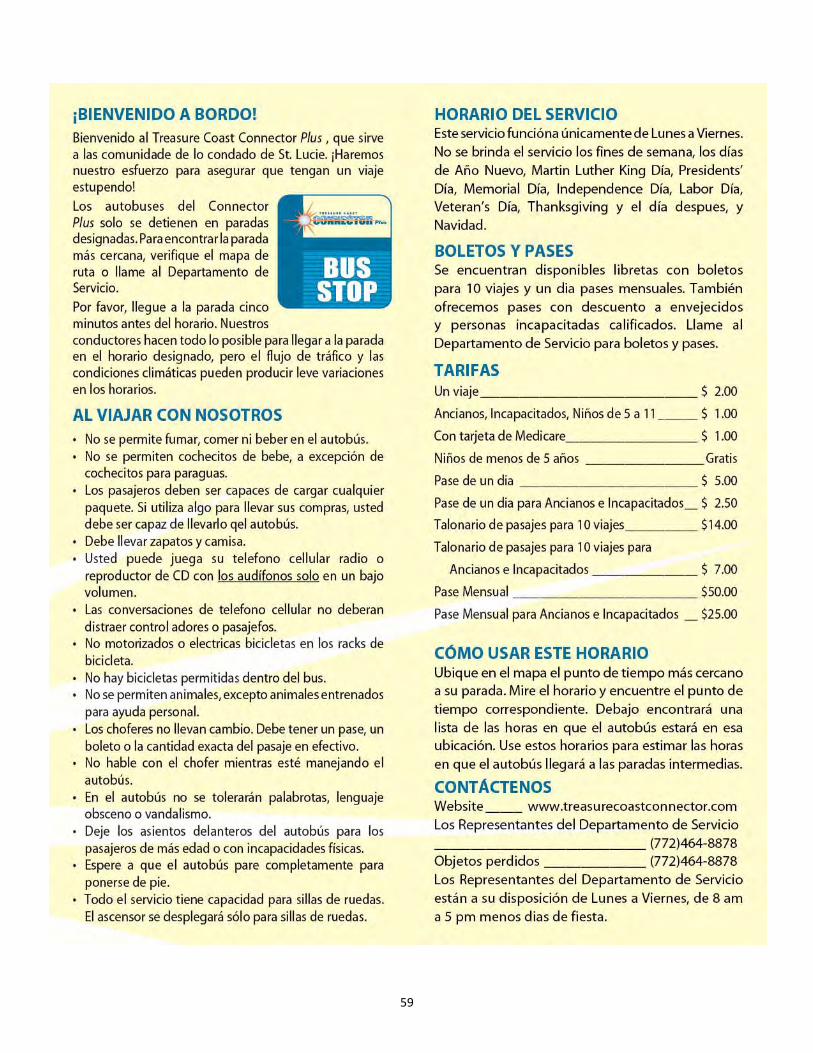
59
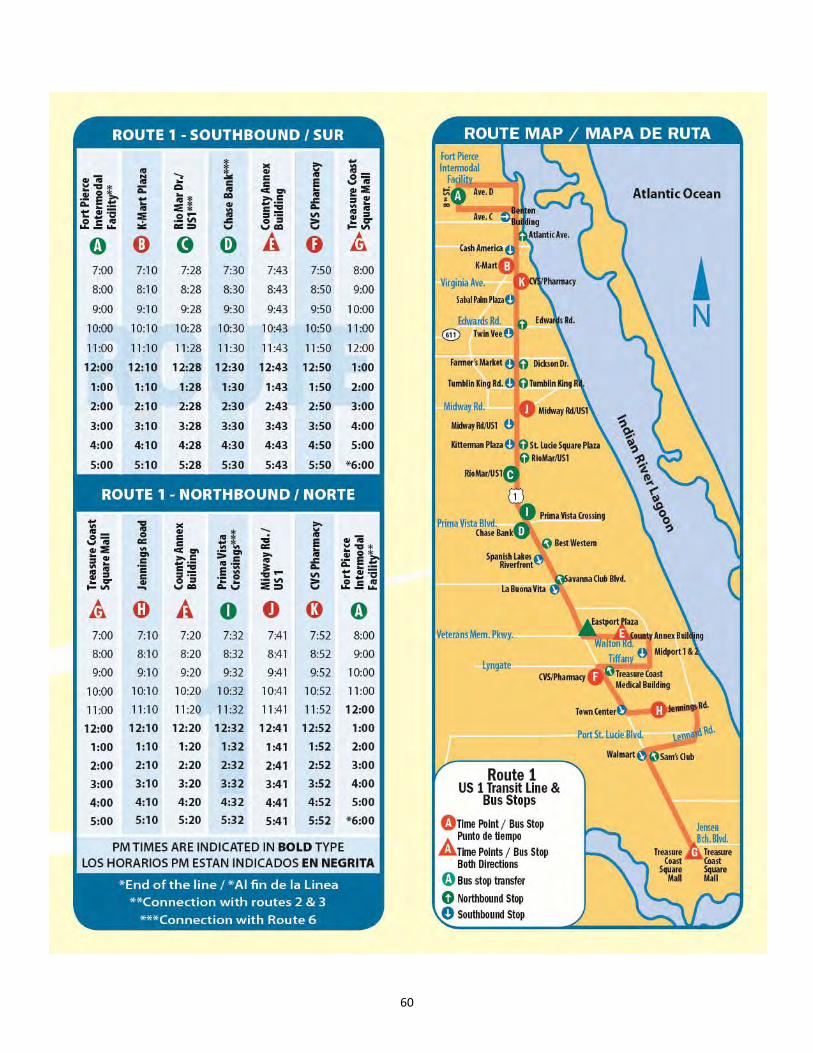
60
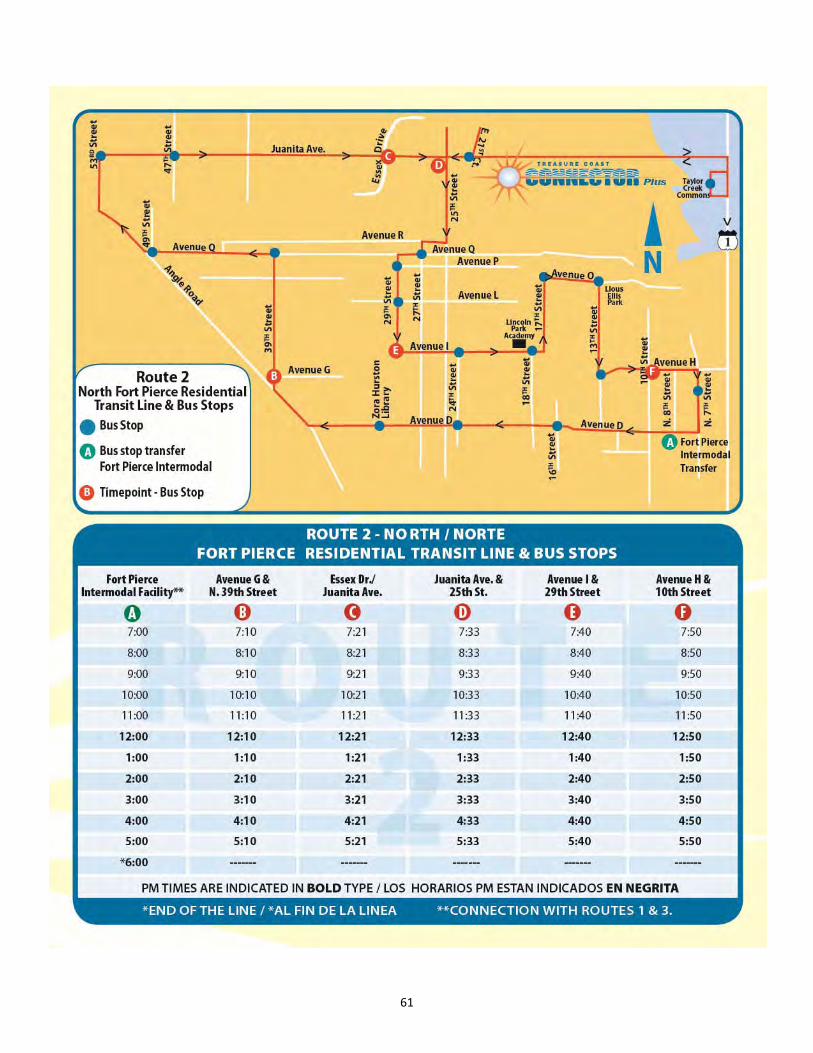
61
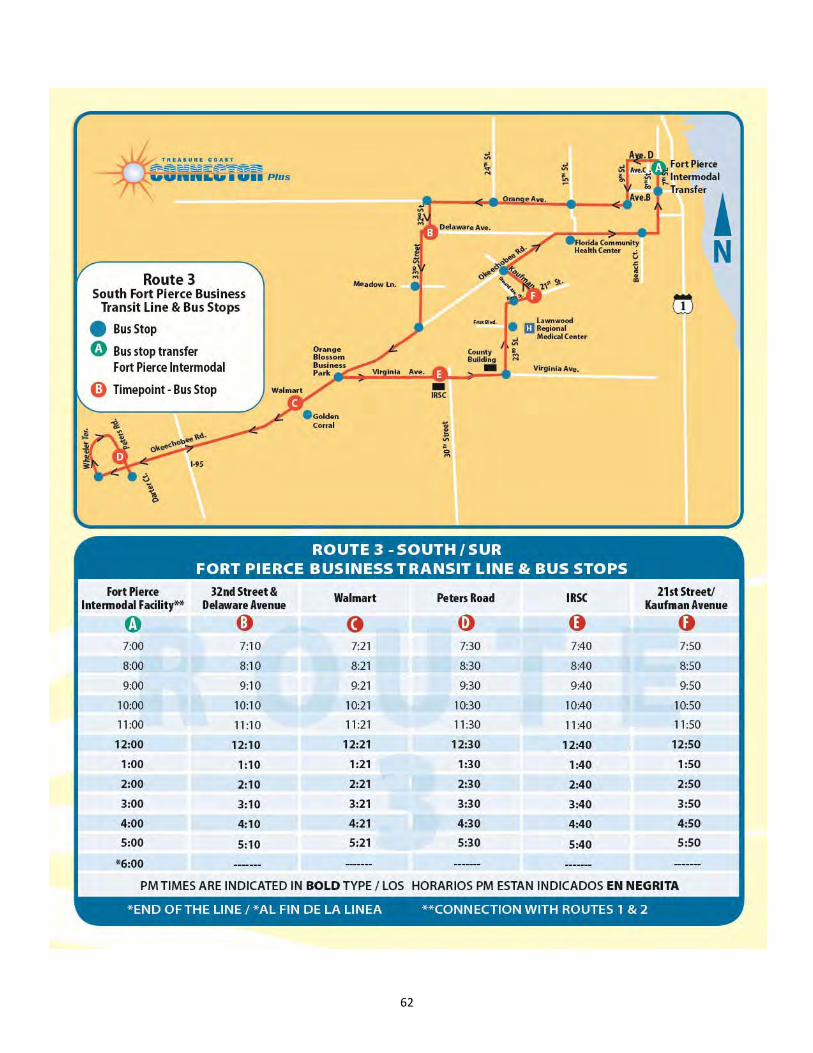
62
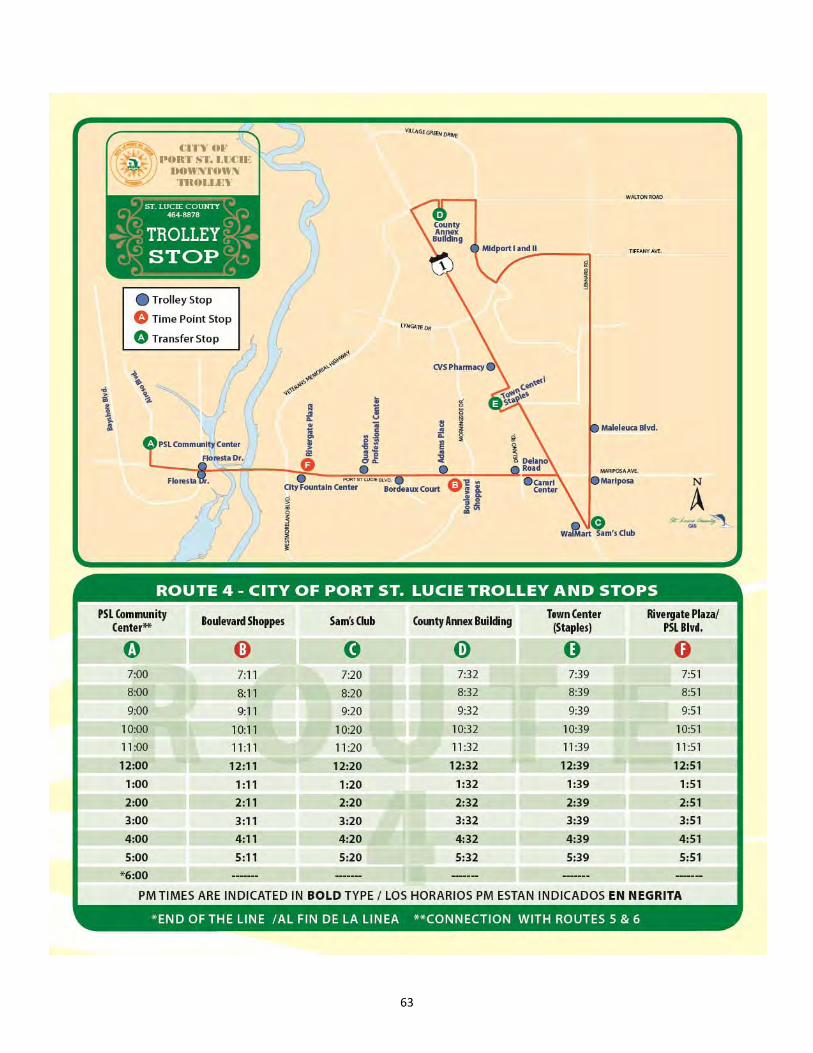
63
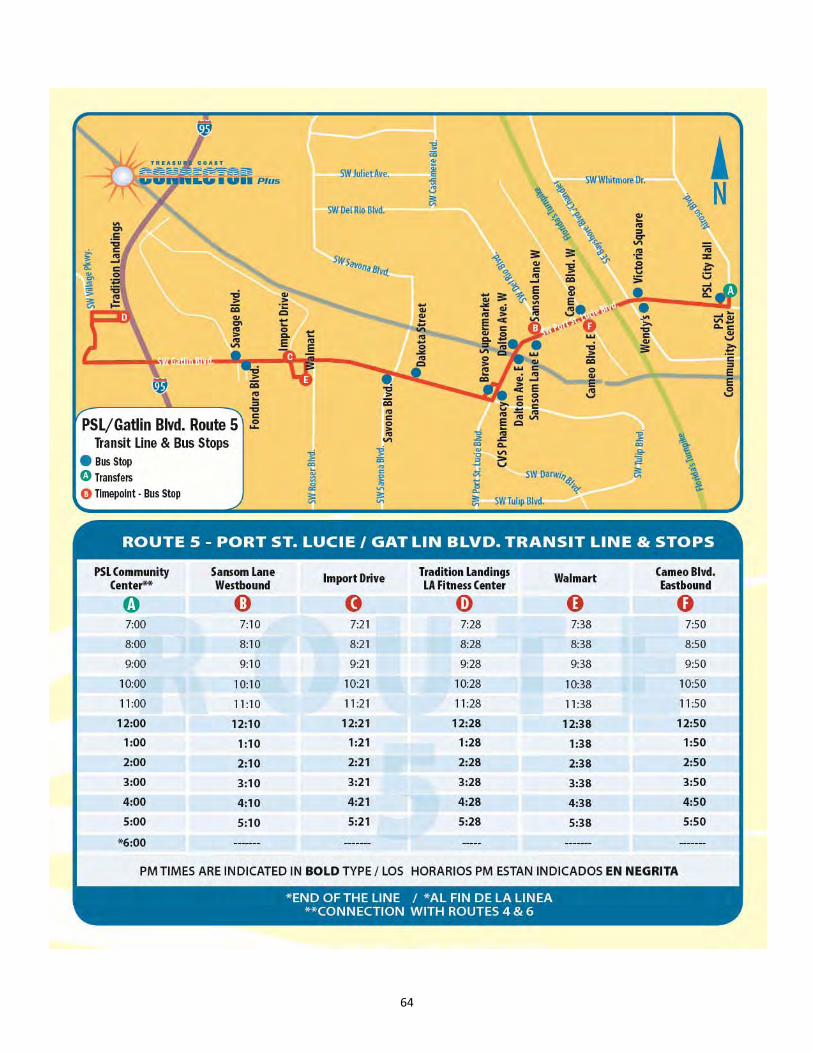
64
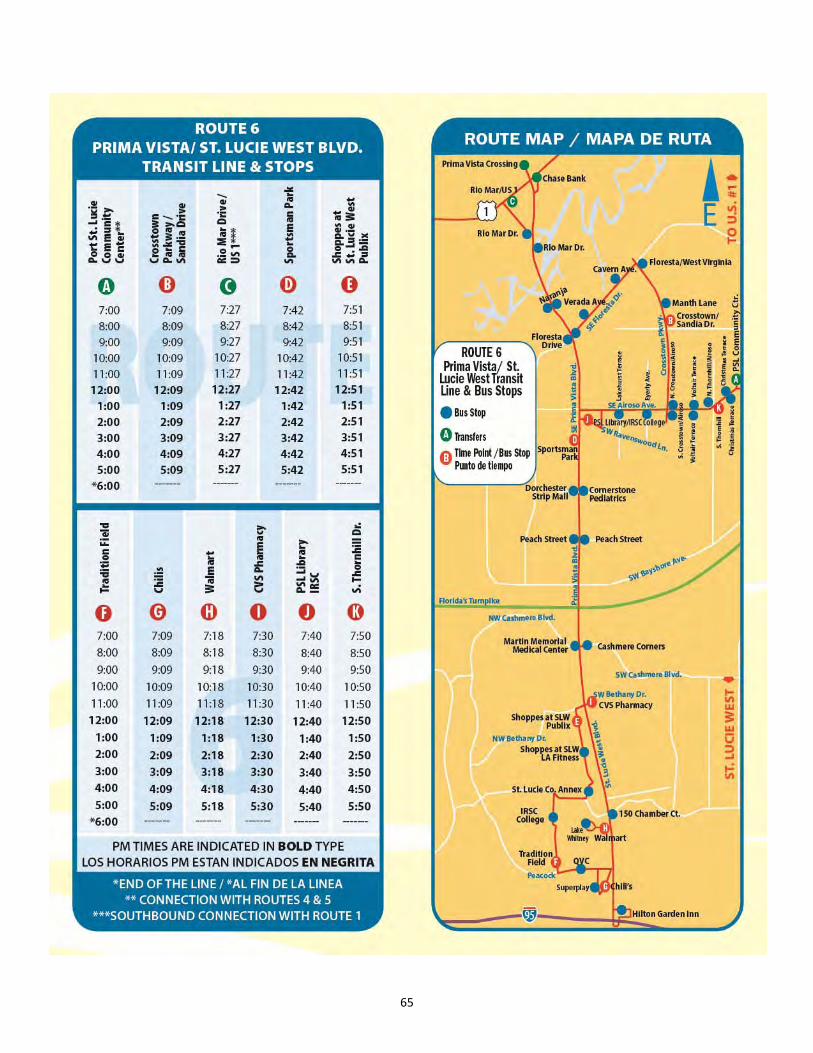
65
66
67
Transportation Disadvantaged Service Plan - Major Update 2013
Appendix E
Vehicle Inventory
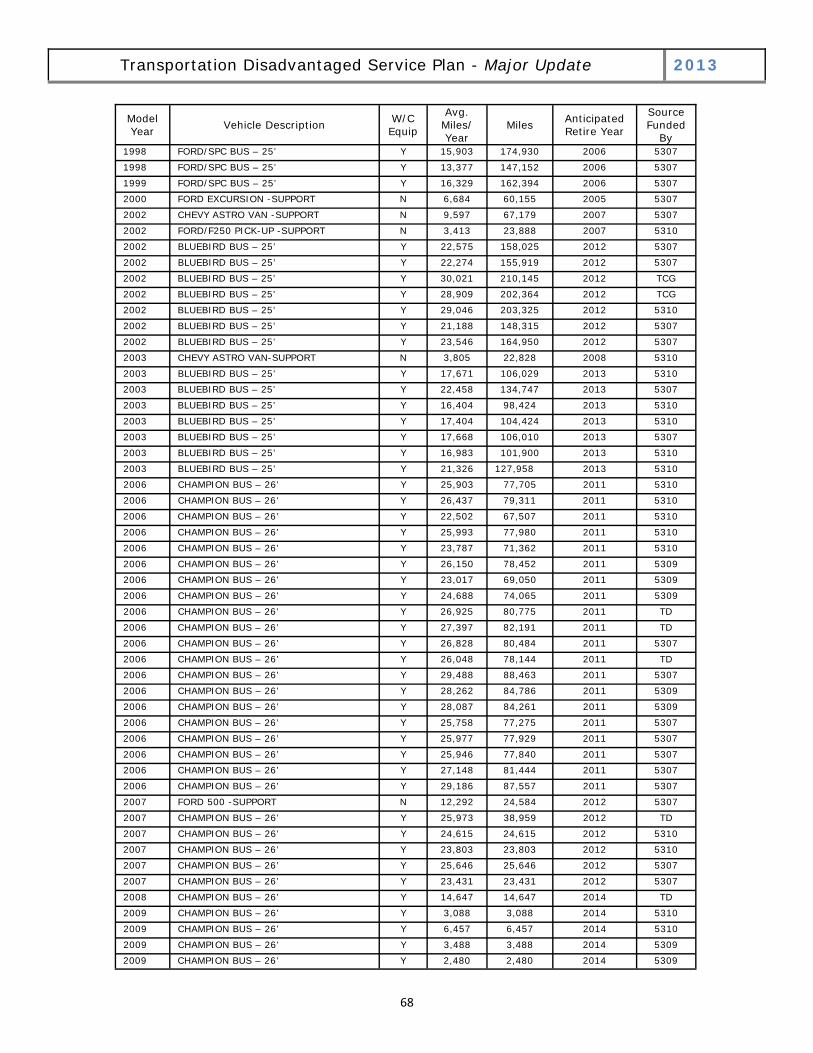
68
Transportation Disadvantaged Service Plan - Major Update 2013
Model Year Vehicle Description W/C
Equip
Avg. Miles/ Year
Miles Anticipated Retire Year
Source Funded
By 1998 FORD/SPC BUS – 25’ Y 15,903 174,930 2006 5307
1998 FORD/SPC BUS – 25’ Y 13,377 147,152 2006 5307
1999 FORD/SPC BUS – 25’ Y 16,329 162,394 2006 5307 2000 FORD EXCURSION -SUPPORT N 6,684 60,155 2005 5307
2002 CHEVY ASTRO VAN -SUPPORT N 9,597 67,179 2007 5307
2002 FORD/F250 PICK-UP -SUPPORT N 3,413 23,888 2007 5310
2002 BLUEBIRD BUS – 25’ Y 22,575 158,025 2012 5307
2002 BLUEBIRD BUS – 25’ Y 22,274 155,919 2012 5307
2002 BLUEBIRD BUS – 25’ Y 30,021 210,145 2012 TCG
2002 BLUEBIRD BUS – 25’ Y 28,909 202,364 2012 TCG
2002 BLUEBIRD BUS – 25’ Y 29,046 203,325 2012 5310
2002 BLUEBIRD BUS – 25’ Y 21,188 148,315 2012 5307
2002 BLUEBIRD BUS – 25’ Y 23,546 164,950 2012 5307
2003 CHEVY ASTRO VAN-SUPPORT N 3,805 22,828 2008 5310
2003 BLUEBIRD BUS – 25’ Y 17,671 106,029 2013 5310 2003 BLUEBIRD BUS – 25’ Y 22,458 134,747 2013 5307
2003 BLUEBIRD BUS – 25’ Y 16,404 98,424 2013 5310
2003 BLUEBIRD BUS – 25’ Y 17,404 104,424 2013 5310
2003 BLUEBIRD BUS – 25’ Y 17,668 106,010 2013 5307
2003 BLUEBIRD BUS – 25’ Y 16,983 101,900 2013 5310
2003 BLUEBIRD BUS – 25’ Y 21,326 127,958 2013 5310 2006 CHAMPION BUS – 26’ Y 25,903 77,705 2011 5310
2006 CHAMPION BUS – 26’ Y 26,437 79,311 2011 5310
2006 CHAMPION BUS – 26’ Y 22,502 67,507 2011 5310
2006 CHAMPION BUS – 26’ Y 25,993 77,980 2011 5310
2006 CHAMPION BUS – 26’ Y 23,787 71,362 2011 5310
2006 CHAMPION BUS – 26’ Y 26,150 78,452 2011 5309 2006 CHAMPION BUS – 26’ Y 23,017 69,050 2011 5309
2006 CHAMPION BUS – 26’ Y 24,688 74,065 2011 5309
2006 CHAMPION BUS – 26’ Y 26,925 80,775 2011 TD
2006 CHAMPION BUS – 26’ Y 27,397 82,191 2011 TD
2006 CHAMPION BUS – 26’ Y 26,828 80,484 2011 5307
2006 CHAMPION BUS – 26’ Y 26,048 78,144 2011 TD
2006 CHAMPION BUS – 26’ Y 29,488 88,463 2011 5307
2006 CHAMPION BUS – 26’ Y 28,262 84,786 2011 5309
2006 CHAMPION BUS – 26’ Y 28,087 84,261 2011 5309
2006 CHAMPION BUS – 26’ Y 25,758 77,275 2011 5307
2006 CHAMPION BUS – 26’ Y 25,977 77,929 2011 5307
2006 CHAMPION BUS – 26’ Y 25,946 77,840 2011 5307 2006 CHAMPION BUS – 26’ Y 27,148 81,444 2011 5307
2006 CHAMPION BUS – 26’ Y 29,186 87,557 2011 5307
2007 FORD 500 -SUPPORT N 12,292 24,584 2012 5307
2007 CHAMPION BUS – 26’ Y 25,973 38,959 2012 TD
2007 CHAMPION BUS – 26’ Y 24,615 24,615 2012 5310
2007 CHAMPION BUS – 26’ Y 23,803 23,803 2012 5310 2007 CHAMPION BUS – 26’ Y 25,646 25,646 2012 5307
2007 CHAMPION BUS – 26’ Y 23,431 23,431 2012 5307
2008 CHAMPION BUS – 26’ Y 14,647 14,647 2014 TD
2009 CHAMPION BUS – 26’ Y 3,088 3,088 2014 5310
2009 CHAMPION BUS – 26’ Y 6,457 6,457 2014 5310
2009 CHAMPION BUS – 26’ Y 3,488 3,488 2014 5309 2009 CHAMPION BUS – 26’ Y 2,480 2,480 2014 5309
69
Transportation Disadvantaged Service Plan - Major Update 2013
Appendix F
System Safety Program Plan Certification
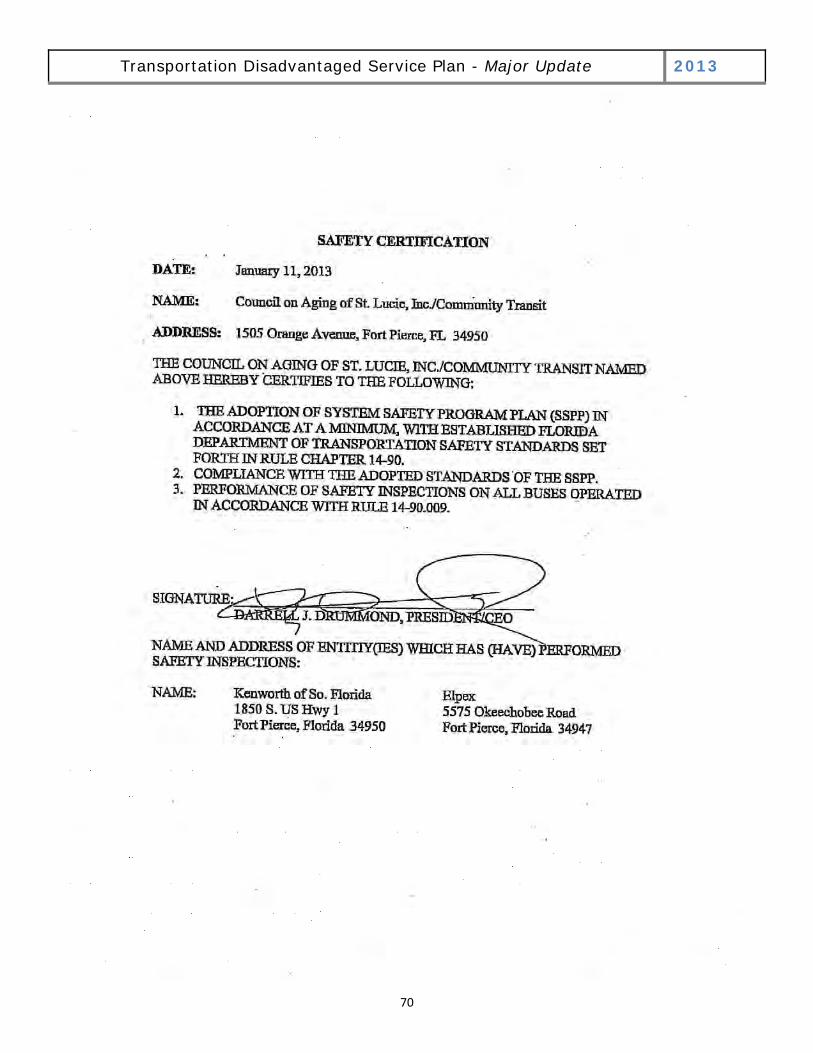
70
Transportation Disadvantaged Service Plan - Major Update 2013
71
Transportation Disadvantaged Service Plan - Major Update 2013
Appendix G
Local Coordinating Board Grievance Procedures
72
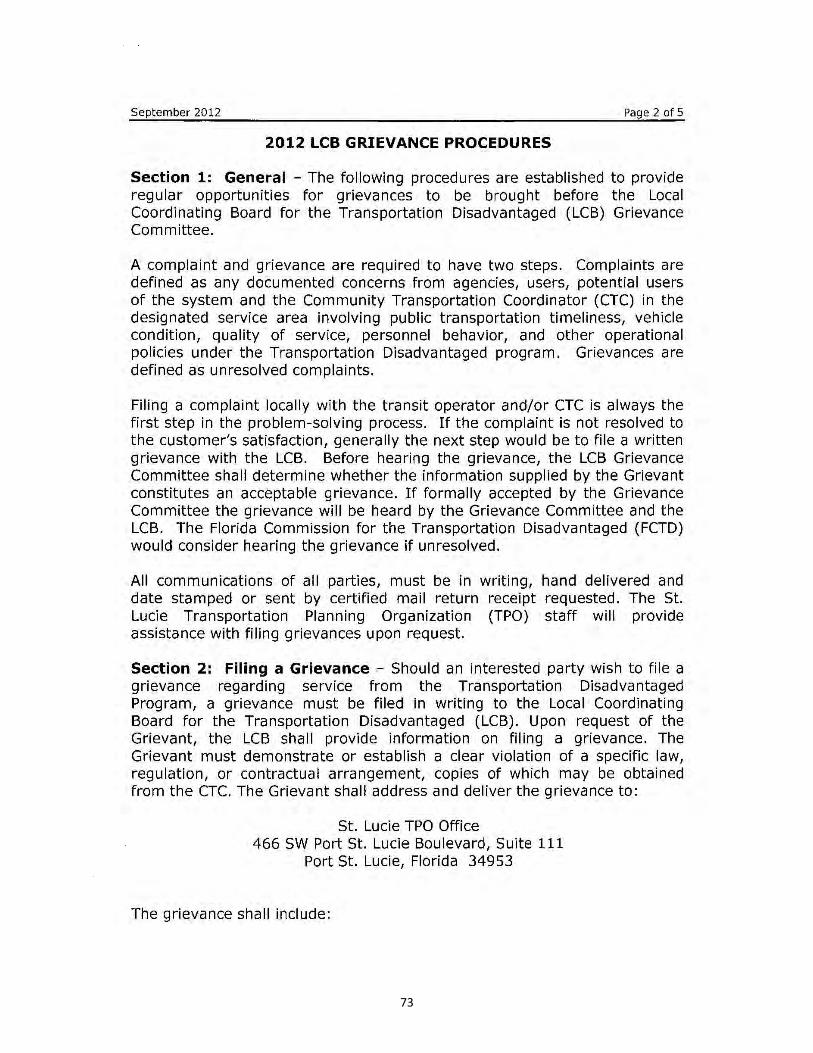
73
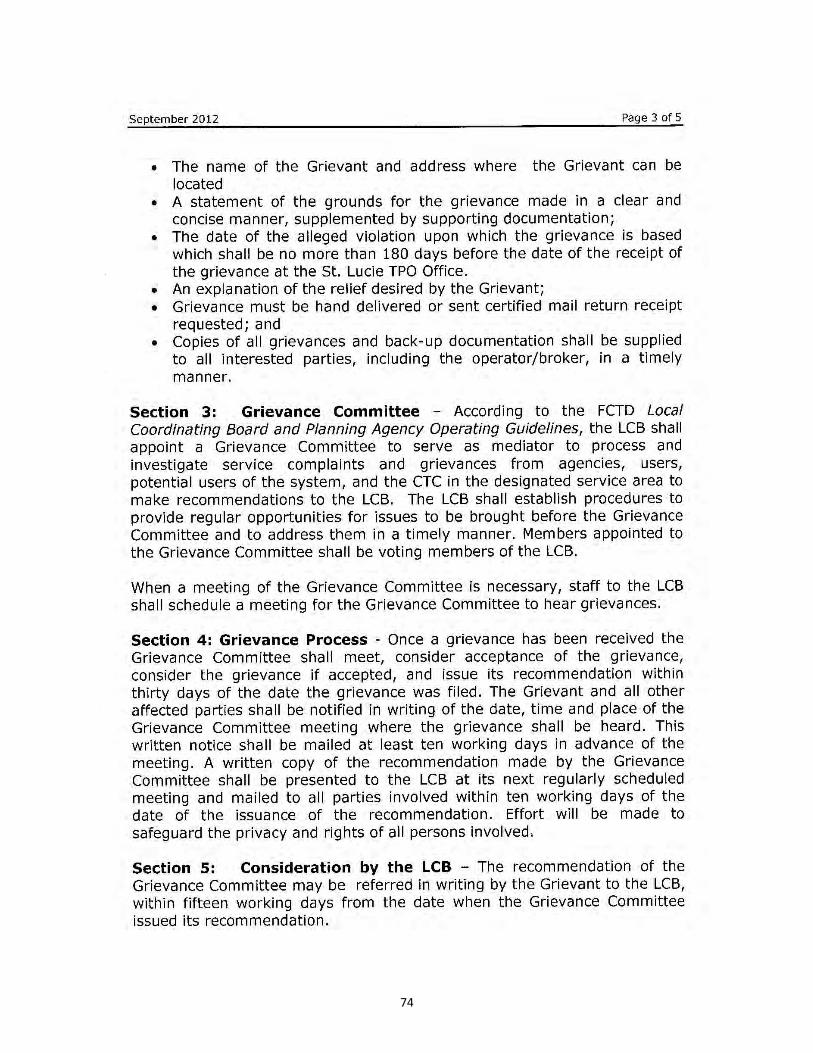
74
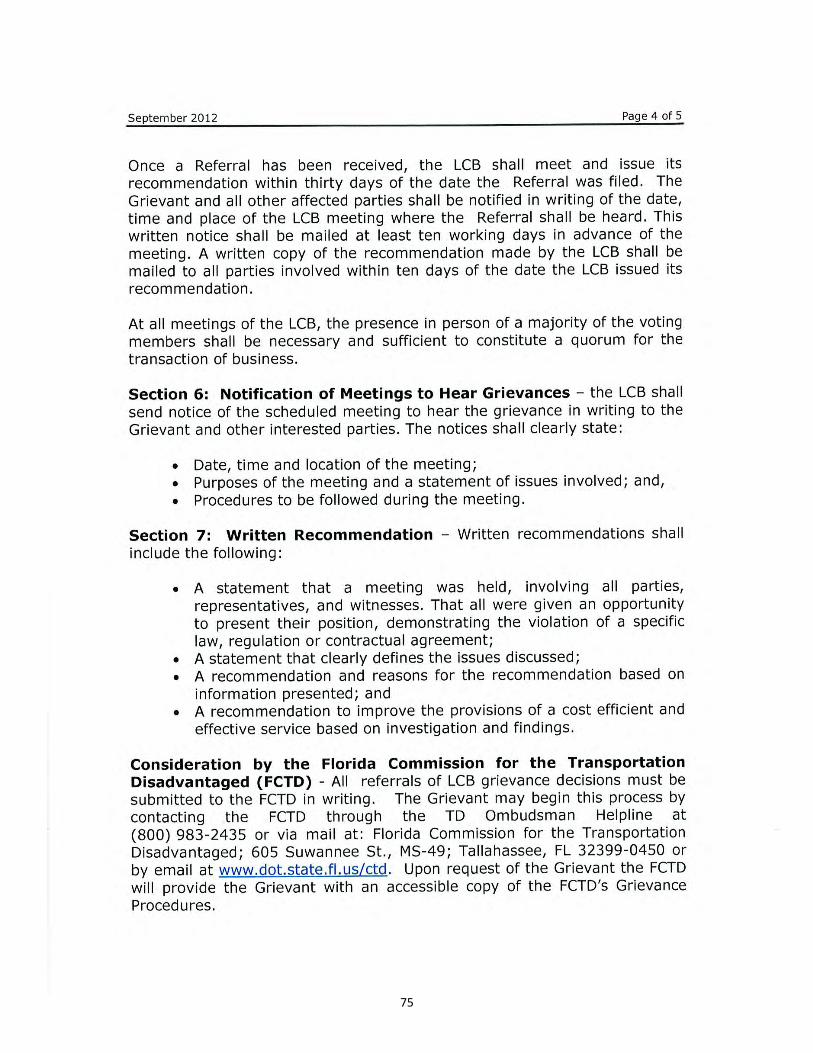
75
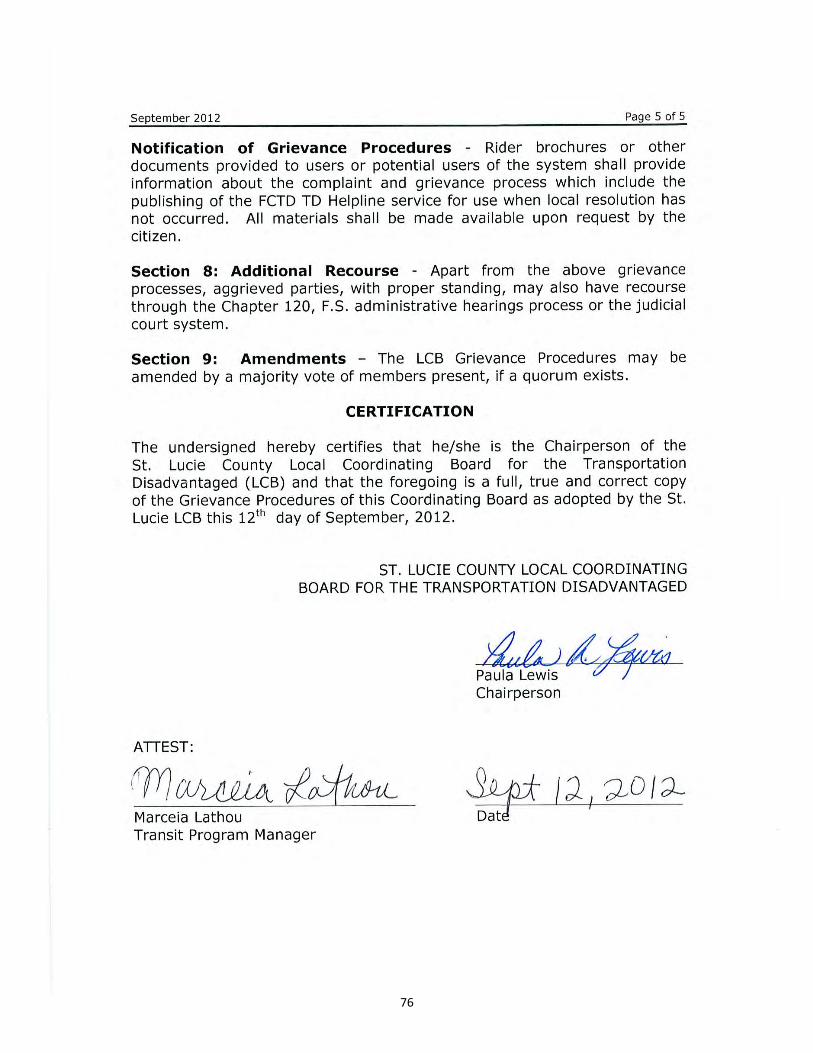
76
77
Transportation Disadvantaged Service Plan - Major Update 2013
Appendix H
Rate Model Calculation Spreadsheet
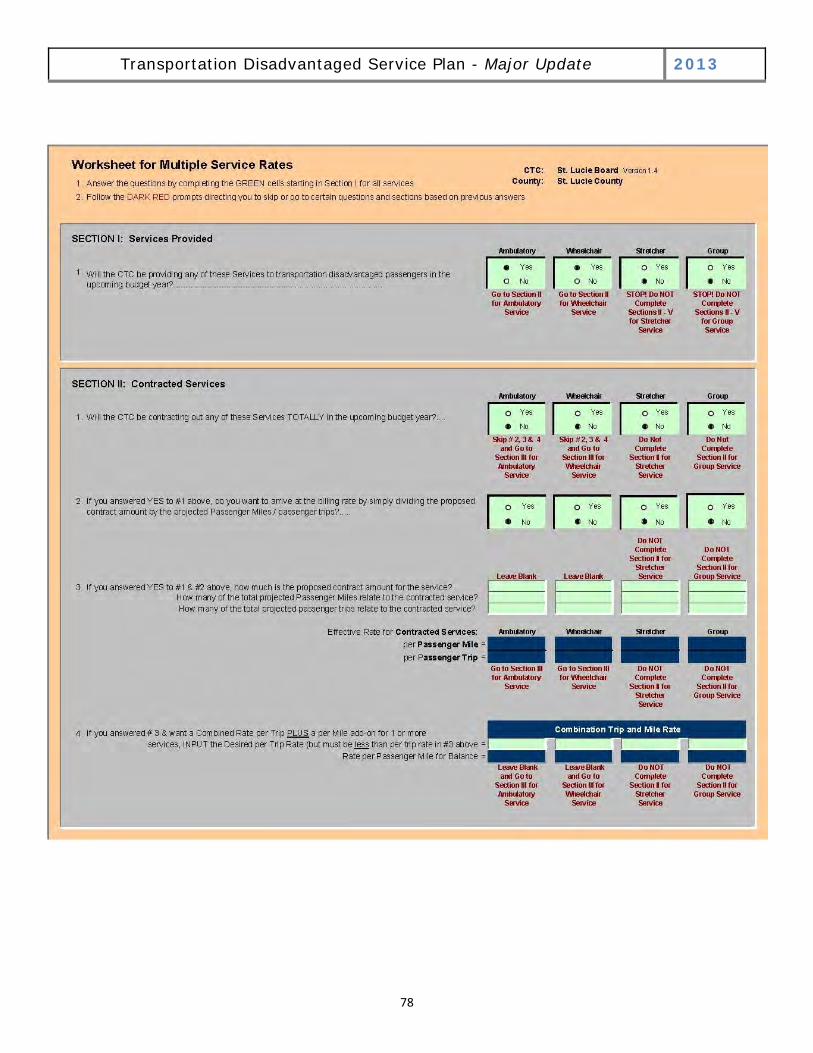
78
Transportation Disadvantaged Service Plan - Major Update 2013
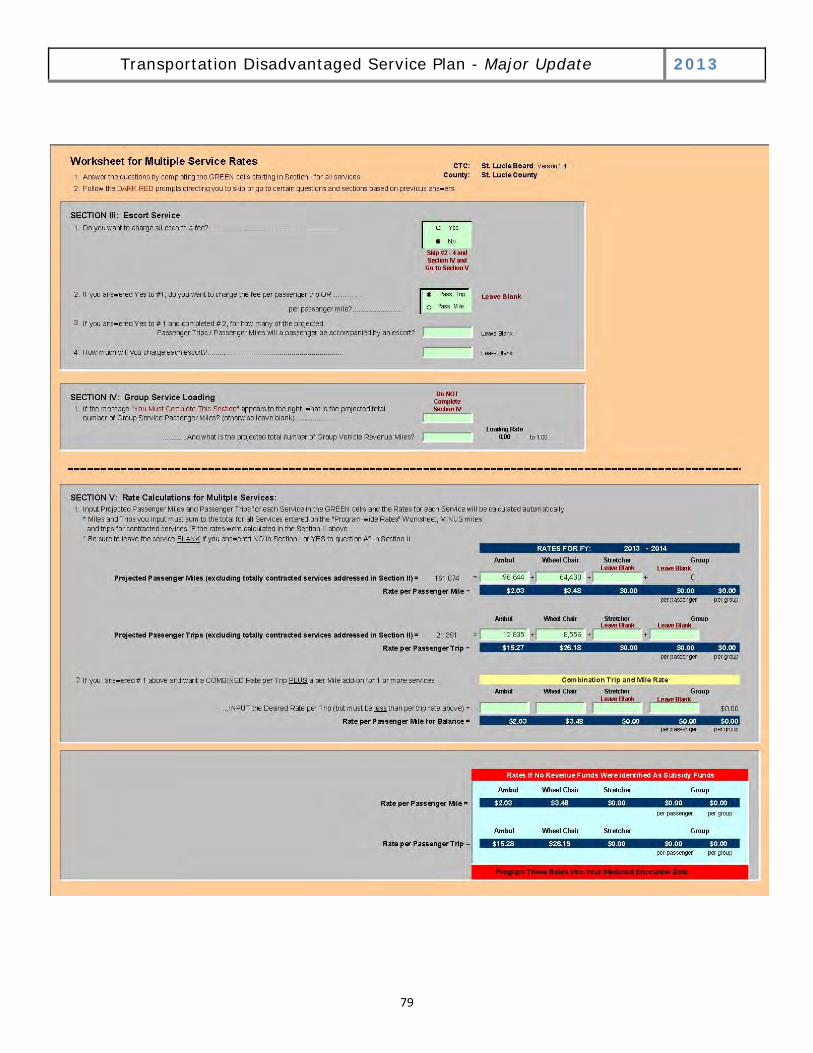
79
Transportation Disadvantaged Service Plan - Major Update 2013

80
Transportation Disadvantaged Service Plan - Major Update 2013
Appendix I
Glossary of Terms and Abbreviations
81
Transportation Disadvantaged Service Plan - Major Update 2013
Glossary of Terms and Abbreviations
The following is derived primarily from a glossary developed by the Florida Commission for the Transportation Disadvantaged to coordinate terminology within the Florida Coordinated Transportation System. ADA (Americans with Disabilities Act): a federal law which provides protection for persons with disabilities. Advance Reservation Service: shared or individual paratransit service that is readily delivered with a least prior day notification. Agency: an official, officer, commission, authority, council, committee, department, division, bureau, board, section, or any other unit or entity of the state or of a city, town, municipality, county, or other local governing body or a private non-profit transportation service providing entity. Availability: a measure of the capability of a transportation system to be used by potential riders, such as the hours the system is in operation, the route spacing, the seating availability, and the pick-up and delivery time parameters. Bus: any motor vehicle designed for carrying more than 10 passengers and used for the transportation of persons for compensation. Bus Stop: a waiting, boarding, and disembarking area, usually designated by distinctive signs and by curbs or pavement markings. CTC (Community Transportation Coordinator): a transportation entity competitively procured or recommended by the appropriate official planning agency and Local Coordinating Board and approved by the FCTD, to ensure that safe, quality, coordinated transportation services are provided or arranged in a cost effective manner to serve the transportation disadvantaged in a designated service area. Chapter 427, Florida Statutes: the Florida statute establishing the Commission for the Transportation Disadvantaged and its duties and responsibilities. Commendation: any documented compliment of any aspect of the coordinated system, including personnel, vehicle, service, etc. Complaint: any documented customer concern involving timeliness, vehicle condition, quality of service, personnel behavior, and other operational policies. Coordinated Transportation System: includes the CTC, the transportation operators and coordination contractors under contract with the CTC, the official planning agency, and Local Coordinating Board involved in the provision of service delivery to the transportation disadvantaged within the designated service area.
82
Transportation Disadvantaged Service Plan - Major Update 2013
Coordinated Trips: passenger trips provided by or arranged through a CTC. Coordinating Board: an entity in each designated service area composed of representatives which provides assistance to the community transportation coordinator relative to the coordination of transportation disadvantaged services. Also referred to as the Local Coordinating Board. Coordination: the arrangement for the provision of transportation services to the transportation disadvantaged in a manner that is cost effective, safe, efficient, and reduces fragmentation and duplication of services. Coordination is not the same as total consolidation of transportation disadvantaged services in any given service area. Coordination Contract: a written contract between the community transportation coordinator and an agency that receives transportation disadvantaged funds and performs some, if not all of, its own services as well as services to others, when such service has been analyzed by the CTC and proven to be a safer, more effective and more efficient service from a total system perspective. The Commission’s standard contract reflects the specific terms and conditions that will apply to those agencies who perform their own transportation, as well as joint utilization and cost provisions for transportation services to and from the coordinator. Critical Need TD Population: persons who due to severe physical limitations or low incomes are dependent upon others for their mobility needs. Demand Response: a paratransit service that is readily delivered with prior notification. Designated Service Area: a geographical area subject to approval by the FCTD which defines the community where coordinated transportation services will be provided to the transportation disadvantaged. Disabled Passenger: anyone with a physical or mental impairment that substantially limits at least one of the major life activities (e.g., caring for one’s self, walking, seeing, hearing, speaking, learning) Emergency: any occurrence, or threat thereof, whether accidental, natural or caused by humans, in war or in peace, which results or may result in substantial denial of services to a designated service area for the transportation disadvantaged. FAC (Florida Administrative Code): a set of administrative codes regulating the state of Florida. FCTD (Florida Commission for the Transportation Disadvantaged): an independent agency created in 1989 to accomplish the coordination of transportation services provided to the transportation disadvantaged.
83
Transportation Disadvantaged Service Plan - Major Update 2013
FDOT (Florida Department of Transportation): a governmental entity. The FCTD is housed under the Florida Department of Transportation for administrative purposes. FS (Florida Statutes): the laws governing the state of Florida. Fixed Route: service in which the vehicle repeatedly follows a consistent time schedule and stopping points over the same route, whereby such schedule, route or service is not at the user’s request (e.g. conventional city bus). General TD Population: all disabled, elderly and low-income persons, and children who are “high-risk” or “at-risk.” Goal: broad conditions that define what the organization hopes to achieve. Grievance Process: a formal plan that provides a channel for the adjustment of grievances through discussions at progressively higher levels of authority, resulting in mediation, if necessary. LCB (Local Coordinating Board): an entity in each designated service area composed of representatives appointed by the official planning agency. Its purpose is to provide assistance to the community transportation coordinator concerning the coordination of transportation disadvantaged services. Also referred to as the Coordinating Board. Local Government: an elected and/or appointed public body existing to coordinate, govern, plan, fund, and administer public services within a designated, limited geographic area of the state. MPO (Metropolitan Planning Organization): the area-wide organization responsible for conducting the continuing, cooperative and comprehensive transportation planning process in a designated area. In some areas this entity is referred to as a TPO (Transportation Planning Organization). Memorandum of Agreement: the state contract between the FCTD and the community transportation coordinator which recognizes the community transportation coordinator as being responsible for the arrangement of the provision of transportation disadvantaged services for a designated service area. Mobility: The ability to move or be moved from place to place.
Mode: A specific form of transportation, such as automobile, walking, bicycle, or bus. Objective: specific measurable conditions that the organization establishes to achieve its goals.
84
Transportation Disadvantaged Service Plan - Major Update 2013
Official Planning Agency: the official body or agency designated by the Florida Commission for the Transportation Disadvantaged to fulfill the functions of transportation disadvantaged planning. Operator Contract: a written contract between the community transportation coordinator and a transportation operator to perform transportation services. Paratransit: elements of public transit that provide service between specific origins and destinations selected by the individual user with such service being provided at a time that is agreed upon between the user and the provider of the service. Paratransit services are provided by sedans, vans, buses, and other vehicles. Prioritization: the process of scheduling TD trips based on availability with preference given to serving riders with life essential needs. Public Transit: the transporting of people by conveyance or systems of conveyances traveling on land or water, local or regional in nature and available for use by the public. Public transit systems may be governmental or privately owned. Purchased Transportation: transportation services provided for an entity by a public or private transportation provider based on a written contract. Ridesharing: the sharing of a vehicle by clients of two or more agencies, thus allowing for greater cost efficiency and improved vehicle utilization. Roadcall: any in-service interruptions caused by failure of some functionally necessary element of the vehicle whether the rider is transferred or not. Roadcalls exclude accidents. Rule 41-2 F.A.C.: the rule adopted by the Florida Commission for the Transportation Disadvantaged to implement provisions established in Chapter 427, F.S. Shuttle: a transit service that operates on a short route or in a small geographical area often as an extension to the service of a longer route. Stretcher Service: a form of non-emergency paratransit service whereby the rider is transported on a stretcher, litter, gurney, or other device that does not meet the dimensions of a wheelchair as defined by the Americans with Disabilities Act. Subscription Service: a regular and recurring service in which schedules are prearranged to meet the travel needs of riders who sign up for the service in advance. The service is characterized by the fact that the same passengers are picked up at the same location and time and are transported to the same location, and then returned to the point of origin in the same manner.
85
System Safety Program Plan: a documented organized approach and guide to accomplishing a system safety program. Transportation Alternative: those specific transportation services that are approved by rule to be acceptable transportation alternatives, and defined in s. 427.018, F.S. Transportation Disadvantaged: those persons, including children as defined in s. 411.202 F.S., who because of physical or mental disability, income status, or inability to drive due to age or disability are unable to transport themselves or to purchase transportation and have no other form of transportation available. These persons are therefore, dependent upon others to obtain access to health care, employment, education, shopping, or medically necessary or life-sustaining activities. Transportation Disadvantaged Service Plan: a plan with annual updates developed by the community transportation coordinator and the planning agency which contains the provisions of service delivery in the coordinated transportation system. The plan shall be reviewed and recommended by the Local Coordinating Board. Transportation Operator: a public, private for profit, or private nonprofit entity engaged by the community transportation coordinator to provide service to the transportation disadvantaged pursuant to an approved coordinated transportation system/transportation disadvantaged service plan. Transportation Operator Contract: the Florida Commission for the Transportation Disadvantaged’s standard coordination/operator contract between the community transportation coordinator and the transportation operator that outlines the terms and conditions for any services to be performed. Unmet Demand: the number of trips desired but not provided because of insufficient service supply. Vanpool: a prearranged ride-sharing service in which a number of people travel together on a regular basis in a van. Vanpools are commonly a company-sponsored van that has a regular volunteer driver. Vehicle Inventory: an inventory of vehicles used by the community transportation coordinator, transportation operators, and coordination contractors for the provision of transportation disadvantaged services. Vehicles: number of vehicles owned by the transit agency that are available for use in providing services. Volunteers: persons who do selected tasks for the community transportation coordinator or its contracted operator for little or no compensation.
Transportation Disadvantaged Service Plan - Major Update 2013
86
Transportation Disadvantaged Service Plan - Major Update 2013
Appendix J
TDSP/Coordinated Plan Certification
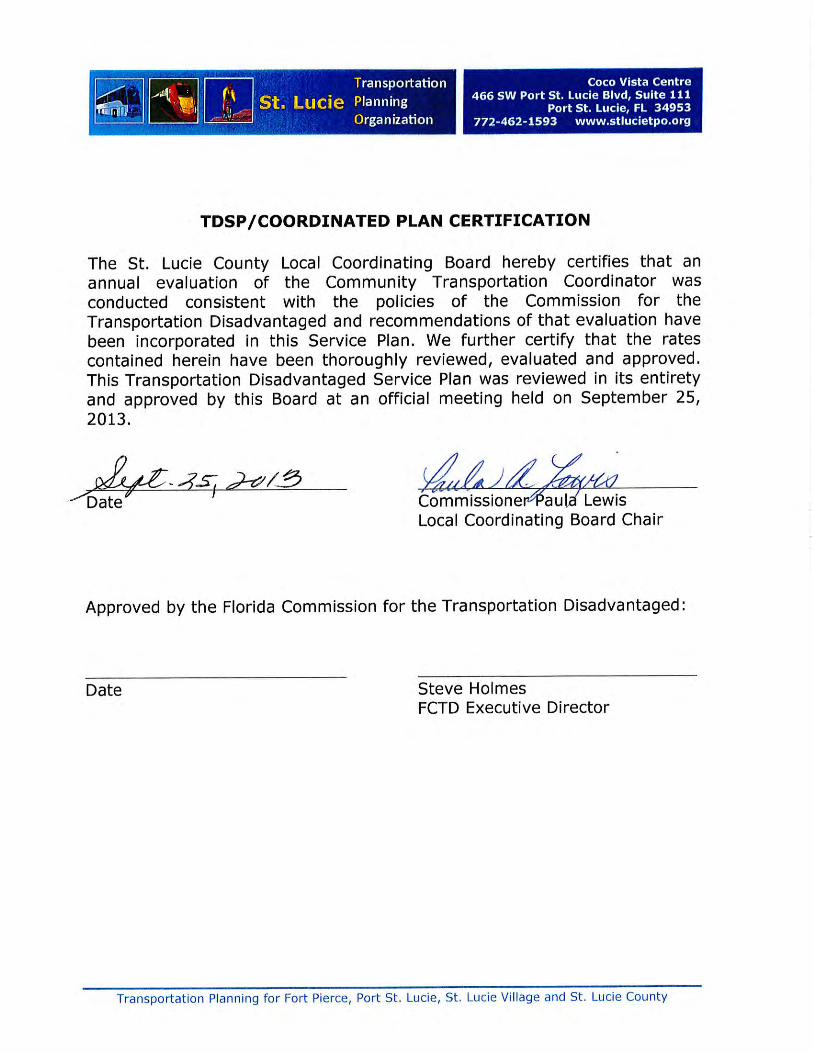
88
Transportation Disadvantaged Service Plan - Major Update 2013
Appendix K
TDSP/Coordinated Plan
Local Coordinating Board Roll Call Vote
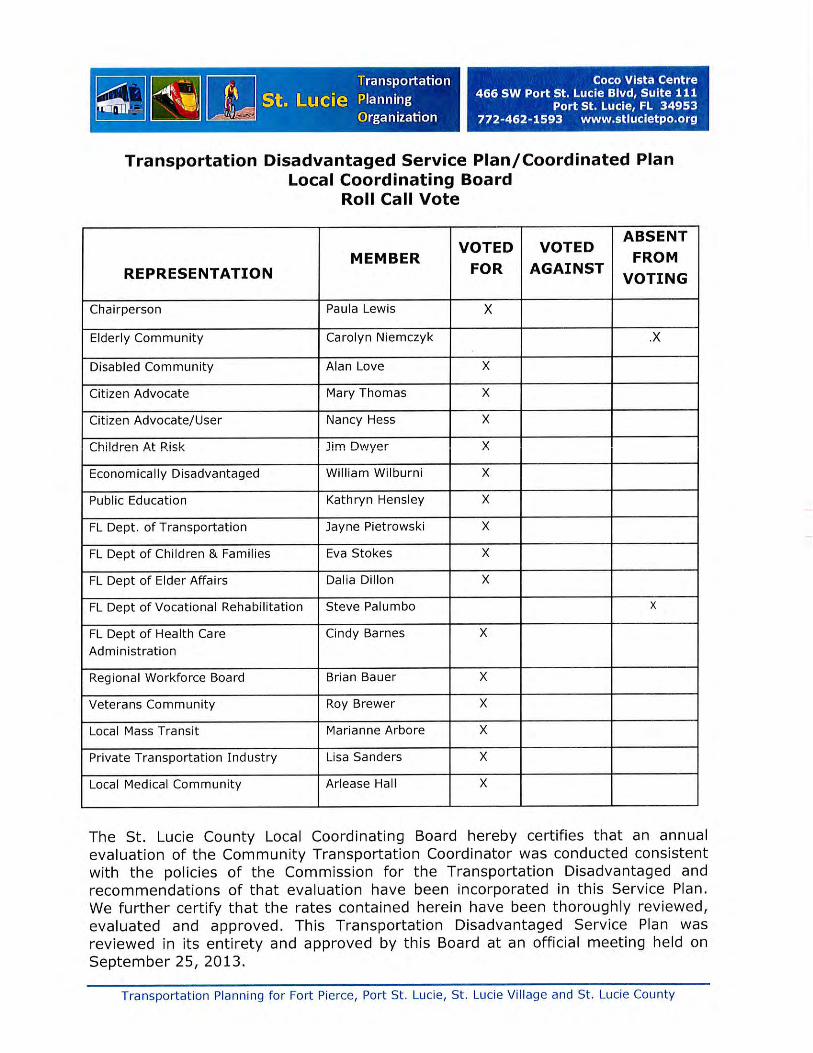
90
Transportation Disadvantaged Service Plan - Major Update 2013
Appendix L
St. Lucie County Local Coordinating Board Membership Certification