Fort Bend ISD Education Staffing ..... 19 Child Nutrition ..... 21 Operations and Facilities ........
91
HR Services Texas Association of School Boards S TAFFING R EVIEW Fort Bend ISD January 2010
-
Upload
duongxuyen -
Category
Documents
-
view
214 -
download
0
Transcript of Fort Bend ISD Education Staffing ..... 19 Child Nutrition ..... 21 Operations and Facilities ........

HR Services Texas Association of School Boards
STAFFING REVIEW
Fort Bend ISD
January 2010

Staffing Review Fort Bend ISD

Table of Contents Background and Overview ................................................................................................... 6 Summary Findings ................................................................................................................. 8 Operations Findings .............................................................................................................. 9 Instructional and Administrative Support Staff ............................................................... 10 Elementary School Teachers............................................................................................... 13 Middle School Teachers ...................................................................................................... 14 High School Teachers .......................................................................................................... 16 Special Education Staffing .................................................................................................. 19 Child Nutrition ..................................................................................................................... 21 Operations and Facilities .................................................................................................... 22 Human Resources ................................................................................................................ 23 Data Tables Staffing School Staffing Compared to SACS Standards .......................................................... 26 School Staffing Compared to Common Practice in Texas ......................................... 29 Elementary Campus Paraprofessionals: Current ...................................................... 32 Elementary Campus Paraprofessionals: Proposed .................................................... 34 Secondary Campus Paraprofessionals: Current ........................................................ 36 Secondary Campus Paraprofessionals: Proposed ...................................................... 37 Non-Campus Clerical Support ..................................................................................... 38 Campus Clinic Staffing ................................................................................................. 39 Professional and Administrative Support Positions ................................................... 40 Class Size Current Sections with Elementary Enrollment .......................................................... 42 Proposed Sections with Elementary Enrollment ........................................................ 46 Elementary School Physical Education ....................................................................... 50 Middle School Class-Size Comparisons (1–4) ............................................................. 51 Middle School Class-Size Comparisons (5–8) ............................................................. 52 Middle School Class-Size Comparisons (9–12) ........................................................... 53 Middle School Class-Size Comparisons (13 and District Averages) ......................... 54 High School Class-Size Comparisons (1–4) ................................................................. 55 High School Class-Size Comparisons (5–8) ................................................................. 56 High School Class-Size Comparisons (9–10 and District Averages) ......................... 57 High School Athletic Period Class Counts .................................................................. 58 Middle School Electives (1–5) ...................................................................................... 59 Middle School Electives (6–10) ..................................................................................... 60 Middle School Electives (11–13 and District Averages) ............................................. 61 High School Elective Class Count Comparisons (1–6) ............................................... 62 High School Elective Class Count Comparisons (7–10 and District Averages) ....... 63 Current Secondary Campus Enrollment .................................................................... 64 Current HS & MS Staff Balance Total in grades 6–12 .............................................. 65

Current HS & MS Staff Balance Total in grades 6–8 & 9–12 ................................... 66 Middle School Enrollment 7/6 Master Schedule ........................................................ 67 Middle School Enrollment Growth, Impact on Class Averages ................................ 68 Current High School Staff Balance .............................................................................. 69 High School Enrollment 7/6 Master Schedule ............................................................ 70 High School Enrollment Growth, Impact on Class Averages ................................... 71 Special Education Staffing by Program ...................................................................................................... 73 Special Education Enrollment by Campus .................................................................. 77 Assessment and Speech Pathology ............................................................................... 79 Support Staff Meals per Labor Hour (MPLH) Report ...................................................................... 81 MPLH Staffing Recovery .............................................................................................. 83 Maintenance Staffing Compared to APPA Standards ............................................... 85 Custodial Staffing Compared to ASBO Standards .................................................... 86 Peer District Comparisons Comparison of 2007–08 AEIS Data Sets...................................................................... 89 Comparison of 2008–09 AEIS Data Sets...................................................................... 91

Staffing Review 6 Fort Bend ISD Copyright 2010 TASB HR Services
Background and Overview
Background
This Staffing Review project was completed during the first semester of the 2009–10 school year. The analysis involved a combination of interviews with key staff members along with the collection and review of several data sets. The work was completed by Richard Lane, a contract consultant with TASB Human Resource Services.
Data Sources
Individual interviews were conducted on November 18–20, 2009, with Senior Leadership Team members Robert Calvert, Ben Copeland, Dr. John Frossard, Dr. Olwen Heron, Tracy Hoke, Mike McKie, Rhonda McWilliams, Dr. Mark Smith, and Dr. Susan Wey; Executive Director Tim Castilaw; Directors Dr. Bob Conlon, Lynn Guidry, Dr. Mary Jackson, Keith Kilgore, and Gail Stotler; all secondary principals, and twenty-two of forty-four elementary principals. Several follow-up interviews, e-mail exchanges, and telephone conferences were held from November 23 through January 15 to clarify issues and to provide additional specific information. Data was compiled from multiple sources. Interviewees completed detailed questionnaires related to staffing issues in their area of responsibility. The Chief Financial Officer and the Chief Human Resources Officer provided detailed information containing Public Education Information Management System (PEIMS) print-outs, completed questionnaires, employee assignment data for the district, a set of position control files to confirm assignments, and copies of master schedules. An additional data source was reviewed. Academic Excellence Indicator System (AEIS) print-outs from the 2007–08 and 2008–09 school years, the most recent information available, were used to compare Fort Bend ISD staffing with a group of peer districts. This group was composed of the Conroe, Katy, Lewisville, North East, Northside, and Plano school districts. Spreadsheets detailing the comparisons on several key measures can be found in the appendices of this report.
Benchmarks
The analysis done in this report involves comparing staffing data to various benchmarks, or standards. The most frequently used comparisons are made to Common Practice in Texas (CPTx). As the title implies, these standards represent staffing averages gleaned (by the analyst) from 15 years of experience in this type of procedure, involving nearly 200 individual public school districts. Additionally, these values are updated annually to provide the most current comparisons possible. Another set of standards has already been mentioned. The Texas Education Agency (TEA) annually publishes Academic Excellence Indicator System (AEIS) data for every school system and campus in Texas. The information becomes available on or about December 1 of each year. The raw data provided by TEA has been processed by the analyst to develop staffing averages for various types of positions. Where appropriate, these averages can allow comparisons with individual peer groups (as listed above) or with the broad range of districts across the state. Finally, occasional references are made to accreditation standards developed by the Southern Association of Colleges and Schools (SACS). These standards are well-known throughout public schools, having been used for many years in school accreditation studies. For a period of time, they were

Staffing Review 7 Fort Bend ISD Copyright 2010 TASB HR Services
also used as the basis for comparison in the Texas School Performance Review (TSPR) reports conducted by the State Comptroller’s Office. These guidelines are understood by school administrators to be extremely conservative. They represent minimum accreditation guidelines, and were never proposed as operational staffing levels by SACS.
Rationale for Findings
A summary of key findings follows this section. A more detailed analysis of each finding is described in the report for each functional area. Supporting data tables are located in the appendices. Three types of findings are reported: Cost Savings, Cost Avoidance, and Operational Suggestions. Cost savings identify expenditures that can be reduced in current or future budgets. Cost avoidance identifies items that would normally increase in future budgets, but whose growth can be reduced or eliminated. Operational suggestions refer to practices that could refine district operations, but will not directly impact the budget. The procedure used in this type of analysis is to compare district staffing to the benchmarks referenced above. Alternatives are then suggested when district practices have established staffing levels in excess of those benchmarks. This analysis will point out that Fort Bend ISD is operating at, or near, state-wide staffing averages. Some programs have been expanded to meet student needs. If not for the systemic underfunding of public schools by the state, Fort Bend ISD could continue with current practices. Changes in enrollment, fluctuations in appraised values, and the uncertainties of state and federal funding, have had a significant impact upon Fort Bend ISD finances. Many of the options in this report deal with the financial impact of current practices. The emphasis of this analysis has been to seek solutions allowing the district to avoid budget deficits and/or implement program changes. The options enumerated in this report do not imply that any current Fort Bend ISD practices are improper. In many cases, the district has made a conscious choice to operate in a certain manner because the practice in question best served students or the needs of a particular program at a given point in time. The findings in this report are made in the spirit of identifying options for possible consideration. If the district decides to continue a particular current practice, that decision can be made with full knowledge of the choices at hand. Fort Bend ISD School Board Trustees and Administrators have actively sought to control expenditures. While economic options have been identified in this report, the actions suggested also have instructional implications. Adjustments in staffing have inevitable consequences in the service model for students. Absorbing some portion of the projected enrollment increase and/or staff vacancies will definitely result in increased class counts. The task will be to balance the instructional and financial issues to reach the best operating practices for the district, its students, and the community at large. It should be noted that this study represents a snapshot in time. The primary data sets were pulled in November of 2009. Enrollment in Fort Bend ISD historically decreases through the winter and spring months. Thus, the student counts listed in the data tables might have changed from the original submissions. It may be useful to consider staffing based upon the average enrollment throughout the school year, rather than emphasize the maximum enrollment in October/November. This is particularly significant for high schools, where peak student counts tend to be short-lived. Also, to a smaller extent, changes do occur in staff due to resignations and retirements. These adjustments are an unavoidable issue in the analysis of all fast growth districts.

Staffing Review 8 Fort Bend ISD Copyright 2010 TASB HR Services
Summary Findings
Cost SavingsInstructional and Administrative Support Staff Absorb up to13 non-campus clerical positions Absorb up to 74 professional support positions Consider revised clinic staffing model, expanding LVN usage
413,200 5,005,300
933,300 Elementary School Teachers Absorb 24 elementary positions, taking class averages from 19.9 to 20.2 Shift to PE staffing model using one teacher and one or more aides per campus
1,275,900
316,900
Middle School Teachers Shift to 7/6 schedule, absorbing up to 59 teacher vacancies (class size goes from 22.2 to 24.0)
3,136,700
High School Teachers Staff based upon a 7/6 schedule and absorb up to an additional 100 positions (class size goes from 23.1 to 24.0)
5,316,000
Special Education Staffing Absorb up to 100 teacher and 50 aide vacancies Absorb up to seven diagnostician vacancies
6,437,800 437,500
Child Nutrition Staffing Absorb up to 230 hours of food service worker positions 481,100
Total Potential Savings
$23,754,300

Staffing Review 9 Fort Bend ISD Copyright 2010 TASB HR Services
Operations Findings Instructional and Administrative Support Staff Continue to use support positions (Deans, CISs, Data Specialists, etc.) to balance shortfalls in APs and counselors
Consider adding 7.5 elementary campus clerks
Elementary School Teachers Consider use of one or more surplus positions for targeted interventions
Middle School Teachers Continue present efficient staffing practices in ISS and CAEP Consider use of one or more surplus positions for targeted interventions
High School Teachers Continue current practice, emphasizing the need for new coaches to hold academic certifications
Continue present efficient staffing practices in ISS and CAEP Consider moving to 24.0 class size in elective courses Consider reassignment of one or more positions for targeted interventions
Special Education Staffing Continue documentation of required interventions prior to initiating referrals Continue to allot carry-over federal funds for residential placements
Child Nutrition Staffing Review free/reduced service data to seek additional student breakfast meals Continue to pro-rate all utility, payroll, casualty insurance, equipment purchase, kitchen renovation, and kitchen construction costs to child nutrition fund balance
Facilities Staffing Continue to monitor contract services for tasks that can be brought back into maintenance and operations, at a net saving in expense
Consider implementation of 11:00 a.m. to 7:00 p.m. maintenance shift for up to one-half of maintenance staff
Human Resources Staffing Release new and replacement positions for hire in March-April Consider implementing “Early Notification” stipend in Spring 2010 Expand the “Ready, Set, Teach” program as a “Grow Your Own” program for minority and bilingual recruitment through college/Fort Bend ISD partnerships

Staffing Review 10 Fort Bend ISD Copyright 2010 TASB HR Services
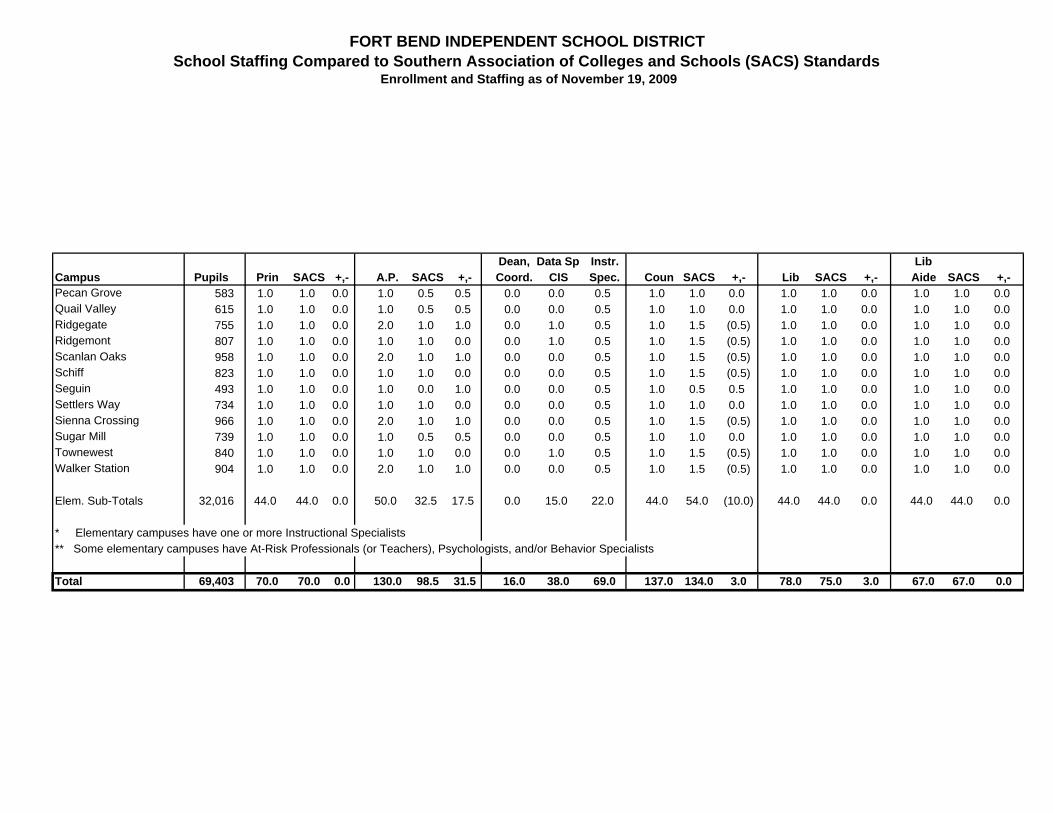
Instructional and Administrative Support Staff Staffing assignments for the positions of principal, assistant principal, counselor, librarian, and
library aide have been compared with two sets of standards. The Southern Association of Colleges and Schools (SACS) standards are well-known throughout public schools, have been used for many years in school accreditation studies, and have been used as the basis for comparison in the Texas School Performance Review (TSPR) reports. These guidelines are understood to be extremely conservative. Additionally, staffing figures for each of the listed positions have been compared with benchmarks reflecting current practice in Texas (CPTx) public school districts. These are voluntary standards, since they have not been specifically funded by the Legislature.
Instructional expectations in Texas public schools would be very difficult to meet with SACS
staffing levels alone, particularly in the case of a fast-growth district increasing by approximately 600 students per year. The applicable SACS guideline is one assistant principal for each 500 secondary students. This standard is very conservative. SACS standards for elementary campuses are even more conservative than at the secondary level; one assistant principal for each 700 elementary students. Currently, the District is staffing 31.5 positions over SACS guidelines for assistant principal (AP) positions.
The comparable Texas current staffing practice (CPTx) is one assistant principal for each 450
students, including both elementary and secondary schools. The Fort Bend ISD overall ratio is one AP per 533 students. The individual campus ratios in Fort Bend ISD are one position per 499 high school students, one position per 449 middle school students, and one position per 640 elementary students. Overall, the district is staffing 24 positions under the CPTx assistant principal benchmark.
In addition to assistant principal positions, Fort Bend ISD staffs Deans and Coordinators (16
positions) at secondary campuses, as well as Campus Improvement Specialists (CIS), Data Specialists, and Instructional Specialists (IS) (80 positions). At the elementary campuses, 37 specialist positions are staffed. These 133 positions, combined with the 130 assistant principal slots, have allowed the District to place significant emphasis on the campus instructional programs, resulting in consistent increases in student performance. However, the combination has the district operating at 109 positions over the assistant principal benchmark. These support positions will be re-visited later in this section of the report.
Fort Bend ISD staffs three counselor positions over the SACS standard on a district-wide basis, and
37.5 positions under the CPTx (common practice) benchmark in Texas. The applicable guidelines are one counselor for each 500 secondary students and one counselor for each 700 elementary students (SACS); or one counselor for each 400 students (CPTx). The district is currently staffing at a ratio of 507 students per counselor, overall. The individual campus counselor ratios in Fort Bend ISD are one position per 440 high school students, one position per 413 middle school students, and one position per 728 elementary students.
Considering the common practice benchmark for counselors, the combined 31 Fort Bend ISD
secondary campuses and alternative sites are in balance at the benchmark level. The elementary campuses are 35.5 positions short. The district does staff At-Risk professionals/teachers, psychologists, and behavior specialists to assist in this area. However, 22 of the slots are assigned at the elementary campuses, leaving the whole group 13.5 positions short of full coverage. While covering the needs at 18 campuses, the practice results in 26 of the 44 elementary sites being at least 0.5 positions below benchmark levels in counseling services.

Staffing Review 11 Fort Bend ISD Copyright 2010 TASB HR Services
Texas Common Practice Standards (CPTx) seek to have a full-time librarian and one library aide at each campus. High school campuses generally add a second librarian and aide at 2,000 students. The district meets the first phase of this benchmark, currently staffing at two librarians per high school and one librarian at all other standard campuses. Presently, one library aide is staffed at each school. This practice meets the second phase of the benchmark at all middle and elementary campuses, and is one aide short at eight of the ten high schools. As the Texas benchmark is voluntary, the district is not out of compliance and can certainly continue with the current economical format for high school libraries.
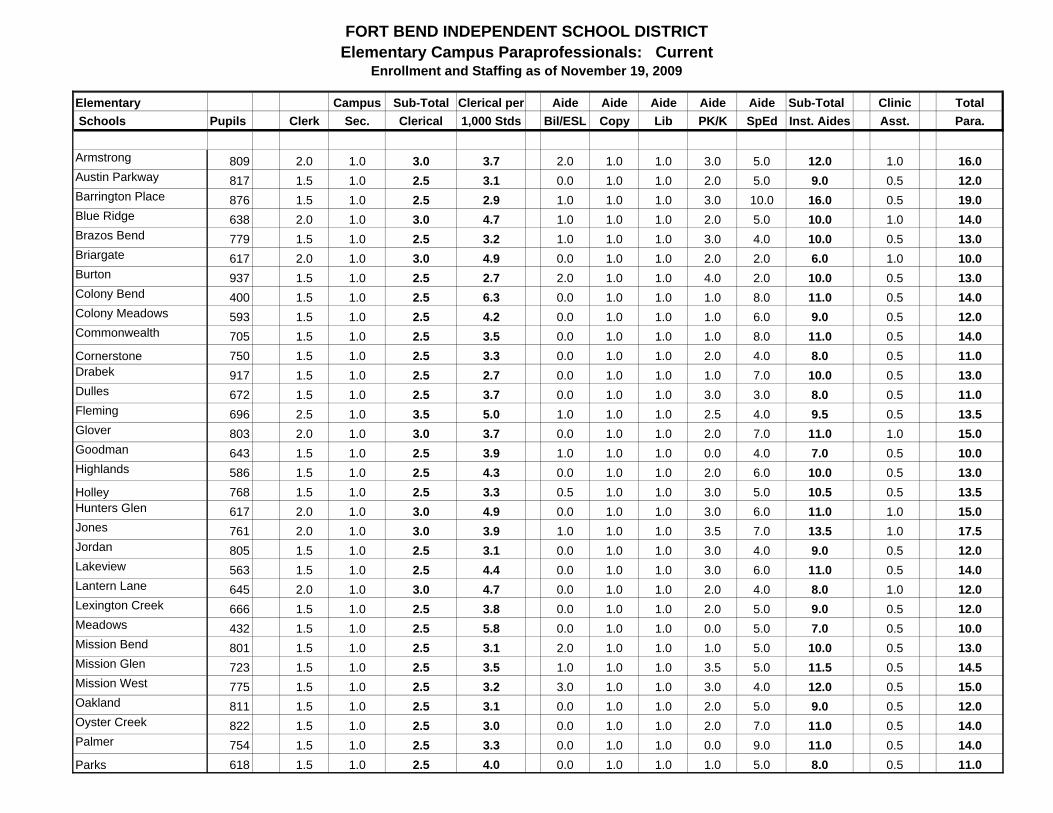
Common practice observed in Texas public schools involves staffing 5.5 clerks and/or secretaries
per 1,000 students at secondary campuses, with a minimum of three positions. The corresponding figure at the elementary level is 4.5 clerks per 1,000 students, with a minimum of two positions. A review of campus clerical staffing indicates that the district is 7.5 positions short of the benchmark at the elementary schools, and at benchmark at the secondary schools. (Some existing imbalances within the secondary campuses could be corrected through reassignments.) The shortages at the elementary level occur primarily at the schools with enrollments of 750+ students. Four spreadsheets detailing this issue can be found in the appendices of this report.
The District currently staffs 706 instructional aides. Staffing at the state benchmark of 13.4 aides
per each 1,000 students would lead to 923.1 instructional aides. Thus, the District is staffing very efficiently at 217.1 positions under the benchmark value. No further adjustments are recommended and the current economical format could be continued.
Currently, 152 clerical support positions are staffed at central administrative offices. These
positions include secretaries, clerks, and specialists. Common practice is 2.0 of these positions per 1,000 students, or 138.8 positions in Fort Bend ISD based on current enrollment. Thus, the staffing of these positions in Fort Bend ISD is 13 positions over the benchmark. Absorbing up to 13 of these surplus positions would result in a cost savings of $413,244 in salary and benefits expenses.
The District currently staffs 71 Registered Nurses (RNs) at a total cost of $4,009,086. Shifting the
staffing model to 15 RNs and 71 LVNs would result in a cost savings of $933,393 in salary and benefits. In the new model, an LVN would be assigned to each campus and a single RN would supervise up to 5 LVNs. The LVNs are licensed and can perform all necessary functions under the supervision of a RN. The RN would spend one day per week at each of the five campuses, providing training and supervision. In an emergency, the RN could come to the campus in need. Also, the high school trainers could be added to the emergency response team.
The PEIMS categories for non-classroom support supervisory and administrative positions include
Professional Support (counselors, diagnosticians, curriculum/instructional specialists, technicians, coordinators, etc.), Campus Administrators (principals, assistant principals, deans, program directors, etc.), and Central Administrators (superintendent, departmental directors, etc.). The district is staffing 1,246.7 of these positions in 2009–10, compared to a state average of 1,167.3 positions for a district of this enrollment. Thus, Fort Bend ISD is operating at 74.4 positions over common practice in Texas.
Staffing Review 12 Fort Bend ISD Copyright 2010 TASB HR Services
As was indicated in an earlier bullet, the wide range of campus level support positions helped to
balance the shortfalls in assistant principal and counselor positions, even to the point of resulting in surpluses to those two benchmarks. However, these support positions are definitely considered in the PEIMS analysis listed in the prior bullet. Absorbing up to 74 of these surplus positions, would result in a cost savings of $5,005,360 in salary and benefits.
While additional support could always be used, the Technology group is appropriately staffed for
current operations. The new Chief Information Officer and his staff have been working to reorganize operations, emphasizing long term problem solving techniques and developing an accurate tracking process for work orders. A difficult issue on the administrative operations side has been a problematic installation of the “People Soft” operating system. If anomalies can not be resolved by individual actions, a full re-install is being considered. Instructional Technology is a shared responsibility between the department, curriculum, and the campuses. Instructional Technology Specialists (ITSs) are staffed at the campus level to lead leaders in the integration of technology into classrooms on a daily basis. There is some concern on the part of the department that these ITSs are, at times, pulled from their core responsibilities to assist with other campus duties.
Principal interviews produced the following consensus positions. First, principals at all levels are
extremely supportive of the efforts of the central office staff. The timeliness of services and the quality of support are greatly appreciated. Second, they almost unanimously expressed a need for positions (professionals or aides) to address necessary student academic interventions. Third, they request that new and replacement positions be released for hiring by April. Applicant quality begins to drop significantly in late June, and minority applicants are hard to find year-round. Finally, principals were near unanimous in their appreciation of their campus-based instructional support positions (Deans, CISs, etc). They requested that these positions remain, and that district-wide slots be absorbed if adjustments needed to be made.
Total cost savings options in this area: $6,351,800.

Staffing Review 13 Fort Bend ISD Copyright 2010 TASB HR Services
Elementary School Teachers
Fort Bend Elementary Schools have an enrollment of 32,016 students, with 30,976 of these students
in Regular Education or Bilingual Education sections. Currently, class averages run 19.4 in grades K–4 and 19.9 across all classrooms in grades PK through 5. Statewide, total elementary school class averages typically run in the 19.5 to 20.5 range. Thus, Fort Bend ISD operates at the lower edge of the benchmark range.
There are twenty-four (24) surplus sections at the campuses in 2009–10, out of a total of 1,555 classrooms. This amounts to only 1.5% of the total number of classrooms, a remarkable achievement in efficient scheduling. The details are shown in eight accompanying spreadsheets in the appendix of this report. These 24 sections could be absorbed without exceeding the 22:1 class-size limit at grades K–4. In theory, absorbing these positions could provide the district a cost savings of up to $1,275,900 in salary and benefits. The reduction of these positions could be accomplished in 2010–11 by absorbing normal vacancies and/or through reassignments. This is the current operating practice of the district. (Concerning the present year, the District’s practice is to leave these positions in place, since adjusting classes after the first two weeks of school can be a significant disturbance to students, staff, and parents. This is a very reasonable policy. Also, these sections allow Fort Bend ISD to absorb additional elementary students throughout the current school year.) If the decision is to keep a smaller class size at particular grade level, one or more of these 24 sections could continue to be offered. Each section retained would reduce the savings by $53,166 in average salary and benefits costs.
Another option for one or more of the 24 positions discussed above would be to use the available
slots to address the principals’ concerns for additional intervention specialists. While regular class size would be increased to free these teacher positions, some or all of the slots involved could be reassigned to small-group intervention roles for students with specific instructional needs.
If the decision is made to retain the surplus sections, another approach to “targeted intervention”
can be used. For example, consider the 4th grade at Schiff Elementary School with 140 students and 8 teachers. Rather than having 8 similar sections at or near the average of 17.5 students, 130 of the students could be assigned to 7 sections averaging 18.6 students, with the remaining 10 students assigned to a single section. This would allow significantly more direct instruction with the 10 students most in need of assistance at this grade level.
The current practice in Fort Bend ISD is to assign multiple PE teachers to elementary schools,
rather than using PE Aides. Each elementary campus certainly needs one fully-certified PE teacher. However the second person in the program could be an aide. The total number of persons in the program would remain the same, so no drop in supervision levels would occur. In addition, the aide(s) would not require a conference period, allowing the principal more flexibility in assignment of duty, etc. Based upon current compensation practices, shifting to this staffing model would result in a cost savings of $316,904 in salary and benefits costs.
Total cost savings options in this area: $1,592,800.

Staffing Review 14 Fort Bend ISD Copyright 2010 TASB HR Services
Middle School Teachers
Eleven Fort Bend middle schools currently operate on a seven-period master schedule, with students taking seven classes per day. Teachers instruct six classes per day, with one conference period. This type of schedule is the most efficient one commonly in use in Texas public schools.
Dulles Middle School and Missouri City Middle School use eight-period master schedules. Core subject teachers instruct six classes, with one conference period and one additional period for academic teaming. Elective teachers instruct seven classes per day, with one conference period. While this type of master schedule has instructional advantages, it is not a particularly efficient master schedule format from staffing and class size perspectives.
Total counts at the middle schools are 15,262 students and 801.6 teachers. The total teacher count includes all teachers, except those in special education assignments. The theoretical class average is 22.2 students per class, based upon a 7/6 master schedule. The mathematical staffing formula corresponding to this data is (1.167 x students)/22.2 = Full-Time Teacher Equivalents (or FTEs).
Statewide, middle school class sizes typically run 22–24 students per class. Based upon current
enrollment and staff, Fort Bend ISD middle schools average 22.2 students per class using a 7/6 schedule. Thus, the class sizes would be at the lower end of standard practice range, allowing the District to absorb increasing enrollment and/or teaching vacancies at these grade levels.
The Fort Bend ISD guidelines use slightly different staffing ratios for middle school teachers,
depending on the percentage of low socioeconomic status (SES) students at each campus. This variation, along with the fact that campuses may or may not meet their projected enrollment growth, causes campuses to have different theoretical class sizes. The district should continue the current practice of making adjustments in allotments for the following school year, but leaving the current year assignments in place to maintain existing master schedules.
Garcia, McAuliffe, Missouri City, and Sugar Land middle schools are staffed at theoretical
averages of 23.3, 16.7, 22.4, and 22.6 students per class, respectively. Their actual class averages in core academic subjects are all equal to or lower than their own theoretical average. The fact that their core averages are at or below their theoretical averages is evidence of balanced master schedules. These principals are making use of larger elective classes to keep their core class as small as possible. The other nine middle schools have core averages from 0.6 to 2.1 students per section greater than their own theoretical averages. Their schedules are “upside down” compared to the balance shown at the four middle school campuses listed above.
The ISS classrooms are currently being served by paraprofessional coordinators, rather than
teachers. Assigning all available certified teachers to academic assignments results in the lowering of core class averages. This is a definite help to principals in the balancing of their schedules.
The district has been providing for a Campus Alternative Education Program (CAEP) at each middle school, staffed by a paraprofessional and using a certified teacher position paid with Compensatory Education funds. The teacher unit is needed since students are assigned to CAEP for longer periods of time and require formal instructional support. The CAEP format was developed as part of a progressive discipline program with the goal of retaining students on their home campuses, rather than immediate assignments to the District-wide AEP. The district will open a second DAEP in the 2010-11 school year. As part of the planning for bringing this facility on-line, analysis and

Staffing Review 15 Fort Bend ISD Copyright 2010 TASB HR Services
evaluation of the discipline alternatives is certainly appropriate. The interrelated use of ISS rooms, CAEPs, the original M.R.Woods program, and the new DAEP involve a wide range of options. The development of a formalized set of guidelines for the use of those options could help to insure that the actions taken are both on-target for modifying behavior, as well as cost-effective.
Elective classes at the middle schools are averaging 23.3 students per section, compared to an
average of 23.3 in core academic classes. (The state-wide benchmark for middle school electives is 24 students per section.) Larger elective classes would contribute to smaller core classes, and assisting in reaching instructional goals in the core subjects.
Shifting to a uniform 7/6 master schedule format would be an attractive alternative, at least for the calculation of staff. Once staffing levels were determined, each campus could operate on their preferred schedule, with the understanding that the use of less efficient schedule formats would result in larger class sizes.
Using a 7/6 format and adjusting staffing to a class size of 24.0 students per section (at the top of the
benchmark range) would allow the absorption of 59 vacancies across the thirteen middle schools. This option would result in a cost savings of up to $3,136,794 in salary and benefits costs. As with the discussion in the prior section, one or more of these slots could be retained to address the needs for targeted intervention at these grade levels.
Total cost saving options in this area: $3,136,700.

Staffing Review 16 Fort Bend ISD Copyright 2010 TASB HR Services
High School Teachers Eight Fort Bend High Schools operate on a seven-period master schedule. Students take seven
classes per day. At Bush High School, teachers instruct six classes per day and have one 50-minute conference period per day. Again, this is the most efficient master schedule currently in use, from a class size perspective.
At seven other high schools using the seven-period day, core academic teachers instruct five classes per day and have one 50-minute conference period and one 50-minute academic teaming period. Elective teachers instruct six classes per day and have one conference period. As with the Middle Schools, this is an inefficient master schedule, considering average class size for a constant number of teacher positions.
Hightower High School and Marshal High School use AB block schedules, with students having four classes per day. Teachers instruct three classes and have one 90-minute conference period, daily. Again, while this schedule may have instruction advantages, it is inefficient considering class size and conference time.
Total counts at Fort Bend High Schools are 21,958 students and 1,168.1 teachers. The total teacher count includes all teachers, except those in special education assignments, the athletic trainers, and the head football coaches. The “average teacher” instructs 5.688 classes. The theoretical class average is 23.1 students per class. The mathematical staffing formula corresponding to this data is (1.231 x students)/23.1 = Full-Time Teacher Equivalents (or FTEs). (Class size at the high school sites would drop to 21.9 if 7/6 schedules were used with the current staff. Using an 8/7 schedule would drop class size to 21.5 students per class.)
Fort Bend ISD operates three additional campuses; the M.R. Wood AEC, the Progressive High
School, and the Technology Center. At the first two sites, the instructional needs of the specific populations can not be served with the same staffing ratios as the main campuses. A degree of “surplus staffing” is required at these two sites to reach the academic needs of the students and the goals of the District. The Technology Center (TC) offers 2-period and 3-period vocational programs. Students attend their home campus for all other courses, attending the TC for their vocational specialty. In theory, the TC should be able to maintain regular class averages by bringing in students from all 10 regular high school campuses. In practice, actual class size averages 16.4 students per section. The district will have to decide whether to continue to support the relatively small enrollment at this site. If active recruitment for 2010–11 cannot yield averages in the 20–22 range, it may be necessary to move the individual programs to “satellite” or “magnet” locations throughout the district. This is a difficult decision since these programs tend to require specialized labs and/or equipment.
As with the middle schools, Fort Bend ISD staffing guidelines provide slightly different ratios for
high school teachers, depending on the percentage of low SES students at each campus. This variation, along with the fact that campuses may or may not meet their projected enrollment growth, leads campuses to have different theoretical class sizes. Again, adjustments are made in allotments for the following school year, but the current year assignments are left in place to maintain the flexibility of existing master schedules.

Staffing Review 17 Fort Bend ISD Copyright 2010 TASB HR Services
Nine of ten high schools have average core class sizes larger than their theoretical averages. Thus, all
the schedules are considered to be unbalanced. Only at Willowridge High School are the core class sizes (21.5) smaller than the theoretical average (23.1).The major factors inhibiting balance at the high school campuses are the smaller athletic period and elective class sizes.
If multiple coaches are assigned to an athletic period, the load per coach should at least approach the
average class counts in the rest of the master schedule. Any coaches in excess of this staffing level should be assigned an academic class, rather than an athletic period. Currently, athletic periods at Fort Bend High Schools are staffed at an average of 16.9 athletes per coach. This compares with the core academic average class sizes of 21.5 to 25.1 students per section. While the athletic period average is well under the core class size, it is within the benchmark of 15–17 athletes per coach commonly in use in Texas high schools.
To reach the flexibility of coaching assignments discussed above, it is important that the majority (if not all) of the coaching staff hold academic certifications. Presently, 121 (45%) of the 270 high school coaches are assigned to Health/PE or Social Studies. Current practice is to reserve six assignments (three female and three male) for Health/PE. Administrators seek to staff other coaching positions with core certifications. To that end, new coaches should not be hired unless academically certified in areas other than Health/PE or Social Studies and current coaches should be encouraged to add academic certifications through testing.
Overall, electives average 20.1 students per section at the high school campuses. (A reasonable
target level would be 24 students per class.) Fine Arts classes average 18.3 students per class. Vocational courses taught at the campus level average 22.4 students per section. This compares with core academic averages of 21.5 to 25.1 students per class. Elective and/or Health/PE vacancies could be absorbed. This action would have only minimal impact on program offerings for students. Another alternative would be to condense small elective sections at the high schools, using the elective staff freed in this manner to teach any core academic classes for which they were certified, to assist in providing targeted intervention to high school students with academic needs, or to offer individual elective sections at the middle schools (building their potential high school enrollments in the future).
ISS and CAEP programs are staffed in the same effective manner as was described in the Middle
School section. In addition, some high schools supplement the ISS room with teachers on a per period basis.
As with the middle schools, the 7/6 master schedule format could be adopted, at least for staffing. As
before, individual campuses would be free to use the schedule of their choice, while being limited to the number of teacher positions generated by the 7/6 schedule formula. Using the 7/6 schedule with the existing staff would drop average class size from 23.1 to 21.9 students per section. The mathematical staffing formula corresponding to this data is (1.167 x students)/21.9 = Full-Time Teacher Equivalents (or FTEs).

Staffing Review 18 Fort Bend ISD Copyright 2010 TASB HR Services
Alternatively, adopting the 7/6 master schedule and moving to an average class size of 24.0 would
allow the absorption, of 100 teaching positions. This option would result in a cost savings of up to $5,316,600 in salary and benefits costs over current practice. The mathematical staffing formula corresponding to this data is (1.167 x students)/24.0 = Full-Time Teacher Equivalents (or FTEs).
Total cost saving options in this area: $5,316,600.

Staffing Review 19 Fort Bend ISD Copyright 2010 TASB HR Services
Special Education Staffing The Special Education program is well-administered. Principals are supportive of the program and
consider it effective in meeting the needs of Fort Bend ISD students. The Fort Bend ISD current percentage identification in Special Education is 6.6%, down from 8.6%
in 2006–07, 7.8% in 2007–08, and 7.1 % in 2008–09. The current state-wide comparison figure is 9.4%. The TEA target goal is 8.0% by 2012–13. Fort Bend ISD has already reached this goal.
The “case manager” format is being used by the appraisal staff and a three-tiered identification
process emphasizing student intervention, pre-referral, and referral is in place. A history of the effectiveness of specific intervention strategies is required prior to referral. This change has helped to generate additional student academic progress as well as improvement in special education program identification figures.
The Special Education department staffs 454.5 teaching positions for 3,794 students, or an average
of 8.3 students per teacher. The state average is 13.9 students per teacher. In addition to the certified teaching staff, 453 special education aides are employed. This produces average counts of 4.2 students per staff member (3,794 students and 907.5 total classroom staff). Across the state, total staffing ratios typically average 6.6 students per special education staff member.
Administrators, teachers, and the assessment staff have done an excellent job of reducing the fraction
of students identified as needing special education services. However, as the number of students has decreased, the teacher positions freed in that process have been used in a “Co-Teach with Teachers” model. This model provides a special education teacher to work on an “every day” basis in regular education classrooms. This has allowed students to be “mainstreamed” while still retaining an elevated level of instructional support. It has been responsible for the significant gains by these students, allowing all campuses to meet the corresponding Annual Yearly Progress (AYP) guidelines. But, this practice has resulted in much “richer” staffing levels for students formerly taught in resource or inclusion settings.
Based on the information listed above, the special education program appears to be substantially
overstaffed as compared to state-wide data. The major factors are the likely retention of staff over the years while student identification has been dropping, as well as Fort Bend ISD’s commitment to the “Co-Teach with Teachers” model for inclusion. After careful review of student needs, it may be theoretically possible to absorb up to 181 teacher vacancies and 151 aide vacancies, resulting in a cost savings of up to $13,014,609 in salary and benefits. This change would have significant impact on the service model for students, and might be precluded by “maintenance of effort” issues. A more realistic goal might be 100 teacher vacancies and 50 aide vacancies over a 2–3 year period, for a net cost savings of $6,437,850 in local funds.
Fort Bend ISD currently staffs 52 Diagnosticians at a caseload of 87.5 students per assessor. Typical
caseloads in Texas school districts average approximately 100–105 students. The number of assessors could be decreased by up to 7 positions to bring caseloads to 101.1 students per assessor. This would result in a cost savings of $437,500 in salary and benefits.
Fort Bend ISD currently staffs 45 Speech Language Pathologists (SLPs) at a caseload of 53.3
students per SLP. The total staff includes 36 Fort Bend ISD employees and the equivalent of 9 more pathologists through contract services. Typical caseloads in Texas school districts average

Staffing Review 20 Fort Bend ISD Copyright 2010 TASB HR Services
approximately 50–55 students. The district is operating inside the benchmark range and no overall adjustments are necessary. However, the contracted positions are running a little over $80,000 per position. Fort Bend ISD speech pathologists average $57,300 plus another $4,500 in benefits. Concerted effort must continue to be made to staff these positions with Fort Bend ISD employees, minimizing the use of contract services.
Only two due process hearings have been requested in the past three years. Considering the
enrollment of the district, this history is evidence of a well-articulated program, administered with clear standards, and sensitive to the needs of the community.
Two residential placements are in effect and no others are anticipated. However, the practice of
reserving a significant portion of a given year’s federal funds carryover for the following year’s potential residential placements should be continued. Any residential placement can be an enormous expense.
Total cost saving options in this area: $6,875,300.

Staffing Review 21 Fort Bend ISD Copyright 2010 TASB HR Services
Child Nutrition Staffing
Fort Bend ISD Child Nutrition operates 67 kitchens across the district. Principals consistently
remarked upon the help of this program in providing timely and nutritious service.
In general, based on the accompanying Meals per Labor Hour (MPLH) chart for October 19–23, 2009, forty-four of the sixty-seven campus kitchens are operating at, or above, target benchmarks. Some level of adjustments could be made at the other twenty-three kitchens.
Secondary school cafeterias routinely have difficulty maintaining MPLH values. The staffing of a
snack bar and increasing menu choices can make these operations less efficient. The desired level of economy often has to be balanced against the perceived need for a wide range of meal options and points of sale (POS). Common target values would be 85–90 percent at high school kitchens, 88–92 percent at middle school kitchens, and 95+ percent at elementary kitchens. Fourteen of the twenty-three secondary school kitchens and nine of the forty-four elementary kitchens fall below these targets. However, many of them are very close to the marks. The initial focus should be on increasing the number of meals served to maintain current staffing levels, rather than initially decreasing labor hours.
An area for further study is the school breakfast program. Based on the data provided, at least 77
percent of students qualifying for the free or reduced price meal program are not eating breakfast at school. This presents a substantial opportunity to expand services. It is difficult for these students to perform effectively when consistently missing the breakfast meal. Also, the Fort Bend ISD Child Nutrition Fund is missing out on a sizable portion of federal reimbursement. Care should be taken to correct this situation. Principals, the Cafeteria Managers, and the Transportation Director should begin to review this issue. Significant improvement in the number of breakfasts served will likely require adjustments in some operations, but will assist in increasing the number of meals served and the operating efficiencies of the kitchens. More importantly, gains in this area would ensure better nutrition and increased performance from the students involved.
Based upon current figures, up to 230 labor hours per day could be reduced in the Fort Bend ISD kitchens. This could be accomplished by reducing hours per shift or outright decreases in positions. This would result in the cost savings of approximately $481,106 in salary and benefits to the Child Nutrition budget. (Retention of the current staffing levels would have to be based on other issues, such as convenience of serving times for students and staff and/or available menus.)
Since Child Nutrition uses a separate fund, increased revenue in this area would not directly impact
the Fort Bend ISD Maintenance and Operations budget. However, savings or additional income would allow for pro-rated reimbursement of casualty insurance costs, equipment replacement, possible salary increases, and/or decreased meal costs to students and staff. Also, rather than depending on bond funds to build and equip kitchens on new campuses, the Child Nutrition Fund Balance could be used to hold down future interest and sinking fund expenditures.
Total cost saving options in this area: $481,100.

Staffing Review 22 Fort Bend ISD Copyright 2010 TASB HR Services
Operations and Facilities Staffing
The staffing in the Fort Bend ISD Maintenance Department is essentially at benchmark levels
(204.1 positions as compared to 206.2 slots recommended) provided by the Association of Physical Plant Administrators (APPA) standards. This analysis considers actual employees of the District (157) along with the amount of work currently being contracted to outside vendors (47.1 employee equivalents).
Across all crafts, there is an excellent mix of skilled tradesmen. There are 45 HVAC technicians,
plumbers, electricians, carpenters, locksmiths, and painters. Most Texas school districts have not been able to retain such a solid mix of skilled tradespersons. Fort Bend ISD is to be commended in this area.
In the future, adjusting to operate at leaner levels of maintenance staffing, with a minimum of new
staff members and increasing campus needs, will require the employees to be even more efficient. Consideration could be given to moving half or more of the maintenance staff to an 11:00 a.m. to 7:00 p.m. shift. This would enable these maintenance employees to accomplish additional work, since students would not be in the buildings for much of the new maintenance work day. The gains in efficiency would need to be balanced against the resistance of these employees to work evening shifts. (A possible approach could be hiring all new maintenance staff members onto the evening shift, and allowing those current employees who wished to do so to keep their current hours. Thus, over a period of time, the desired number of employees on the evening shift would be reached on a voluntary basis.)
Fort Bend ISD currently staffs at one custodian per 18,376 square feet, compared to the ASBO
standard of one custodian per 19,000 square feet. Thus, the total staffing in the Custodial Department is 26.8 positions over benchmark levels (534 positions versus 507.2 positions recommended), based on ASBO standards. In general most high schools are 1.5–4.0 positions under benchmark levels, middle schools are at or near benchmark, and elementary campuses are 0.5–1.5 positions over benchmark. This is a distribution pattern commonly found across the state.
Prior to any adjustments to the custodial staff, a review of the availability of cleaning equipment, the age of the campuses, the mix of permanent and portable buildings, any structural issues which could require more labor, and the current level of cleanliness of the buildings should be completed. The impact of these factors, and possibly others, can be assessed before custodial positions are adjusted. Also, the surplus discussed above is spread over 67 sites, making the recovery of positions from any one site difficult. Finally, considering the history of absenteeism in the area, a small surplus for contingencies is not a problem.
District leadership in Operations is considering a revision in the calculation of custodial staffing
based upon one position per 26,000 square feet. This trend towards the use of a conservative staffing ratio is reflective of the advanced equipment in use in the district, the introduction of specific-task cleaning crews, and the economy of scale available to large districts.

Staffing Review 23 Fort Bend ISD Copyright 2010 TASB HR Services
Human Resources Principals have been very supportive of the level of effort in this area. Human Resources staff
members are considered to be readily available for service and able to handle campus needs in a timely and effective manner. At one point in the past, there were some concerns over the accuracy of position control data. However, principals perceive that significant improvements have been made in the past year.
All principals agree that solid applicants are available for regular education positions in the months of March through mid-June. Beginning in July, the quality begins to drop. This decline normally accelerates in the summer, through no fault of anyone. As the stronger candidates commit to contracts, the overall quality of the remaining candidates drops. Concerning Bilingual Education, Special Education, Science, and Math positions, as well as minority applicants, there is a perceived shortage, year-round. Principals recommend additional recruiting at the fall and spring teacher fairs to address these areas, and agree to assist with the extra travel. (Also, many of the candidates for “shortage area” slots are Alternative Certification Program (ACP) persons, rather than holders of traditional certificates.)
It is increasingly important to release positions for hire in the spring months, when possible.
Whether by use of the staffing formula, or other methods, every effort should be made to release positions to principals, while strong candidates are plentiful, and to quickly hire these available strong candidates before they are lost to neighboring districts.
A helpful practice in this area can be the establishment of a small stipend (approximately $500) paid
to current teachers planning to retire or resign, rather than returning for the following school year. To qualify for the “Early Notification” stipend, teachers would need to submit their letter of resignation on or prior to the end of the first week of April. This would allow principals to seek replacements while the number of eligible candidates was at its peak.
Fort Bend ISD already addresses local teacher recruitment with several pro-active programs.
Included are scholarship offerings to Fort Bend ISD high school graduates, recruitment of teacher aides into traditional certification programs, and the use of grant funds to assist alternative certification candidates. “Ready, Set, Teach” (RST) is a TEA-approved vocational program and students enrolled generate additional vocational funds for the District. Expanding the RST program, through partnerships with area colleges and universities, has shown to be an effective tool in encouraging seniors to consider education majors after graduation. Across the state, these programs have been particularly effective in generating minority candidates, special education teachers, and bilingual teachers. Emphasizing the “Grow Your Own” features of the RST program (by providing opportunities for graduates to return to Fort Bend ISD for substitute assignments and student teaching while in college) will assist the District in filling the current shortage of minority and bilingual teachers.

Data Tables

Staffing

FORT BEND INDEPENDENT SCHOOL DISTRICTSchool Staffing Compared to Southern Association of Colleges and Schools (SACS) Standards
Enrollment and Staffing as of November 19, 2009Dean, Data Sp Instr. Lib
Campus Pupils Prin SACS +,- A.P. SACS +,- Coord. CIS Spec. Coun SACS +,- Lib SACS +,- Aide SACS +,-
High Schools
Austin 2,350 1.0 1.0 0.0 4.0 4.0 0.0 0.0 1.0 2.0 5.0 4.5 0.5 2.0 2.0 0.0 1.0 1.0 0.0Bush 2,021 1.0 1.0 0.0 4.0 3.0 1.0 2.0 1.0 2.0 5.0 4.5 0.5 2.0 2.0 0.0 1.0 1.0 0.0Clements 2,804 1.0 1.0 0.0 5.0 5.0 0.0 1.0 1.0 2.0 6.0 5.5 0.5 2.0 2.0 0.0 1.0 1.0 0.0Dulles 2,073 1.0 1.0 0.0 3.0 3.0 0.0 1.5 1.0 2.0 5.0 4.5 0.5 2.0 2.0 0.0 1.0 1.0 0.0Elkins 2,387 1.0 1.0 0.0 5.0 4.0 1.0 1.5 1.0 2.0 5.0 4.5 0.5 2.0 2.0 0.0 1.0 1.0 0.0Hightower 2,728 1.0 1.0 0.0 6.0 5.0 1.0 1.0 1.0 2.0 6.0 5.5 0.5 2.0 2.0 0.0 1.0 1.0 0.0Kempner 2,537 1.0 1.0 0.0 5.0 5.0 0.0 1.0 1.0 2.0 5.0 4.5 0.5 2.0 2.0 0.0 1.0 1.0 0.0Marshall 1,450 1.0 1.0 0.0 4.0 2.5 1.5 2.0 1.0 2.0 4.0 3.0 1.0 2.0 1.0 1.0 1.0 1.0 0.0Travis 2,179 1.0 1.0 0.0 4.0 4.0 0.0 0.0 1.0 2.0 5.0 4.5 0.5 2.0 2.0 0.0 1.0 1.0 0.0Willowridge 1,461 1.0 1.0 0.0 4.0 2.5 1.5 2.0 1.0 2.0 4.0 3.0 1.0 2.0 1.0 1.0 1.0 1.0 0.0
HS Sub-Totals 21,990 10.0 10.0 0.0 44.0 38.0 6.0 12.0 10.0 20.0 50.0 44.0 6.0 20.0 18.0 2.0 10.0 10.0 0.0
Alternative Schools
MR Wood 132 1.0 1.0 0.0 1.0 0.0 1.0 0.0 0.0 0.0 3.0 0.5 2.5 0.0 0.0 0.0 0.0 0.0 0.0Progressive * 0 1.0 1.0 0.0 1.0 0.0 1.0 0.0 0.0 1.0 1.0 0.5 0.5 1.0 0.0 1.0 0.0 0.0 0.0Tech Ed Center * 0 1.0 1.0 0.0 0.0 0.0 0.0 0.0 0.0 0.0 2.0 0.5 1.5 0.0 0.0 0.0 0.0 0.0 0.0
Alt. Sub-Totals 132 3.0 3.0 0.0 2.0 0.0 2.0 0.0 0.0 1.0 6.0 1.5 4.5 1.0 0.0 1.0 0.0 0.0 0.0
* Students at these two campuses remain on their "home school" rosters
Middle Schools
Baines 1,361 1.0 1.0 0.0 3.0 2.5 0.5 0.0 1.0 2.0 3.0 3.0 0.0 1.0 1.0 0.0 1.0 1.0 0.0Crockett 1,352 1.0 1.0 0.0 3.0 2.5 0.5 0.0 1.0 2.0 3.0 3.0 0.0 1.0 1.0 0.0 1.0 1.0 0.0Dulles 1,345 1.0 1.0 0.0 3.0 2.5 0.5 0.0 1.0 2.0 3.0 3.0 0.0 1.0 1.0 0.0 1.0 1.0 0.0First Colony 1,116 1.0 1.0 0.0 3.0 2.0 1.0 0.0 1.0 2.0 3.0 2.5 0.5 1.0 1.0 0.0 1.0 1.0 0.0Fort Settlement 1,097 1.0 1.0 0.0 2.0 2.0 0.0 0.0 1.0 2.0 3.0 2.5 0.5 1.0 1.0 0.0 1.0 1.0 0.0Garcia 1,359 1.0 1.0 0.0 3.0 2.5 0.5 0.0 1.0 2.0 3.0 3.0 0.0 1.0 1.0 0.0 1.0 1.0 0.0Hodges Bend 1,401 1.0 1.0 0.0 3.0 2.5 0.5 1.0 1.0 2.0 3.0 3.0 0.0 1.0 1.0 0.0 1.0 1.0 0.0Lake Olympia 1,334 1.0 1.0 0.0 3.0 2.5 0.5 0.0 1.0 2.0 3.0 3.0 0.0 1.0 1.0 0.0 1.0 1.0 0.0McAuliffe 610 1.0 1.0 0.0 2.0 1.0 1.0 1.0 1.0 2.0 2.0 1.5 0.5 1.0 1.0 0.0 1.0 1.0 0.0Missouri City 762 1.0 1.0 0.0 2.0 1.5 0.5 1.0 1.0 2.0 2.0 2.0 0.0 1.0 1.0 0.0 1.0 1.0 0.0Quail Valley 847 1.0 1.0 0.0 2.0 1.5 0.5 1.0 1.0 2.0 3.0 2.0 1.0 1.0 1.0 0.0 1.0 1.0 0.0

FORT BEND INDEPENDENT SCHOOL DISTRICTSchool Staffing Compared to Southern Association of Colleges and Schools (SACS) Standards
Enrollment and Staffing as of November 19, 2009Dean, Data Sp Instr. Lib
Campus Pupils Prin SACS +,- A.P. SACS +,- Coord. CIS Spec. Coun SACS +,- Lib SACS +,- Aide SACS +,-Sartartia 1,269 1.0 1.0 0.0 2.0 2.5 (0.5) 0.0 1.0 2.0 3.0 3.0 0.0 1.0 1.0 0.0 1.0 1.0 0.0Sugar Land 1,412 1.0 1.0 0.0 3.0 2.5 0.5 0.0 1.0 2.0 3.0 3.0 0.0 1.0 1.0 0.0 1.0 1.0 0.0
MS Sub-Totals 15,265 13.0 13.0 0.0 34.0 28.0 6.0 4.0 13.0 26.0 37.0 34.5 2.5 13.0 13.0 0.0 13.0 13.0 0.0
ElementarySchools* **
Armstrong 809 1.0 1.0 0.0 1.0 1.0 0.0 0.0 0.0 0.5 1.0 1.5 (0.5) 1.0 1.0 0.0 1.0 1.0 0.0Austin Parkway 817 1.0 1.0 0.0 1.0 1.0 0.0 0.0 0.0 0.5 1.0 1.5 (0.5) 1.0 1.0 0.0 1.0 1.0 0.0Barrington Place 876 1.0 1.0 0.0 1.0 1.0 0.0 0.0 0.0 0.5 1.0 1.5 (0.5) 1.0 1.0 0.0 1.0 1.0 0.0Blue Ridge 638 1.0 1.0 0.0 1.0 0.5 0.5 0.0 1.0 0.5 1.0 1.0 0.0 1.0 1.0 0.0 1.0 1.0 0.0Brazos Bend 779 1.0 1.0 0.0 1.0 1.0 0.0 0.0 0.0 0.5 1.0 1.5 (0.5) 1.0 1.0 0.0 1.0 1.0 0.0Briargate 617 1.0 1.0 0.0 1.0 0.5 0.5 0.0 0.0 0.5 1.0 1.0 0.0 1.0 1.0 0.0 1.0 1.0 0.0Burton 937 1.0 1.0 0.0 2.0 1.0 1.0 0.0 1.0 0.5 1.0 1.5 (0.5) 1.0 1.0 0.0 1.0 1.0 0.0Colony Bend 400 1.0 1.0 0.0 1.0 0.0 1.0 0.0 0.0 0.5 1.0 0.5 0.5 1.0 1.0 0.0 1.0 1.0 0.0Colony Meadows 593 1.0 1.0 0.0 1.0 0.5 0.5 0.0 0.0 0.5 1.0 1.0 0.0 1.0 1.0 0.0 1.0 1.0 0.0Commonwealth 705 1.0 1.0 0.0 1.0 0.5 0.5 0.0 0.0 0.5 1.0 1.0 0.0 1.0 1.0 0.0 1.0 1.0 0.0Cornerstone 750 1.0 1.0 0.0 1.0 1.0 0.0 0.0 0.0 0.5 1.0 1.5 (0.5) 1.0 1.0 0.0 1.0 1.0 0.0Drabek 917 1.0 1.0 0.0 2.0 1.0 1.0 0.0 0.0 0.5 1.0 1.5 (0.5) 1.0 1.0 0.0 1.0 1.0 0.0Dulles 672 1.0 1.0 0.0 1.0 0.5 0.5 0.0 1.0 0.5 1.0 1.0 0.0 1.0 1.0 0.0 1.0 1.0 0.0Fleming 696 1.0 1.0 0.0 1.0 0.5 0.5 0.0 0.0 0.5 1.0 1.0 0.0 1.0 1.0 0.0 1.0 1.0 0.0Glover 803 1.0 1.0 0.0 1.0 1.0 0.0 0.0 1.0 0.5 1.0 1.5 (0.5) 1.0 1.0 0.0 1.0 1.0 0.0Goodman 643 1.0 1.0 0.0 1.0 0.5 0.5 0.0 1.0 0.5 1.0 1.0 0.0 1.0 1.0 0.0 1.0 1.0 0.0Highlands 586 1.0 1.0 0.0 1.0 0.5 0.5 0.0 0.0 0.5 1.0 1.0 0.0 1.0 1.0 0.0 1.0 1.0 0.0Holley 768 1.0 1.0 0.0 1.0 1.0 0.0 0.0 1.0 0.5 1.0 1.5 (0.5) 1.0 1.0 0.0 1.0 1.0 0.0Hunters Glen 617 1.0 1.0 0.0 1.0 0.5 0.5 0.0 1.0 0.5 1.0 1.0 0.0 1.0 1.0 0.0 1.0 1.0 0.0Jones 761 1.0 1.0 0.0 1.0 1.0 0.0 0.0 1.0 0.5 1.0 1.5 (0.5) 1.0 1.0 0.0 1.0 1.0 0.0Jordan 805 1.0 1.0 0.0 1.0 1.0 0.0 0.0 0.0 0.5 1.0 1.5 (0.5) 1.0 1.0 0.0 1.0 1.0 0.0Lakeview 563 1.0 1.0 0.0 1.0 0.5 0.5 0.0 0.0 0.5 1.0 1.0 0.0 1.0 1.0 0.0 1.0 1.0 0.0Lantern Lane 645 1.0 1.0 0.0 1.0 0.5 0.5 0.0 0.0 0.5 1.0 1.0 0.0 1.0 1.0 0.0 1.0 1.0 0.0Lexington Creek 666 1.0 1.0 0.0 1.0 0.5 0.5 0.0 0.0 0.5 1.0 1.0 0.0 1.0 1.0 0.0 1.0 1.0 0.0Meadows 432 1.0 1.0 0.0 1.0 0.0 1.0 0.0 0.0 0.5 1.0 0.5 0.5 1.0 1.0 0.0 1.0 1.0 0.0Mission Bend 801 1.0 1.0 0.0 1.0 1.0 0.0 0.0 1.0 0.5 1.0 1.5 (0.5) 1.0 1.0 0.0 1.0 1.0 0.0Mission Glen 723 1.0 1.0 0.0 1.0 0.5 0.5 0.0 1.0 0.5 1.0 1.0 0.0 1.0 1.0 0.0 1.0 1.0 0.0Mission West 775 1.0 1.0 0.0 1.0 1.0 0.0 0.0 1.0 0.5 1.0 1.5 (0.5) 1.0 1.0 0.0 1.0 1.0 0.0Oakland 811 1.0 1.0 0.0 1.0 1.0 0.0 0.0 0.0 0.5 1.0 1.5 (0.5) 1.0 1.0 0.0 1.0 1.0 0.0Oyster Creek 822 1.0 1.0 0.0 1.0 1.0 0.0 0.0 0.0 0.5 1.0 1.5 (0.5) 1.0 1.0 0.0 1.0 1.0 0.0Palmer 754 1.0 1.0 0.0 1.0 1.0 0.0 0.0 0.0 0.5 1.0 1.5 (0.5) 1.0 1.0 0.0 1.0 1.0 0.0Parks 618 1.0 1.0 0.0 1.0 0.5 0.5 0.0 1.0 0.5 1.0 1.0 0.0 1.0 1.0 0.0 1.0 1.0 0.0
FORT BEND INDEPENDENT SCHOOL DISTRICTSchool Staffing Compared to Southern Association of Colleges and Schools (SACS) Standards
Enrollment and Staffing as of November 19, 2009
Dean, Data Sp Instr. LibCampus Pupils Prin SACS +,- A.P. SACS +,- Coord. CIS Spec. Coun SACS +,- Lib SACS +,- Aide SACS +,-Pecan Grove 583 1.0 1.0 0.0 1.0 0.5 0.5 0.0 0.0 0.5 1.0 1.0 0.0 1.0 1.0 0.0 1.0 1.0 0.0Quail Valley 615 1.0 1.0 0.0 1.0 0.5 0.5 0.0 0.0 0.5 1.0 1.0 0.0 1.0 1.0 0.0 1.0 1.0 0.0Ridgegate 755 1.0 1.0 0.0 2.0 1.0 1.0 0.0 1.0 0.5 1.0 1.5 (0.5) 1.0 1.0 0.0 1.0 1.0 0.0Ridgemont 807 1.0 1.0 0.0 1.0 1.0 0.0 0.0 1.0 0.5 1.0 1.5 (0.5) 1.0 1.0 0.0 1.0 1.0 0.0Scanlan Oaks 958 1.0 1.0 0.0 2.0 1.0 1.0 0.0 0.0 0.5 1.0 1.5 (0.5) 1.0 1.0 0.0 1.0 1.0 0.0Schiff 823 1.0 1.0 0.0 1.0 1.0 0.0 0.0 0.0 0.5 1.0 1.5 (0.5) 1.0 1.0 0.0 1.0 1.0 0.0Seguin 493 1.0 1.0 0.0 1.0 0.0 1.0 0.0 0.0 0.5 1.0 0.5 0.5 1.0 1.0 0.0 1.0 1.0 0.0Settlers Way 734 1.0 1.0 0.0 1.0 1.0 0.0 0.0 0.0 0.5 1.0 1.0 0.0 1.0 1.0 0.0 1.0 1.0 0.0Sienna Crossing 966 1.0 1.0 0.0 2.0 1.0 1.0 0.0 0.0 0.5 1.0 1.5 (0.5) 1.0 1.0 0.0 1.0 1.0 0.0Sugar Mill 739 1.0 1.0 0.0 1.0 0.5 0.5 0.0 0.0 0.5 1.0 1.0 0.0 1.0 1.0 0.0 1.0 1.0 0.0Townewest 840 1.0 1.0 0.0 1.0 1.0 0.0 0.0 1.0 0.5 1.0 1.5 (0.5) 1.0 1.0 0.0 1.0 1.0 0.0Walker Station 904 1.0 1.0 0.0 2.0 1.0 1.0 0.0 0.0 0.5 1.0 1.5 (0.5) 1.0 1.0 0.0 1.0 1.0 0.0
Elem. Sub-Totals 32,016 44.0 44.0 0.0 50.0 32.5 17.5 0.0 15.0 22.0 44.0 54.0 (10.0) 44.0 44.0 0.0 44.0 44.0 0.0
* Elementary campuses have one or more Instructional Specialists** Some elementary campuses have At-Risk Professionals (or Teachers), Psychologists, and/or Behavior Specialists
Total 69,403 70.0 70.0 0.0 130.0 98.5 31.5 16.0 38.0 69.0 137.0 134.0 3.0 78.0 75.0 3.0 67.0 67.0 0.0

FORT BEND INDEPENDENT SCHOOL DISTRICTSchool Staffing Compared to Common Practice in Texas (CPTx)
Enrollment and Staffing as of November 19, 2009Dean, Data Sp Instr. Lib
Campus Pupils Prin CPTx +,- A.P. CPTx +,- Coord. CIS Spec. Coun CPTx +,- Lib CPTx +,- Aide CPTx +,-
High Schools
Austin 2,350 1.0 1.0 0.0 4.0 5.0 (1.0) 0.0 1.0 2.0 5.0 6.0 (1.0) 2.0 2.0 0.0 1.0 2.0 (1.0)Bush 2,021 1.0 1.0 0.0 4.0 4.5 (0.5) 2.0 1.0 2.0 5.0 5.0 0.0 2.0 2.0 0.0 1.0 2.0 (1.0)Clements 2,804 1.0 1.0 0.0 5.0 6.0 (1.0) 1.0 1.0 2.0 6.0 7.0 (1.0) 2.0 2.0 0.0 1.0 2.0 (1.0)Dulles 2,073 1.0 1.0 0.0 3.0 4.5 (1.5) 1.5 1.0 2.0 5.0 5.0 0.0 2.0 2.0 0.0 1.0 2.0 (1.0)Elkins 2,387 1.0 1.0 0.0 5.0 5.0 0.0 1.5 1.0 2.0 5.0 6.0 (1.0) 2.0 2.0 0.0 1.0 2.0 (1.0)Hightower 2,728 1.0 1.0 0.0 6.0 6.0 0.0 1.0 1.0 2.0 6.0 7.0 (1.0) 2.0 2.0 0.0 1.0 2.0 (1.0)Kempner 2,537 1.0 1.0 0.0 5.0 5.5 (0.5) 1.0 1.0 2.0 5.0 6.5 (1.5) 2.0 2.0 0.0 1.0 2.0 (1.0)Marshall 1,450 1.0 1.0 0.0 4.0 3.0 1.0 2.0 1.0 2.0 4.0 3.5 0.5 2.0 1.0 1.0 1.0 1.0 0.0Travis 2,179 1.0 1.0 0.0 4.0 5.0 (1.0) 0.0 1.0 2.0 5.0 5.5 (0.5) 2.0 2.0 0.0 1.0 2.0 (1.0)Willowridge 1,461 1.0 1.0 0.0 4.0 3.0 1.0 2.0 1.0 2.0 4.0 3.5 0.5 2.0 1.0 1.0 1.0 1.0 0.0
HS Sub-Totals 21,990 10.0 10.0 0.0 44.0 47.5 (3.5) 12.0 10.0 20.0 50.0 55.0 (5.0) 20.0 18.0 2.0 10.0 18.0 (8.0)
Alternative Schools
MR Wood 132 1.0 1.0 0.0 1.0 0.0 1.0 0.0 0.0 0.0 3.0 0.5 2.5 0.0 0.0 0.0 0.0 0.0 0.0Progressive * 0 1.0 1.0 0.0 1.0 0.0 1.0 0.0 0.0 1.0 1.0 0.5 0.5 1.0 0.0 1.0 0.0 0.0 0.0Tech Ed Center * 0 1.0 1.0 0.0 0.0 0.0 0.0 0.0 0.0 0.0 2.0 0.5 1.5 0.0 0.0 0.0 0.0 0.0 0.0
Alt. Sub-Totals 132 3.0 3.0 0.0 2.0 0.0 2.0 0.0 0.0 1.0 6.0 1.5 4.5 1.0 0.0 1.0 0.0 0.0 0.0
* Students at these two campuses remain on their "home school" rosters
Middle Schools
Baines 1,361 1.0 1.0 0.0 3.0 3.0 0.0 0.0 1.0 2.0 3.0 3.5 (0.5) 1.0 1.0 0.0 1.0 1.0 0.0Crockett 1,352 1.0 1.0 0.0 3.0 3.0 0.0 0.0 1.0 2.0 3.0 3.5 (0.5) 1.0 1.0 0.0 1.0 1.0 0.0Dulles 1,345 1.0 1.0 0.0 3.0 3.0 0.0 0.0 1.0 2.0 3.0 3.5 (0.5) 1.0 1.0 0.0 1.0 1.0 0.0First Colony 1,116 1.0 1.0 0.0 3.0 2.5 0.5 0.0 1.0 2.0 3.0 3.0 0.0 1.0 1.0 0.0 1.0 1.0 0.0Fort Settlement 1,097 1.0 1.0 0.0 2.0 2.5 (0.5) 0.0 1.0 2.0 3.0 2.5 0.5 1.0 1.0 0.0 1.0 1.0 0.0Garcia 1,359 1.0 1.0 0.0 3.0 3.0 0.0 0.0 1.0 2.0 3.0 3.5 (0.5) 1.0 1.0 0.0 1.0 1.0 0.0Hodges Bend 1,401 1.0 1.0 0.0 3.0 3.0 0.0 1.0 1.0 2.0 3.0 3.5 (0.5) 1.0 1.0 0.0 1.0 1.0 0.0Lake Olympia 1,334 1.0 1.0 0.0 3.0 3.0 0.0 0.0 1.0 2.0 3.0 3.5 (0.5) 1.0 1.0 0.0 1.0 1.0 0.0McAuliffe 610 1.0 1.0 0.0 2.0 1.5 0.5 1.0 1.0 2.0 2.0 1.5 0.5 1.0 1.0 0.0 1.0 1.0 0.0Missouri City 762 1.0 1.0 0.0 2.0 1.5 0.5 1.0 1.0 2.0 2.0 2.0 0.0 1.0 1.0 0.0 1.0 1.0 0.0Quail Valley 847 1.0 1.0 0.0 2.0 2.0 0.0 1.0 1.0 2.0 3.0 2.0 1.0 1.0 1.0 0.0 1.0 1.0 0.0

FORT BEND INDEPENDENT SCHOOL DISTRICTSchool Staffing Compared to Common Practice in Texas (CPTx)
Enrollment and Staffing as of November 19, 2009Dean, Data Sp Instr. Lib
Campus Pupils Prin CPTx +,- A.P. CPTx +,- Coord. CIS Spec. Coun CPTx +,- Lib CPTx +,- Aide CPTx +,-Sartartia 1,269 1.0 1.0 0.0 2.0 3.0 (1.0) 0.0 1.0 2.0 3.0 3.0 0.0 1.0 1.0 0.0 1.0 1.0 0.0Sugar Land 1,412 1.0 1.0 0.0 3.0 3.0 0.0 0.0 1.0 2.0 3.0 3.5 (0.5) 1.0 1.0 0.0 1.0 1.0 0.0
MS Sub-Totals 15,265 13.0 13.0 0.0 34.0 34.0 0.0 4.0 13.0 26.0 37.0 38.5 (1.5) 13.0 13.0 0.0 13.0 13.0 0.0
ElementarySchools* **
Armstrong 809 1.0 1.0 0.0 1.0 2.0 (1.0) 0.0 0.0 0.5 1.0 2.0 (1.0) 1.0 1.0 0.0 1.0 1.0 0.0Austin Parkway 817 1.0 1.0 0.0 1.0 2.0 (1.0) 0.0 0.0 0.5 1.0 2.0 (1.0) 1.0 1.0 0.0 1.0 1.0 0.0Barrington Place 876 1.0 1.0 0.0 1.0 2.0 (1.0) 0.0 0.0 0.5 1.0 2.0 (1.0) 1.0 1.0 0.0 1.0 1.0 0.0Blue Ridge 638 1.0 1.0 0.0 1.0 1.5 (0.5) 0.0 1.0 0.5 1.0 1.5 (0.5) 1.0 1.0 0.0 1.0 1.0 0.0Brazos Bend 779 1.0 1.0 0.0 1.0 1.5 (0.5) 0.0 0.0 0.5 1.0 2.0 (1.0) 1.0 1.0 0.0 1.0 1.0 0.0Briargate 617 1.0 1.0 0.0 1.0 1.5 (0.5) 0.0 0.0 0.5 1.0 1.5 (0.5) 1.0 1.0 0.0 1.0 1.0 0.0Burton 937 1.0 1.0 0.0 2.0 2.0 0.0 0.0 1.0 0.5 1.0 2.0 (1.0) 1.0 1.0 0.0 1.0 1.0 0.0Colony Bend 400 1.0 1.0 0.0 1.0 1.0 0.0 0.0 0.0 0.5 1.0 1.0 0.0 1.0 1.0 0.0 1.0 1.0 0.0Colony Meadows 593 1.0 1.0 0.0 1.0 1.5 (0.5) 0.0 0.0 0.5 1.0 1.5 (0.5) 1.0 1.0 0.0 1.0 1.0 0.0Commonwealth 705 1.0 1.0 0.0 1.0 1.5 (0.5) 0.0 0.0 0.5 1.0 2.0 (1.0) 1.0 1.0 0.0 1.0 1.0 0.0Cornerstone 750 1.0 1.0 0.0 1.0 1.5 (0.5) 0.0 0.0 0.5 1.0 2.0 (1.0) 1.0 1.0 0.0 1.0 1.0 0.0Drabek 917 1.0 1.0 0.0 2.0 2.0 0.0 0.0 0.0 0.5 1.0 2.5 (1.5) 1.0 1.0 0.0 1.0 1.0 0.0Dulles 672 1.0 1.0 0.0 1.0 1.5 (0.5) 0.0 1.0 0.5 1.0 1.5 (0.5) 1.0 1.0 0.0 1.0 1.0 0.0Fleming 696 1.0 1.0 0.0 1.0 1.5 (0.5) 0.0 0.0 0.5 1.0 1.5 (0.5) 1.0 1.0 0.0 1.0 1.0 0.0Glover 803 1.0 1.0 0.0 1.0 2.0 (1.0) 0.0 1.0 0.5 1.0 2.0 (1.0) 1.0 1.0 0.0 1.0 1.0 0.0Goodman 643 1.0 1.0 0.0 1.0 1.5 (0.5) 0.0 1.0 0.5 1.0 1.5 (0.5) 1.0 1.0 0.0 1.0 1.0 0.0Highlands 586 1.0 1.0 0.0 1.0 1.5 (0.5) 0.0 0.0 0.5 1.0 1.5 (0.5) 1.0 1.0 0.0 1.0 1.0 0.0Holley 768 1.0 1.0 0.0 1.0 1.5 (0.5) 0.0 1.0 0.5 1.0 2.0 (1.0) 1.0 1.0 0.0 1.0 1.0 0.0Hunters Glen 617 1.0 1.0 0.0 1.0 1.5 (0.5) 0.0 1.0 0.5 1.0 1.5 (0.5) 1.0 1.0 0.0 1.0 1.0 0.0Jones 761 1.0 1.0 0.0 1.0 1.5 (0.5) 0.0 1.0 0.5 1.0 2.0 (1.0) 1.0 1.0 0.0 1.0 1.0 0.0Jordan 805 1.0 1.0 0.0 1.0 2.0 (1.0) 0.0 0.0 0.5 1.0 2.0 (1.0) 1.0 1.0 0.0 1.0 1.0 0.0Lakeview 563 1.0 1.0 0.0 1.0 1.5 (0.5) 0.0 0.0 0.5 1.0 1.5 (0.5) 1.0 1.0 0.0 1.0 1.0 0.0Lantern Lane 645 1.0 1.0 0.0 1.0 1.5 (0.5) 0.0 0.0 0.5 1.0 1.5 (0.5) 1.0 1.0 0.0 1.0 1.0 0.0Lexington Creek 666 1.0 1.0 0.0 1.0 1.5 (0.5) 0.0 0.0 0.5 1.0 1.5 (0.5) 1.0 1.0 0.0 1.0 1.0 0.0Meadows 432 1.0 1.0 0.0 1.0 1.0 0.0 0.0 0.0 0.5 1.0 1.0 0.0 1.0 1.0 0.0 1.0 1.0 0.0Mission Bend 801 1.0 1.0 0.0 1.0 2.0 (1.0) 0.0 1.0 0.5 1.0 2.0 (1.0) 1.0 1.0 0.0 1.0 1.0 0.0Mission Glen 723 1.0 1.0 0.0 1.0 1.5 (0.5) 0.0 1.0 0.5 1.0 2.0 (1.0) 1.0 1.0 0.0 1.0 1.0 0.0Mission West 775 1.0 1.0 0.0 1.0 1.5 (0.5) 0.0 1.0 0.5 1.0 2.0 (1.0) 1.0 1.0 0.0 1.0 1.0 0.0Oakland 811 1.0 1.0 0.0 1.0 2.0 (1.0) 0.0 0.0 0.5 1.0 2.0 (1.0) 1.0 1.0 0.0 1.0 1.0 0.0Oyster Creek 822 1.0 1.0 0.0 1.0 2.0 (1.0) 0.0 0.0 0.5 1.0 2.0 (1.0) 1.0 1.0 0.0 1.0 1.0 0.0Palmer 754 1.0 1.0 0.0 1.0 1.5 (0.5) 0.0 0.0 0.5 1.0 2.0 (1.0) 1.0 1.0 0.0 1.0 1.0 0.0Parks 618 1.0 1.0 0.0 1.0 1.5 (0.5) 0.0 1.0 0.5 1.0 1.5 (0.5) 1.0 1.0 0.0 1.0 1.0 0.0

FORT BEND INDEPENDENT SCHOOL DISTRICTSchool Staffing Compared to Common Practice in Texas (CPTx)
Enrollment and Staffing as of November 19, 2009
Dean, Data Sp Instr. LibCampus Pupils Prin CPTx +,- A.P. CPTx +,- Coord. CIS Spec. Coun CPTx +,- Lib CPTx +,- Aide CPTx +,-Pecan Grove 583 1.0 1.0 0.0 1.0 1.5 (0.5) 0.0 0.0 0.5 1.0 1.5 (0.5) 1.0 1.0 0.0 1.0 1.0 0.0Quail Valley 615 1.0 1.0 0.0 1.0 1.5 (0.5) 0.0 0.0 0.5 1.0 1.5 (0.5) 1.0 1.0 0.0 1.0 1.0 0.0Ridgegate 755 1.0 1.0 0.0 2.0 1.5 0.5 0.0 1.0 0.5 1.0 2.0 (1.0) 1.0 1.0 0.0 1.0 1.0 0.0Ridgemont 807 1.0 1.0 0.0 1.0 2.0 (1.0) 0.0 1.0 0.5 1.0 2.0 (1.0) 1.0 1.0 0.0 1.0 1.0 0.0Scanlan Oaks 958 1.0 1.0 0.0 2.0 2.0 0.0 0.0 0.0 0.5 1.0 2.5 (1.5) 1.0 1.0 0.0 1.0 1.0 0.0Schiff 823 1.0 1.0 0.0 1.0 2.0 (1.0) 0.0 0.0 0.5 1.0 2.0 (1.0) 1.0 1.0 0.0 1.0 1.0 0.0Seguin 493 1.0 1.0 0.0 1.0 1.0 0.0 0.0 0.0 0.5 1.0 1.0 0.0 1.0 1.0 0.0 1.0 1.0 0.0Settlers Way 734 1.0 1.0 0.0 1.0 1.5 (0.5) 0.0 0.0 0.5 1.0 1.5 (0.5) 1.0 1.0 0.0 1.0 1.0 0.0Sienna Crossing 966 1.0 1.0 0.0 2.0 2.0 0.0 0.0 0.0 0.5 1.0 2.5 (1.5) 1.0 1.0 0.0 1.0 1.0 0.0Sugar Mill 739 1.0 1.0 0.0 1.0 1.5 (0.5) 0.0 0.0 0.5 1.0 2.0 (1.0) 1.0 1.0 0.0 1.0 1.0 0.0Townewest 840 1.0 1.0 0.0 1.0 2.0 (1.0) 0.0 1.0 0.5 1.0 2.0 (1.0) 1.0 1.0 0.0 1.0 1.0 0.0Walker Station 904 1.0 1.0 0.0 2.0 2.0 0.0 0.0 0.0 0.5 1.0 2.5 (1.5) 1.0 1.0 0.0 1.0 1.0 0.0
Elem. Sub-Totals 32,016 44.0 44.0 0.0 50.0 72.5 (22.5) 0.0 15.0 22.0 44.0 79.5 (35.5) 44.0 44.0 0.0 44.0 44.0 0.0
* Elementary campuses have one or more Instructional Specialists** Some elementary campuses have At-Risk Professionals (or Teachers), Psychologists, and/or Behavior Specialists
Total 69,403 70.0 70.0 0.0 130.0 154.0 (24.0) 16.0 38.0 69.0 137.0 174.5 (37.5) 78.0 75.0 3.0 67.0 75.0 (8.0)
FORT BEND INDEPENDENT SCHOOL DISTRICTElementary Campus Paraprofessionals: Current
Enrollment and Staffing as of November 19, 2009
Elementary Campus Sub-Total Clerical per Aide Aide Aide Aide Aide Sub-Total Clinic Total Schools Pupils Clerk Sec. Clerical 1,000 Stds Bil/ESL Copy Lib PK/K SpEd Inst. Aides Asst. Para.
Armstrong 809 2.0 1.0 3.0 3.7 2.0 1.0 1.0 3.0 5.0 12.0 1.0 16.0Austin Parkway 817 1.5 1.0 2.5 3.1 0.0 1.0 1.0 2.0 5.0 9.0 0.5 12.0Barrington Place 876 1.5 1.0 2.5 2.9 1.0 1.0 1.0 3.0 10.0 16.0 0.5 19.0Blue Ridge 638 2.0 1.0 3.0 4.7 1.0 1.0 1.0 2.0 5.0 10.0 1.0 14.0Brazos Bend 779 1.5 1.0 2.5 3.2 1.0 1.0 1.0 3.0 4.0 10.0 0.5 13.0Briargate 617 2.0 1.0 3.0 4.9 0.0 1.0 1.0 2.0 2.0 6.0 1.0 10.0Burton 937 1.5 1.0 2.5 2.7 2.0 1.0 1.0 4.0 2.0 10.0 0.5 13.0Colony Bend 400 1.5 1.0 2.5 6.3 0.0 1.0 1.0 1.0 8.0 11.0 0.5 14.0Colony Meadows 593 1.5 1.0 2.5 4.2 0.0 1.0 1.0 1.0 6.0 9.0 0.5 12.0Commonwealth 705 1.5 1.0 2.5 3.5 0.0 1.0 1.0 1.0 8.0 11.0 0.5 14.0Cornerstone 750 1.5 1.0 2.5 3.3 0.0 1.0 1.0 2.0 4.0 8.0 0.5 11.0Drabek 917 1.5 1.0 2.5 2.7 0.0 1.0 1.0 1.0 7.0 10.0 0.5 13.0Dulles 672 1.5 1.0 2.5 3.7 0.0 1.0 1.0 3.0 3.0 8.0 0.5 11.0Fleming 696 2.5 1.0 3.5 5.0 1.0 1.0 1.0 2.5 4.0 9.5 0.5 13.5Glover 803 2.0 1.0 3.0 3.7 0.0 1.0 1.0 2.0 7.0 11.0 1.0 15.0Goodman 643 1.5 1.0 2.5 3.9 1.0 1.0 1.0 0.0 4.0 7.0 0.5 10.0Highlands 586 1.5 1.0 2.5 4.3 0.0 1.0 1.0 2.0 6.0 10.0 0.5 13.0Holley 768 1.5 1.0 2.5 3.3 0.5 1.0 1.0 3.0 5.0 10.5 0.5 13.5Hunters Glen 617 2.0 1.0 3.0 4.9 0.0 1.0 1.0 3.0 6.0 11.0 1.0 15.0Jones 761 2.0 1.0 3.0 3.9 1.0 1.0 1.0 3.5 7.0 13.5 1.0 17.5Jordan 805 1.5 1.0 2.5 3.1 0.0 1.0 1.0 3.0 4.0 9.0 0.5 12.0Lakeview 563 1.5 1.0 2.5 4.4 0.0 1.0 1.0 3.0 6.0 11.0 0.5 14.0Lantern Lane 645 2.0 1.0 3.0 4.7 0.0 1.0 1.0 2.0 4.0 8.0 1.0 12.0Lexington Creek 666 1.5 1.0 2.5 3.8 0.0 1.0 1.0 2.0 5.0 9.0 0.5 12.0Meadows 432 1.5 1.0 2.5 5.8 0.0 1.0 1.0 0.0 5.0 7.0 0.5 10.0Mission Bend 801 1.5 1.0 2.5 3.1 2.0 1.0 1.0 1.0 5.0 10.0 0.5 13.0Mission Glen 723 1.5 1.0 2.5 3.5 1.0 1.0 1.0 3.5 5.0 11.5 0.5 14.5Mission West 775 1.5 1.0 2.5 3.2 3.0 1.0 1.0 3.0 4.0 12.0 0.5 15.0Oakland 811 1.5 1.0 2.5 3.1 0.0 1.0 1.0 2.0 5.0 9.0 0.5 12.0Oyster Creek 822 1.5 1.0 2.5 3.0 0.0 1.0 1.0 2.0 7.0 11.0 0.5 14.0Palmer 754 1.5 1.0 2.5 3.3 0.0 1.0 1.0 0.0 9.0 11.0 0.5 14.0Parks 618 1.5 1.0 2.5 4.0 0.0 1.0 1.0 1.0 5.0 8.0 0.5 11.0

FORT BEND INDEPENDENT SCHOOL DISTRICTElementary Campus Paraprofessionals: Current
Enrollment and Staffing as of November 19, 2009
Pecan Grove 583 1.5 1.0 2.5 4.3 0.0 1.0 1.0 3.0 4.0 9.0 0.5 12.0Quail Valley 615 2.0 1.0 3.0 4.9 0.0 1.0 1.0 2.0 4.0 8.0 1.0 12.0Ridgegate 755 2.0 1.0 3.0 4.0 2.0 1.0 1.0 4.0 6.0 14.0 1.0 18.0Ridgemont 807 2.0 1.0 3.0 3.7 2.0 1.0 1.0 1.0 2.0 7.0 1.0 11.0Scanlan Oaks 958 3.5 1.0 4.5 4.7 0.0 1.0 1.0 0.0 6.0 8.0 0.5 13.0Schiff 823 1.5 1.0 2.5 3.0 0.0 1.0 1.0 2.0 5.0 9.0 0.5 12.0Seguin 493 1.5 1.0 2.5 5.1 1.0 1.0 1.0 0.0 3.0 6.0 0.5 9.0Settlers Way 734 1.5 1.0 2.5 3.4 0.0 1.0 1.0 1.0 8.0 11.0 0.5 14.0Sienna Crossing 966 1.5 1.0 2.5 2.6 0.0 1.0 1.0 2.0 7.0 11.0 0.5 14.0Sugar Mill 739 1.5 1.0 2.5 3.4 0.0 1.0 1.0 2.0 6.0 10.0 0.5 13.0Townewest 840 1.5 1.0 2.5 3.0 2.0 1.0 1.0 3.0 7.0 14.0 0.5 17.0Walker Station 904 1.5 1.0 2.5 2.8 0.0 1.0 1.0 2.0 4.0 8.0 0.5 11.0
Total 32,016 74.0 44.0 118.0 3.7 23.5 44.0 44.0 88.5 234.0 434.0 27.0 579.0
Clerical positions per 1,000 elementary students = 4.5 (with a minimum of 2 positions)

FORT BEND INDEPENDENT SCHOOL DISTRICTElementary Campus Paraprofessionals: Proposed
Enrollment as of November 19, 2009
Elementary Campus Sub-Total Clerical per Aide Aide Aide Aide Aide Sub-Total Clinic Total Schools Pupils Clerk Sec. Clerical 1,000 Stds Bil/ESL Copy Lib PK/K SpEd Inst. Aides Asst. Para.
Armstrong 809 2.0 1.0 3.0 3.7 2.0 1.0 1.0 3.0 5.0 12.0 1.0 16.0Austin Parkway 817 2.0 1.0 3.0 3.7 0.0 1.0 1.0 2.0 5.0 9.0 0.5 12.5Barrington Place 876 2.0 1.0 3.0 3.4 1.0 1.0 1.0 3.0 10.0 16.0 0.5 19.5Blue Ridge 638 2.0 1.0 3.0 4.7 1.0 1.0 1.0 2.0 5.0 10.0 1.0 14.0Brazos Bend 779 2.0 1.0 3.0 3.9 1.0 1.0 1.0 3.0 4.0 10.0 0.5 13.5Briargate 617 2.0 1.0 3.0 4.9 0.0 1.0 1.0 2.0 2.0 6.0 0.5 9.5Burton 937 2.5 1.0 3.5 3.7 2.0 1.0 1.0 4.0 2.0 10.0 0.5 14.0Colony Bend 400 1.0 1.0 2.0 5.0 0.0 1.0 1.0 1.0 8.0 11.0 0.5 13.5Colony Meadows 593 1.5 1.0 2.5 4.2 0.0 1.0 1.0 1.0 6.0 9.0 0.5 12.0Commonwealth 705 1.5 1.0 2.5 3.5 0.0 1.0 1.0 1.0 8.0 11.0 0.5 14.0Cornerstone 750 1.5 1.0 2.5 3.3 0.0 1.0 1.0 2.0 4.0 8.0 0.5 11.0Drabek 917 2.0 1.0 3.0 3.3 0.0 1.0 1.0 1.0 7.0 10.0 0.5 13.5Dulles 672 1.5 1.0 2.5 3.7 0.0 1.0 1.0 3.0 3.0 8.0 0.5 11.0Fleming 696 2.0 1.0 3.0 4.3 1.0 1.0 1.0 2.5 4.0 9.5 0.5 13.0Glover 803 2.0 1.0 3.0 3.7 0.0 1.0 1.0 2.0 7.0 11.0 1.0 15.0Goodman 643 1.5 1.0 2.5 3.9 1.0 1.0 1.0 0.0 4.0 7.0 0.5 10.0Highlands 586 1.5 1.0 2.5 4.3 0.0 1.0 1.0 2.0 6.0 10.0 0.5 13.0Holley 768 2.0 1.0 3.0 3.9 0.5 1.0 1.0 3.0 5.0 10.5 0.5 14.0Hunters Glen 617 2.0 1.0 3.0 4.9 0.0 1.0 1.0 3.0 6.0 11.0 1.0 15.0Jones 761 2.0 1.0 3.0 3.9 1.0 1.0 1.0 3.5 7.0 13.5 1.0 17.5Jordan 805 2.0 1.0 3.0 3.7 0.0 1.0 1.0 3.0 4.0 9.0 0.5 12.5Lakeview 563 1.5 1.0 2.5 4.4 0.0 1.0 1.0 3.0 6.0 11.0 0.5 14.0Lantern Lane 645 2.0 1.0 3.0 4.7 0.0 1.0 1.0 2.0 4.0 8.0 1.0 12.0Lexington Creek 666 1.5 1.0 2.5 3.8 0.0 1.0 1.0 2.0 5.0 9.0 0.5 12.0Meadows 432 1.0 1.0 2.0 4.6 0.0 1.0 1.0 0.0 5.0 7.0 0.5 9.5Mission Bend 801 2.0 1.0 3.0 3.7 2.0 1.0 1.0 1.0 5.0 10.0 0.5 13.5Mission Glen 723 1.5 1.0 2.5 3.5 1.0 1.0 1.0 3.5 5.0 11.5 0.5 14.5Mission West 775 2.0 1.0 3.0 3.9 3.0 1.0 1.0 3.0 4.0 12.0 0.5 15.5Oakland 811 2.0 1.0 3.0 3.7 0.0 1.0 1.0 2.0 5.0 9.0 0.5 12.5Oyster Creek 822 2.0 1.0 3.0 3.6 0.0 1.0 1.0 2.0 7.0 11.0 0.5 14.5Palmer 754 2.0 1.0 3.0 4.0 0.0 1.0 1.0 0.0 9.0 11.0 0.5 14.5Parks 618 1.5 1.0 2.5 4.0 0.0 1.0 1.0 1.0 5.0 8.0 0.5 11.0

FORT BEND INDEPENDENT SCHOOL DISTRICTElementary Campus Paraprofessionals: Proposed
Enrollment as of November 19, 2009
Pecan Grove 583 1.5 1.0 2.5 4.3 0.0 1.0 1.0 3.0 4.0 9.0 0.5 12.0Quail Valley 615 2.0 1.0 3.0 4.9 0.0 1.0 1.0 2.0 4.0 8.0 1.0 12.0Ridgegate 755 2.0 1.0 3.0 4.0 2.0 1.0 1.0 4.0 6.0 14.0 1.0 18.0Ridgemont 807 2.0 1.0 3.0 3.7 2.0 1.0 1.0 1.0 2.0 7.0 1.0 11.0Scanlan Oaks 958 3.5 1.0 4.5 4.7 0.0 1.0 1.0 0.0 6.0 8.0 0.5 13.0Schiff 823 2.0 1.0 3.0 3.6 0.0 1.0 1.0 2.0 5.0 9.0 0.5 12.5Seguin 493 1.0 1.0 2.0 4.1 1.0 1.0 1.0 0.0 3.0 6.0 0.5 8.5Settlers Way 734 1.5 1.0 2.5 3.4 0.0 1.0 1.0 1.0 8.0 11.0 0.5 14.0Sienna Crossing 966 2.5 1.0 3.5 3.6 0.0 1.0 1.0 2.0 7.0 11.0 0.5 15.0Sugar Mill 739 1.5 1.0 2.5 3.4 0.0 1.0 1.0 2.0 6.0 10.0 0.5 13.0Townewest 840 2.0 1.0 3.0 3.6 2.0 1.0 1.0 3.0 7.0 14.0 0.5 17.5Walker Station 904 2.5 1.0 3.5 3.9 0.0 1.0 1.0 2.0 4.0 8.0 0.5 12.0
Total 32,016 81.5 44.0 125.5 3.9 23.5 44.0 44.0 88.5 234.0 434.0 26.5 586.0
Clerical positions per 1,000 elementary students = 4.5 (with a minimum of 2 positions) Seven and one-half (7.5) additional elementary clerks are needed to get to benchmark levels

FORT BEND INDEPENDENT SCHOOL DISTRICTSecondary Campus Paraprofessionals: Current
Enrollment and Staffing as of November 19, 2009Clerical Aide Sub-Total
Secondary Sec., Bkkpr, Campus Sub-Total per 1,000 Aide ISS, Aide Aide Aide Clinic Total Schools Pupils Clerk Rgstrar Sec. Clerical Students Copy CAEP Lib SpEd Instruct. Asst. Para.
Austin 2,350 6.0 5.0 1.0 12.0 5.1 1.0 2.0 1.0 7.0 11.0 1.0 24.0Bush 2,021 6.0 5.0 1.0 12.0 5.9 1.0 2.0 1.0 9.0 13.0 1.0 26.0Clements 2,804 7.0 5.0 1.0 13.0 4.6 1.0 2.0 1.0 10.0 14.0 1.0 28.0Dulles 2,073 6.0 5.0 1.0 12.0 5.8 1.0 2.0 1.0 7.0 11.0 1.0 24.0Elkins 2,387 6.0 5.0 1.0 12.0 5.0 1.0 2.0 1.0 13.0 17.0 1.0 30.0Hightower 2,728 7.0 5.0 1.0 13.0 4.8 1.0 2.0 1.0 9.0 13.0 1.0 27.0Kempner 2,537 7.0 5.0 1.0 13.0 5.1 1.0 2.0 1.0 8.0 12.0 1.0 26.0Marshall 1,450 6.0 5.0 1.0 12.0 8.3 1.0 2.0 1.0 11.0 15.0 1.0 28.0Travis 2,179 6.0 5.0 1.0 12.0 5.5 1.0 2.0 1.0 13.0 17.0 1.0 30.0Willowridge 1,461 6.0 5.0 1.0 12.0 8.2 1.0 2.0 1.0 9.0 13.0 1.0 26.0
Baines 1,361 4.0 2.0 1.0 7.0 5.1 1.0 1.0 1.0 8.0 11.0 1.0 19.0Crockett 1,352 4.0 2.0 1.0 7.0 5.2 1.0 1.0 1.0 7.0 10.0 1.0 18.0Dulles 1,345 4.0 2.0 1.0 7.0 5.2 1.0 1.0 1.0 9.0 12.0 1.0 20.0First Colony 1,116 4.0 2.0 1.0 7.0 6.3 1.0 1.0 1.0 6.0 9.0 1.0 17.0Fort Settlement 1,097 4.0 2.0 1.0 7.0 6.4 1.0 1.0 1.0 8.0 11.0 1.0 19.0Garcia 1,359 4.0 2.0 1.0 7.0 5.2 1.0 1.0 1.0 8.0 11.0 1.0 19.0Hodges Bend 1,401 4.0 2.0 1.0 7.0 5.0 1.0 1.0 1.0 7.0 10.0 1.0 18.0Lake Olympia 1,334 4.0 2.0 1.0 7.0 5.2 1.0 1.0 1.0 7.0 10.0 1.0 18.0McAuliffe 610 4.0 2.0 1.0 7.0 11.5 1.0 1.0 1.0 6.0 9.0 1.0 17.0Missouri City 762 4.0 2.0 1.0 7.0 9.2 1.0 1.0 1.0 7.0 10.0 1.0 18.0Quail Valley 847 4.0 2.0 1.0 7.0 8.3 1.0 1.0 1.0 5.0 8.0 1.0 16.0Sartartia 1,269 4.0 2.0 1.0 7.0 5.5 1.0 1.0 1.0 8.0 11.0 1.0 19.0Sugar Land 1,412 4.0 2.0 1.0 7.0 5.0 1.0 1.0 1.0 11.0 14.0 1.0 22.0
Total 37,255 115.0 76.0 23.0 214.0 5.7 23.0 33.0 23.0 193.0 272.0 23.0 509.0
Clerical positions per 1,000 secondary students = 5.5 (with a minimum of 3 positions)
69,403 students x 13.3 instructional aide positions per 1,000 students = 923.1 positions (Current staffing = 434.0 elementary aides + 272.0 secondary aides = 706.0 instructional aides)

FORT BEND INDEPENDENT SCHOOL DISTRICTSecondary Campus Paraprofessionals: Proposed
Enrollment as of November 19, 2009
Clerical Aide Sub-TotalSecondary Sec., Bkkpr, Campus Sub-Total per 1,000 Aide ISS, Aide Aide Aide Clinic Total Schools Pupils Clerk Rgstrar Sec. Clerical Students Copy CAEP Lib SpEd Instruct. Asst. Para.
Austin 2,350 7.0 5.0 1.0 13.0 5.5 1.0 2.0 1.0 7.0 11.0 1.0 25.0Bush 2,021 6.0 5.0 1.0 12.0 5.9 1.0 2.0 1.0 9.0 13.0 1.0 26.0Clements 2,804 9.0 5.0 1.0 15.0 5.3 1.0 2.0 1.0 10.0 14.0 1.0 30.0Dulles 2,073 6.0 5.0 1.0 12.0 5.8 1.0 2.0 1.0 7.0 11.0 1.0 24.0Elkins 2,387 6.0 5.0 1.0 12.0 5.0 1.0 2.0 1.0 13.0 17.0 1.0 30.0Hightower 2,728 9.0 5.0 1.0 15.0 5.5 1.0 2.0 1.0 9.0 13.0 1.0 29.0Kempner 2,537 8.0 5.0 1.0 14.0 5.5 1.0 2.0 1.0 8.0 12.0 1.0 27.0Marshall 1,450 3.0 5.0 1.0 9.0 6.2 1.0 2.0 1.0 11.0 15.0 1.0 25.0Travis 2,179 6.0 5.0 1.0 12.0 5.5 1.0 2.0 1.0 13.0 17.0 1.0 30.0Willowridge 1,461 3.0 5.0 1.0 9.0 6.2 1.0 2.0 1.0 9.0 13.0 1.0 23.0
Baines 1,361 4.5 2.0 1.0 7.5 5.5 1.0 1.0 1.0 8.0 11.0 1.0 19.5Crockett 1,352 4.5 2.0 1.0 7.5 5.5 1.0 1.0 1.0 7.0 10.0 1.0 18.5Dulles 1,345 4.5 2.0 1.0 7.5 5.6 1.0 1.0 1.0 9.0 12.0 1.0 20.5First Colony 1,116 4.0 2.0 1.0 7.0 6.3 1.0 1.0 1.0 6.0 9.0 1.0 17.0Fort Settlement 1,097 4.0 2.0 1.0 7.0 6.4 1.0 1.0 1.0 8.0 11.0 1.0 19.0Garcia 1,359 4.5 2.0 1.0 7.5 5.5 1.0 1.0 1.0 8.0 11.0 1.0 19.5Hodges Bend 1,401 4.5 2.0 1.0 7.5 5.4 1.0 1.0 1.0 7.0 10.0 1.0 18.5Lake Olympia 1,334 4.5 2.0 1.0 7.5 5.6 1.0 1.0 1.0 7.0 10.0 1.0 18.5McAuliffe 610 2.0 2.0 1.0 5.0 8.2 1.0 1.0 1.0 6.0 9.0 1.0 15.0Missouri City 762 3.0 2.0 1.0 6.0 7.9 1.0 1.0 1.0 7.0 10.0 1.0 17.0Quail Valley 847 3.0 2.0 1.0 6.0 7.1 1.0 1.0 1.0 5.0 8.0 1.0 15.0Sartartia 1,269 4.0 2.0 1.0 7.0 5.5 1.0 1.0 1.0 8.0 11.0 1.0 19.0Sugar Land 1,412 5.0 2.0 1.0 8.0 5.7 1.0 1.0 1.0 11.0 14.0 1.0 23.0
Total 37,255 115.0 76.0 23.0 214.0 5.7 23.0 33.0 23.0 193.0 272.0 23.0 509.0
Clerical positions per 1,000 secondary students = 5.5 (with a minimum of 3 positions) Total secondary clerks are at benchmark levels, but the reassignments would balance the load across all campuses
69,403 students x 13.3 instructional aide positions per 1,000 students = 923.1 positions (Current staffing = 434.0 elementary aides + 272.0 secondary aides = 706.0 instructional aides)

FORT BEND INDEPENDENT SCHOOL DISTRICTNon-Campus Clerical Support
Staffing as of November 19, 2009
Department or Office Clerk Secretary Specialist Total
Administration Building 23 48 31 102
Administrative Annex 3 10 3 16
Athletics 0 2 0 2
Facilities 5 4 0 9
Maintenance 1 0 0 1
Natatorium 0 1 0 1
Operations 1 1 0 2
Purchasing 7 6 0 13
Transportation 4 2 0 6
Total Positions 44 74 34 152
69,403 students x 2.0 non-campus clerical positions per 1,000 students = 138.8 positions
Thirteen (13) positions over benchmark @ $31,788 = $413,244

FORT BEND INDEPENDENT SCHOOL DISTRICTCampus Clinics
Staffing as of November 19, 2009
Current Staffing Model
Average TotalJob Title Payroll Positions Compensation
Licensed Vocational Nurse (LVN) $32,043 0 $0
Registered Nurse (RN) $56,466 71 $4,009,086
Current Model Total Payroll $4,009,086
Proposed Staffing Model
Average TotalJob Title Payroll Positions Compensation
Licensed Vocational Nurse (LVN) $32,043 71 $2,275,053
Registered Nurse (RN) $53,376 15 $800,640
Proposed Model Total Payroll $3,075,693
Savings by Implementation of New Model $933,393

FORT BEND INDEPENDENT SCHOOL DISTRICTProfessional and Administrative Support Positions
Comparison of AEIS Data for 2006-07, 2007-08, 2008-09, and 2009-10
Criterion
Students 66,792 67,780 68,507 4,708,204 69,069Membership Increase 988 727 562
Professional Support 860.2 960.0 1,003.3 54,475.5 1,016.6Therapist & Physician 23.1 19.9 17.7 16.5Counselor 129.3 137.8 137.9 136.6Librarian 69.4 75.2 74.9 77.0Social Worker 11.3 9.9 9.0 11.0Nurse 62.9 67.0 67.9 71.0Speech Pathologist 35.5 32.5 32.8 33.8Diagnostician & LSSP 71.6 74.8 80.0 81.4Teacher Facilitator 64.5 121.4 124.9 124.8Department Head 135.9 163.4 150.1 158.8Campus Prof. Personnel 64.7 50.2 89.7 74.3Non-Campus Prof. Personnel 184.2 198.9 209.4 221.4Athletic Trainer 7.0 9.0 9.0 10.0
859.4 960.0 1,003.3 1,016.6Prof Support per 1,000 Stds 12.9 14.2 14.6 11.6 14.7
Campus Admin. 191.1 195.5 196.6 18,324.9 199.3Campus Adm per 1,000 Stds 2.9 2.9 2.9 3.9 2.9
Central Admin. 54.6 31.0 28.0 6,671.7 30.8Central Adm per 1,000 Stds 0.8 0.5 0.4 1.4 0.4
Total Prof. & Admin. Support 1,105.9 1,186.5 1,227.9 79,472.1 1,246.7Total Support per 1,000 Stds 16.6 17.5 17.9 16.9 18.1
69,069 students x 16.9 administrative and support positions per 1,000 students = 1,167.3 positions
1,246.7 - 1,167.3 = 74.4 surplus positions @ $67,640 = $5,370,616 in salary and benefits costs
(06-07)Fort Bend Fort Bend
(08-09)Fort Bend
(09-10)State Average
(08-09)Fort Bend
(07-08)

Class Size

FORT BEND INDEPENDENT SCHOOL DISTRICTElementary Enrollment as of November 6, 2009
Current Sections
Pre-K Grade 2 Grade 3 Grade 4Fort Bend ISDElementary # Class # Class # Class # Class # Class # Class # Class # Class # ClassSchools Sect Enr. Avg. Sect Enr. Avg. Sect Enr. Avg. Sect Enr. Avg. Sect Enr. Avg. Sect Enr. Avg. Sect Enr. Avg. Sect Enr. Avg. Tchrs Enr. Avg.
ArmstrongRegular Ed 1 22 22.0 3 56 18.7 4 72 18.0 3 54 18.0 4 68 17.0 3 59 19.7 3 79 26.3 3 63 21.0 23.5 462 19.7Bilingual Ed 1 19 19.0 2 43 21.5 3 56 18.7 3 63 21.0 2 42 21.0 2 42 21.0 2 36 1 23 23.0 15.5 315 20.3
Austin ParkwayRegular Ed 5 110 22.0 6 122 20.3 7 137 19.6 7 135 19.3 8 154 19.3 6 149 24.8 39 807 20.7
Barrington Place
Regular Ed 1 22 22.0 7 140 20.0 6 125 20.8 6 130 21.7 7 150 21.4 7 147 21.0 5 129 25.8 38.5 832 21.6Regular Ed (PM) 1 22 22.0 0.5 11 22.0
Blue RidgeRegular Ed 1 19 19.0 3 45 15.0 3 54 18.0 4 75 18.8 4 71 17.8 3 55 18.3 3 65 21.7 3 72 24.0 23.5 447 19.0Bilingual Ed 1 18 18.0 2 28 14.0 2 23 11.5 1 21 21.0 2 33 16.5 2 37 18.5 1 14 14.0 10.5 165 15.7
Brazos BendRegular Ed 6 115 19.2 7 115 16.4 6 118 19.7 7 139 19.9 7 155 22.1 5 134 26.8 38 776 20.4
BriargateRegular Ed (AM) 1 21 21.0 3 69 23.0 5 87 17.4 4 72 18.0 4 70 17.5 5 100 20.0 3 78 26.0 5 100 20.0 29.5 587 19.9Regular Ed (PM) 1 21 21.0 0.5 11 21.0
BurtonRegular Ed 1 21 21.0 4 72 18.0 4 84 21.0 5 95 19.0 5 91 18.2 5 96 19.2 4 97 24.3 27.5 546 19.8Bilingual Ed 1 23 23.0 3 55 18.3 3 58 19.3 3 60 20.0 3 62 20.7 2 43 21.5 3 68 22.7 17.5 358 20.4
Colony BendRegular Ed 2 45 22.5 3 61 20.3 3 59 19.7 4 70 17.5 3 57 19.0 3 85 28.3 18 377 20.9
Colony MeadowsRegular Ed (AM) 1 22 22.0 5 78 15.6 4 89 22.3 4 85 21.3 5 96 19.2 5 91 18.2 5 105 21.0 28.5 555 19.5Regular Ed (PM) 1 21 21.0 0.5 11 21.0
CommonwealthRegular Ed 4 76 19.0 4 91 22.8 6 115 19.2 5 104 20.8 7 152 21.7 7 156 22.3 33 694 21.0
CornerstoneRegular Ed 6 117 19.5 7 130 18.6 6 132 22.0 6 121 20.2 7 136 19.4 4 103 25.8 36 739 20.5
DrabekRegular Ed (AM) 1 22 22.0 6 118 19.7 8 171 21.4 7 137 19.6 7 156 22.3 7 141 20.1 6 139 23.2 42 884 21.0Regular Ed (PM) 1 21 21.0 1 21 21.0
DullesRegular Ed 5 104 20.8 6 110 18.3 6 114 19.0 5 97 19.4 6 112 18.7 6 132 22.0 34 669 19.7
Grade 5 Grade 6 Total Kindergarten Grade 1

FORT BEND INDEPENDENT SCHOOL DISTRICTElementary Enrollment as of November 6, 2009
Current Sections
Pre-K Grade 2 Grade 3 Grade 4Fort Bend ISDElementary # Class # Class # Class # Class # Class # Class # Class # Class # ClassSchools Sect Enr. Avg. Sect Enr. Avg. Sect Enr. Avg. Sect Enr. Avg. Sect Enr. Avg. Sect Enr. Avg. Sect Enr. Avg. Sect Enr. Avg. Tchrs Enr. Avg.
Grade 5 Grade 6 Total Kindergarten Grade 1
FlemingRegular Ed (AM) 1 22 22.0 4 71 17.8 5 101 20.2 4 67 16.8 4 83 20.8 5 91 18.2 5 99 19.8 27.5 523 19.0Regular Ed (PM) 1 21 21.0 0.5 11 21.0Bilingual Ed 1 19 19.0 1 17 17.0 2 21 10.5 2 21 10.5 1 14 14.0 2 22 11.0 1 13 13.0 9.5 118 12.4
GloverRegular Ed (AM) 1 17 17.0 4 74 18.5 5 101 20.2 5 91 18.2 6 121 20.2 6 118 19.7 6 117 19.5 6 112 18.7 38.5 743 19.3Regular Ed (PM) 1 21 21.0 0.5 11 21.0
GoodmanRegular Ed 4 67 16.8 4 88 22.0 5 90 18.0 4 92 23.0 4 87 21.8 4 94 23.5 25 518 20.7Bilingual Ed 1 25 25.0 1 16 16.0 1 20 2.0 2 24 12.0 1 15 15.0 1 10 10.0 7 110 15.7
HighlandsRegular Ed (AM) 1 22 22.0 4 74 18.5 4 76 19.0 5 108 21.6 4 86 21.5 4 82 20.5 5 103 20.6 26.5 540 20.4Regular Ed (PM) 1 22 22.0 0.5 11 22.0
HolleyRegular Ed 5 90 18.0 7 133 19.0 4 83 20.8 5 101 20.2 6 119 19.8 4 99 24.8 31 625 20.2Bilingual Ed 1 21 21.0 1 20 20.0 1 20 20.0 1 18 18.0 1 17 17.0 1 14 14.0 1 11 11.0 6.5 111 17.0
Hunters GlenRegular Ed (AM) 1 22 22.0 3 61 20.3 5 90 18.0 4 81 20.3 4 75 18.8 4 81 20.3 5 99 19.8 4 80 20.0 29.5 578 19.6Regular Ed (PM) 1 19 19.0 0.5 10 19.0
JonesRegular Ed 4 75 18.8 4 73 18.3 4 66 16.5 4 73 18.3 3 60 20.0 3 83 27.7 4 87 21.8 26 517 19.9Bilingual Ed (AM) 1 16 16.0 2 37 18.5 2 36 18.0 1 24 24.0 2 39 19.5 2 37 18.5 1 20 20.0 10.5 201 19.1Bilingual Ed (PM) 1 13 13.0 0.5 7 13.0
JordanRegular Ed (AM) 1 24 24.0 5 103 20.6 6 135 22.5 7 136 19.4 6 120 20.0 6 130 21.7 6 141 23.5 36.5 777 21.3Regular Ed (PM) 1 21 21.0 0.5 11 21.0
LakeviewRegular Ed 4 71 17.8 5 94 18.8 5 95 19.0 5 93 18.6 5 104 20.8 4 100 25.0 28 557 19.9
Lantern LaneRegular Ed 4 80 20.0 5 90 18.0 4 83 20.8 5 96 19.2 5 97 19.4 5 105 21.0 4 84 21.0 32 635 19.8
Lexington CreekRegular Ed 4 85 21.3 5 106 21.2 6 115 19.2 5 100 20.0 6 117 19.5 6 131 21.8 32 654 20.4
MeadowsRegular Ed 3 58 19.3 4 69 17.3 4 76 19.0 4 72 18.0 4 80 20.0 3 75 25.0 22 430 19.5
Mission BendRegular Ed 1 22 22.0 4 77 19.3 5 100 20.0 5 95 19.0 4 84 21.0 5 88 17.6 4 92 23.0 27.5 547 19.9Regular Ed (PM) 1 22 22.0 0.5 11 22.0Bilingual Ed 2 35 17.5 2 31 15.5 3 44 14.7 2 37 18.5 2 43 21.5 1 24 24.0 12 214 17.8
Mission Glen

FORT BEND INDEPENDENT SCHOOL DISTRICTElementary Enrollment as of November 6, 2009
Current Sections
Pre-K Grade 2 Grade 3 Grade 4Fort Bend ISDElementary # Class # Class # Class # Class # Class # Class # Class # Class # ClassSchools Sect Enr. Avg. Sect Enr. Avg. Sect Enr. Avg. Sect Enr. Avg. Sect Enr. Avg. Sect Enr. Avg. Sect Enr. Avg. Sect Enr. Avg. Tchrs Enr. Avg.
Grade 5 Grade 6 Total Kindergarten Grade 1
Regular Ed 1 22 22.0 5 106 21.2 5 96 19.2 6 110 18.3 6 128 21.3 6 118 19.7 5 114 22.8 33.5 683 20.4Regular Ed (PM) 1 22 22.0 0.5 11 22.0
Mission WestRegular Ed (AM) 1 21 21.0 4 71 17.8 4 72 18.0 4 76 19.0 4 79 19.8 5 91 18.2 4 88 22.0 25.5 488 19.1Regular Ed (PM) 1 21 21.0 0.5 11 21.0Bilingual Ed (AM) 1 19 19.0 2 39 19.5 2 41 20.5 2 39 19.5 2 32 16.0 2 36 18.0 2 30 15.0 12.5 227 18.1Bilingual Ed (PM) 1 17 17.0 0.5 9 17.0
OaklandRegular Ed 7 141 20.1 6 132 22.0 6 132 22.0 7 150 21.4 6 119 19.8 5 125 25.0 37 799 21.6
Oyster CreekRegular Ed 6 110 18.3 7 144 20.6 5 102 20.4 7 147 21.0 8 151 18.9 7 161 23.0 40 815 20.4
PalmerRegular Ed 5 104 20.8 7 133 19.0 5 93 18.6 6 127 21.2 7 151 21.6 6 142 23.7 36 750 20.8
ParksRegular Ed 1 22 22.0 3 55 18.3 4 65 16.3 3 56 18.7 4 72 18.0 4 84 21.0 3 72 24.0 21.5 415 19.3Bilingual Ed (AM) 1 22 22.0 1 25 25.0 2 26 13.0 1 20 20.0 2 27 13.5 1 20 20.0 1 18 18.0 8.5 147 17.3Bilingual Ed (PM) 1 14 14.0 0.5 7 14.0
Pecan GroveRegular Ed (AM) 1 22 22.0 4 80 20.0 4 78 19.5 4 82 20.5 4 88 22.0 5 101 20.2 4 101 25.3 25.5 541 21.2Regular Ed (PM) 1 20 20.0 0.5 10 20.0
Quail ValleyRegular Ed (AM) 1 17 17.0 4 73 18.3 4 82 4.0 4 77 19.3 4 87 21.8 4 87 21.8 4 88 22.0 4 78 19.5 28.5 581 20.4Regular Ed (PM) 1 19 19.0 0.5 10 19.0
RidgegateRegular Ed (AM) 1 17 17.0 3 56 18.7 4 73 18.3 3 51 17.0 3 62 20.7 3 54 18.0 4 81 20.3 5 84 16.8 25.5 470 18.4Regular Ed (PM) 1 20 20.0 0.5 10 20.0Bilingual Ed (AM) 1 20 20.0 2 32 16.0 2 33 16.5 2 29 14.5 2 33 16.5 2 30 15.0 2 19 9.5 2 32 16.0 14.5 218 15.0Bilingual Ed (PM) 1 15 15.0 0.5 8 15.0
RidgemontRegular Ed (AM) 1 18 18.0 3 58 19.3 3 62 20.7 3 61 20.3 3 46 15.3 4 55 13.8 4 81 20.3 5 80 16.0 25.5 452 17.7Regular Ed (PM) 1 14 14.0 0.5 7 14.0Bilingual Ed (AM) 1 22 22.0 3 56 18.7 3 45 15.0 3 44 14.7 3 46 15.3 2 41 20.5 1 22 22.0 15.5 265 17.1Bilingual Ed (PM) 1 22 22.0 0.5 11 22.0
Scanlan OaksRegular Ed 8 167 20.9 8 170 21.3 7 143 20.4 8 167 20.9 8 160 20.0 6 135 22.5 45 942 20.9
SchiffRegular Ed 7 112 16.0 7 146 20.9 6 129 21.5 8 155 19.4 8 140 17.5 5 129 25.8 41 811 19.8
SeguinRegular Ed 5 107 21.4 3 63 21.0 4 74 18.5 3 58 19.3 3 61 20.3 3 64 21.3 21 427 20.3

FORT BEND INDEPENDENT SCHOOL DISTRICTElementary Enrollment as of November 6, 2009
Current Sections
Pre-K Grade 2 Grade 3 Grade 4Fort Bend ISDElementary # Class # Class # Class # Class # Class # Class # Class # Class # ClassSchools Sect Enr. Avg. Sect Enr. Avg. Sect Enr. Avg. Sect Enr. Avg. Sect Enr. Avg. Sect Enr. Avg. Sect Enr. Avg. Sect Enr. Avg. Tchrs Enr. Avg.
Grade 5 Grade 6 Total Kindergarten Grade 1
Bilingual Ed 1 15 15.0 1 17 17.0 1 17 17.0 1 12 12.0 4 61 15.3
Settlers WayRegular Ed (AM) 1 22 22.0 5 96 19.2 6 112 18.7 5 105 21.0 5 109 21.8 5 103 20.6 5 125 25.0 31.5 661 21.0Regular Ed (PM) 1 22 22.0 0.5 11 22.0
Sienna CrossingRegular Ed 8 152 19.0 8 170 21.3 8 159 19.9 8 156 19.5 8 163 20.4 6 153 25.5 46 953 20.7
Sugar MillRegular Ed 6 111 18.5 6 118 19.7 6 122 20.3 7 124 17.7 6 131 21.8 6 130 21.7 37 736 19.9
TownewestRegular Ed (AM) 1 22 22.0 4 78 19.5 5 102 20.4 5 100 20.0 5 94 18.8 5 105 21.0 5 119 23.8 29.5 609 20.6Regular Ed (PM) 1 22 22.0 0.5 11 22.0Bilingual Ed 2 24 12.0 2 26 13.0 2 37 18.5 2 32 16.0 2 33 16.5 2 32 16.0 12 184 15.3
Walker StationRegular Ed 6 114 19.0 8 159 19.9 7 137 19.6 8 167 20.9 8 160 20.0 7 162 23.1 44 899 20.4
TOTAL 28 556 20.2 228 4,358 19.1 258 4,991 19.3 246 4,775 19.4 257 5,035 19.6 263 5,168 19.7 228 5,176 22.7 46 895 19.5 1,555 30,976 19.9
Bilingual Ed = 159 2,732 17.2K-4 Class Average = 1,252 sections with 24,327 students = 19.4 students per class Regular Ed = 1,396 28,244 20.2PK-6 Class Average = 1,555 sections with 30,976 students = 19.9 students per class
$265,830 = savings @ 20.1 students per section, = 1507 sections, 5 fewer sections than the current staffing format$531,660 = savings @ 20.1 students per section, = 1502 sections, 10 fewer sections than the current staffing format$797,490 = savings @ 20.2 students per section, = 1497 sections, 15 fewer sections than the current staffing format
$1,063,320 = savings @ 20.3 students per section, = 1492 sections, 20 fewer sections than the current staffing format$1,329,150 = savings @ 20.3 students per section, = 1487 sections, 25 fewer sections than the current staffing format

FORT BEND INDEPENDENT SCHOOL DISTRICTElementary Enrollment as of November 6, 2009
Proposed Sections
Pre-K Grade 2 Grade 3 Grade 4Fort Bend ISDElementary # Class # Class # Class # Class # Class # Class # Class # Class # ClassSchools Sect Enr. Avg. Sect Enr. Avg. Sect Enr. Avg. Sect Enr. Avg. Sect Enr. Avg. Sect Enr. Avg. Sect Enr. Avg. Sect Enr. Avg. Tchrs Enr. Avg.
ArmstrongRegular Ed 1 22 22.0 3 56 18.7 4 72 18.0 3 54 18.0 4 68 17.0 3 59 19.7 3 79 26.3 3 63 21.0 23.5 462 19.7Bilingual Ed 1 19 19.0 2 43 21.5 3 56 18.7 3 63 21.0 2 42 21.0 2 42 21.0 2 36 1 23 23.0 15.5 315 20.3
Austin Parkway
Regular Ed 5 110 22.0 6 122 20.3 7 137 19.6 7 135 19.3 7 154 22.0 6 149 24.8 38 807 21.2
Barrington Place
Regular Ed 1 22 22.0 7 140 20.0 6 125 20.8 6 130 21.7 7 150 21.4 7 147 21.0 5 129 25.8 38.5 832 21.6Regular Ed (PM) 1 22 22.0 0.5 11 22.0
Blue RidgeRegular Ed 1 19 19.0 3 45 15.0 3 54 18.0 4 75 18.8 4 71 17.8 3 55 18.3 3 65 21.7 3 72 24.0 23.5 447 19.0Bilingual Ed 1 18 18.0 2 28 14.0 2 23 11.5 1 21 21.0 2 33 16.5 2 37 18.5 1 14 14.0 10.5 165 15.7
Brazos BendRegular Ed 6 115 19.2 6 115 19.2 6 118 19.7 7 139 19.9 7 155 22.1 5 134 26.8 37 776 21.0
BriargateRegular Ed (AM) 1 21 21.0 3 69 23.0 4 87 21.8 4 72 18.0 4 70 17.5 5 100 20.0 3 78 26.0 5 100 20.0 28.5 587 20.6Regular Ed (PM) 1 21 21.0 0.5 11 21.0
BurtonRegular Ed 1 21 21.0 4 72 18.0 4 84 21.0 5 95 19.0 5 91 18.2 5 96 19.2 4 97 24.3 27.5 546 19.8Bilingual Ed 1 23 23.0 3 55 18.3 3 58 19.3 3 60 20.0 3 62 20.7 2 43 21.5 3 68 22.7 17.5 358 20.4
Colony BendRegular Ed 2 45 22.5 3 61 20.3 3 59 19.7 4 70 17.5 3 57 19.0 3 85 28.3 18 377 20.9
Colony MeadowsRegular Ed (AM) 1 22 22.0 4 78 19.5 4 89 22.3 4 85 21.3 5 96 19.2 5 91 18.2 5 105 21.0 27.5 555 20.2Regular Ed (PM) 1 21 21.0 0.5 11 21.0
CommonwealthRegular Ed 4 76 19.0 4 91 22.8 6 115 19.2 5 104 20.8 7 152 21.7 7 156 22.3 33 694 21.0
CornerstoneRegular Ed 6 117 19.5 6 130 21.7 6 132 22.0 6 121 20.2 7 136 19.4 4 103 25.8 35 739 21.1
DrabekRegular Ed (AM) 1 22 22.0 6 118 19.7 8 171 21.4 7 137 19.6 7 156 22.3 7 141 20.1 6 139 23.2 42 884 21.0Regular Ed (PM) 1 21 21.0 1 21 21.0
Dulles
Grade 5 Grade 6 Total Kindergarten Grade 1

FORT BEND INDEPENDENT SCHOOL DISTRICTElementary Enrollment as of November 6, 2009
Proposed Sections
Pre-K Grade 2 Grade 3 Grade 4Fort Bend ISDElementary # Class # Class # Class # Class # Class # Class # Class # Class # ClassSchools Sect Enr. Avg. Sect Enr. Avg. Sect Enr. Avg. Sect Enr. Avg. Sect Enr. Avg. Sect Enr. Avg. Sect Enr. Avg. Sect Enr. Avg. Tchrs Enr. Avg.
Grade 5 Grade 6 Total Kindergarten Grade 1
Regular Ed 5 104 20.8 5 110 22.0 6 114 19.0 5 97 19.4 6 112 18.7 6 132 22.0 33 669 20.3
FlemingRegular Ed (AM) 1 22 22.0 4 71 17.8 5 101 20.2 4 67 16.8 4 83 20.8 5 91 18.2 5 99 19.8 27.5 523 19.0Regular Ed (PM) 1 21 21.0 0.5 11 21.0Bilingual Ed 1 19 19.0 1 17 17.0 1 21 21.0 1 21 21.0 1 14 14.0 1 22 22.0 1 13 13.0 6.5 118 18.1
GloverRegular Ed (AM) 1 17 17.0 4 74 18.5 5 101 20.2 5 91 18.2 6 121 20.2 6 118 19.7 6 117 19.5 5 112 22.4 37.5 743 19.8Regular Ed (PM) 1 21 21.0 0.5 11 21.0
GoodmanRegular Ed 4 67 16.8 4 88 22.0 5 90 18.0 4 92 23.0 4 87 21.8 4 94 23.5 25 518 20.7Bilingual Ed 1 25 25.0 1 16 16.0 1 20 2.0 2 24 12.0 1 15 15.0 1 10 10.0 7 110 15.7
HighlandsRegular Ed (AM) 1 22 22.0 4 74 18.5 4 76 19.0 5 108 21.6 4 86 21.5 4 82 20.5 5 103 20.6 26.5 540 20.4Regular Ed (PM) 1 22 22.0 0.5 11 22.0
HolleyRegular Ed 5 90 18.0 7 133 19.0 4 83 20.8 5 101 20.2 6 119 19.8 4 99 24.8 31 625 20.2Bilingual Ed 1 21 21.0 1 20 20.0 1 20 20.0 1 18 18.0 1 17 17.0 1 14 14.0 1 11 11.0 6.5 111 17.0
Hunters GlenRegular Ed (AM) 1 22 22.0 3 61 20.3 5 90 18.0 4 81 20.3 4 75 18.8 4 81 20.3 5 99 19.8 4 80 20.0 29.5 578 19.6Regular Ed (PM) 1 19 19.0 0.5 10 19.0
JonesRegular Ed 4 75 18.8 4 73 18.3 3 66 22.0 4 73 18.3 3 60 20.0 3 83 27.7 4 87 21.8 25 517 20.7Bilingual Ed (AM) 1 16 16.0 2 37 18.5 2 36 18.0 1 24 24.0 2 39 19.5 2 37 18.5 1 20 20.0 10.5 201 19.1Bilingual Ed (PM) 1 13 13.0 0.5 7 13.0
JordanRegular Ed (AM) 1 24 24.0 5 103 20.6 6 135 22.5 7 136 19.4 6 120 20.0 6 130 21.7 6 141 23.5 36.5 777 21.3Regular Ed (PM) 1 21 21.0 0.5 11 21.0
LakeviewRegular Ed 4 71 17.8 5 94 18.8 5 95 19.0 5 93 18.6 5 104 20.8 4 100 25.0 28 557 19.9
Lantern LaneRegular Ed 4 80 20.0 5 90 18.0 4 83 20.8 5 96 19.2 5 97 19.4 5 105 21.0 4 84 21.0 32 635 19.8
Lexington CreekRegular Ed 4 85 21.3 5 106 21.2 6 115 19.2 5 100 20.0 6 117 19.5 6 131 21.8 32 654 20.4
MeadowsRegular Ed 3 58 19.3 4 69 17.3 4 76 19.0 4 72 18.0 4 80 20.0 3 75 25.0 22 430 19.5

FORT BEND INDEPENDENT SCHOOL DISTRICTElementary Enrollment as of November 6, 2009
Proposed Sections
Pre-K Grade 2 Grade 3 Grade 4Fort Bend ISDElementary # Class # Class # Class # Class # Class # Class # Class # Class # ClassSchools Sect Enr. Avg. Sect Enr. Avg. Sect Enr. Avg. Sect Enr. Avg. Sect Enr. Avg. Sect Enr. Avg. Sect Enr. Avg. Sect Enr. Avg. Tchrs Enr. Avg.
Grade 5 Grade 6 Total Kindergarten Grade 1
Mission BendRegular Ed 1 22 22.0 4 77 19.3 5 100 20.0 5 95 19.0 4 84 21.0 5 88 17.6 4 92 23.0 27.5 547 19.9Regular Ed (PM) 1 22 22.0 0.5 11 22.0Bilingual Ed 2 35 17.5 2 31 15.5 2 44 22.0 2 37 18.5 2 43 21.5 1 24 24.0 11 214 19.5
Mission GlenRegular Ed 1 22 22.0 5 106 21.2 5 96 19.2 6 110 18.3 6 128 21.3 6 118 19.7 5 114 22.8 33.5 683 20.4Regular Ed (PM) 1 22 22.0 0.5 11 22.0
Mission WestRegular Ed (AM) 1 21 21.0 4 71 17.8 4 72 18.0 4 76 19.0 4 79 19.8 5 91 18.2 4 88 22.0 25.5 488 19.1Regular Ed (PM) 1 21 21.0 0.5 11 21.0Bilingual Ed (AM) 1 19 19.0 2 39 19.5 2 41 20.5 2 39 19.5 2 32 16.0 2 36 18.0 2 30 15.0 12.5 227 18.1Bilingual Ed (PM) 1 17 17.0 0.5 9 17.0
OaklandRegular Ed 7 141 20.1 6 132 22.0 6 132 22.0 7 150 21.4 6 119 19.8 5 125 25.0 37 799 21.6
Oyster CreekRegular Ed 5 110 22.0 7 144 20.6 5 102 20.4 7 147 21.0 7 151 21.6 7 161 23.0 38 815 21.4
PalmerRegular Ed 5 104 20.8 7 133 19.0 5 93 18.6 6 127 21.2 7 151 21.6 6 142 23.7 36 750 20.8
ParksRegular Ed 1 22 22.0 3 55 18.3 3 65 21.7 3 56 18.7 4 72 18.0 4 84 21.0 3 72 24.0 20.5 415 20.2Bilingual Ed (AM) 1 22 22.0 1 25 25.0 2 26 13.0 1 20 20.0 2 27 13.5 1 20 20.0 1 18 18.0 8.5 147 17.3Bilingual Ed (PM) 1 14 14.0 0.5 7 14.0
Pecan GroveRegular Ed (AM) 1 22 22.0 4 80 20.0 4 78 19.5 4 82 20.5 4 88 22.0 5 101 20.2 4 101 25.3 25.5 541 21.2Regular Ed (PM) 1 20 20.0 0.5 10 20.0
Quail ValleyRegular Ed (AM) 1 17 17.0 4 73 18.3 4 82 4.0 4 77 19.3 4 87 21.8 4 87 21.8 4 88 22.0 4 78 19.5 28.5 581 20.4Regular Ed (PM) 1 19 19.0 0.5 10 19.0
RidgegateRegular Ed (AM) 1 17 17.0 3 56 18.7 4 73 18.3 3 51 17.0 3 62 20.7 3 54 18.0 4 81 20.3 4 84 21.0 24.5 470 19.2Regular Ed (PM) 1 20 20.0 0.5 10 20.0Bilingual Ed (AM) 1 20 20.0 2 32 16.0 2 33 16.5 2 29 14.5 2 33 16.5 2 30 15.0 1 19 19.0 2 32 16.0 13.5 218 16.1Bilingual Ed (PM) 1 15 15.0 0.5 8 15.0
RidgemontRegular Ed (AM) 1 18 18.0 3 58 19.3 3 62 20.7 3 61 20.3 3 46 15.3 3 55 18.3 4 81 20.3 4 80 20.0 23.5 452 19.2Regular Ed (PM) 1 14 14.0 0.5 7 14.0Bilingual Ed (AM) 1 22 22.0 3 56 18.7 3 45 15.0 2 44 22.0 3 46 15.3 2 41 20.5 1 22 22.0 14.5 265 18.3

FORT BEND INDEPENDENT SCHOOL DISTRICTElementary Enrollment as of November 6, 2009
Proposed Sections
Pre-K Grade 2 Grade 3 Grade 4Fort Bend ISDElementary # Class # Class # Class # Class # Class # Class # Class # Class # ClassSchools Sect Enr. Avg. Sect Enr. Avg. Sect Enr. Avg. Sect Enr. Avg. Sect Enr. Avg. Sect Enr. Avg. Sect Enr. Avg. Sect Enr. Avg. Tchrs Enr. Avg.
Grade 5 Grade 6 Total Kindergarten Grade 1
Bilingual Ed (PM) 1 22 22.0 0.5 11 22.0
Scanlan OaksRegular Ed 8 167 20.9 8 170 21.3 7 143 20.4 8 167 20.9 8 160 20.0 6 135 22.5 45 942 20.9
SchiffRegular Ed 6 112 18.7 7 146 20.9 6 129 21.5 8 155 19.4 7 140 20.0 5 129 25.8 39 811 20.8
SeguinRegular Ed 5 107 21.4 3 63 21.0 4 74 18.5 3 58 19.3 3 61 20.3 3 64 21.3 21 427 20.3Bilingual Ed 1 15 15.0 1 17 17.0 1 17 17.0 1 12 12.0 4 61 15.3
Settlers WayRegular Ed (AM) 1 22 22.0 5 96 19.2 6 112 18.7 5 105 21.0 5 109 21.8 5 103 20.6 5 125 25.0 31.5 661 21.0Regular Ed (PM) 1 22 22.0 0.5 11 22.0
Sienna CrossingRegular Ed 7 152 21.7 8 170 21.3 8 159 19.9 8 156 19.5 8 163 20.4 6 153 25.5 45 953 21.2
Sugar MillRegular Ed 6 111 18.5 6 118 19.7 6 122 20.3 6 124 20.7 6 131 21.8 6 130 21.7 36 736 20.4
TownewestRegular Ed (AM) 1 22 22.0 4 78 19.5 5 102 20.4 5 100 20.0 5 94 18.8 5 105 21.0 5 119 23.8 29.5 609 20.6Regular Ed (PM) 1 22 22.0 0.5 11 22.0Bilingual Ed 2 24 12.0 2 26 13.0 2 37 18.5 2 32 16.0 2 33 16.5 2 32 16.0 12 184 15.3
Walker StationRegular Ed 6 114 19.0 8 159 19.9 7 137 19.6 8 167 20.9 8 160 20.0 7 162 23.1 44 899 20.4
TOTAL 28 556 20.2 224 4,358 19.5 252 4,991 19.8 242 4,775 19.7 256 5,035 19.7 258 5,168 20.0 227 5,176 22.8 43 895 20.8 1,531 30,976 20.2
Bilingual Ed = 153 2,732 17.9K-4 Class Average = 1232 sections with 24,327 students = 19.7 students per class Regular Ed = 1,378 28,244 20.5PK-6 Class Average = 1531 sections with 30,976 students = 20.2 students per class
Absorbing twenty-four (24) vacancies at $53,166 = $1,275,984 in salary and benefits costs

FORT BEND INDEPENDENT SCHOOL DISTRICTElementary School Physical Education
Staffing as of November 19, 2009
Current Staffing Model
Average TotalJob Title Payroll Positions Compensation
PE Teacher $56,865 52 $2,956,980
Current Model Total Payroll $2,956,980
Proposed Staffing Model
Average TotalJob Title Payroll Positions Compensation
PE Teacher $56,865 44 $2,502,060
PE Aide $17,252 8 $138,016
Proposed Model Total Payroll $2,640,076
Savings by Implementation of New Model $316,904

FORT BEND INDEPENDENT SCHOOL DISTRICTMiddle School Class Size Comparisons (MSs 1-4)
Enrollment and Staffing as of November 6, 2009
Course Students Students Students StudentsLang. Arts - 6 394 17 23.2 271 12 22.6 336 14 24.0 306 13 23.5Lang. Arts - 6 PAP/GT 24 1 24.0 168 6 28.0 16 1 16.0 20 1 20.0Lang. Arts - 7 357 13 27.5 232 9 25.8 318 11 28.9 204 8 25.5Lang. Arts - 7 PAP/GT 100 4 25.0 185 7 26.4 123 5 24.6 143 6 23.8Lang. Arts - 8 232 9 25.8 262 11 23.8 304 11 27.6 234 11 21.3Lang. Arts - 8 PAP/GT 125 4 31.3 155 6 25.8 169 6 28.2 142 6 23.7Reading - 6 394 17 23.2 271 12 22.6 336 14 24.0 306 13 23.5Reading - 6 PAP/GT 24 1 24.0 168 6 28.0 16 1 16.0 20 1 20.0Reading - 7 357 13 27.5 232 9 25.8 318 11 28.9 204 8 25.5Reading - 7 PAP/GT 100 4 25.0 185 7 26.4 123 5 24.6 143 6 23.8Reading - 8 232 9 25.8 262 11 23.8 304 11 27.6 234 11 21.3Reading - 8 PAP/GT 125 4 31.3 155 6 25.8 169 6 28.2 142 6 23.7Math - 6 441 18 24.5 259 11 23.5 351 16 21.9 312 12 26.0Math - 6 PAP/GT 31 1 31.0 204 7 29.1 16 1 16.0 23 1 23.0Math - 7 371 13 28.5 249 10 24.9 327 14 23.4 196 10 19.6Math - 7 PAP/GT 109 4 27.3 178 7 25.4 124 5 24.8 160 6 26.7Math - 8 291 12 24.3 316 14 22.6 363 15 24.2 271 13 20.8Algebra 1 PAP/GT 84 4 21.0 105 4 26.3 126 4 31.5 109 4 27.3Science - 6 455 19 23.9 291 11 26.5 361 14 25.8 329 13 25.3Science - 6 PAP/GT 26 1 26.0 181 6 30.2 16 1 16.0 21 1 21.0Earth Science 387 14 27.6 247 10 24.7 339 13 26.1 230 11 20.9Earth Science PAP/GT 99 4 24.8 187 7 26.7 121 5 24.2 134 5 26.8Life Science 273 11 24.8 285 12 23.8 334 12 27.8 264 12 22.0Life Science PAP/GT 107 4 26.8 143 6 23.8 166 6 27.7 128 5 25.6World Cultures - 6 461 20 23.1 311 12 25.9 363 15 24.2 332 13 25.5World Cult. - 6 PAP/GT 20 1 20.0 161 6 26.8 14 1 14.0 18 1 18.0Texas History 454 16 28.4 247 10 24.7 445 18 24.7 198 9 22.0Texas History PAP/GT 32 1 32.0 187 7 26.7 15 1 15.0 164 7 23.4American History 283 11 25.7 282 12 23.5 337 13 25.9 267 7 38.1Am. History PAP/GT 97 4 24.3 146 5 29.2 162 6 27.0 125 5 25.0Spanish 2 170 8 21.3 140 5 28.0 182 7 26.0 96 5 19.2Student/Teacher Total Total Class Total Total Class Total Total Class Total Total ClassAverage Counts Students Sections Average Students Sections Average Students Sections Average Students Sections AverageCore Subject Counts 6,655 262 25.4 6,665 264 25.2 6,694 263 25.5 5,475 230 23.8Std/Tchr (Reg Ed) Students Teachers Ratio Students Teachers Ratio Students Teachers Ratio Students Teachers RatioStaffing Counts 1,360 67.4 1,353 66.1 1,345 72.0 1,116 60.0Theoretical Average 23.5 23.9 23.4 21.7Master Schedule 7/6 7/6 8/6.4 7/6
First Colony MSSections AverageAverage
Baines MSSections
Dulles MSSections AverageAverage
Crockett MSSections

FORT BEND INDEPENDENT SCHOOL DISTRICTMiddle School Class Size Comparisons (MSs 5-8)
Enrollment and Staffing as of November 6, 2009
Course Students Students Students StudentsLang. Arts - 6 254 11 23.1 369 16 23.1 362 19 19.1 317 13 24.4Lang. Arts - 6 PAP/GT 56 2 28.0 46 2 23.0 82 3 27.3Lang. Arts - 7 202 9 22.4 400 15 26.7 316 13 24.3 351 14 25.1Lang. Arts - 7 PAP/GT 132 5 26.4 53 2 26.5 101 4 25.3 85 3 28.3Lang. Arts - 8 197 9 21.9 298 14 21.3 338 16 21.1 257 11 23.4Lang. Arts - 8 PAP/GT 189 7 27.0 110 5 22.0 84 4 21.0 138 5 27.6Reading - 6 254 11 23.1 369 16 23.1 362 19 19.1 317 13 24.4Reading - 6 PAP/GT 56 2 28.0 46 2 23.0 82 3 27.3Reading - 7 202 9 22.4 400 15 26.7 316 13 24.3 351 14 25.1Reading - 7 PAP/GT 132 5 26.4 53 2 26.5 101 4 25.3 85 3 28.3Reading - 8 197 9 21.9 298 14 21.3 338 16 21.1 257 11 23.4Reading - 8 PAP/GT 189 7 27.0 110 5 22.0 84 4 21.0 138 5 27.6Math - 6 237 10 23.7 377 16 23.6 423 22 19.2 353 16 22.1Math - 6 PAP/GT 50 2 25.0 54 2 27.0 75 3 25.0Math - 7 211 9 23.4 387 19 20.4 344 16 21.5 361 17 21.2Math - 7 PAP/GT 130 5 26.0 61 3 20.3 131 5 26.2 81 3 27.0Math - 8 256 9 28.4 334 15 22.3 359 15 23.9 311 16 19.4Algebra 1 PAP/GT 157 6 26.2 111 5 22.2 94 4 23.5 92 4 23.0Science - 6 274 10 27.4 385 15 25.7 431 21 20.5 359 16 22.4Science - 6 PAP/GT 60 2 30.0 46 2 23.0 79 3 26.3Earth Science 189 8 23.6 397 18 22.1 393 17 23.1 402 17 23.6Earth Science PAP/GT 159 6 26.5 58 3 19.3 94 4 23.5 61 3 20.3Life Science 174 7 24.9 330 17 19.4 374 14 26.7 320 16 20.0Life Science PAP/GT 224 8 28.0 92 4 23.0 86 3 28.7 101 4 25.3World Cultures - 6 283 10 28.3 387 16 24.2 431 18 23.9 363 15 24.2World Cult. - 6 PAP/GT 53 2 26.5 41 2 20.5 75 3 25.0Texas History 283 12 23.6 427 16 26.7 497 17 29.2 389 15 25.9Texas History PAP/GT 64 2 32.0 36 2 18.0 73 3 24.3American History 257 10 25.7 337 13 25.9 379 15 25.3 307 13 23.6Am. History PAP/GT 141 5 28.2 90 4 22.5 81 3 27.0 114 4 28.5Spanish - 2 129 6 21.5 229 8 28.6 135 6 22.5 111 5 22.2Student/Teacher Total Total Class Total Total Class Total Total Class Total Total ClassAverage Counts Students Sections Average Students Sections Average Students Sections Average Students Sections AverageCore Subject Counts 5,391 215 25.1 6,731 288 23.4 6,654 292 22.8 6,487 274 23.7Std/Tchr (Reg Ed) Students Teachers Ratio Students Teachers Ratio Students Teachers Ratio Students Teachers RatioStaffing Counts 1,097 54.0 1,359 68.0 1,400 77.0 1,334 69.0Theoretical Average 23.7 23.3 21.2 22.6Master Schedule 7/6 7/6 7/6 7/6
Fort Settlement MS Garcia MS Hodges Bend MS Lake Olympia MSSections Average Sections Average Sections Average Sections Average

FORT BEND INDEPENDENT SCHOOL DISTRICTMiddle School Class Size Comparisons (MSs 9-12)
Enrollment and Staffing as of November 6, 2009
Course Students Students Students StudentsLang. Arts - 6 198 9 22.0 287 12 23.9Lang. Arts - 6 PAP/GT 88 3 29.3Lang. Arts - 7 255 11 23.2 327 13 25.2 147 6 24.5 229 9 25.4Lang. Arts - 7 PAP/GT 14 11 1.3 17 1 17.0 174 9 19.3 188 7 26.9Lang. Arts - 8 248 11 22.5 303 11 27.5 151 7 21.6 242 9 26.9Lang. Arts - 8 PAP/GT 21 1 21.0 23 1 23.0 155 6 25.8 179 7 25.6Reading - 6 198 9 22.0 287 12 23.9Reading - 6 PAP/GT 88 3 29.3Reading - 7 255 11 23.2 327 13 25.2 147 6 24.5 229 9 25.4Reading - 7 PAP/GT 14 11 1.3 17 1 17.0 174 9 19.3 188 7 26.9Reading - 8 248 11 22.5 303 11 27.5 151 7 21.6 242 9 26.9Reading - 8 PAP/GT 21 1 21.0 23 1 23.0 155 6 25.8 179 7 25.6Math - 6 171 9 19.0 275 13 21.2Math - 6 PAP/GT 87 4 21.8Math - 7 253 14 18.1 352 17 20.7 144 9 16.0 210 10 21.0Math - 7 PAP/GT 14 1 14.0 17 1 17.0 26 1 26.0 212 8 26.5Math - 8 277 17 16.3 327 17 19.2 218 9 24.2 248 12 20.7Algebra 1 PAP/GT 28 1 28.0 21 1 21.0 125 6 20.8 216 8 27.0Science - 6 198 10 19.8 300 14 21.4Science - 6 PAP/GT 87 3 29.0Earth Science 263 17 15.5 374 17 22.0 154 9 17.1 242 10 24.2Earth Science PAP/GT 13 1 13.0 17 1 17.0 176 8 22.0 199 7 28.4Life Science 315 17 18.5 336 17 19.8 168 9 18.7 225 9 25.0Life Science PAP/GT 13 1 13.0 24 1 24.0 135 7 19.3 207 8 25.9World Cultures - 6 198 10 19.8 312 15 20.8World Cult. - 6 PAP/GT 75 4 18.8Texas History 262 17 15.4 374 17 22.0 177 7 25.3 390 15 26.0Texas History PAP/GT 14 1 14.0 17 1 17.0 153 6 25.5 49 2 24.5American History 312 17 18.4 337 16 21.1 172 8 21.5 263 10 26.3Am. History PAP/GT 16 1 16.0 23 1 23.0 131 7 18.7 169 7 24.1Spanish - 2 159 8 19.9 110 5 22.0 520 28 18.6 280 12 23.3Student/Teacher Total Total Class Total Total Class Total Total Class Total Total ClassAverage Counts Students Sections Average Students Sections Average Students Sections Average Students Sections AverageCore Subject Counts 3,015 181 16.7 3,669 164 22.4 4,516 217 20.8 6,472 265 24.4Std/Tchr (Reg Ed) Students Teachers Ratio Students Teachers Ratio Students Teachers Ratio Students Teachers RatioStaffing Counts 610 40.0 762 43.0 844 49.0 1,269 64.0Theoretical Average 17.8 22.5 20.1 23.1Master Schedule 7/6 8/6.3 7/6 7/6
McAuliffe MS Missouri City MS Quail Valley MS Sartartia MSSections Average Sections Average Sections Average Sections Average
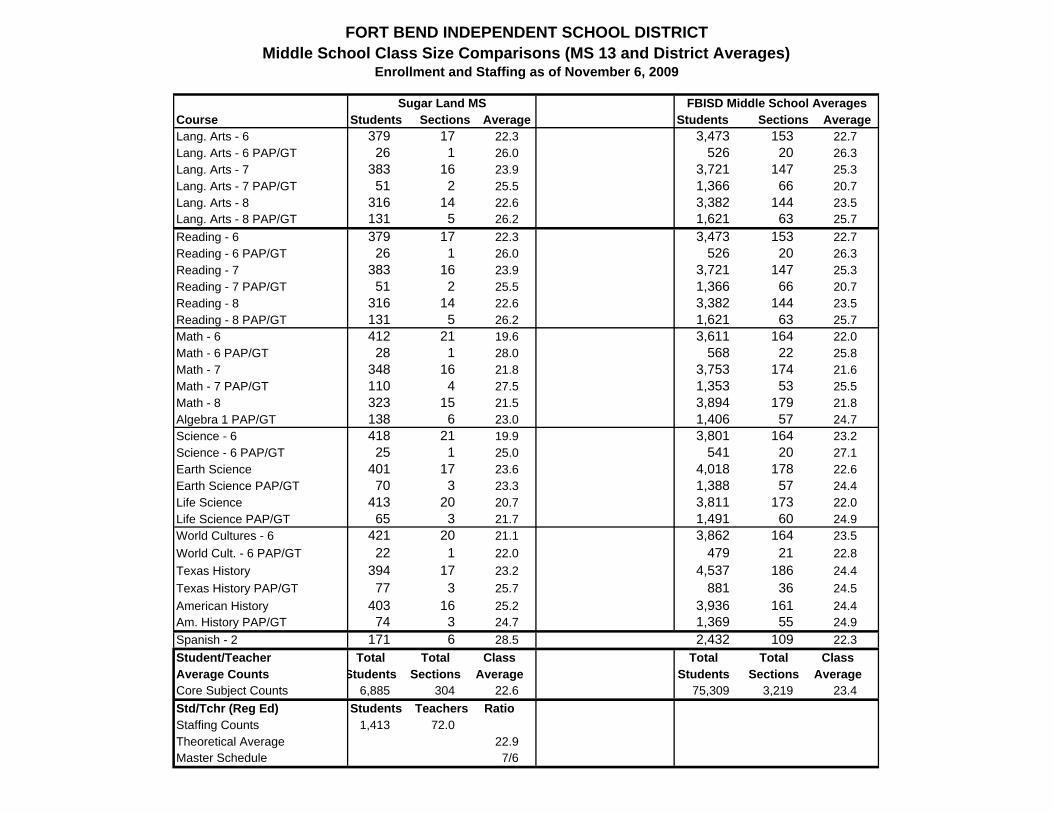
FORT BEND INDEPENDENT SCHOOL DISTRICTMiddle School Class Size Comparisons (MS 13 and District Averages)
Enrollment and Staffing as of November 6, 2009
Course Students StudentsLang. Arts - 6 379 17 22.3 3,473 153 22.7Lang. Arts - 6 PAP/GT 26 1 26.0 526 20 26.3Lang. Arts - 7 383 16 23.9 3,721 147 25.3Lang. Arts - 7 PAP/GT 51 2 25.5 1,366 66 20.7Lang. Arts - 8 316 14 22.6 3,382 144 23.5Lang. Arts - 8 PAP/GT 131 5 26.2 1,621 63 25.7Reading - 6 379 17 22.3 3,473 153 22.7Reading - 6 PAP/GT 26 1 26.0 526 20 26.3Reading - 7 383 16 23.9 3,721 147 25.3Reading - 7 PAP/GT 51 2 25.5 1,366 66 20.7Reading - 8 316 14 22.6 3,382 144 23.5Reading - 8 PAP/GT 131 5 26.2 1,621 63 25.7Math - 6 412 21 19.6 3,611 164 22.0Math - 6 PAP/GT 28 1 28.0 568 22 25.8Math - 7 348 16 21.8 3,753 174 21.6Math - 7 PAP/GT 110 4 27.5 1,353 53 25.5Math - 8 323 15 21.5 3,894 179 21.8Algebra 1 PAP/GT 138 6 23.0 1,406 57 24.7Science - 6 418 21 19.9 3,801 164 23.2Science - 6 PAP/GT 25 1 25.0 541 20 27.1Earth Science 401 17 23.6 4,018 178 22.6Earth Science PAP/GT 70 3 23.3 1,388 57 24.4Life Science 413 20 20.7 3,811 173 22.0Life Science PAP/GT 65 3 21.7 1,491 60 24.9World Cultures - 6 421 20 21.1 3,862 164 23.5World Cult. - 6 PAP/GT 22 1 22.0 479 21 22.8Texas History 394 17 23.2 4,537 186 24.4Texas History PAP/GT 77 3 25.7 881 36 24.5American History 403 16 25.2 3,936 161 24.4Am. History PAP/GT 74 3 24.7 1,369 55 24.9Spanish - 2 171 6 28.5 2,432 109 22.3Student/Teacher Total Total Class Total Total ClassAverage Counts Students Sections Average Students Sections AverageCore Subject Counts 6,885 304 22.6 75,309 3,219 23.4Std/Tchr (Reg Ed) Students Teachers RatioStaffing Counts 1,413 72.0Theoretical Average 22.9Master Schedule 7/6
Sugar Land MS FBISD Middle School AveragesSections Average Sections Average

FORT BEND INDEPENDENT SCHOOL DISTRICTHigh School Class Size Comparisons (HSs 1-4)
Enrollment and Staffing as of November 6, 2009
CourseEnglish 1 510 21 24.3 418 18 23.2 489 21 23.3 305 13 23.5English 1 PAP 139 6 23.2 131 6 21.8 232 9 25.8 142 5 28.4English 2 460 18 25.6 384 16 24.0 438 19 23.1 295 13 22.7English 2 PAP 144 5 28.8 115 5 23.0 276 9 30.7 225 7 32.1English 3 431 16 26.9 339 13 26.1 495 21 23.6 415 15 27.7AP English 3 113 4 28.3 150 9 16.7 222 8 27.8 78 3 26.0English 4 426 18 23.7 295 13 22.7 368 13 28.3 408 14 29.1AP English 4 64 2 32.0 93 3 31.0 133 5 26.6 122 5 24.4TAKS English 17 3 5.7 66 4 16.5 69 6 11.5Communication Appl. 576 22 26.2 341 14 24.4 306 11 27.8 218 11 19.8Algebra 1 495 21 23.6 553 29 19.1 469 25 18.8 363 21 17.3Algebra 2 299 11 27.2 367 16 22.9 432 16 27.0 266 12 22.2Algebra 2 PAP 158 5 31.6 165 7 23.6 205 8 25.6 125 5 25.0Geometry 453 20 22.7 373 19 19.6 430 20 21.5 418 24 17.4Geometry PAP 136 5 27.2 117 5 23.4 253 11 23.0 106 4 26.5Pre-Calculus 249 10 24.9 70 4 17.5 304 11 27.6 171 7 24.4Pre-Calculus PAP 127 5 25.4 106 5 21.2 185 7 26.4 63 3 21.0AP Calculus 132 6 22.0 29 2 14.5 239 9 26.6 89 4 22.3Math Electives 34 2 17.0 365 14 26.1 28 2 14.0AP Statistics 80 3 26.7 69 2 34.5 44 2 22.0TAKS Math 29 4 7.3 33 7 4.7 68 7 9.7Math Models 106 6 17.7 137 6 22.8 96 6 16.0 166 7 23.7Wld Geography 471 19 24.8 443 19 23.3 376 15 25.1 399 14 28.5Wld Geo. & Studies PAP 222 7 31.7 118 4 29.5 397 13 30.5 108 4 27.0Wld History 449 17 26.4 398 21 19.0 432 14 30.9 398 16 24.9Wld History AP/PAP 168 6 28.0 103 4 25.8 304 12 25.3 147 5 29.4US History 413 17 24.3 446 19 23.5 417 14 29.8 392 14 28.0US History AP/PAP 129 4 32.3 53 3 17.7 233 8 29.1 107 4 26.8Social Studies Electives 432 17 25.4 248 11 22.5 282 11 25.6Government/Economics 756 32 23.6 688 32 21.5 335 11 30.5 372 13 28.6AP Government/Econ. 220 8 27.5 211 8 26.4 209 8 26.1 187 7 26.7Intro Physics & Chem 108 5 21.6 248 11 22.5 179 9 19.9 91 5 18.2Biology 513 19 27.0 504 22 22.9 517 20 25.9 400 17 23.5Biology PAP 200 6 33.3 102 4 25.5 270 11 24.5 147 6 24.5Chemistry 605 24 25.2 470 22 21.4 597 23 26.0 564 24 23.5Chemistry PAP 75 4 18.8 179 6 29.8 180 7 25.7Physics 134 6 22.3 87 5 17.4 159 6 26.5 224 9 24.9Physics PAP 136 4 34.0 64 4 16.0 180 6 30.0AP Sciences 318 12 26.5 43 3 14.3 140 6 23.3 136 6 22.7Science Electives 160 4 40.0 227 8 28.4 289 13 22.2 144 7 20.6TAKS Science 12 2 6.0 14 1 14.0ASL 188 8 23.5 133 6 22.2 139 6 23.2French 133 6 22.2 109 5 21.8 188 9 20.9 143 6 23.8Other Languages 568 27 21.0 155 9 17.2Spanish 848 34 24.9 933 42 22.2 966 43 22.5 655 26 25.2Student/Teacher Total Total Class Total Total Class Total Total Class Total Total ClassAverage Counts Students Sections Average Students Sections Average Students Sections Average Students Sections AverageCore Subject Counts 11,793 470 25.1 9,538 437 21.8 13,388 540 24.8 9,568 407 23.5Std/Tchr (Reg Ed) Stdnts Teachers Ratio Stdnts Teachers Ratio Stdnts Teachers Ratio Stdnts Teachers RatioStaffing Counts 2,347 119.0 2,013 111.5 2,800 143.7 2,067 110.7Theoretical Average 24.8 21.1 24.0 22.8Master Schedule 7/5.575 7/6 7/5.676 7/5.744
Clements HS Dulles HSStudents Sections Average Students Sections AverageSections Average
Bush HSAverage
Austin HSStudents Sections Students

FORT BEND INDEPENDENT SCHOOL DISTRICTHigh School Class Size Comparisons (HSs 5-8)
Enrollment and Staffing as of November 6, 2009
CourseEnglish 1 389 16 24.3 443 19 23.3 445 18 24.7 278 12 23.2English 1 PAP 154 6 25.7 272 10 27.2 170 7 24.3 49 3 16.3English 2 460 17 27.1 410 16 25.6 435 17 25.6 242 10 24.2English 2 PAP 163 6 27.2 262 10 26.2 231 8 28.9 47 3 15.7English 3 453 19 23.8 436 17 25.6 428 17 25.2 282 10 28.2AP English 3 137 6 22.8 224 9 24.9 168 7 24.0 16 1 16.0English 4 & Electives 508 20 25.4 406 16 25.4 583 24 24.3 285 11 25.9AP English 4 59 2 29.5 164 6 27.3 94 4 23.5 14 1 14.0TAKS English 8 1 8.0 38 6 6.3 83 6 13.8Communication Appl. 199 11 18.1 461 16 28.8 268 9 29.8 382 14 27.3Algebra 1 430 20 21.5 600 26 23.1 585 26 22.5 358 15 23.9Algebra 2 349 13 26.8 355 15 23.7 336 12 28.0 195 9 21.7Algebra 2 PAP 124 6 20.7 181 7 25.9 153 6 25.5 39 2 19.5Geometry 480 22 21.8 550 26 21.2 492 20 24.6 313 11 28.5Geometry PAP 157 6 26.2 170 8 21.3 93 5 18.6 31 2 15.5Pre-Calculus 174 7 24.9 95 4 23.8 153 6 25.5 77 4 19.3Pre-Calculus PAP 67 3 22.3 160 6 26.7 124 5 24.8 16 1 16.0AP Calculus 89 4 22.3 81 4 20.3 83 4 20.8 23 1 23.0Math Electives 12 1 12.0 114 6 19.0AP Statistics 14 1 14.0 47 2 23.5TAKS Math 17 1 17.0 173 16 10.8 6 1 6.0Math Models 176 9 19.6 225 8 28.1 162 8 20.3 147 6 24.5Wld Geography 363 14 25.9 475 19 25.0 450 18 25.0 286 13 22.0Wld Geo. & Studies PAP 212 7 30.3 286 9 31.8 233 9 25.9 80 3 26.7Wld History 513 18 28.5 458 17 26.9 480 17 28.2 298 10 29.8Wld History AP/PAP 147 6 24.5 241 9 26.8 209 8 26.1 42 2 21.0US History 480 18 26.7 461 16 28.8 544 21 25.9 256 10 25.6US History AP/PAP 98 4 24.5 224 9 24.9 71 3 23.7 17 1 17.0Social Studies Electives 233 10 23.3 105 5 21.0 239 10 23.9Government/Economics 405 15 27.0 434 14 31.0 378 16 23.6 301 10 30.1AP Government/Econ. 98 4 24.5 185 6 30.8 195 7 27.9 70 2 35.0Intro Physics & Chem 252 12 21.0 211 10 21.1 319 13 24.5 293 9 32.6Biology 441 17 25.9 726 27 26.9 546 21 26.0 387 16 24.2Biology PAP 197 6 32.8 277 9 30.8 253 8 31.6 28 1 28.0Chemistry 488 20 24.4 502 17 29.5 370 16 23.1 372 16 23.3Chemistry PAP 303 12 25.3 328 11 29.8 238 8 29.8 22 1 22.0Physics 80 4 20.0 94 3 31.3 119 5 23.8 55 3 18.3Physics PAP 163 6 27.2AP Sciences 103 6 17.2 394 15 26.3 257 11 23.4 4 1 4.0Science Electives 108 5 21.6 95 5 19.0 35 2 17.5 13 1 13.0TAKS Science 31 2 15.5 28 4 7.0 6 1 6.0ASL 133 6 22.2French 143 6 23.8 164 7 23.4 175 8 21.9 54 3 18.0Other Languages 23 2 11.5Spanish 1,028 41 25.1 1,168 48 24.3 1,169 50 23.4 567 21 27.0Student/Teacher Total Total Class Total Total Class Total Total Class Total Total ClassAverage Counts Students Sections Average Students Sections Average Students Sections Average Students Sections AverageCore Subject Counts 10,638 436 24.4 12,562 505 24.9 11,562 472 24.5 5,939 239 24.8Std/Tchr (Reg Ed) Stdnts Teachers Ratio Stdnts Teachers Ratio Stdnts Teachers Ratio Stdnts Teachers RatioStaffing Counts 2,388 126.0 2,721 150.0 2,536 133.1 1,449 82.0Theoretical Average 23.7 24.2 23.3 23.6Master Schedule 7/5.587 4/3 7/5.715 4/3
AverageElkins HS Hightower HS Kempner HS Marshall HS
Students Sections Average Students Sections Average Students Sections Average Students Sections

FORT BEND INDEPENDENT SCHOOL DISTRICTHigh School Class Size Comparisons (HSs 9-10 and District Averages)
Enrollment and Staffing as of November 6, 2009
CourseEnglish 1 401 15 26.7 211 11 19.2 3,889 164 23.7English 1 PAP 178 6 29.7 118 6 19.7 1,585 64 24.8English 2 389 16 24.3 291 10 29.1 3,804 152 25.0English 2 PAP 159 5 31.8 114 6 19.0 1,736 64 27.1English 3 376 14 26.9 225 10 22.5 3,880 152 25.5AP English 3 148 5 29.6 108 4 27.0 1,364 56 24.4English 4 & Electives 402 15 26.8 271 13 20.8 3,952 157 25.2AP English 4 118 5 23.6 40 2 20.0 901 35 25.7TAKS English 12 2 6.0 84 10 8.4 377 38 9.9Communication Appl. 283 11 25.7 236 9 26.2 3,270 128 25.5Algebra 1 435 21 20.7 327 19 17.2 4,615 223 20.7Algebra 2 358 13 27.5 242 12 20.2 3,199 129 24.8Algebra 2 PAP 117 4 29.3 75 3 25.0 1,342 53 25.3Geometry 449 20 22.5 319 13 24.5 4,277 195 21.9Geometry PAP 135 5 27.0 79 5 15.8 1,277 56 22.8Pre-Calculus 173 7 24.7 1,466 60 24.4Pre-Calculus PAP 95 4 23.8 81 3 27.0 1,024 42 24.4AP Calculus 83 4 20.8 6 1 6.0 854 39 21.9Math Electives 77 3 25.7 630 28 22.5AP Statistics 52 2 26.0 306 12 25.5TAKS Math 38 4 9.5 19 2 9.5 383 42 9.1Math Models 124 7 17.7 57 3 19.0 1,396 66 21.2Wld Geography 390 15 26.0 153 6 25.5 3,806 152 25.0Wld Geo. & Studies PAP 221 7 31.6 173 8 21.6 2,050 71 28.9Wld History 413 15 27.5 275 11 25.0 4,114 156 26.4Wld History AP/PAP 154 6 25.7 135 5 27.0 1,650 63 26.2US History 400 15 26.7 268 10 26.8 4,077 154 26.5US History AP/PAP 132 5 26.4 76 3 25.3 1,140 44 25.9Social Studies Electives 166 7 23.7 1,705 71 24.0Government/Economics 400 14 28.6 221 8 27.6 4,290 165 26.0AP Government/Econ. 211 8 26.4 95 4 23.8 1,681 62 27.1Intro Physics & Chem 186 7 26.6 32 1 32.0 1,919 82 23.4Biology 449 19 23.6 286 12 23.8 4,769 190 25.1Biology PAP 208 8 26.0 272 14 19.4 1,954 73 26.8Chemistry 476 20 23.8 362 19 19.1 4,806 201 23.9Chemistry PAP 208 7 29.7 118 5 23.6 1,651 61 27.1Physics 158 7 22.6 62 3 20.7 1,172 51 23.0Physics PAP 121 5 24.2 664 25 26.6AP Sciences 137 7 19.6 8 1 8.0 1,540 68 22.6Science Electives 38 2 19.0 1,109 47 23.6TAKS Science 26 2 13.0 117 12 9.8ASL 147 6 24.5 740 32 23.1French 128 6 21.3 119 6 19.8 1,356 62 21.9Other Languages 746 38 19.6Spanish 1,010 41 24.6 640 29 22.1 8,984 375 24.0Student/Teacher Total Total Class Total Total Class Total Total ClassAverage Counts Students Sections Average Students Sections Average Students Sections AverageCore Subject Counts 10,355 415 25.0 6,224 289 21.5 101,567 4,210 24.1Std/Tchr (Reg Ed) Stdnts Teachers Ratio Stdnts Teachers RatioStaffing Counts 2,177 114.0 1,460 78.0Theoretical Average 24.2 23.1Master Schedule 7/5.531 7/5.673
Travis HS Willowridge HS FBISD High School AveragesStudents Sections Average Students Sections Average Students Sections Average

FORT BEND INDEPENDENT SCHOOL DISTRICTHigh School Athletic Period Class CountsEnrollment and Staffing as of November 6, 2009
Campus Stdnts Coach Avg Stdnts Coach Avg Stdnts Coach Avg Stdnts Coach Avg Stdnts Coach Avg Stdnts Coach AvgHigh Schools
Period 1 Period 2, 3, 4, & 6 Period 5 Period 7 Period 8 Totals
Austin HS 166 11 15.1 175 7 25.0 324 17 19.1 665 35 19.0
Bush HS 9 1 9.0 88 5 17.6 259 15 17.3 215 9 23.9 571 30 19.0
Clements HS 63 6 10.5 246 14 17.6 444 26 17.1 753 46 16.4
Dulles HS 94 6 15.7 126 10 12.6 299 23 13.0 519 39 13.3
Elkins HS 126 12 10.5 25 1 25.0 164 9 18.2 376 18 20.9 691 40 17.3
Hightower HS 98 3 32.7 486 24 20.3 89 3 29.7 109 10 10.9 240 11 21.8 1,022 51 20.0
Kempner HS 25 2 12.5 250 13 19.2 479 24 20.0 754 39 19.3
Marshall HS 44 3 14.7 49 4 12.3 40 2 20.0 204 9 22.7 205 9 22.8 542 27 20.1
Travis HS 61 8 7.6 198 16 12.4 293 20 14.7 552 44 12.5
Willowridge HS 5 2 2.5 109 6 18.2 77 11 7.0 191 19 10.1
HS Totals 691 54 12.8 648 34 19.1 1,656 95 17.4 2,820 167 16.9 445 20 22.3 6,260 370 16.9
Certification(Assignment) AHS BHS CHS DHS EHS HHS KHS MHS THS WHS Total
Eng-LA, Speech 6 2 3 7 2 3 4 1 3 2 33Math 4 6 11 3 6 3 4 1 4 6 48Science 6 1 3 2 1 0 4 0 6 2 25Social Studies 10 6 10 6 9 6 10 1 8 1 67Foreign Language 0 1 0 0 0 1 1 1 0 1 5Special Ed 0 3 1 4 5 2 3 2 3 1 24CATE 1 0 0 1 1 1 1 0 0 0 5HPE 6 7 4 5 6 6 4 5 7 4 54Other 0 1 1 1 1 2 0 1 0 2 9
Total 33 27 33 29 31 24 31 12 31 19 270

FORT BEND INDEPENDENT SCHOOL DISTRICTMiddle School Elective Class Count Comparisons (MSs 1-5)
Students and Sections as of November 6, 2009
Course Stds Sect Avg Stds Sect Avg Stds Sect Avg Stds Sect Avg Stds Sect Avg
Art 159 6 26.5 257 12 21.4 173 7 24.7 157 6 26.2 191 6 31.8
Band 199 13 15.3 175 12 14.6 215 14 15.4 246 12 20.5 191 12 15.9
Choir 135 7 19.3 41 1 41.0 169 11 15.4 189 6 31.5 83 6 13.8
Contest Math 20 1 20.0 28 1 28.0 64 3 21.3 13 1 13.0
Dance
Health 485 20 24.3 437 16 27.3 457 18 25.4 364 16 22.8 170 6 28.3
Journlism (Y/N) 152 5 30.4 74 5 14.8 22 2 11.0 95 6 15.8 15 2 7.5
Kick Start
Life Managemant 141 6 23.5 133 6 22.2 139 6 23.2 127 6 21.2 78 3 26.0
Orchestra 42 3 14.0 79 6 13.2 150 11 13.6 146 6 24.3 133 6 22.2
PALS/Teen Leader 21 1 21.0 20 1 20.0 14 1 14.0 83 4 20.8 109 5 21.8
PE 1,342 61 22.0 1,397 50 27.9 1,340 45 29.8 1,103 39 28.3 822 27 30.4
Tech Education 146 6 24.3 154 6 25.7 152 7 21.7 135 7 19.3 142 6 23.7
Theatre/Speech 189 7 27.0 149 12 12.4 137 6 22.8 172 6 28.7 122 5 24.4
Total Total Class Total Total Class Total Total Class Total Total Class Total Total ClassStds Sect Avg Stds Sect Avg Stds Sect Avg Stds Sect Avg Stds Sect Avg
All Elective Average 3,031 136 22.3 2,916 127 23.0 2,996 129 23.2 2,881 117 24.6 2,069 85 24.3
Fort Settlement MSDulles MS First Colony MSBaines MS Crockett MS

FORT BEND INDEPENDENT SCHOOL DISTRICTMiddle School Elective Class Count Comparisons (MSs 6-10)
Students and Sections as of November 6, 2009
Course Stds Sect Avg Stds Sect Avg Stds Sect Avg Stds Sect Avg Stds Sect Avg
Art 257 12 21.4 251 12 20.9 280 12 23.3 145 7 20.7 126 7 18.0
Band 187 12 15.6 159 12 13.3 224 12 18.7 220 7 31.4 121 7 17.3
Choir 67 4 16.8 82 7 11.7
Contest Math 23 1 23.0
Dance
Health 470 20 23.5 493 21 23.5 461 18 25.6 268 8 33.5
Journlism (Y/N) 61 3 20.3 51 4 12.8 133 6 22.2 392 14 28.0
Kick Start 199 6 33.2 85 7 12.1
Life Managemant 119 5 23.8 214 10 21.4 92 7 13.1 112 7 16.0
Orchestra 105 6 17.5 112 6 18.7 35 3 11.7
PALS/Teen Leader 20 1 20.0 19 1 19.0 50 3 16.7 12 1 12.0
PE 917 34 27.0 1520 65 23.4 1126 54 20.9 616 17 36.2 713 28 25.5
Tech Education 44 2 22.0 95 5 19.0 92 5 18.4 105 7 15.0 712 29 24.6
Theatre/Speech 218 11 19.8 199 12 16.6 111 6 18.5 83 6 13.8 105 7 15.0
Total Total Class Total Total Class Total Total Class Total Total Class Total Total ClassStds Sect Avg Stds Sect Avg Stds Sect Avg Stds Sect Avg Stds Sect Avg
All Elective Average 2,421 107 22.6 3,113 148 21.0 2,778 129 21.5 1,623 67 24.2 2,366 106 22.3
Garcia MS Hodges Bend MS Lake Olympia MS McAuliffe MS Missouri City MS

FORT BEND INDEPENDENT SCHOOL DISTRICTMiddle School Elective Class Count Comparisons (MSs 11-13 and District Averages)
Students and Sections as of November 6, 2009
Course Stds Sect Avg Stds Sect Avg Stds Sect Avg Students Sections Average
Art 128 6 21.3 273 11 24.8 140 6 23.3 2,537 110 23.1
Band 165 12 13.8 196 12 16.3 293 12 24.4 2,591 149 17.4
Choir 16 1 16.0 77 5 15.4 34 4 8.5 893 52 17.2
Contest Math 56 2 28.0 204 9 22.7
Dance 143 5 28.6 143 5 28.6
Health 333 13 25.6 217 7 31.0 221 10 22.1 4,376 173 25.3
Journlism (Y/N) 80 6 13.3 13 1 13.0 16 1 16.0 1,104 55 20.1
Kick Start 284 13 21.8
Life Managemant 237 12 19.8 1,392 68 20.5
Orchestra 62 2 31.0 168 6 28.0 138 6 23.0 1,170 61 19.2
PALS/Teen Leader 50 3 16.7 19 1 19.0 78 4 19.5 495 26 19.0
PE 838 21 39.9 884 29 30.5 1190 36 33.1 13,808 506 27.3
Tech Education 13 1 13.0 126 6 21.0 1,916 87 22.0
Theatre/Speech 30 1 30.0 145 6 24.2 131 6 21.8 1,791 91 19.7
Total Total Class Total Total Class Total Total Class Total MS Total MS Total MSStds Sect Avg Stds Sect Avg Stds Sect Avg Students Sections Average
All Elective Avg. 1,771 68 26.0 2,261 89 25.4 2,478 97 25.5 32,704 1,405 23.3
Quail Valley MS Sartartia MS Sugar Land MS FBISD MS Electives

FORT BEND INDEPENDENT SCHOOL DISTRICTHigh School Elective Class Count Comparisons (HSs 1-6)
Students and sections as of November 6, 2009
Austin HS Bush HS Clements HS Dulles HS Elkins HS Hightower HSCourse Stds Sect Avg Stds Sect Avg Stds Sect Avg Stds Sect Avg Stds Sect Avg Stds Sect AvgArt 283 14 20.2 230 8 28.8 351 14 25.1 246 12 20.5 254 12 21.2 597 27 22.1Band 175 18 9.7 112 12 9.3 382 18 21.2 205 15 13.7 185 13 14.2 126 11 11.5Choir 88 3 29.3 42 4 10.5 186 12 15.5 92 6 15.3 165 10 16.5 134 9 14.9Dance 222 12 18.5 137 7 19.6 174 12 14.5 125 8 15.6 150 6 25.0 229 12 19.1Orchestra 150 6 25.0 34 4 8.5 168 12 14.0 113 4 28.3 30 2 15.0 32 3 10.7Photography 73 3 24.3 47 3 15.7 88 4 22.0 77 3 25.7 45 3 15.0Theatre 280 12 23.3 159 6 26.5 202 12 16.8 180 6 30.0 271 10 27.1 287 15 19.1Academic Decathlon 12 1 12.0 12 1 12.0 15 1 15.0Debate 18 1 18.0 10 1 10.0 38 2 19.0 16 1 16.0 22 1 22.0Health 500 24 20.8 302 11 27.5 275 12 22.9 182 8 22.8 266 9 29.6 335 11 30.5Journalism 73 4 18.3 68 5 13.6 120 7 17.1 30 2 15.0 36 2 18.0 32 3 10.7PE 399 13 30.7 308 13 23.7 350 15 23.3 381 16 23.8 363 12 30.3 535 19 28.2PE Athletics 665 35 19.0 571 30 19.0 753 46 16.4 519 39 13.3 691 40 17.3 1022 51 20.0Teen Leadership/PALS 49 2 24.5 36 4 9.0Agriculture 215 12 17.9 99 6 16.5 87 4 21.8 143 9 15.9 106 5 21.2 142 5 28.4Business 863 34 25.4 472 23 20.5 721 29 24.9 584 30 19.5 657 29 22.7 657 26 25.3Computer Applications 100 4 25.0 507 23 22.0 411 16 25.7 166 7 23.7 162 7 23.1 202 7 28.9Co-Op Programs 38 3 12.7 33 2 16.5 38 2 19.0 61 5 12.2 25 2 12.5Criminal Justice 130 5 26.0Family & Cons. Sci 217 9 24.1 129 6 21.5 118 6 19.7 284 12 23.7 564 20 28.2Graphics 44 2 22.0 61 3 20.3 27 2 13.5 66 3 22.0 96 5 19.2 62 4 15.5Health Sci Tech 137 5 27.4Marketing 71 4 119 5 88 6Tech Systems 42 2 21.0 19 1 19.0 17 1 17.0 83 4 20.8
Total Total Class Total Total Class Total Total Class Total Total Class Total Total Class Total Total ClassStds Sect Avg Stds Sect Avg Stds Sect Avg Stds Sect Avg Stds Sect Avg Stds Sect Avg
All Elective Average 4,594 217 21.2 3,345 168 19.9 4,430 222 20.0 3,442 187 18.4 4,015 189 21.2 5,167 237 21.8
Fine Arts Average 1,271 68 18.7 714 41 17.4 1,510 83 18.2 1,049 55 19.1 1,132 56 20.2 1,450 80 18.1"Other" Average 1,655 77 21.5 1,259 60 21.0 1,498 80 18.7 1,199 69 17.4 1,372 64 21.4 1,982 89 22.3Vocational Average 1,656 71 23.3 1,372 67 20.5 1,422 59 24.1 1,182 62 19.1 1,496 68 22.0 1,735 68 25.5

FORT BEND INDEPENDENT SCHOOL DISTRICTHigh School Elective Class Count Comparisons (HSs 7-10 and District Averages)
Students and sections as of November 6, 2009
Kempner HS Marshall HS Travis HS Willowridge HS FBISD HS ElectivesCourse Stds Sect Avg Stds Sect Avg Stds Sect Avg Stds Sect Avg Stds Sect AvgArt 304 12 25.3 270 10 27.0 334 16 20.9 286 12 23.8 3,155 137 23.0Band 132 12 11.0 60 10 6.0 174 13 13.4 126 12 10.5 1,677 134 12.5Choir 125 5 25.0 52 5 10.4 104 6 17.3 48 2 24.0 1,036 62 16.7Dance 153 10 15.3 237 9 26.3 190 12 15.8 176 6 29.3 1,793 94 19.1Orchestra 96 6 16.0 43 4 10.8 666 41 16.2Photography 25 2 12.5 57 2 28.5 412 20 20.6Theatre 254 10 25.4 220 12 18.3 9 0.0 97 4 24.3 1,950 96 20.3Academic Decathlon 39 3 13.0Debate 55 3 18.3 33 2 16.5 48 2 24.0 15 1 15.0 255 14 18.2Health 265 9 29.4 146 6 24.3 254 10 25.4 179 7 25.6 2,704 107 25.3Journalism 89 5 17.8 49 3 16.3 63 4 15.8 22 1 22.0 582 36 16.2PE 456 17 26.8 361 16 22.6 375 27 13.9 220 13 16.9 3,748 161 23.3PE Athletics 754 39 19.3 542 27 20.1 552 44 12.5 199 19 10.5 6,268 370 16.9Teen Leadership/PALS 57 3 19.0 142 9 15.8Agriculture 201 10 20.1 139 6 23.2 93 5 18.6 119 6 19.8 1,344 68 19.8Business 475 22 21.6 220 10 22.0 516 23 22.4 297 13 22.8 5,462 239 22.9Computer Applications 355 15 23.7 442 20 22.1 262 10 26.2 88 4 22.0 2,695 113 23.8Co-Op Programs 22 1 22.0 73 3 24.3 28 2 14.0 28 2 14.0 346 22 15.7Criminal Justice 84 4 21.0 159 6 26.5 140 6 23.3 513 21 24.4Family & Cons. Sci 206 9 22.9 263 12 21.9 144 6 24.0 116 5 23.2 2,041 85 24.0Graphics 106 5 21.2 48 2 24.0 75 3 25.0 52 2 26.0 637 31 20.5Health Sci Tech 108 4 27.0 245 9 27.2Marketing 82 3 27.3 59 3 19.7 50 2 25.0 469 23 20.4Tech Systems 86 5 17.2 103 5 20.6 350 18 19.4
Total Total Class Total Total Class Total Total Class Total Total Class Total Total ClassStds Sect Avg Stds Sect Avg Stds Sect Avg Stds Sect Avg Stds Sect Avg
All Elective Average 4,433 208 21.3 3,474 166 20.9 3,371 202 16.7 2,258 117 19.3 38,529 1913 20.1
Fine Arts Average 1,089 57 19.1 896 48 18.7 845 60 14.1 733 36 20.4 10,689 584 18.3"Other" Average 1,619 73 22.2 1,131 54 20.9 1,349 90 15.0 635 41 15.5 13,738 700 19.6Vocational Average 1,725 78 22.1 1,447 64 22.6 1,177 52 22.6 890 40 22.3 14,102 629 22.4

FORT BEND INDEPENDENT SCHOOL DISTRICTSecondary Enrollment as of November 6, 2009
Current Master Schedule
Fort Bend ISD Grade Grade Grade Grade Total Total SpEd Net Pupil Tchr P/T High Schools 9 10 11 12 Pupils Tchrs Tchr Tchrs Prds Prds Ratio
Austin 726 608 518 495 2,347 132.0 13.0 119.0 7 5.575 24.8Bush 610 480 470 453 2,013 126.0 14.5 111.5 7 6.000 21.1Clements 777 744 694 585 2,800 156.2 12.5 143.7 7 5.676 24.0Dulles 526 549 471 521 2,067 125.7 15.0 110.7 7 5.744 22.8Elkins 619 658 562 549 2,388 139.0 13.0 126.0 7 5.587 23.7Hightower 781 673 656 611 2,721 164.0 14.0 150.0 4 3.000 24.2Kempner 693 688 601 554 2,536 144.1 11.0 133.1 7 5.715 23.3Marshall 412 327 293 417 1,449 96.0 14.0 82.0 4 3.000 23.6Travis 628 546 516 487 2,177 130.0 16.0 114.0 7 5.531 24.2Willowridge 378 431 325 326 1,460 97.0 19.0 78.0 7 5.673 23.1
High SchoolTotal 6,150 5,704 5,106 4,998 21,958 1,310.1 142.0 1,168.1 7 6 21.9
8 7 21.5
Fort Bend ISD Grade Grade Grade Grade Total Total SpEd Net Pupil Tchr P/T Middle Schools 5 6 7 8 Pupils Tchrs Tchr Tchrs Prds Prds Ratio
Baines 487 490 383 1,360 78.4 11.0 67.4 7 6 23.5Crockett 478 441 434 1,353 77.1 11.0 66.1 7 6 23.9Dulles 378 464 503 1,345 83.0 11.0 72.0 8 6.4 23.4First Colony 354 366 396 1,116 72.0 12.0 60.0 7 6 21.7Fort Settlement 337 352 408 1,097 63.0 9.0 54.0 7 6 23.7Garcia 436 482 441 1,359 82.0 14.0 68.0 7 6 23.3Hodges Bend 438 494 468 1,400 89.0 12.0 77.0 7 6 21.2Lake Olympia 442 469 423 1,334 79.0 10.0 69.0 7 6 22.6McAuliffe 0 277 333 610 49.0 9.0 40.0 7 6 17.8Missouri City 0 395 367 762 52.0 9.0 43.0 8 6.3 22.4Quail Valley 198 339 307 844 55.0 6.0 49.0 7 6 20.1Sartartia 389 444 436 1,269 72.0 8.0 64.0 7 6 23.1Sugar Land 448 479 486 1,413 83.0 11.0 72.0 7 6 22.9
Middle SchoolTotal 0 4,385 5,492 5,385 15,262 934.6 133.0 801.6 7 6 22.2
8 7 21.8

FORT BEND INDEPENDENT SCHOOL DISTRICTSecondary School Enrollment as of November 6, 2009
Internal Equity Comparison Across Grades 6-12
Fort Bend ISD Grade Grade Grade Grade Total Total SpEd Net Pupil Tchr P/T Tchrs TeacherHigh Schools 9 10 11 12 Pupils Tchrs Tchr Tchrs Prds Prds Ratio @ 22.0 Change
Austin 726 608 518 495 2,347 132.0 13.0 119.0 7 6 23.0 124.2 5.2Bush 610 480 470 453 2,013 126.0 14.5 111.5 7 6 21.1 106.5 -5.0Clements 777 744 694 585 2,800 156.2 12.5 143.7 7 6 22.7 148.2 4.5Dulles 526 549 471 521 2,067 125.7 15.0 110.7 7 6 21.8 109.4 -1.3Elkins 619 658 562 549 2,388 139.0 13.0 126.0 7 6 22.1 126.4 0.4Hightower 781 673 656 611 2,721 164.0 14.0 150.0 7 6 21.2 144.0 -6.0Kempner 693 688 601 554 2,536 144.1 11.0 133.1 7 6 22.2 134.2 1.1Marshall 412 327 293 417 1,449 96.0 14.0 82.0 7 6 20.6 76.7 -5.3Travis 628 546 516 487 2,177 130.0 16.0 114.0 7 6 22.3 115.2 1.2Willowridge 378 431 325 326 1,460 97.0 19.0 78.0 7 6 21.8 77.3 -0.7
High SchoolTotal 6,150 5,704 5,106 4,998 21,958 1310.1 142.0 1168.1 7 6 21.9
Fort Bend ISD Grade Grade Grade Grade Total Total SpEd Net Pupil Tchr P/T Tchrs TeacherMiddle Schools 5 6 7 8 Pupils Tchrs Tchr Tchrs Prds Prds Ratio @ 22.0 Change
Baines 487 490 383 1,360 78.4 11.0 67.4 7 6 23.5 72.0 4.5Crockett 478 441 434 1,353 77.1 11.0 66.1 7 6 23.9 71.6 5.5Dulles 378 464 503 1,345 83.0 11.0 72.0 7 6 21.8 71.2 -0.8First Colony 354 366 396 1,116 72.0 12.0 60.0 7 6 21.7 59.1 -0.9Fort Settlement 337 352 408 1,097 63.0 9.0 54.0 7 6 23.7 58.1 4.1Garcia 436 482 441 1,359 82.0 14.0 68.0 7 6 23.3 71.9 3.9Hodges Bend 438 494 468 1,400 89.0 12.0 77.0 7 6 21.2 74.1 -2.9Lake Olympia 442 469 423 1,334 79.0 10.0 69.0 7 6 22.6 70.6 1.6McAuliffe 0 277 333 610 49.0 9.0 40.0 7 6 17.8 32.3 -7.7Missouri City 0 395 367 762 52.0 9.0 43.0 7 6 20.7 40.3 -2.7Quail Valley 198 339 307 844 55.0 6.0 49.0 7 6 20.1 44.7 -4.3Sartartia 389 444 436 1,269 72.0 8.0 64.0 7 6 23.1 67.2 3.2Sugar Land 448 479 486 1,413 83.0 11.0 72.0 7 6 22.9 74.8 2.8
Middle SchoolTotal 0 4,385 5,492 5,385 15,262 934.6 133.0 801.6 7 6 22.2
TOTAL SECONDARY 37,220 2,245 275 1,970 7 6 22.0 1,970 0.0

FORT BEND INDEPENDENT SCHOOL DISTRICTSecondary School Enrollment as of November 6, 2009
Internal Equity Comparison for Grades 9-12 and 6-8
Fort Bend ISD Grade Grade Grade Grade Total Total SpEd Net Pupil Tchr P/T Tchrs TeacherHigh Schools 9 10 11 12 Pupils Tchrs Tchr Tchrs Prds Prds Ratio @ 21.9 Change
Austin 726 608 518 495 2,347 132.0 13.0 119.0 7 6 23.0 124.9 5.9Bush 610 480 470 453 2,013 126.0 14.5 111.5 7 6 21.1 107.1 -4.4Clements 777 744 694 585 2,800 156.2 12.5 143.7 7 6 22.7 148.9 5.2Dulles 526 549 471 521 2,067 125.7 15.0 110.7 7 6 21.8 110.0 -0.8Elkins 619 658 562 549 2,388 139.0 13.0 126.0 7 6 22.1 127.0 1.0Hightower 781 673 656 611 2,721 164.0 14.0 150.0 7 6 21.2 144.7 -5.3Kempner 693 688 601 554 2,536 144.1 11.0 133.1 7 6 22.2 134.9 1.8Marshall 412 327 293 417 1,449 96.0 14.0 82.0 7 6 20.6 77.1 -4.9Travis 628 546 516 487 2,177 130.0 16.0 114.0 7 6 22.3 115.8 1.8Willowridge 378 431 325 326 1,460 97.0 19.0 78.0 7 6 21.8 77.7 -0.3
High SchoolTotal 6,150 5,704 5,106 4,998 21,958 1310.1 142.0 1168.1 7 6 21.9 1168.1 0.0
Fort Bend ISD Grade Grade Grade Grade Total Total SpEd Net Pupil Tchr P/T Tchrs TeacherMiddle Schools 5 6 7 8 Pupils Tchrs Tchr Tchrs Prds Prds Ratio @ 22.2 Change
Baines 487 490 383 1,360 78.4 11.0 67.4 7 6 23.5 71.4 4.0Crockett 478 441 434 1,353 77.1 11.0 66.1 7 6 23.9 71.1 4.9Dulles 378 464 503 1,345 83.0 11.0 72.0 7 6 21.8 70.6 -1.4First Colony 354 366 396 1,116 72.0 12.0 60.0 7 6 21.7 58.6 -1.4Fort Settlement 337 352 408 1,097 63.0 9.0 54.0 7 6 23.7 57.6 3.6Garcia 436 482 441 1,359 82.0 14.0 68.0 7 6 23.3 71.4 3.4Hodges Bend 438 494 468 1,400 89.0 12.0 77.0 7 6 21.2 73.5 -3.5Lake Olympia 442 469 423 1,334 79.0 10.0 69.0 7 6 22.6 70.1 1.1McAuliffe 0 277 333 610 49.0 9.0 40.0 7 6 17.8 32.0 -8.0Missouri City 0 395 367 762 52.0 9.0 43.0 7 6 20.7 40.0 -3.0Quail Valley 198 339 307 844 55.0 6.0 49.0 7 6 20.1 44.3 -4.7Sartartia 389 444 436 1,269 72.0 8.0 64.0 7 6 23.1 66.6 2.6Sugar Land 448 479 486 1,413 83.0 11.0 72.0 7 6 22.9 74.2 2.2
Middle SchoolTotal 0 4,385 5,492 5,385 15,262 934.6 133.0 801.6 7 6 22.2 801.6 0.0

FORT BEND INDEPENDENT SCHOOL DISTRICTMiddle School Enrollment as of November 6, 2009
Uniform 7/6 Master Schedule: Position Recovery by Varying Class Average
Total Total SpEd Net Pupil Tchr P/T Tchr @ (+/-) Savings at $53,166Pupils Tchr Tchr Tchrs Prds Prds Ratio Avg Tchrs per Position
Fort Bend MSs' Base Line 15,262 934.6 133.0 801.6 7 6 22.2
Fort Bend MSs at 22.5 Avg. 15,262 934.6 133.0 801.6 7 6 22.5 791.4 -10.2 $542,774
Fort Bend MSs at 23.0 Avg. 15,262 934.6 133.0 801.6 7 6 23.0 774.2 -27.4 $1,457,417
Fort Bend MSs at 23.5 Avg. 15,262 934.6 133.0 801.6 7 6 23.5 757.7 -43.9 $2,333,140
Fort Bend MSs at 24.0 Avg. 15,262 934.6 133.0 801.6 7 6 24.0 741.9 -59.7 $3,172,374
Fort Bend MSs at 24.5 Avg. 15,262 934.6 133.0 801.6 7 6 24.5 726.8 -74.8 $3,977,354
Fort Bend MSs at 25.0 Avg. 15,262 934.6 133.0 801.6 7 6 25.0 712.2 -89.3 $4,750,134
Fort Bend MSs at 25.5 Avg. 15,262 934.6 133.0 801.6 7 6 25.5 698.3 -103.3 $5,492,609
Fort Bend MSs at 26.0 Avg. 15,262 934.6 133.0 801.6 7 6 26.0 684.8 -116.7 $6,206,528

FORT BEND INDEPENDENT SCHOOL DISTRICTMiddle School Enrollment as of November 6, 2009
Maintain Same Master ScheduleCalculate Variance of Class Average due to Increased Enrollment
Total Total SpEd Net Pupil Tchr P/TPupils Tchr Tchr Tchrs Prds Prds Ratio
Fort Bend MS' Base Line 15,262 934.6 133.0 801.6 7 6 22.2
Plus 50 new students 15,312 934.6 133.0 801.6 7 6 22.3
Plus 100 new students 15,362 934.6 133.0 801.6 7 6 22.4
Plus 150 new students 15,412 934.6 133.0 801.6 7 6 22.4
Plus 200 new students 15,462 934.6 133.0 801.6 7 6 22.5
Plus 250 new students 15,512 934.6 133.0 801.6 7 6 22.6
Plus 300 new students 15,562 934.6 133.0 801.6 7 6 22.7
Plus 350 new students 15,612 934.6 133.0 801.6 7 6 22.7
Plus 400 new students 15,662 934.6 133.0 801.6 7 6 22.8
Plus 450 new students 15,712 934.6 133.0 801.6 7 6 22.9
Plus 500 new students 15,762 934.6 133.0 801.6 7 6 22.9

FORT BEND INDEPENDENT SCHOOL DISTRICTHigh School Enrollment as of November 6, 2009
Same Master Schedule: Position Recovery by Varying Class Average
Total Total SpEd Net Pupil Tchr P/T Tchr @ (+/-) Savings at $53,166Pupils Tchr Tchr Tchrs Prds Prds Ratio Avg Tchrs per Position
Fort Bend HS's Base Line 21,958 1,310.1 142.0 1,168.1 7 5.688 23.1
Fort Bend HS's at 23.5 Avg. 21,958 1,310.1 142.0 1,168.1 7 5.688 23.5 1149.9 -18.2 $965,615
Fort Bend HS's at 24.0 Avg. 21,958 1,310.1 142.0 1,168.1 7 5.688 24.0 1126.0 -42.1 $2,239,283
Fort Bend HS's at 24.5 Avg. 21,958 1,310.1 142.0 1,168.1 7 5.688 24.5 1103.0 -65.1 $3,460,964
Fort Bend HS's at 25.0 Avg. 21,958 1,310.1 142.0 1,168.1 7 5.688 25.0 1080.9 -87.2 $4,633,778
Fort Bend HS's at 25.5 Avg. 21,958 1,310.1 142.0 1,168.1 7 5.688 25.5 1059.7 -108.4 $5,760,599
Fort Bend HS's at 26.0 Avg. 21,958 1,310.1 142.0 1,168.1 7 5.688 26.0 1039.3 -128.7 $6,844,081

FORT BEND INDEPENDENT SCHOOL DISTRICTHigh School Enrollment as of November 6, 2009
Shift to 7/6 Master Schedule: Position Recovery by Varying Class Average
Total Total SpEd Net Pupil Tchr P/T Tchr @ (+/-) Savings at $53,166Pupils Tchr Tchr Tchrs Prds Prds Ratio Avg Tchrs per Position
Fort Bend HS's Base Line 21,958 1,310.1 142.0 1,168.1 7 5.688 23.1
Fort Bend HS's Base Line 21,958 1,310.1 142.0 1,168.1 7 6 21.9
Fort Bend HS's at 22.0 Avg. 21,958 1,310.1 142.0 1,168.1 7 6 22.0 1164.4 -3.6 $193,078
Fort Bend HS's at 22.5 Avg. 21,958 1,310.1 142.0 1,168.1 7 6 22.5 1138.6 -29.5 $1,568,824
Fort Bend HS's at 23.0 Avg. 21,958 1,310.1 142.0 1,168.1 7 6 23.0 1113.8 -54.3 $2,884,756
Fort Bend HS's at 23.5 Avg. 21,958 1,310.1 142.0 1,168.1 7 6 23.5 1090.1 -78.0 $4,144,690
Fort Bend HS's at 24.0 Avg. 21,958 1,310.1 142.0 1,168.1 7 6 24.0 1067.4 -100.7 $5,352,127
Fort Bend HS's at 24.5 Avg. 21,958 1,310.1 142.0 1,168.1 7 6 24.5 1045.6 -122.5 $6,510,281
Fort Bend HS's at 25.0 Avg. 21,958 1,310.1 142.0 1,168.1 7 6 25.0 1024.7 -143.4 $7,622,108
Fort Bend HS's at 25.5 Avg. 21,958 1,310.1 142.0 1,168.1 7 6 25.5 1004.6 -163.5 $8,690,335
Fort Bend HS's at 26.0 Avg. 21,958 1,310.1 142.0 1,168.1 7 6 26.0 985.3 -182.8 $9,717,476
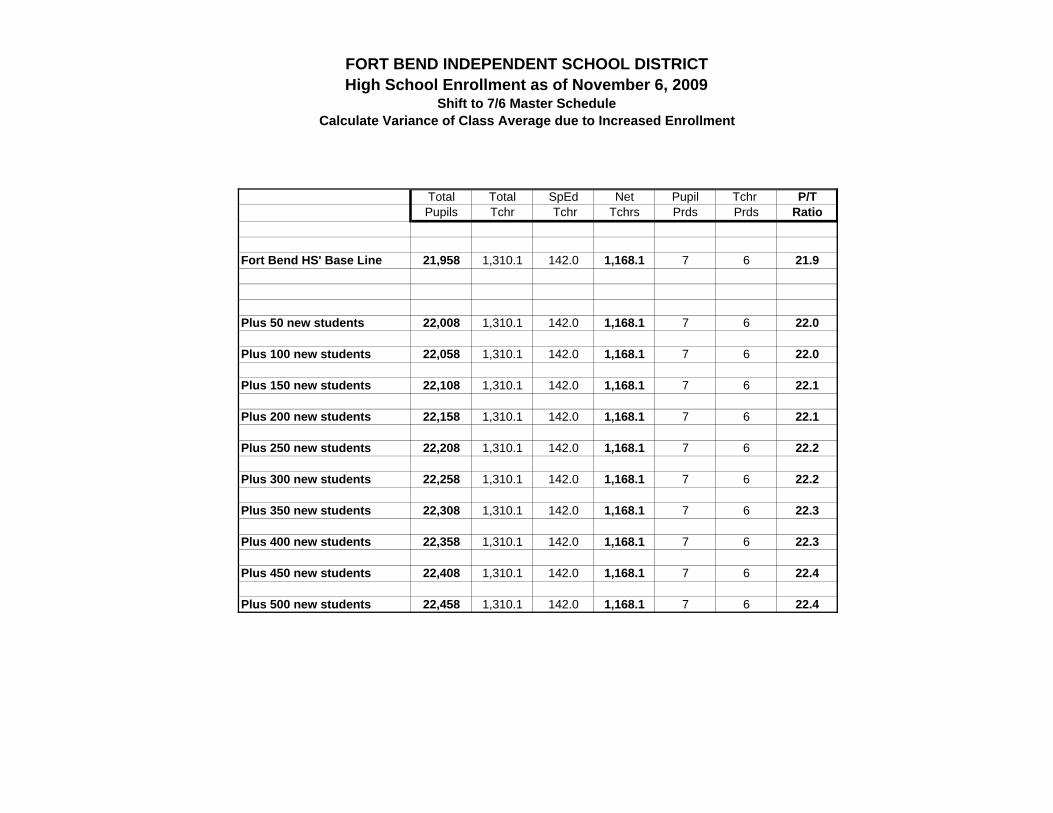
FORT BEND INDEPENDENT SCHOOL DISTRICTHigh School Enrollment as of November 6, 2009
Shift to 7/6 Master ScheduleCalculate Variance of Class Average due to Increased Enrollment
Total Total SpEd Net Pupil Tchr P/TPupils Tchr Tchr Tchrs Prds Prds Ratio
Fort Bend HS' Base Line 21,958 1,310.1 142.0 1,168.1 7 6 21.9
Plus 50 new students 22,008 1,310.1 142.0 1,168.1 7 6 22.0
Plus 100 new students 22,058 1,310.1 142.0 1,168.1 7 6 22.0
Plus 150 new students 22,108 1,310.1 142.0 1,168.1 7 6 22.1
Plus 200 new students 22,158 1,310.1 142.0 1,168.1 7 6 22.1
Plus 250 new students 22,208 1,310.1 142.0 1,168.1 7 6 22.2
Plus 300 new students 22,258 1,310.1 142.0 1,168.1 7 6 22.2
Plus 350 new students 22,308 1,310.1 142.0 1,168.1 7 6 22.3
Plus 400 new students 22,358 1,310.1 142.0 1,168.1 7 6 22.3
Plus 450 new students 22,408 1,310.1 142.0 1,168.1 7 6 22.4
Plus 500 new students 22,458 1,310.1 142.0 1,168.1 7 6 22.4

Special Education

FORT BEND INDEPENDENT SCHOOL DISTRICTSpecial Education Staffing by Program
Teachers and Instructional Aides as of November 19, 2009
TotalPupil/Staff
Program RatioRes./Incl./CM/CT/FS/VACAustin 88 8.5 10.4 2.0 10.5 8.4Bush 97 6.5 14.9 3.0 9.5 10.2Clements 118 8.5 13.9 3.0 11.5 10.3Dulles 131 11.5 11.4 2.0 13.5 9.7Elkins 134 8.0 16.8 2.0 10.0 13.4Hightower 155 9.0 17.2 6.0 15.0 10.3Kempner 126 8.0 15.8 5.0 13.0 9.7Marshall 135 10.0 13.5 1.0 11.0 12.3Travis 107 11.0 9.7 3.0 14.0 7.6Willowridge 125 11.0 11.4 3.0 14.0 8.9Baines 63 8.0 7.9 3.0 11.0 5.7Crockett 47 7.0 6.7 2.0 9.0 5.2Dulles 66 9.0 7.3 6.0 15.0 4.4First Colony 58 9.0 6.4 3.0 12.0 4.8Fort Settlement 26 6.0 4.3 2.0 8.0 3.3Garcia 54 11.0 4.9 2.0 13.0 4.2Hodges Bend 84 9.0 9.3 3.0 12.0 7.0Lake Olympia 84 8.0 10.5 4.0 12.0 7.0McAuliffe 42 6.0 7.0 3.0 9.0 4.7Missouri City 67 6.0 11.2 5.0 11.0 6.1Quail Valley 19 3.0 6.3 1.0 4.0 4.8Sartartia 47 5.0 9.4 3.0 8.0 5.9Sugar Land 65 8.0 8.1 4.0 12.0 5.4Armstrong 29 2.0 14.5 3.0 5.0 5.8Austin Parkway 18 2.0 9.0 2.0 4.0 4.5Barrington Place 19 3.0 6.3 4.0 7.0 2.7Blue Ridge 22 3.0 7.3 3.0 6.0 3.7Brazos Bend 16 3.0 5.3 3.0 6.0 2.7Briargate 25 3.0 8.3 2.0 5.0 5.0Burton 17 3.0 5.7 2.0 5.0 3.4Colony Bend 7 2.0 3.5 2.0 4.0 1.8Colony Meadows 20 2.5 8.0 3.0 5.5 3.6Commonwealth 13 3.0 4.3 6.0 9.0 1.4Cornerstone 17 2.0 8.5 2.0 4.0 4.3Drabek 18 3.0 6.0 3.0 6.0 3.0Dulles 21 3.0 7.0 3.0 6.0 3.5Fleming 8 3.0 2.7 2.0 5.0 1.6Glover 31 3.0 10.3 5.0 8.0 3.9Goodman 20 3.0 6.7 1.0 4.0 5.0Highlands 29 3.0 9.7 4.0 7.0 4.1Holley 19 4.0 4.8 5.0 9.0 2.1Hunters Glen 27 3.0 9.0 3.0 6.0 4.5Jones 35 3.0 11.7 4.0 7.0 5.0Jordan 25 2.0 12.5 2.0 4.0 6.3Lakeview 19 3.0 6.3 3.0 6.0 3.2Lantern Lane 20 3.0 6.7 2.0 5.0 4.0Lexington Creek 19 3.0 6.3 4.0 7.0 2.7Meadows 18 2.0 9.0 2.0 4.0 4.5Mission Bend 24 3.0 8.0 4.0 7.0 3.4Mission Glen 17 3.0 5.7 4.0 7.0 2.4Mission West 17 3.0 5.7 3.0 6.0 2.8Oakland 16 3.0 5.3 3.0 6.0 2.7Oyster Creek 28 3.0 9.3 5.0 8.0 3.5
Students Receiving Total
StaffServices Beyond Pupil/Tchr Instruct. Special EdSpeech Therapy Teachers Ratio Aides

FORT BEND INDEPENDENT SCHOOL DISTRICTSpecial Education Staffing by Program
Teachers and Instructional Aides as of November 19, 2009
TotalPupil/Staff
Program Ratio
Students Receiving Total
StaffServices Beyond Pupil/Tchr Instruct. Special EdSpeech Therapy Teachers Ratio Aides
Palmer 18 3.0 6.0 7.0 10.0 1.8Parks 19 2.0 9.5 2.0 4.0 4.8Pecan Grove 26 3.0 8.7 2.0 5.0 5.2Quail Valley 32 4.0 8.0 3.0 7.0 4.6Ridgegate 30 4.0 7.5 4.0 8.0 3.8Ridgemont 16 3.0 5.3 2.0 5.0 3.2Scanlan Oaks 15 3.0 5.0 4.0 7.0 2.1Schiff 17 3.0 5.7 4.0 7.0 2.4Seguin 31 3.0 10.3 3.0 6.0 5.2Settlers Way 60 3.0 20.0 4.0 7.0 8.6Sienna Crossing 17 3.0 5.7 6.0 9.0 1.9Sugar Mill 21 3.0 7.0 5.0 8.0 2.6Townewest 20 3.0 6.7 6.0 9.0 2.2Walker Station 22 3.0 7.3 4.0 7.0 3.1
Sub Total 2896 315 9.2 221 535.5 5.4
Life Skills, Severe/ProfoundAustin 25 3.0 8.3 4.0 7.0 3.6Bush 26 4.0 6.5 6.0 10.0 2.6Clements 19 3.0 6.3 6.0 9.0 2.1Dulles 15 2.0 7.5 3.0 5.0 3.0Elkins 23 3.0 7.7 6.0 9.0 2.6Hightower 17 2.0 8.5 5.0 7.0 2.4Kempner 24 2.0 12.0 2.0 4.0 6.0Marshall 22 3.0 7.3 5.0 8.0 2.8Travis 18 3.0 6.0 5.0 8.0 2.3Willowridge 41 5.0 8.2 11.0 16.0 2.6Baines 3 1.0 3.0 1.0 2.0 1.5Crockett 10 1.0 10.0 2.0 3.0 3.3Dulles 8 1.0 8.0 3.0 4.0 2.0First Colony 3 1.0 3.0 3.0 4.0 0.8Fort Settlement 8 1.0 8.0 1.0 2.0 4.0Garcia 14 2.0 7.0 5.0 7.0 2.0Hodges Bend 19 2.0 9.5 3.0 5.0 3.8Lake Olympia 11 1.0 11.0 2.0 3.0 3.7McAuliffe 5 1.0 5.0 1.0 2.0 2.5Missouri City 7 1.0 7.0 3.0 4.0 1.8Quail Valley 14 2.0 7.0 4.0 6.0 2.3Sartartia 5 1.0 5.0 1.0 2.0 2.5Sugar Land 18 2.0 9.0 4.0 6.0 3.0Barrington Place 9 1.0 9.0 2.0 3.0 3.0Brazos Bend 7 1.0 7.0 1.0 2.0 3.5Colony Bend 5 1.0 5.0 2.0 3.0 1.7Drabek 3 1.0 3.0 3.0 4.0 0.8Jones 11 1.0 11.0 2.0 3.0 3.7Jordan 4 1.0 4.0 2.0 3.0 1.3Lexington Creek 12 1.0 12.0 2.0 3.0 4.0Parks 6 1.0 6.0 1.0 2.0 3.0Quail Valley 8 1.0 8.0 1.0 2.0 4.0Seguin 5 1.0 5.0 1.0 2.0 2.5Sienna Crossing 7 1.0 7.0 1.0 2.0 3.5
Sub Total 432 58.0 7.4 104.0 162.0 2.7

FORT BEND INDEPENDENT SCHOOL DISTRICTSpecial Education Staffing by Program
Teachers and Instructional Aides as of November 19, 2009
TotalPupil/Staff
Program Ratio
Students Receiving Total
StaffServices Beyond Pupil/Tchr Instruct. Special EdSpeech Therapy Teachers Ratio Aides
PPCDArmstrong 7 1.0 7.0 2.0 3.0 2.3Barrington Place 11 1.0 11.0 2.0 3.0 3.7Blue Ridge 6 1.0 6.0 2.0 3.0 2.0Colony Bend 8 1.0 8.0 2.0 3.0 2.7Commonwealth 9 1.0 9.0 2.0 3.0 3.0Drabek 9 1.0 9.0 2.0 3.0 3.0Fleming 10 1.0 10.0 2.0 3.0 3.3Highlands 9 1.0 9.0 2.0 3.0 3.0Hunters Glen 6 1.0 6.0 2.0 3.0 2.0Lantern Lane 5 1.0 5.0 1.0 2.0 2.5Mission Bend 8 1.0 8.0 1.0 2.0 4.0Mission Glen 7 1.0 7.0 2.0 3.0 2.3Oakland 9 1.0 9.0 2.0 3.0 3.0Palmer 7 1.0 7.0 2.0 3.0 2.3Parks 6 1.0 6.0 2.0 3.0 2.0Scanlan Oaks 11 1.0 11.0 2.0 3.0 3.7
Sub Total 128 16 8.0 30 46 2.8
Adaptive Behavior, AutismAustin 5 1.0 5.0 1.0 2.0 2.5Bush 16 2.0 8.0 3.0 5.0 3.2Clements 6 1.0 6.0 1.0 2.0 3.0Dulles 15 2.0 7.5 3.0 5.0 3.0Elkins 18 2.0 9.0 5.0 7.0 2.6Hightower 11 3.0 3.7 1.0 4.0 2.8Kempner 7 2.0 3.5 2.0 4.0 1.8Marshall 15 2.0 7.5 3.0 5.0 3.0Travis 14 3.0 4.7 5.0 8.0 1.8Willowridge 13 2.0 6.5 2.0 4.0 3.3Baines 9 2.0 4.5 6.0 8.0 1.1Crockett 7 2.0 3.5 3.0 5.0 1.4Fort Settlement 7 2.0 3.5 3.0 5.0 1.4Garcia 7 1.0 7.0 1.0 2.0 3.5Hodges Bend 2 1.0 2.0 1.0 2.0 1.0Lake Olympia 5 1.0 5.0 1.0 2.0 2.5McAuliffe 6 2.0 3.0 2.0 4.0 1.5Missouri City 4 1.0 4.0 1.0 2.0 2.0Sartartia 8 2.0 4.0 6.0 8.0 1.0Sugar Land 5 1.0 5.0 2.0 3.0 1.7Austin Parkway 6 2.0 3.0 3.0 5.0 1.2Barrington Place 7 1.0 7.0 2.0 3.0 2.3Burton 5 1.0 5.0 1.0 2.0 2.5Colony Bend 5 1.0 5.0 2.0 3.0 1.7Colony Meadows 5 1.0 5.0 3.0 4.0 1.3Cornerstone 6 1.0 6.0 2.0 3.0 2.0Glover 7 1.0 7.0 3.0 4.0 1.8Goodman 7 1.0 7.0 3.0 4.0 1.8Jones 3 1.0 3.0 1.0 2.0 1.5Lakeview 7 1.0 7.0 3.0 4.0 1.8Lantern Lane 4 1.0 4.0 1.0 2.0 2.0Meadows 4 1.0 4.0 1.0 2.0 2.0

FORT BEND INDEPENDENT SCHOOL DISTRICTSpecial Education Staffing by Program
Teachers and Instructional Aides as of November 19, 2009
TotalPupil/Staff
Program Ratio
Students Receiving Total
StaffServices Beyond Pupil/Tchr Instruct. Special EdSpeech Therapy Teachers Ratio Aides
Mission West 4 1.0 4.0 1.0 2.0 2.0Oyster Creek 6 1.0 6.0 2.0 3.0 2.0Pecan Grove 4 1.0 4.0 2.0 3.0 1.3Ridgegate 5 1.0 5.0 2.0 3.0 1.7Schiff 3 1.0 3.0 1.0 2.0 1.5Sugar Mill 4 1.0 4.0 1.0 2.0 2.0Townewest 4 1.0 4.0 1.0 2.0 2.0
Sub Total 276 55 5.0 87 142 1.9
RDSFDMarshall HS 16 3.0 5.3 4.0 7.0 2.3First Colony MS 4 2.0 2.0 1.0 3.0 1.3Meadows Elementary 10 2.0 5.0 2.0 4.0 2.5Settlers Way Elementary 32 4.0 8.0 4.0 8.0 4.0
Sub Total 62 11 5.6 11 22 2.8
Total 3,794 454.5 8.3 453.0 907.5 4.2
Fort Bend ISD at State Average 3,794 272.9 13.9 301.9 574.8 6.6
Difference -181.6 -151.1
Savings at Average Salaries $9,652,306 $3,362,303 $13,014,609

FORT BEND INDEPENDENT SCHOOL DISTRICTSpecial Education Enrollment by Campus as of November 9, 2009
Total SpEd Percent Speech Net Sped Net %Campus Pupils Students SpEd Only Stds Students SpEd
High Schools
Austin 2,350 119 5.1% 1 118 5.0%Bush 2,021 142 7.0% 3 139 6.9%Clements 2,804 146 5.2% 3 143 5.1%Dulles 2,073 161 7.8% 0 161 7.8%Elkins 2,387 178 7.5% 3 175 7.3%Hightower 2,728 192 7.0% 9 183 6.7%Kempner 2,537 157 6.2% 0 157 6.2%Marshall 1,450 173 11.9% 1 172 11.9%Travis 2,179 142 6.5% 3 139 6.4%Willowridge 1,461 184 12.6% 5 179 12.3%
Alternative Schools
Progressive N.A. 5 N.A. 0 5 N.A.MR Wood 132 15 11.4% 0 15 11.4%JJAEP N.A. 2 N.A. 0 2 N.A.
Middle Schools
Baines 1,361 79 5.8% 4 75 5.5%Crockett 1,352 66 4.9% 2 64 4.7%Dulles 1,345 82 6.1% 8 74 5.5%First Colony 1,116 63 5.6% 2 61 5.5%Fort Settlement 1,097 42 3.8% 1 41 3.7%Garcia 1,359 77 5.7% 2 75 5.5%Hodges Bend 1,401 113 8.1% 8 105 7.5%Lake Olympia 1,334 102 7.6% 2 100 7.5%McAuliffe 610 53 8.7% 0 53 8.7%Missouri City 762 79 10.4% 1 78 10.2%Quail Valley 847 34 4.0% 1 33 3.9%Sartartia 1,269 62 4.9% 2 60 4.7%Sugar Land 1,412 95 6.7% 7 88 6.2%
Elementary Schools
Armstrong 809 59 7.3% 23 36 4.4%Austin Parkway 817 44 5.4% 20 24 2.9%Barrington Place 876 70 8.0% 24 46 5.3%Blue Ridge 638 33 5.2% 14 19 3.0%Brazos Bend 779 45 5.8% 22 23 3.0%Briargate 617 32 5.2% 7 25 4.1%Burton 937 36 3.8% 14 22 2.3%Colony Bend 400 39 9.8% 14 25 6.3%Colony Meadows 593 28 4.7% 3 25 4.2%Commonwealth 705 40 5.7% 18 22 3.1%Cornerstone 750 33 4.4% 10 23 3.1%Drabek 917 47 5.1% 21 26 2.8%Dulles 672 33 4.9% 12 21 3.1%Fleming 696 38 5.5% 20 18 2.6%Glover 803 50 6.2% 12 38 4.7%

FORT BEND INDEPENDENT SCHOOL DISTRICTSpecial Education Enrollment by Campus as of November 9, 2009
Total SpEd Percent Speech Net Sped Net %Campus Pupils Students SpEd Only Stds Students SpEd
Goodman 643 39 6.1% 12 27 4.2%Highlands 586 58 9.9% 20 38 6.5%Holley 768 51 6.6% 21 30 3.9%Hunters Glen 617 48 7.8% 15 33 5.3%Jones 761 71 9.3% 22 49 6.4%Jordan 805 35 4.3% 16 19 2.4%Lakeview 563 26 4.6% 7 19 3.4%Lantern Lane 645 39 6.0% 10 29 4.5%Lexington Creek 666 44 6.6% 13 31 4.7%Meadows 432 41 9.5% 19 22 5.1%Mission Bend 801 51 6.4% 27 24 3.0%Mission Glen 723 35 4.8% 11 24 3.3%Mission West 775 40 5.2% 19 21 2.7%Oakland 811 47 5.8% 22 25 3.1%Oyster Creek 822 52 6.3% 18 34 4.1%Palmer 754 44 5.8% 19 25 3.3%Parks 618 42 6.8% 11 31 5.0%Pecan Grove 583 46 7.9% 20 26 4.5%Quail Valley 615 61 9.9% 21 40 6.5%Ridgegate 755 47 6.2% 12 35 4.6%Ridgemont 807 26 3.2% 10 16 2.0%Scanlan Oaks 958 51 5.3% 25 26 2.7%Schiff 823 36 4.4% 16 20 2.4%Seguin 493 62 12.6% 26 36 7.3%Settlers Way 734 73 9.9% 13 60 8.2%Sienna Crossing 966 44 4.6% 20 24 2.5%Sugar Mill 739 56 7.6% 31 25 3.4%Townewest 840 43 5.1% 19 24 2.9%Walker Station 904 52 5.8% 30 22 2.4%
Total 69,403 4,550 6.6% 827 3,723 5.4%
State Identification in 2008-09 = 9.4%
Fort Bend ISD Identification in 2006-07 = 8.6%
Fort Bend ISD Identification in 2007-08 = 7.8%
Fort Bend ISD Identification in 2008-09 = 7.1%

FORT BEND INDEPENDENT SCHOOL DISTRICTAssessment and Speech Pathology
Special Education Enrollment and Staffing as of November 6, 2009
SpEd CaseProgram Students Staff Load
Assessment
Fort Bend ISD 4,550 52 87.5
Benchmark 100-105
Proposed 4,550 51 89.24,550 50 91.04,550 49 92.94,550 48 94.84,550 47 96.84,550 46 98.94,550 45 101.1
Speech Pathology
Fort Bend ISD 2,400 45 53.3
Benchmark 50-55

Support Staff

FORT BEND INDEPENDENT SCHOOL DISTRICTMeals Per Labor Hour (MPLH)
Data for week of October 19-23, 2009
Enrollment Total Avg. Daily Avg. Daily Avg. Avg. Daily Avg. Daily Avg. Daily Avg. Daily Average Average Staffing(as of Oct. F/R F/R Bkfst Paid Bkfst Daily "Type A" Paid Lnch Ala Carte Ala Carte Meals Labor Hrs Actual Standard Efficiency
Campus 19-23, '09) Count Served Served Snacks Lunches Served Sales Equivalents per Day per Day MPLH MPLH * (MPLH)
Austin 2,350 343 32 7 0 177 115 $2,026 1,013 1,325 95.5 13.9 18.0 77%Bush 2,021 1,020 170 21 0 532 119 $1,502 751 1,497 95.5 15.7 18.0 87%Clements 2,804 150 12 2 0 58 151 $2,437 1,219 1,435 95.5 15.0 18.0 83%Dulles ** 2,205 516 87 22 0 274 165 $2,057 1,029 1,522 121.0 12.6 18.0 70%Elkins 2,387 413 21 16 0 136 216 $2,071 1,035 1,407 95.5 14.7 18.0 82%Hightower 2,728 998 85 8 0 411 100 $2,740 1,370 1,927 100.0 19.3 18.0 107%Kempner 2,537 769 155 51 0 455 272 $1,844 922 1,753 95.5 18.4 18.0 102%Marshall 1,450 733 59 6 0 322 61 $1,288 644 1,060 95.5 11.1 18.0 62%Travis 2,179 512 92 15 0 329 191 $1,672 836 1,410 95.5 14.8 18.0 82%Willowridge 1,461 961 155 9 0 483 64 $1,098 549 1,179 102.5 11.5 18.0 64%
Baines 1,361 369 105 38 0 261 154 $1,226 613 1,099 68.0 16.2 18.0 90%Crockett 1,352 454 137 45 0 296 195 $1,377 689 1,270 65.5 19.4 18.0 108%Dulles 1,345 319 34 9 0 199 219 $1,317 658 1,098 84.5 13.0 18.0 72%First Colony 1,116 147 11 7 0 81 163 $1,319 660 913 65.5 13.9 17.4 80%Fort Settlement 1,097 66 1 7 0 39 243 $1,411 705 991 65.5 15.1 17.4 87%Garcia 1,359 411 45 26 0 256 220 $1,379 689 1,200 65.5 18.3 18.0 102%Hodges Bend 1,401 911 242 49 0 669 205 $968 484 1,504 72.5 20.7 18.0 115%Lake Olympia 1,334 566 60 18 0 322 183 $1,231 615 1,159 72.5 16.0 18.0 89%McAuliffe 610 481 134 11 81 328 28 $600 300 769 65.5 11.7 17.3 68%Missouri City 762 520 184 33 50 338 82 $863 432 985 72.5 13.6 18.0 75%Quail Valley 847 223 22 6 0 130 106 $1,015 507 758 65.5 11.6 16.4 71%Sartartia 1,269 96 5 2 0 45 91 $1,376 688 827 65.5 12.6 17.3 73%Sugar Land 1,412 572 67 9 0 398 230 $1,645 822 1,488 70.0 21.3 18.0 118%
Armstrong 809 621 184 22 0 553 120 $30 15 791 35.5 22.3 17.9 124%Austin Parkway 817 66 21 33 0 55 423 $101 50 556 33.0 16.8 15.5 109%Barrington Place 876 255 67 41 0 216 377 $117 59 705 33.0 21.4 17.0 126%Blue Ridge 638 500 163 33 128 412 84 $83 41 700 33.0 21.2 17.0 125%Brazos Bend 779 95 14 28 0 70 321 $154 77 488 33.0 14.8 14.8 100%Briargate 617 464 154 26 0 389 94 $102 51 624 40.0 15.6 16.2 96%Burton 937 669 228 35 0 559 191 $71 35 917 47.0 19.5 18.0 108%Colony Bend 400 47 6 13 0 35 196 $99 50 291 28.5 10.2 12.9 79%Colony Meadows 593 44 10 15 0 34 260 $119 59 366 28.5 12.8 13.6 94%Commonwealth 705 5 0 10 0 4 390 $116 58 456 28.5 16.0 14.5 110%Cornerstone 750 43 5 30 0 34 397 $218 109 558 35.5 15.7 15.5 101%Drabek 917 180 40 48 0 146 434 $84 42 665 40.0 16.6 16.6 100%Dulles 672 230 70 35 0 190 244 $87 44 530 35.5 14.9 15.3 98%Fleming 696 395 100 21 0 327 189 $40 20 597 40.0 14.9 15.9 94%Glover 803 482 168 89 0 395 234 $71 35 793 40.0 19.8 17.9 111%Goodman 643 403 162 66 0 347 183 $117 58 703 42.5 16.5 17.0 97%Highlands 586 107 13 16 0 79 243 $135 68 404 33.0 12.3 14.0 88%

FORT BEND INDEPENDENT SCHOOL DISTRICTMeals Per Labor Hour (MPLH)
Data for week of October 19-23, 2009
Holley 768 445 150 37 0 396 216 $41 20 727 35.5 20.5 17.2 119%Hunters Glen 617 405 132 32 0 349 154 $97 48 634 40.0 15.8 16.3 97%Jones 761 562 212 45 120 494 150 $148 74 906 40.0 22.7 18.0 126%Jordan 805 328 77 52 0 276 322 $70 35 698 40.0 17.4 16.9 103%Lakeview 563 166 32 24 0 136 220 $109 55 439 33.0 13.3 14.3 93%Lantern Lane 645 324 75 29 0 254 204 $47 23 533 33.0 16.2 15.3 106%Lexington Creek 666 76 15 24 0 66 376 $211 106 567 35.5 16.0 15.6 102%Meadows 432 166 52 22 0 143 159 $71 36 375 28.5 13.2 13.7 96%Mission Bend 801 579 168 28 0 478 147 $68 34 757 40.0 18.9 17.5 108%Mission Glen 723 398 97 38 0 328 228 $99 49 673 40.0 16.8 16.7 101%Mission West 775 490 122 36 0 413 160 $21 10 662 40.0 16.6 16.6 100%Oakland 811 129 31 55 0 107 370 $109 55 574 35.5 16.2 15.7 103%Oyster Creek 822 240 57 85 0 197 363 $67 33 664 33.0 20.1 16.6 121%Palmer 754 155 56 61 0 135 384 $82 41 619 33.0 18.8 16.1 116%Parks 618 384 115 48 10 337 176 $113 56 656 35.5 18.5 16.5 112%Pecan Grove 583 82 18 18 0 57 198 $72 36 309 28.5 10.8 13.0 83%Quail Valley 615 207 74 54 0 161 228 $66 33 486 40.0 12.1 14.8 82%Ridgegate 755 667 159 19 0 601 72 $116 58 820 51.5 15.9 18.0 88%Ridgemont 807 712 228 16 81 645 72 $33 16 895 51.5 17.4 18.0 97%Scanlan Oaks 958 42 12 31 0 33 458 $131 65 578 35.5 16.3 15.7 104%Schiff 823 222 100 74 0 213 386 $94 47 733 35.5 20.7 17.3 119%Seguin 493 198 58 29 0 173 193 $102 51 461 35.5 13.0 14.6 89%Settlers Way 734 108 26 37 0 77 313 $257 128 550 28.5 19.3 15.5 125%Sienna Crossing 966 77 28 34 0 37 386 $176 88 541 35.5 15.2 15.4 99%Sugar Mill 739 184 41 48 0 149 309 $139 69 572 28.5 20.1 15.7 128%Townewest 840 593 159 25 0 494 135 $70 35 756 40.0 18.9 17.5 108%Walker Station 904 31 3 19 0 21 333 $36 18 383 28.5 13.4 13.8 97%
TOTAL 69,403 24,126 5,614 1,997 470 17,156 14,666 $38,849 19,425 55,287 3478.50 15.9
Percent Free/Reduced 35%Percent Breakfast Served 8%Percent Lunch Served 25%
Labor Hours = Total hours devoted to preparation, serving, and clean-up.2 Breakfasts and/or 2 snacks = 1 Meal Equivalent$2.00 of Ala Carte Sales = 1 Meal Equivalent
* Standard MPLH from "School Food Service Management in the 21st Century" by Dorothy Pannell
** PHS and MRW data included in DHS data

FORT BEND INDEPENDENT SCHOOL DISTRICTMPLH and Staffing Recovery
Data from week of October 19-23, 2009
Average Average Allowed Labor Hours FTEs at 7.0 Net Salary Daily Meals Standard Daily Labor Hours Above (Below) Labor Hours to and Benefits
Campus Served MPLH * Labor Hours at Std MPLH Standard be Recovered to be Gained (Lost)
Austin 1,325 18.0 95.5 73.6 21.9 3.1 $45,820Bush 1,497 18.0 95.5 83.2 12.3 1.8 $25,765Clements 1,435 18.0 95.5 79.7 15.8 2.3 $33,000Dulles ** 1,522 18.0 121.0 84.6 36.4 5.2 $76,247Elkins 1,407 18.0 95.5 78.1 17.4 2.5 $36,320Hightower 1,927 18.0 100.0 107.0 (7.0) (1.0) ($14,748)Kempner 1,753 18.0 95.5 97.4 (1.9) (0.3) ($3,898)Marshall 1,060 18.0 95.5 58.9 36.6 5.2 $76,600Travis 1,410 18.0 95.5 78.3 17.2 2.5 $35,927Willowridge 1,179 18.0 102.5 65.5 37.0 5.3 $77,464
Baines 1,099 18.0 68.0 61.1 6.9 1.0 $14,492Crockett 1,270 18.0 65.5 70.5 (5.0) (0.7) ($10,546)Dulles 1,098 18.0 84.5 61.0 23.5 3.4 $49,203First Colony 913 17.4 65.5 52.5 13.0 1.9 $27,268Fort Settlement 991 17.4 65.5 56.9 8.6 1.2 $17,918Garcia 1,200 18.0 65.5 66.7 (1.2) (0.2) ($2,475)Hodges Bend 1,504 18.0 72.5 83.5 (11.0) (1.6) ($23,079)Lake Olympia 1,159 18.0 72.5 64.4 8.1 1.2 $16,949McAuliffe 769 17.3 65.5 44.4 21.1 3.0 $44,089Missouri City 985 18.0 72.5 54.7 17.8 2.5 $37,168Quail Valley 758 16.4 65.5 46.2 19.3 2.8 $40,346Sartartia 827 17.3 65.5 47.8 17.7 2.5 $36,984Sugar Land 1,488 18.0 70.0 82.7 (12.7) (1.8) ($26,469)
Armstrong 791 17.9 35.5 44.2 (8.7) (1.2) ($18,183)Austin Parkway 556 15.5 33.0 35.8 (2.8) (0.4) ($5,960)Barrington Place 705 17.0 33.0 41.5 (8.5) (1.2) ($17,778)Blue Ridge 700 17.0 33.0 41.2 (8.2) (1.2) ($17,114)Brazos Bend 488 14.8 33.0 33.0 0.0 0.0 $44Briargate 624 16.2 40.0 38.5 1.5 0.2 $3,118Burton 917 18.0 47.0 51.0 (4.0) (0.6) ($8,294)Colony Bend 291 12.9 28.5 22.5 6.0 0.9 $12,490Colony Meadows 366 13.6 28.5 26.9 1.6 0.2 $3,311Commonwealth 456 14.5 28.5 31.4 (2.9) (0.4) ($6,167)Cornerstone 558 15.5 35.5 36.0 (0.5) (0.1) ($1,023)Drabek 665 16.6 40.0 40.1 (0.1) (0.0) ($171)

FORT BEND INDEPENDENT SCHOOL DISTRICTMPLH and Staffing Recovery
Data from week of October 19-23, 2009
Dulles 530 15.3 35.5 34.7 0.8 0.1 $1,739Fleming 597 15.9 40.0 37.6 2.4 0.3 $5,091Glover 793 17.9 40.0 44.3 (4.3) (0.6) ($9,033)Goodman 703 17.0 42.5 41.4 1.1 0.2 $2,384Highlands 404 14.0 33.0 28.9 4.1 0.6 $8,623Holley 727 17.2 35.5 42.2 (6.7) (1.0) ($14,105)Hunters Glen 634 16.3 40.0 38.9 1.1 0.2 $2,375Jones 906 18.0 40.0 50.4 (10.4) (1.5) ($21,663)Jordan 698 16.9 40.0 41.3 (1.3) (0.2) ($2,694)Lakeview 439 14.3 33.0 30.7 2.3 0.3 $4,779Lantern Lane 533 15.3 33.0 34.8 (1.8) (0.3) ($3,836)Lexington Creek 567 15.6 35.5 36.4 (0.9) (0.1) ($1,798)Meadows 375 13.7 28.5 27.4 1.1 0.2 $2,340Mission Bend 757 17.5 40.0 43.2 (3.2) (0.5) ($6,798)Mission Glen 673 16.7 40.0 40.3 (0.3) (0.0) ($619)Mission West 662 16.6 40.0 39.9 0.1 0.0 $205Oakland 574 15.7 35.5 36.6 (1.1) (0.2) ($2,221)Oyster Creek 664 16.6 33.0 40.0 (7.0) (1.0) ($14,617)Palmer 619 16.1 33.0 38.4 (5.4) (0.8) ($11,372)Parks 656 16.5 35.5 39.8 (4.3) (0.6) ($8,897)Pecan Grove 309 13.0 28.5 23.7 4.8 0.7 $9,967Quail Valley 486 14.8 40.0 32.8 7.2 1.0 $15,030Ridgegate 820 18.0 51.5 45.6 5.9 0.8 $12,442Ridgemont 895 18.0 51.5 49.7 1.8 0.3 $3,672Scanlan Oaks 578 15.7 35.5 36.8 (1.3) (0.2) ($2,755)Schiff 733 17.3 35.5 42.4 (6.9) (1.0) ($14,406)Seguin 461 14.6 35.5 31.6 3.9 0.6 $8,261Settlers Way 550 15.5 28.5 35.5 (7.0) (1.0) ($14,655)Sienna Crossing 541 15.4 35.5 35.1 0.4 0.1 $774Sugar Mill 572 15.7 28.5 36.4 (7.9) (1.1) ($16,577)Townewest 756 17.5 40.0 43.2 (3.2) (0.5) ($6,691)Walker Station 383 13.8 28.5 27.8 0.7 0.1 $1,541
TOTAL 55,287 3,478.5 3,248.5 230.0 32.9 $481,106
* Standard MPLH from "School Food Service Management in the 21st Century" by Dorothy Pannell
** PHS and MRW data included in DHS data

FORT BEND INDEPENDENT SCHOOL DISTRICTMaintenance Staffing Compared to APPA Standards *
Square Footage and Staffing as of November 19, 2009
Position
Craftsman 10,731,655 1 : 500,000 GSF 21.5 16 (5.5)
HVAC Technician 1 : 450,000 GSF 23.8 8 (15.8)
Plumber, Welder, Water Quality Technician 1 : 390,000 GSF 27.5 5 (22.5)
Electrician, Appliance Repair Technician, 1 : 380,000 GSF 28.2 17 (11.2)Radio Technician, Electronics Technician
Carpenter, Locksmith, Mason 1 : 300,000 GSF 35.8 6 (29.8)
Painter, Roofer 1 : 300,000 GSF 35.8 9 (26.8)
Groundsman, IPM Technician 1,511 Acres 1 : 45 acres 33.6 37 3.4
Craftsman Helpers 14Mechanic, Equipment Operator 9Utility, CDL Driver 15Warehouse 4
Supervisor, Foreman 17
Spending for Contract Labor Services $2,015,912 1 : $42,833 47.1
Department Sub-Totals 206.2 204.1 (2.1)
Director 1
Secretary, Clerk 10
Department Totals 215.1
* Association of Physical Plant Administrators, (APPA) standards per Gross Square Foot (GSF) are used for projections
Fort Bend ISD GrossSquare Footage
APPA*Standard Difference
APPAStaffing
CurrentStaffing
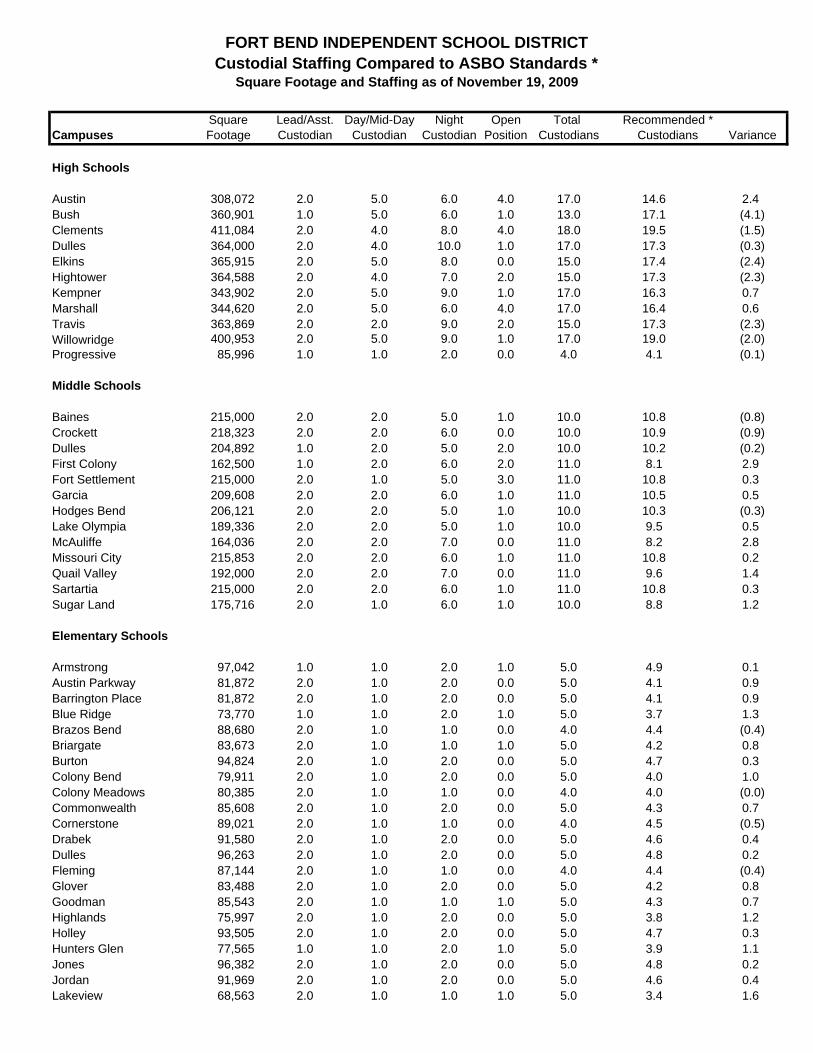
FORT BEND INDEPENDENT SCHOOL DISTRICTCustodial Staffing Compared to ASBO Standards *
Square Footage and Staffing as of November 19, 2009
Lead/Asst. Day/Mid-Day Night Open Total Campuses Custodian Custodian Custodian Position Custodians Variance
High Schools
Austin 308,072 2.0 5.0 6.0 4.0 17.0 14.6 2.4Bush 360,901 1.0 5.0 6.0 1.0 13.0 17.1 (4.1)Clements 411,084 2.0 4.0 8.0 4.0 18.0 19.5 (1.5)Dulles 364,000 2.0 4.0 10.0 1.0 17.0 17.3 (0.3)Elkins 365,915 2.0 5.0 8.0 0.0 15.0 17.4 (2.4)Hightower 364,588 2.0 4.0 7.0 2.0 15.0 17.3 (2.3)Kempner 343,902 2.0 5.0 9.0 1.0 17.0 16.3 0.7Marshall 344,620 2.0 5.0 6.0 4.0 17.0 16.4 0.6Travis 363,869 2.0 2.0 9.0 2.0 15.0 17.3 (2.3)Willowridge 400,953 2.0 5.0 9.0 1.0 17.0 19.0 (2.0)Progressive 85,996 1.0 1.0 2.0 0.0 4.0 4.1 (0.1)
Middle Schools
Baines 215,000 2.0 2.0 5.0 1.0 10.0 10.8 (0.8)Crockett 218,323 2.0 2.0 6.0 0.0 10.0 10.9 (0.9)Dulles 204,892 1.0 2.0 5.0 2.0 10.0 10.2 (0.2)First Colony 162,500 1.0 2.0 6.0 2.0 11.0 8.1 2.9Fort Settlement 215,000 2.0 1.0 5.0 3.0 11.0 10.8 0.3Garcia 209,608 2.0 2.0 6.0 1.0 11.0 10.5 0.5Hodges Bend 206,121 2.0 2.0 5.0 1.0 10.0 10.3 (0.3)Lake Olympia 189,336 2.0 2.0 5.0 1.0 10.0 9.5 0.5McAuliffe 164,036 2.0 2.0 7.0 0.0 11.0 8.2 2.8Missouri City 215,853 2.0 2.0 6.0 1.0 11.0 10.8 0.2Quail Valley 192,000 2.0 2.0 7.0 0.0 11.0 9.6 1.4Sartartia 215,000 2.0 2.0 6.0 1.0 11.0 10.8 0.3Sugar Land 175,716 2.0 1.0 6.0 1.0 10.0 8.8 1.2
Elementary Schools
Armstrong 97,042 1.0 1.0 2.0 1.0 5.0 4.9 0.1Austin Parkway 81,872 2.0 1.0 2.0 0.0 5.0 4.1 0.9Barrington Place 81,872 2.0 1.0 2.0 0.0 5.0 4.1 0.9Blue Ridge 73,770 1.0 1.0 2.0 1.0 5.0 3.7 1.3Brazos Bend 88,680 2.0 1.0 1.0 0.0 4.0 4.4 (0.4)Briargate 83,673 2.0 1.0 1.0 1.0 5.0 4.2 0.8Burton 94,824 2.0 1.0 2.0 0.0 5.0 4.7 0.3Colony Bend 79,911 2.0 1.0 2.0 0.0 5.0 4.0 1.0Colony Meadows 80,385 2.0 1.0 1.0 0.0 4.0 4.0 (0.0)Commonwealth 85,608 2.0 1.0 2.0 0.0 5.0 4.3 0.7Cornerstone 89,021 2.0 1.0 1.0 0.0 4.0 4.5 (0.5)Drabek 91,580 2.0 1.0 2.0 0.0 5.0 4.6 0.4Dulles 96,263 2.0 1.0 2.0 0.0 5.0 4.8 0.2Fleming 87,144 2.0 1.0 1.0 0.0 4.0 4.4 (0.4)Glover 83,488 2.0 1.0 2.0 0.0 5.0 4.2 0.8Goodman 85,543 2.0 1.0 1.0 1.0 5.0 4.3 0.7Highlands 75,997 2.0 1.0 2.0 0.0 5.0 3.8 1.2Holley 93,505 2.0 1.0 2.0 0.0 5.0 4.7 0.3Hunters Glen 77,565 1.0 1.0 2.0 1.0 5.0 3.9 1.1Jones 96,382 2.0 1.0 2.0 0.0 5.0 4.8 0.2Jordan 91,969 2.0 1.0 2.0 0.0 5.0 4.6 0.4Lakeview 68,563 2.0 1.0 1.0 1.0 5.0 3.4 1.6
SquareFootage
Recommended *Custodians

FORT BEND INDEPENDENT SCHOOL DISTRICTCustodial Staffing Compared to ASBO Standards *
Square Footage and Staffing as of November 19, 2009
Lead/Asst. Day/Mid-Day Night Open Total Campuses Custodian Custodian Custodian Position Custodians Variance
SquareFootage
Recommended *Custodians
Lantern Lane 78,375 2.0 1.0 1.0 1.0 5.0 3.9 1.1Lexington Creek 81,952 1.0 1.0 2.0 1.0 5.0 4.1 0.9Meadows 67,924 2.0 1.0 1.0 0.0 4.0 3.4 0.6Mission Bend 90,061 2.0 1.0 2.0 0.0 5.0 4.5 0.5Mission Glen 79,069 2.0 1.0 2.0 0.0 5.0 4.0 1.0Mission West 86,529 2.0 1.0 2.0 0.0 5.0 4.3 0.7Oakland 97,016 2.0 1.0 1.0 0.0 4.0 4.9 (0.9)Oyster Creek 87,079 2.0 1.0 1.0 0.0 4.0 4.4 (0.4)Palmer 77,856 2.0 1.0 2.0 0.0 5.0 3.9 1.1Parks 88,560 2.0 1.0 1.0 0.0 4.0 4.4 (0.4)Pecan Grove 77,497 2.0 1.0 2.0 0.0 5.0 3.9 1.1Quail Valley 90,096 2.0 1.0 2.0 0.0 5.0 4.5 0.5Ridgegate 82,983 2.0 1.0 2.0 0.0 5.0 4.1 0.9Ridgemont 86,076 2.0 1.0 2.0 0.0 5.0 4.3 0.7Scanlan Oaks 91,969 2.0 3.0 2.0 0.0 7.0 4.6 2.4Schiff 89,021 2.0 1.0 2.0 0.0 5.0 4.5 0.5Seguin 89,021 1.0 1.0 1.0 1.0 4.0 4.5 (0.5)Settlers Way 75,281 2.0 1.0 2.0 0.0 5.0 3.8 1.2Sienna Crossing 96,295 2.0 1.0 2.0 0.0 5.0 4.8 0.2Sugar Mill 78,786 2.0 1.0 2.0 0.0 5.0 3.9 1.1Townewest 87,195 2.0 1.0 2.0 0.0 5.0 4.4 0.6Walker Station 84,183 2.0 1.0 2.0 0.0 5.0 4.2 0.8
Other Sites
Administration Bldg 77,000 2.0 3.0 0.0 0.0 5.0 3.9 1.2Administrative Annex 40,110 1.0 2.0 0.0 0.0 3.0 2.0 1.0M.R.Wood 45,950 1.0 1.0 2.0 0.0 4.0 2.3 1.7Natatorium 39,471 1.0 1.0 0.0 0.0 2.0 2.0 0.0Tech Center 33,821 1.0 0.0 2.0 0.0 3.0 1.7 1.3Transportation-LOE 24,700 1.0 0.0 0.0 0.0 1.0 1.2 (0.2)Transportation-HBE 23,600 1.0 0.0 0.0 0.0 1.0 1.2 (0.2)
Campus Totals 10,329,418 135.0 122.0 234.0 43.0 534.0 507.2 26.8
* Recommended custodians based on ASBO projection of 1 custodian per 19,000 Adjusted Square Feet (ASF)(ASF = 95% of actual square footage)
Fort Bend ISD current staffing = 1 custodian per 20,074 gross square feet (including lead custodians)

Peer District Comparisons

FORT BEND INDEPENDENT SCHOOL DISTRICTComparison of 2007-08 AEIS Data with Peer Districts
Criterion
AEIS RatingMaint. & Oper. Tax rate $1.030 $1.127 $1.040 $1.040 $1.040 $1.020 $1.040 $1.050 $1.042Taxable Value per Student $353,615 $291,190 $436,309 $404,761 $318,570 $601,529 $295,693 $400,996 $333,420Percent Residential Value 68.5% 68.9% 72.3% 70.9% 70.3% 67.2% 79.0% 54.2%
Revenue per Student $8,498 $9,089 $9,521 $9,504 $8,896 $10,006 $8,217 $9,252 $9,388Expenditures per Student $10,341 $9,982 $10,642 $11,175 $10,678 $11,361 $9,443 $10,697 $10,162Maint. & Oper. per Student $6,759 $7,164 $7,546 $7,774 $7,426 $7,830 $7,286 $7,417 $7,826Instr Exp Ratio (11,12,13,31) 64.6% 67.2% 66.3% 69.2% 66.5% 69.6% 67.9% 64.1%
Students 46,302 53,762 49,449 61,910 85,544 53,439 67,780 4,651,516Economic Disadvantaged 31.7% 25.2% 21.9% 39.2% 47.4% 15.9% 30.6% 55.3%Limited English Proficient 11.4% 13.4% 12.0% 7.7% 6.7% 12.1% 12.4% 16.7%
Teachers 2,926.6 3,669.7 3,577.5 4,232.8 5,507.9 4,003.0 4,319.8 321,729.5Special Ed Teachers 283.6 333.9 460.8 593.0 706.0 624.0 430.8 31,552.5Net Tchrs (less SpEd) 2,643.0 3,335.8 3,116.7 3,639.8 4,801.9 3,379.0 3,889.0 290,177.0Teachers per 1,000 Stds 57.1 62.0 63.0 58.8 56.1 63.2 57.4 60.1 62.4
Professional Support 495.5 478.1 564.5 900.6 1,243.9 601.1 960.0 52,637.2Prof Support per 1,000 Stds 10.7 8.9 11.4 14.5 14.5 11.2 14.2 11.9 11.3
Campus Admin. 150.0 160.8 179.5 183.7 236.0 181.0 195.5 17,861.3Campus Adm per 1,000 Stds 3.2 3.0 3.6 3.0 2.8 3.4 2.9 3.2 3.8
Central Admin. 34.5 46.0 60.0 12.0 33.0 70.0 28.0 6,447.0Central Adm per 1,000 Stds 0.7 0.9 1.2 0.2 0.4 1.3 0.4 0.8 1.4
Educational Aides 378.8 560.0 569.3 735.4 1,115.4 664.3 607.9 62,668.8Ed Aides per 1,000 Stds 8.2 10.4 11.5 11.9 13.0 12.4 9.0 11.2 13.5Auxiliary Staff 1,560.6 1,859.4 945.2 2,152.2 3,407.8 1,374.5 2,817.2 172,002.7Aux Staff per 1,000 Stds 33.7 34.6 19.1 34.8 39.8 25.7 41.6 31.3 37.0Total Staff Members 5,546.0 6,774.0 5,896.0 8,216.7 11,544.0 6,893.9 8,928.4 633,346.5Total Staff per 1,000 Stds 119.8 126.0 119.2 132.7 134.9 129.0 131.7 126.9 136.2
Acceptable
Average StateKaty Lewisville Northside Plano Bend
Acceptable Recognized Acceptable Recognized RecognizedRecognized
ConroeFort
of Peers AverageEastNorth

FORT BEND INDEPENDENT SCHOOL DISTRICTComparison of 2007-08 AEIS Data with Peer Districts
CriterionAverage State
Katy Lewisville Northside Plano BendConroeFort
of Peers AverageEastNorth
Recommended HS Grad Plan 76.5% 83.1% 87.3% 78.8% 82.1% 82.7% 86.9% 77.9%Number Students/Teacher 15.8 14.7 13.8 14.6 15.5 13.3 15.7 14.5
Teacher Turnover Rate 15.4% 13.2% 11.7% 11.2% 10.8% 14.5% 13.7% 15.2%
Bilingual/ESL Stds 4,620 6,858 5,322 4,380 4,771 6,201 7,742 721,119Percent of Total Stds 10.0% 12.8% 10.8% 7.1% 5.6% 11.6% 11.4% 15.5%Bilingual/ESL Tchrs 205.8 200.8 195.8 253.8 362.4 249.2 236.6 23,378.3Percent of Total Tchrs 7.0% 5.5% 5.5% 6.0% 6.6% 6.2% 5.5% 7.3%Tchrs per 1,000 Students 44.5 29.3 36.8 57.9 76.0 40.2 30.6 47.5 32.4
Special Ed Stds 4,205 4,412 5,039 7,008 10,510 5,991 5,269 464,789Percent of Total Stds 9.1% 8.2% 10.2% 11.3% 12.3% 11.2% 7.8% 10.0%Special Ed Tchrs 283.6 333.9 460.8 593.0 706.0 624.0 430.8 31,552.5Percent of Total Tchrs 9.7% 9.1% 12.9% 14.0% 12.8% 15.6% 10.0% 9.8%Tchrs per 1,000 Students 67.4 75.7 91.4 84.6 67.2 104.2 81.8 81.8 67.9
Elem Class Size per TchrKindergarten 19.9 18.8 18.6 18.6 20.3 17.9 19.1 19.0 18.91st Grade 19.7 18.8 18.5 18.7 19.9 21.1 17.5 19.5 18.92nd Grade 18.9 17.9 18.0 18.8 20.0 21.7 18.7 19.2 19.03rd Grade 19.3 20.2 18.3 18.6 20.2 21.4 18.4 19.7 19.04th Grade 19.7 20.3 18.4 18.8 20.3 21.7 18.5 19.9 19.65th Grade 23.8 23.0 21.6 21.7 23.5 21.1 21.3 22.5 22.26th Grade 23.5 20.2 20.5 22.2 23.8 20.8 21.0 21.8 22.4
Sec Class Size per TchrSec. English 22.2 21.0 21.0 22.6 23.2 18.4 22.0 21.4 20.0Sec. Foreign Lang. 22.7 21.4 20.3 22.8 24.5 22.1 22.2 22.3 21.0Sec. Math 22.1 20.3 21.0 22.1 23.1 21.0 20.8 21.6 19.8Sec. Science 21.5 22.0 21.8 23.6 24.7 22.5 22.5 22.7 20.8

FORT BEND INDEPENDENT SCHOOL DISTRICTComparison of 2008-09 AEIS Data with Peer Districts
Criterion
AEIS RatingMaint. & Oper. Tax rate $1.040 $1.127 $1.040 $1.040 $1.040 $1.040 $1.040 $1.055 $1.052Taxable Value per Student $384,127 $325,745 $458,571 $436,285 $349,528 $626,151 $331,347 $430,068 $363,600Percent Residential Value 69.7% 67.6% 71.0% 69.4% 69.2% 66.0% 77.2% 53.3%
Revenue per Student $8,807 $9,458 $9,998 $10,663 $8,954 $10,012 $8,406 $9,649 $9,739Expenditures per Student $10,755 $12,779 $11,722 $11,519 $11,649 $11,221 $9,859 $11,608 $11,024Maint. & Oper. per Student $7,105 $7,640 $8,418 $8,328 $7,943 $8,301 $7,798 $7,956 $8,342Instr Exp Ratio (11,12,13,31) 65.8% 67.8% 65.5% 69.4% 67.1% 71.0% 67.9% 64.4%
Students 47,769 56,191 50,038 63,189 88,201 53,906 68,507 4,708,204Economic Disadvantaged 32.4% 27.9% 23.6% 40.0% 47.9% 20.7% 30.9% 56.7%Limited English Proficient 12.0% 13.8% 12.3% 8.3% 7.2% 11.9% 13.1% 16.9%
Teachers 3,081.8 3,913.6 3,666.2 4,310.8 5,782.4 4,067.1 4,353.8 327,662.9Special Ed Teachers 296.4 323.5 439.3 585.3 773.8 641.8 426.2 31,805.5Net Tchrs (less SpEd) 2,785.4 3,590.1 3,226.9 3,725.5 5,008.6 3,425.3 3,927.6 295,857.4Teachers per 1,000 Stds 58.3 63.9 64.5 59.0 56.8 63.5 57.3 61.0 62.8
Professional Support 527.3 509.7 579.9 908.0 1,292.7 626.2 1,003.3 54,475.5Prof Support per 1,000 Stds 11.0 9.1 11.6 14.4 14.7 11.6 14.6 12.1 11.6
Campus Admin. 160.2 172.8 188.5 189.0 249.0 186.0 196.6 18,324.9Campus Adm per 1,000 Stds 3.4 3.1 3.8 3.0 2.8 3.5 2.9 3.2 3.9
Central Admin. 36.5 46.0 80.0 10.0 34.0 71.0 25.0 6,671.7Central Adm per 1,000 Stds 0.8 0.8 1.6 0.2 0.4 1.3 0.4 0.8 1.4
Educational Aides 408.1 539.4 521.6 742.5 1124.3 672.4 556.7 62,459.5Ed Aides per 1,000 Stds 8.5 9.6 10.4 11.8 12.7 12.5 8.1 10.9 13.3Auxiliary Staff 1628.0 2009.0 1,108.7 2346.9 3680.4 1,153.8 2759.0 177,220.5Aux Staff per 1,000 Stds 34.1 35.8 22.2 37.1 41.7 21.4 40.3 32.0 37.6Total Staff Members 5,841.9 7,190.5 6,144.9 8,507.2 12,162.8 6,776.5 8,894.4 646,815.0Total Staff per 1,000 Stds 122.3 128.0 122.8 134.6 137.9 125.7 129.8 128.6 137.4
Average
Recognized Recognized Recognized Recognized Recognized Acceptable Acceptable
Average StateConroe Katy Lewisville East Northside Plano Bend of Peers
North Fort

FORT BEND INDEPENDENT SCHOOL DISTRICTComparison of 2008-09 AEIS Data with Peer Districts
Criterion AverageAverage State
Conroe Katy Lewisville East Northside Plano Bend of PeersNorth Fort
Recommended HS Grad Plan 80.6% 89.4% 91.6% 83.5% 85.0% 82.6% 87.5% 81.4%Number Students/Teacher 15.5 14.4 13.6 14.7 15.3 13.3 15.7 14.4
Teacher Turnover Rate 14.4% 13.4% 11.9% 10.4% 9.7% 11.6% 15.3% 14.7%
Bilingual/ESL Stds 5,112 7,388 5,576 5,003 5,608 6,231 8,491 757,146Percent of Total Stds 10.7% 13.1% 11.1% 7.9% 6.4% 11.6% 12.4% 16.1%Bilingual/ESL Tchrs 208.5 258.1 175.3 356.7 245.8 256.3 232.4 24,508.0Percent of Total Tchrs 6.8% 6.6% 4.8% 8.3% 4.3% 6.3% 5.3% 7.5%Tchrs per 1,000 Students 40.8 34.9 31.4 71.3 43.8 41.1 27.4 43.9 32.4
Special Ed Stds 4,047 4,395 4,847 6,526 10,667 5,894 4,877 444,026Percent of Total Stds 8.5% 7.8% 9.7% 10.3% 12.1% 10.9% 7.1% 9.4%Special Ed Tchrs 296.4 323.5 439.3 585.3 773.8 641.8 426.2 31,805.5Percent of Total Tchrs 9.6% 8.3% 12.0% 13.6% 13.4% 15.8% 9.8% 9.7%Tchrs per 1,000 Students 73.2 73.6 90.6 89.7 72.5 108.9 87.4 84.8 71.6
Elem Class Size per TchrKindergarten 19.8 18.5 19.2 19.0 19.8 18.6 19.2 19.2 19.01st Grade 19.6 18.3 18.7 18.8 20.2 19.6 17.2 19.2 19.02nd Grade 19.2 18.1 18.9 19.6 20.1 19.8 19.0 19.3 19.33rd Grade 19.6 17.8 18.7 19.4 20.0 20.2 19.1 19.3 19.34th Grade 19.6 18.0 21.1 19.7 20.0 20.3 19.0 19.8 19.75th Grade 23.6 20.0 23.8 21.8 22.9 22.4 22.0 22.4 22.16th Grade 23.7 20.3 23.9 23.0 22.8 22.4 21.1 22.7 21.5
Sec Class Size per TchrSec. English 21.4 19.8 23.8 22.4 22.4 20.8 22.7 21.8 19.8Sec. Foreign Lang. 22.8 21.3 20.1 22.1 24.0 23.2 22.3 22.3 21.1Sec. Math 21.6 19.9 23.0 21.6 22.5 22.2 21.8 21.8 19.6Sec. Science 20.5 21.6 23.9 23.4 23.8 24.5 23.8 23.0 20.5