Formulation and Preparation of Water-In-Oil-In-Water ...
19
foods Article Formulation and Preparation of Water-In-Oil-In-Water Emulsions Loaded with a Phenolic-Rich Inner Aqueous Phase by Application of High Energy Emulsification Methods Seyed Mehdi Niknam , Isabel Escudero and José M. Benito * Department of Biotechnology and Food Science, University of Burgos, Plaza Misael Bañuelos s/n, 09001 Burgos, Spain; [email protected] (S.M.N.); [email protected] (I.E.) * Correspondence: [email protected]; Tel.: +34-947-258-810 Received: 3 September 2020; Accepted: 2 October 2020; Published: 5 October 2020 Abstract: Currently, industry is requesting proven techniques that allow the use of encapsulated polyphenols, rather than free molecules, to improve their stability and bioavailability. Response surface methodology (RSM) was applied in this work to determine the optimal composition and operating conditions for preparation of water-in-oil-in-water (W/O/W) emulsions loaded with phenolic rich inner aqueous phase from olive mill wastewater. A rotor-stator mixer, an ultrasonic homogenizer and a microfluidizer processor were tested in this study as high-energy emulsification methods. Optimum results were obtained by means of microfluidizer with 148 MPa and seven cycles input levels yielding droplets of 105.3 ± 3.2 nm in average size and 0.233 ± 0.020 of polydispersity index. ζ-potential, chemical and physical stability of the optimal W/O/W emulsion were also evaluated after storage. No droplet size growth or changes in stability and ζ-potential were observed. Furthermore, a satisfactory level of phenolics retention (68.6%) and antioxidant activity (89.5%) after 35 days of storage at room temperature makes it suitable for application in the food industry. Keywords: water-in-oil-in-water (W/O/W) emulsion; response surface methodology (RSM); microfluidization; ultrasonic homogenization; rotor-stator mixing; stability analysis 1. Introduction Emulsions are generally used for the encapsulation of bioactive compounds in aqueous solutions. They consist of at least two immiscible liquids (oil and water), one of them dispersed as small droplets in the other [1,2]. Typically, droplet diameters in food systems range from 0.1 to 100 μm[3]. Emulsions can be classified as oil-in-water (O/W) or water-in-oil (W/O) emulsions, depending on whether the dispersed phase is oil or water, respectively. Furthermore, there are several types of multiple emulsions, such as oil-in-water-in-oil (O/W/O) or water-in-oil-in-water (W/O/W) emulsions [4,5]. Emulsifiers are commonly added as stabilizers to obtain a kinetically stable system [6]. The formation, stability, and properties of emulsions depend on the characteristics (polarity, water solubility, viscosity, density, etc.) of the oil phase and the type and concentration of components present in the aqueous phase [2,7–11]. The choice of surfactant used as emulsifier is very important in the food industry because it must be able not only to create and stabilize the dispersed phase droplets, but also be biodegradable and nontoxic [12]. Several studies on encapsulation and delivery of polyphenols have been published in recent years [6,13–28]. The use of encapsulated polyphenols present in phenolic-rich extracts (e.g., green tea, mango peel, olive leaf or grape seed [27–31]) instead of free molecules improves both the stability Foods 2020, 9, 1411; doi:10.3390/foods9101411 www.mdpi.com/journal/foods
Transcript of Formulation and Preparation of Water-In-Oil-In-Water ...

foods
Article
Formulation and Preparation of Water-In-Oil-In-WaterEmulsions Loaded with a Phenolic-Rich InnerAqueous Phase by Application of HighEnergy Emulsification Methods
Seyed Mehdi Niknam , Isabel Escudero and José M. Benito *
Department of Biotechnology and Food Science, University of Burgos, Plaza Misael Bañuelos s/n,09001 Burgos, Spain; [email protected] (S.M.N.); [email protected] (I.E.)* Correspondence: [email protected]; Tel.: +34-947-258-810
Received: 3 September 2020; Accepted: 2 October 2020; Published: 5 October 2020�����������������
Abstract: Currently, industry is requesting proven techniques that allow the use of encapsulatedpolyphenols, rather than free molecules, to improve their stability and bioavailability. Response surfacemethodology (RSM) was applied in this work to determine the optimal composition and operatingconditions for preparation of water-in-oil-in-water (W/O/W) emulsions loaded with phenolic richinner aqueous phase from olive mill wastewater. A rotor-stator mixer, an ultrasonic homogenizerand a microfluidizer processor were tested in this study as high-energy emulsification methods.Optimum results were obtained by means of microfluidizer with 148 MPa and seven cycles inputlevels yielding droplets of 105.3 ± 3.2 nm in average size and 0.233 ± 0.020 of polydispersityindex. ζ-potential, chemical and physical stability of the optimal W/O/W emulsion were alsoevaluated after storage. No droplet size growth or changes in stability and ζ-potential were observed.Furthermore, a satisfactory level of phenolics retention (68.6%) and antioxidant activity (89.5%) after35 days of storage at room temperature makes it suitable for application in the food industry.
Keywords: water-in-oil-in-water (W/O/W) emulsion; response surface methodology (RSM);microfluidization; ultrasonic homogenization; rotor-stator mixing; stability analysis
1. Introduction
Emulsions are generally used for the encapsulation of bioactive compounds in aqueous solutions.They consist of at least two immiscible liquids (oil and water), one of them dispersed as small droplets inthe other [1,2]. Typically, droplet diameters in food systems range from 0.1 to 100 µm [3]. Emulsions canbe classified as oil-in-water (O/W) or water-in-oil (W/O) emulsions, depending on whether thedispersed phase is oil or water, respectively. Furthermore, there are several types of multiple emulsions,such as oil-in-water-in-oil (O/W/O) or water-in-oil-in-water (W/O/W) emulsions [4,5]. Emulsifiers arecommonly added as stabilizers to obtain a kinetically stable system [6].
The formation, stability, and properties of emulsions depend on the characteristics (polarity, watersolubility, viscosity, density, etc.) of the oil phase and the type and concentration of components presentin the aqueous phase [2,7–11]. The choice of surfactant used as emulsifier is very important in the foodindustry because it must be able not only to create and stabilize the dispersed phase droplets, but alsobe biodegradable and nontoxic [12].
Several studies on encapsulation and delivery of polyphenols have been published in recentyears [6,13–28]. The use of encapsulated polyphenols present in phenolic-rich extracts (e.g., green tea,mango peel, olive leaf or grape seed [27–31]) instead of free molecules improves both the stability
Foods 2020, 9, 1411; doi:10.3390/foods9101411 www.mdpi.com/journal/foods

Foods 2020, 9, 1411 2 of 19
and bioavailability of the molecules in vitro and in vivo [32,33] using single and multiple emulsionsand nanoemulsions.
Emulsion preparation always involves the use of primary homogenization (direct preparationfrom two separate liquids) and/or secondary homogenization (droplet size reduction in existingemulsions) [33]. The control of homogenization conditions (temperature, pressure and cycles) isrequired to obtain emulsions with the desired properties (droplet size, stability, and encapsulation anddelivery of biocompounds) [34].
Water-in-oil-in-water (W/O/W) double emulsions are formed by small water droplets within largeroil droplets dispersed in an aqueous continuous phase [2]. They are much better encapsulation systemsfor hydrophilic polyphenols than O/W emulsions, because the release of polyphenols can be prolongedand better controlled [4,33,35–37]. However, both O/W and W/O/W emulsions are highly susceptibleto instability, mainly by flocculation, coalescence and Ostwald ripening, that will affect the deliveryof encapsulated polyphenols. Reducing the droplet size greatly improves the stability and shelf lifeof emulsions [38,39], but it should be kept in mind that the very small size and therefore the verylarge specific surface area of the droplets in nanoemulsions may promote the chemical degradation ofencapsulated compounds [40].
In this study, response surface methodology (RSM) was applied to determine the optimalcomposition and operating conditions for the preparation of W/O/W double emulsions loaded withphenolic rich inner aqueous phase from olive mill wastewater. The emulsion formulation wasfirst optimized and then operating conditions to obtain a double nanoemulsion using high energyemulsification methods were examined. In addition to droplet size analysis, physical and chemicalstability of double emulsions over time for the optimal formulation were also evaluated.
2. Materials and Methods
2.1. Materials
Olive mill wastewater (OMW) used in this study was obtained by means of a three-phase oliveoil extraction and centrifugation system and was kindly provided by Mamalan Agro IndustrialCompany (Zanjan, Iran). Miglyol 812 oil, a mixture of C6-C12 medium chain triglycerides (MCT),was supplied by Sasol GmbH (Hamburg, Germany). Folin-Ciocalteu reagent and hydrochloric acid(37%) were purchased from VWR International Eurolab (Llinars del Vallès, Spain) and Acros Organics(Geel, Belgium), respectively. Sodium carbonate, methanol, gallic acid, 2,2-diphenyl-1-picrylhydrazyl(DPPH), 6-hydroxy-2,5,7,8-tetramethylchroman-2-carboxylic acid (Trolox), sorbitan monooleate(Span 80) and polyoxyethylene (20) sorbitan monooleate (Tween 80) were purchased from Sigma-Aldrich(Darmstadt, Germany). Milli-Q water (Millipore, St. Louis, MO, USA) was used in all samples.
2.2. Preparation of Phenolic Rich Olive Mill Aqueous Phase
OMW was first centrifuged (Eppendorf 5804, Hamburg, Germany) for 30 min at 4000 rpm in orderto separate the remaining solid particles, obtaining a liquid phase with a pH value of 4.85 (GLP-21pH-meter, Crison, Barcelona, Spain). Afterwards, based on the method described by Bazzarelli et al. [41],acidification with HCl (37%) was performed by 0.003% (v/w) addition to reach pH = 1.8. After 24 h,the pretreated OMW was used in a two-stage membrane treatment process including ultrafiltration(UF) followed by nanofiltration (NF).
Both UF and NF were performed in batch concentration mode using a stainless steel HP4750high-pressure stirred cell of 300 mL capacity supplied by Sterlitech Corporation (Kent, WA, USA).For this purpose, an UF flat sheet polysulfone membrane (US100, 100 kDa, Microdyn-Nadir, Wiesbaden,Germany) was used and the permeate obtained from UF was entered to the same stirred cell moduleequipped with a NF flat sheet polyamide-thin film composite membrane (NF90, 200 Da, Dow Filmtec,Minneapolis, MN, USA). Transmembrane pressures of 5 bar and 10 bar for UF and NF processes,respectively, were supplied by a nitrogen cylinder. Membrane surface area was 14.6 cm2 and both

Foods 2020, 9, 1411 3 of 19
UF and NF treatments were performed at room temperature. The retentate solution obtained by NFtreatment was used as the inner aqueous phase in the optimal formulation of W/O/W nanoemulsions.
2.3. Preparation of Primary Emulsion (W/O)
W/O emulsions were prepared by mixing Miglyol 812 and Span 80 in amounts described byresponse surface methodology (RSM) and shown in Table 1. Then the aqueous dispersed phase wasadded dropwise and the mixture was stirred for 10 min at 500 rpm. The prepared W/O emulsionswere immediately used as the dispersed phase in the preparation of W/O/W double emulsions.
Table 1. Experimental matrix of W/O/W formulations based in a central composite design (CCD).
Run
Independent Variables Response Variables
Aqueous PhaseContent in W/O
Emulsion(X1, % w/w)
SurfactantContent in W/O
Emulsion(X2, % w/w)
W/O Contentin W/O/WEmulsion
(X3, % w/w)
SurfactantContent in
W/O/W Emulsion(X4, % w/w)
Droplet Size(Y, nm)
PolydispersityIndex (PDI)
Mean SD Mean SD
1 12 12 10 7 470.4 3.7 0.426 0.0432 20 12 25 7 415.2 12.8 0.357 0.0683 20 4 40 4 512.2 14.8 0.561 0.0334 20 20 10 4 279.7 18.1 0.439 0.0155 12 4 25 7 344.8 10.1 0.486 0.0326 20 4 40 10 1767 119.5 0.592 0.0717 4 20 10 4 388.7 6.3 0.458 0.0208 20 4 10 10 470.3 4.7 0.437 0.0249 20 20 40 4 478.3 19.1 0.607 0.07610 12 12 25 4 316.2 13.0 0.571 0.02711 4 4 10 10 363.5 11.4 0.329 0.05412 12 20 25 7 371.8 7.4 0.454 0.00913 12 12 40 7 768.9 17.3 0.620 0.00914 20 20 40 10 1828 58.3 0.501 0.01515 12 12 25 7 585.8 19.1 0.553 0.04116 20 4 10 4 242.6 5.6 0.283 0.01117 4 20 10 10 330.0 10.4 0.273 0.01118 4 20 40 4 923.6 24.3 0.610 0.04519 12 12 25 7 857.4 13.3 0.487 0.04720 4 4 10 4 232.3 2.5 0.365 0.04521 20 20 10 10 216.3 5.0 0.460 0.03222 4 4 40 10 1336 246.6 0.907 0.16223 12 12 25 10 795.7 11.5 0.514 0.01724 4 20 40 10 362.5 8.4 0.574 0.01825 4 12 25 7 476.5 4.2 0.467 0.00626 4 4 40 4 415.5 37.9 0.872 0.190
W/O: water-in-oil. W/O/W: water-in-oil-in-water. SD: standard deviation.
2.4. Preparation of Double Emulsion (W/O/W)
W/O/W emulsions were prepared by the dropwise addition of the dispersed phase (W/O emulsion)to a continuous phase formed by Milli-Q water and the Tween 80 surfactant.
The primary goal for preparation of double emulsion was optimization of formulation. For thispurpose, emulsification process was performed with 26 different compositions based on RSMexperimental design (Table 1). The emulsification was performed by using a high intensity ultrasonichomogenizer, described below, for 6 min effective time, in 5 s pulses (5 s off and 5 s on) and50% amplitude.
The second goal was emulsification of optimized formulation with different high energy methodsin order to achieve the optimal operating conditions. A high speed blender (Miccra D9 equippedwith a DS-5/K-1 rotor-stator, ART Prozess & Labortechnik, Mülheim, Germany), a high intensityultrasonic homogenizer (Sonics VCX 500, 500 W, 20 kHz, Newtown, CT, USA) with a titanium alloy

Foods 2020, 9, 1411 4 of 19
microtip probe of 3 mm diameter, and a microfluidizer high shear fluid processor (LM20, Microfluidics,Westwood, MA, USA) were the equipment used for the formation of W/O/W emulsions.
2.5. Droplet Size Analysis of the Emulsions
Droplet size distribution, mean droplet diameter and polydispersity index (PDI) of sampleswere measured by dynamic light scattering (DLS) using a Zetasizer Nano ZS apparatus (MalvernInstruments Ltd., Malvern, UK). Measurements were performed by triplicate at 25 ◦C. The PDI is adimensionless measure of the width of the size distribution ranging from 0 to 1, a higher value beingindicative of a broader distribution of particle size.
2.6. ζ-Potential
ζ-potential was also measured with the aforementioned Zetasizer Nano ZS apparatus, using thelaser Doppler velocimetry technique. The measurement was conducted six times for each diluted sampleat 25 ◦C. The ζ-potential was calculated using Henry’s equation and the Smoluchowski approximation.
2.7. Total Phenolic Content
Total phenolic content (TPC) of samples was measured using Folin-Ciocalteu standard method [42]with some modifications. Briefly, a standard calibration curve (R2 = 0.998) was prepared using gallicacid solution. 100 µL of sample was added to a test tube. Then 2.8 mL of distilled water, 2 mL of 7.5%sodium carbonate solution and 100 µL of Folin-Ciocalteu reagent were added to the test tube andmixed. After 60 min of incubation in darkness at room temperature, the absorbance was measuredspectrophotometrically at 750 nm wavelength (U-2000 spectrophotometer, Hitachi, Tokyo, Japan).TPC was expressed as milligrams of gallic acid equivalents per liter of sample (mg GA/L).
2.8. Antioxidant Activity
Antioxidant activity (AA) of the samples was measured by the DPPH free radical scavengingactivity method described by Shen et al. [43]. Briefly, 1 mg of DPPH reagent (2,2-diphenyl-1-picrylhydrazyl) was dissolved in 50 mL of methanol and stored in darkness at 4 ◦C for 4 h. In order toperform DPPH assay, 60 µL of sample were mixed with 2940 µL of DPPH reagent solution. For thecontrol sample 60 µL of the solvent (in this case Milli-Q water) were used. The mixtures wereallowed to stand in darkness at room temperature for 60 min. Then the absorbance was measured at517 nm wavelength using the U-2000 spectrophotometer. A standard calibration curve (R2 = 0.995)was prepared using Trolox solution, and antioxidant activity was expressed as milligrams of Troloxequivalents per liter of sample (mg Trolox/L).
2.9. Chemical Stability Measurements
The percentage of phenolic compounds held within the aqueous phase after 35 days of storageat room temperature was measured following the method proposed by Regan and Mulvihill [44].Thus, 3 g of optimal double emulsions were mixed with 3 g of phosphate buffer solution (pH 7) andcentrifuged (Eppendorf 5804 centrifuge) at 4500 rpm for 90 min. Then, the lower phase was collectedcarefully for total phenolic content (TPC) and antioxidant activity (AA) analysis. The percentage ofencapsulated compounds (E) was identified by using Equation (1):
E(%) =
(1−
C2
C1
)× 100 (1)
where C2 is the concentration of phenolic compounds found in the aqueous phase after centrifugationand C1 is the initial concentration of phenolic compounds in the inner aqueous phase [22,44].
Foods 2020, 9, 1411 5 of 19
2.10. Physical Stability Measurements
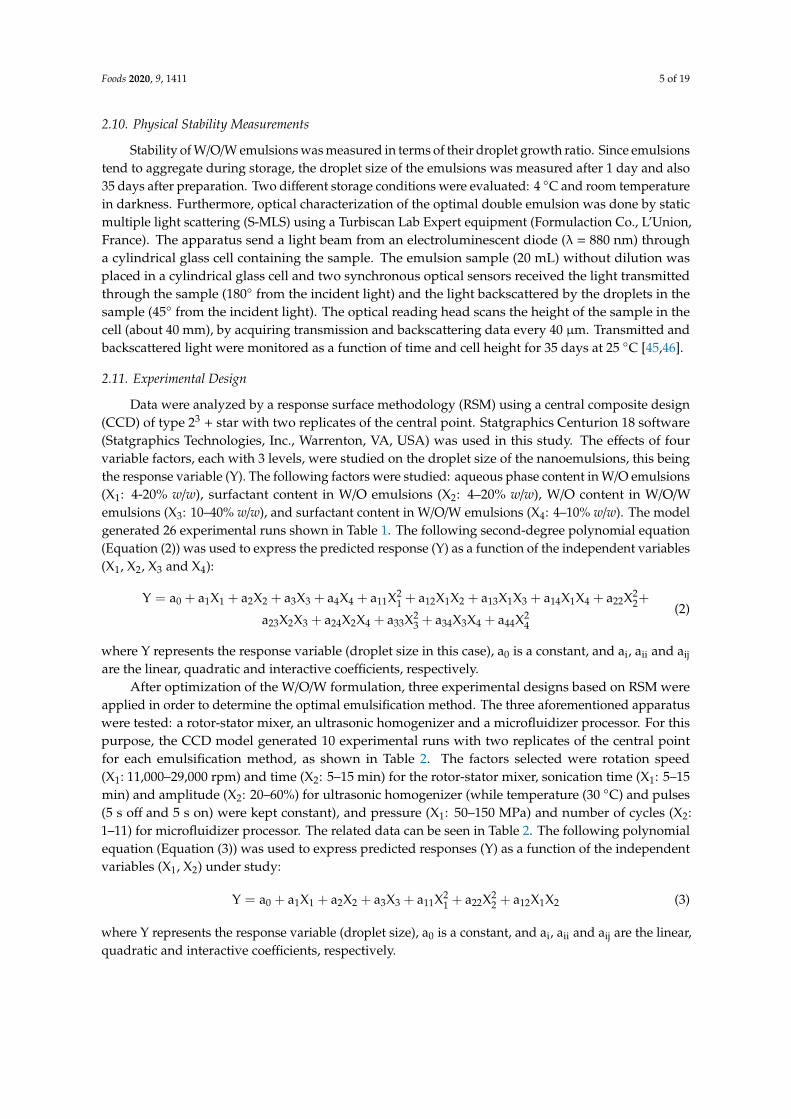
Stability of W/O/W emulsions was measured in terms of their droplet growth ratio. Since emulsionstend to aggregate during storage, the droplet size of the emulsions was measured after 1 day and also35 days after preparation. Two different storage conditions were evaluated: 4 ◦C and room temperaturein darkness. Furthermore, optical characterization of the optimal double emulsion was done by staticmultiple light scattering (S-MLS) using a Turbiscan Lab Expert equipment (Formulaction Co., L’Union,France). The apparatus send a light beam from an electroluminescent diode (λ = 880 nm) througha cylindrical glass cell containing the sample. The emulsion sample (20 mL) without dilution wasplaced in a cylindrical glass cell and two synchronous optical sensors received the light transmittedthrough the sample (180◦ from the incident light) and the light backscattered by the droplets in thesample (45◦ from the incident light). The optical reading head scans the height of the sample in thecell (about 40 mm), by acquiring transmission and backscattering data every 40 µm. Transmitted andbackscattered light were monitored as a function of time and cell height for 35 days at 25 ◦C [45,46].
2.11. Experimental Design
Data were analyzed by a response surface methodology (RSM) using a central composite design(CCD) of type 23 + star with two replicates of the central point. Statgraphics Centurion 18 software(Statgraphics Technologies, Inc., Warrenton, VA, USA) was used in this study. The effects of fourvariable factors, each with 3 levels, were studied on the droplet size of the nanoemulsions, this beingthe response variable (Y). The following factors were studied: aqueous phase content in W/O emulsions(X1: 4-20% w/w), surfactant content in W/O emulsions (X2: 4–20% w/w), W/O content in W/O/Wemulsions (X3: 10–40% w/w), and surfactant content in W/O/W emulsions (X4: 4–10% w/w). The modelgenerated 26 experimental runs shown in Table 1. The following second-degree polynomial equation(Equation (2)) was used to express the predicted response (Y) as a function of the independent variables(X1, X2, X3 and X4):
Y = a0 + a1X1 + a2X2 + a3X3 + a4X4 + a11X21 + a12X1X2 + a13X1X3 + a14X1X4 + a22X2
2+
a23X2X3 + a24X2X4 + a33X23 + a34X3X4 + a44X2
4
(2)
where Y represents the response variable (droplet size in this case), a0 is a constant, and ai, aii and aij
are the linear, quadratic and interactive coefficients, respectively.After optimization of the W/O/W formulation, three experimental designs based on RSM were
applied in order to determine the optimal emulsification method. The three aforementioned apparatuswere tested: a rotor-stator mixer, an ultrasonic homogenizer and a microfluidizer processor. For thispurpose, the CCD model generated 10 experimental runs with two replicates of the central pointfor each emulsification method, as shown in Table 2. The factors selected were rotation speed(X1: 11,000–29,000 rpm) and time (X2: 5–15 min) for the rotor-stator mixer, sonication time (X1: 5–15min) and amplitude (X2: 20–60%) for ultrasonic homogenizer (while temperature (30 ◦C) and pulses(5 s off and 5 s on) were kept constant), and pressure (X1: 50–150 MPa) and number of cycles (X2:1–11) for microfluidizer processor. The related data can be seen in Table 2. The following polynomialequation (Equation (3)) was used to express predicted responses (Y) as a function of the independentvariables (X1, X2) under study:
Y = a0 + a1X1 + a2X2 + a3X3 + a11X21 + a22X2
2 + a12X1X2 (3)
where Y represents the response variable (droplet size), a0 is a constant, and ai, aii and aij are the linear,quadratic and interactive coefficients, respectively.
Foods 2020, 9, 1411 6 of 19
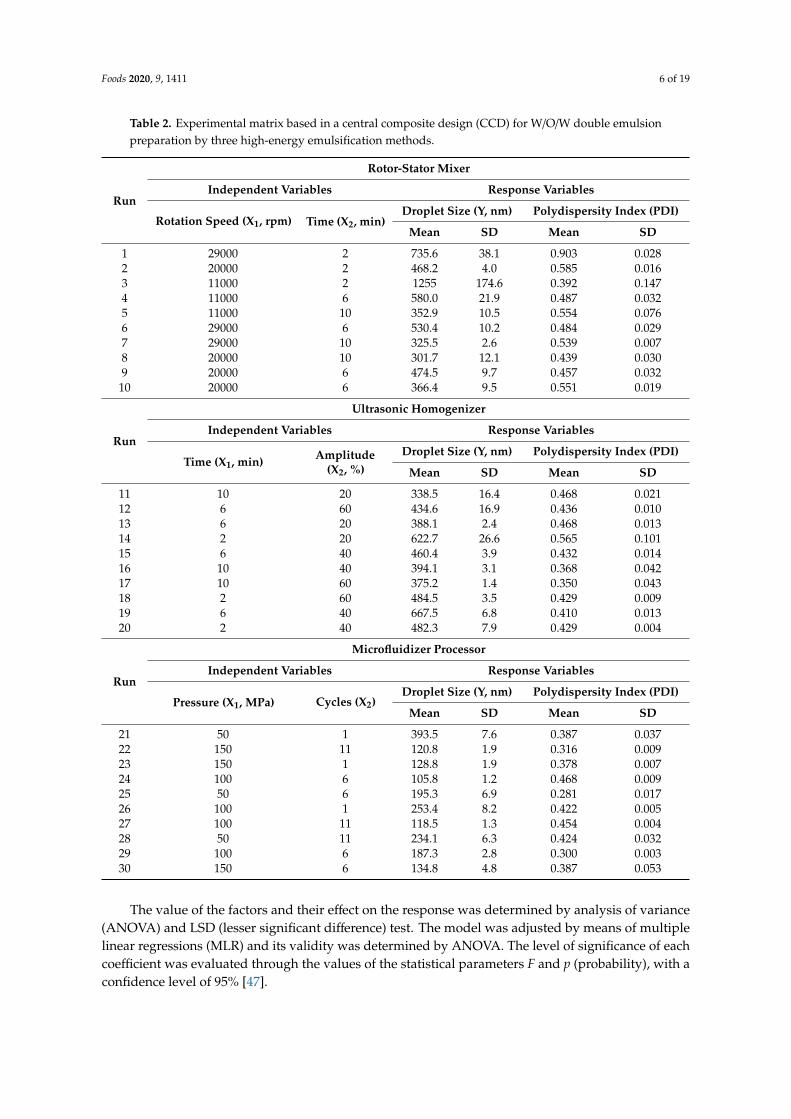
Table 2. Experimental matrix based in a central composite design (CCD) for W/O/W double emulsionpreparation by three high-energy emulsification methods.
Run
Rotor-Stator Mixer
Independent Variables Response Variables
Rotation Speed (X1, rpm) Time (X2, min)Droplet Size (Y, nm) Polydispersity Index (PDI)
Mean SD Mean SD
1 29000 2 735.6 38.1 0.903 0.0282 20000 2 468.2 4.0 0.585 0.0163 11000 2 1255 174.6 0.392 0.1474 11000 6 580.0 21.9 0.487 0.0325 11000 10 352.9 10.5 0.554 0.0766 29000 6 530.4 10.2 0.484 0.0297 29000 10 325.5 2.6 0.539 0.0078 20000 10 301.7 12.1 0.439 0.0309 20000 6 474.5 9.7 0.457 0.032
10 20000 6 366.4 9.5 0.551 0.019
Run
Ultrasonic Homogenizer
Independent Variables Response Variables
Time (X1, min) Amplitude(X2, %)
Droplet Size (Y, nm) Polydispersity Index (PDI)
Mean SD Mean SD
11 10 20 338.5 16.4 0.468 0.02112 6 60 434.6 16.9 0.436 0.01013 6 20 388.1 2.4 0.468 0.01314 2 20 622.7 26.6 0.565 0.10115 6 40 460.4 3.9 0.432 0.01416 10 40 394.1 3.1 0.368 0.04217 10 60 375.2 1.4 0.350 0.04318 2 60 484.5 3.5 0.429 0.00919 6 40 667.5 6.8 0.410 0.01320 2 40 482.3 7.9 0.429 0.004
Run
Microfluidizer Processor
Independent Variables Response Variables
Pressure (X1, MPa) Cycles (X2)Droplet Size (Y, nm) Polydispersity Index (PDI)
Mean SD Mean SD
21 50 1 393.5 7.6 0.387 0.03722 150 11 120.8 1.9 0.316 0.00923 150 1 128.8 1.9 0.378 0.00724 100 6 105.8 1.2 0.468 0.00925 50 6 195.3 6.9 0.281 0.01726 100 1 253.4 8.2 0.422 0.00527 100 11 118.5 1.3 0.454 0.00428 50 11 234.1 6.3 0.424 0.03229 100 6 187.3 2.8 0.300 0.00330 150 6 134.8 4.8 0.387 0.053
The value of the factors and their effect on the response was determined by analysis of variance(ANOVA) and LSD (lesser significant difference) test. The model was adjusted by means of multiplelinear regressions (MLR) and its validity was determined by ANOVA. The level of significance of eachcoefficient was evaluated through the values of the statistical parameters F and p (probability), with aconfidence level of 95% [47].

Foods 2020, 9, 1411 7 of 19
3. Results and Discussion
3.1. Determination of W/O/W Double Emulsion Formulation
3.1.1. Model Fitting of Formulation
One response variable, the droplet size, and four experimental factors were used on the CCD forthe optimization of formulation, as shown in Table 1. PDI of the LSD measurements is also shownin Table 1. The default model is quadratic with 15 coefficients, and it has been fit to the responsevariable. The R-squared statistic indicates that the model as fitted explains 80.57% of the variability inparticle size. Three of the coefficients (a3, a4, and a34) of the quadratic polynomial model, Equation (2),have p-values less than 0.05, indicating that they are significantly different from zero at the 95%confidence level (Table 3). F-ratio values indicate that, for the range of studied variables, W/O contentin W/O/W composition (X3) had stronger influence on the droplet size of the emulsions than the otherindependent variables. F-ratio values also indicate that the interaction with the highest incidence wasthe one occurring between the W/O concentration in W/O/W (X3) and surfactant content in W/O/Wemulsion (X4).
Table 3. Analysis of variance of the regression coefficients of the quadratic model (Equation (2)) for thedroplet size of W/O/W emulsions.
Source Regression Coefficients F-Ratio p-Value
a0 1029.33 - -a1 −46.5462 1.27 0.2841a2 75.8451 0.17 0.6882a3 −47.5277 19.37 0.0011a4 −171.888 9.00 0.0121a11 −0.407612 0.02 0.8878a12 0.149121 0.02 0.8973a13 0.861198 2.05 0.1805a14 6.08568 4.08 0.0683a22 −1.77558 0.40 0.5421a23 −0.179323 0.09 0.7714a24 −4.8638 2.61 0.1345a33 0.656502 0.67 0.4309a34 3.78764 5.56 0.0379a44 9.33476 0.22 0.6509
3.1.2. Response Surface Analysis
In order to study the effect of the independent variables on the droplet size, surface responses ofthe quadratic polynomial model were generated by varying two of the independent variables withinthe experimental range while holding the other two constant at the central points. Figure 1a wasgenerated by varying the surfactant content in W/O (X2) and surfactant content in W/O/W (X4), keepingconstant the aqueous phase content in W/O (X1) and W/O content in W/O/W (X3) at their centralvalues. It shows that increasing X4 in the lower levels of X2 causes an increase in emulsion particle sizewhich is unfavorable, while for higher levels of X2 no considerable variations in particle size wereobserved. The effect of X1 and X4 on the particle size of the emulsion at a fixed content of X2 and X3 intheir central values can be seen in Figure 1b. This figure shows that the increase in X1 and X4 hardlyaffects the particle size, except at the higher levels for both factors. The effect of X1 and X2 changingon particle size at the central values of X3 and X4 is depicted in Figure 1c. It shows that changes ofX1 and X2 hardly affect the particle size. The effects of X3 and X4 variations on particle size at centralvalues of X1 and X2 are shown in Figure 1d: a particle size increase is observed as X3 increases, beingthis effect greater at higher levels of X4. Figure 1e depicts the effect of X2 and X3 on particle size atcentral values of X1 and X4. Somehow, X2 variation hardly modifies the particle size, while increasing

Foods 2020, 9, 1411 8 of 19
X3 has a significant effect on particle size growth. Figure 1f shows the effect of X1 and X3 variation onparticle size at central levels of X2 and X4. A significant growth in particle size with the increase inX1 is only observed at the highest levels of X3 factor. It can be concluded that these figures prove thesignificance of X3 and X4 over other factors on particle size, as well as the interaction between bothfactors represented in Figure 1d.Foods 2020, 9, x 8 of 19
Figure 1. Response surface plots of interactions between two input factors, while holding the other two constants at their central points, on particle size of W/O/W emulsions. X1: Aqueous phase content in W/O emulsion; X2: Surfactant content in W/O emulsion; X3: W/O content in W/O/W emulsion; X4: Surfactant content in W/O/W emulsion. (a) X2 vs. X4; (b) X1 vs. X4; (c) X1 vs. X2; (d) X3 vs. X4; (e) X2 vs. X3; (b) X1 vs. X3.
3.1.3. Optimization of Double Emulsion Formulation
Following Stoke’s law, the stability of emulsion would increase as the droplet size decreases. Furthermore, the emulsion with higher resistance and control to creaming should also be homogenously distributed in particle size [48]. Numerical optimization of W/O/W emulsion formulation loaded with phenolic rich inner aqueous phase was carried out through design expert software, using desirability function. The W/O/W optimal formulation is expected to be those leading to a stable emulsion with minimum droplet size. Optimum formulation with 98.8% desirability was predicted for 20% (w/w) of aqueous phase content (X1), 4% (w/w) Span 80 surfactant content (X2), 10% (w/w) of aqueous phase (W/O) content (X3), and 4.6% (w/w) of Tween 80 surfactant content (X4). Because some of these optimal values are in the lower range of those selected in the CCD matrix, data extrapolation was performed. It was carried out through expert design software to expand factor input levels and to evaluate the possibility of achieving a better response beyond the levels considered. Formulation optimization process for main response (minimum particle size) yields 100% desirability for 20.3% (w/w) of aqueous phase content (X1), 3.7% (w/w) Span 80 surfactant content
(a) (d)
(b)
(c)
(e)
(f)
Figure 1. Response surface plots of interactions between two input factors, while holding the othertwo constants at their central points, on particle size of W/O/W emulsions. X1: Aqueous phase contentin W/O emulsion; X2: Surfactant content in W/O emulsion; X3: W/O content in W/O/W emulsion;X4: Surfactant content in W/O/W emulsion. (a) X2 vs. X4; (b) X1 vs. X4; (c) X1 vs. X2; (d) X3 vs. X4;(e) X2 vs. X3; (b) X1 vs. X3.
3.1.3. Optimization of Double Emulsion Formulation
Following Stoke’s law, the stability of emulsion would increase as the droplet size decreases.Furthermore, the emulsion with higher resistance and control to creaming should also be homogenouslydistributed in particle size [48]. Numerical optimization of W/O/W emulsion formulation loaded withphenolic rich inner aqueous phase was carried out through design expert software, using desirabilityfunction. The W/O/W optimal formulation is expected to be those leading to a stable emulsion withminimum droplet size. Optimum formulation with 98.8% desirability was predicted for 20% (w/w) of

Foods 2020, 9, 1411 9 of 19
aqueous phase content (X1), 4% (w/w) Span 80 surfactant content (X2), 10% (w/w) of aqueous phase(W/O) content (X3), and 4.6% (w/w) of Tween 80 surfactant content (X4). Because some of these optimalvalues are in the lower range of those selected in the CCD matrix, data extrapolation was performed.It was carried out through expert design software to expand factor input levels and to evaluate thepossibility of achieving a better response beyond the levels considered. Formulation optimizationprocess for main response (minimum particle size) yields 100% desirability for 20.3% (w/w) of aqueousphase content (X1), 3.7% (w/w) Span 80 surfactant content (X2), 9.8% (w/w) of aqueous phase (W/O)content (X3), and 4.1% (w/w) of Tween 80 surfactant content (X4). The predicted optimal response isvery close to that obtained without extrapolation, which reveals the validity of the experimental designcarried out. Three experimental replicates of the optimal formulation were made (20.3% X1, 3.7% X2,9.8% X3 and 4.1% X4). The average droplet size of these samples was 232.5 ± 2.9 nm and the PDI was0.274 ± 0.013, indicating a narrow distribution in droplet size. As expected, the results were very closeto those obtained in run 16 of Table 1.
3.2. Effect of the High Energy Emulsification Method on Double Emulsion Droplet Size
Under suitable homogenization conditions, the final droplet size depends strongly on thecharacteristics of the oil and emulsifier used [34,49–60]. In general, small droplet sizes can be obtainedmore effectively by low-energy approaches than by high-energy approaches, but the former are morelimited in the types of oils and emulsifiers that can be used [11].
Microfluidizers generate intense disruptive forces when two fast-moving emulsion streamsimpinge upon each other within an interaction chamber, leading to highly efficient dropletdisruption [11]. Ultrasonic homogenizers use high-intensity ultrasonic waves to create the intensedisruptive forces needed to fracture oil and water phases into very small droplets [53,61–63].Ultrasound requires less energy expenditure than other high-energy methods, but sonicatorprobe-induced contamination is an important drawback. For scale-up applicability, commercialhomogenizers based on sonication have been developed in which nanoemulsion is made to flowthrough a special column capable of producing ultrasonic waves [64]. Rotor-stator mixers aremechanical homogenizers especially used for high viscosity and high disperse phase volume fractiondispersions, e.g., in pharmaceuticals, cosmetics and food processing [65–67].
After obtaining the optimal W/O/W double emulsion formulation, the second aim of this work wasto achieve the optimal operating conditions for its preparation. For this purpose, the following methodsand factors were studied: ultrasonic homogenizer by varying time and amplitude, rotor-stator mixerby varying time and rotor speed, and microfluidizer processor by varying pressure and cycle numbers.
3.2.1. Model Fitting of Emulsification Method
Three experimental designs based on RSM were prepared by the application of rotor-stator mixer,ultrasonic homogenizer and microfluidizer processor. For this purpose, the CCD model generated 10experimental runs with two replicates of central point for each emulsification apparatus. The averagedroplet size and PDI of the experiments corresponding to the CCD design is given in Table 2.
The default model is quadratic and statistical models have been fit to the response variables.The R-squared statistic indicates that the fitted model explains 84.23%, 56.13% and 86.18% of thevariability in particle size for rotor-stator mixer, ultrasonic homogenizer and microfluidizer processor,respectively. Regarding the rotor-stator mixer, the F-ratio values indicate that the time factor (X2) has astronger influence on the droplet size of the emulsions than the rotational speed factor (X1). In theultrasonic homogenizer, the F-ratio values indicate that time (X1) has a slightly stronger influence onthe droplet size of double emulsions than the amplitude (X2), whereas for microfluidizer processorpressure (X1) has considerable stronger influence on the droplet size of the emulsions than the numberof cycles (X2), as shown in Table 4.
ANOVA showed the significance of the coefficients of the quadratic polynomial models(Equation (3)). Regarding the high speed mixer and microfluidizer, only one coefficient in each

Foods 2020, 9, 1411 10 of 19
model has a p-value less than 0.05, indicating that it is significantly different to zero with 95%confidence level. Moreover, no coefficient has a p-value less than 0.05 for the ultrasonic homogenizermodel (Table 4).
Table 4. Analysis of variance of the regression coefficients of the quadratic Equation (3) for the W/O/Wemulsion preparation by three high-energy emulsification methods.
SourceRotor-Stator Mixer Ultrasonic Homogenizer Microfluidizer Processor
RegressionCoefficients F-Ratio p-Value Regression
Coefficients F-Ratio p-Value RegressionCoefficients F-Ratio p-Value
a0 2570.49 - - 497.885 - - 616.672 - -a1 −0.139724 2.06 0.2242 −20.3173 3.44 0.1372 −4.52892 13.05 0.0225a2 −166.557 12.69 0.0235 7.39658 0.04 0.8426 −48.2018 6.20 0.0675a11 2.7045 × 10⁻⁶ 3.90 0.1195 −1.80134 0.17 0.6993 0.0107943 0.69 0.4523a12 0.00341667 2.11 0.2203 0.546562 0.68 0.4558 0.1514 2.33 0.2014a22 3.05089 0.19 0.6827 −0.139179 0.64 0.4675 1.91543 2.18 0.2140
3.2.2. Response Surface Analysis
In order to study the effect of the emulsification methods and operating conditions on thedroplet size, surface response plots of the quadratic polynomial model were generated. Figure 2ashows the effects of time and rotation speed in rotor-stator mixer on the emulsion droplet size.This figure shows that regardless of time level, 20,000–23,000 rpm is the optimal range for rotationspeed. However, increasing time causes a continuous decrease in particle size which is favorable.
Foods 2020, 9, x 10 of 19
Table 4. Analysis of variance of the regression coefficients of the quadratic Equation (3) for the W/O/W emulsion preparation by three high-energy emulsification methods.
Source Rotor-Stator Mixer Ultrasonic Homogenizer Microfluidizer Processor
Regression Coefficients
F-Ratio
p-Value
Regression Coefficients
F-Ratio
p-Value
Regression Coefficients
F-Ratio
p-Value
a0 2570.49 - - 497.885 - - 616.672 - - a1 −0.139724 2.06 0.2242 -20.3173 3.44 0.1372 -4.52892 13.05 0.0225 a2 −166.557 12.69 0.0235 7.39658 0.04 0.8426 -48.2018 6.20 0.0675 a11 2.7045E-6 3.90 0.1195 -1.80134 0.17 0.6993 0.0107943 0.69 0.4523 a12 0.00341667 2.11 0.2203 0.546562 0.68 0.4558 0.1514 2.33 0.2014 a22 3.05089 0.19 0.6827 -0.139179 0.64 0.4675 1.91543 2.18 0.2140
3.2.2. Response Surface Analysis
In order to study the effect of the emulsification methods and operating conditions on the droplet size, surface response plots of the quadratic polynomial model were generated. Figure 2a shows the effects of time and rotation speed in rotor-stator mixer on the emulsion droplet size. This figure shows that regardless of time level, 20000–23000 rpm is the optimal range for rotation speed. However, increasing time causes a continuous decrease in particle size which is favorable.
(a)
(b)
Figure 2. Cont.

Foods 2020, 9, 1411 11 of 19Foods 2020, 9, x 11 of 19
Figure 2. Response surface plots of interaction between emulsification input factors on particle size: (a) Rotor-stator mixer; (b) Ultrasonic homogenizer; (c) Microfluidizer processor.
Figure 2b shows the interaction of time and amplitude on the achieved particle size in ultrasonic homogenizer; as it can be observed, amplitude hardly affects the particle size except for lower time levels. Furthermore, increasing time is significant on reducing particle size [68], as it causes an increase in temperature and cavitation intensity which accelerates the breakdown of droplets [57,69]. Somehow, the minimum particle size would be achieved for high time and lower amplitude levels.
In emulsions prepared by microfluidization the mean droplet diameter decreased with increasing homogenization pressure. It is in accordance with the study performed by Bai et al. [49], in which the mean droplet diameter decreased from around 213 to 150 nm as the homogenization pressure increased from 4 to 14 kbar. The decrease in droplet size with increasing pressure can be attributed to the increase in the magnitude of the disruptive forces generated within the homogenization chamber. Therefore double emulsions containing small droplets with a narrow particle size distribution can be produced by using microfluidizer processor. Figure 2c shows the interaction between pressure and cycles and their effect on particle size in microfluidizer emulsification tests. It can be observed that increasing pressure is significantly effective in decreasing particle size at middle cycle levels. Somehow, the minimum particle size can be achieved at 140–150 MPa pressure levels and 6–7 cycles.
3.2.3. Optimization of W/O/W Emulsion Preparation Conditions
The optimal conditions for the emulsification of the phenolic rich olive mill aqueous phase used in this work would be those leading to a stable double emulsion with minimum droplet size. Numerical optimization was performed through design expert software, using desirability function method. Regarding the W/O/W emulsification by rotor-stator mixer, the combined optimum ingredient levels for average particle size with 100% desirability were predicted to be achieved by emulsification at 20000 rpm and 10 min. The predicted response at optimal value was 169.4 nm for particle size and polydispersity index (PDI) of 0.546, while observed results were 301.7 ± 12.1 nm and 0.439 ± 0.030 for particle size and PDI, respectively (Table 2). This large difference between predicted and observed results is due to imprecision in the average size for heterogeneous populations, as revealed the high PDI values
In the case of optimal double emulsion prepared by ultrasonic homogenizer, response of 316.15 nm for particle size and PDI of 0.453 with 100% desirability was predicted while emulsification for 10 min at 20% amplitude was the combined optimum factor levels. The observed results, as shown in Table 2, were 338.5 ± 16.5 nm and 0.468 ± 0.021 for particle size and PDI, respectively. The narrow difference between the predicted and observed responses can verify the reliability of the ultrasonic assisted experimental design.
Best results were obtained with microfluidizer processor (Table 2). Numerical optimization performed by the design expert software predicted the optimal factor levels as 148 MPa of pressure and 7 cycles. The predicted response was 96.03 nm and 0.330 for particle size and PDI, respectively, whereas the observed responses for the mentioned factor levels were 105.3 ± 3.2 nm and 0.233 ± 0.020
(c)
Figure 2. Response surface plots of interaction between emulsification input factors on particle size:(a) Rotor-stator mixer; (b) Ultrasonic homogenizer; (c) Microfluidizer processor.
Figure 2b shows the interaction of time and amplitude on the achieved particle size in ultrasonichomogenizer; as it can be observed, amplitude hardly affects the particle size except for lower timelevels. Furthermore, increasing time is significant on reducing particle size [68], as it causes anincrease in temperature and cavitation intensity which accelerates the breakdown of droplets [57,69].Somehow, the minimum particle size would be achieved for high time and lower amplitude levels.
In emulsions prepared by microfluidization the mean droplet diameter decreased with increasinghomogenization pressure. It is in accordance with the study performed by Bai et al. [49], in whichthe mean droplet diameter decreased from around 213 to 150 nm as the homogenization pressureincreased from 4 to 14 kbar. The decrease in droplet size with increasing pressure can be attributed tothe increase in the magnitude of the disruptive forces generated within the homogenization chamber.Therefore double emulsions containing small droplets with a narrow particle size distribution canbe produced by using microfluidizer processor. Figure 2c shows the interaction between pressureand cycles and their effect on particle size in microfluidizer emulsification tests. It can be observedthat increasing pressure is significantly effective in decreasing particle size at middle cycle levels.Somehow, the minimum particle size can be achieved at 140–150 MPa pressure levels and 6–7 cycles.
3.2.3. Optimization of W/O/W Emulsion Preparation Conditions
The optimal conditions for the emulsification of the phenolic rich olive mill aqueous phaseused in this work would be those leading to a stable double emulsion with minimum droplet size.Numerical optimization was performed through design expert software, using desirability functionmethod. Regarding the W/O/W emulsification by rotor-stator mixer, the combined optimum ingredientlevels for average particle size with 100% desirability were predicted to be achieved by emulsificationat 20,000 rpm and 10 min. The predicted response at optimal value was 169.4 nm for particle size andpolydispersity index (PDI) of 0.546, while observed results were 301.7 ± 12.1 nm and 0.439 ± 0.030 forparticle size and PDI, respectively (Table 2). This large difference between predicted and observedresults is due to imprecision in the average size for heterogeneous populations, as revealed the highPDI values.
In the case of optimal double emulsion prepared by ultrasonic homogenizer, response of 316.15 nmfor particle size and PDI of 0.453 with 100% desirability was predicted while emulsification for 10 minat 20% amplitude was the combined optimum factor levels. The observed results, as shown in Table 2,were 338.5 ± 16.5 nm and 0.468 ± 0.021 for particle size and PDI, respectively. The narrow differencebetween the predicted and observed responses can verify the reliability of the ultrasonic assistedexperimental design.
Best results were obtained with microfluidizer processor (Table 2). Numerical optimizationperformed by the design expert software predicted the optimal factor levels as 148 MPa of pressureand 7 cycles. The predicted response was 96.03 nm and 0.330 for particle size and PDI, respectively,whereas the observed responses for the mentioned factor levels were 105.3 ± 3.2 nm and 0.233 ± 0.020

Foods 2020, 9, 1411 12 of 19
for particle size and PDI, respectively. The narrow difference between the predicted and observedresponses can also verify the reliability of the microfluidizer experimental design. Therefore, it canbe concluded from the observed responses of optimal points from three emulsification methods thatmicrofluidizer processor can be considered as the optimal method to achieve double emulsions withlower particle size and PDI.
3.3. Effect of the High Energy Emulsification Method on Double Emulsion Droplet Size
3.3.1. Stability Evaluations During Storage
The stability of the optimized double emulsions during their storage was evaluated by twomethods. The first one was the comparative evaluation of droplet size (at room temperature and 4 ◦C)after 1 day and 35 days from emulsification in order to study the possible droplet growth. The secondmethod was the backscattering (BS) evolution over time using Turbiscan Lab Expert apparatus to detectpossible creaming, sedimentation, coalescence, flocculation or Ostwald ripening effect. Sedimentation,creaming and flocculation phenomena are unexpected, while those of coalescence and Ostwald ripeningare more likely in the behavior of nanoemulsions [55].
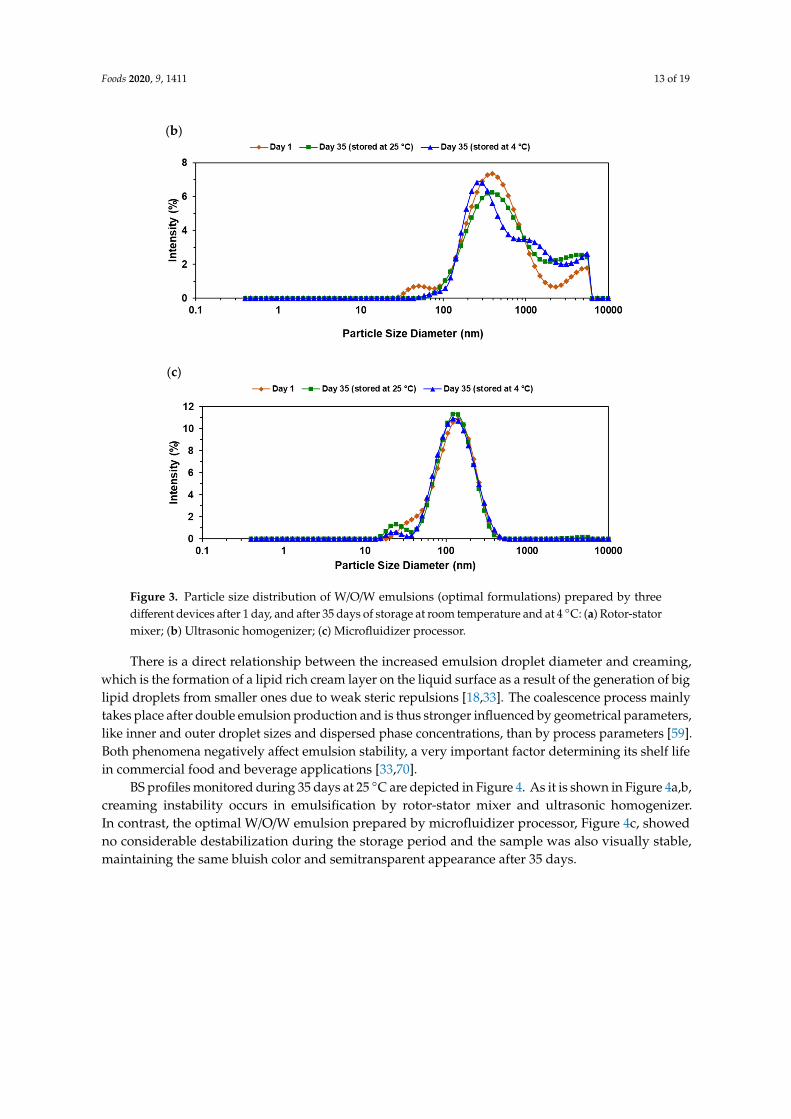
Figure 3 shows the changes in droplet size between 1 day and 35 days of storage at 4 ◦C androom temperature. As it can be seen from Figure 3a, there is no considerable change in droplet sizedistribution of rotor-stator optimal W/O/W emulsion during the storage period while the intensityincreased regardless of storage temperature condition. According to Figure 3b, which shows thedroplet size distribution of emulsion prepared in ultrasonic homogenizer, average droplet size didnot vary considerably but PDI was increased during the storage period. It is already mentionedthe advantage of optimal W/O/W prepared by microfluidizer processor over other devices due tosignificantly better average droplet size. Furthermore, it showed the best droplet growth stability,as shown in Figure 3c: neither average droplet size nor PDI was changed after 35 days of storageat both 4 ◦C and room temperature. ζ-potential was also measured for this sample and the resultsindicated the stable value of −2.7 mV after 1 day and 35 days of emulsification.
Foods 2020, 9, x 12 of 19
for particle size and PDI, respectively. The narrow difference between the predicted and observed responses can also verify the reliability of the microfluidizer experimental design. Therefore, it can be concluded from the observed responses of optimal points from three emulsification methods that microfluidizer processor can be considered as the optimal method to achieve double emulsions with lower particle size and PDI.
3.3. Effect of the High Energy Emulsification Method on Double Emulsion Droplet Size
3.3.1. Stability Evaluations During Storage
The stability of the optimized double emulsions during their storage was evaluated by two methods. The first one was the comparative evaluation of droplet size (at room temperature and 4 °C) after 1 day and 35 days from emulsification in order to study the possible droplet growth. The second method was the backscattering (BS) evolution over time using Turbiscan Lab Expert apparatus to detect possible creaming, sedimentation, coalescence, flocculation or Ostwald ripening effect. Sedimentation, creaming and flocculation phenomena are unexpected, while those of coalescence and Ostwald ripening are more likely in the behavior of nanoemulsions [55].
Figure 3 shows the changes in droplet size between 1 day and 35 days of storage at 4 °C and room temperature. As it can be seen from Figure 3a, there is no considerable change in droplet size distribution of rotor-stator optimal W/O/W emulsion during the storage period while the intensity increased regardless of storage temperature condition. According to Figure 3b, which shows the droplet size distribution of emulsion prepared in ultrasonic homogenizer, average droplet size did not vary considerably but PDI was increased during the storage period. It is already mentioned the advantage of optimal W/O/W prepared by microfluidizer processor over other devices due to significantly better average droplet size. Furthermore, it showed the best droplet growth stability, as shown in Figure 3c: neither average droplet size nor PDI was changed after 35 days of storage at both 4 °C and room temperature. ζ-potential was also measured for this sample and the results indicated the stable value of −2.7 mV after 1 day and 35 days of emulsification.
(a)
Figure 3. Cont.
Foods 2020, 9, 1411 13 of 19Foods 2020, 9, x 13 of 19
Figure 3. Particle size distribution of W/O/W emulsions (optimal formulations) prepared by three different devices after 1 day, and after 35 days of storage at room temperature and at 4 °C: (a) Rotor-stator mixer; (b) Ultrasonic homogenizer; (c) Microfluidizer processor.
There is a direct relationship between the increased emulsion droplet diameter and creaming, which is the formation of a lipid rich cream layer on the liquid surface as a result of the generation of big lipid droplets from smaller ones due to weak steric repulsions [18,33]. The coalescence process mainly takes place after double emulsion production and is thus stronger influenced by geometrical parameters, like inner and outer droplet sizes and dispersed phase concentrations, than by process parameters [59]. Both phenomena negatively affect emulsion stability, a very important factor determining its shelf life in commercial food and beverage applications [33,70].
BS profiles monitored during 35 days at 25 °C are depicted in Figure 4. As it is shown in Figures 4a and 4b, creaming instability occurs in emulsification by rotor-stator mixer and ultrasonic homogenizer. In contrast, the optimal W/O/W emulsion prepared by microfluidizer processor, Figure 4c, showed no considerable destabilization during the storage period and the sample was also visually stable, maintaining the same bluish color and semitransparent appearance after 35 days.
(a)
(b)
(c)
Figure 3. Particle size distribution of W/O/W emulsions (optimal formulations) prepared by threedifferent devices after 1 day, and after 35 days of storage at room temperature and at 4 ◦C: (a) Rotor-statormixer; (b) Ultrasonic homogenizer; (c) Microfluidizer processor.
There is a direct relationship between the increased emulsion droplet diameter and creaming,which is the formation of a lipid rich cream layer on the liquid surface as a result of the generation of biglipid droplets from smaller ones due to weak steric repulsions [18,33]. The coalescence process mainlytakes place after double emulsion production and is thus stronger influenced by geometrical parameters,like inner and outer droplet sizes and dispersed phase concentrations, than by process parameters [59].Both phenomena negatively affect emulsion stability, a very important factor determining its shelf lifein commercial food and beverage applications [33,70].
BS profiles monitored during 35 days at 25 ◦C are depicted in Figure 4. As it is shown in Figure 4a,b,creaming instability occurs in emulsification by rotor-stator mixer and ultrasonic homogenizer.In contrast, the optimal W/O/W emulsion prepared by microfluidizer processor, Figure 4c, showedno considerable destabilization during the storage period and the sample was also visually stable,maintaining the same bluish color and semitransparent appearance after 35 days.

Foods 2020, 9, 1411 14 of 19
Foods 2020, 9, x 13 of 19
Figure 3. Particle size distribution of W/O/W emulsions (optimal formulations) prepared by three different devices after 1 day, and after 35 days of storage at room temperature and at 4 °C: (a) Rotor-stator mixer; (b) Ultrasonic homogenizer; (c) Microfluidizer processor.
There is a direct relationship between the increased emulsion droplet diameter and creaming, which is the formation of a lipid rich cream layer on the liquid surface as a result of the generation of big lipid droplets from smaller ones due to weak steric repulsions [18,33]. The coalescence process mainly takes place after double emulsion production and is thus stronger influenced by geometrical parameters, like inner and outer droplet sizes and dispersed phase concentrations, than by process parameters [59]. Both phenomena negatively affect emulsion stability, a very important factor determining its shelf life in commercial food and beverage applications [33,70].
BS profiles monitored during 35 days at 25 °C are depicted in Figure 4. As it is shown in Figures 4a and 4b, creaming instability occurs in emulsification by rotor-stator mixer and ultrasonic homogenizer. In contrast, the optimal W/O/W emulsion prepared by microfluidizer processor, Figure 4c, showed no considerable destabilization during the storage period and the sample was also visually stable, maintaining the same bluish color and semitransparent appearance after 35 days.
(a)
(b)
(c)
Foods 2020, 9, x 14 of 19
Figure 4. Backscattering profiles of W/O/W emulsions (optimal formulations) prepared by three devices through 35 days of storage at 25 °C: (a) Rotor-stator mixer; (b) Ultrasonic homogenizer; (c) Microfluidizer processor.
The rotor-stator mixer sample happened to exhibit visual creaming instability after a few hours of storage. Nevertheless, double emulsion obtained by using ultrasonic homogenizer showed a slightly larger droplet size but visual instability was not observed after the same storage period. Similar results were obtained by Einhorn-Stoll et al. [71], who observed a rapid destabilization of emulsions prepared by a single step with the Ultra-Turrax homogenizer. However, both chemical analysis and physical appearance indicated slight levels of creaming after few days of storage (Figure 4b). The shifting of the curves in Figures 4b and 4c could be attributed to the presence of air bubbles in cells or being a little shaken during each analysis.
3.3.2. Retention Properties of Nanoemulsions
As it was aforementioned the OMW used in this study was acidified to pH = 1.8 prior to membrane treatment in order to increase the content of selective bioactive compounds. The effect of pH on physical stability of different emulsions has been previously determined by several authors. Recently, the effect of pH on curcumin emulsions was investigated [72]. The authors found that more than 85% of curcumin was present after one month of storage at 37 °C when acidic conditions were employed. However, emulsions at pH 7.0, 7.4 and 8.0 contained only 62, 60, and 53% of the initial curcumin, respectively, thus demonstrating low stability. The effect of pH on the stability of emulsions stabilized by pectin-zein complexes has also been studied by Juttulapa et al. [73]: they found a greater cross-linking polymer network at pH 4 than pH 7, providing thus a smaller droplet size distribution.
Chemical stability of W/O/W emulsion was evaluated by measurements of retention levels of total phenolic content (TPC) and antioxidant activity (AA) after 35 days of storage at room temperature. TPC and AA measurements were done on the W/O/W double emulsion using the optimal formulation prepared by microfluidizer processor at 148 MPa and 7 cycles. Polyphenols are very sensitive compounds that can be easily degraded over time; therefore, their encapsulation in suitable double emulsions is an effective solution to prevent the degradation of phenolic compounds at a satisfactory level. The phenolic rich inner aqueous phase used in this study (after membrane
(c)
(b)
Figure 4. Backscattering profiles of W/O/W emulsions (optimal formulations) prepared by threedevices through 35 days of storage at 25 ◦C: (a) Rotor-stator mixer; (b) Ultrasonic homogenizer;(c) Microfluidizer processor.
The rotor-stator mixer sample happened to exhibit visual creaming instability after a few hours ofstorage. Nevertheless, double emulsion obtained by using ultrasonic homogenizer showed a slightlylarger droplet size but visual instability was not observed after the same storage period. Similar resultswere obtained by Einhorn-Stoll et al. [71], who observed a rapid destabilization of emulsions preparedby a single step with the Ultra-Turrax homogenizer. However, both chemical analysis and physicalappearance indicated slight levels of creaming after few days of storage (Figure 4b). The shifting of thecurves in Figure 4b,c could be attributed to the presence of air bubbles in cells or being a little shakenduring each analysis.
3.3.2. Retention Properties of Nanoemulsions
As it was aforementioned the OMW used in this study was acidified to pH = 1.8 prior tomembrane treatment in order to increase the content of selective bioactive compounds. The effect ofpH on physical stability of different emulsions has been previously determined by several authors.Recently, the effect of pH on curcumin emulsions was investigated [72]. The authors found that morethan 85% of curcumin was present after one month of storage at 37 ◦C when acidic conditions were

Foods 2020, 9, 1411 15 of 19
employed. However, emulsions at pH 7.0, 7.4 and 8.0 contained only 62, 60, and 53% of the initialcurcumin, respectively, thus demonstrating low stability. The effect of pH on the stability of emulsionsstabilized by pectin-zein complexes has also been studied by Juttulapa et al. [73]: they found a greatercross-linking polymer network at pH 4 than pH 7, providing thus a smaller droplet size distribution.
Chemical stability of W/O/W emulsion was evaluated by measurements of retention levels of totalphenolic content (TPC) and antioxidant activity (AA) after 35 days of storage at room temperature.TPC and AA measurements were done on the W/O/W double emulsion using the optimal formulationprepared by microfluidizer processor at 148 MPa and 7 cycles. Polyphenols are very sensitivecompounds that can be easily degraded over time; therefore, their encapsulation in suitable doubleemulsions is an effective solution to prevent the degradation of phenolic compounds at a satisfactorylevel. The phenolic rich inner aqueous phase used in this study (after membrane treatments and beforeemulsification) had a TPC of 1399.8 ± 17.9 mg GA/L and 286.5 ± 0.3 mg Trolox/L of AA. After 35 days ofstorage at room temperature, 68.6% and 89.5% retentions of TPC and AA, respectively, were preserved.
In related studies, Akhtar et al. [74] reported 72% rutin and anthocyanin flavonoids retentionafter 10 days of storage in a W/O/W nanoemulsion system, but a polymodal droplet size distributionand inner phase leakage were observed. Gomes et al. [75] studied the retention of gallic acid in W/Oand O/W emulsion systems with soybean oil, obtaining a 15% reduction in gallic acid content after7 days of storage. Mohammadi et al. [22] reported 22% of phenolic compounds release by preparingdouble emulsions stabilized only with whey protein concentrate (WPC) containing olive leaf extractafter 20 days. Furthermore, in the study performed by Gadkari et al. [18] it was noted that when theemulsions were stored at temperatures of 277 K, 300 K and 310 K, the green tea polyphenols presentin emulsions were degraded by 4.25%, 15.97% and 22.78%, respectively. It can be concluded thatthe results obtained in the present study are in the usual retention range of phenols encapsulated inemulsions with applications for the food industry.
4. Conclusions
Response surface methodology was applied in this work to determine both the optimal compositionand operating conditions for preparation of W/O/W nanoemulsion loaded with phenolic rich inneraqueous phase from olive mill wastewater. The optimal formulation for primary W/O emulsion was20.3% (w/w) of phenolic rich aqueous solution as dispersed phase and 3.7% (w/w) of Span 80 in MCToil as continuous phase. The optimal composition for W/O/W emulsion was 9.8% (w/w) of W/O asdispersed phase and 4.1% (w/w) of Tween 80 in Milli-Q water as external phase. Three methods weretested to obtain the optimal emulsification conditions: mechanical homogenization (rotor-stator mixer),ultrasonic homogenization and microfluidization. Optimum results were achieved by microfluidizationat 148 MPa and 7 cycles input levels, obtaining a W/O/W nanoemulsion with an average dropletdiameter of 105.3 ± 3.2 nm and a polydispersity index of 0.233 ± 0.02. Samples obtained by rotor-statormixer and ultrasonic homogenizer showed creaming instability after few days of emulsification,while emulsion obtained by microfluidization showed no droplet size growth or changes in stabilityand ζ-potential after 35 days of storage at 25 ◦C. Furthermore, it showed a satisfactory level of phenolicsretention (68.6%) and antioxidant activity (89.5%) after 35 days of storage, which are suitable forapplication in the food or pharmaceutical industry.
Author Contributions: Conceptualization, I.E. and J.M.B.; Formal analysis, S.M.N. and J.M.B.; Funding acquisition,I.E.; Investigation, S.M.N.; Methodology, J.M.B.; Project administration, I.E.; Resources, I.E.; Supervision, J.M.B.;Validation, S.M.N.; Writing—original draft, S.M.N.; Writing—review and editing, I.E. and J.M.B. All authors haveread and agreed to the published version of the manuscript.
Funding: This research was funded by the Junta de Castilla y León (JCyL) and the European Regional DevelopmentFund (ERDF) through grant number BU301P18, and also by the Agencia Estatal de Investigación (grant numberPID2019-104950RB-I00/AEI/10.13039/501100011033).
Acknowledgments: The authors would like to thank Junta de Castilla y León and the European Social Fund (ESF)for the contract of Davinia Benito-Bedoya through the Youth Employment Initiative (YEI) programme.

Foods 2020, 9, 1411 16 of 19
Conflicts of Interest: The authors declare no conflict of interest. The funders had no role in the design of thestudy; in the collection, analyses, or interpretation of data; in the writing of the manuscript, or in the decision topublish the results.
References
1. Friberg, S.; Larsson, K.; Sjöblom, J. Food Emulsions, 4th ed.; CRC Press: Boca Raton, FL, USA, 2003.2. McClements, D.J. Food Emulsions: Principles, Practices, and Techniques, 3rd ed.; CRC Press: Boca Raton, FL,
USA, 2015.3. McClements, D.J.; Decker, E.A.; Park, Y.; Weiss, J. Structural Design Principles for Delivery of Bioactive
Components in Nutraceuticals and Functional Foods. Crit. Rev. Food Sci. Nutr. 2009, 49, 577–606. [CrossRef][PubMed]
4. Bénichou, A.; Aserin, A.; Garti, N. Double emulsions stabilized with hybrids of natural polymers forentrapment and slow release of active matters. Adv. Colloid Interface Sci. 2004, 29–41. [CrossRef] [PubMed]
5. Van Der Graaf, S.; Schroën, K.; Boom, R. Preparation of double emulsions by membraneemulsification—a review. J. Membr. Sci. 2005, 251, 7–15. [CrossRef]
6. Fang, Z.; Bhandari, B. Encapsulation of polyphenols – a review. Trends Food Sci. Technol. 2010, 21, 510–523.[CrossRef]
7. Anton, H.; Gayet, P.; Benoit, J.-P.; Saulnier, P. Nano-emulsions and nanocapsules by the PIT method:An investigation on the role of the temperature cycling on the emulsion phase inversion. Int. J. Pharm. 2007,344, 44–52. [CrossRef]
8. Anton, H.; Vandamme, T.F. The universality of low-energy nano-emulsification. Int. J. Pharm. 2009, 377,142–147. [CrossRef]
9. Tadros, T.; Izquierdo, P.; Esquena, J.; Solans, C. Formation and stability of nano-emulsions. Adv. ColloidInterface Sci. 2004, 303–318. [CrossRef]
10. Wooster, T.J.; Golding, M.; Sanguansri, P. Impact of Oil Type on Nanoemulsion Formation and OstwaldRipening Stability. Langmuir 2008, 24, 12758–12765. [CrossRef]
11. McClements, D.J.; Rao, J. Food-Grade Nanoemulsions: Formulation, Fabrication, Properties, Performance,Biological Fate, and Potential Toxicity. Crit. Rev. Food Sci. Nutr. 2011, 51, 285–330. [CrossRef]
12. Llinares, R.; Santos, J.; Trujillo-Cayado, L.A.; Ramírez, P.; Muñoz, J. Enhancing rosemary oil-in-watermicrofluidized nanoemulsion properties through formulation optimization by response surface methodology.LWT 2018, 97, 370–375. [CrossRef]
13. Ahmad, M.; Mudgil, P.; Gani, A.; Hamed, F.; Masoodi, F.A.; Maqsood, S. Nano-encapsulation of catechin instarch nanoparticles: Characterization, release behavior and bioactivity retention during simulated in-vitrodigestion. Food Chem. 2019, 270, 95–104. [CrossRef] [PubMed]
14. Ballesteros, L.F.; Ramirez, M.J.; Orrego, C.E.; Teixeira, J.A.; Mussatto, S.I. Encapsulation of antioxidantphenolic compounds extracted from spent coffee grounds by freeze-drying and spray-drying using differentcoating materials. Food Chem. 2017, 237, 623–631. [CrossRef] [PubMed]
15. Bhushani, J.A.; Kurrey, N.K.; Anandharamakrishnan, C. Nanoencapsulation of green tea catechins byelectrospraying technique and its effect on controlled release and in-vitro permeability. J. Food Eng. 2017, 199,82–92. [CrossRef]
16. Alves, A.D.C.S.; Mainardes, R.M.; Khalil, N.M. Nanoencapsulation of gallic acid and evaluation of itscytotoxicity and antioxidant activity. Mater. Sci. Eng. C 2016, 60, 126–134. [CrossRef]
17. Di Mattia, C.; Sacchetti, G.; Mastrocola, D.; Pittia, P.; Di Mattia, C.D. Effect of phenolic antioxidants onthe dispersion state and chemical stability of olive oil O/W emulsions. Food Res. Int. 2009, 42, 1163–1170.[CrossRef]
18. Gadkari, P.V.; Shashidhar, M.; Balaraman, M. Delivery of green tea catechins through Oil-in-Water (O/W)nanoemulsion and assessment of storage stability. J. Food Eng. 2017, 199, 65–76. [CrossRef]
19. Ghanbari, R.; Anwar, F.; Alkharfy, K.M.; Gilani, A.H.; Saari, N. Valuable Nutrients and Functional Bioactivesin Different Parts of Olive (Olea europaea L.)—A Review. Int. J. Mol. Sci. 2012, 13, 3291–3340. [CrossRef]
20. Kumari, A.; Yadav, S.K.; Pakade, Y.B.; Singh, B.; Yadav, S.C. Development of biodegradable nanoparticles fordelivery of quercetin. Colloids Surf. B Biointerfaces 2010, 80, 184–192. [CrossRef]

Foods 2020, 9, 1411 17 of 19
21. Matos, M.; Gutiérrez, G.; Coca, J.; Pazos, C. Preparation of water-in-oil-in-water (W1/O/W2) double emulsionscontaining trans-resveratrol. Colloids Surf. A Physicochem. Eng. Asp. 2014, 442, 69–79. [CrossRef]
22. Mohammadi, A.; Jafari, S.M.; Assadpour, E.; Esfanjani, A.F. Nano-encapsulation of olive leaf phenoliccompounds through WPC–pectin complexes and evaluating their release rate. Int. J. Biol. Macromol. 2016,82, 816–822. [CrossRef]
23. Mohammadi, A.; Jafari, S.M.; Esfanjani, A.F.; Akhavan, S. Application of nano-encapsulated olive leaf extractin controlling the oxidative stability of soybean oil. Food Chem. 2016, 190, 513–519. [CrossRef] [PubMed]
24. Pisoschi, A.M.; Pop, A.; Cimpeanu, C.; Turcus, V.; Predoi, G.; Iordache, F. Nanoencapsulation techniques forcompounds and products with antioxidant and antimicrobial activity—A critical view. Eur. J. Med. Chem.2018, 157, 1326–1345. [CrossRef] [PubMed]
25. Sari, T.; Mann, B.; Kumar, R.; Singh, R.; Sharma, R.; Bhardwaj, M.; Athira, S. Preparation and characterizationof nanoemulsion encapsulating curcumin. Food Hydrocoll. 2015, 43, 540–546. [CrossRef]
26. Tolun, A.; Altintas, Z.; Artik, N. Microencapsulation of grape polyphenols using maltodextrin and gumarabic as two alternative coating materials: Development and characterization. J. Biotechnol. 2016, 239, 23–33.[CrossRef] [PubMed]
27. Tuyishime, M.A.; Matabaro, E.; Habinshuti, I.; Hitabatuma, A.; Korma, S.A.; Ali, A.H. Green teapolyphenols-proteins nanocomplexes foaming behavior, nanoemulsions and their applications. IJAIR2016, 5, 149–156.
28. Lu, W.; Kelly, A.L.; Miao, S. Emulsion-based encapsulation and delivery systems for polyphenols. Trends FoodSci. Technol. 2016, 47, 1–9. [CrossRef]
29. Velderrain-Rodríguez, G.R.; Acevedo-Fani, A.; González-Aguilar, G.A.; Martín-Belloso, O. Encapsulation andstability of a phenolic-rich extract from mango peel within water-in-oil-in-water emulsions. J. Funct. Foods2019, 56, 65–73. [CrossRef]
30. Estévez, M.; Güell, C.; De Lamo-Castellví, S.; Ferrando, M. Encapsulation of grape seed phenolic-rich extractwithin W/O/W emulsions stabilized with complexed biopolymers: Evaluation of their stability and release.Food Chem. 2019, 272, 478–487. [CrossRef]
31. Ye, Q.; Li, T.; Li, J.; Liu, L.; Dou, X.; Zhang, X. Development and evaluation of tea polyphenols loaded waterin oil emulsion with zein as stabilizer. J. Drug Deliv. Sci. Technol. 2020, 56, 101528. [CrossRef]
32. Ahmed, K.; Li, Y.; McClements, D.J.; Xiao, H. Nanoemulsion- and emulsion-based delivery systems forcurcumin: Encapsulation and release properties. Food Chem. 2012, 132, 799–807. [CrossRef]
33. McClements, D.J. Encapsulation, protection, and release of hydrophilic active components: Potential andlimitations of colloidal delivery systems. Adv. Colloid Interface Sci. 2015, 219, 27–53. [CrossRef] [PubMed]
34. Yuan, Y.; Gao, Y.; Zhao, J.; Mao, L. Characterization and stability evaluation of β-carotene nanoemulsionsprepared by high pressure homogenization under various emulsifying conditions. Food Res. Int. 2008, 41,61–68. [CrossRef]
35. Garti, N.; Bisperink, C. Double emulsions: Progress and applications. Curr. Opin. Colloid Interface Sci. 1998,3, 657–667. [CrossRef]
36. Cournarie, F.; Savelli, M.-P.; Rosilio, V.; Bretez, F.; Vauthier, C.; Grossiord, J.-L.; Seiller, M.Insulin-loaded W/O/W multiple emulsions: Comparison of the performances of systems prepared withmedium-chain-triglycerides and fish oil. Eur. J. Pharm. Biopharm. 2004, 58, 477–482. [CrossRef] [PubMed]
37. McClements, D.J.; Decker, E.A.; Weiss, J. Emulsion-Based Delivery Systems for Lipophilic BioactiveComponents. J. Food Sci. 2007, 72, R109–R124. [CrossRef]
38. Li, Y.; Le Maux, S.; Xiao, H.; McClements, D.J. Emulsion-Based Delivery Systems for Tributyrin, a PotentialColon Cancer Preventative Agent. J. Agric. Food Chem. 2009, 57, 9243–9249. [CrossRef]
39. Mun, S.; McClements, D.J. Influence of Interfacial Characteristics on Ostwald Ripening in HydrocarbonOil-in-Water Emulsions. Langmuir 2006, 22, 1551–1554. [CrossRef]
40. Mao, L.; Xu, D.; Yang, J.; Yuan, F.; Gao, Y.; Zhao, J. Effects of small and large molecule emulsifierson the characteristics of β-carotene nanoemulsions prepared by high pressure homogenization.Food Technol. Biotechnol. 2009, 47, 336–342.
41. Bazzarelli, F.; Poerio, T.; Mazzei, R.; D’Agostino, N.; Giorno, L. Study of OMWWs suspended solidsdestabilization to improve membrane processes performance. Sep. Purif. Technol. 2015, 149, 183–189.[CrossRef]

Foods 2020, 9, 1411 18 of 19
42. Hoff, J.E.; Singleton, K.I. A method for determination of tannins in foods by means of immobilized protein.J. Food Sci. 1977, 42, 1566–1569. [CrossRef]
43. Shen, Q.; Zhang, B.; Xu, R.; Wang, Y.; Ding, X.; Li, P. Antioxidant activity in vitro of the selenium-containedprotein from the Se-enriched Bifidobacterium animalis 01. Anaerobe 2010, 16, 380–386. [CrossRef] [PubMed]
44. Regan, J.O.; Mulvihill, D.M. Water soluble inner aqueous phase markers as indicators of the encapsulationproperties of water-in-oil-in-water emulsions stabilized with sodium caseinate. Food Hydrocoll. 2009, 23,2339–2345. [CrossRef]
45. Allende, D.; Cambiella, A.; Benito, J.M.; Pazos, C.; Coca, J. Destabilization-Enhanced Centrifugation ofMetalworking Oil-in-Water Emulsions: Effect of Demulsifying Agents. Chem. Eng. Technol. 2008, 31,1007–1014. [CrossRef]
46. Rebolleda, S.; Sanz, M.T.; Benito, J.M.; Beltrán, S.; Escudero, I.; González-Sanjosé, M.L. Formulation andcharacterisation of wheat bran oil-in-water nanoemulsions. Food Chem. 2015, 167, 16–23. [CrossRef]
47. Ghorbannezhad, P.; Bay, A.; Yolmeh, M.; Yadollahi, R.; Moghadam, J.Y. Optimization ofcoagulation–flocculation process for medium density fiberboard (MDF) wastewater through responsesurface methodology. Desalin. Water Treat. 2016, 57, 26916–26931. [CrossRef]
48. Hu, Y.-T.; Ting, Y.; Hu, J.-Y.; Hsieh, S.-L. Techniques and methods to study functional characteristics ofemulsion systems. J. Food Drug Anal. 2017, 25, 16–26. [CrossRef]
49. Bai, L.; Huan, S.; Gu, J.; McClements, D.J. Fabrication of oil-in-water nanoemulsions by dual-channelmicrofluidization using natural emulsifiers: Saponins, phospholipids, proteins, and polysaccharides.Food Hydrocoll. 2016, 61, 703–711. [CrossRef]
50. Ganesan, P.; Karthivashan, G.; Park, S.Y.; Kim, J.; Choi, D.-K. Microfluidization trends in the development ofnanodelivery systems and applications in chronic disease treatments. Int. J. Nanomed. 2018, 13, 6109–6121.[CrossRef]
51. Jafari, S.M.; He, Y.; Bhandari, B. Nano-Emulsion Production by Sonication and Microfluidization—AComparison. Int. J. Food Prop. 2006, 9, 475–485. [CrossRef]
52. Jafari, S.M.; He, Y.; Bhandari, B. Production of sub-micron emulsions by ultrasound and microfluidizationtechniques. J. Food Eng. 2007, 82, 478–488. [CrossRef]
53. Kentish, S.; Wooster, T.; Ashokkumar, M.; Balachandran, S.; Mawson, R.; Simons, L. The use of ultrasonicsfor nanoemulsion preparation. Innov. Food Sci. Emerg. Technol. 2008, 9, 170–175. [CrossRef]
54. Khadem, B.; Sheibat-Othman, N. Theoretical and Experimental Investigations of Double Emulsion Preparationby Ultrasonication. Ind. Eng. Chem. Res. 2019, 58, 8220–8230. [CrossRef]
55. Kumar, H.; Kumar, V. Ultrasonication assisted formation and stability of water-in-oil nanoemulsions:Optimization and ternary diagram analysis. Ultrason. Sonochem. 2018, 49, 79–88. [CrossRef] [PubMed]
56. Li, P.-H.; Chiang, B.-H. Process optimization and stability of d-limonene-in-water nanoemulsions preparedby ultrasonic emulsification using response surface methodology. Ultrason. Sonochem. 2012, 19, 192–197.[CrossRef]
57. Mehmood, T.; Ahmad, A.; Ahmed, A.; Ahmed, Z. Optimization of olive oil based O/W nanoemulsionsprepared through ultrasonic homogenization: A response surface methodology approach. Food Chem. 2017,229, 790–796. [CrossRef]
58. Qian, C.; McClements, D.J. Formation of nanoemulsions stabilized by model food-grade emulsifiers usinghigh-pressure homogenization: Factors affecting particle size. Food Hydrocoll. 2011, 25, 1000–1008. [CrossRef]
59. Schuch, A.; Wrenger, J.; Karbstein, H.P. Production of W/O/W double emulsions. Part II: Influence ofemulsification device on release of water by coalescence. Colloids Surf. A Physicochem. Eng. Asp. 2014, 461,344–351. [CrossRef]
60. Yukuyama, M.N.; Kato, E.T.M.; De Araujo, G.L.B.; Löbenberg, R.; Monteiro, L.M.; Lourenço, F.R.;Bou-Chacra, N.A. Olive oil nanoemulsion preparation using high-pressure homogenization and d-phaseemulsification—A design space approach. J. Drug Deliv. Sci. Technol. 2019, 49, 622–631. [CrossRef]
61. Leong, T.; Wooster, T.; Kentish, S.; Ashokkumar, M. Minimising oil droplet size using ultrasonic emulsification.Ultrason. Sonochem. 2009, 16, 721–727. [CrossRef]
62. Lin, C.-Y.; Chen, L.-W. Comparison of fuel properties and emission characteristics of two- and three-phaseemulsions prepared by ultrasonically vibrating and mechanically homogenizing emulsification methods.Fuel 2008, 87, 2154–2161. [CrossRef]

Foods 2020, 9, 1411 19 of 19
63. Ðordevic, V.; Belšcak-Cvitanovic, A.; Drvenica, I.; Komes, D.; Nedovic, V.; Bugarski, B.M. Nanoscale nutrientdelivery systems. In Nutrient Delivery. Nanotechnology in the Agri-Food Industry; Grumezescu, A.M., Ed.;Academic Press: London, UK, 2017; Volume 5, pp. 87–139.
64. Singh, Y.; Meher, J.G.; Raval, K.; Khan, F.A.; Chaurasia, M.; Jain, N.K.; Chourasia, M.K. Nanoemulsion:Concepts, development and applications in drug delivery. J. Control. Release 2017, 252, 28–49. [CrossRef][PubMed]
65. Atiemo-Obeng, V.A.; Calabrese, R.V. Rotor-stator mixing devices. In Handbook of Industrial Mixing: Scienceand Practice, 1st ed.; Paul, E.L., Atiemo-Obeng, V.A., Kresta, S.M., Eds.; Wiley: Hoboken, NJ, USA, 2003;pp. 479–505.
66. Mortensen, H.H.; Innings, F.; Håkansson, A. The effect of stator design on flowrate and velocity fields in arotor-stator mixer—An experimental investigation. Chem. Eng. Res. Des. 2017, 121, 245–254. [CrossRef]
67. Zhang, J.; Xu, S.; Li, W. High shear mixers: A review of typical applications and studies on power draw, flowpattern, energy dissipation and transfer properties. Chem. Eng. Process. Process. Intensif. 2012, 57, 25–41.[CrossRef]
68. Anarjan, N.; Mirhosseini, H.; Baharin, B.S.; Tan, C.P. Effect of processing conditions on physicochemicalproperties of astaxanthin nanodispersions. Food Chem. 2010, 123, 477–483. [CrossRef]
69. Gaikwad, S.G.; Pandit, A.B. Ultrasound emulsification: Effect of ultrasonic and physicochemical propertieson dispersed phase volume and droplet size. Ultrason. Sonochem. 2008, 15, 554–563. [CrossRef]
70. Yang, Y.; Leser, M.E.; Sher, A.A.; McClements, D.J. Formation and stability of emulsions using a natural smallmolecule surfactant: Quillaja saponin (Q-Naturale®). Food Hydrocoll. 2013, 30, 589–596. [CrossRef]
71. Einhorn-Stoll, U.; Weiss, M.; Kunzek, H. Influence of the emulsion components and preparation method onthe laboratory-scale preparation of o/w emulsions containing different types of dispersed phases and/oremulsifiers. Food/Nahrung 2002, 46, 294–301. [CrossRef]
72. Kharat, M.; Du, Z.; Zhang, G.; McClements, D.J. Physical and Chemical Stability of Curcumin in AqueousSolutions and Emulsions: Impact of pH, Temperature, and Molecular Environment. J. Agric. Food Chem.2017, 65, 1525–1532. [CrossRef]
73. Juttulapa, M.; Piriyaprasarth, S.; Sriamornsak, P. Effect of pH on Stability of Oil-in-Water Emulsions Stabilizedby Pectin-Zein Complexes. Adv. Mater. Res. 2013, 747, 127–130. [CrossRef]
74. Akhtar, M.; Murray, B.S.; Afeisume, E.I.; Khew, S.H. Encapsulation of flavonoid in multiple emulsion usingspinning disc reactor technology. Food Hydrocoll. 2014, 34, 62–67. [CrossRef]
75. Gomes, A.; Costa, A.L.R.; Perrechil, F.D.A.; Cunha, R.L. Role of the phases composition on the incorporationof gallic acid in O/W and W/O emulsions. J. Food Eng. 2016, 168, 205–214. [CrossRef]
© 2020 by the authors. Licensee MDPI, Basel, Switzerland. This article is an open accessarticle distributed under the terms and conditions of the Creative Commons Attribution(CC BY) license (http://creativecommons.org/licenses/by/4.0/).