Formation of hydrogen negative ions by surface and volume ... · PDF filevolume processes with...
15
HAL Id: jpa-00219442 https://hal.archives-ouvertes.fr/jpa-00219442 Submitted on 1 Jan 1979 HAL is a multi-disciplinary open access archive for the deposit and dissemination of sci- entific research documents, whether they are pub- lished or not. The documents may come from teaching and research institutions in France or abroad, or from public or private research centers. L’archive ouverte pluridisciplinaire HAL, est destinée au dépôt et à la diffusion de documents scientifiques de niveau recherche, publiés ou non, émanant des établissements d’enseignement et de recherche français ou étrangers, des laboratoires publics ou privés. Formation of hydrogen negative ions by surface and volume processes with application to negative ion sources J. Hiskes To cite this version: J. Hiskes. Formation of hydrogen negative ions by surface and volume processes with applica- tion to negative ion sources. Journal de Physique Colloques, 1979, 40 (C7), pp.C7-179-C7-192. <10.1051/jphyscol:19797439>. <jpa-00219442>
Transcript of Formation of hydrogen negative ions by surface and volume ... · PDF filevolume processes with...

HAL Id: jpa-00219442https://hal.archives-ouvertes.fr/jpa-00219442
Submitted on 1 Jan 1979
HAL is a multi-disciplinary open accessarchive for the deposit and dissemination of sci-entific research documents, whether they are pub-lished or not. The documents may come fromteaching and research institutions in France orabroad, or from public or private research centers.
L’archive ouverte pluridisciplinaire HAL, estdestinée au dépôt et à la diffusion de documentsscientifiques de niveau recherche, publiés ou non,émanant des établissements d’enseignement et derecherche français ou étrangers, des laboratoirespublics ou privés.
Formation of hydrogen negative ions by surface andvolume processes with application to negative ion
sourcesJ. Hiskes
To cite this version:J. Hiskes. Formation of hydrogen negative ions by surface and volume processes with applica-tion to negative ion sources. Journal de Physique Colloques, 1979, 40 (C7), pp.C7-179-C7-192.<10.1051/jphyscol:19797439>. <jpa-00219442>
JOURNAL DE PHYSIQUE Colloque C7, supplkment au no 7, Tome 40, Juillet 1979, page C7-179
Formation of hydrogen negative ions by surface and volume processes with application to negative ion sources
J. R. Hiskes
Lawrence Livermore Laboratory, University of California Livermore, California 94550, U.S.A
Abstract. - Three methods for the formation of negative ions are reviewed : double charge-exchange, whereby low-energy positive ions are converted to negative ions by two sequential electron captures in a vapor target; electron-volume-processes wherein low-energy electrons lead to negative-ion formation by dissociative attachment or dissociative recombination by collisions with hydrogen molecules or hydrogen molecular ions and, surface processes leading to negative ions by backscattering or desorption induced by energetic particle bombardment. The application of these method to the development of hydrogen-negative-ion sources is discussed.
During the last few decades interest in negative- hydrogen ion sources has been directed mainly toward synchrotron and other particle accelerator applications, with emphasis on high current densities delivered for short pulses. But within the last several years there has been an awareness in the magnetic fusion program of the future need for negative ions as a means for generating high energy neutral beams, beams with energies above a few hundred keV. Negative ions seem to be the only effective interme- diary for efficiently producing such beams. Although methods for generating negative ion beams have relied upon synchrotron concepts, the requirements for fusion are very different : here one is interested in more moderate current densities, up to 100 mA cm-', but with continuous operation. Proposed source modules would accelerate of the order of 10 A of beam current and deliver several megawatts of beam power. Both H- and D- beams are being considered for application in different reactor systems.
The conceptualization of negative ion sources is now in a very volatile stage. But of the great variety of proposals that have been offered to date [I-41, three general areas appear ready for development. These are : first, the double charge exchange method for converting a positive ion beam into a negative ion beam ; second, electron-volume processes wherein low energy electrons interacting with molecular species lead to negative ion products via dissociative attach- ment or recombination; and third, generation of negative ions in surface interactions, principally via desorption and backscattering. Both our qualitative and our quantitative understanding of these processes diminishes as one proceeds from the first through the third. In this paper we shall consider the physics of these three methods in increasing detail.
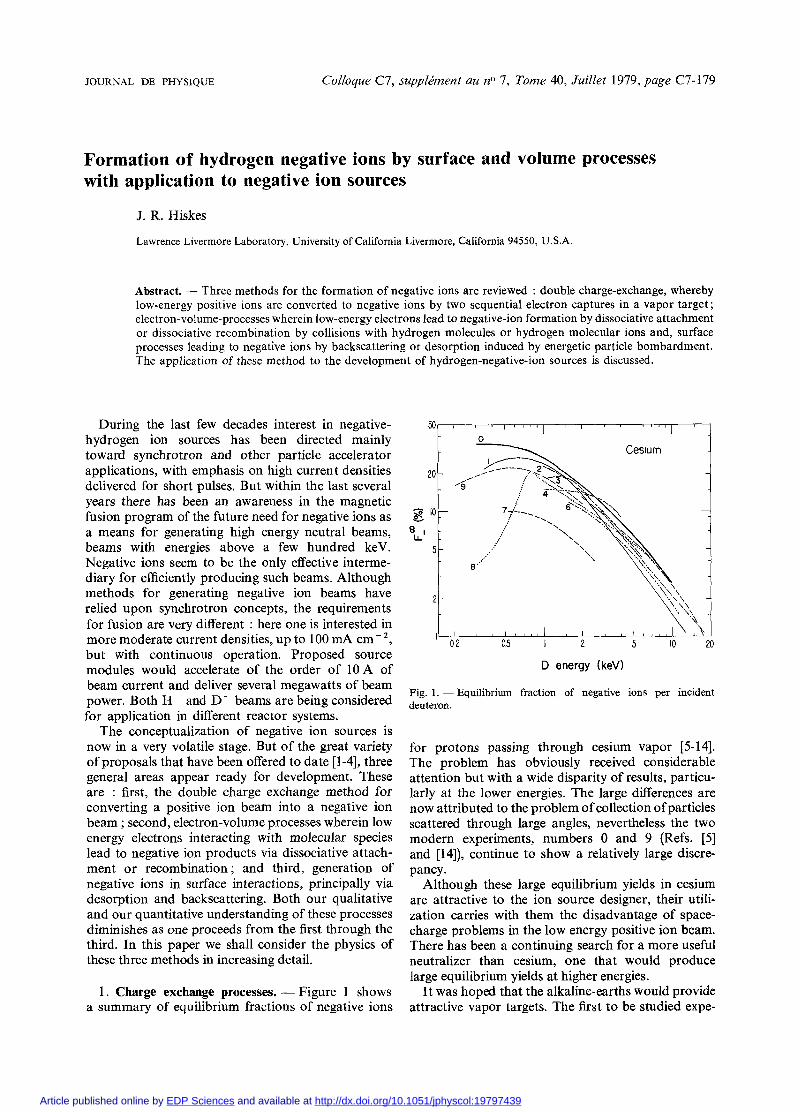
1. Charge exchange processes. - Figure 1 shows a summary of equilibrium fractions of negative ions
D energy (keV)
Fig. 1. - Equilibrium fraction of negative ions per incident deuteron.
for protons passing through cesium vapor [5-141. The problem has obviously received considerable attention but with a wide disparity of results, particu- larly at the lower energies. The large differences are now attributed to the problem of collection of particles scattered through large angles, nevertheless the two modern experiments, numbers 0 and 9 (Refs. [5] and [14]), continue to show a relatively large discre- pancy.
Although these large equilibrium yields in cesium are attractive to the ion source designer, their utili- zation carries with them the disadvantage of space- charge problems in the low energy positive ion beam. There has been a continuing search for a more useful neutralizer than cesium, one that would produce large equilibrium yields at higher energies.
It was hoped that the alkaline-earths would provide attractive vapor targets. The first to be studied expe-
Article published online by EDP Sciences and available at http://dx.doi.org/10.1051/jphyscol:19797439
C7-180 J . R. HISKES
Alkaline earths 0.02
O.Ol( ' I " I ' " ' l I I ' i i " i l 1 2 5 10 20 50 100
D energy ( keV)
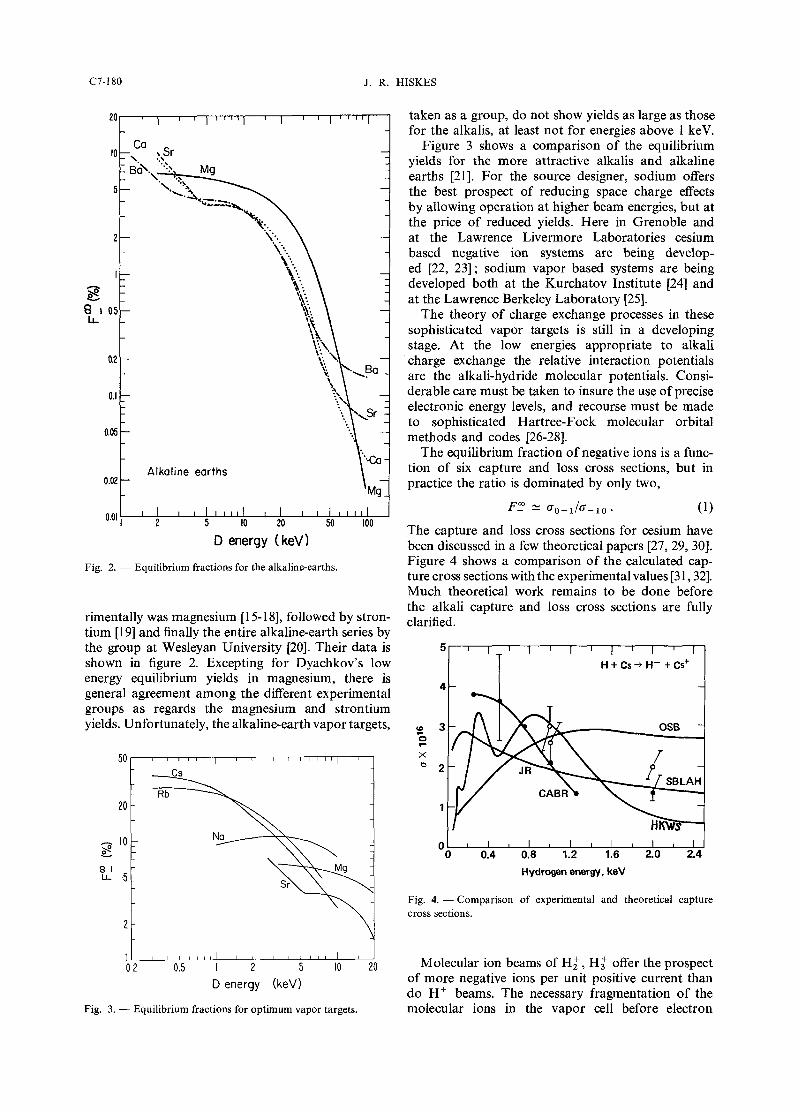
Fig. 2. - Equilibrium fractions for the alkaline-earths.
rimentally was magnesium [I 5-1 81, followed by stron- tium [19] and finally the entire alkaline-earth series by the group at Wesleyan University [20]. Their data is shown in figure 2. Excepting for Dyachkov's low energy equilibrium yields in magnesium, there is general agreement among the different experimental groups as regards the magnesium and strontium yields. Unfortunately, the alkaline-earth vapor targets,
taken as a group, do not show yields as large as those for the alkalis, at least not for energies above 1 key.
Figure 3 shows a comparison of the equilibrium yields for the more attractive alkalis and alkaline earths [21]. For the source designer, sodium offers the best prospect of reducing space charge effects by allowing operation at higher beam energies, but at the price of reduced yields. Here in Grenoble and at the Lawrence Livermore Laboratories cesium based negative ion systems are being develop- ed [22, 231; sodium vapor based systems are being developed both at the Kurchatov Institute [24] and at the Lawrence Berkeley Laboratory [25].
The theory of charge exchange processes in these sophisticated vapor targets is still in a developing stage. At the low energies appropriate to alkali charge exchange the relative interaction potentials are the alkali-hydride molecular potentials. Consi- derable care must be taken to insure the use of precise electronic energy levels, and recourse must be made to sophisticated Hartree-Fock molecular orbital methods and codes [26-281.
The equilibrium fraction of negative ions is a func- tion of six capture and loss cross sections, but in practice the ratio is dominated by only two,
The capture and loss cross sections for cesium have been discussed in a few theoretical papers [27,29, 301. Figure 4 shows a comparison of the calculated cap- ture cross sections with the experimental values [3 1,321. Much theoretical work remains to be done before the alkali capture and loss cross sections are fully clarified.
Hydrogen energy, keV
Fig. 4. - Comparison of experimental and theoretical capture cross sections.
0 2 0.5 1 2 5 10 20
D energy (keV)
Fig. 3. - Equilibrium fractions for optimum vapor targets.
Molecular ion beams of H l , H: offer the prospect of more negative ions per unit positive current than do H + beams. The necessary fragmentation of the molecular ions in the vapor cell before electron
FORMATION O F HYDROGEN NEGATIVE IONS BY SURFACE AND VOLUME C7-181
capture can occur imposes the disadvantage of requiring a greater cell line density. The use of the H i ion introduces some further subtleties with additional reaction channels, and with consequences for the angular distribution of the product negative ions [33].
2. Electron volume processes. - Turning our atten- tion to electron-molecule collisions, we come upon the first of many surprises. The study of hydrogen discharges is well established, but until an effort was made to diagnose the negative ion density several important electron collision processes were not appre- ciated. In the initial experiments at the Ecole Poly- technique, plasma probes indicated an anomalously high negative ion density [34]. This has subsequently been confirmed by photodetachment of the H- ions and observing the rise in electron density [35]. Addi- tional confirmation has been achieved by direct extraction of an H- beam with a current density of the order of 1 mA The parameters of the discharge are given in table I.
Table I. H, density 2 x 1014 cm-3 Positive ion density 2 x 1 O l 0 cmA3 H: fraction 92 % H,+ fraction 5 % Hf fraction 3 % Electron temperature 0.1 -t 0.4 eV Fast electron density (120 eV) 2 x 10' cm-3 Ion temperature (uncertain) 0.1 eV
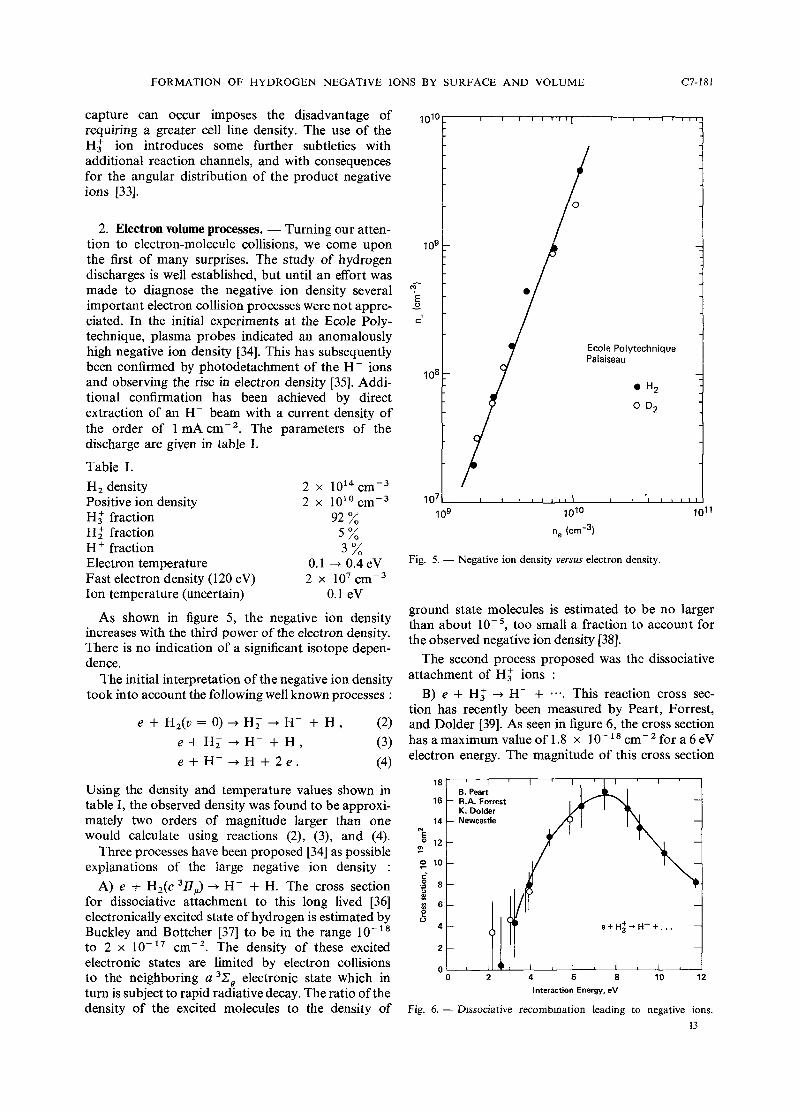
As shown in figure 5, the negative ion density increases with the third power of the electron density. There is no indication of a significant isotope depen- dence.
The initial interpretation of the negative ion density took into account the following well known processes :
Fig. 5. - Negative ion density versus electron density.
ground state molecules is estimated to be no larger than about lo-', too small a fraction to account for the observed negative ion density [38].
The second process proposed was the dissociative attachment of H: ions :
B) e + H: + H- + .+.. This reaction cross sec- tion has recently been measured by Peart, Forrest, and Dolder [39]. As seen in figure 6, the cross section has amaximum value of 1.8 x 10-l8 cmW2 for a 6 eV electron energy. The magnitude of this cross section
Using the density and temperature values shown in B. Pean
table I, the observed density was found to be approxi- 16 - R.A. Forrest K. Dolder
mately two orders of magnitude larger than one 14 - Newcastle
would calculate using reactions (2), (3), and (4). "g ,2 - Three processes have been proposed [34] as possible "
explanations of the Iarge negative ion density :
A) e f H,(c 3U,) -+ H- + H. The cross section 8 -
for dissociative attachment to this long lived [36] $ 6 - electronically excited state of hydrogen is estimated by Buckley and Bottcher [37] to be in the range 10- l8
to 2 x lo-" cm-'. The density of these excited electronic states are limited by electron collisions to the neighboring a 3 ~ , electronic state which in o 2 4 6 s 10 12
turn is subject to rapid radiative decay. The ratio of the Interaction Energy, eV
density of the excited molecules to the density of Fig. 6. - D~ssociative recombination leading to negative ions.
13
C7-182 J. R. HISKES
is at least an order-of-magnitude too small to explain the observed negative ion density.
The dissociative recombination leading to neutral products
is known to have a large cross section, of order 10-l5 ~ m - ~ [40]. The resonance state of H, leading to reaction (5) and the product states on the right side of the reaction have been studied by Kulander and Guest [41]. They conclude the H2 molecules are formed with a substantial.population in the higher vibrational states. This conclusion is consistent with the experimental observations of Vogler [42].
The third and most probable process of importance is the dissociative attachment to vibrationally excited molecules :
C) e + H2(v 2 6)- H; + H- + H. In a recent experiment by Allan and Wong [43], this cross section is shown to increase by approximately an order-of- magnitude for successive vibrational excitation through the lowest four levels. In the theoretical analysis of this reaction by Wadehra and Bardsley [44], these cross sections continue to increase through v = 6, and reach a value of 3-4 x 10-l6 cm-2 for the upper levels through v = 9. For the case of D2(v) the rate of increase is even more dramatic, rising from a value of 2 x cmP2 for v = 0 to greater than 2 x 10- l 6 cm2 for levels v = 9-13. For both H2(v) and D2(v) the dissociative attachment cross sections are greater than 2 x 10-l6 cm-2 for vibrational levels with thresholds below 1 eV. As a consequence, the very pronounced isotope effect that is so well known for the ground vibrational levels is almost non-existent for the upper levels.
The question then arises as to the origin of the vibrationally excited molecules, H2(v). Two processes appear probable : the dissociative recombination of H i illustrated in reaction (5), and the Auger neutra- lization of H i ions in wall collisions :
Using the Frank-Condon factors between H i and Hz [45] and the population distributions for H i vibrational levels [46], one estimates the process (6) may yield populations for levels v 2 6 which are greater than 30 % of the total H2(v) distribution.
But even granted such large populations and/or the large cross section for reaction (5), the parameters listed in table I cannot be used to explain the observed negative ion yields. In order for the density of H2(v 2 6) to rise to a sufficiently high level, the H2(v) must survive several wall collisions against vibrational de-excitation :
At least 10 but no more than 100 wall collisions are
required, on average, before de-excitation of type (7) are allowed.
In conclusion, a complete interpretation of the negative ion density is not yet possible, but the following tentative scenario is offered :
3. Surface formation processes. - Among the most striking developments in negative ion research in recent years has been the generation of negative ions by particle bombardment of alkali-coated metal surfaces. First developed by the Novosibirsk group for synchrotron applications, the early technology was subsequently adopted at Brookhaven for both syn- chrotron and possible fusion applications, with the BNL group successfully extending the pulse length into the millisecond range. A summary account of this early work on surface production is given in the Proceedings of the 1974 Berkeley Symposium [47,48].
From the point of view of the physical processes involved, the problem at hand is in many ways ana- logous to the situation in electron-volume-processes : namely, what is the principal mechanism leading to the production of negative ions. In their original papers, the Novosibirsk group interpreted the opera- tion of their source as based on the desorption of negative ions by energetic primaries striking the cathode [47,49].
Subsequently, they were to observe hydrogen- negative-ion secondary-emission desorption yields near unity for 2-10 keV Cs+ ions bombarding alkali- coated surfaces in a hydrogen atmosphere [50]. More recently, Seidl[2] has reported desorption yields of H- for Csf and Na+ ions incident upon CsH with energies up to 20 keV ; the Cs+ secondary emission coefficients found by Seidl are similar to those reported in refe- rence [50]. M. Yu has observed the desorption of H- ions from cesium-coated surfaces bombarded with 150 eV Ne+ ions [51]. His data illustrates very clearly the sensitive dependence of the negative ion yield as a function of surface work function, but he does not report the magnitude of the secondary emission coef- ficient. Further, Wiesemann has interpreted the negative ion yields from surface-plasma and duoplas- matron sources as due principally to surface desorp- tion [52].
Following the Berkeley Symposium in 1974, an alternative to the desorption process was proposed whereby the energetic hydrogen primaries backscatter from the cathode substrate, and, retaining an appre- ciable fraction of their incident energy as they are
FORMATION O F HYDROGEN NEGATIVE IONS BY SURFACE AND VOLUME C7-183
emitted from the cathode, capture electrons to form negative ions in a region several angstroms in front of the surface [53]. This model has been developed further in successive papers [54,55].
The Berkeley group has bombarded alkali-coated, surfaces with D: and D: ions with energies of from 100 eV to a few keV per nucleon, and have interpreted their data as backscattering yields [56].
In a more recent experiment W. Graham has direct- ed a thermal beam of hydrogen atoms emitted from an oven maintained at 3 000 K onto a cesium coated surface [57]. The negative ion flux observed is inter- preted as resulting from the backscattering of those atoms in the tail of the incident thermal distribution with energies above about one electron-volt.
In their 1977 Brookhaven paper [58], the Novosi- birsk group consider both desorption and backscatter- ing processes, but draw no conclusions as to the relative ion yields resulting from these two mecha- nisms. Unfortunately, there does not exist an experi- ment in which the desorption and backscattering yields can be monitored simultaneously although the possibility for such an experiment has been discussed [59]. In consideration of the disparity of views that have been expressed concerning these processes, it seems appropriate to estimate the desorption yield for hydrogen particles adsorbed on the surface, and to compare the particle desorption yields with the particle backscattering yields.
3.1 SURFACE DESORPTION. - The cross sections for desorption can be estimated using the differential cross sections for electron scattering on chemisorbed hydrogen [60]. In reference [60] the jellium model is employed to account for the electron shielding of protons embedded in the surface of tungsten. Since the crystal structure and lattice spacing of tungsten and molybdenum are virtually identical, and the number of 5s and 4d valence electrons in Mo are equal to the number 6s and 5d electrons in W, the jellium model differential scattering cross sections for Mo and W should be similar. At large scattering angles these differential cross sections go over to the Rutherford cross section, but remain finite a t small scattering angles. Bearing in mind that the Rutherford cross section is a function only of c.m. energy and is independent of mass, the 50 and 100 eV electron scattering cross sections given in reference [60] can be used for interpreting proton collisions where the proton energies in the laboratory system are 100 and 200 eV, respectively.
Another basis for estimating the desorption cross section can be obtained using the computer studies of hydrogen sputtering by hydrogen incident upon TiH,, FeH, and FeH, [61]. In reference [61] it is found that the essential mechanism for light-particle sputtering is the two-body collision of the backscatter- ed light particle with the atoms near the surface. Using this observation as the basis for a desorption
model, one can use the differential scattering cross sections mentioned above, together with an expression for energy transfer in two-particle collisions, to calcu- late the cross section for an energetic hydrogen particle emerging from the surface to dislodge another hydrogen particle bound to the surface with energy E,. If E, is the initial energy of a particle scattered through an angle 6, in the laboratory system that transfers an amount of energy E, to a particle of equal mass, the ratio of energies is
The adsorption energy of hydrogen, E,, is approxi- mately 2 eV. A hydrogen atom is presumed to be desorbed if it receives an amount of kinetic energy greater than 2 eV directed normally outward from the surface. The computer-calculations described below show that the backscattered particles emerge from the surface with a cosine angular distribution ; it follows that the mean kinetic energy directed per- pendicular to the surface is equal to one half the total kinetic energy. The minimum angle 6 , leading to desorption is the angle for which E2 = 4 eV, and the desorption cross section is the integral over the differential cross section ranging from this angle up to 900 in the lab system. The values obtained are shown in table 11, including those derived from the sputtering calculations of reference [61].
Table 11. - Desorption cross sections.
Backscattered energy
100 eV H sputtering
100 eV 200 eV TiH, FeH FeH, 0.52 A2 0.27 A2 0.50 A2 0.82 A2 0.52 A2
If the angular effects are ignored and only a minimum of 2 eV energy transfer is assumed, the cross sections are increased approximately 20 "/,. The sputtering cross sections shown in the table are not strictly comparable because the backscattered particles in this latter case are distributed in energy up to 100 eV, nevertheless the comparisons are plausible.
It is interesting to consider the magnitude of the desorption yield in the surface-plasma-source that is implied by these cross sections. Previously [53] the surface hydrogen coverage under source conditions had been estimated to be about 2 x 10¹⁴ atoms cm-', from which one would infer a hydrogen atom desorp- tion yield of about 1 %. For surfaces near room temperature, however, adsorbed hydrogen atom cove- rages can be as large as loi5 atoms cm-,, implying desorption yields up to several percent.
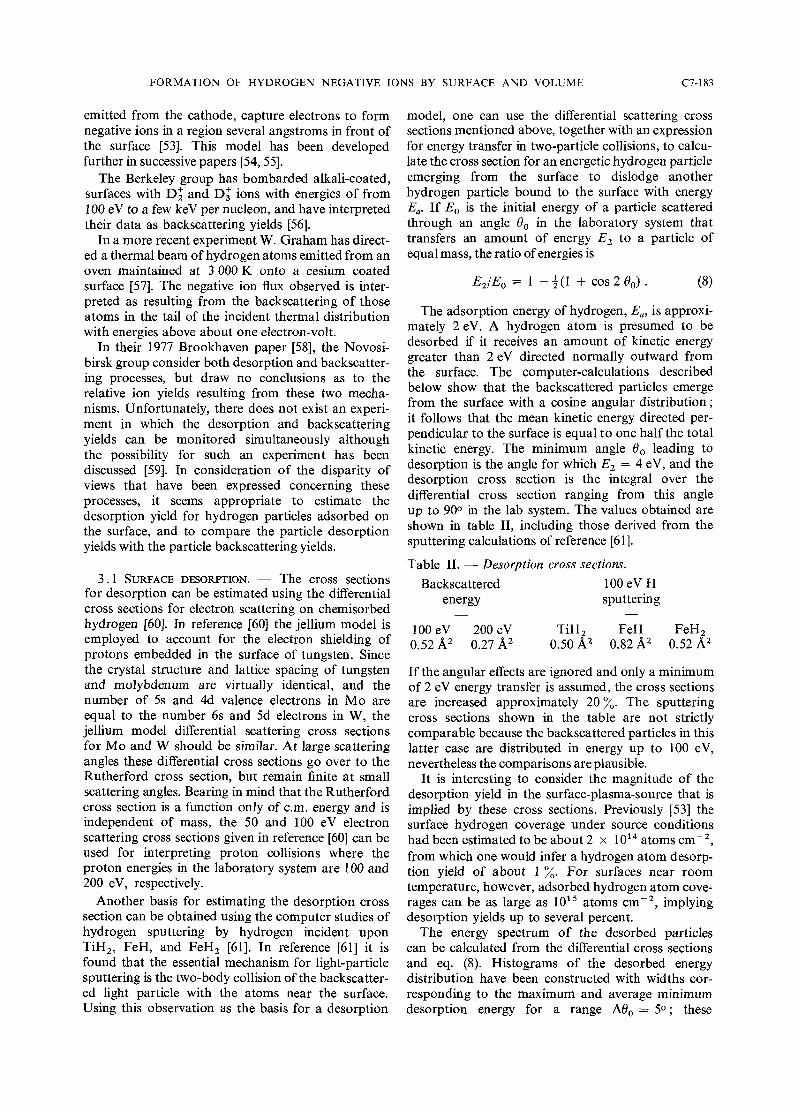
The energy spectrum of the desorbed particles can be calculated from the differential cross sections and eq. (8). Histograms of the desorbed energy distribution have been constructed with widths cor- responding to the maximum and average minimum desorption energy for a range Ado = 50; these
C7-184 J . R. HISKES
DESORBTION SPUTTERING - 1 0 0 e V H+H(a) . . . - a 100eV H+ViH, --- 200eV
BACKSCATTER ING lOOeV H+Mo 200eV
EIE - lncident
Fig. 7. - Energy distributions versus incident energy.
histograms have been summed to give the energy distribution shown in figure 7. For comparison we have included the histogram of the H sputtering yield [61] for 100 eV hydrogen incident upon TiH,.
Also shown in the figure is the histogram of back- scattered H particles for 100 or 200 eV hydrogen atoms incident upon molybdenum. These distributions were calculated using the Marlowe [61] code discussed below. Qualitatively, the desorption and backscatter- ing distributions are distinct : the desorption maxima occurring at lower energies, the backscattering maxima occurring near the incident energy. This distinction is expected to be generally true, but may be less distinct for low-Z substrates.
The cross sections shown in table I1 and the energy distributions shown in the figure refer to the total number of particles backscattered. Only a fraction of this total is converted into negative ions at the surface. The calculation of this negative ion produc- tion probability will be discussed in a later section.
3.2 BACKSCATTERING YIELDS. - Experimental data on backscattering yields are for the most part limited to incident energies above 1 keV [62-651. The principal source of theoretical backscattering data is the Marlowe Monte Carlo code developed at Oak Ridge by Robinson and Torrens [66] and by Oen and Robinson [67]. The experimental data has been compared with the results from the Marlowe code for both backscattering and sputtering. The Marlowe code is believed to contain the proper physics for incident energies as low as 10 eV. Since the principal backscattering processes of interest in negative ion research are below 1 keV, one must rely almost entirely upon Marlowe for the relevant data. The Oak Ridge group has made available to Livermore the Marlowe code for negative ion studies. The next few figures summarize the relevant backscattering data.
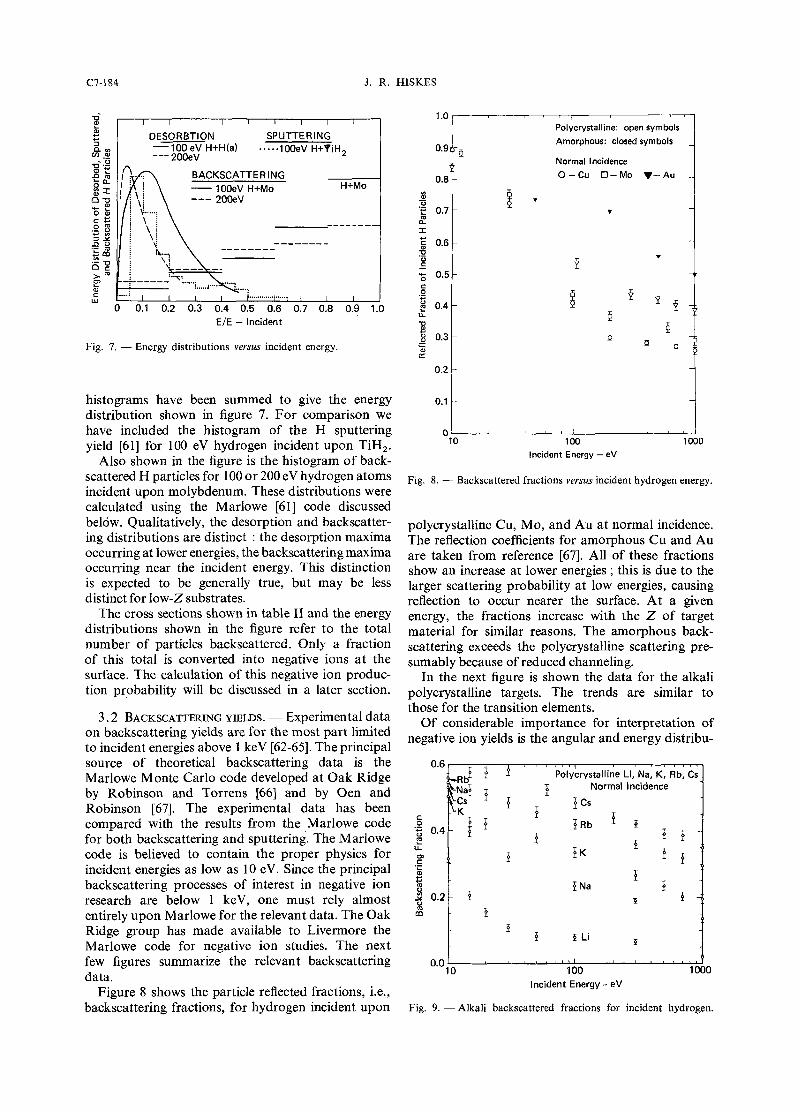
Figure 8 shows the particle reflected fractions, i.e., backscattering fractions, for hydrogen incident upon
Polycrystalline: open symbols Amorphous: closed symbols
Normal lncidence
0.8 0 - C U 0 - M O V - A u
0 1 I I 10 100 1 OD0
lncident Energy - eV
Fig. 8. - Backscattered fractions versus incident hydrogen energy.
polycrystalline Cu, Mo, and Au at normal incidence. The reflection coefficients for amorphous Cu and Au are taken from reference [67]. All of these fractions show an increase at lower energies ; this is due to the larger scattering probability at low energies, causing reflection to occur nearer the surface. At a given energy, the fractions increase with the Z of target material for similar reasons. The amorphous back- scattering exceeds the polycrystalline scattering pre- sumably because of reduced channeling.
In the next figure is shown the data for the alkali polycrystalline targets. The trends are similar to those for the transition elements.
Of considerable importance for interpretation of negative ion yields is the angular and energy distribu-
I
Polycrystalline Li, Na, K, Rb, Cs
1 Normal Incidence
P P cs
P ~b 3 % P I
f 5 - 4 K 1 P
T
0.0 1 I # 10 100 1000
lncident Energy - eV
Fig. 9. -Alkali backscattered fractions for incident hydrogen.
FORMATION OF HYDROGEN NEGATIVE IONS BY SURFACE AND VOLUME C7-185
M Polycrystalline : Normal Incident 10eV H I000 e,V H
I 0.10
Backscattered Energyllncident Energy
Fig. 10. - Energy distribution histograms for back scattered hydrogen.
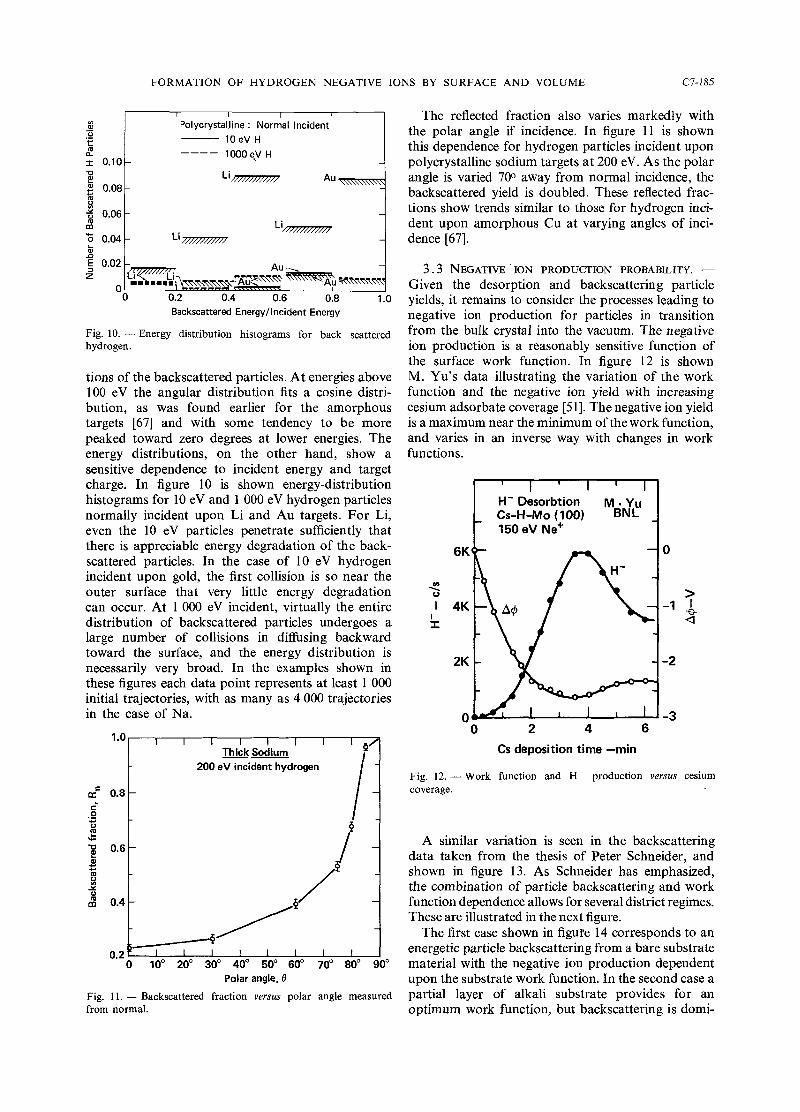
tions of the backscattered particles. At energies above 100 eV the angular distribution fits a cosine distri- bution, as was found earlier for the amorphous targets 1671 and with some tendency to be more peaked toward zero degrees at lower energies. The energy distributions, on the other hand, show a sensitive dependence to incident energy and target charge. In figure 10 is shown energy-distribution histograms for 10 eV and 1 000 eV hydrogen particles normally incident upon Li and Au targets. For Li, even the 10 eV particles penetrate sufficiently that there is appreciable energy degradation of the back- scattered particles. In the case of 10 eV hydrogen incident upon gold, the first collision is so near the outer surface that very little energy degradation can occur. At 1 000 eV incident, virtually the entire distribution of backscattered particles undergoes a large number of collisions in diffusing backward toward the surface, and the energy distribution is necessarily very broad. In the examples shown in these figures each data point represents at least 1 000 initial trajectories, with as many as 4 000 trajectories in the case of Na.
1 .o I I I I I I Thick Sodium
200 eV incident hydrogen
Polar angle, 8
Fig. 11. - Backscattered fraction versus polar angle measured from normal.
The reflected fraction also varies markedly with the polar angle if incidence. In figure 11 is shown this dependence for hydrogen particles incident upon polycrystalline sodium targets a t 200 eV. As the polar angle is varied 700 away from normal incidence, the backscattered yield is doubled. These reflected frac- tions show trends similar to those for hydrogen inci- dent upon amorphous Cu at varying angles of inci- dence [67].
3 . 3 NEGATIVE 'ION PRODUCTION PROBABILITY. - Given the desorption and backscattering particle yields, it remains to consider the processes leading to negative ion production for particles in transition from the bulk crystal into the vacuum. The negative ion production is a reasonably sensitive function of the surface work function. In figure 12 is shown M. Yu's data illustrating the variation of the work function and the negative ion yield with increasing cesium adsorbate coverage [51]. The negative ion yield is a maximum near the minimum of the work function, and varies in an inverse way with changes in work functions.
0 2 4 6
Cs deposition time -min
Fig. 12. -Work function and H - production versus cesium coverage.
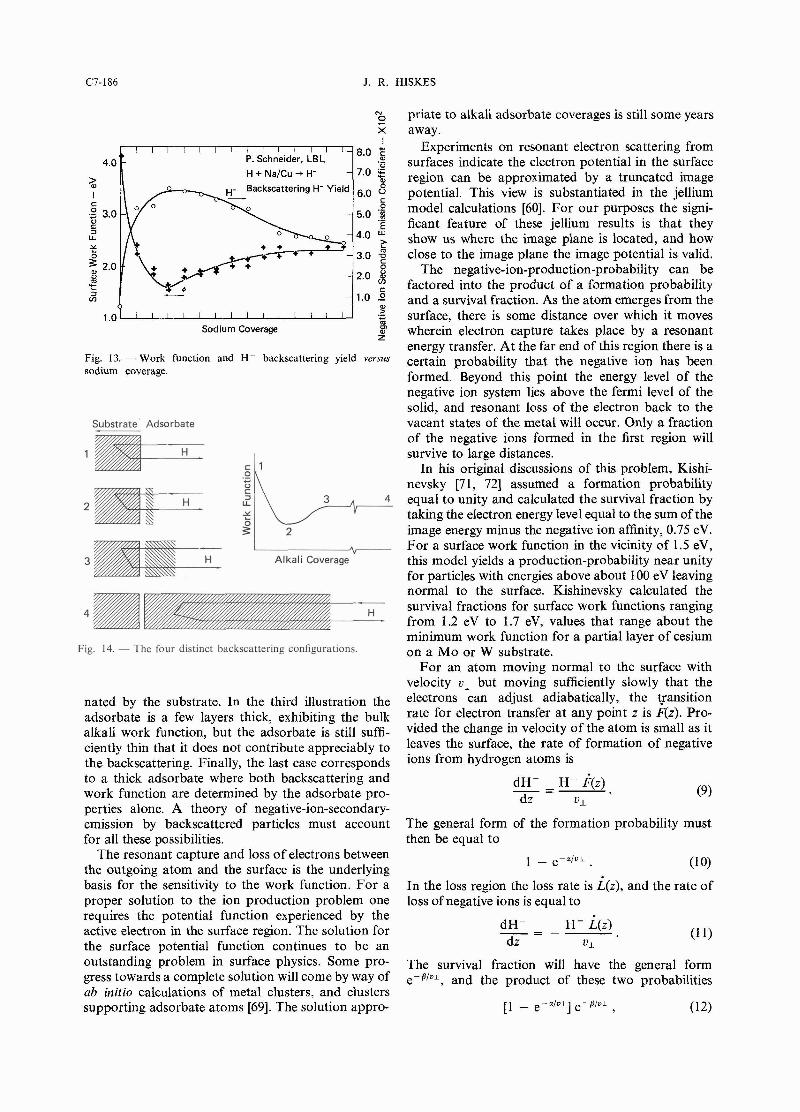
A similar variation is seen in the backscattering data taken from the thesis of Peter Schneider, and shown in figure 13. As Schneider has emphasized, the combination of particle backscattering and work function dependence allows for several district regimes. These are illustrated in the next figure.
The first case shown in figufe 14 corresponds to an energetic particle backscattering from a bare substrate material with the negative ion production dependent upon the substrate work function. In the second case a partial layer of alkali substrate provides for an optimum work function, but backscattering is domi-
C7- 186 J. R. HISKES
. . z X I
I I I I I I I I I I I I I I - P. Schneider, LBL H + Na/Cu + H-
C - 1.0 0
0 m
1.0 " " " " " ' " ' .- +-
Sodium Coverage rn t Fig. 13. - Work function and H - backscattering yield versus sodium coverage.
Substrate' Adsorbate
3 I
Alkali Coverage
normal to the surface. Kishinevsky calculated the survival fractions for surface work functions ranging from 1.2 eV to 1.7 eV, values that range about the
Fig. 14. - The four distinct backscattering configurations.
nated by the substrate. In the third illustration the adsorbate is a few layers thick, exhibiting the bulk alkali work function, but the adsorbate is still suffi- ciently thin that it does not contribute appreciably to the backscattering. Finally, the last case corresponds to a thick adsorbate where both backscattering and work function are determined by the adsorbate pro- perties alone. A theory of negative-ion-secondary- emission by backscattered particles must account for all these possibilities.
The resonant capture and loss of electrons between the outgoing atom and the surface is the underlying basis for the sensitivity to the work function. For a proper solution to the ion production problem one requires the potential function experienced by the active electron in the surface region. The solution for the surface potential function continues to be an outstanding problem in surface physics. Some pro- gress towards a complete solution will come by way of ab initio calculations of metal clusters, and clusters supporting adsorbate atoms [69]. The solution appro-
minimum work function for a partial layer of cesium on a Mo or W substrate.
For an atom moving normal to the surface with velocity v, but moving sufficiently slowly that the electrons can adjust adiabatically, the {ransition rate for electron transfer at any point z is F(z). Pro- vided the change in velocity of the atom is small as it leaves the surface, the rate of formation of negative ions from hydrogen atoms is
The general form of the formation probability must then be equal to
In the loss region the loss rate is ~ ( z ) , and the rate of loss of negative ions is equal to
The survival fraction will have the general form e-PIDL, and the product of t4ese two probabilities
priate to alkali adsorbate coverages is still some years away.
Experiments on resonant electron scattering from surfaces indicate the electron potential in the surface region can be approximated by a truncated image potential. This view is substantiated in the jellium model calculations [60]. For our purposes the signi- ficant feature of these jellium results is that they show us where the image plane is located, and how close to the image plane the image potential is valid.
The negative-ion-production-probability can be factored into the product of a formation probability and a survival fraction. As the atom emerges from the surface, there is some distance over which it moves wherein electron capture takes place by a resonant energy transfer. At the far end of this region there is a certain probability that the negative ion has been formed. Beyond this point the energy level of the negative ion system lies above the fermi level of the solid, and resonant loss of the electron back to the vacant states of the metal will occur. Only a fraction of the negative ions formed in the first region will survive to large distances.
In his original discussions of this problem, Kishi- nevsky [7 1, 721 assumed a formation probability equal to unity and calculated the survival fraction by taking the electron energy level equal to the sum of the image energy minus the negative ion affinity, 0.75 eV. For a surface work function in the vicinity of 1.5 eV, this model yields a production-probability near unity for particles with energies above about 100 eV leaving
FORMATLON OF HYDROGEN NEGATIVE IONS BY SURFACE AND VOLUME C7- 187
is the production probability for a particle emitted from the surface with normal component u,. The values for a and B must be derived from specific models for the surface potential, and contain the dependence on the surface work function.
An accurate calculation of a is quite difficult, a being sensitive to details of the surface potential in a region where the potential is least well known. Provided the ratio alv, is sufficiently large however, the formation probability is close to unity and the overall production probability is not too uncertain. A rough estimate for a is made in references [54] and [55], wherein is derived a formation probability near fifty percent for hydrogen emitted with normal energy component, E,, equal to one hundred eV.
The calculation for f i can be less uncertain. This is because p is dependent upon details of the surface potential at great distances from the surface where surface models are more reliable. In consideration of the calculation of a and p it is worthwhile first to digress and review qualitatively the main features of alkali adsorbates.
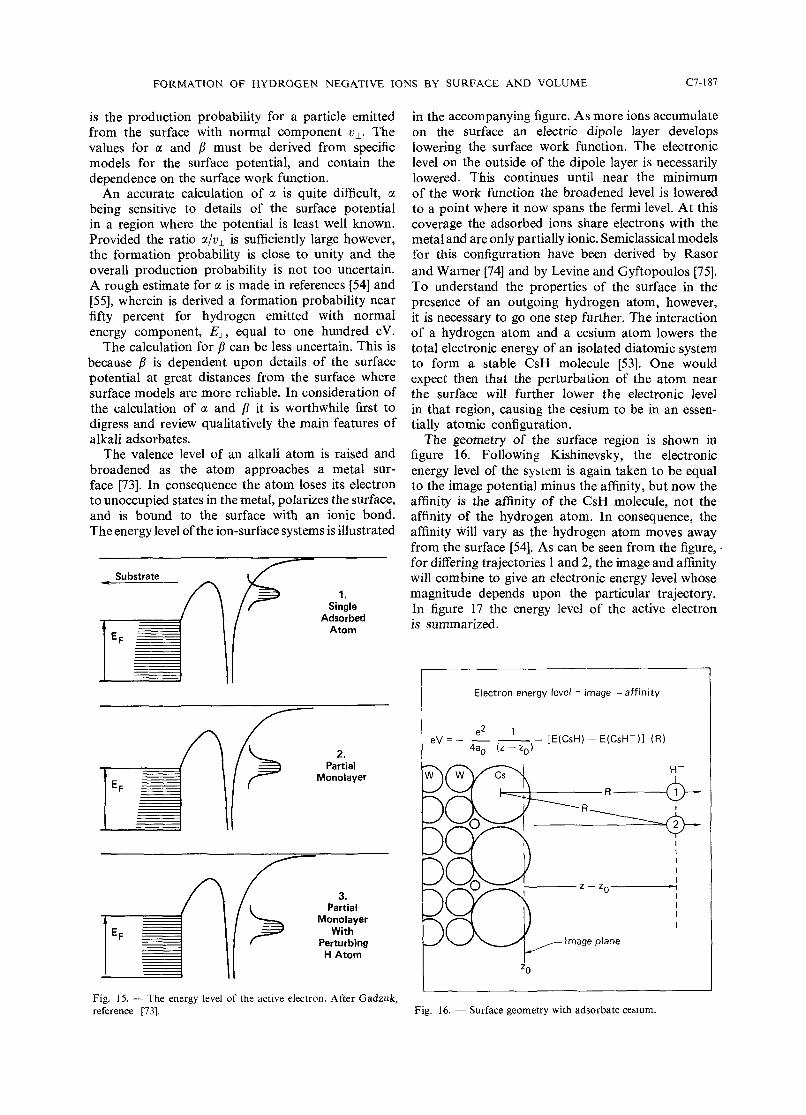
The valence level of an alkali atom is raised and broadened as the atom approaches a metal sur- face [73]. In consequence the atom loses its electron to unoccupied states in the metal, polarizes the surface, and is bound to the surface with an ionic bond. The energy level of the ion-surface systems is illustrated
Atom
in the accompanying figure. As more ions accumulate on the surface an electric dipole layer develops lowering the surface work function. The electronic level on the outside of the dipole layer is necessarily lowered. This continues until near the minimum of the work function the broadened level is lowered to a point where it now spans the fermi level. At this coverage the adsorbed ions share electrons with the metal and are only partially ionic. Semiclassical models for this configuration have been derived by Rasor and Warner [74] and by Levine and Gyftopoulos [75]. To understand the properties of the surface in the presence of an outgoing hydrogen atom, however, it is necessary to go one step further. The interaction of a hydrogen atom and a cesium atom lowers the total electronic energy of an isolated diatomic system to form a stable CsH molecule [53]. One would expect then that the perturbation of the atom near the surface will further lower the electronic level in that region, causing the cesium to be in an essen- tially atomic conliguration.
The geometry of the surface region is shown in figure 16. Following Kishinevsky, the electronic energy level of the system is again taken to be equal to the image potential minus the affinity, but now the affinity is the affinity of the CsH molecule, not the affinity of the hydrogen atom. In consequence, the affinity will vary as the hydrogen atom moves away from the surface [54]. As can be seen from the figure, . for differing trajectories 1 and 2, the image and affinity will combine to give an electronic energy level whose magnitude depends upon the particular trajectory. In figure 17 the energy level of the active electron is summarized.
- [E(CsH) - E(CsH-)I ( R )
I I
I I I
Perturbing Image plane H Atom
F
I
Fig. 15. - The energy level of the active electron. After Gadzuk, reference [73]. Fig. 16. - Surface geometry with adsorbate ceslum.
Electron energy level = image - affinity
C7-188 J . R. HISKES
-
-H'energy level = - -Affinity + image - -
0 2 4 6 8 10 12 14 16 18 20
R /a
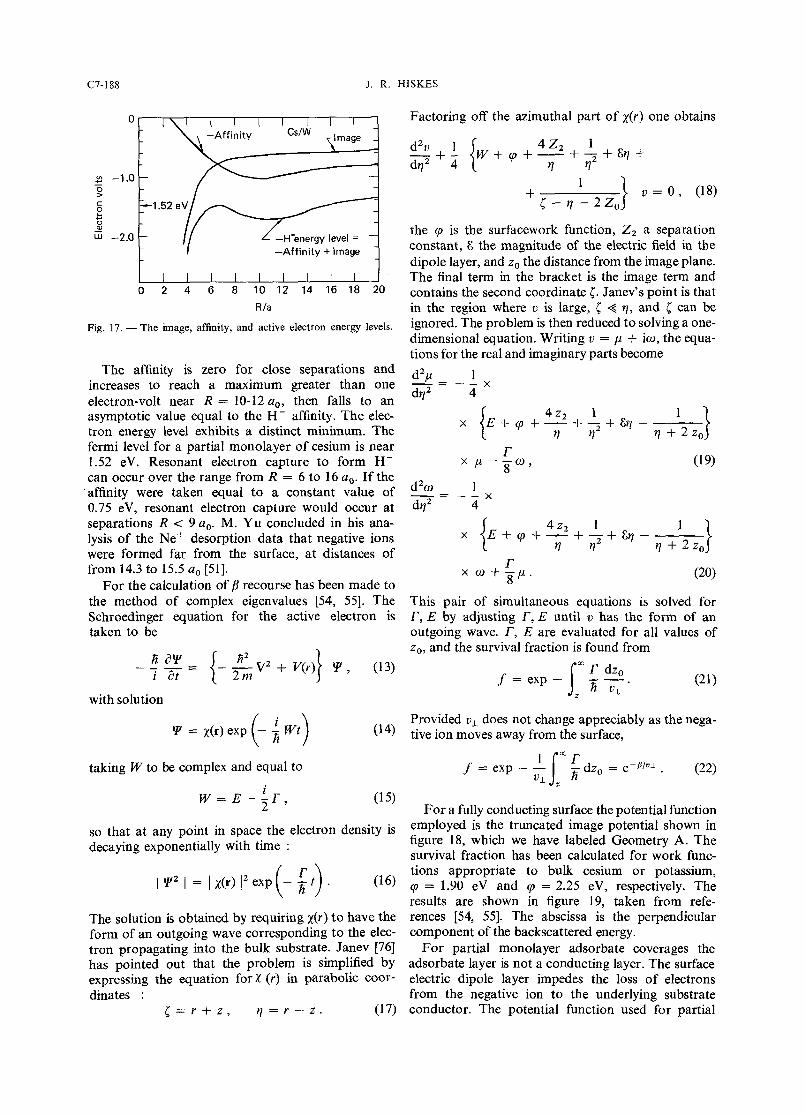
Fig. 17. -The image, affinity, and active electron energy levels.
The affinity is zero for close separations and increases to reach a maximum greater than one electron-volt near R = 10-12 a,, then falls to an asymptotic value equal to the H - affinity. The elec- tron energy level exhibits a distinct minimum. The fermi level for a partial monolayer of cesium is near 1.52 eV. Resonant electron capture to form H- can occur over the range from R = 6 to 16 a,. If the affinity were taken equal to a constant value of 0.75 eV, resonant electron capture would occur at separations R < 9 a,. M. Yu concluded in his ana- lysis of the Nef desorption data that negative ions were formed far from the surface, at distances of from 14.3 to 15.5 a, [51].
For the calculation of p recourse has been made to the method of complex eigenvalues [54, 551. The Schroedinger equation for the active electron is taken to be
with solution
Y = ~ ( r ) exp , - - Wt ( : > taking W to be complex and equal to
so that at any point in space the electron density is decaying exponentially with time :
The solution is obtained by requiring ~ ( r ) to have the form of an outgoing wave corresponding to the elec- tron propagating into the bulk substrate. Janev [76] has pointed out that the problem is simplified by expressing the equation for X (r) in parabolic coor- dinates :
c = r + z , y = r - Z . (1 7)
Factoring off the azimuthal part of ~ ( r ) one obtains
the cp is the surfacework function, Z2 a separation constant, 8 the magnitude of the electric field in the dipole layer, and z, the distance from the image plane. The final term in the bracket is the image term and contains the second coordinate c. Janev's point is that in the region where v is large, [ < y, and c can be ignored. The problem is then reduced to solving a one- dimensional equation. Writing v = p + iw, the equa- tions for the real and imaginary parts become
This pair of simultaneous equations is solved for r , E by adjusting T, E until v has the form of an outgoing wave. T, E are evaluated for all values of z,, and the survival fraction is found from
r dz, f = exp - - - .
h 0,
Provided v, does not change appreciably as the nega- tive ion moves away from the surface,
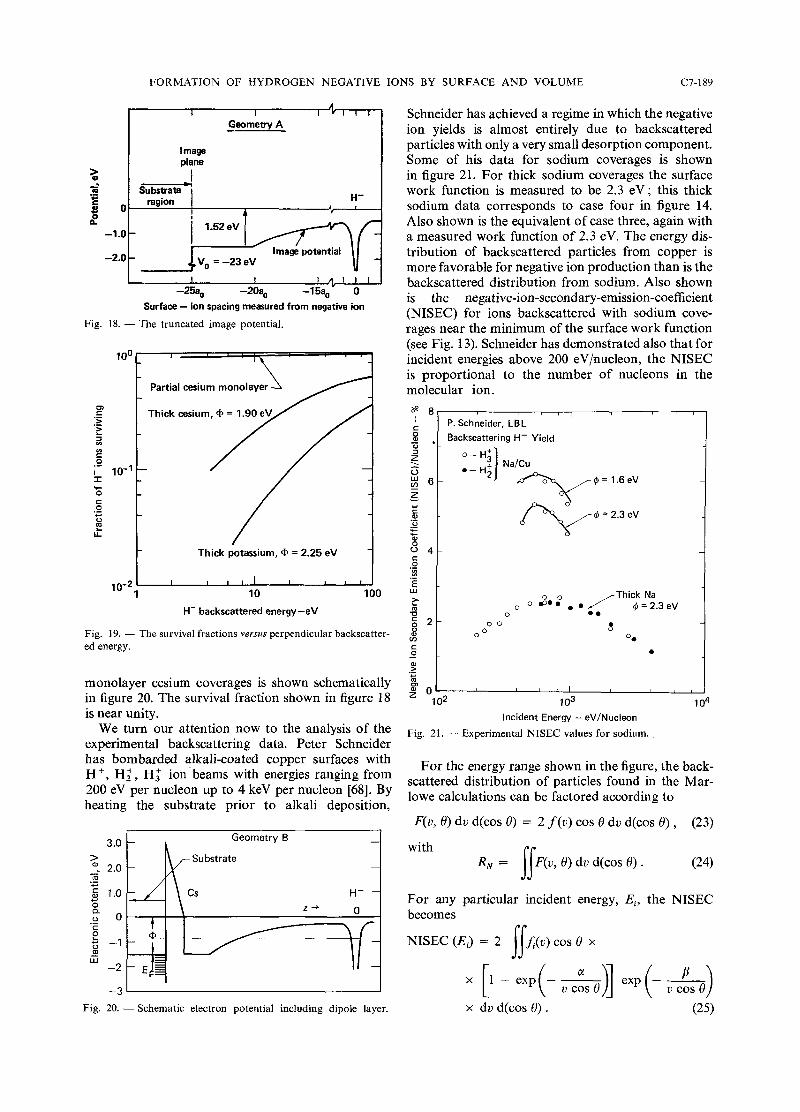
For a fully conducting surface the potential function employed is the truncated image potential shown in figure 18, which we have labeled Geometry A. The survival fraction has been calculated for work func- tions appropriate to bulk cesium or potassium, cp = 1.90 eV and cp = 2.25 eV, respectively. The results are shown in figure 19, taken from refe- rences 1-54, 553. The abscissa is the perpendicular component of the backscattered energy.
For partial monolayer adsorbate coverages the adsorbate layer is not a conducting layer. The surface electric dipole layer impedes the loss of electrons from the negative ion to the underlying substrate conductor. The potential function used for partial
FORMATION OF HYDROGEN NEGATIVE IONS BY SURFACE A N D VOLUME C7-189
I 1 I I . I I I
Geometry A - I I Image I I plane
2 I I Substrate
s
-1.0
Image potential -2.0 V, = -23 eV
I I t I A l I I -25ao -20a0 -15aov 0
Surface - ion spacing measured from negative ion
Fig. 18. - The truncated image potential.
E 0 .-
1 lo-' I
- Partial cesium monolayer -
-
- Thick potassium, @ = 2.25 eV -
I 1 I l l I I
H- backscattered energy -eV
Fig. 19. - The survival fractions versus perpendicular backscatter- ed energy.
monolayer cesium coverages is shown schematically in figure 20. The survival fraction shown in figure 18 is near unity.
We turn our attention now to the analysis of the experimental backscattering data. Peter Schneider has bombarded alkali-coated copper surfaces with Hf, H:, H z ion-beams with energies ranging from 200 eV per nucleon up to 4 keV per nucleon [68]. By heating the substrate prior to alkali deposition,
Geometry B -
H- -
z + 0
\ r -
Schneider has achieved a regime in which the negative ion yields is almost entirely due to backscattered particles with only a very small desorption component. Some of his data for sodium coverages is shown in figure 21. For thick sodium coverages the surface work function is measured to be 2.3 eV; this thick sodium data corresponds to case four in figure 14. Also shown is the equivalent of case three, again with a measured work function of 2.3 eV. The energy dis- tribution of backscattered particles from copper is more favorable for negative ion production than is the backscattered distribution from sodium. Also shown is the negative-ion-secondary-emission-coefficient (NISEC) for ions backscattered with sodium cove- rages near the minimum of the surface work function (see Fig. 13). Schneider has demonstrated also that for incident energies above 200 eV/nucleon, the NISEC is proportional to the number of nucleons in the molecular ion. $ 8 / P. Schneider, LBL
I
Backscattering H- Yield
.; 1 , , , , , , , , , I m 2 0
102 I o3 1 o4 Incident Energy - eV/Nucleon
Fig. 21. - Experimental NISEC values for sodium.
For the energy range shown in the figure, the back- scattered distribution of particles found in the Mar- lowe calculations can be factored according to
F(v, 0) dv d(cos 8) = 2 f (v) cos 0 dv d(cos 0) , (23)
with RN = {SF(v, 8) d~ ~ ( C O S 8) . (24)
For any particular incident energy, E,, the NISEC becomes
NISEC (Ei) = 2 {Sf;(v) cos 6' x
Fig. 20. - Schematic electron potential including dipole layer. x dv ~ ( C O S 0) . (25)
C7-190 J . R. HISKES
Integrating over cos 0, this reduces to an integral over velocity, and scattering a = alv, b = Plv,
NISEC (E,) = 2 - b) (1 - e-")+ae-"1 f0.577 22[(a+ b)'- b2] +(a+ b)' ln(a+ b)- b2 In b +
The velocity distributions of the backscattered par- ticles, J;.(v), are calculated using Marlowe. We then attempt a least-squares fit of eq. (26) to the NISEC data treating the a and /I as adjustable constants. In analogy with linear equations, we would expect to be able to determine the two parameters a and j in the polynomial, eq. (26), by fitting to the NISEC values at two energies, Ei,? On the other hand if we attempt a fit to several data points the a and /I are overdeter- mined. In this latter case one would not in general be able to obtain a good fit unless the fi(u)'s were correct and the functional form for the formation probability and survival fraction were also correct.
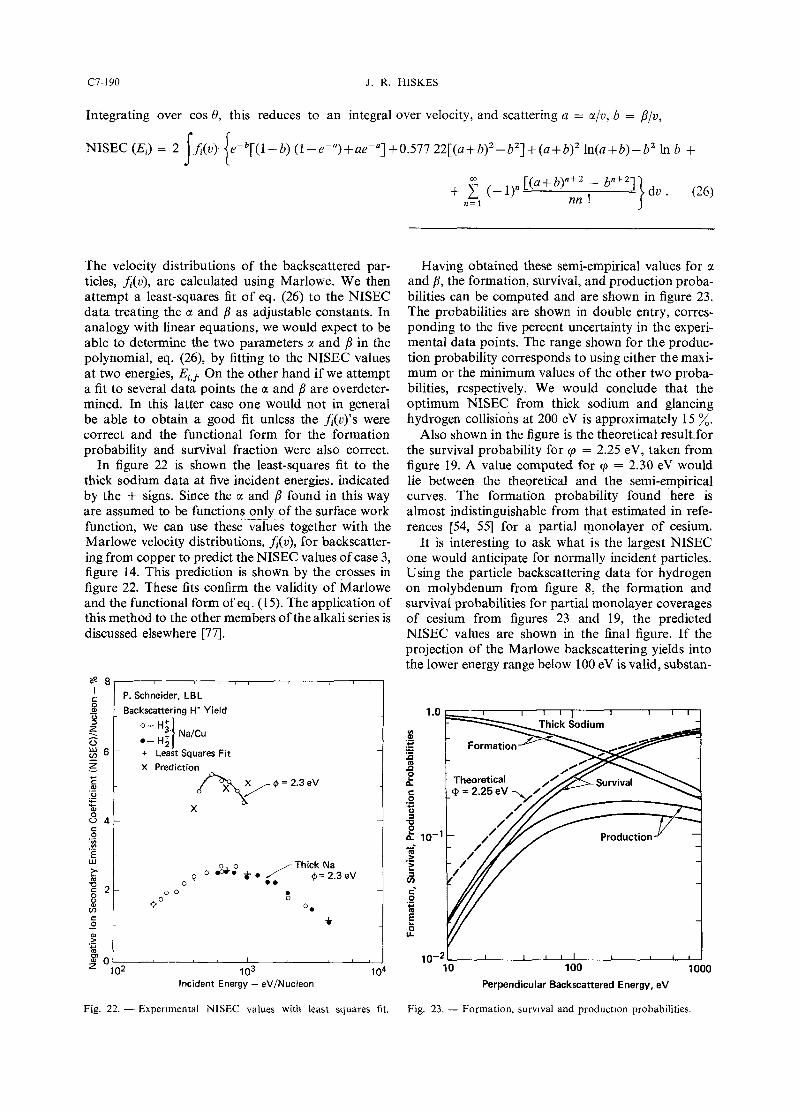
In figure 22 is shown the least-squares fit to the thick sodium data at five incident energies, indicated by the + signs. Since the a and P found in this way are assumed to be functions . . .- only -- . of . the surface work function, we can use these values together with the Marlowe velocity distributions, J;.(v), for backscatter- ing from copper to predict the NISEC values of case 3, figure 14. This prediction is shown by the crosses in figure 22. These fits confirm the validity of Marlowe and the functional form of eq. (15). The application of this method to the other members of the alkali series is discussed elsewhere [77].
8 . 8 1 I P. Schneider, LBL
I
Backscattering H- Yield 0- Hi. - H+ Na/Cu
2 I - + Least Squares Fit
Thick Na o o & ' * * / • + = 2 . 3 e ~
Having obtained these semi-empirical values for a and p, the formation, survival, and production proba- bilities can be computed and are shown in figure 23. The probabilities are shown in double entry, corres- ponding to the five percent uncertainty in the experi- mental data points. The range shown for the produc- tion probability corresponds to using either the maxi- mum or the minimum values of the other two proba- bilities, respectively. We would conclude that the optimum NISEC from thick sodium and glancing hydrogen collisions at 200 eV is approximately 15 %.
Also shown in the figure is the theoretical resultfor the survival probability for cp = 2.25 eV, taken from figure 19. A value computed for cp = 2.30 eV would lie between the theoretical and the semi-empirical curves. The formation probability found here is almost indistinguishable from that estimated in refe- rences [54, 551 for a partial monolayer of cesium.
It is interesting to ask what is the largest NISEC one would anticipate for normally incident particles. Using the particle backscattering data for hydrogen on molybdenum from figure 8, the formation and survival probabilities for partial monolayer coverages of cesium from figures 23 and 19, the predicted NISEC values are shown in the final figure. If the projection of the Marlowe backscattering yields into the lower energy range below 100 eV is valid, substan-
.- G I
Production
Incident Energy - eV/Nucleon Perpendicular Backscattered Energy, eV
Fig. 22. - Experimental NISEC values with least squares fit. Fig. 23. - Formation, surv~val and product~on probabilities.
FORMATION OF HYDROGEN NEGATIVE IONS BY SURFACE AND VOLUME C7-191
tial increases in the NISEC are possible at these lower energies.
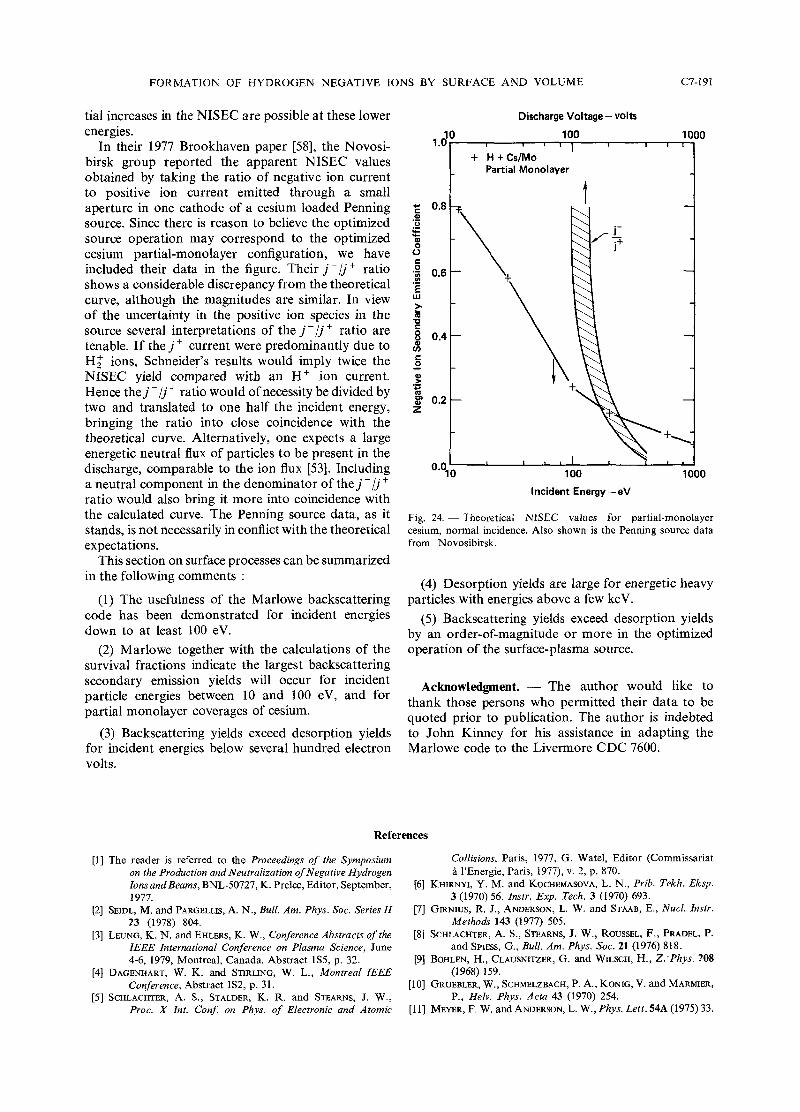
In their 1977 Brookhaven paper [58] , the Novosi- birsk group reported the apparent NISEC values obtained by taking the ratio of negative ion current to positive ion current emitted through a small aperture in one cathode of a cesium loaded Penning source. Since there is reason to believe the optimized source operation may correspond to the optimized cesium partial-monolayer configuration, we have included their data in the figure. Their j - / j + ratio shows a considerable discrepancy from the theoretical curve, although the magnitudes are similar. In view of the uncertainty in the positive ion species in the source several interpretations of the j - / j + ratio are tenable. If the j + current were predominantly due to H z ions, Schneidey's results would imply twice the NISEC yield compared with an H f ion current. Hence the j - / j + ratio would of necessity be divided by two and translated to one half the incident energy, bringing the ratio into close coincidence with the theoretical curve. Alternatively, one expects a large energetic neutral flux of particles to be present in the discharge, comparable to the ion flux [53]. Including a neutral component in the denominator of the j - / j + ratio would also bring it more into coincidence with the calculated curve. The Penning source data, as it stands, is not necessarily in conflict with the theoretical expectations.
This section on surface processes can be summarized in the following comments :
(1) The usefulness of the Marlowe backscattering code has been demonstrated for incident energies down to at least 100 eV.
(2) Marlowe together with the calculations of the survival fractions indicate the largest backscattering secondary emission yields will occur for incident particle energies between 10 and 100 eV, and for partial monolayer coverages of cesium.
(3) Backscattering yields exceed desorption yields for incident energies below several hundred electron volts.
Discharge Voltage- volts
t Partial Monolayer
3
Incident Energy -eV
Fig. 24. - Theoretical NISEC values for partial-monolayer cesium, normal incidence. Also shown is the Penning source data from Novosibirsk.
(4) Desorption yields are large for energetic heavy particles with energies above a few key.
(5 ) Backscattering yields exceed desorption yields by an order-of-magnitude or more in the optimized operation of the surface-plasma source.
Acknowledgment. - The author would like to thank those persons who permitted their data to be quoted prior to publication. The author is indebted to John Kinney for his assistance in adapting the Marlowe code to the Livermore CDC 7600.
References
[I] The reader is referred to the Proceedings of the Symposium on the Production and Neutralization of Negative Hydrogen IonsandBeams, BNL-50727, K . Prelec, Editor, September, 1977.
[2] SEIDL, M. and PARGELLIS, A. N., Bull. Am. Phys. Soc. Series ZI 23 (1978) 804.
[3] LEUNG, K. N. and EHLERS, K. W., Conference Abstracts of the IEEE International Conference on Plasma Science, June 4-6, 1979, Montreal, Canada. Abstract 1S5, p. 32.
[4] DAGENHART, W. K. and STIRLING, W. L., Montreal ZEEE Conference, Abstract 1S2, p. 31.
[5] SCHLACHTER, A. S., STALDER, K. R. and STEARNS, J. W., Proc. X Znt. Conf. on Phys. of Electronic and Atomic
Collisions, Paris, 1977, G. Watel, Editor (Commissariat a I'Energie, Paris, 1977), v. 2, p. 870.
[6] KHIRNYI, Y. M. and KOCHEMASOVA, L. N., Prib. Tekh. Eksp. 3 (1970) 56. Instr. Exp. Tech. 3 (1970) 693.
[7] GIRNIUS, R. J., ANDERSON, L. W. and STAAB, E., Nucl. Instr. Methods 143 (1977) 505.
[8] SCHLACHTER, A. S., STEARNS, J. W., ROUSSEL, F., PRADEL, P. and SPIESS, G., Bull. Am. Phys. Soc. 21 (1976) 818.
[9] BOHLEN, H., CLAUSNITZER, G. and WILSCH, H., Z:Phys. 108 (1968) 159.
[lo] GRUEBLER, W., SCHMELZBACH, P. A,, KONIG, V. and MARMIER, P., Helv. Phys. Acta 43 (1970) 254.
[l l] MEYER, F. W. and ANDERSON, L. W., Phys. Lett. 54A (1975) 33.
C7- 192 J. R. HISKES
[12] CISNEROS, C., ALVAREZ, I., BARNETT, C. F. and RAY, J. A., Phys. Rev. A 14 (1977) 88.
[13] AGAFONOV, Y. A,, D'YACHKW, B. A. and PAVLII, M. A,, Pisma Zh. Tekh. Fiz. 2 (1976) 757. Sov. Tech. Phys. Lett. 2 (1976) 296.
[14] MEYER, F. W., Oak Ridge National Laboratory, Private Com- munication.
[15] D'YACHKOV, B. A,, ZINENKO, V. I. and PAVLII, M. A,, SOV. Phys. Tech. Phys. 16 (1972) 1868.
[16] BARAGIOLA, R. A., SALVATELLI, E. R. and ALONSO, E., Nucl. Znstr. and Meth. 110 (1973) 507.
[17] MOSES, K. G. and FUTCH, A. H., Jr., Bull. Am. Phys. Soc., Ser. 11,344 and Private Communication, 1966.
[18] BERKNER, K. H., LEUNG, D., PYLE, R. V., SCHLACHTER, A. S. and STEARNS, J. W., Nucl. Znstr. and Meth. 143 (1977) 157.
[19] BERKNER, K. H., LEUNG, D., PYLE, R. V., SCHLACHTER, A. S. and STEARNS, J. W., Phys. Letters 64A (1977) 217.
[20] MORGAN, T. J., STONE, J., MAYO, M. and KUROSE, J., Submitted to Phys. Rev. A .
[21] SCHLACHTER, A. S., STALDER, K. R. and STEARNS, J. W., Lawrence Berkeley Laboratory Abstract 9032, Submitted for presentation at the Eleventh International Conference on Electronic and Atomic Collision Processes, Kyoto, Japan, August, 1979.
[22] GELLER, R., JACQUOT, C. and SERMET, P., Brookhaven Proceed- ings, 1977 (ref. [I]), p. 173.
[23] HOOPER, E. B., Jr., ANDERSON, 0 . A., ORZECHOWSKI, T. J. and POULSEN, P., Brookhaven Proceedings, 1977 (ref. [I]), p. 163.
[24] SEMASHKO, N. N., KUSNETSOV, V. V. and KRYLOV, A. I., Brookhaven Proceedings, 1977 (ref. [I]), p. 170.
[25] HOOPER, E. B., Jr. and POULSEN, P., Conference Abstracts of the IEEE International Conference on Plasma Science, June 4-6, 1979, Montreal, Canada. Abstract 1S4, p. 32.
[26] KARO, A. M., GARDNER, M. A. and HISKES, J. R., J. Chem. Phys. 68 (4) (1978) 1942.
[27] HISKES, J. R., KARO, A. M., WILLMAN, P. A. and STEVENS, W. B., Phys. Lett. 68A (1978) 221.
[28] STEVENS, W. B. and KARO, A. M., A Pseudo-Potential Calcu- lation of the Ground States ofthe Alkali Hydrides and Their Negative Ions, Submitted for Publication.
[29] OLSON, R. E., SHIPSEY, E. J. and BROWNE, J. C., Phys. Rev. A 13 (1976) 180.
[30] JANEV, R. K. and RADULOVIC, Z. M., Phys. Rev. A 17 (1978) 889.
[31] SCHLACHTER, A. S., BJORKHOLM, P. J., LOYD, D. H., ANDERSON, L. W. and HAEBERLI, W., Phys Rev. 177 (1969) 184.
[32] CISNEROS, C., ALVAREZ, I., BARNETT, C. F. and RAY; J. A., Phys. Rev. A 14 (1976) 76.
[33] CLSNEROS, C., ALVAREZ, I., GARCIA G., R., BARNETT, C. F., RAY, J. A. and RUSK, A,, Phys. Rev. A 19 (1979) 631.
[34] BACAL, M., NICOLOPOULOU, E. and DOUCET, H. J., Brookhaven Proceedings, 1977 (ref. [I]), p. 26.
[35] BACAL, M. and HAMILTON, G. W., Phys. Rev. Lett. 42 (1979) 1538.
[36] FREE, R; P. and HISKES, J. R., Phys. Rev. A 2 (1970) 573. [37] BUCKLEY, B. D. and BOTTCHW, C., Submitted for publication
in Journal of Physics B, Letters, and Private Communi- cation.
[38] For a more detailed discussion of the atomic processes occurring in this hydrogen discharge see
HISKES, J. R., BACAL, M. and HAMILTON, G. W., Lawrence Livermore Laboratory Report UCID-1803 1, January 1979.
[39] PEART, B., FORREST, R. A. and DOLDER, K., Srlbmitted for publication in Journal of Physics, B, and Private Commu- nication.
[40] PEART, B. and DOLDER, K. T., J. Phys. B. 7 (1974) 1948. [41] KULANDER, K. C. and GUEST, M. F., Submitted for publication
to Journ. of Physics, B.
[42] VOGLER, M., Phys. Rev. A 19 (1979) 1. [43] ALLAN, M. and WONG, S. F., Phys. Rev. Letters41 (1978) 1791. [44] WADEHRA, J. M. and BARDSLEY, J. N., Phys. Rev. Letters 41
(1978) 1795 and Private Communication. [45] FLANNERY, M. R., TAI, H. and ALBRITTON, D. L., Atomic
Data and Nuclear Data Tables 20 (1977) 563. 1461 VILLAREJO, D., Journ. Chem. Phys. 49 (1968) 2523. [47] BELCHENKO, Y. I., DIMOV, G. I. and DUDNKOV, V. G., Pro-
ceedings of the Second Symposium on Ion Sources and Formation of Ion Beams, LBL-3399, Berkeley, California, October 1974.
[48] SLUYTERS, T., Proc. of Second Berkeley Symposium, October 1974.
[49] BELCHENKO, Y. I., DIMOV, G. I. and DUDNIKOV, V. G., Nuclear Fusion 14 (1974) 113.
[50] BENDER, E. D., DIMOV, G. I. and KISHINEVSKY, M. E., Preprint IYaF 75-9, Nuclear-Physics Institute, Siberian Division, Academy of Sciences of the USSR, Novosibirsk (1975). Papers of the First All-Union Seminar on Secondary Ion- Ion Emission, Kharkov, 1975.
[51] Yu, M. L., Proc. of Brookhaven Symposium, 1977, p. 48. Phys. Rev. Letter 40 (1978) 574.
[52] WIESEMANN, K., Proc. of Brookhaven Symposium,_l977, p. 97. [53] HISKES, J. R., KARO, A. M. and GARDNER, M. A., Journ. Applied
Physics 47 (1976) 3888. [54] HISKES, J. R. and KARO; - A. M., US-USSR Negative Ion
workshop, May-June 1977, Moscow ; UCRL-79521, May 1977.
[55] HISKES, J. R. and KARO, A. M., Proc. of Brookhaven Sympo- sium, 1977, p. 42.
[56] SCHNEIDER, P. J., BERKNER, K. H., GRAHAM, W. G., PYLE, R. V. and STEARNS, J. W., Proc. of Brookhaven Symposium, 1977, p. 63.
[57] GRAHAM, W. G., Bull. Am. Phys. Soc., Series 2 23 (1978) 804. [58] BELCHENKO, Y. I., DIMOV, G. I. and DUDNIKOV, V. G., Proc.
of the Brookhaven Symposium, 1977, p. 79. [59] Panel Session, Proc. of the Brookhaven Symposium, 1977,
p. 151. [60] YMG, S. C., SMITH, J. R. and KOHN, W., Phys. Rev. B11
(1975) 1483. [61] OEN, 0 . S. and ROBINSON, M. T., Journ. of Nucl. Materials
76,77 (1978) 370. [62] ECKSTEIN, W. and VERBEEK, H., Journ. of Nucl. Materials
76, 77 (1978) 365. [63] Hou, M., ECKSTEIN, W. and VERBEEK, H., Radiation Eflects
39 (1978) 107. [64] BEHRISCH, R., Surface Erosion From Plasma Materials Inter-
action to be published in Journ. of Nucl. Materials, 1979. [65] TAGLAUER, E., BEITAT, U. and HEILAND, W., Nucl. Instr. and
Methods 149 (1978) 605. [66] ROBINSON, M. T. and TORRENS, I. M., Phys. Rev. B 9 (1974)
5008. [67] OEN, 0. S. and ROBINSON, M. T., Nucl. Instr. and Methods
13? (1976) 647. [68] SCHNEIDER, P., Ph. d. Thesis, Dept. of Physics, Univ. of Cali-
fornia, Berkeley, CA, 1979. [69] UPTON, T. H. and GODDARD, W. A., III Phys. Rev. Letters
42 (1979) 472. [70] MCRAE, E. G., Bull. of Am. Phys. Soc., Series 2 24 (1979) 260. [71] KISHINEVSKY, M. E., Preprint No. 116-73, Znst. of Nuclear
Physics, Siberian Academy of Sciences, Novosibirsk, 1973.
[72] KISHMEVSKY, M. E., Journ. of Tech. Phys. 48 (1978) 773. [73] GADZUK, J. W., Surface Science 6 (1967) 133. [74] RASOR, N. S. and WARNER, C., Journ. of Appl. Phys. 35 (1964)
2589. [75] LEVINE; J. D. and GYFTOPOULOS, E. P., Surface Science 1
(1963) 171. [76] JANEV, R. K., Surface Science 45 (1974) 609. [77] HISKES, J. R. and SCHNEWER, P., TO be published.