
Gas Phase Negative Ion Chemistry: Reactivity and Mechanism ...
211
University of Colorado, Boulder CU Scholar Chemistry & Biochemistry Graduate eses & Dissertations Chemistry & Biochemistry Spring 1-1-2011 Gas Phase Negative Ion Chemistry: Reactivity and Mechanism in Fundamental Organic Reactions John Michael Garver University of Colorado at Boulder, [email protected] Follow this and additional works at: hp://scholar.colorado.edu/chem_gradetds Part of the Chemistry Commons is Dissertation is brought to you for free and open access by Chemistry & Biochemistry at CU Scholar. It has been accepted for inclusion in Chemistry & Biochemistry Graduate eses & Dissertations by an authorized administrator of CU Scholar. For more information, please contact [email protected]. Recommended Citation Garver, John Michael, "Gas Phase Negative Ion Chemistry: Reactivity and Mechanism in Fundamental Organic Reactions" (2011). Chemistry & Biochemistry Graduate eses & Dissertations. Paper 37.
Transcript of Gas Phase Negative Ion Chemistry: Reactivity and Mechanism ...
University of Colorado, BoulderCU ScholarChemistry & Biochemistry Graduate Theses &Dissertations Chemistry & Biochemistry
Spring 1-1-2011
Gas Phase Negative Ion Chemistry: Reactivity andMechanism in Fundamental Organic ReactionsJohn Michael GarverUniversity of Colorado at Boulder, [email protected]
Follow this and additional works at: http://scholar.colorado.edu/chem_gradetds
Part of the Chemistry Commons
This Dissertation is brought to you for free and open access by Chemistry & Biochemistry at CU Scholar. It has been accepted for inclusion inChemistry & Biochemistry Graduate Theses & Dissertations by an authorized administrator of CU Scholar. For more information, please [email protected].
Recommended CitationGarver, John Michael, "Gas Phase Negative Ion Chemistry: Reactivity and Mechanism in Fundamental Organic Reactions" (2011).Chemistry & Biochemistry Graduate Theses & Dissertations. Paper 37.

Gas Phase Negative Ion Chemistry: Reactivity and Mechanism
in Fundamental Organic Reactions
by
John M. Garver
B. S., United States Air Force Academy, 1992
M. S., Wright State University, 1995
A thesis submitted to the Faculty of the Graduate School
of the University of Colorado in partial fulfillment
of the requirements for the degree of
Doctor of Philosophy
Department of Chemistry and Biochemistry
2011
This thesis entitled:
Gas Phase Negative Ion Chemistry: Reactivity and Mechanism
in Fundamental Organic Reactions
Written by John M. Garver
has been approved for the
Department of Chemistry and Biochemistry
by
_______________________________________
Veronica M. Bierbaum
_______________________________________
W. Carl Lineberger
_______________________________________
G. Barney Ellison
_______________________________________
J. Mathias Weber
_______________________________________
Heather J. Lewandowski
Date: July 08, 2011
A final copy of this thesis has been examined by all signatories, and we find that both the content
and the form meet acceptable presentation standards of scholarly work in the above mentioned
discipline.

iii
Garver, John M. (Ph.D. Physical Chemistry)
Gas Phase Negative Ion Chemistry: Reactivity and Mechanism in Fundamental Organic
Reactions
Thesis directed by Professor Veronica M. Bierbaum
Abstract:
Numerous experimental and theoretical studies have probed reactions using gas phase ion
chemistry to develop an intrinsic understanding of kinetics, mechanisms and structure-energy
relationships. The fundamental knowledge gained from these studies allows predictive tools to
be developed for understanding chemical systems (earth’s atmosphere, biological, etc.). This
thesis describes the reactive characteristics and competitive processes within several organic
ion-molecule reactions. An overview of the basic principles of gas phase ion-molecule reactions
and the experimental methods employed in our studies are given in Chapters 1-2.
In Chapter 3, comparisons of the reactivity and mechanistic pathways between the
reactions of alkyl iodides with CN¯ in the gas phase and several solvents are reported. The
mechanistic results are strikingly similar; however, a tighter gas phase transition state is
suggested.
In Chapter 4, competition between the substitution (SN2) and elimination (E2) reactions
of alkyl iodides with Cl¯, CN¯, and HS¯ is evaluated. Contrary to previous studies, our results
reveal competition between the SN2 and E2 pathways. Discussions cover reaction efficiencies,
kinetic isotope effects, linear basicity-reactivity relationships, electrostatic models, and transition
state looseness parameters.
In Chapter 5, our investigation of the α-effect in the gas phase shows enhanced validating
an intrinsic origin of the effect. Variations in electron affinities and bond strengths between the
normal and α-anions indicate that HOO¯ has distinctive thermochemical properties.

iv
In Chapter 6, we apply Marcus theory in an attempt to resolve discrepancies between
experimental and computational studies on the existence of the α-effect in SN2 reactions with
CH3Cl. Marcus theory indicates that the intrinsic differences between normal and α-nucleophiles
are small and can be easily masked by thermodynamic driving forces.
In Chapter 7, we explore the intrinsic behavior of α-nucleophiles in competitive reaction
mechanisms. The α-effect is not seen in the E2 mechanism, but is reported for nucleophilic
attack at both sp2 and sp
3 carbon sites. This is rationalized by “soft” base behavior.
In Chapter 8, the reactivity of 1,3,5-triazine is investigated. Significant hydride acceptor
properties are observed. Anion-arene binding modes and their influence on reaction pathways
are discussed.

Dedicated to My Family:
Gretchen, Zach, Tyler,
Nick and Anna
You are a gift from God.
Thank you for the inspiration, comfort,
and joy you bring to my life every day.
Nothing in the world can take the place of Persistence.
Talent will not; nothing is more common than unsuccessful
men with talent. Genius will not; unrewarded genius is
almost a proverb. Education will not; the world is full of
educated derelicts. Persistence and determination alone
are omnipotent. The slogan 'Press On' has solved and
always will solve the problems of the human race.
- Calvin Coolidge
(30th president of US, 1872 - 1933)

vi
Acknowledgements
This thesis would not be possible without the help and support from many people, who directly
or indirectly have contributed to this achievement.
Firstly, I would like to express my gratitude to my supervisor, Veronica Bierbaum, who gave me
the opportunity to work under her supervision and benefit from her experience, knowledge and
vision. Working with you has been truly rewarding and has allowed me to grow not only
scientifically, but also personally. I really appreciated your caring and patience. Thank you for
always being there when I needed help and for all the useful life discussions.
I would also like to thank my USAFA sponsors, Mike Van Valkenburg and Don Bird, for giving
an old dog a chance to learn new tricks. Yes, I did find myself asking what the heck I did going
to grad school, but your faith paid off. I can’t wait to rejoin my USAFA family.
A very special thanks goes to Chuck DePuy and Kristine Kelly for your kindness and support.
Chuck, your words of encouragement were just as valuable as your insightful discussions.
Kristine, your “been there, done that” helped carry me through the most frustrating moments.
I need to send many thanks to Don David, Shuji Kato and Scott Gronert for the mentoring and
advice during my time at CU.
I am also very grateful to my classroom instructors (Mathias Weber, David Jonas, Niels
Damrauer, Rex Skodje, and David Nesbitt) and classmates (Patrick, Paul, Sydney, Younghee,
and Dan). Niels and Mathias, thanks for the patience and willingness to help during the many
office hours. Pat, thanks for all the “nuggets” and helping me dig for gold.

vii
The friendship and help of the Bierbaum, Ellison, Lineberger, Weber Super Group was
phenomenal. What a great group of Professors to serve as mentors and surrogate advisors. I
send a special thanks to Jesse Marcum for his help throughout the program.
To the Bierbaum Lab I bequeath… Nicole, Steph, Oscar, Nick, Callie, Charles, Ben, Zhibo and
Nadine, thanks for all the memories! Nicole, thanks for training me on the FA-SIFT. Oscar, can
you find the secret word buried in the thesis? Everyone else, good luck, have fun and take care
of Ronnie.
This list would be incomplete (and probably still is anyway) without acknowledging my parents,
who have always encouraged me to achieve great heights.
Lastly, I owe a huge debt of gratitude to my wife, Gretchen, and my family for their love and
support.
viii
Table of Contents
Chapter 1: Gas-Phase Ion-Molecule Reactions 1
1.1 Introduction 2
1.2 Fundamentals of Physical Organic Chemistry 3
1.2.1 Models of Chemical Bonding 4
1.2.1.1 Hybridized Orbitals 4
1.2.1.2 Electrostatic Models 6
1.2.1.3 Molecular Orbital Theory 7
1.3 Gas Phase Kinetics and Thermodyanamics 9
1.3.1 Double-Well Potential Energy Surface 10
1.3.2 Negative Ion Cycle/Gas Phase Acidity 11
1.3.3 Linear Free-Energy Relationships 12
1.4 References 14
Chapter 2: Experimental Methods and Techniques 15
2.1 Introduction 16
2.2 Flowing Afterglow-Selected Ion Flow Tube Mass Spectrometer 16
2.2.1 Ion Source Region 17
2.2.2 Reaction Flow Tube 18
2.2.3 Detection Region 18
2.2.4 Rate Constant Determination and Error Analysis 19
2.2.5 Branching Fractions 20
2.3 Kinetic Isotope Effects 21
2.4 Collision-Induced Dissociation 23
2.5 Determining Gas Phase Acidity/Proton Affinity 24
2.5.1 Equilibrium Method (Keq = kf/kr) 25
2.5.2 Bracketing Method 25
2.5.3 Kinetic Method 26
2.6 References 28
Chapter 3: A Direct Comparison of Reactivity and Mechanism in the Gas Phase 29
and in Solution
3.1 Introduction 30
3.2 Experimental 34
3.2.1 Gas Phase Experimental 34
3.2.2 Condensed Phase Experimental 35
3.2.3 Computational Methods 36
3.3 Results and Discussion 37
3.3.1 Gas Phase Reactions 37
3.3.2 Condensed Phase Reactions 39
3.3.3 Comparison of Gas Phase and Solution Results 41
3.4 Conclusion 48
3.5 References 49
ix
Chapter 4: Mechanistic Investigation of SN2 Dominated Gas Phase 51
Alkyl Iodide Reactions
4.1 Introduction 52
4.2 Experimental 56
4.2.1 Ion-Molecule Reactions 56
4.2.2 Computational Methods 57
4.3 Results and Discussion 58
4.3.1 Experimental Data 58
4.3.2 Reactivity Trends 59
4.3.3 Multipole Electrostatic Model 63
4.3.4 Estimated Relative Free-Energy Barrier Heights 66
4.3.5 Kinetic Isotope Effects 67
4.3.6 Computational Work 69
4.3.7 Looseness Parameter and Electrostatic Model 71
4.4 Conclusion 73
4.5 References 75
Chapter 5: Experimental Validation of the α-effect in the Gas Phase 77
5.1 Introduction 78
5.2 Experimental 80
5.3 Results and Discussion 80
5.3.1 Kinetic Data 80
5.3.2 Evaluating the α-effect 82
5.3.3 Common Scale for Acidity/Basicity (Condensed and Gas Phase) 83
5.3.4 Variations in Electron Affinities and Homolytic Bond Strengths 85
5.4 Conclusion 86
5.5 References 87
Chapter 6: Resolving the α-effect in Gas Phase SN2 Reactions: A Marcus Theory 89
Approach
6.1 Introduction 91
6.2 Experimental 95
6.2.1 Ion-Molecule Reactions 95
6.2.2 Materials 96
6.2.3 Computational Methods 96
6.2.4 Marcus Barrier Calculations 97
6.3 Results and Discussion 97
6.3.1 Brønsted Correlation 97
6.3.2 Marcus Theory (Variations in Intrinsic Nature of Anions) 99
6.3.3 Marcus Theory (Convergence of Overall Activation Barriers) 100
6.3.4 Overall and Intrinsic Barriers 102
6.3.5 Molecular Electron Affinity (Ease of Electron Transfer) 107
6.3.6 Variations in Solvent Effects 108
6.4 Conclusion 109
6.5 References 111
x
Chapter 7: Intrinsic Reactivity and the α-effect in Elimination Reactions 113
and Competing Mechanisms in the Gas Phase
7.1 Introduction 114
7.2 Experimental 119
7.2.1 Ion-Molecule Reactions 119
7.2.2 Materials 120
7.2.3 Computational Methods 120
7.3 Results and Discussion 121
7.3.1 Brønsted Correlation (E2 Mechanism) 121
7.3.2 Reagent Pairing [FCH2CH2O¯, C6H5CH2O¯, (CH3)3COO¯] 124
7.3.2.1 SN2 Reactions 124
7.3.2.2 E2 Reactions 126
7.3.3 Dimethyl Methylphosphonate 127
7.3.4 Methyl Formate 130
7.4 Conclusion 135
7.5 References 138
Chapter 8: Gas Phase Reactions of 1,3,5-Triazine: Proton Transfer, Hydride 141
Transfer and Anionic σ-Adduct Formation
8.1 Introduction 142
8.2 Experimental 146
8.2.1 Ion-Molecule Reactions 146
8.2.2 Collision-Induced Dissociation 147
8.2.3 H/D Exchange 148
8.2.4 Materials 148
8.2.5 Computational Methods 148
8.3 Results and Discussion 149
8.3.1 Elucidation of Structure, Mechanisms, and Energetics 149
8.3.2 Reactivity of 1,3,5-Triazine 157
8.3.3 Potential Energy Surface of 1,3,5-Triazine Reactions 162
8.4 Conclusion 167
8.5 References 169
Appendix 1 Calculation of the E2 Branching Fraction, Optimized Reaction Geometries 172
Appendix 2 Exothermicities and Computational Reaction Barriers, Covalent 177
Potential Electronegativity Scale
Appendix 3 Reaction coordinate plot for the reaction of methoxide with methyl formate 178
Appendix 4 Covalent α-Adduct Geometries, SIFT-CID ratios for reference acid/ 179
1,3,5-triazinide clusters
Bibliography 182
xi
List of Figures
Figure 1.1 Hybridization. a) Forming sp, sp2 and sp
3 hybrid orbitals and b) sigma (σ) 5
and pi (π) bonding in hybrid orbitals.
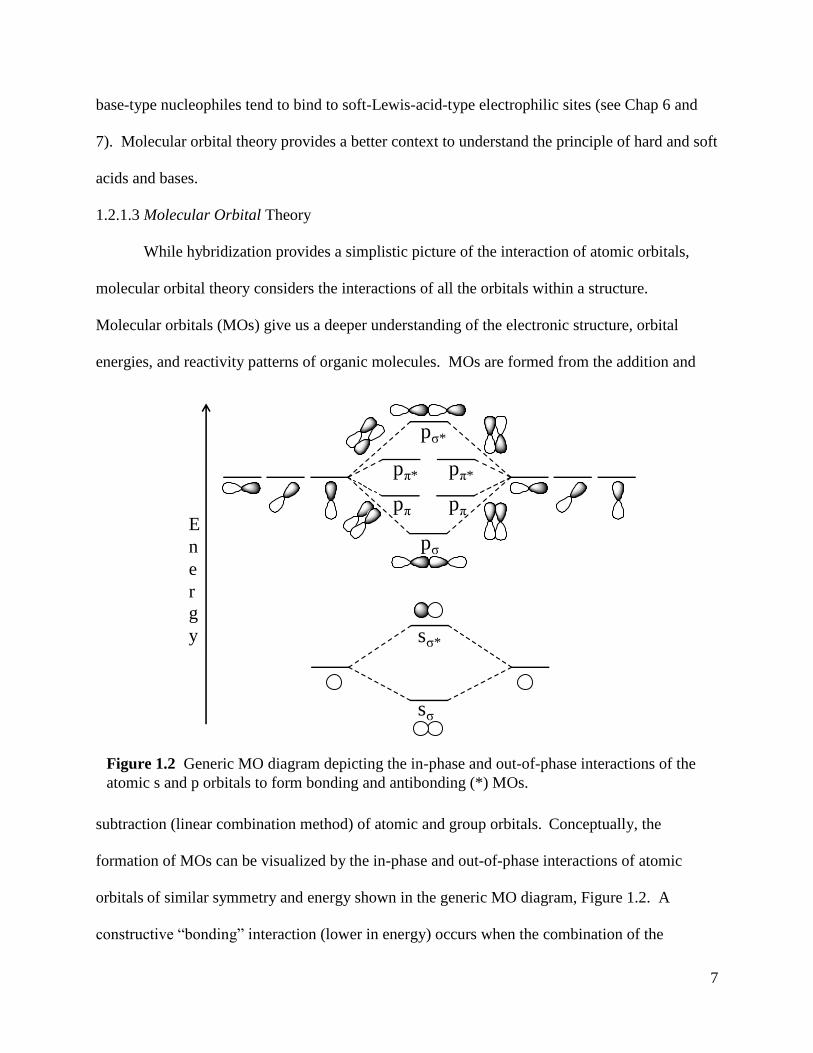
Figure 1.2 Generic MO diagram depicting the in-phase and out-of-phase interactions 7
of the atomic s and p orbitals to form bonding and antibonding (*) MOs.
Figure 1.3 Hard Soft Acid Base (HSAB) interactions using frontier molecular orbital 8
theory.
Figure 1.4 Gas Phase Double-Well Potential Energy Model. 10
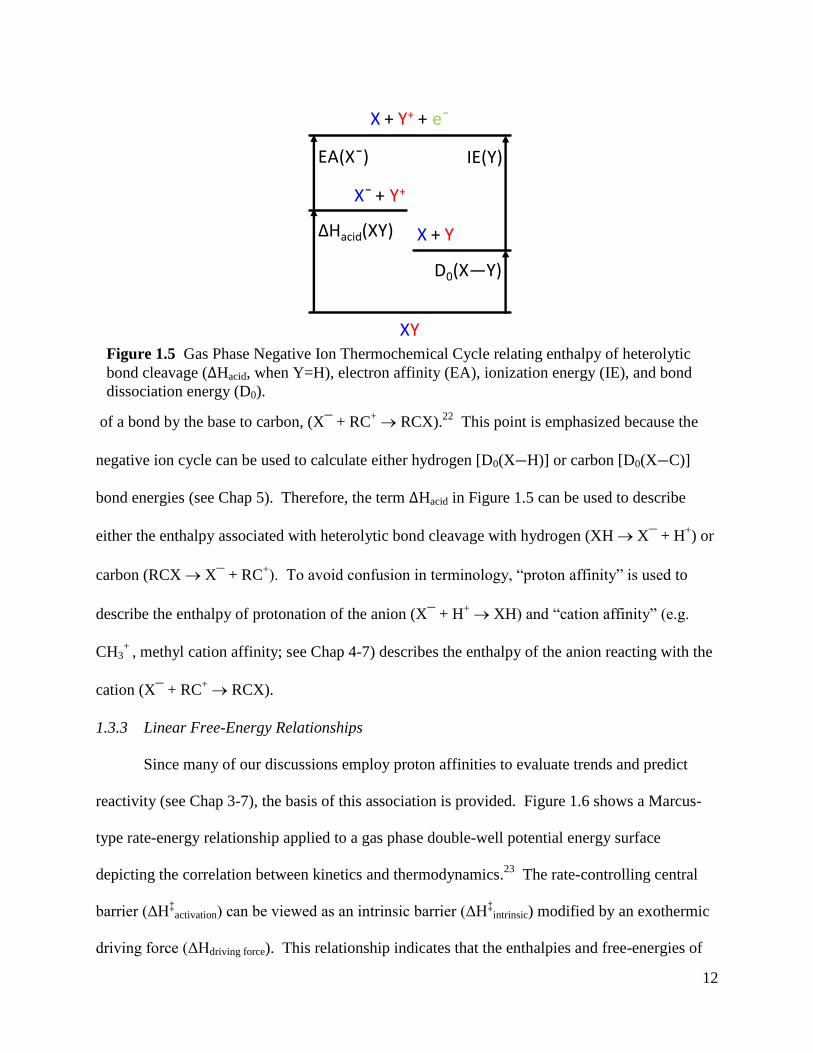
Figure 1.5 Gas Phase Negative Ion Thermochemical Cycle relating enthalpy of 12
deprotonation (ΔHacid), electron affinity (EA), ionization energy (IE),
and bond dissociation energy (D0).
Figure 1.6 Marcus-type rate-energy relationship applied to a gas phase double-well 13
potential energy surface depicting the correlation between kinetics and
thermodynamics.
Figure 2.1 Flowing Afterglow-Selected Ion Flow Tube (FA-SIFT) Mass Spectrometer. 17
Figure 2.2 Schematic diagram of potential energy surfaces indicating the Ea or the 22
“activation barrer” for hydrogen and deuterium labeled compounds and
associated transition states (TS) upon transition from (a) reactant to
(b) a tight TS (e.g., SN2 TS) or (c) a “loose” transition state (e.g., E2 TS).
Figure 2.3 Relative yield of precursor and fragment ions from collision-induced 24
dissocation as a function of relative kinetic energy and an estimate of the
threshold dissociation energy from the onset of fragmentation.
Figure 2.4 Bracketing Method. The reactivity of 1,3,5-triazine, H3C3N3, lies between 26
water and cyclopentanol, therefore is assigned a gas phase acidity
of 374.9 ± 9.1 kcal mol-1
.
Figure 2.5 Kinetic Method. Potential energy surface for the proton bound dimeric ion 27
depicting competitive dissociation between acids (A1H and A2H) upon
collision-induced activation.
Figure 3.1 Potential energy diagram of a generic SN2 reaction in the gas phase 30
(curve a), in an aprotic solvent (curve b), and in a protic solvent (curve c).
Figure 3.2 Plot of the dielectric constant (ε) vs. the activation energy for the 47
Cl− + CH3Cl SN2 reaction, ΔE
‡(ε)MP2(fc)/6-31+G(d), in various solvents.

xii
Figure 4.1 The logarithm of reaction efficiency (krxn/kcol) at 298 K versus the anion 61
proton affinity (ΔH298) for (a) the SN2 reaction of Nu– with CH3I and
(b) the E2 reaction of Nu– with t-C4H9I.
.
Figure 4.2 Qualitative depiction of relative SN2 barrier heights for CH3Cl and the E2 66
barrier heights for t-C4H9I estimated from the basicity-reactivity baselines.
Figure 5.1 Magnitude of the α-effect for HOO¯ (PA = 1575 kJ mol-1
) relative to 83
CH3O¯ (PA = 1598 kJ mol-1
) and C2H5O¯ (PA = 1585 kJ mol-1
).
Figure 5.2 Suppression of the differences in relative free energies of deprotonation in 84
aqueous solution [∆ΔG = ΔGacid(X¯) − ΔGacid(HOO¯) for both the gas
phase and aqueous solution in kJ mol-1
].
Figure 6.1 Application of Marcus theory to a generic gas-phase SN2 potential energy 93
surface depicting a) the “intrinsic” central barrier (ΔH‡
intrinsic) of a
thermoneutral identity reaction compared to b) the lowering of the intrinsic
barrier by a thermodynamic driving force (ΔH‡
driving force) in an exothermic
non-identity reaction to produce a modified central barrier (ΔH‡
activation).
Figure 6.2 Brønsted-type plot where y-axis is the logarithm of the reaction efficiency 98
(krxn/kcol) and the x-axis is the gas phase proton affinity of the anion (ΔH298)
for the SN2 reaction of Nu¯ with CH3Cl.
Figure 6.3 Relationship of the Marcus non-identity reaction activation barrier 101
(ΔH‡
activation = ΔH‡
intrinsic(X,Y) + ΔH‡
driving force) and the thermodynamic driving
force (ΔH‡
driving force = ½ ΔHrxn + (ΔHrxn)2/(16 × ΔH
‡intrinsic) at increasing
exothermicity of reaction (ΔHrxn) for hypothetical non-identity reaction
intrinsic barrier heights of 40, 50, 60, and 80 kJ mol-1
.
Figure 6.4 Differential solvation effects relative to gas-phase proton affinities (aqueous 109
pKa versus gas phase proton affinity) between normal nucleophiles and
α-nucleophiles.
Figure 7.1 Generic gas phase double-well potential energy surfaces for competing 117
bimolecular elimination (E2), bimolecular substitution (SN2), and proton
transfer (PT) reactions.
Figure 7.2 Brønsted correlation where y-axis is the logarithmic scale of the E2 reaction 122
efficiency for the anion with (CH3)3CCl and the x-axis is the gas phase
proton affinity of the anion.
Figure 8.1 Binding modes for complexes of anions with charge-neutral arenes (a) C–H 144
hydrogen bonding, (b) noncovalent anion–π interaction, (c) weakly covalent
σ-interaction, and (d) strongly covalent σ-interaction.21
- Reproduced by
permission of The Royal Chemical Society
xiii
Figure 8.2 FA-SIFT Mass Spectra of (a) the reaction of HO¯ + 1,3,5-triazine with 151
insets of isotopic shift studies. (b) CID of the hydroxide-1,3,5-triazine
species, [HO•C3H3N3] ¯, at an Ecm injection voltage of 1.2 eV. (c) The
reaction of CH3O¯ + 1,3,5-triazine with insets of isotopic shift studies,
and (d) CID of the methoxide-1,3,5-triazine species, [CH3O•C3H3N3]¯,
at Ecm of 0.65 eV.
Figure 8.3 Relative yield of the product ions from the SIFT collision-induced 153
dissocation of 1,3,5-triazinide, C3H2N3¯, as a function of translational
energy in the center-of-mass frame.
Figure 8.4 Energy diagram for the decomposition of 1,3,5-triazinide. 155
Figure 8.5 Reaction coordinate plots for the reaction of 1,3,5-triazine with 163
(a) hydroxide, (b) amide (c) methoxide, and (d) furanide.
xiv
List of Tables
Table 3.1 Rate Constants, Reaction Efficiencies, Kinetic Isotope Effects (kH/kD), 38
and Enthalpies of Reaction for CN¯ + RI in the Gas Phase
Table 3.2 Rate Constants and Perdeutero KIEs (kH/kD) for the CN¯ + CH3I and 40
CN– + CH3CH2I Reactions in the Protic to Aprotic Solvent Series
Table 3.3 A Comparison of Experimental and Theoretical Deuterium KIEs for the 42
CN¯ + CH3I and CN¯ + CH3CH2I Reactions in the Gas Phase
and in Solution
Table 4.1 Reaction Rate Constants (kH) in Units of 10
-10 cm
3 s
-1, Reaction Efficiencies 60
(kH/kcol), and isotope effects (KIEexp)
Table 4.2 Experimental KIEs Compared to Computational KIEs and Branching 70
Fractions
Table 4.3 Looseness Parameter (RTS), Theoretical SN2 KIEs, and Transition State 72
α-carbon atomic charge
Table 5.1 Thermodynamic Parameters, Kinetic Data, and Branching Fractions to 81
Evaluate the α-Effect for HOO¯ Relative to Normal Oxyanions (HO¯,
CH3O¯, C2H5O¯, and i-C3H7O¯) in a Series of Bimolecular Nucleophilic
Substitution (SN2) Reactions
Table 5.2 Gas Phase Thermochemical Ion Cycle to Determine the Homolytic Bond 85
Strength of CH3OH and HOOH
Table 6.1 The α-effect and Intrinsic Reactivity for the SN2 Reactions of HO¯, CH3O¯, 104
C2H5O¯, and HOO¯ with Methyl Chloride, Methyl Fluoride, Anisole and
4-Fluoroanisole (energies in units of kJ mol-1
)
Table 7.1 Thermodynamic and Kinetic Data with Associated Barriers for the Reagent 125
Pairing [FCH2CH2O¯, PhCH2O¯, and (CH3)3COO¯] in the SN2 Reactions
with CH3Cl and the E2 Reactions with (CH3)3CCl to Evaluate the α-effect
Table 7.2 Kinetic Data and Branching Fractions with Relevant Thermodynamic Data 129
(kJ mol-1
) for the Reactions of CD3O¯, HOO¯, and (CH3)2CHO¯ with
Dimethyl Methylphosphonate (DMMP)
Table 7.3 Kinetic Data and Branching Fractions with Relevant Thermodynamic Data 133
(kJ mol-1
) for the Reactions of HO¯, CD3O¯, CH3CD2O¯, HOO¯ and
(CH3)2CHO¯ with methyl formate
Table 8.1 1,3,5-Triazine Reactions with Proton Affinity, Overall Rate Constant, 158
Reaction Efficiency, and Initial Product Ion Distribution
xiii
Publications
1. Garver, J. M.; Fang, Y. R.; Eyet, N.; Villano, S. M.; Bierbaum, V. M.; Westaway, K. C.,
A Direct Comparison of Reactivity and Mechanism in the Gas Phase and in Solution.
Journal of the American Chemical Society 2010 132 (11), 3808-3814.
2. Garver, J. M.; Eyet, N.; Villano, S. M.; Yang, Z.; Bierbaum, V. M. Mechanistic
investigation of SN2 dominated gas phase alkyl iodide reactions. International Journal of
Mass Spectrometry, 2011 301 (1-3), 151-158.
3. Garver, J. M.; Eyet, N.; Villano, S. M.; Yang, Z.; Kato, S.; Wren, S. W.; Vogelhuber, K.
M.; Lineberger, W. C.; Bierbaum, V. M. Gas Phase Reactions of 1,3,5-Triazine: Proton
Transfer, Hydride Transfer, and Anionic σ-Adduct Formation. Journal of the American
Society for Mass Spectrometry, 2011 22 (7), 1260-1272.
4. Garver, J. M.; Gronert, S.; Bierbaum, V. M. Experimental Validation of the α-Effect in
the Gas Phase, submitted as a Communication to the Journal of the American Chemical
Society.
5. Garver, J. M.; Yang, Z.; Nichols C.; Worker, B.; Gronert, S.; Bierbaum, V. M. Resolving
the α-effect in Gas Phase SN2 Reactions: A Marcus Theory Approach, In preparation.
6. Garver, J. M.; Yang, Z.; Wehres, N.; Nichols C.; Worker, B.; Gronert, S.; Bierbaum, V.
M. Intrinsic Reactivity and the α-effect in Elimination Reactions and Competing
Mechanisms in the Gas Phase, In preparation.
7. Wren, S. W.; Vogelhuber, K. M.; Garver, J. M.; Kato, S.; Sheps, L.; Bierbaum, V. M;
Lineberger, W. C. Nitrogen Proximity Effects in Azines: How Nitrogen Atoms Affect the
C-H Bond Strengths and Anion Stability, In preparation.

1
CHAPTER 1
Gas-Phase Ion-Molecule Reactions
Overview
Life, Universe and Everything. The studies of gas phase ion-molecule reactions have played an
important role in our fundamental understanding of physical organic chemistry. The relevance
of this work is stressed and future applications highlighted. The fundamental physical organic
principles that govern reaction mechanisms and reactivity are reviewed and the relevant chapters
of the thesis in which they are employed are placed in brackets following the discussion, i.e., (see
Chap 1-8).
Image from Hublesite (http://hubblesite.org/gallery/;NASA Contract NAS5-26555)Reaction Coordinate
ΔHrxn
X– + RY X–····RY RX····Y– RX + Y–
ΔH‡overall barrier
Reactants
Reactant
Ion-Dipole
Complex Product Ion-Dipole Complex
Products
Transition
State
k1
K-1
k2
k-2
k3
K-3[X····R····Y]–‡
ΔHcomplexation

2
1.1 Introduction
Historically, physical organic chemists have sought to identify meaningful trends in
chemical reactivity and to relate these patterns with molecular parameters.1 Early work focused
on reaction mechanisms in solution and analyzed the effects of structural variations in terms of
linear free-energy relationships and kinetic isotope effects. These experimental studies provided
a solid foundation in kinetics, mechanisms and structure-energy relationships; however, for
many classical organic reactions scientists have yet to resolve the role of solvent interactions
from intrinsic reactivity. It is known that reaction rates and mechanisms can be influenced by
solvent effects, which are even more pronounced in reactions involving ionic species due to
strong electrostatic interactions with the solvent.2 Thus, the fundamental nature of ion-molecule
interactions should be derived from chemical behavior in a solvent-free environment. Gas phase
studies provide insight into the intrinsic nature of a reaction without the interference of solvent
effects and the presence of counter ions. In fact, the study of supramolecular chemistry and
biological systems is increasingly performed with the aid of gas phase techniques.3,4
The gas
phase has proven a valuable environment to establish the properties and reactivity of the non-
polar interior of biological molecules (proteins and DNA), as well as provide insight into the role
of solvent influences on nucleobase selectivity and recognition.5-7
Furthermore, gas phase data
enable the molecular modeling of energies, structures, and electronic properties of molecules
without having to account for the complexities of solute-solvent interactions.
The study of the products, distribution, rates, and equilibria of ionic reactions in the gas
phase is well-suited to provide detailed information on reaction mechanisms, energetics, and
solvent effects.8,9
Cations, anions, and even transient ionic intermediates can be generated,
detected, isolated, and characterized in the gas phase. These completely unsolvated ions undergo

3
a large number of reactions that are analogous to those in solution. By comparing the gas phase
results with those of condensed-phase experiments, the intrinsic behavior of these processes may
be studied and the role of solvent exposed. Many common synthetic organic schemes
(substitutions, eliminations, Grignard additions, aldol condensations, hydrolysis of esters, etc.)
involve anions.1 Many of these mechanisms not only play a central role in organic chemistry,
but also in biological, atmospheric, and interstellar systems. A detailed and quantitative analysis
of the effects of structural variation on the properties of molecules and reactions can be expanded
to multidisciplinary areas such as supramolecular chemistry, nanotechnology, surfactant and
membrane mimetic chemistry, catalytic processes, biochemical processes, and organic materials
with specialized (super)conducting, optical, and magnetic properties.10
1.2 Fundamentals of Physical Organic Chemistry
Physical organic chemistry is concerned with the study of factors (structural or
environmental) that affect the rates of reactions (kinetics), the way that light and matter interact
(spectroscopy), how electrons are arranged in atoms and molecules (quantum mechanics), and
the stabilities of compounds and processes (thermodynamics) of organic reactions.1 Through the
basic principles of classical and quantum mechanics, a method of describing microscopic atomic
forces and molecular interactions is achieved. Statistical treatment of these concepts enables the
prediction of the macroscopic properties and behavior of chemical systems. Chemical kinetics
and reaction dynamics applies these concepts to explain the transformation of substances and the
energy changes that accompany reactions. Within this framework the fundamental physical
principles that govern reaction mechanisms and reactivity can be understood.

4
1.2.1 Models of Chemical Bonding1
Since chemical reactions involve breaking and forming of chemical bonds, an
understanding of the structural theory of organic chemistry will provide insights into physical
properties of molecules and how they might interact. An atom consists of a dense, positively
charged central nucleus surrounded by a cloud of negatively charged electrons held in place by
electrostatic forces. The wave-like behavior of these electrons can be obtained from basic
quantum mechanics via solution of the Schrödinger equation. In general, each solution or
wavefunction describes the energy, size, shape, and the directionality of the atomic orbitals for a
given nucleus. The geometries of these orbitals (s, px, py, pz, etc.) determine the three
dimensional structure of molecules and are the foundation of bonding models.
1.2.1.1 Hybridized Orbitals
The concept of hybridization arises from a "mixing" of the energy levels of the atomic
orbitals during covalent bond formation. This perturbation of the atomic orbital wavefunctions
results in new orbitals with geometries determined by the component atomic orbitals. Organic
chemistry is primarily concerned with the sp3, sp
2, and sp hybrid orbitals generated from the s
and p orbitals. The geometries and shifts in electron distributions associated with the
superposition of an s orbital with one, two, or three p orbitals are depicted in Figure 1.1a. These
hybrid states are often invoked to describe molecular or transition state geometries (see Chap 3-
8). The ideal geometries (sp3 = tetrahedral, 109.5°; sp
2 = trigonal planar, 120°; sp = linear, 180°)
are approximate and molecules deviate from ideal angles based on the actual percentage of s and
p character used to form the hybrid orbitals. Hybrid orbitals also provide a picture of

5
bonding based on overlap of these orbitals along the bond axis to generate sigma (σ) bonds and
between the orthogonal p orbitals on adjacent atoms to form pi (π) bonds (Figure 1.1b). Double
bonds consist of a σ-bond and a π-bond and triple bonds consist of a σ-bond and two π-bonds. In
structures with alternating single and multiple bonds (conjugated system), delocalization of
charge density across the π-bonds may lower the overall energy and increase stability. The
greater the delocalization of π-electrons across all the adjacent aligned p-orbitals (resonance) the
greater the stability of the structure.1 The continuous overlap of π bonds above and below the
plane of the ring in a conjugated cyclic system (Hückel 4n+2 electron rule)1 is typically
Figure 1.1 Hybridization. a) Forming sp, sp2 and sp
3 hybrid orbitals and b) sigma (σ) and pi
(π) bonding in hybrid orbitals.
pzs pxpy
sp : +
pzs pxpy
sp2: + +
pzs pxpy
sp3: + + +
pzsp hybrids px
+
pxsp2 hybrids
sp3 hybrids
180°
120°
109.5°
+
sigma
pipx
sp2 hybrids
a) hybridization
b) bonding

6
associated with aromaticity (enhanced stabilization from cyclic delocalization and resonance).
“Aromatic” systems tend to exhibit thermodynamic and kinetic stability; however, shifts in
electron density within the σ and π bonds can significantly influence chemical properties as well
as the forces that govern reaction pathways (see Chap 8).
1.2.1.2 Electrostatic Models
As mentioned above, the charge distribution within a molecule or anion is a key
characteristic for predicting reactivity. Most of the gas phase anion-molecule reactions in our
studies can be considered acid-base reactions in which a nucleophile (electron rich ion) attacks
the site of an electron deficient atom (electrophilic center) within a molecule. Electronegativity
and bond polarization provide a means to define the electron density within a structure.
Electronegativity scales (measure of the attraction of an atom for electrons in a covalent bond)
assess the energy of the orbitals that an atom uses to accept electrons. When a σ-bond forms
between atoms (X-Y), the electrons will preferentially reside near the more electronegative atom
(Y), producing a partial negative (Yδ-
) and partial positive charge (Xδ+
) on the atoms. While the
bonds are still covalent in nature, this bond polarization is often used to understand stability in
electrostatic models (see Chap 3-8). Often the electronegativity and polarization effects can be
felt along adjacent σ bonds (inductive effect) and across space between structures (field effects).
In complex structures, electrostatic potential surfaces (see Chap 7 and 8 overview art) provide a
better picture of the degrees of polarity across a molecule (red for negative and blue for positive).
The polarizability of the anion also plays a key role in reactivity and selectivity. Whereas the
energies of interaction for non-polarizable (hard) anions are primarily controlled by electrostatic
attractions, polarizable (soft) anions are dependent on orbital mixing interactions.11
Hard-Lewis-
base-type nucleophiles tend to bind to hard-Lewis-acid-type electrophilic sites and soft-Lewis-
7
base-type nucleophiles tend to bind to soft-Lewis-acid-type electrophilic sites (see Chap 6 and
7). Molecular orbital theory provides a better context to understand the principle of hard and soft
acids and bases.
1.2.1.3 Molecular Orbital Theory
While hybridization provides a simplistic picture of the interaction of atomic orbitals,
molecular orbital theory considers the interactions of all the orbitals within a structure.
Molecular orbitals (MOs) give us a deeper understanding of the electronic structure, orbital
energies, and reactivity patterns of organic molecules. MOs are formed from the addition and
subtraction (linear combination method) of atomic and group orbitals. Conceptually, the
formation of MOs can be visualized by the in-phase and out-of-phase interactions of atomic
orbitals of similar symmetry and energy shown in the generic MO diagram, Figure 1.2. A
constructive “bonding” interaction (lower in energy) occurs when the combination of the
Figure 1.2 Generic MO diagram depicting the in-phase and out-of-phase interactions of the
atomic s and p orbitals to form bonding and antibonding (*) MOs.
pσ*
pπ* pπ*
pσ
pπ pπ
sσ*
sσ
E
n
e
r
g
y

8
wavefunctions is in-phase (overlap of two shaded or two unshaded orbital lobes) and an
antibonding (*) interaction (higher in energy) is generated when the combination of the
wavefunctions is out-of-phase (a shaded orbital lobe overlapping with an unshaded orbital lobe)
(see Chap 8). Computer programs such as Gaussian12
have enabled efficient calculations of
MOs in order to predict the structures and energetics of many of the reactants, transition states,
and products studied in this thesis (see Chap 3-8).
Since chemical bonding involves the interaction of the frontier molecular orbitals (FMO
Theory) of the reactants, reactivity can be understood by focusing on the Highest Occupied
Molecular Orbital (HOMO) of one species and the Lowest Unoccupied Molecular Orbital
Figure 1.3 Hard Soft Acid Base (HSAB) interactions using frontier molecular orbital
theory. a) Hard/Hard = HOMO-LUMO energies are far apart, reactivity influenced by
electrostatic interactions. b) Soft/Soft = HOMO and LUMO are close in energy, reactivity
governed by the formation of energetically favorable new MOs.
Hard Acid A:B Hard Base
(e¯ pair acceptor) (Electrostatic Interaction) (e¯ pair donor)
HOMO
LUMO
HOMO
Soft Acid A:B Soft Base
(e¯ pair acceptor) (MO Interaction) (e¯ pair donor)
HOMO
LUMO
HOMO
ΔE
ΔE
a) b)

9
(LUMO) of the other.11
One application of the HOMO-LUMO argument is the description of
acid-base behavior. Orbitals of similar symmetry and energy combine easily to form an acid-
base adduct. Symmetry, energy, and occupation of frontier orbitals allow us to understand hard
soft acid base theory (Figure 1.3). Hard acid-hard base reactions have HOMO-LUMO energies
that are far apart; therefore, electrostatics (δ+/δ
- charge attractions) primarily influence the
bonding interactions. Soft acid-soft base reactions have similar HOMO and LUMO energies
promoting the formation of energetically favorable new MOs. Hard-soft reactions do not
generate stable interactions and reactivity is generally very low.13
The principles behind the hard
(non-polarizable) and soft (polarizable) behavior can be used to rationalize the reactivity and
mechanistic selectivity of anions (see Chap 5-7).
1.3 Gas Phase Kinetics and Thermodynamics
Knowledge of accurate reaction rates and thermochemical properties is of great
importance in many branches of chemistry, in particular, combustion,14
atmospheric,15
prebiotic,16
and astrochemical (interstellar medium and planetary atmospheres)17
modeling.
Much of the kinetic and thermochemical data available have been obtained from gas phase
spectroscopic, kinetic, and equilibrium experiments and related through positive or negative ion
thermochemical cycles.18
Our research group measures rate constants and product distributions
of organic reactions in the gas phase revealing the details of how one molecule is transformed
into another. The analysis of our data is understood in the context of a double-well potential
energy surface and predicated on statistical rate theory.15,19
Thermodynamic information about
the reactants, products and intermediate complexes can often be obtained from reaction rate
constants or directly from collision-induced dissociation studies.
10
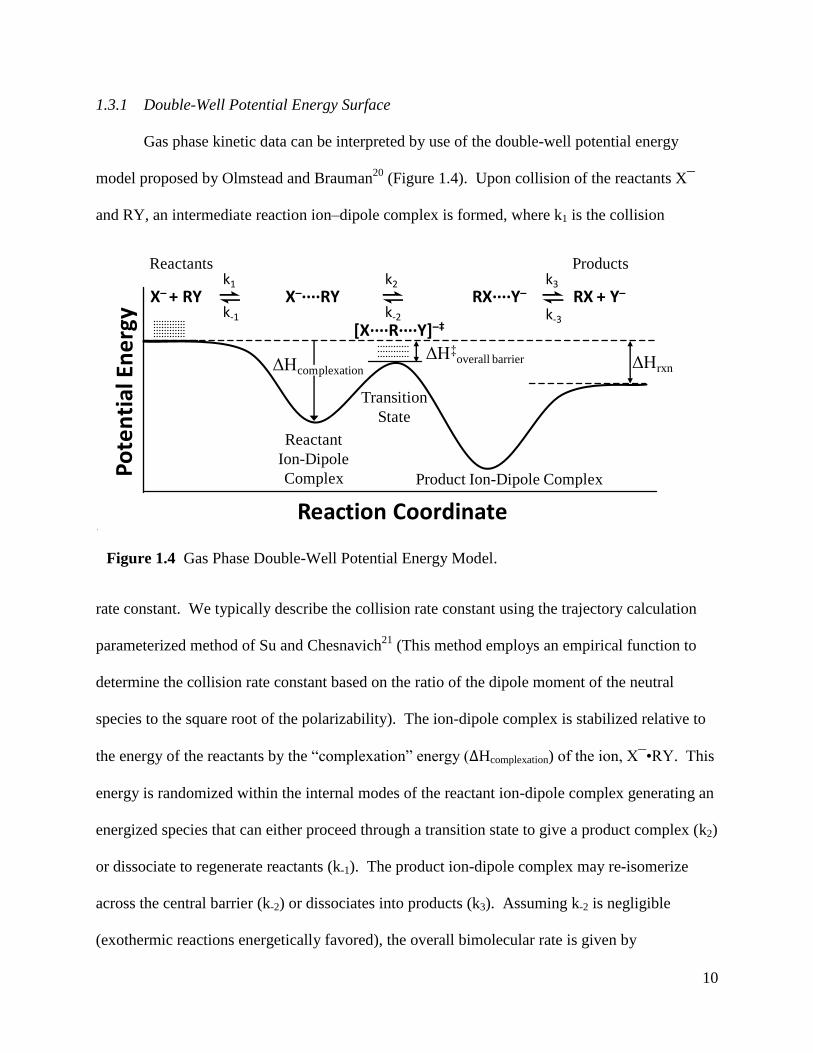
1.3.1 Double-Well Potential Energy Surface
Gas phase kinetic data can be interpreted by use of the double-well potential energy
model proposed by Olmstead and Brauman20
(Figure 1.4). Upon collision of the reactants X¯
and RY, an intermediate reaction ion–dipole complex is formed, where k1 is the collision
rate constant. We typically describe the collision rate constant using the trajectory calculation
parameterized method of Su and Chesnavich21
(This method employs an empirical function to
determine the collision rate constant based on the ratio of the dipole moment of the neutral
species to the square root of the polarizability). The ion-dipole complex is stabilized relative to
the energy of the reactants by the “complexation” energy (ΔHcomplexation) of the ion, X¯•RY. This
energy is randomized within the internal modes of the reactant ion-dipole complex generating an
energized species that can either proceed through a transition state to give a product complex (k2)
or dissociate to regenerate reactants (k-1). The product ion-dipole complex may re-isomerize
across the central barrier (k-2) or dissociates into products (k3). Assuming k-2 is negligible
(exothermic reactions energetically favored), the overall bimolecular rate is given by
Figuer 1.4Fig
Figure 1.4 Gas Phase Double-Well Potential Energy Model.
Reaction Coordinate
ΔHrxn
X– + RY X–····RY RX····Y– RX + Y–
ΔH‡overall barrier
Reactants
Reactant
Ion-Dipole
Complex Product Ion-Dipole Complex
Products
Transition
State
k1
k-1
k2
k-2
k3
k-3[X····R····Y]–‡
ΔHcomplexation
11
The ability to extract meaningful information from our data is based on the statistical behavior of
the reactant ion-dipole complex. In order for statistical rate theory to hold, a few assumptions
must be valid: (1) collisions must not result in direct reactions or nonreactive elastic scattering,
(2) the complexation energy is randomized within the internal modes (rotational and vibrational)
of the complex on the time scale of the reaction, and (3) the transition state controls the
reaction.19
Generally, ion-molecule reactions behave statistically because the deep well of the
reactant ion-dipole complex generates long-lived intermediates; however, smaller reaction
systems with fewer internal modes for energy distribution are more prone to non-statistical
behavior. In extremely exothermic reactions and in reactions with extremely low activation
energies, the central barrier has little effect on the reactant ion-dipole complex and the overall
reaction transitions from kinetically to thermodynamically controlled. In these cases,
mechanistic selectivity is significantly influenced by reaction dynamics and the interactions
associated with molecular collisions (see Chap 5-7).
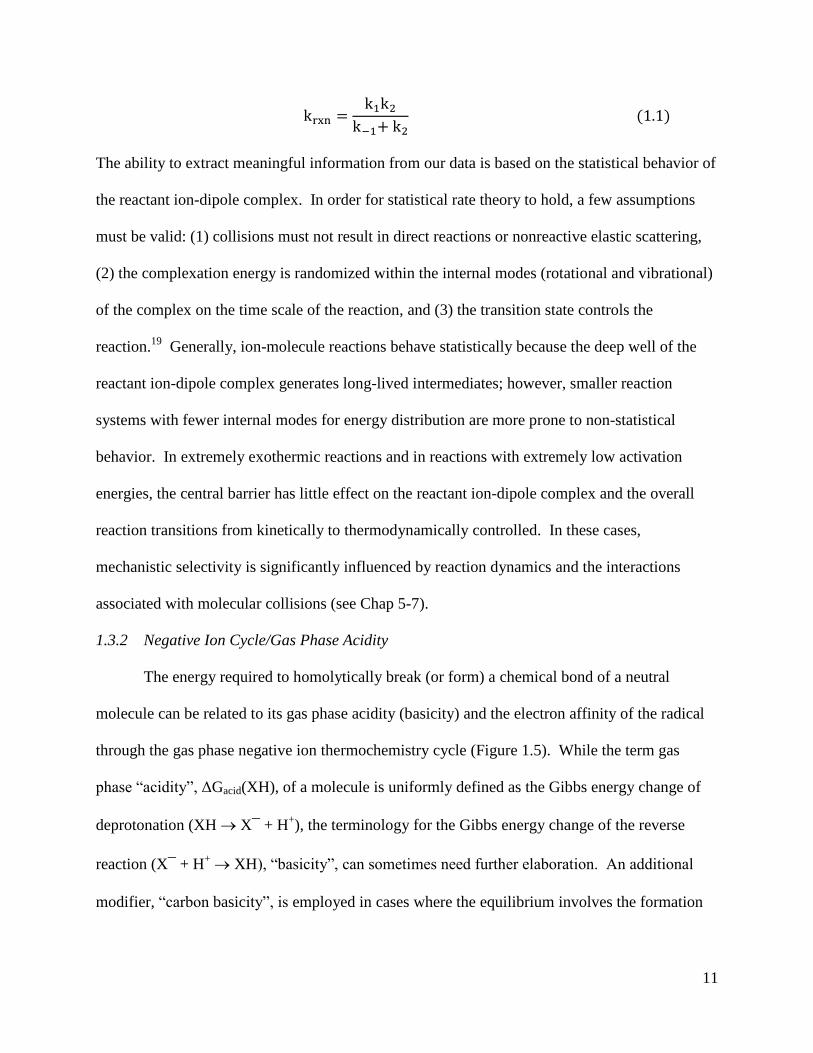
1.3.2 Negative Ion Cycle/Gas Phase Acidity
The energy required to homolytically break (or form) a chemical bond of a neutral
molecule can be related to its gas phase acidity (basicity) and the electron affinity of the radical
through the gas phase negative ion thermochemistry cycle (Figure 1.5). While the term gas
phase “acidity”, ΔGacid(XH), of a molecule is uniformly defined as the Gibbs energy change of
deprotonation (XH X¯ + H+), the terminology for the Gibbs energy change of the reverse
reaction (X¯ + H+ XH), “basicity”, can sometimes need further elaboration. An additional
modifier, “carbon basicity”, is employed in cases where the equilibrium involves the formation
12
of a bond by the base to carbon, (X¯ + RC+ RCX).
22 This point is emphasized because the
negative ion cycle can be used to calculate either hydrogen [D0(X―H)] or carbon [D0(X―C)]
bond energies (see Chap 5). Therefore, the term ΔHacid in Figure 1.5 can be used to describe
either the enthalpy associated with heterolytic bond cleavage with hydrogen (XH X¯ + H+) or
carbon (RCX X¯ + RC+). To avoid confusion in terminology, “proton affinity” is used to
describe the enthalpy of protonation of the anion (X¯ + H+ XH) and “cation affinity” (e.g.
CH3+
, methyl cation affinity; see Chap 4-7) describes the enthalpy of the anion reacting with the
cation (X¯ + RC+ RCX).
1.3.3 Linear Free-Energy Relationships
Since many of our discussions employ proton affinities to evaluate trends and predict
reactivity (see Chap 3-7), the basis of this association is provided. Figure 1.6 shows a Marcus-
type rate-energy relationship applied to a gas phase double-well potential energy surface
depicting the correlation between kinetics and thermodynamics.23
The rate-controlling central
barrier (ΔH‡
activation) can be viewed as an intrinsic barrier (ΔH‡
intrinsic) modified by an exothermic
driving force (ΔHdriving force). This relationship indicates that the enthalpies and free-energies of
Figure 1.5 Gas Phase Negative Ion Thermochemical Cycle relating enthalpy of heterolytic
bond cleavage (ΔHacid, when Y=H), electron affinity (EA), ionization energy (IE), and bond
dissociation energy (D0).
X + Y+ + e¯
EA(X¯) IE(Y)
ΔHacid(XY)
D0(X―Y)
X¯ + Y+
XY
X + Y

13
activation for a reaction should have a strong correlation with the heats of reaction in the gas
phase (i.e., the more exothermic, the lower the barrier). In general, the exothermicity of a
nucleophilic reaction is equal to the difference in the cation affinity of the nucleophile and
nucleofuge. Since both nucleophilicity and basicity involve the donation of electrons to an
electrophile, a strong linear correlation also exists between proton affinities and cation
affinities.22
These relationships establish a link between proton affinity and reactivity. “Linear”
free-energy relationships tend to exist within a family of anions.22 Deviations from linearity in
reactivity-basicity correlations can reflect the influence of additional variables or significant
differences in the intrinsic nature of the anion. Based on this, the proton affinity (PA) is the most
useful thermodynamic parameter for correlating reactivity patterns and evaluating intrinsic
differences in anions.
Figure 1.6 Marcus-type rate-energy relationship applied to a gas phase double-well
potential energy surface depicting the correlation between kinetics and thermodynamics.
The rate-controlling central barrier (ΔH‡
activation) can be viewed as an intrinsic barrier
(ΔH‡
intrinsic) modified by an exothermic driving force (ΔHdriving force).
Reaction Coordinate
ΔHrxn
X– + RY X–····RY [X····R····Y]–‡ RX····Y– RX + Y–
ΔH‡intrinsic
ΔH‡activation
ΔHdriving force
14
1.4 References
1. Anslyn, E. V.; Dougherty, D. A. Modern Physical Organic Chemistry. University
Science Books: United States, 2006.
2. Hynes, J. T. Annu. Rev. Phys. Chem. 1985, 36, 573-597.
3. Schalley, C. A. Int. J. Mass Spec. 2000, 194, 11-39.
4. Hoaglund-Hyzer, C.S.; Counterman, A.E.; Clemmer, D.E. Chem. Rev. 1999, 99, 3037-
3079.
5. Lundegaard, C.; Jensen, K. F. Biochem. 1999, 38, 3327-3334.
6. Jordan, F.; Li, H.; Brown, A. Biochem. 1999, 38, 6369-6373.
7. Kurinovich, M. A.; Lee, J. K. J. Am. Chem. Soc. 2000, 122, 6258-6262.
8. Gronert, S. Chem. Rev. 2001, 101, 329-360.
9. Bohme, D. K. Can. J. Chem. 2008, 86, 177-198.
10. Engberts, J. B. F. N. Pure Appl. Chem. 1997, 69, 231-233.
11. Bradley, J. D.; Gerrans, G. C. J. Chem. Educ. 1973, 50, 463-466.
12. Gaussian 09, Revision A.1, Frisch, M. J.; Trucks, G. W.; Schlegel, H. B.; Scuseria, G. E.;
Robb, M. A.; Cheeseman, J. R.; Scalmani, G.; Barone, V.; Mennucci, B.; Petersson, G.
A.; Nakatsuji, H.; Caricato, M.; Li, X.; Hratchian, H. P.; Izmaylov, A. F.; Bloino, J.;
Zheng, G.; Sonnenberg, J. L.; Hada, M.; Ehara, M.; Toyota, K.; Fukuda, R.; Hasegawa,
J.; Ishida, M.; Nakajima, T.; Honda, Y.; Kitao, O.; Nakai, H.; Vreven, T.; Montgomery,
Jr., J. A.; Peralta, J. E.; Ogliaro, F.; Bearpark, M.; Heyd, J. J.; Brothers, E.; Kudin, K. N.;
Staroverov, V. N.; Kobayashi, R.; Normand, J.; Raghavachari, K.; Rendell, A.; Burant, J.
C.; Iyengar, S. S.; Tomasi, J.; Cossi, M.; Rega, N.; Millam, N. J.; Klene, M.; Knox, J. E.;
Cross, J. B.; Bakken, V.; Adamo, C.; Jaramillo, J.; Gomperts, R.; Stratmann, R. E.;
Yazyev, O.; Austin, A. J.; Cammi, R.; Pomelli, C.; Ochterski, J. W.; Martin, R. L.;
Morokuma, K.; Zakrzewski, V. G.; Voth, G. A.; Salvador, P.; Dannenberg, J. J.;
Dapprich, S.; Daniels, A. D.; Farkas, Ö.; Foresman, J. B.; Ortiz, J. V.; Cioslowski, J.;
Fox, D. J. Gaussian, Inc., Wallingford CT, 2009.
13. Chattaraj, P. K. J. Phys. Chem. A 2001, 105, 511-513.
14. Miller, J. A.; Kee, R. J.; Westbrook, C. K., Annu. Rev. Phys. Chem. 1990, 41, 345-387.
15. Steinfeld, J. I.; Francisco, J. S.; Hase, W. L. Chemical Kinetics and Dynamics; Prentice-
Hall: Englewood Cliffs, NJ, 1989.
16. Balucani, N. Int. J. Mol. Sci. 2009, 10, 2304-2335.
17. KIDA (KInetic Database for Astrochemistry, http://kida.obs.u-bordeaux1.fr).
18. NIST Chemistry WebBook, National Institute of Standards and Technology,
Gaithersburg MD, 20899, http://webbook.nist.gov.
19. Chabinyc, M. L.; Craig, S. L.; Regan, C. K.; Brauman, J. I. Science 1998, 279, 1882-
1886.
20. Olmstead, W. N.; Brauman, J. I. J. Am. Chem. Soc. 1977, 99, 4219-4228.
21. Su, T.; Chesnavich, W. J. J. Chem. Phys. 1982, 76, 5183-5185.
22. Uggerud, E. Pure Appl. Chem. 2009, 81, 709-717.
23. Pellerite, M. J.; Brauman, J. I. J. Am. Chem. Soc. 1983, 105, 2672-2680.
15
CHAPTER 2
Experimental Methods and Techniques
Overview
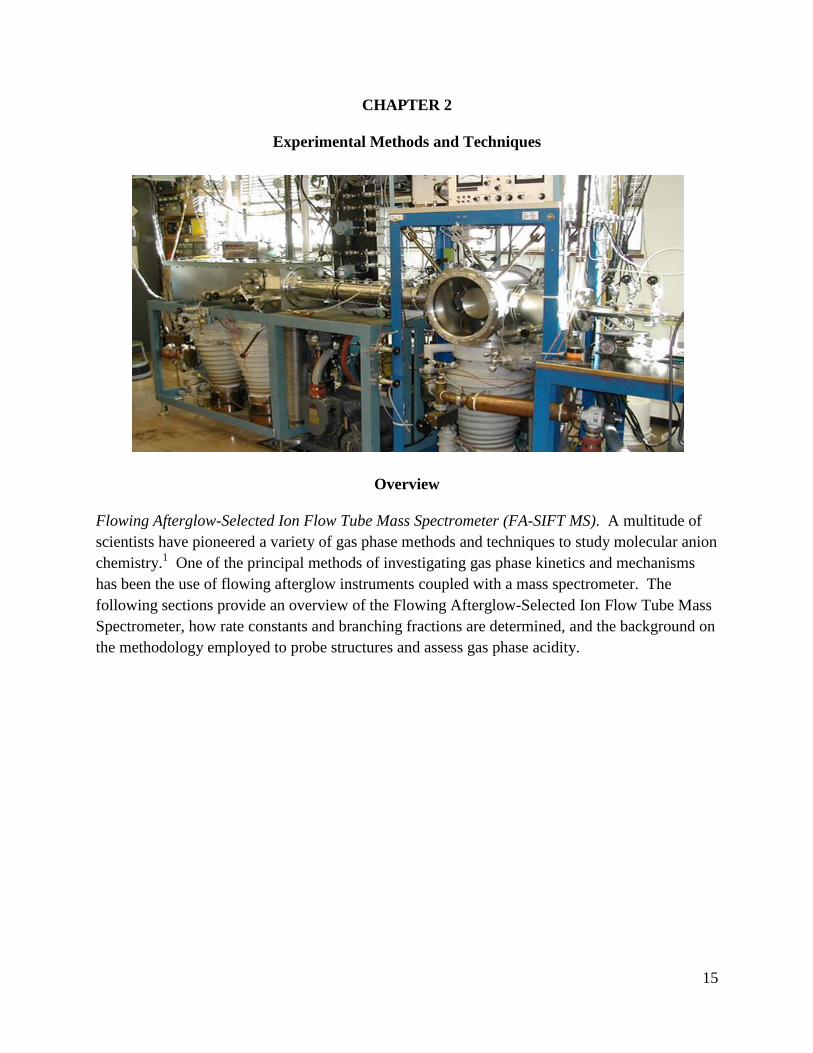
Flowing Afterglow-Selected Ion Flow Tube Mass Spectrometer (FA-SIFT MS). A multitude of
scientists have pioneered a variety of gas phase methods and techniques to study molecular anion
chemistry.1 One of the principal methods of investigating gas phase kinetics and mechanisms
has been the use of flowing afterglow instruments coupled with a mass spectrometer. The
following sections provide an overview of the Flowing Afterglow-Selected Ion Flow Tube Mass
Spectrometer, how rate constants and branching fractions are determined, and the background on
the methodology employed to probe structures and assess gas phase acidity.
16
2.1 Introduction
A multitude of scientists have pioneered a variety of gas phase methods and techniques to
study molecular anion chemistry.1 One of the principal methods of investigating gas phase
kinetics and mechanisms has been the use of flowing afterglow instruments coupled with a mass
spectrometer. The correlation of kinetic data and isotope effects with thermodynamic and
structural parameters has proven to be a valuable approach for interpreting transition state
structures. Collision-induced dissociation methods allow structural information or gas-phase
acidities to be obtained from energy-resolved competitive fragmentation. Gas phase acidities and
proton affinities can be determined by the ion-molecule bracketing method, the equilibrium
method (Keq = kf/kr) or the kinetic method.
2.2 Flowing Afterglow-Selected Ion Flow Tube Mass Spectrometer
Ferguson, Fehsenfeld, and Schmeltekopf pioneered the use of the flowing afterglow
technique to study atmospherically relevant ion-molecule reactions.2 Flowing afterglow mass
spectrometry provides the capability to make a variety of ions in situ and study their reactions
under well characterized conditions (laminar flow behavior, viscous gas flow, thermalized ions,
etc.). Due to the possibility of generating multiple reactant ions, in 1989 our lab designed and
built a tandem flowing afterglow-selected ion flow tube (SIFT)3 instrument (Figure 2.1), which
allows the ions of interest to be generated in a source flow tube and mass-selected prior to
injection into the reaction flow tube.4 Our instrument consists of four sections: an ion source, an
ion selection region, a reaction flow tube, and a detection system.

17
2.2.1 Ion Source Region
Primary reactant ions (e.g., HO¯ and NH2¯) are generated by electron impact on trace
gases in the source flow tube (traditional flowing afterglow source with helium buffer gas).
Secondary reactant ions can be produced through ion-molecule reactions with the primary
reactant ions by adding another neutral reagent further downstream through moveable gas inlets.
The moveable ionizer consists of a repeller plate, a rhenium filament (applied voltage, 5 V [2.5
A]; 25 mA electrons produced [~70 eV]), and an extracting grid that provides a feedback loop to
regulate the emission current. All of these elements float at the voltage of the source flow tube.
At the end of the source flow tube the ions are extracted into the ion selection region by an
attractive potential relative to the source flow tube by a cone shaped extractor through a 2 mm
orifice in a molybdenum nosecone. Once inside the selection chamber (10-4
torr, 10-inch
diffusion pump), the ions are focused and guided by a series of six adjustable electrostatic lenses
into the SIFT quadrupole mass filter. The SIFT quadrupole (Extrel # 4-270-9, four rods 1.6 cm x
Figure 2.1 Flowing Afterglow-Selected Ion Flow Tube (FA-SIFT) Mass Spectrometer
18
22 cm) powered by an Extrel power supply (# 011-1) with a 1.5 MHz High-Q head (Extrel #
011-14) is mounted in a separate smaller chamber (10-6
torr, 6-inch diffusion pump), which
allows transmission of ions up to 367 amu. The SIFT quadrupole is set to pass the ion of interest
with a specific mass-to-charge ratio. Following mass selection, the ions are focused by three
electrostatic lenses into an ion injection orifice and a concentric Venturi gas inlet just
downstream of the orifice. Helium buffer gas is forced through two small, circularly symmetric
inner and outer inlets by a high backing pressure. The resulting Venturi effect lowers the
pressure near the ion orifice and backstreaming into the ion selection region, and increases ion
transmission from a region of low pressure to high pressure.
2.2.2 Reaction Flow Tube
The reaction flow tube is 117 cm in length, composed of a 40 cm entry region and 77 cm
reaction region. The entry region allows time for the He buffer gas to transition from turbulent
flow to laminar flow and the reactant ion to be collisionally cooled (vibrationally and rotationally
relaxed to a room temperature Boltzman distribution). Neutral reagents can be added to the
reaction flow tube through a manifold containing seven fixed radial inlets; the first inlet is
positioned at a distance of 13.5 cm from the downstream nosecone. Inlets are spaced at 9.7 cm
increments. The reactant ions and neutral reagents are entrained in helium buffer gas maintained
at a flow rate of 12.0 std L/min by a Tylan flow controller.
2.2.3 Detection Region
Reactant and product ions are gently extracted into the detection region through a 0.5 mm
orifice in a molybdenum plate (< 10 V) mounted on a stainless steel carrier plate. The carrier
plate voltage (1-10 V) is typically negative to focus the ions toward the nosecone. Once inside
the detection region, sampled ions are focused into a triple quadrupole mass spectrometer by a

19
series of five electrostatic lenses. The triple quadrupole (Extrel C50 TQMS system: 1.2 MHz RF
oscillator, 300 W DC power level for Q1 and Q3, and 200 W power level for Q2, 1.9 cm
diameter rods capable of transmission up to 500 amu) can be operated in a MS-MS mode using
Q1 and Q2 to scan or in a MS mode where Q1 and Q2 are used as ion pipes and Q3 scans. For
the experiments described in this thesis, the instrument was operated in the MS mode using Q3
as the mass analyzer. The triple quadrupole is coupled to an electron multiplier with a gain of
108. The output pulses are amplified, discriminated, and processed by the Extrel Merlin data
system software package. The lensing and triple quadrupole/electron multiplier are housed in
three separate chambers that are differentially pumped by two 10-inch and one 6-inch diffusion
pumps maintaining pressures ranging from 10-6
to 10-7
torr.
2.2.4 Rate Constant Determination and Error Analysis
Since the velocity profile of our reactants and helium buffer gas are well-defined and
well-characterized, the reaction time and distance can be related and incorporated into a second-
order rate law describing the change in ion concentration as a function of distance (Eq 2.1),
where [X¯] is the concentration of reactant ion, [N] is the concentration of the neutral reagent, z
is the reaction distance, α is the ion velocity correction factor of 1.6,2 and vHe is the average
helium velocity. The integrated rate law of Equation 2.1 can be rearranged into a linear
expression (Eq 2.2) allowing the slope (m) of a semilogarithmic plot of the ion concentration
versus the reaction distance to be related to the reaction rate constant (krxn) by Equation 2.3.

20
The concentration of neutral, [N], in particles cm-3
is determined using a known flow of neutral,
FN (determined by a change in pressure in a constant volume over time) in atm cm3 s
-1, He
velocity in cm s-1
, and the flow tube area using a radius of a = 3.65 cm and the conversion shown
in Equation 2.4.
An extensive evaluation of systematic and random error has been reported in reference 5.
From this work, the error in our measurements primarily arises from errors in the slope (1-3%),
the ion velocity correction (12.5%), He buffer flow (0.9%), temperature (0.4%) measurements,
and neutral flow determination (~3%). Propagating this error results in an accuracy of ± 14% for
each measurement; however, we conservatively give an overall accuracy of ± 20%. In addition,
our rate constant measurements include error bars of one standard deviation of the mean of three
or more measurements.
2.2.5 Branching Fractions
Competitive reaction pathways may exist within the ion-dipole complexes (Scheme 2.1);
therefore, studies of gas phase ion-molecule reactions not only seek to identify relationships of
reactant properties with reactivity and mechanism, but with product distributions as well.
Secondary reactions or clustering between the product ions and the neutral reagent do not affect
the overall rate constant measurement (krxn = k1 + k2), but need to be considered when
Scheme 2.1
X¯ + N C¯ + D Y¯ + Z
Primary Reactions Secondary Reactions
E¯ + F
k1
k2

21
determining product branching fractions. Shifts in the relative abundance of primary ions due to
secondary processes can be accounted for by using a plot of product ion intensity (C¯, E¯, and
Y¯) as a function of inlet distance and extrapolating to product ion concentrations at “zero
reaction distance” (before secondary processes can occur). Once secondary processes are
accounted for the branching fractions can be used to determining the relative rate constants (k1
and k2) from the overall reaction rate constant (krxn = k1 + k2). The branching fractions (BR) are
determined from a ratio of a given ionic product (C¯ or E¯) to the total product ion concentration
and related to the relative rate constants according to Equation 2.5.
2.3 Kinetic Isotope Effects
Deuterium Kinetic Isotope Effects (KIEs) are often employed to probe the structure of
the transition state and relative reaction pathways. A deuterium KIE is the ratio of rate constants
of an undeuterated reactant to the deuterated reactant (KIE = kH/KD). These KIEs are primarily
due to the changes in the vibrational frequencies as a reaction proceeds from reactants to the
transition state, Figure 2.2. The effects can be evaluated by comparing the relative differences in
zero point energy between the hydrogen and deuterium labeled reactions. The electronic nature
of the isotopic atoms is nearly identical; however, bonds to the heavier deuterium atoms will
have lower vibrational frequencies. The relative change in vibrational energy, as the bonds in
the reactant are modified to either a loose (longer bond) or tight (shorter bond) transition state,
can be interpreted as an activation barrier for the respective isotopic reaction. A “normal” KIE
(>1), [Ea(H) < Ea(D) therefore kD < kH], is observed when bonds are loosened from reactants to

22
the transition state (e.g., loose E2 transition state, see Chap 3 and 4). An “inverse” KIE (< 1,
[Ea(H) > Ea(D) therefore kD > kH], results from the tightening of bonds on going to the transition
state (e.g., sp3 to sp
2 geometries in SN2 transition state, see Chap 3 and 4). Although inverse
KIEs are characteristic of “tight” transition states (e.g., SN2 reactions) and normal KIEs are
typical of “loose” transition states (e.g., E2 reactions), this interpretation must be tempered due
to minor contributions from all modes (translational, vibrational, rotational). For our studies we
determine the overall KIEs using a ratio of undeuterated to deuterated activation barriers (a more
in depth analysis of the contributions from the various modes to the overall KIE can be
accomplished by using transition state theory and partition functions6). For reactions that
Figure 2.2 Schematic diagram of potential energy surfaces indicating the Ea or the
“activation barrer” for hydrogen and deuterium labeled compounds and associated
transition states (TS) upon transition from (a) reactant to (b) a tight TS (e.g., SN2 TS) or (c)
a “loose” transition state (e.g., E2 TS).
D
H
X―H or D
[X- - -H or D]‡
(a)
(b) (c)
Tight Transition State
(e.g., SN2 TS)
Ea(H) > Ea(D)
KIE < 1 Loose Transition State
(e.g., E2 TS)
Ea(H) < Ea(D)
KIE > 1
CH3
C Y
H H
X
CC
H
HH
H
H
Y
X
23
proceed by both an E2 and SN2 mechanism an overall KIE is measured, which provides
qualitative insight into the competition between these two mechanisms.
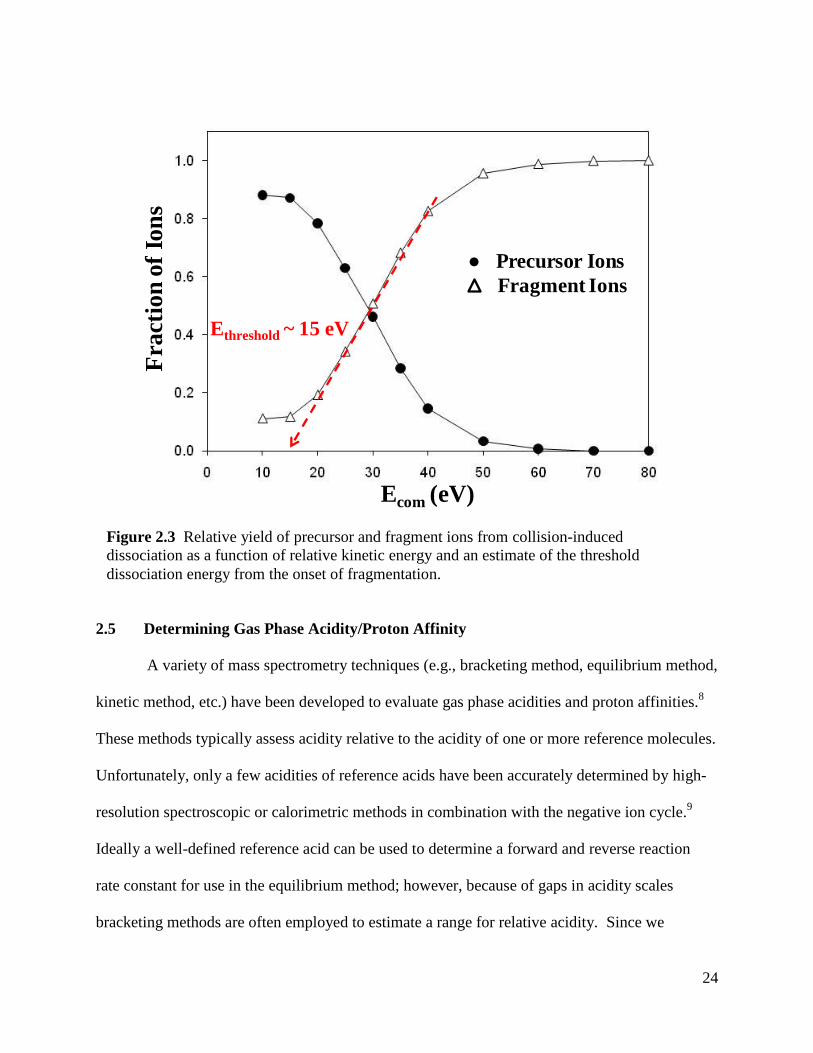
2.4 Collision-Induced Dissociation
Structural information and bond dissociation energies can be evaluated by mass
spectrometry via collision-induced dissociation (CID).7,8
In CID, precursor ions are accelerated
by an electrical potential to a higher kinetic energy and then allowed to collide with a neutral
collision gas (helium in our studies). At low impact energies (< 100 eV) some of the kinetic
energy is converted into internal energy and dissociation occurs by vibrational and rotational
excitation of the ions. Structural features of the precursor ion can be identified based on the
fragmentation pattern observed in the mass spectrum. Under controlled ion translational energy
conditions, thermochemical properties can be determined from the appearance energy for
dissociation. By plotting ion signal as a function of this energy-resolved data, the observation of
the onset of specific ions can be fitted to locate a threshold dissociation energy. The relevant
energy for analysis must be converted from the lab frame (Elab) to the center-of-mass (Ecom)
frame of reference. Figure 2.3 depicts the relative yield of precursor and fragment ions from
collision-induced dissociation as a function of relative kinetic energy and an estimate of the
threshold dissociation energy from the onset of fragmentation.
24
2.5 Determining Gas Phase Acidity/Proton Affinity
A variety of mass spectrometry techniques (e.g., bracketing method, equilibrium method,
kinetic method, etc.) have been developed to evaluate gas phase acidities and proton affinities.8
These methods typically assess acidity relative to the acidity of one or more reference molecules.
Unfortunately, only a few acidities of reference acids have been accurately determined by high-
resolution spectroscopic or calorimetric methods in combination with the negative ion cycle.9
Ideally a well-defined reference acid can be used to determine a forward and reverse reaction
rate constant for use in the equilibrium method; however, because of gaps in acidity scales
bracketing methods are often employed to estimate a range for relative acidity. Since we
Figure 2.3 Relative yield of precursor and fragment ions from collision-induced
dissociation as a function of relative kinetic energy and an estimate of the threshold
dissociation energy from the onset of fragmentation.
Ecom (eV)
Fra
ctio
n o
fIo
ns
Precursor Ions
Fragment Ions
Ethreshold ~ 15 eV
25
measure reaction rates, we can experimentally assess the Gibbs energy associated with gas-phase
acidity. In order to calculate proton affinities we computationally calculate an entropic
contribution to the free energy (Eq 2.6)
∆acidH298 = ∆acidG298 + TΔS, where T = 298 K (2.6)
2.5.1 Equilibrium Method (Keq = kf /kr)
In general, a forward (kf : Aref¯ + HAunknown HAref + Aunknown¯) and reverse (kr :
Aunknown¯ + HAref HAunknown + Aref¯) proton transfer rate constant can be measured relative to
a reference molecule when the reference acid is similar in acidity to the unknown acid (if not,
either the forward or reverse rate is outside the detection limits of our instrument). The
forward/reverse rate constant ratio gives the proton transfer equilibrium constant (Keq = kf/kr).
The relative change in Gibbs energy of the proton transfer reaction can be related to the
equilibrium constant through the Gibbs free energy expression in Equation 2.7.
(∆acidG298)= -RT ln( ) (2.7)
The reported accuracy for this method can be fairly high since the error involves the root sum
square of the uncertainty in the reference acid and the error in the measurements.
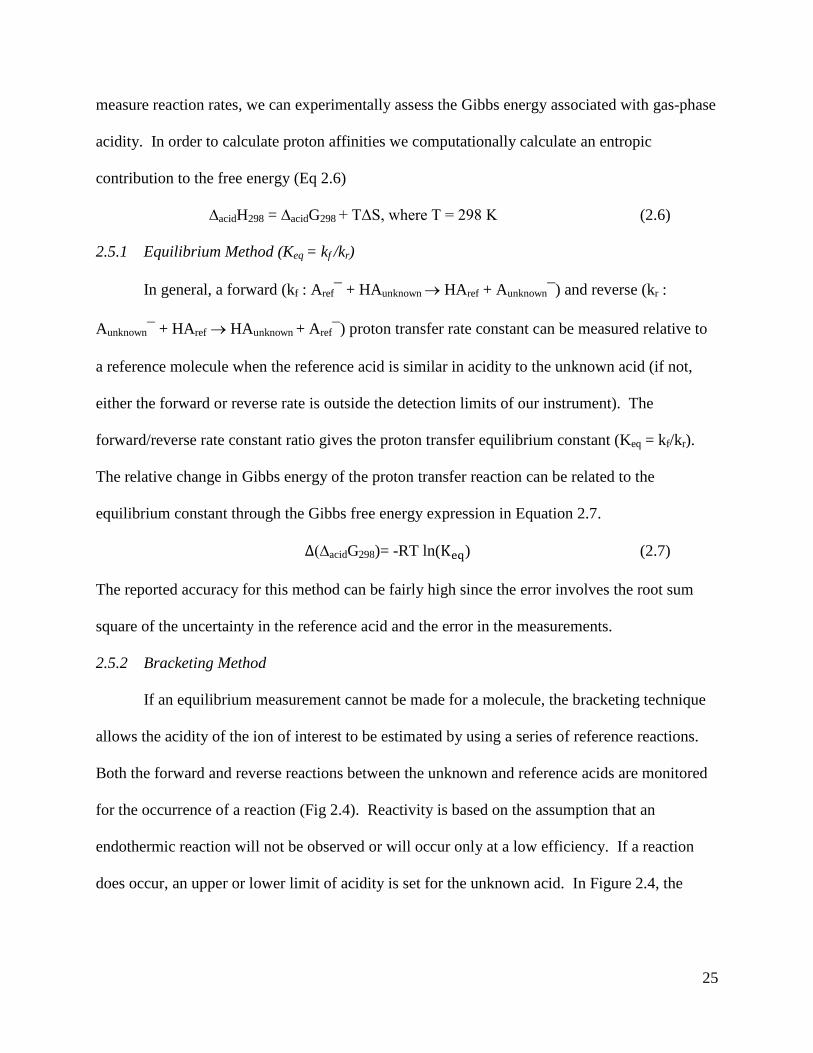
2.5.2 Bracketing Method
If an equilibrium measurement cannot be made for a molecule, the bracketing technique
allows the acidity of the ion of interest to be estimated by using a series of reference reactions.
Both the forward and reverse reactions between the unknown and reference acids are monitored
for the occurrence of a reaction (Fig 2.4). Reactivity is based on the assumption that an
endothermic reaction will not be observed or will occur only at a low efficiency. If a reaction
does occur, an upper or lower limit of acidity is set for the unknown acid. In Figure 2.4, the
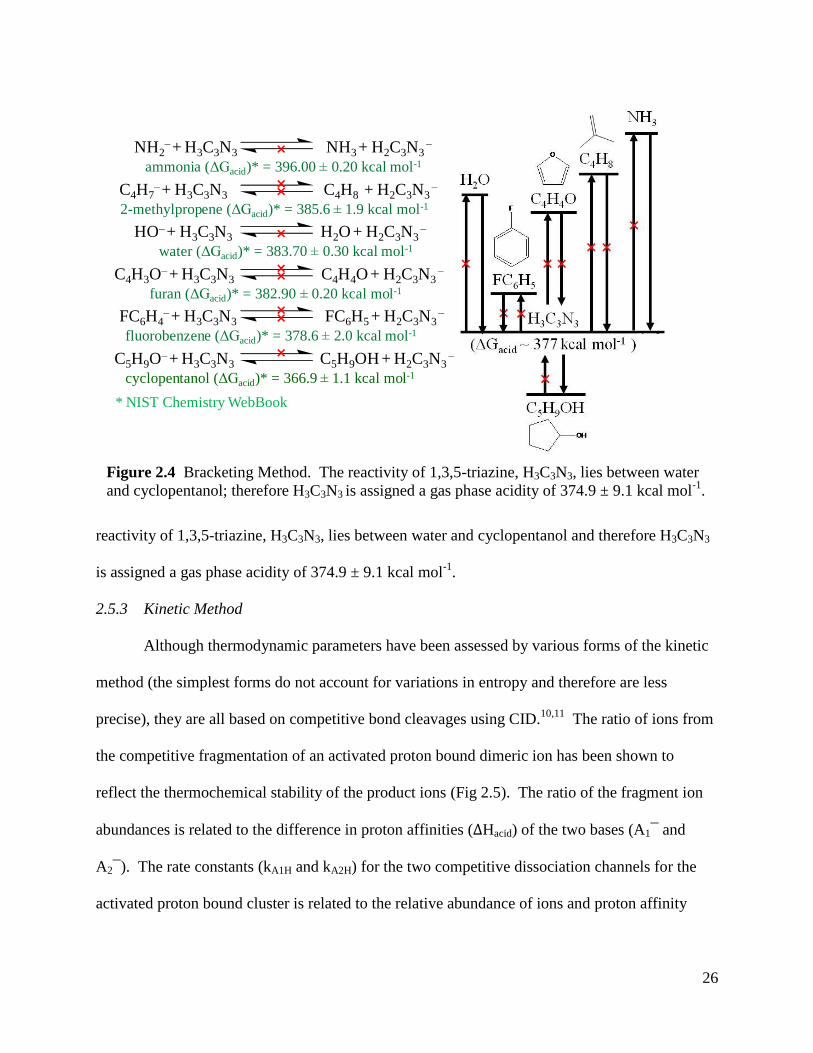
26
reactivity of 1,3,5-triazine, H3C3N3, lies between water and cyclopentanol and therefore H3C3N3
is assigned a gas phase acidity of 374.9 ± 9.1 kcal mol-1
.
2.5.3 Kinetic Method
Although thermodynamic parameters have been assessed by various forms of the kinetic
method (the simplest forms do not account for variations in entropy and therefore are less
precise), they are all based on competitive bond cleavages using CID.10,11
The ratio of ions from
the competitive fragmentation of an activated proton bound dimeric ion has been shown to
reflect the thermochemical stability of the product ions (Fig 2.5). The ratio of the fragment ion
abundances is related to the difference in proton affinities (ΔHacid) of the two bases (A1¯ and
A2¯). The rate constants (kA1H and kA2H) for the two competitive dissociation channels for the
activated proton bound cluster is related to the relative abundance of ions and proton affinity
Figure 2.4 Bracketing Method. The reactivity of 1,3,5-triazine, H3C3N3, lies between water
and cyclopentanol; therefore H3C3N3 is assigned a gas phase acidity of 374.9 ± 9.1 kcal mol-1
.
NH2–+ H3C3N3 NH3 + H2C3N3
–
ammonia (ΔGacid)* = 396.00 0.20 kcal mol-1˟
HO–+ H3C3N3 H2O + H2C3N3–
water (ΔGacid)* = 383.70 0.30 kcal mol-1˟
C4H7–+ H3C3N3 C4H8 + H2C3N3
–
2-methylpropene (ΔGacid)* = 385.6 1.9 kcal mol-1˟˟
FC6H4–+ H3C3N3 FC6H5 + H2C3N3
–
fluorobenzene (ΔGacid)* = 378.6 2.0 kcal mol-1˟˟
* NIST Chemistry WebBook
H2O
H3C3N3
(ΔGacid ~ 377 kcal mol-1 )
CH3OH
˟
NH3
˟
C4H8
˟ ˟C4H3O
–+ H3C3N3 C4H4O + H2C3N3–
furan (ΔGacid)* = 382.90 0.20 kcal mol-1˟˟
O
C4H4O
˟˟
˟
FC6H5
F
˟
C5H9OH
OH
˟
C5H9O–+ H3C3N3 C5H9OH + H2C3N3
–
cyclopentanol (ΔGacid)* = 366.9 1.1 kcal mol-1
˟

27
difference by Equation 2.8, where Teff is the effective temperature (energy) of the activated
dimer.10,11
A calibration line based on the ion ratios of the unknown acid (AHunknown) to
reference acids as a function of the proton affinity of the reference acids provides a slope of
[-1/RTeff] and an intercept of [ΔHacid(AHunknown)/RTeff].
Figure 2.5 Kinetic Method. Potential energy surface for the proton bound dimeric ion
depicting competitive dissociation between acids (A1H and A2H) upon collision-induced
activation.
[A1H∙∙∙A2 ―]
[A1―∙∙∙HA2]
[A1∙∙∙H∙∙∙A2]*‡―
Ecom
A1― + HA2A1H + A2
―
Reaction Coordinate
En
erg
y
kA1H kA2H
[A1∙∙∙H∙∙∙A2]‡―
ΔHacid

28
2.6 References
1. Simons, J. Molecular Ions Web Site, http://www.hec.utah.edu/anions.
2. Ferguson, E. E.; Fehsenfeld, F.C.; Schmeltekopf, A.L. Adv. At. Mol. Phys. 1969, 5, 1-69.
3. Smith, D.; Mcintosh, B. J.; Adams, N. G. J. Chem. Phys. 1989, 90, 6213-6219.
4. Van Doren, J. M.; Barlow, S. E.; DePuy, C. H.; Bierbaum, V. M. Int. J. Mass Spectrom.
Ion Processes 1987, 81, 85-100.
5. Van Doren, J. M. The Tandem Flowing Afterglow-SIFT-DRIFT: Developments and
Applications to Gas Phase Ion Chemistry, PhD Thesis, Department of Chemistry and
Biochemistry, University of Colorado at Boulder 1983.
6. Davico, G. E.; Bierbaum, V. M. J. Am. Chem. Soc. 2000, 122, 1740-1748.
7. Schalley, C.; Armentrout, P. Threshold Collision-Induced Dissociations for the
Determination of Accurate Gas-Phase Binding Energies and Reaction Barriers. In
Modern Mass Spectrometry, Springer Berlin / Heidelberg: 2003; 225, 233-262.
8. Ervin, K. M. Chem. Rev. 2001, 101, 391-444.
9. Ervin, K. M.; DeTuro, V. F. J. Phys. Chem. A 2002, 106, 9947-9956.
10. Cooks, R. G.; Wong, P. S. H. Acc. Chem. Res. 1998, 31, 379-386.
11. Cooks, R. G.; Koskinen, J. T.; Thomas, P. D. J. Mass Spectrom. 1999, 34, 85-92.

29
CHAPTER 3
A Direct Comparison of Reactivity and Mechanism in the Gas Phase and in Solution
Adapted from
Garver, J. M.; Fang, Y; Eyet, N.; Villano, S. M.; Bierbaum, V. M.; Westaway, K. C. J. Am. Chem. Soc.,
2010, 132, 3808-3814
Overview
Direct comparisons of the reactivity and mechanistic pathways for anionic systems in the gas
phase and in solution are presented. Rate constants and kinetic isotope effects for the reactions of
methyl, ethyl, i-propyl, and t-butyl iodide with cyanide ion in the gas phase, as well as for the
reactions of methyl and ethyl iodide with cyanide ion in several solvents, are reported. In
addition to measuring the perdeutero kinetic isotope effect (KIE) for each reaction, the secondary
α- and β-deuterium KIEs were determined for the ethyl iodide reaction. Comparisons of
experimental results with computational transition states, KIEs, and branching fractions are
explored to determine how solvent affects these reactions. The KIEs show that the transition
state does not change significantly when the solvent is changed from dimethyl
sulfoxide/methanol (a protic solvent) to dimethyl sulfoxide (a strongly polar aprotic solvent) to
tetrahydrofuran (a slightly polar aprotic solvent) in the ethyl iodide−cyanide ion SN2 reaction in
solution, as the “Solvation Rule for SN2 Reactions” predicts. However, the Solvation Rule fails
the ultimate test of predicting gas phase results, where significantly smaller (more inverse) KIEs
indicate the existence of a tighter transition state. This result is primarily attributed to the greater
electrostatic forces between the partial negative charges on the iodide and cyanide ions and the
partial positive charge on the α carbon in the gas phase transition state. Nevertheless, in
evaluating the competition between SN2 and E2 processes, the mechanistic results for the
solution and gas phase reactions are strikingly similar. The reaction of cyanide ion with ethyl
iodide occurs exclusively by an SN2 mechanism in solution and primarily by an SN2 mechanism
in the gas phase; only 1% of the gas phase reaction is ascribed to an elimination process.
CN– + CH3I CH3CN + I–
Solution
Gas
Phase

30
3.1 Introduction
The influence of solvent on reactions has intrigued chemists for many years. Ions in the
gas phase often react differently than the same ions in solution, where coordinating solvent
molecules stabilize charges. These effects are evident in the large differences between reaction
rate constants of identical gas and condensed phase reactions,1,2
in the reversal of ordering of
acidities and basicities in solution versus the gas phase,3,4
as well as in the enhanced
nucleophilicity of polarizable nucleophiles in solution versus the gas phase.5 While gas phase
studies allow one to probe the intrinsic reactivity of a molecule, a comparison of these results to
solution allows one to directly probe the role of the solvent. For example, Figure 3.1 shows a
potential energy diagram for an SN2 reaction in the gas phase (curve a), in an aprotic solvent
Figure 3.1. Potential energy diagram of a generic SN2 reaction in the gas phase (curve a), in
an aprotic solvent (curve b), and in a protic solvent (curve c).
ΔH‡protic > ΔH‡
aprotic
Reaction Coordinate
ΔHrxn
ΔHrxn
ΔH‡gas phasea)
b)
X– + RY X– ····RY [X····R····Y]–‡ RX····Y– RX + Y–
protic solvent
aprotic solvent
ΔHrxn
ΔHsolv(TS)ΔHsolv(reactants) ΔHsolv(products)
c)

31
(curve b), and in a protic solvent (curve c). In the gas phase, the ion and neutral molecule are
attracted by ion-dipole and ion-induced-dipole forces, resulting in the formation of an encounter
complex. Because the energy (~15–20 kcal mol-1
)6 released in forming the new bonds is
converted to internal energy, the complex has sufficient energy to overcome the reaction barrier
and form a product complex, which dissociates into the separated products. While there is ample
energy for reaction, an ordered transition state slows the process, and hence not every collision
results in reaction. The barrier height, and therefore the sum of states above the barrier, can be
dramatically different for different ion-neutral pairs. The vertical separation between curves (a)
and (b) and between curves (a) and (c) reflects the solvation energy of the reactants, products,
and transition state, in the aprotic and protic solvents, respectively. When the reactants and
products for the SN2 reaction in Figure 3.1 are placed in solution, considerable energy is released
due to solvation of the localized charge on the anion and to a lesser extent, the dipole in the
substrate. In the transition state, on the other hand, the charge is dispersed and the solvation
energy is much smaller. As a result, the central barrier (ΔH‡) to reaction is much higher (the
reactions are much slower) in solution than in the gas phase; as indicated in Figure 3.1, reaction
barriers are higher in protic solvents relative to aprotic solvents. Figure 3.1 also defines ΔH‡ for
the gas phase transition state relative to the reactants; a more negative ΔH‡ represents a lower
energy barrier.
Studies of ion-molecule reactions in both solution and the gas phase have focused on how
various nucleophiles, leaving groups, and substituents affect the reactivity of alkyl halides, and
how various factors determine kinetics, mechanisms, and relative product distributions.7-12
In
particular, competition between base-induced elimination (E2) and nucleophilic substitution
32
(SN2) mechanisms is significantly influenced by the nature of the attacking group (X–), leaving
group abilities (Y), substrate properties, and solvent effects.13-16
X– + CH3CH2Y 2NS
CH3CH2X + Y–
2E C2H4 + HX + Y–
Substituent effects on transition state structure indicate that both electronic and geometric (steric
hindrance) effects influence the SN2/E2 ratio.11, 17
Condensed and gas phase data show a
transition from a predominantly substitution pathway to a predominantly elimination pathway as
the steric hindrance around the α-carbon is increased (CH3CH2Y to (CH3)2CHY to (CH3)3CY).
This shift in reaction pathway occurs because the additional methyl groups increase the steric
crowding in the SN2 transition state, thereby increasing the activation barrier and reducing the
reaction rate. In contrast, the activation barrier for the E2 pathway, which is less affected by
crowding in the transition state, appears to be lowered by the additional methyl groups producing
faster rates.17
In previous work, the study of microsolvated ions has been undertaken as a way to bridge
the gap between gas phase and solution. Extensive experimental18-22
and theoretical23-27
work
has been carried out to understand SN2 reactions, while fewer studies have examined E2
reactions.28-31
While these experiments have provided valuable insight, they are typically limited
to processes with a reaction efficiency greater than 10-3
. The direct comparison of gas phase and
solution results in this study provides additional insight into this problem.
Deuterium KIEs were employed in our gas and condensed phase reactions to probe the
structure of the transition state and relative reaction pathways. A deuterium KIE is the ratio of
the rate constant for an undeuterated reactant to the rate constant for a particular deuterated
reactant, (KIE = kH/kD.) These KIEs are primarily due to changes in the vibrations of bonds
33
involving the isotopes as a reaction proceeds from reactants to products. A normal KIE (>1) is
observed when these bonds are loosened on going from reactants to the transition state. This
causes a decrease in zero point energy as the reaction proceeds from separated reactants to the
transition state. An inverse KIE (<1) results from the tightening of these bonds on going to the
transition state, causing an increase in the difference in zero point energy as the reaction
proceeds. Although normal KIEs are characteristic of E2 reactions and inverse KIEs are typical
of SN2 reactions, this interpretation must be tempered due to minor contributions from all modes
(translational, vibrational, rotational). For reactions that proceed by both an E2 and SN2
mechanism an overall KIE is measured, which provides qualitative insight into the competition
between these two mechanisms.
In this study, the reactivity, KIEs, and substituent effects for a series of alkyl iodide-
cyanide ion reactions in the gas phase and in solution are evaluated. The reaction rate constants
and KIEs for methyl, ethyl, i-propyl, and t-butyl iodide with cyanide ion in the gas phase, and of
methyl and ethyl iodide with cyanide ion in solution, are reported. The reactions in solution were
carried out in three different solvents – a methanol/dimethyl sulfoxide mixture (CH3OH/DMSO),
dimethyl sulfoxide (DMSO), and tetrahydrofuran (THF). CH3OH is a protic solvent that is
capable of forming strong hydrogen bonds to the negatively charged nucleophile in the ground
state and transition state, DMSO is a very polar aprotic solvent, and THF is a weakly polar
aprotic solvent that will solvate ions only very weakly. These solvents provide a smooth gradual
transition to the gas phase conditions. In addition to measuring the perdeutero KIE, (kH/kD)D5,
for the ethyl iodide reaction, the secondary α-deuterium, (kH/kD)α-D2, and secondary β-deuterium,
(kH/kD)β-D3 KIEs were determined for the ethyl iodide reaction. Computational transition states,
KIEs, and branching fractions for these reactions provide additional support for our conclusions.
34
3.2 Experimental
3.2.1 Gas Phase Experimental
These reactions were carried out in a flowing afterglow-selected ion flow tube (FA-SIFT)
mass spectrometer.32
The reactant anion, CN–, is produced by electron impact on CNBr,
mass-selected using a quadrupole mass filter, and injected into the reaction flow tube where it
becomes thermally equilibrated to room temperature through collisions with He buffer gas (~0.5
torr, ~104 cm s
-1). A known flow of neutral reagents was added to the reaction flow tube through
a series of fixed inlets at various distances along the flow tube, and the depletion of the reactant
ions and formation of the product ions were monitored using the detection quadrupole mass filter
coupled to an electron multiplier. Reaction rate constants were determined under pseudo-first
order conditions, where the concentration of the alkyl halide (~1011
molecules cm-3
) was
significantly greater than the concentration of cyanide ion (~105 ions cm
-3). The reactant ion
signal was monitored as the position of the neutral reagent addition was varied, thereby changing
the reaction distance and time. The reaction rate constant is obtained from the slope of a plot of
the ln [ion] as a function of the reaction distance and other measured experimental parameters.
The reported values are the averages of at least three individual measurements.
Absolute uncertainties in these rate measurements are ± 20%, however some systematic errors
(pressure, temperature, He flow rate, etc.) cancel in the rate constant ratio, so that the error bars
for KIEs are significantly smaller. Neutral reagents [CH3I, Aldrich 99.5%; CD3I, Cambridge
Isotope Laboratories 99.5% D; CH3CH2I, Aldrich 99%; CD3CD2I, Isotec 99.5% D; CD3CH2I,
Isotec 98% D; CH3CD2I, Isotec 98% D; (CH3)2CHI, Aldrich 99%; (CD3)2CDI, CDN Isotopes
99.1% D; (CH3)3CI, Aldrich 95%; (CD3)3CI, CDN Isotopes 99.5% D] were obtained from
commercial vendors and purified by several freeze-pump-thaw cycles before use. The reagents
35
were protected from light and stored under vacuum. Helium buffer gas (99.995%) was purified
by passage through a molecular sieve trap immersed in liquid nitrogen. Parallel reactions of
deuterated and undeuterated reactants were carried out under identical conditions.
3.2.2 Condensed Phase Experimental
The rate constants were measured using the procedure outlined for the reaction of ethyl
iodide in a previous study,12
except that the stock solutions were prepared as follows. The alkyl
iodide stock solutions for the reactions of ethyl iodide in DMSO and THF were prepared by
adding approximately 18 μL of the alkyl iodide to 10 mL of the solvent. For the reaction of ethyl
iodide in 90% CH3OH/10% DMSO (v/v), the ethyl iodide stock solution was prepared by adding
36 μL of ethyl iodide to 10 mL of the solvent. The methyl iodide stock solution for the reaction
in 40% CH3OH/60% DMSO (v/v) was prepared by adding approximately 8 μL of methyl iodide
to 10 mL of solvent. The tetrabutylammonium cyanide stock solutions for the ethyl iodide
reactions in DMSO and THF and for the methyl iodide reactions in 40% CH3OH/60% DMSO
(v/v) were prepared by dissolving 75 mg of tetrabutylammonium cyanide (accurately weighed)
in 50.00 mL of solvent. The tetrabutylammonium cyanide stock solution for the ethyl iodide
reaction in 90% CH3OH/10% DMSO (v/v) was prepared by dissolving approximately 0.170 g of
tetrabutylammonium cyanide (accurately weighed) in 25.00 mL of solvent. Twenty mL of the
tetrabutylammonium cyanide stock solution was transferred into a reaction flask fitted with a
serum cap and the reaction flask and the alkyl iodide stock solutions were temperature
equilibrated for at least one hour. The reaction was started by injecting 5 mL of the appropriate
ethyl iodide stock solution into the reaction flask and 1.00 mL aliquots of the reaction mixture
were taken throughout the reaction and injected into 30 mL of 0.013 M nitric acid. This
quenched the reaction by protonating the nucleophile making it unreactive. After the acidic

36
solution containing HCN from the unreacted cyanide ion had been stirred in the fume hood for at
least an hour to remove the hydrogen cyanide, the iodide ion in the sample was analyzed using a
potentiometric titration and a 0.0005 M silver nitrate solution. The rate constants were
calculated using the standard kinetic equation for a second order reaction that is first order in
both reactants. The iodide reagents [CH3I, 99.5%; CD3I, 99.5% D; CH3CH2I, 99%; CD3CD2I,
99.5% D; CH3CD2I, 98% D] were purchased from Sigma-Aldrich. The reported rate constants
are the averages of at least three individual measurements.
3.2.3 Computational Methods
Electronic structure calculations were carried out using the Gaussian 0333
suite of
programs to provide additional insight into the experimental results. Since it has been shown
that the calculated KIEs for the ethyl iodide–cyanide ion SN2 reaction vary markedly with the
level of theory,12
several levels of theory and basis sets were investigated. The MP234
level of
theory with the 6-311++G(2d,p) basis set35,36
for C, N, and H and the LanL2DZ effective core
potential37
for I correctly predicted the magnitude of the observed (kH/kD)α-D3 for the methyl
iodide–cyanide ion reaction, which can only occur by the SN2 mechanism. Therefore, this level
of theory was used in all subsequent calculations and scaling was not applied. Although
Merrick, Moran, and Radom have not recommended optimal scaling factors for this level of
theory, similar theoretical methods have zero point vibrational energy, enthalpy, and entropy
scaling factors near unity.38
Application of these factors might slightly change the absolute KIE
values. However, work on similar reactions by Nielson, Glad, and Jensen indicates scaling does
not affect the relative KIEs.39
Therefore, we expect the magnitude and relative changes in our
calculated KIEs to provide consistent interpretation of transition state structures without scaling.
37
The KIEs were calculated using transition state theory, formulated by assuming that any
variational or tunneling effects are insignificant:
r‡‡
HD
D
H
GGGwhere
RT
GGexp
k
k‡‡
ΔG ‡ is the difference between the zero point corrected free energy of the transition state relative
to the separated reactants. Transition states were confirmed by the existence of one imaginary
frequency along the reaction coordinate. The kH/kD ratio for the SN2 and E2 transition states
provides relative KIEs for each pathway. The % SN2 was determined using the same formula
with the ratio of the theoretical rate constants for the perprotio reaction, kSN2/(kSN2 + kE2). All
frequencies are treated using the harmonic approximation. Although harmonic treatment of low
frequency modes can introduce error into the entropy term of the free energy, this effect appears
to be minimized in our KIE calculations due to the relatively small changes in the lowest
frequencies upon isotopic substitution.
3.3 Results and Discussion
3.3.1 Gas Phase Reactions
The experimental rate constants, reaction efficiencies, and deuterium KIEs for the
reactions of cyanide ion with alkyl iodides in the gas phase are given in Table 3.1. With the
exception of the reaction of CN–
with i-propyl iodide, the reaction rate constants were within the
detectable range of 10-9
to 10-12
cm3 molecule
-1 s
-1. The reaction efficiencies (krxn/kcol, where kcol
is calculated using parameterized trajectory theory40
) are less than 7%; this low reactivity is
consistent with the low proton affinity and delocalized nature of the anion. With efficiencies
well below the collision-controlled limit, the KIEs are expected to reflect the intrinsic reactivity
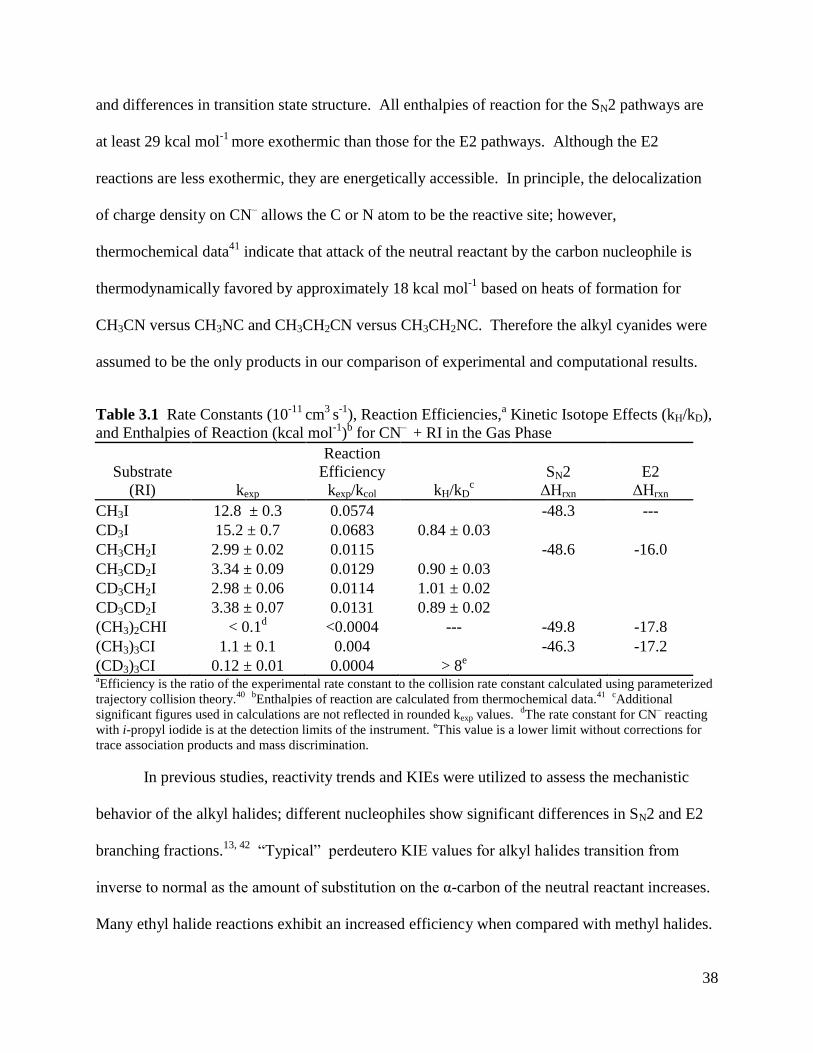
38
and differences in transition state structure. All enthalpies of reaction for the SN2 pathways are
at least 29 kcal mol-1
more exothermic than those for the E2 pathways. Although the E2
reactions are less exothermic, they are energetically accessible. In principle, the delocalization
of charge density on CN– allows the C or N atom to be the reactive site; however,
thermochemical data41
indicate that attack of the neutral reactant by the carbon nucleophile is
thermodynamically favored by approximately 18 kcal mol-1
based on heats of formation for
CH3CN versus CH3NC and CH3CH2CN versus CH3CH2NC. Therefore the alkyl cyanides were
assumed to be the only products in our comparison of experimental and computational results.
Table 3.1 Rate Constants (10-11
cm3
s-1
), Reaction Efficiencies,a Kinetic Isotope Effects (kH/kD),
and Enthalpies of Reaction (kcal mol-1
)b for CN
– + RI in the Gas Phase
Substrate
(RI) kexp
Reaction
Efficiency
kexp/kcol kH/kDc
SN2
ΔHrxn
E2
ΔHrxn
CH3I 12.8 ± 0.3 0.0574 -48.3 ---
CD3I 15.2 ± 0.7 0.0683 0.84 ± 0.03
CH3CH2I 2.99 ± 0.02 0.0115 -48.6 -16.0
CH3CD2I 3.34 ± 0.09 0.0129 0.90 ± 0.03
CD3CH2I 2.98 ± 0.06 0.0114 1.01 ± 0.02
CD3CD2I 3.38 ± 0.07 0.0131 0.89 ± 0.02
(CH3)2CHI < 0.1d
<0.0004 --- -49.8 -17.8
(CH3)3CI 1.1 ± 0.1 0.004
-46.3 -17.2
(CD3)3CI 0.12 ± 0.01 0.0004 > 8e
aEfficiency is the ratio of the experimental rate constant to the collision rate constant calculated using parameterized
trajectory collision theory.40
bEnthalpies of reaction are calculated from thermochemical data.
41
cAdditional
significant figures used in calculations are not reflected in rounded kexp values. dThe rate constant for CN
– reacting
with i-propyl iodide is at the detection limits of the instrument. eThis value is a lower limit without corrections for
trace association products and mass discrimination.
In previous studies, reactivity trends and KIEs were utilized to assess the mechanistic
behavior of the alkyl halides; different nucleophiles show significant differences in SN2 and E2
branching fractions.13, 42
“Typical” perdeutero KIE values for alkyl halides transition from
inverse to normal as the amount of substitution on the α-carbon of the neutral reactant increases.
Many ethyl halide reactions exhibit an increased efficiency when compared with methyl halides.
39
This has been attributed to either an increased stabilization of the SN2 transition state and/or an
E2 contribution to the reaction. Further substitution on the alpha carbon generates additional
steric hindrance to the SN2 reaction, which overcomes the SN2 stabilizing electronic effects,
leading to significant amounts of E2 reaction. Reactions of t-butyl halides proceed exclusively
by the E2 mechanism.13
An inverse (kH/kD)α-D3 of 0.84 ± 0.03 for reaction of CN– with methyl iodide and an
(kH/kD)α-D2 of 0.90 ± 0.03 for the reaction of CN– with ethyl iodide are consistent with previously
reported values for systems that proceed primarily or exclusively by an SN2 mechanism.42, 43
The
unusually large KIE (> 8) measured for the reaction of t-butyl iodide with CN– indicates that the
reaction probably proceeds exclusively by an E2 mechanism. However unlike typical reaction
systems, the reaction efficiency decreases from methyl to i-propyl, and then increases for t-butyl
iodide. The observed decrease in rate constant from methyl to i-propyl shows the typical
decrease in the SN2 channel, but an unusually small increase in the E2 channel relative to
previous results.13, 17, 42, 43
The exceptionally large increase in the rate constant and efficiency
from the i-propyl to the t-butyl iodide reaction may be due to significant release of steric strain in
going to the transition state of the t-butyl iodide reaction, i.e., t-butyl iodide is especially strained
due to the large iodine atom and the multiple methyl groups.
3.3.2 Condensed Phase Reactions
The rate constants expressed in both solution and gas phase units, and the perdeutero
KIEs for the SN2 reaction between cyanide ion and methyl iodide in 40% CH3OH/60% DMSO
and ethyl iodide in 90% CH3OH/10% DMSO, DMSO, and THF are presented in Table 3.2. All
values are consistent with an SN2 mechanism for the reaction.44
The smaller (more inverse) KIE
found for the methyl iodide–cyanide ion reaction in 40% CH3OH/60% DMSO, Table 3.2, is
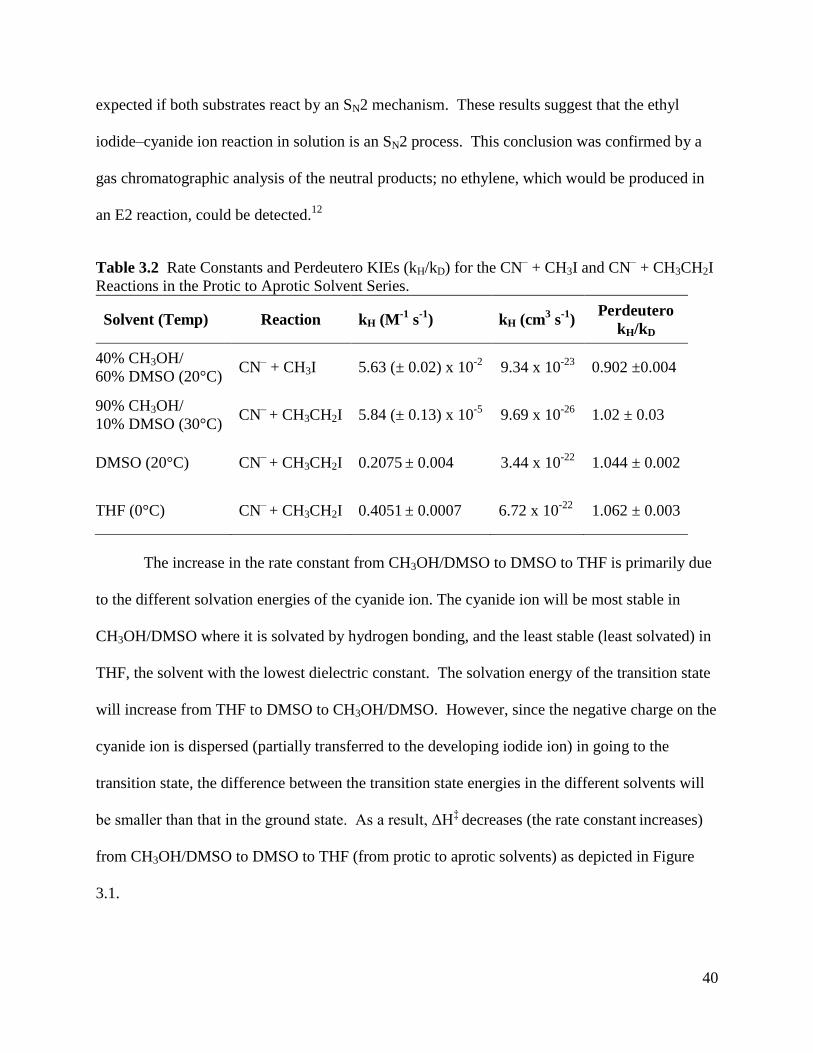
40
expected if both substrates react by an SN2 mechanism. These results suggest that the ethyl
iodide–cyanide ion reaction in solution is an SN2 process. This conclusion was confirmed by a
gas chromatographic analysis of the neutral products; no ethylene, which would be produced in
an E2 reaction, could be detected.12
Table 3.2 Rate Constants and Perdeutero KIEs (kH/kD) for the CN– + CH3I and CN
– + CH3CH2I
Reactions in the Protic to Aprotic Solvent Series.
Solvent (Temp) Reaction kH (M-1
s-1
) kH (cm3 s
-1)
Perdeutero
kH/kD
40% CH3OH/
60% DMSO (20°C) CN
– + CH3I 5.63 (± 0.02) x 10
-2 9.34 x 10
-23 0.902 ±0.004
90% CH3OH/
10% DMSO (30°C) CN
– + CH3CH2I 5.84 (± 0.13) x 10
-5 9.69 x 10
-26 1.02 ± 0.03
DMSO (20°C) CN–
+ CH3CH2I 0.2075 ± 0.004 3.44 x 10
-22 1.044 ± 0.002
THF (0°C) CN–
+ CH3CH2I 0.4051 ± 0.0007 6.72 x 10
-22 1.062 ± 0.003
The increase in the rate constant from CH3OH/DMSO to DMSO to THF is primarily due
to the different solvation energies of the cyanide ion. The cyanide ion will be most stable in
CH3OH/DMSO where it is solvated by hydrogen bonding, and the least stable (least solvated) in
THF, the solvent with the lowest dielectric constant. The solvation energy of the transition state
will increase from THF to DMSO to CH3OH/DMSO. However, since the negative charge on the
cyanide ion is dispersed (partially transferred to the developing iodide ion) in going to the
transition state, the difference between the transition state energies in the different solvents will
be smaller than that in the ground state. As a result, ΔH‡
decreases (the rate constant increases)
from CH3OH/DMSO to DMSO to THF (from protic to aprotic solvents) as depicted in Figure
3.1.
41
3.3.3 Comparison of Gas Phase and Solution Results
The transition states of the methyl and ethyl iodide reactions in solution and gas phase
were further probed using secondary α- and β-deuterium KIEs. These KIEs, measured in the
condensed and gas phase, as well as the calculated branching fractions and KIEs are given in
Table 3.3. It has been assumed that the solution perdeutero KIE for the ethyl iodide reaction is
the product of the (kH/kD)β-D3 and (kH/kD)α-D2:
ICDCHCN
ICHCHCN
ICHCDCN
ICHCHCN
ICDCDCN
ICHCHCN
k
k
k
k
k
k
23_
23_
23_
23_
23_
23_
= (kH/kD)β-D3 × (kH/kD)α-D2
Because the (kH/kD)β-D3 values for the reactions in solution were expected to be near unity, they
were calculated from this relationship rather than experimentally measured. While the current
gas phase data as well as our computational results support the use of this multiplicative
technique, other gas phase results29,45
indicate this relationship may only be an approximation
rather than a rigid equality. To accommodate the inexact nature of the relationship, no error bars
have been given for the (kH/kD)β-D3 values in solution.
Because the rate of the ethyl iodide–cyanide ion reaction changed by a factor of 104 when
the solvent was changed from CH3OH/DMSO to THF, the rate constants and the KIEs could not
be measured at the same temperature in the three solvents, Table 3.3. In order to accurately
compare the KIEs in the different solvents, a temperature correction for the KIE was needed.
This was possible for the (kH/kD)α-D2 values. The average temperature dependence of (kH/kD)α-D2
from 34 reactions in three different laboratories44, 46, 47
was 1.0 (± 1.0) x 10-3
/oC. Applying this
correction to the (kH/kD)α-D2 in Table 3.3 gives the best estimate of the (kH/kD)α-D2 for the SN2
reaction between cyanide ion and ethyl iodide in the three solvents at 20oC, column 6, Table 3.3.
Although no temperature dependence could be found for the (kH/kD)β-D3 or (kH/kD)D5 KIEs, a

Table 3.3 A Comparison of Experimental and Theoreticala Deuterium KIEs for the CN
– + CH3I and CN
– + CH3CH2I Reactions in the
Gas Phaseb and in Solution
c.
Reaction Phase
CN– + CH3I CN
– + CH3CH2I
(kH/kD)-D3
(kH/kD)D5 Corrected
(kH/kD)D5 (20C) (kH/kD)-D2
Corrected
(kH/kD)-D2(20C) (kH/kD)-D3
Corrected
(kH/kD)-D3(20C)
40% CH3OH/
60% DMSO 0.902 0.004
d
---
--- --- --- --- ---
90% CH3OH/
10% DMSO ---
1.02 0.03
e 1.03 0.04 1.015 0.02
e 1.03 0.03 1.005
g 1.00
g
DMSO ---
1.044 0.002d
1.044 0.002 1.032 0.004d
1.032 0.004 1.012g
1.012g
THF ---
1.062 0.003f
1.04 0.02 1.040 0.003f
1.02 0.02 1.021g
1.02g
Gas Phase 0.84 0.03
0.89 0.02 0.90 0.03 1.01 0.02
Theoretical SN2
Gas Phase 0.83 0.89 0.91 0.97
THF --- 1.087 1.059 1.028
Theoretical E2
Gas Phase --- 8.4 1.1 7.8
a Theoretical SN2 and E2 KIEs used conventional transition state theory and ΔG
‡ at the MP2 level of theory with the 6-311++G(2d,p) basis set for C, N, and H
and the LanL2DZ effective core potential for I at 298 K. bThe error in the gas phase KIEs is one standard deviation of at least three measurements. Experiments
conducted at 298 K. cThe error in the solution KIEs is 1/kD[(ΔkH)
2 + (kH/kD)
2 x (ΔkD)
2]
1/2, where ΔkH and ΔkD are the standard deviations for the average rate
constants for the reactions of the undeuterated and deuterated substrates, respectively. dExperiments conducted at 20°C.
eExperiments conducted at 30°C.
fExperiments conducted at 0°C.
gThe (kH/kD)β-D3 /corrected (kH/kD)β-D3 was calculated by dividing the experimental/corrected experimental (kH/kD)D5 by the
experimental /corrected experimental (kH/kD)α-D2.
42
43
comparison of the magnitude of these KIEs suggests a relatively small correction factor for the
(kH/kD)β-D3. Therefore, using the single component (kH/kD)α-D2 correction should provide a good
estimate of the actual (kH/kD)D5 values in solution; the corrected (kH/kD)D5 values at 20oC are
given in column 4, Table 3.3.
Computations were carried out to provide additional insight into the experimental results.
The MP234
level of theory with the 6-311++G(2d,p) basis set for C, N, and H and the LanL2DZ
effective core potential for I correctly predicted the observed (kH/kD)α-D3 for the methyl iodide–
cyanide ion reaction that can only occur by the SN2 mechanism, i.e., the computational
(kH/kD)α-D3 of 0.83 found for the CN– + CH3I reaction is in excellent agreement with the
experimental gas phase (kH/kD)α-D3 of 0.84 ± 0.03. Therefore, this level of theory was used in all
subsequent calculations. Solvent calculations were conducted at the same level of theory
employing the polarizable continuum model with a THF dielectric parameter for the ethyl iodide
reactions. Since standard dielectric parameters for mixed solvents are not available in the
Gaussian database, condensed phase KIE calculations for the CN– + CH3I reaction were not
carried out. Consistent with experimental data no transition state structures were found for the
E2 reactions in the condensed phase. The direction of the calculated KIEs is in good agreement
with experimental data. While the consistency of the calculated KIEs for both the gas phase and
THF solvent provides support for our methodology and use of relative KIEs to infer branching
fractions, the qualitative predictions are considered more reliable than quantitative
interpretations.
The theoretical KIE for the methyl iodide–cyanide ion reaction (0.83) is significantly
smaller (more inverse) than the theoretical SN2 (kH/kD)α-D2 for the gas phase ethyl iodide–cyanide
ion reaction (0.91). This larger (less inverse) KIE for ethyl iodide reflects the additional
44
stabilization of the transition state by the polarizable alkyl group,13, 15, 17
the looser transition
states found for the SN2 reactions of ethyl substrates,48
and the fact that this isotope effect is now
due to only two hydrogens rather than three as in the methyl iodide case. The large magnitude of
the E2 (kH/kD)D5 calculated for the gas phase ethyl iodide–cyanide reaction (8.4) arises from a
substantial primary (7.8) and a smaller secondary (1.1) KIE. It is consistent with the large
primary hydrogen-deuterium KIE observed for the E2 reaction between cyanide ion and t-butyl
iodide (>8). Although the calculated KIEs for the E2 reaction are large compared to those
typically found for E2 reactions (KIE = 2-7), they are in good agreement with the KIEs found
experimentally and computationally by Gronert et al.49
for E2 reactions in the gas phase.
Our transition state theory calculations predict the ethyl iodide–cyanide ion reaction to be
99% SN2 and 1% E2. The presence of a small amount of E2 elimination in the gas phase
reaction is consistent within the error range of a comparison of experimental and computational
KIEs. Consider first the gas phase experimental (kH/kD)β-D3 value of 1.01, which exceeds the
computational SN2 value (KIE = 0.97). A simple calculation, detailed in Appendix 1, shows that
this experimental value can be reproduced by a 4% contribution of the E2 channel (KIE = 7.8).
While the experimental (kH/kD)α-D2 and (kH/kD)D5 values suggest no contribution from the E2
channel, the error bars on these values definitely allow a small amount of elimination pathway.
Thus, both the transition state theory calculations and the experimental KIEs suggest there is a
small amount of E2 pathway in the gas phase reaction, whereas there is none in solution. The E2
channel probably competes more effectively with the SN2 channel in the gas phase because the
solvation energy decreases the basicity of the anion in solution.
An examination of the (kH/kD)D5 and (kH/kD)α-D2 values at 20oC in columns 4 and 6 of
Table 3.3 show that neither KIE is affected significantly by the change in solvent from
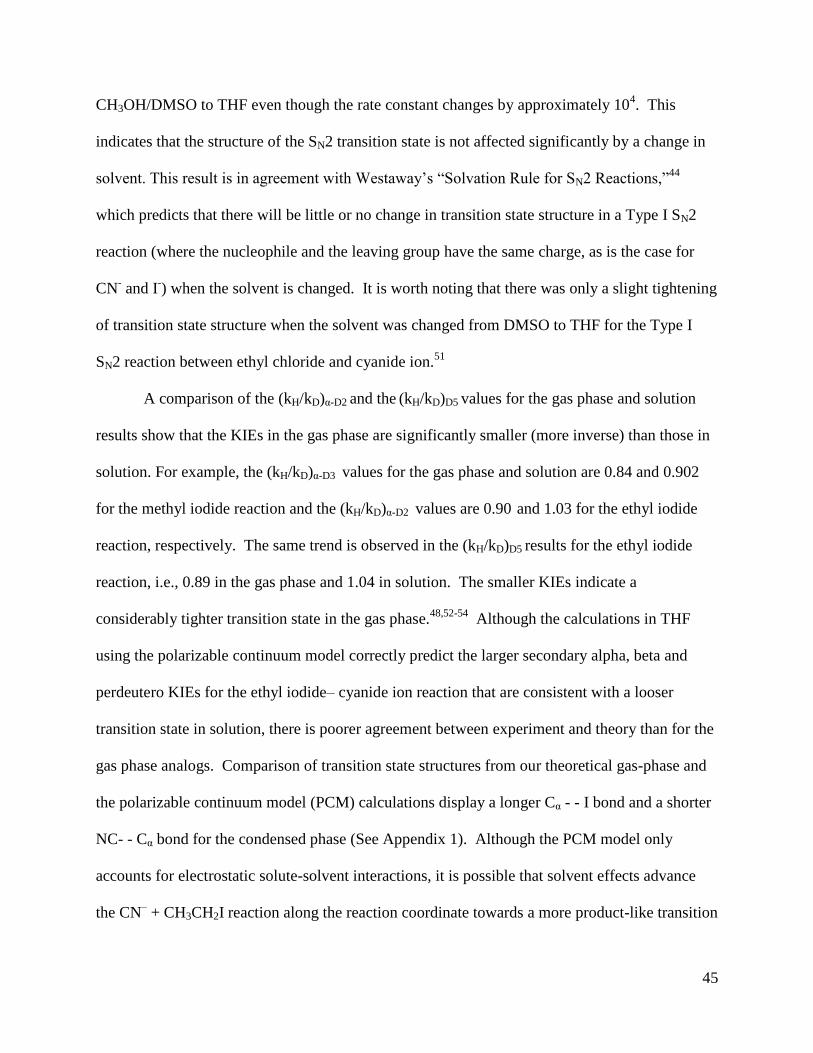
45
CH3OH/DMSO to THF even though the rate constant changes by approximately 104. This
indicates that the structure of the SN2 transition state is not affected significantly by a change in
solvent. This result is in agreement with Westaway’s “Solvation Rule for SN2 Reactions,”44
which predicts that there will be little or no change in transition state structure in a Type I SN2
reaction (where the nucleophile and the leaving group have the same charge, as is the case for
CN- and I
-) when the solvent is changed. It is worth noting that there was only a slight tightening
of transition state structure when the solvent was changed from DMSO to THF for the Type I
SN2 reaction between ethyl chloride and cyanide ion.51
A comparison of the (kH/kD)α-D2 and the (kH/kD)D5 values for the gas phase and solution
results show that the KIEs in the gas phase are significantly smaller (more inverse) than those in
solution. For example, the (kH/kD)α-D3 values for the gas phase and solution are 0.84 and 0.902
for the methyl iodide reaction and the (kH/kD)α-D2 values are 0.90 and 1.03 for the ethyl iodide
reaction, respectively. The same trend is observed in the (kH/kD)D5 results for the ethyl iodide
reaction, i.e., 0.89 in the gas phase and 1.04 in solution. The smaller KIEs indicate a
considerably tighter transition state in the gas phase.48,52-54
Although the calculations in THF
using the polarizable continuum model correctly predict the larger secondary alpha, beta and
perdeutero KIEs for the ethyl iodide– cyanide ion reaction that are consistent with a looser
transition state in solution, there is poorer agreement between experiment and theory than for the
gas phase analogs. Comparison of transition state structures from our theoretical gas-phase and
the polarizable continuum model (PCM) calculations display a longer Cα - - I bond and a shorter
NC- - Cα bond for the condensed phase (See Appendix 1). Although the PCM model only
accounts for electrostatic solute-solvent interactions, it is possible that solvent effects advance
the CN– + CH3CH2I reaction along the reaction coordinate towards a more product-like transition
46
state. However, experimental KIEs from studies51
for the ethyl chloride–cyanide ion SN2
reaction in DMSO and THF suggest that both the NC- - Cα and the Cα - - Cl bonds are shorter in
the transition state for the less polar (less solvating) solvent (THF). Clearly further
computational studies are warranted.
It is important to note that Westaway’s Solvation Rule, which holds in solution very well,
fails the ultimate test because the transition state changes significantly on going to the gas phase.
The tighter transition state in the gas phase probably occurs because the electrostatic attraction
between the partial negative charges on the cyanide and iodide ions and the partial positive
charge on the alpha carbon is much more important in determining transition state structure in
the gas phase than when the charges on the cyanide and iodide ions are reduced by solvation in
solution. The tighter transition state in the gas phase is evident in the 7% difference in our
(kH/kD)α-D3 values for the gas phase and solution (0.84 and 0.902, respectively) for the methyl
iodide reaction. This trend is even more evident in the ethyl iodide reaction, i.e., the (kH/kD)α-D2
and (kH/kD)D5 values in the gas phase and in solution differ by 15% and 17%, respectively.
The significant difference between the KIEs and the transition state structures in the gas phase
and solution was initially troubling since the use of THF was expected to approach gas phase
conditions. However, Bogdanov and McMahon55
have shown that even though THF has a low
dielectric constant ( = 7), it is far from the gas phase limit. Figure 3.2 shows their computed
values for ΔE‡
for the Cl– + CH3Cl reaction as a function of the dielectric constant of the solvent.
Changing the solvent from CH3OH/DMSO to THF for the SN2 reaction between methyl chloride
and chloride ion would reduce ΔE‡ by only 2 kcal mol
-1; in contrast, going from CH3OH/DMSO
to the gas phase would reduce ΔE‡ by over 17 kcal mol
-1. Given the large difference in ΔE
‡

47
between the gas phase and THF (approximately 15 kcal mol-1
) the observation of a significantly
tighter transition state in the gas phase is a reasonable result. The curve in Figure 3.2 also
Figure 3.2. Plot of the dielectric constant (ε) vs. the activation energy for the Cl− + CH3Cl SN2
reaction, ΔE‡(ε)MP2(fc)/6-31+G(d), in various solvents.
56
explains why the reaction is between 1011
and 1015
times faster in the gas phase than in solution
(see Tables 3.1 and 3.2 and Figure 3.1). Finally, the magnitudes of the electrostatic attraction
between the partial negative charges on the nucleophiles in the transition state (cyanide ion and
iodide ion) and the partial positive charge on the alpha carbon are much larger in the gas phase
than in THF where solvation will reduce the electrostatic attraction between the ions in the

48
transition state. This greater electrostatic attraction in the gas phase transition state is likely
responsible for the tighter transition state and more inverse KIEs observed in the gas phase.49
3.4 Conclusion
The reaction of cyanide ion with ethyl iodide provides an ideal system for comparing gas
phase and solution data. Both gas phase and solution reactions are dominated by the SN2
pathway and have reactivities that are measurable and sensitive to isotopic substitution. In
addition, the system is a Type I SN2 reaction where changes in solvent are predicted to have
minimal or no effect on transition state structure and the KIEs. A direct comparison of KIEs
between the gas phase and solution showed that the KIEs in the gas phase are significantly
smaller (more inverse) than those in solution. This result indicates that the transition state is
significantly tighter in the gas phase. Thus, although the “Solvation Rule for SN2 Reactions” has
successfully predicted the change in transition state structure for a wide range of SN2 reactions in
solution,54
it fails the ultimate test of predicting the effect of removing the solvent completely.
The tighter transition state in the gas phase is primarily attributed to bond changes due to the
greater electrostatic forces between the partial negative charges on iodide and cyanide ions and
the partial positive charge on the alpha carbon in the gas phase.

49
3.5 References
1. Bohme, D. K.; Mackay, G. I. J. Am. Chem. Soc. 1981, 103, 978-979.
2. Bohme, D. K.; Raksit, A. B.; Mackay, G. L. J. Am. Chem. Soc. 1982, 104, 1100-1101.
3. Brauman, J. I.; Blair, L. K. J. Am. Chem. Soc. 1970, 92, 5986-5987.
4. Taft, R. W. Prog. Phys. Org. Chem. 1983, 14, 247-350.
5. Olmstead, W. N.; Brauman, J. I. J. Am. Chem. Soc. 1977, 99, 4219-4228.
6. DePuy, C. H. J. Org. Chem. 2002, 67, 2393-2401.
7. Gronert, S. Chem. Rev. 2001, 101, 329-360.
8. Almerindo, G. I.; Pliego, J. R. Org. Lett. 2005, 7, 1821-1823.
9. Tondo, D. W.; Pliego, J. R. J. Phys. Chem. A 2005, 109, 507-511.
10. Kahn, K.; Bruice, T. C. J. Phys. Chem. B 2003, 107, 6876-6885.
11. Westaway, K. C.; Fang, Y. R.; MacMillar, S.; Matsson, O.; Poirier, R. A.; Islam, S. M. J.
Phys. Chem. A 2007, 111, 8110-8120.
12. Westaway, K. C.; Fang, Y. R.; MacMillar, S.; Matsson, O.; Poirier, R. A.; Islam, S. M. J.
Phys. Chem. A 2008, 112, 10264-10273.
13. DePuy, C. H.; Gronert, S.; Mullin, A.; Bierbaum, V. M. J. Am. Chem. Soc. 1990, 112,
8650-8655.
14. Uggerud, E. Pure Appl. Chem. 2009, 81, 709-717.
15. Gronert, S. Acc. Chem. Res. 2003, 36, 848-857.
16. Wladkowski, B. D.; Brauman, J. I. J. Am. Chem. Soc. 1992, 114, 10643-10644.
17. Gronert, S.; Fagin, A. E.; Okamoto, K.; Mogali, S.; Pratt, L. M. J. Am. Chem. Soc. 2004,
126, 12977-12983.
18. Bohme, D. K.; Raksit, A. B. Can. J. Chem. 1985, 63, 3007-3011.
19. Kato, S.; Hacaloglu, J.; Davico, G. E.; DePuy, C. H.; Bierbaum, V. M. J. Phys. Chem. A
2004, 108, 9887-9891.
20. O'Hair, R. A. J.; Davico, G. E.; Hacaloglu, J.; Dang, T. T.; DePuy, C. H.; Bierbaum, V.
M. J. Am. Chem. Soc. 1994, 116, 3609-3610.
21. Thomas, J. M.; Viggiano, A. A. J. Phys. Chem. A 1999, 103, 2720-2722.
22. Viggiano, A. A.; Arnold, S. T.; Morris, R. A. Int. Rev. Phys. Chem. 1998, 17, 147-184.
23. Davico, G. E. J. Phys. Chem. A 2006, 110, 13112-13121.
24. Hu, W. -P.; Truhlar, D. G. J. Am. Chem. Soc. 1994, 116, 7797-7800.
25. Ohta, K.; Morokuma, K. J. Phys. Chem. 1985, 89, 5845-5849.
26. Tachikawa, H. J. Phys. Chem. A 2001, 105, 1260-1266.
27. Glad, S. S.; Jensen, F. J. Phys. Chem. 1996, 100, 16892-16898.
28. Bickelhaupt, F. M.; Baerends, E. J.; Nibbering, N. M. M. Chem. Eur. J. 1996, 2, 196-207.
29. Eyet, N.; Villano, S. M.; Bierbaum, V. M. J. Am. Soc. Mass Spectrom. 2008, 19, 1296-
1302.
30. Eyet, N.; Villano, S. M.; Kato, S.; Bierbaum, V. M. J. Am. Soc. Mass Spectrom. 2007, 18,
1046-1051.
31. Wu, Y.-R.; Hu, W.-P. J. Am. Chem. Soc. 1999, 121, 10168-10177.
32. Van Doren, J. M.; Barlow, S. E.; DePuy, C. H.; Bierbaum, V. M. Int. J. Mass Spectrom.
Ion Proc. 1987, 81, 85-100.
33. Frisch, M. J.; Trucks, G. W.; Schlegel, H. B.; Scuseria, G. E.; Robb, M. A.; Cheeseman,
J. R.; Montgomery, J. J. A.; Vreven, T.; Kudin, K. N.; Burant, J. C.; Millam, J. M.;
Iyengar, S. S.; Tomasi, J.; Barone, V.; Mennucci, B.; Cossi, M.; Scalmani, G.; Rega, N.;
50
Petersson, G. A.; Nakatsuji, H.; Hada, M.; Ehara, M.; Toyota, K.; Fukuda, R.; Hasegawa,
J.; Ishida, M.; Nakajima, T.; Honda, Y.; Kitao, O.; Nakai, H.; Klene, M.; Li, X.; Knox, J.
E.; Hratchian, H. P.; Cross, J. B.; Bakken, V.; Adamo, C.; Jaramillo, J.; Gomperts, R.;
Stratmann, R. E.; Yazyev, O.; Austin, A. J.; Cammi, R.; Pomelli, C.; Ochterski, J. W.;
Ayala, P. Y.; Morokuma, K.; Voth, G. A.; Salvador, P.; Dannenberg, J. J.; Zakrzewski,
V. G.; Dapprich, S.; Daniels, A. D.; Strain, M. C.; Farkas, O.; Malick, D. K.; Rabuck, A.
D.; Raghavachari, K.; Foresman, J. B.; Ortiz, J. V.; Cui, Q.; Baboul, A. G.; Clifford, S.;
Cioslowski, J.; Stefanov, B. B.; Liu, G.; Liashenko, A.; Piskorz, P.; Komaromi, I.;
Martin, R. L.; Fox, D. J.; Keith, T.; Al-Laham, M. A.; Peng, C. Y.; Nanayakkara, A.;
Challacombe, M.; Gill, P. M. W.; Johnson, B.; Chen, W.; Wong, M. W.; Gonzalez, C.;
Pople, J. A. Gaussian 03, Revision B.05, Gaussian, Inc.: Pittsburgh, PA, 2004.
34. Moller, C.; Plesset, M. S. Phys. Rev. 1934, 46, 618-622.
35. Zhang, Q. Z.; Wang, H. N.; Sun, T. L.; Wang, W. X. Chem. Phys. 2006, 324, 298-306.
36. Hadad, C. M.; Rablen, P. R.; Wiberg, K. B. J. Org. Chem. 1998, 63, 8668-8681.
37. Hay, P. J.; Wadt, W. R. J. Chem. Phys. 1985, 82, 270-283.
38. Merrick, J. P.; Moran, D.; Radom, L. J. Phys. Chem. A 2007, 111, 11683-11700.
39. Nielson, P. Aa.; Glad, S. S.; Jensen, F. J. J. Am. Chem. Soc. 1996, 118, 10577-10583.
40. Su, T.; Chesnavich, W. J. J. Chem. Phys. 1982, 76, 5183-5185.
41. P.J. Linstrom and W.G. Mallard, Eds., NIST Chemistry WebBook, National Institute
of Standards and Technology, NIST Standard Reference Database Number 69,
Gaithersburg MD, 20899, http://webbook.nist.gov; (retrieved October 23, 2009.)
42. Gronert, S.; DePuy, C. H.; Bierbaum, V. M. J. Am. Chem. Soc. 1991, 113, 4009-4010.
43. Bierbaum, V. M.; Grabowski, J. J.; DePuy, C. H. J. Phys. Chem. 1984, 88, 1389-1393.
44. Westaway, K. C.; Waszczylo, Z. Can. J. Chem. 1982, 60, 2500-2520.
45. Villano, S. M.; Eyet, N.; Lineberger, W. C.; Bierbaum, V. M. J. Am. Chem. Soc. 2009,
131, 8227-8233.
46. Koshy, K. M.; Robertson, R. E. J. Am. Chem. Soc. 1974, 96, 914-916.
47. Shiner, V. J. Jr.; Dowd, W.; Fisher, R. D.; Hartshorn, S. R.; Kessick, M. A.; Milakofs, L.;
Rapp, M. W. J. Am. Chem. Soc. 1969, 91, 4838-4939.
48. Poirier, R. A.; Wang, Y. L.; Westaway, K. C. J. Am. Chem. Soc. 1994, 116, 2526-2533.
49. Gronert, S.; Fagin, A. E.; Wong, L. J. Am. Chem. Soc. 2007, 129, 5330-5331.
50. Westaway, K. C. Can. J. Chem. 1978, 56, 2691-2699.
51. Fang, Y. R.; MacMillar, S.; Eriksson, J.; Kolodziejska-Huben, M.; Dybala-Defratyka, A.;
Paneth, P.; Matsson, O.; Westaway, K. C. J. Org. Chem. 2006, 71, 4742-4747.
52. Kato, S.; Davico, G. E.; Lee, H. S.; DePuy, C. H.; Bierbaum, V. M. Int. J. Mass
Spectrom. 2001, 210, 223-229.
53. Glad, S. S.; Jensen, F. J. Am. Chem. Soc. 1997, 119, 227-232.
54. Westaway, K. C. Adv. Phys. Org. Chem. 2006, 41, 217-273.
55. Bogdanov, B.; McMahon, T. B. Int. J. Mass Spectrom. 2005, 241, 205-223.
56. "Reprinted from Int. J. Mass Spectrom., 241, Bogdanov, B. and McMahon, T.B.,
Thermochemistry and structures of solvated SN2 complexes and transition states in the
gas phase: experiments and theory, 205-223, Copyright (2005), with permission from
Elsevier."

51
CHAPTER 4
Mechanistic Investigation of SN2 Dominated Gas Phase Alkyl Iodide Reactions
Adapted from
Garver, J. M.; Fang, Y; Eyet, N.; Villano, S. M.; Yang, Z.; Bierbaum, V. M. Int. J. Mass Spectrom.,
2011, 301, 151-158
Overview
The competition between substitution (SN2) and elimination (E2) has been studied for the
reactions of methyl, ethyl, i-propyl, and t-butyl iodide with Cl–, CN
–, and HS
– in the gas phase.
Previous studies have shown a dominance of the SN2 mechanism for sulfur anions and for some
cyanide-alkyl iodide reactions. Although our results support this conclusion for the reactions
studied, they reveal that competition between the SN2 and E2 pathways exists for the i-propyl
reactions. Steric and electronic effects, upon alkyl group substitution, produce looser and less
stable SN2 transition states; however, they can favor the E2 process. These opposing effects on
barrier heights produce E2/SN2 competition as steric hindrance increases around the α-carbon;
however, the relative differences in intrinsic barrier heights lead to significantly different
branching ratios. This interpretation is discussed in terms of reaction efficiencies, kinetic isotope
effects, linear basicity-reactivity relationships, electrostatic models, and transition state looseness
parameters.
52
4.1 Introduction
Studies of bimolecular nucleophilic substitution (SN2) and base-induced elimination
reactions (E2) have made significant contributions to the fundamental knowledge of prototypical
organic reactions1, 2
and the conceptual framework for understanding biological systems.3, 4
In
these experimental5-14
and theoretical investigations,15-20
wide-ranging relationships connecting
structure and reactivity parameters to reaction rates and mechanistic pathways have been
established. These structure-energy relationships form the basis of efforts to predict and control
the predominant reaction channel between the two competitive processes. Even within the
current conceptual construct, transition state energetics9, 21
and solvent effects22-25
produce
exceptions to expected reactivity and mechanistic selectivity.
Of interest for our current research
is the apparent dominance of the SN2 mechanism for sulfur anions9, 21
and for some cyanide-alkyl
iodide reactions26
in the gas phase. By investigating the electronic and structural properties of
systems that deviate from typical reactivity patterns, valuable insight can be gained to provide a
more detailed picture of kinetics, mechanisms, and product distributions.
Studies of ion-molecule reactions have shown competition between SN2 and E2
mechanisms (Scheme 4.1) to be significantly influenced by the nature of the attacking group
(X–), leaving group abilities (Y), substrate properties, and solvent effects.
9, 27-29 The most
influential factors on the E2/SN2 ratio are the presence of β-hydrogens, the degree of α- and β-
branching, and the nucleophilicity vs. basicity of the reactant anion. For an E2 elimination to
occur, there must be periplanar β-hydrogens allowing orbital overlap during double bond
formation. This sp3 to sp
2 transformation from reactants to products reduces steric strain
between substituents producing a driving force for the E2 process in highly substituted systems.
In contrast, increasing alkyl group substitution at the α-carbon or on the attacking group hinders

53
CH3
X + CH3CH2Y-
HX + C2H4 + Y
XCH2CH3 + Y
-
-C Y
H H
CC
H
HH
H
H
SN2
E2
Y
X
X
Scheme 4.1
the approach of the nucleophile during the SN2 process, thus increasing the activation barrier and
decreasing contributions from this channel. Experimental investigations into substituent effects
around the α-carbon of alkyl halide substrates have shown a transition from predominantly
substitution products for primary alkyl halides to exclusively elimination products for tertiary
alkyl halides.17, 28, 30
In addition to structural influences, strong nucleophilicity (carbon cation
affinity measured by kinetics) enhances the SN2 pathway, while strong basicity (proton affinity
measured by thermodynamics) enhances the E2 pathway. Distinguishing between the relative
nucleophilic or basic character of an attacking group is not straightforward due to a linear free-
energy relationship between these properties. Rationalized in the context of Marcus theory, the
intrinsic transition state barrier height is lowered by the exothermicity of reaction.31, 32
Although
gas-phase basicity is often an excellent predictive tool for SN2 reactivity, deviations in the
correlation between SN2 and E2 barriers arise for attacking atoms outside the same row or group
in the periodic table.9, 29
Alternative correlations utilizing transition state geometries,
electronegativity, exothermicity and energy barriers have proven insightful.20,33-36
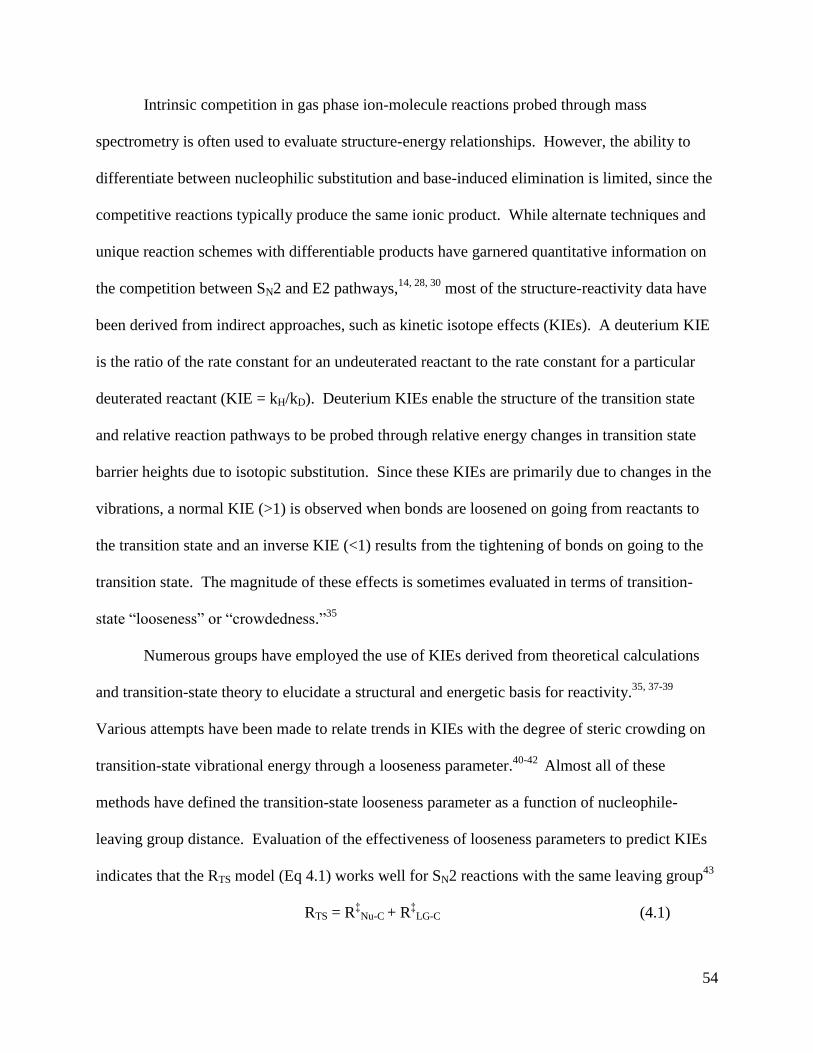
54
Intrinsic competition in gas phase ion-molecule reactions probed through mass
spectrometry is often used to evaluate structure-energy relationships. However, the ability to
differentiate between nucleophilic substitution and base-induced elimination is limited, since the
competitive reactions typically produce the same ionic product. While alternate techniques and
unique reaction schemes with differentiable products have garnered quantitative information on
the competition between SN2 and E2 pathways,14, 28, 30
most of the structure-reactivity data have
been derived from indirect approaches, such as kinetic isotope effects (KIEs). A deuterium KIE
is the ratio of the rate constant for an undeuterated reactant to the rate constant for a particular
deuterated reactant (KIE = kH/kD). Deuterium KIEs enable the structure of the transition state
and relative reaction pathways to be probed through relative energy changes in transition state
barrier heights due to isotopic substitution. Since these KIEs are primarily due to changes in the
vibrations, a normal KIE (>1) is observed when bonds are loosened on going from reactants to
the transition state and an inverse KIE (<1) results from the tightening of bonds on going to the
transition state. The magnitude of these effects is sometimes evaluated in terms of transition-
state “looseness” or “crowdedness.”35
Numerous groups have employed the use of KIEs derived from theoretical calculations
and transition-state theory to elucidate a structural and energetic basis for reactivity.35, 37-39
Various attempts have been made to relate trends in KIEs with the degree of steric crowding on
transition-state vibrational energy through a looseness parameter.40-42
Almost all of these
methods have defined the transition-state looseness parameter as a function of nucleophile-
leaving group distance. Evaluation of the effectiveness of looseness parameters to predict KIEs
indicates that the RTS model (Eq 4.1) works well for SN2 reactions with the same leaving group43
RTS = R‡
Nu-C + R‡
LG-C (4.1)
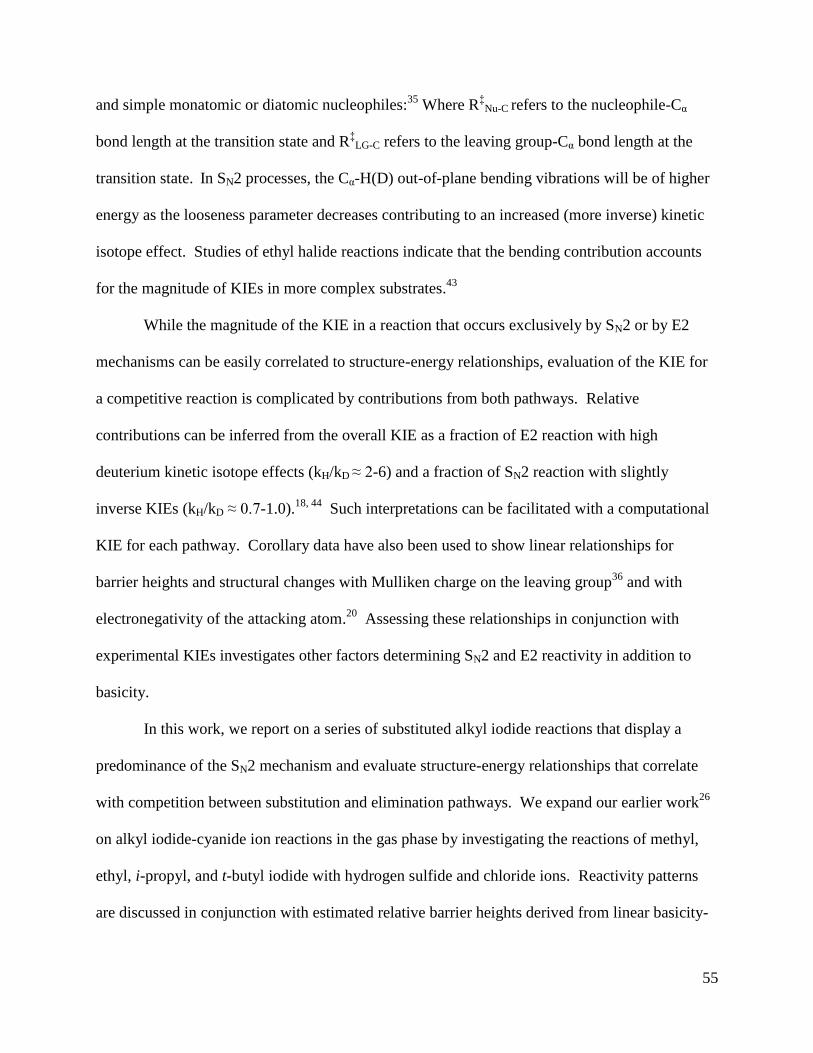
55
and simple monatomic or diatomic nucleophiles:35
Where R‡
Nu-C refers to the nucleophile-Cα
bond length at the transition state and R‡
LG-C refers to the leaving group-Cα bond length at the
transition state. In SN2 processes, the Cα-H(D) out-of-plane bending vibrations will be of higher
energy as the looseness parameter decreases contributing to an increased (more inverse) kinetic
isotope effect. Studies of ethyl halide reactions indicate that the bending contribution accounts
for the magnitude of KIEs in more complex substrates.43
While the magnitude of the KIE in a reaction that occurs exclusively by SN2 or by E2
mechanisms can be easily correlated to structure-energy relationships, evaluation of the KIE for
a competitive reaction is complicated by contributions from both pathways. Relative
contributions can be inferred from the overall KIE as a fraction of E2 reaction with high
deuterium kinetic isotope effects (kH/kD ≈ 2-6) and a fraction of SN2 reaction with slightly
inverse KIEs (kH/kD ≈ 0.7-1.0).18, 44
Such interpretations can be facilitated with a computational
KIE for each pathway. Corollary data have also been used to show linear relationships for
barrier heights and structural changes with Mulliken charge on the leaving group36
and with
electronegativity of the attacking atom.20
Assessing these relationships in conjunction with
experimental KIEs investigates other factors determining SN2 and E2 reactivity in addition to
basicity.
In this work, we report on a series of substituted alkyl iodide reactions that display a
predominance of the SN2 mechanism and evaluate structure-energy relationships that correlate
with competition between substitution and elimination pathways. We expand our earlier work26
on alkyl iodide-cyanide ion reactions in the gas phase by investigating the reactions of methyl,
ethyl, i-propyl, and t-butyl iodide with hydrogen sulfide and chloride ions. Reactivity patterns
are discussed in conjunction with estimated relative barrier heights derived from linear basicity-
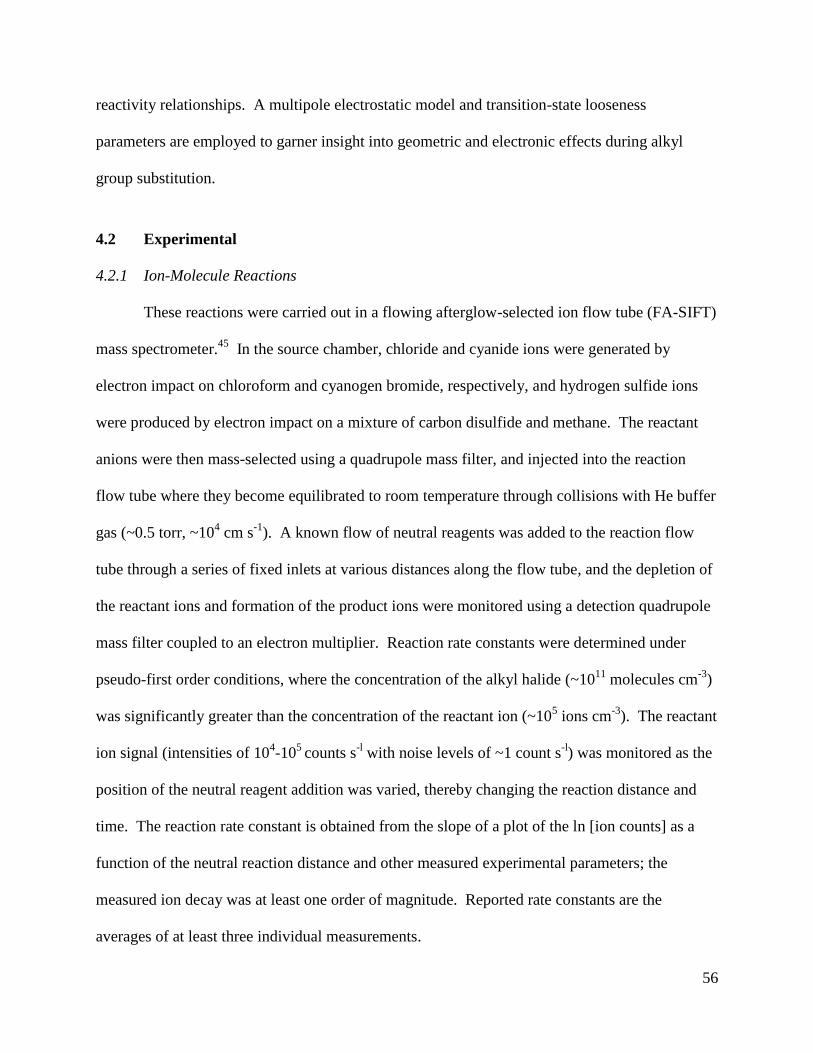
56
reactivity relationships. A multipole electrostatic model and transition-state looseness
parameters are employed to garner insight into geometric and electronic effects during alkyl
group substitution.
4.2 Experimental
4.2.1 Ion-Molecule Reactions
These reactions were carried out in a flowing afterglow-selected ion flow tube (FA-SIFT)
mass spectrometer.45
In the source chamber, chloride and cyanide ions were generated by
electron impact on chloroform and cyanogen bromide, respectively, and hydrogen sulfide ions
were produced by electron impact on a mixture of carbon disulfide and methane. The reactant
anions were then mass-selected using a quadrupole mass filter, and injected into the reaction
flow tube where they become equilibrated to room temperature through collisions with He buffer
gas (~0.5 torr, ~104 cm s
-1). A known flow of neutral reagents was added to the reaction flow
tube through a series of fixed inlets at various distances along the flow tube, and the depletion of
the reactant ions and formation of the product ions were monitored using a detection quadrupole
mass filter coupled to an electron multiplier. Reaction rate constants were determined under
pseudo-first order conditions, where the concentration of the alkyl halide (~1011
molecules cm-3
)
was significantly greater than the concentration of the reactant ion (~105 ions cm
-3). The reactant
ion signal (intensities of 104-10
5 counts s
-l with noise levels of ~1 count s
-l) was monitored as the
position of the neutral reagent addition was varied, thereby changing the reaction distance and
time. The reaction rate constant is obtained from the slope of a plot of the ln [ion counts] as a
function of the neutral reaction distance and other measured experimental parameters; the
measured ion decay was at least one order of magnitude. Reported rate constants are the
averages of at least three individual measurements.

57
Absolute uncertainties in these rate measurements are ± 20%, however some systematic
errors (pressure, temperature, He flow rate, etc.) are cancelled in the rate constant ratio, so that
the error bars for KIEs are significantly smaller. Neutral reagents [CH3I, Aldrich 99.5%; CD3I,
Cambridge Isotope Laboratories 99.5% D; CH3CH2I, Aldrich 99%; CD3CD2I, Isotec 99.5% D;
(CH3)2CHI, Aldrich 99%; (CD3)2CDI, CDN Isotopes 99.1% D; (CH3)3CI, Aldrich 95%;
(CD3)3CI, CDN Isotopes 99.5% D] were obtained from commercial vendors and purified by
several freeze-pump-thaw cycles before use. The reagents were protected from light and stored
under vacuum. Helium buffer gas (99.995%) was purified by passage through a molecular sieve
trap immersed in liquid nitrogen. Parallel reactions of deuterated and undeuterated reactants
were carried out under identical conditions.
4.2.2 Computational Methods
Electronic structure calculations were carried out using the Gaussian 0346
suite of
programs to provide additional insight into the experimental results. The MP2/6-311++G(2d,p)
level of theory47-49
for carbon, nitrogen, and hydrogen and the LanL2DZ effective core
potential50
for iodine were employed based on accurate correlations of SN2 KIEs for the methyl
iodide–cyanide ion reaction in previous work.26
Due to the systematic error of some electronic
structure theory, it is very common to scale the Gaussian calculation of vibrational frequencies to
obtain better results with respect to the experiments. Since optimal scaling factors for similar
theoretical methods have zero point vibrational energy, enthalpy, and entropy scaling factors
near unity,51
scaling was not employed in our experiments. Transition states were determined by
the existence of one imaginary frequency along the reaction coordinate. The KIEs were
calculated using transition-state theory (Eq 4.2), neglecting any variational or tunneling effects:
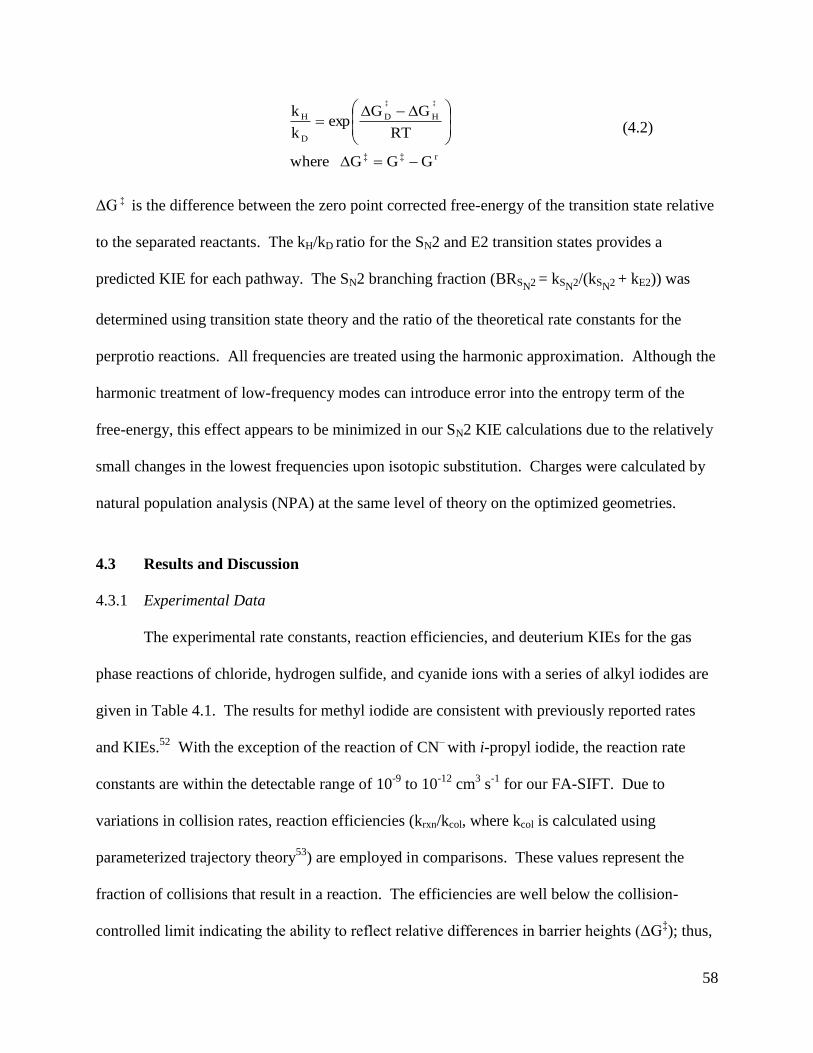
58
r‡‡
HD
D
H
GGGwhere
RT
GGexp
k
k‡‡
(4.2)
ΔG ‡ is the difference between the zero point corrected free-energy of the transition state relative
to the separated reactants. The kH/kD ratio for the SN2 and E2 transition states provides a
predicted KIE for each pathway. The SN2 branching fraction (BRSN2 = kSN2/(kSN2 + kE2)) was
determined using transition state theory and the ratio of the theoretical rate constants for the
perprotio reactions. All frequencies are treated using the harmonic approximation. Although the
harmonic treatment of low-frequency modes can introduce error into the entropy term of the
free-energy, this effect appears to be minimized in our SN2 KIE calculations due to the relatively
small changes in the lowest frequencies upon isotopic substitution. Charges were calculated by
natural population analysis (NPA) at the same level of theory on the optimized geometries.
4.3 Results and Discussion
4.3.1 Experimental Data
The experimental rate constants, reaction efficiencies, and deuterium KIEs for the gas
phase reactions of chloride, hydrogen sulfide, and cyanide ions with a series of alkyl iodides are
given in Table 4.1. The results for methyl iodide are consistent with previously reported rates
and KIEs.52
With the exception of the reaction of CN–
with i-propyl iodide, the reaction rate
constants are within the detectable range of 10-9
to 10-12
cm3 s
-1 for our FA-SIFT. Due to
variations in collision rates, reaction efficiencies (krxn/kcol, where kcol is calculated using
parameterized trajectory theory53
) are employed in comparisons. These values represent the
fraction of collisions that result in a reaction. The efficiencies are well below the collision-
controlled limit indicating the ability to reflect relative differences in barrier heights (ΔG‡); thus,
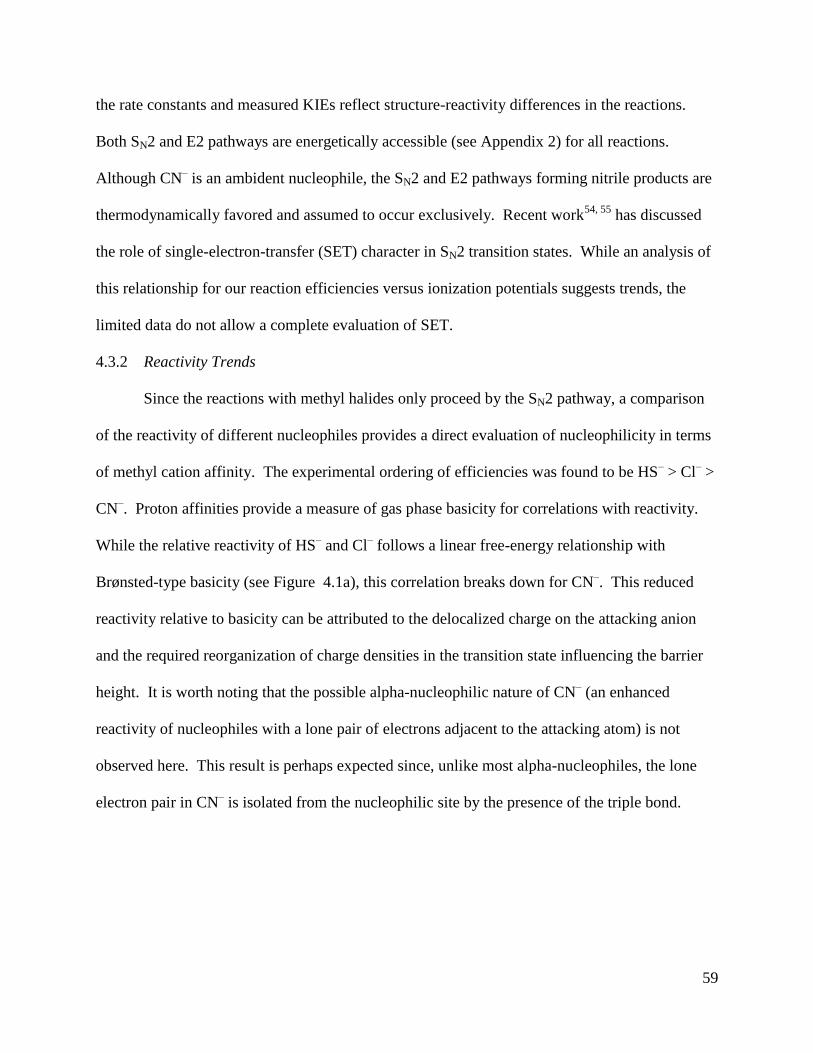
59
the rate constants and measured KIEs reflect structure-reactivity differences in the reactions.
Both SN2 and E2 pathways are energetically accessible (see Appendix 2) for all reactions.
Although CN– is an ambident nucleophile, the SN2 and E2 pathways forming nitrile products are
thermodynamically favored and assumed to occur exclusively. Recent work54, 55
has discussed
the role of single-electron-transfer (SET) character in SN2 transition states. While an analysis of
this relationship for our reaction efficiencies versus ionization potentials suggests trends, the
limited data do not allow a complete evaluation of SET.
4.3.2 Reactivity Trends
Since the reactions with methyl halides only proceed by the SN2 pathway, a comparison
of the reactivity of different nucleophiles provides a direct evaluation of nucleophilicity in terms
of methyl cation affinity. The experimental ordering of efficiencies was found to be HS– > Cl
– >
CN–. Proton affinities provide a measure of gas phase basicity for correlations with reactivity.
While the relative reactivity of HS– and Cl
– follows a linear free-energy relationship with
Brønsted-type basicity (see Figure 4.1a), this correlation breaks down for CN–. This reduced
reactivity relative to basicity can be attributed to the delocalized charge on the attacking anion
and the required reorganization of charge densities in the transition state influencing the barrier
height. It is worth noting that the possible alpha-nucleophilic nature of CN– (an enhanced
reactivity of nucleophiles with a lone pair of electrons adjacent to the attacking atom) is not
observed here. This result is perhaps expected since, unlike most alpha-nucleophiles, the lone
electron pair in CN– is isolated from the nucleophilic site by the presence of the triple bond.
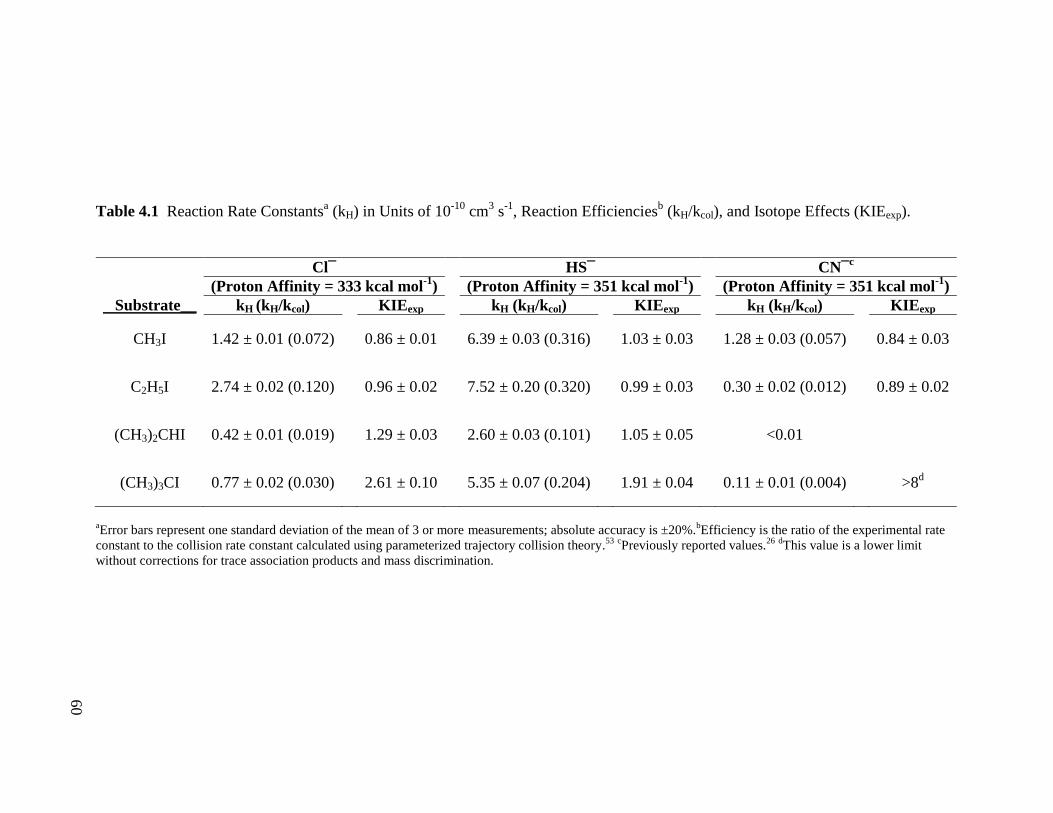
Table 4.1 Reaction Rate Constantsa (kH) in Units of 10
-10 cm
3 s
-1, Reaction Efficiencies
b (kH/kcol), and Isotope Effects (KIEexp).
Cl¯ HS¯ CN¯c
(Proton Affinity = 333 kcal mol-1
) (Proton Affinity = 351 kcal mol-1
) (Proton Affinity = 351 kcal mol-1
)
Substrate__ kH (kH/kcol) KIEexp kH (kH/kcol) KIEexp kH (kH/kcol) KIEexp
CH3I 1.42 ± 0.01 (0.072) 0.86 ± 0.01 6.39 ± 0.03 (0.316) 1.03 ± 0.03 1.28 ± 0.03 (0.057) 0.84 ± 0.03
C2H5I 2.74 ± 0.02 (0.120) 0.96 ± 0.02 7.52 ± 0.20 (0.320) 0.99 ± 0.03 0.30 ± 0.02 (0.012) 0.89 ± 0.02
(CH3)2CHI 0.42 ± 0.01 (0.019) 1.29 ± 0.03 2.60 ± 0.03 (0.101) 1.05 ± 0.05 <0.01
(CH3)3CI 0.77 ± 0.02 (0.030) 2.61 ± 0.10 5.35 ± 0.07 (0.204) 1.91 ± 0.04 0.11 ± 0.01 (0.004) >8d
aError bars represent one standard deviation of the mean of 3 or more measurements; absolute accuracy is ±20%.
bEfficiency is the ratio of the experimental rate
constant to the collision rate constant calculated using parameterized trajectory collision theory.53
cPreviously reported values.
26 dThis value is a lower limit
without corrections for trace association products and mass discrimination.
60

Figure 4.1 The logarithm of reaction efficiency (krxn/kcol) at 298 K versus the anion proton affinity (ΔH298) for (a) the SN2 reaction of
Nu– with CH3I and (b) the E2 reaction of Nu
– with t-C4H9I. The linear trends are fit to the monatomic halide anions due to stronger
linear correlations with basicity 20, 29, 54, 55
(SN2: y = 0.0334x – 12.39; r2 = 0.989 and E2: y = 0.0348x – 13.13). Experimental data from
this work and ref 52 updated using parameterized trajectory theory53
to calculate kcol. The reaction rate constant for F–
with C4H9I was
measured as 2.09 (± 0.02) x 10-9
(this work where the error bars represent one standard deviation of the mean of 3 or more
measurements; absolute accuracy is ±20%); the reaction of Br–
with t-C4H9I is not energetically accessible. Proton affinity data are
from ref 61. Error bars for the plot represent an absolute accuracy of ±20% in efficiency.
61

62
The relative correlation of basicity and E2 barrier heights can be accessed from the t-
butyl iodide reactions since they have previously been shown to be dominated by the E2
mechanism.9 The experimental ordering of efficiencies was found to be HS
– > Cl
– > CN
–. Once
again the reactivity of CN– is below that expected for the associated basicity (see Figure 4.1b).
Although similar trends in relative reactivity and Brønsted-type basicity are observed for both
the SN2 and E2 processes, comparison of the slopes for the halide anion with methyl iodide
reactions (0.0334) and t-butyl iodide reactions (0.0348) reactions suggest that the E2 barrier is
slightly more sensitive to basicity. Computational studies by Ren and Yamataka show a similar
trend for competing barriers in CH3CH2Cl reactions.56
If the minor difference in slopes is
interpreted as a reflection of the trends in barrier heights, the relative E2 to SN2 efficiency
increases at higher basicities (i.e., more similar SN2 and E2 barrier heights). Analysis of the ratio
of E2/SN2 (i.e., t-C4H9I/CH3I) efficiencies shows an increase from Cl–
(41.7%) to F–
(60.1%).
This relationship suggests that the SN2 and E2 barriers for alkyl iodide reactions are not
equivalent until extremely high anion basicities. If these trends in E2/SN2 barrier heights apply
across the competitive series of ethyl and i-propyl iodide reactions, the SN2 process should be the
prominent pathway for all the nucleophiles in this study. This dominance of the SN2 pathway is
observed in dianion research with ethyl and i-propyl iodides by Gronert et al.28
Further
comparisons show that the CH3I reaction efficiency of CN– (0.057) is a factor of five below that
of HS–
(0.316). However, the t-C4H9I reaction efficiency of CN– (0.004) is a factor of fifty
below that of HS–
(0.204), a much greater deviation than in the SN2 process. This result indicates
that variations in electronic and structural changes for the CN– reaction are magnified in the E2
transition state and that the E2 pathway is even more inhibited in these reactions.

63
Competing pathways as well as substituent effects complicate the analysis of the
reactivity trends of the methyl, ethyl, i-propyl, and t-butyl iodide reactions. Therefore,
established trends and a holistic approach must be employed. As Cα-branching increases, SN2
processes will be inhibited and E2 processes will be enhanced. A decrease in reactivity down the
series of alkyl iodides (i.e., 1˚ ≥ 2˚ ≥ 3˚) would be indicative of large E2 barriers and a resulting
dominance of the SN2 pathway. In contrast, an increase in reactivity down the series of alkyl
iodides (i.e., 1˚ ≤ 2˚ ≤ 3˚) would be indicative of a major E2 contribution to the overall reaction
rate. Applying these concepts to the data in Table 4.1, patterns emerge that support large barriers
to the E2 process. For the Cl–
and HS– nucleophiles, there is an increase in efficiency for the
ethyl reaction followed by a sharp decrease for the i-propyl reaction. Although the increased
reactivity in the primary iodide could be indicative of an E2 contribution, the sharp decrease for
the secondary iodide dissuades this interpretation. Rather, the enhanced efficiency for the Cl–
and HS– with ethyl iodide reactions is explained by stabilization of the SN2 transition state
through charge delocalization on the additional methyl group. It is more challenging to explain
the dramatic decrease in efficiency along the series of alkyl iodides observed for CN– where the
reaction efficiency drops below 2% for the ethyl reaction and continues to drop below the
detection limit for the i-propyl reaction. In an effort to understand the anomalies between trends,
we employ a slightly modified electrostatic model that has been effectively used by Gronert et al.
for β-substituted alkyl halides.57
4.3.3 Multipole Electrostatic Model
Variations in the magnitude of the efficiency between the methyl and ethyl reactions
(67% increase for Cl–, 1% increase for HS
–, and 79% decrease for CN
–), reflect the combined
capability of the methyl and attacking groups to shift electron density away from the α-carbon in

64
the transition state. This effect can be understood by applying a multipole electrostatic model57
where the transition state is represented by the interaction of the partial charge on the attacking
group, the leaving group, the β-carbon, and the α-carbon (Scheme 4.2). While the
thermodynamic stability of the products can be reflected in shifts in the position of the geometry
and amount of charge transferred in the transition state (early or late, i.e., reactant like or product
like) used in our application of this model, the differences in the heat of reaction between the
methyl and ethyl iodide reactions for a given nucleophile are all less than 1 kcal mol-1
.
Therefore, relative variations in reaction efficiency are expected to be dominated by the intrinsic
parameters that can be evaluated through bond lengths and the ionic nature of the transition state.
C
C Y
H H
X
HH H
R2 R3
R1
Scheme 4.2
Although methyl groups are commonly considered weak electron donors in solution, in
gas phase reactions at saturated carbon centers they have a tendency to be weak electron
acceptors.58
Polarizability effects on anionic centers play a major role in reactivity and the
ability to delocalize charge across alkyl groups significantly stabilizes the anionic SN2 transition
state. In the absence of an electron-withdrawing group on the methyl group to remove electron
density, the β-carbon will maintain a partial negative charge. As the SN2 reaction progresses,
electron density from the nucleophile must transfer along the reaction coordinate to the leaving
group. Depending on the electronegativity of the attacking and leaving groups, the electron

65
density of the transition state can range from a large partial negative charge on Xδ--
and Yδ--
(strongly electronegative) with a slight positive charge on Cαδ+
to a moderate partial negative
charge on Xδ-
and Yδ-
(weakly electronegative) with a slight negative charge on Cαδ-
. If a
positive charge develops on Cα, attractive forces between Xδ-
, Yδ-
, Cβδ-
, and Cαδ+
will
significantly stabilize the transition state. On the opposite extreme, a negative charge on Cα
generates repulsive forces between Xδ-
, Yδ-
, Cβδ-
, and Cαδ-
, destabilizing the transition state.
Based on the covalent potential electronegativity scale59
(see Appendix 2 for calculations), Cl–
(6.86) has a higher electronegativity than HS–
(5.83) or CN–
(5.74). As a result, more electron
density will be shifted away from Cα in the chloride-ethyl iodide transition state leading to the
observed enhanced reactivity compared to the chloride-methyl iodide reaction (further
elaboration of this point is made below in conjunction with the computational atomic charges in
Table 4.3). Electronegativity differences alone cannot explain the significant difference in
efficiency between methyl and ethyl iodide reactions for CN– and HS
– which have approximately
the same electronegativity. However, if the relative R1, R2, R3 bond distances of the model are
taken into account in conjunction with electrostatic effects, shorter bonds would lead to larger
repulsive forces and the observed reduced reactivity. A more inverse KIE for CN–
(KIE = 0.89)
versus HS– (KIE = 0.99) supports the presence of shorter bonds in the transition state. Therefore,
the higher repulsive forces in the cyanide-ethyl iodide transition state would reduce efficiency.
While based primarily on electrostatic field effects, this simple model seems to provide an
effective explanation for variations in reactivity trends. Application of this model to other
reactions is expected to hold, and computational studies by Wu et al. show a strong linear
relationship between barrier heights and electronegativity for twelve nucleophiles.20
66
4.3.4 Estimated Relative Free-Energy Barrier Heights
In an attempt to further discern the role of competition in these reactions, a qualitative
analysis was made using estimated relative free-energy barrier heights from our E2/SN2 basicity-
reactivity linear-fit baselines. To effectively analyze trends in reactivity relative to the
free-energy barrier heights a common scale must be employed. Therefore the relative E2 to SN2
free-energy barrier heights estimated from our E2/SN2 efficiencies are scaled to the linear SN2
basicity-reactivity baseline. A qualitative depiction of the relationship of the free-energy barrier
heights for and between anions is shown in Figure 4.2. The SN2 free-energy barrier height for
HS– is slightly below the baseline reflecting slightly higher reactivity and the CN
– free-energy
barrier height is significantly above the baseline reflecting substantially lower reactivity (this
Figure 4.2 Qualitative depiction of relative SN2 barrier heights for CH3Cl and the E2 barrier
heights for t-C4H9I estimated from the basicity-reactivity baselines of Figure 4.1. The black
dashed line (---) represents the linear fit of the SN2 basicity-reactivity baseline.
67
correlates directly to Figure 4.1a). The E2 transition-state barrier height (ΔG‡
E2) reflects a rough
estimate of the variance between the lowest SN2 and E2 free-energy barrier heights, which is
related to the percent difference in t-C4H9I and CH3I reaction efficiencies (%ΔG‡
SN2 = t-C4H9I
efficiency divided by the CH3I efficiency, although the linear proportionality is a simplification).
While these approximations are based on experimental data, the use of efficiency ratios relies on
many assumptions and is only intended to provide a plausible interpretation of branching ratios
when used in conjunction with efficiencies and KIEs.
Upon transitioning from the methyl to the t-butyl iodide reactions, each additional methyl
group will generate steric effects increasing the SN2 free-energy barriers towards and above the
E2 free-energy barriers. Examining the series of reactions in the context of these effects on the
free-energy barrier heights, the SN2 process is expected to dominate in the ethyl reactions with
perhaps a small contribution of the E2 channel for HS–. In the case of i-propyl, we would expect
a small contribution of the E2 channel for Cl–, competitive contributions from both the SN2 and
E2 channels for HS–, and extremely small contributions from either channel for CN
– due to the
high free-energy barriers for both channels. In the t-butyl reactions, significant steric hindrance
will drive all the SN2 free-energy barriers to be higher than the E2 free-energy barriers. The E2
mechanism will dominate; however, due to the higher E2 free-energy barrier for CN– the
efficiency would remain extremely low. The efficiencies and KIEs are in agreement with this
assessment suggesting that the relationship between free-energy barrier heights established by
the basicity-reactivity baselines is reasonable.
4.3.5 Kinetic Isotope Effects
If deuterium KIEs are used to rationalize the mechanisms for all three sets of anion
reactions, the results also indicate a predominance of the SN2 pathway for the ethyl and i-propyl

68
iodides. Across the methyl iodide reactions, the KIEs are inverse or near unity reflecting the
expected vibrational changes during sp3 → sp
2 hybridization in an SN2 transition state. This
trend continues for the ethyl iodides indicating that the substitution channel is the dominant
factor in the total KIE. The more normal effect for HS– with methyl halides has been attributed
to a small inverse vibrational contribution and a more normal rotational contribution (high
moment of inertia due to larger size and higher mass) to the overall KIE.35
This “loose” SN2
transition state explains the relatively constant KIE (0.99-1.05) for the HS– with methyl, ethyl,
and i-propyl iodide series. It is not until the tertiary iodides that KIEs associated with the E2
channel are observed in all reactions.
A KIE significantly larger (> 8) than predicted by semi-classical theory (≈ 7) is
observed for the CN–
with t-butyl iodide reaction. This value is established as a lower limit and
is most likely higher due to mass discrimination and trace association products. The ability to
more accurately assess the magnitude of this effect with confidence is limited by a combination
of the larger error associated with smaller ion-signal changes due to the low reactivity and the
high mass of the products. KIEs larger than the theoretical limit may be evidence of quantum
mechanical tunneling; however, alternate explanations have been offered by Gronert et al.14
for
observed KIEs of this magnitude in the gas phase. In reactions with barriers near the entrance
channel, the pathways with the greater deuterium barrier height (≈ 1 kcal mol-1
) are influenced
by the lifetime of the collision complex leading to significantly lower rates. In reactions with
competing pathways, a shift in barrier heights could push the deuterated system towards the SN2
pathway. This explanation is interesting in light of the apparent dominance of the SN2 channel in
the ethyl and i-propyl iodide systems, but further discussion is beyond the scope of this work.
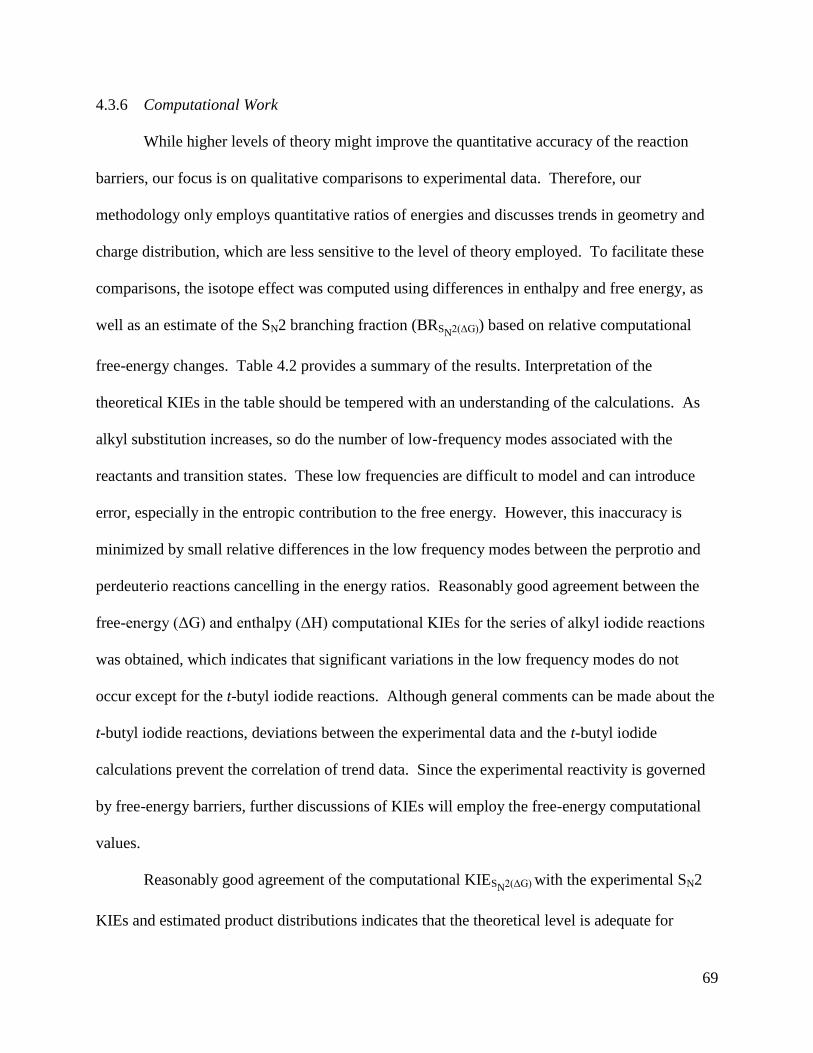
69
4.3.6 Computational Work
While higher levels of theory might improve the quantitative accuracy of the reaction
barriers, our focus is on qualitative comparisons to experimental data. Therefore, our
methodology only employs quantitative ratios of energies and discusses trends in geometry and
charge distribution, which are less sensitive to the level of theory employed. To facilitate these
comparisons, the isotope effect was computed using differences in enthalpy and free energy, as
well as an estimate of the SN2 branching fraction (BRSN2(ΔG)) based on relative computational
free-energy changes. Table 4.2 provides a summary of the results. Interpretation of the
theoretical KIEs in the table should be tempered with an understanding of the calculations. As
alkyl substitution increases, so do the number of low-frequency modes associated with the
reactants and transition states. These low frequencies are difficult to model and can introduce
error, especially in the entropic contribution to the free energy. However, this inaccuracy is
minimized by small relative differences in the low frequency modes between the perprotio and
perdeuterio reactions cancelling in the energy ratios. Reasonably good agreement between the
free-energy (ΔG) and enthalpy (ΔH) computational KIEs for the series of alkyl iodide reactions
was obtained, which indicates that significant variations in the low frequency modes do not
occur except for the t-butyl iodide reactions. Although general comments can be made about the
t-butyl iodide reactions, deviations between the experimental data and the t-butyl iodide
calculations prevent the correlation of trend data. Since the experimental reactivity is governed
by free-energy barriers, further discussions of KIEs will employ the free-energy computational
values.
Reasonably good agreement of the computational KIESN2(ΔG) with the experimental SN2
KIEs and estimated product distributions indicates that the theoretical level is adequate for
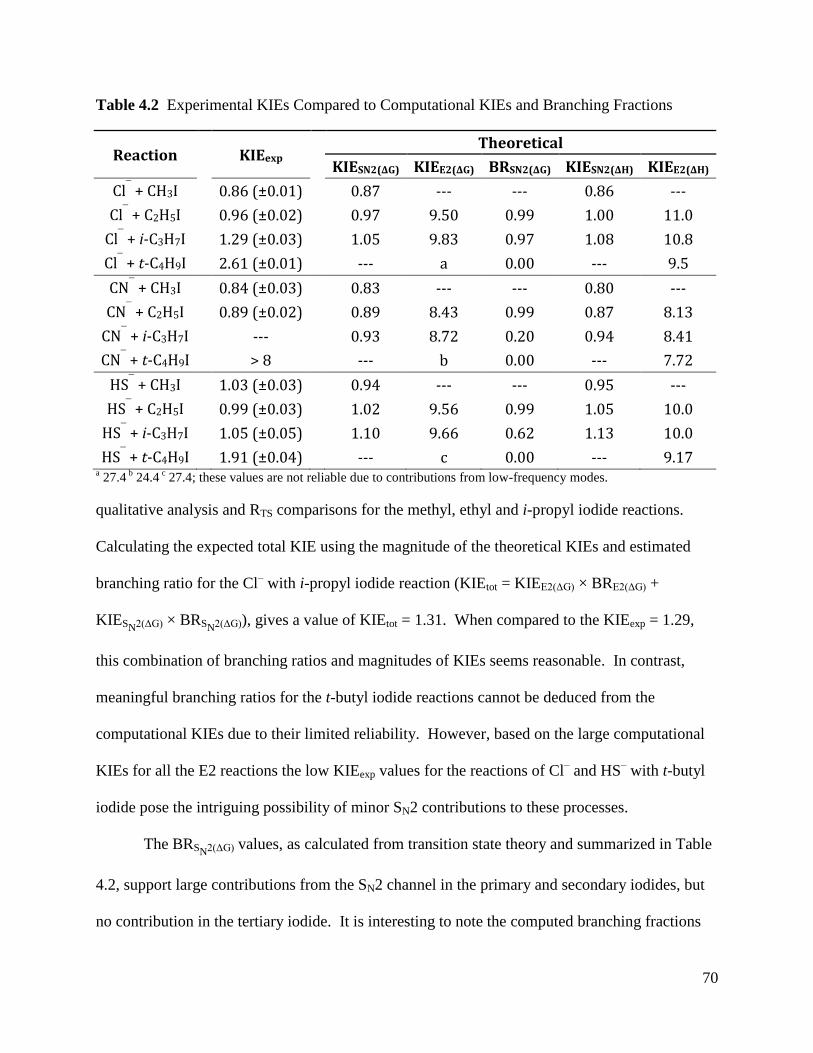
70
Table 4.2 Experimental KIEs Compared to Computational KIEs and Branching Fractions
Reaction
KIEexp
Theoretical
KIESN2(ΔG) KIEE2(ΔG) BRSN2(ΔG) KIESN2(ΔH) KIEE2(ΔH)
Cl¯ + CH3I 0.86 (±0.01) 0.87 --- --- 0.86 ---
Cl¯ + C2H5I 0.96 (±0.02) 0.97 9.50 0.99 1.00 11.0
Cl¯ + i-C3H7I 1.29 (±0.03) 1.05 9.83 0.97 1.08 10.8
Cl¯ + t-C4H9I 2.61 (±0.01) --- a 0.00 --- 9.5
CN¯ + CH3I 0.84 (±0.03) 0.83 --- --- 0.80 ---
CN¯ + C2H5I 0.89 (±0.02) 0.89 8.43 0.99 0.87 8.13
CN¯ + i-C3H7I --- 0.93 8.72 0.20 0.94 8.41
CN¯ + t-C4H9I > 8 --- b 0.00 --- 7.72
HS¯ + CH3I 1.03 (±0.03) 0.94 --- --- 0.95 ---
HS¯ + C2H5I 0.99 (±0.03) 1.02 9.56 0.99 1.05 10.0
HS¯ + i-C3H7I 1.05 (±0.05) 1.10 9.66 0.62 1.13 10.0
HS¯ + t-C4H9I 1.91 (±0.04) --- c 0.00 --- 9.17 a 27.4
b 24.4
c 27.4; these values are not reliable due to contributions from low-frequency modes.
qualitative analysis and RTS comparisons for the methyl, ethyl and i-propyl iodide reactions.
Calculating the expected total KIE using the magnitude of the theoretical KIEs and estimated
branching ratio for the Cl– with i-propyl iodide reaction (KIEtot = KIEE2(ΔG) × BRE2(ΔG) +
KIESN2(ΔG) × BRSN2(ΔG)
), gives a value of KIEtot = 1.31. When compared to the KIEexp = 1.29,
this combination of branching ratios and magnitudes of KIEs seems reasonable. In contrast,
meaningful branching ratios for the t-butyl iodide reactions cannot be deduced from the
computational KIEs due to their limited reliability. However, based on the large computational
KIEs for all the E2 reactions the low KIEexp values for the reactions of Cl– and HS
– with t-butyl
iodide pose the intriguing possibility of minor SN2 contributions to these processes.
The BRSN2(ΔG) values, as calculated from transition state theory and summarized in Table
4.2, support large contributions from the SN2 channel in the primary and secondary iodides, but
no contribution in the tertiary iodide. It is interesting to note the computed branching fractions

71
relative to the efficiency trends observed in the reaction. Upon switching from ethyl to i-propyl
iodide, the efficiency of the Cl–
reaction decreases by 90%, while the efficiency of the HS–
reaction only decreases by 30%. The predicted SN2 and E2 branching provides an interpretation
of this effect based on two factors. First, the increase in steric hindrance around the α-carbon
significantly inhibits the SN2 process. Second, the E2 process is competitive for HS– allowing a
contribution to the overall rate from this channel. Our correlation of E2/SN2 barrier heights with
basicity inferred from our t-C4H9I/CH3I efficiency ratios supports the E2 channel being more
competitive for the more basic HS–.
4.3.7 Looseness Parameters and Electrostatic Model
Correlations between experimental KIEs and looseness parameters have been primarily
restricted to methyl and t-butyl halide reactions in the gas phase. Expansion of these concepts to
the SN2 dominated ethyl and i-propyl iodide reactions provides new insight into transition-state
structures upon substitution. The looseness parameter (RTS), theoretical SN2 KIEs, and transition
state α-carbon atomic charge are compiled in Table 4.3 for the SN2 reactions. Although specific
values are listed in the table, these numbers are not considered an actual measure of the
molecular structures or charge. Rather, the parameters are interpreted qualitatively in order to
access overall trends.
A key observation in Table 4.3 is a loosening of the transition states upon α-carbon
substitution. A comparison of RTS and KIEexp clearly shows an increasingly normal isotope
effect corresponding to longer bonds in the transition state upon progression from methyl
through i-propyl iodide. This change in isotope effect could also be attributed to a reduction in
the number of α-hydrogen/deuterium. However, scaling the isotope effect relative to the number
of hydrogens does not fully account for the magnitude of the shift. Experimental condensed
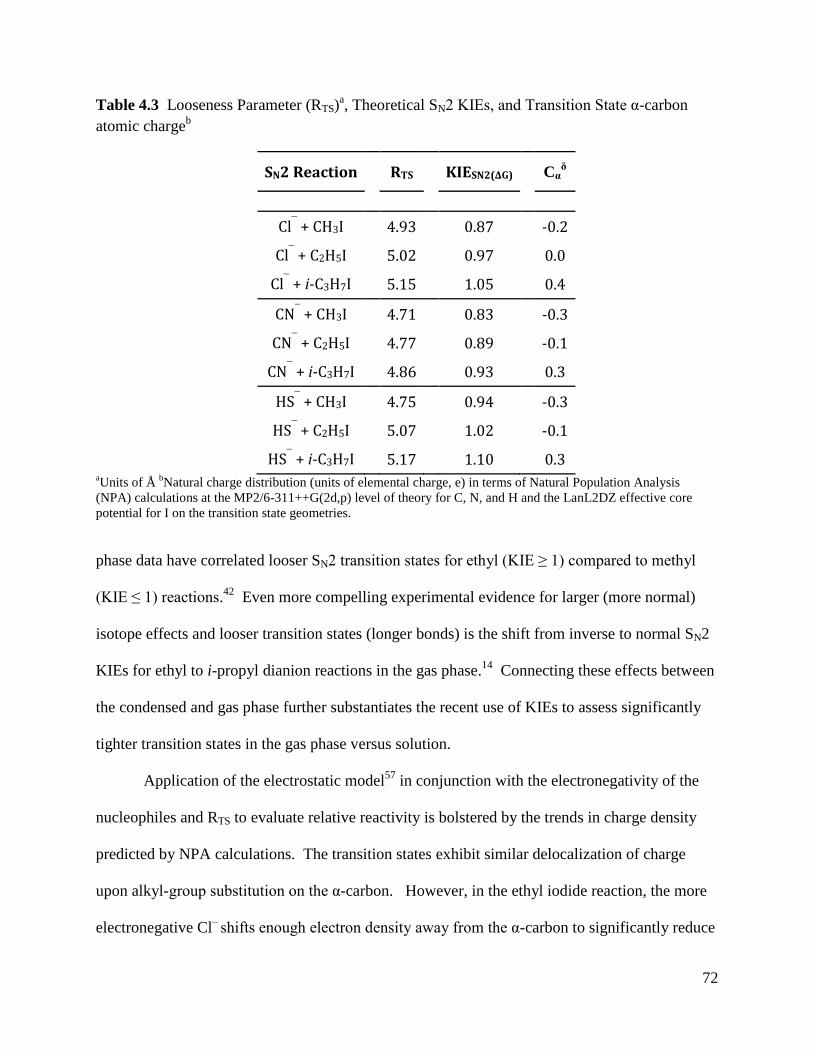
72
Table 4.3 Looseness Parameter (RTS)a, Theoretical SN2 KIEs, and Transition State α-carbon
atomic chargeb
SN2 Reaction RTS KIESN2(ΔG) Cαδ
Cl¯ + CH3I 4.93 0.87 -0.2
Cl¯ + C2H5I 5.02 0.97 0.0
Cl¯ + i-C3H7I 5.15 1.05 0.4
CN¯ + CH3I 4.71 0.83 -0.3
CN¯ + C2H5I 4.77 0.89 -0.1
CN¯ + i-C3H7I 4.86 0.93 0.3
HS¯ + CH3I 4.75 0.94 -0.3
HS¯ + C2H5I 5.07 1.02 -0.1
HS¯ + i-C3H7I 5.17 1.10 0.3 aUnits of Å
bNatural charge distribution (units of elemental charge, e) in terms of Natural Population Analysis
(NPA) calculations at the MP2/6-311++G(2d,p) level of theory for C, N, and H and the LanL2DZ effective core
potential for I on the transition state geometries.
phase data have correlated looser SN2 transition states for ethyl (KIE ≥ 1) compared to methyl
(KIE ≤ 1) reactions.42
Even more compelling experimental evidence for larger (more normal)
isotope effects and looser transition states (longer bonds) is the shift from inverse to normal SN2
KIEs for ethyl to i-propyl dianion reactions in the gas phase.14
Connecting these effects between
the condensed and gas phase further substantiates the recent use of KIEs to assess significantly
tighter transition states in the gas phase versus solution.
Application of the electrostatic model57
in conjunction with the electronegativity of the
nucleophiles and RTS to evaluate relative reactivity is bolstered by the trends in charge density
predicted by NPA calculations. The transition states exhibit similar delocalization of charge
upon alkyl-group substitution on the α-carbon. However, in the ethyl iodide reaction, the more
electronegative Cl– shifts enough electron density away from the α-carbon to significantly reduce
73
repulsive forces and stabilize the transition state. Based on a higher charge density on the α-
carbon, tighter transition states (RTS = R1 + R2) for CN–
have higher repulsive forces, which
destabilize the transition state.
While this model predicts an even more stable transition state for the i-propyl reactions,
the reduced efficiency indicates that other factors are destabilizing the transition state. An
obvious feature absent in the model when applied across substrates is the effect of steric factors.
Alkyl substitution generates steric hindrance which can suppress the SN2 process, while the
release of steric strain in branched substrates can favor the E2 reaction. These forces have the
ability to drive changes in relative barrier heights and influence branching ratios. For the
reactions studied, the steric and electronic effects do not display the ability to drive large
deviations from the original E2/SN2 ratios established using the basicity-reactivity baseline. As a
result computational branching ratios could be employed with estimated relative barrier heights
to correlate reaction efficiencies for the different anions.
One final note of interest, when reviewing the atomic charges present in the transition
states there is significantly more charge on the leaving group for the reaction of Cl– and i-propyl
iodide reaction, than for the analogous reactions. This is intriguing because the SN2 process is
predicted to dominate the branching ratio for this reaction relative to the other anions.
Computational studies60
have shown enhanced reactivity (lower SN2 barrier heights) for
nucleophiles with looser and more ionic transition states (i.e., Xδ-
, Yδ-
, and Cαδ+
), such as those
present in the Cl– and i-propyl iodide reaction.
4.4 Conclusion
Our investigation of the apparent dominance of the SN2 mechanism for some alkyl iodide
reactions has provided a more detailed picture of kinetics, mechanisms, and product distributions

74
in the gas phase. Analysis of reactivity trends and the electronic and structural properties for the
series of alkyl iodide reactions with Cl–, HS
–, and CN
– have led to the following findings.
(1) The relative E2/SN2 barrier heights for the ethyl and i-propyl iodide reactions appear to
significantly favor the SN2 pathway. Relative efficiencies indicate that the E2 pathway is
more sensitive to basicity. At higher anion basicities the E2 pathway becomes more
competitive with the SN2 process.
(2) A multipole electrostatic model57
explains the relative reactivity for reactions with similar
branching and steric factors. When employed in conjunction with the electronegativity of
the nucleophile (to account for electron density on Cα) and the looseness of the transition
state (assessed through KIEs or RTS), all trends in the ethyl iodide reactions can be
explained.
(3) Larger (more normal) isotope effects and looser SN2 transition states (longer bonds) are
produced upon alkyl group substitution. These effects correlate with condensed phase
studies.
The alkyl iodide reaction series has proven to be an ideal system for expansion of common
techniques for evaluating exclusively SN2 reactions and correlating the results of dianion studies.
The halide ion-alkyl iodide reactions provide a simple monatomic basicity-reactivity baseline
from which reactivity changes for various nucleophiles can be assessed. In addition, the reaction
rate constants fall within the center of our experimental detection range. Future gas-phase
studies on alkyl iodide reactions are certain to provide further insight into reactivity trends.

75
4.5 References
1. Carey, F. A.; Sundberg, R. J. Advanced Organic Chemistry: Part A: Structure and
Mechanism. 5th ed.; Springer: New York, 2007.
2. Lowry, T. H.; Richardson, K. S. Mechanism and Theory in Organic Chemistry. Harper
and Row: New York, 1987.
3. Bachrach, S. M.; Mulhearn, D. C. J. Phys. Chem. 1996, 100, 3535-3540.
4. Dmitrenko, O.; Thorpe, C.; Bach, R. D. J. Org. Chem. 2007, 72, 8298-8307.
5. Lum, R. C.; Grabowski, J. J. J. Am. Chem. Soc. 1992, 114, 9663-9665.
6. Wladkowski, B. D.; Brauman, J. I. J. Am. Chem. Soc. 1992, 114, 10643-10644.
7. Villano, S. M.; Eyet, N.; Lineberger, W. C.; Bierbaum, V. M. J. Am. Chem. Soc. 2009,
131 (23), 8227-8233.
8. Villano, S. M.; Kato, S.; Bierbaum, V. M. J. Am. Chem. Soc. 2006, 128, 736-737.
9. DePuy, C. H.; Gronert, S.; Mullin, A.; Bierbaum, V. M. J. Am. Chem. Soc. 1990, 112,
8650-8655.
10. Gronert, S. Acc. Chem. Res. 2003, 36, 848-857.
11. Haib, J.; Stahl, D. Org. Mass Spectrom. 1992, 27, 377-382.
12. Lum, R. C.; Grabowski, J. J. J. Am. Chem. Soc. 1988, 110, 8568-8570.
13. Jones, M. E.; Ellison, G. B. J. Am. Chem. Soc. 1989, 111, 1645-1654.
14. Gronert, S.; Fagin, A. E.; Wong, L. J. Am. Chem. Soc. 2007, 129, 5330-5331.
15. Mugnai, M.; Cardini, G.; Schettino, V. J. Phys. Chem. A 2003, 107, 2540-2547.
16. Ermolaeva, L. V.; Appolonova, S. A.; Plemenkov, V. V.; Konovalov, A. I. Theochem. J.
Mol. Struct. 1997, 398, 451-455.
17. Gronert, S.; DePuy, C. H.; Bierbaum, V. M. J. Am. Chem. Soc. 1991, 113, 4009-4010.
18. Hu, W. P.; Truhlar, D. G. J. Am. Chem. Soc. 1996, 118, 860-869.
19. Bickelhaupt, F. M. J. Comput. Chem. 1999, 20, 114-128.
20. Wu, X. P.; Sun, X. M.; Wei, X. G.; Ren, Y.; Wong, N. B.; Li, W. K. J. Chem. Theory
Comput. 2009, 5, 1597-1606.
21. Gronert, S.; Lee, J. M. J. Org. Chem. 1995, 60, 4488-4497.
22. Mackay, G. I.; Bohme, D. K. J. Am. Chem. Soc. 1978, 100, 327-329.
23. Olmstead, W. N.; Brauman, J. I. J. Am. Chem. Soc. 1977, 99, 4219-4228.
24. O'Hair, R. A. J.; Davico, G. E.; Hacaloglu, J.; Dang, T. T.; DePuy, C. H.; Bierbaum, V.
M. J. Am. Chem. Soc. 1994, 116, 3609-3610.
25. Toteva, M. M.; Richard, J. P. J. Am. Chem. Soc. 2000, 122, 11073-11083.
26. Garver, J. M.; Fang, Y.; Eyet, N.; Villano, S. M.; Bierbaum, V. M.; Westaway, K. C. J.
Am. Chem. Soc. 2010, 132, 3808-3814.
27. Uggerud, E. Pure Appl. Chem. 2009, 81, 709-717.
28. Gronert, S.; Fagin, A. E.; Okamoto, K.; Mogali, S.; Pratt, L. M. J. Am. Chem. Soc. 2004,
126, 12977-12983.
29. Gronert, S. Chem. Rev. 2001, 101, 329-360.
30. Flores, A. E.; Gronert, S. J. Am. Chem. Soc. 1999, 121, 2627-2628.
31. Pellerite, M. J.; Brauman, J. I. J. Am. Chem. Soc. 1983, 105, 2672-2680.
32. Laerdahl, J. K.; Uggerud, E. Int. J. Mass Spectrom. 2002, 214, 277-314.
33. Glad, S. S.; Jensen, F. J. Org. Chem. 1997, 62, 253-260.
34. Nielsen, P. A.; Glad, S. S.; Jensen, F. J. Am. Chem. Soc. 1996, 118, 10577-10583.
35. Davico, G. E.; Bierbaum, V. M. J. Am. Chem. Soc. 2000, 122, 1740-1748.

76
36. Glad, S. S.; Jensen, F. J. Am. Chem. Soc. 1994, 116, 9302-9310.
37. Viggiano, A. A.; Paschkewitz, J. S.; Morris, R. A.; Paulson, J. F.; Gonzalezlafont, A.;
Truhlar, D. G. J. Am. Chem. Soc. 1991, 113, 9404-9405.
38. Hu, W. P.; Truhlar, D. G. J. Am. Chem. Soc. 1995, 117, 10726-10734.
39. Hu, W. P.; Truhlar, D. G. J. Am. Chem. Soc. 1994, 116, 7797-7800.
40. Glad, S. S.; Jensen, F. J. Am. Chem. Soc. 1997, 119, 227-232.
41. Wolfe, S.; Kim, C. K. J. Am. Chem. Soc. 1991, 113, 8056-8061.
42. Poirier, R. A.; Wang, Y. L.; Westaway, K. C. J. Am. Chem. Soc. 1994, 116, 2526- 2533.
43. Westaway, K. C. J. Labelled Compd. Radiopharm. 2007, 50, 989-1005.
44. Gronert, S.; DePuy, C. H.; Bierbaum, V. M. J. Am. Chem. Soc 1991, 113, 4009-4010.
45. Van Doren, J. M.; Barlow, S. E.; DePuy, C. H.; Bierbaum, V. M. Int. J. Mass Spectrom.
Ion Proc. 1987, 81, 85-100.
46. Frisch, M. J.; Trucks, G. W.; Schlegel, H. B.; Scuseria, G. E.; Robb, M. A.; Cheeseman,
J. R.; Montgomery, J. J. A.; Vreven, T.; Kudin, K. N.; Burant, J. C.; Millam, J. M.;
Iyengar, S. S.; Tomasi, J.; Barone, V.; Mennucci, B.; Cossi, M.; Scalmani, G.; Rega, N.;
Petersson, G. A.; Nakatsuji, H.; Hada, M.; Ehara, M.; Toyota, K.; Fukuda, R.; Hasegawa,
J.; Ishida, M.; Nakajima, T.; Honda, Y.; Kitao, O.; Nakai, H.; Klene, M.; Li, X.; Knox, J.
E.; Hratchian, H. P.; Cross, J. B.; Bakken, V.; Adamo, C.; Jaramillo, J.; Gomperts, R.;
Stratmann, R. E.; Yazyev, O.; Austin, A. J.; Cammi, R.; Pomelli, C.; Ochterski, J. W.;
Ayala, P. Y.; Morokuma, K.; Voth, G. A.; Salvador, P.; Dannenberg, J. J.; Zakrzewski,
V. G.; Dapprich, S.; Daniels, A. D.; Strain, M. C.; Farkas, O.; Malick, D. K.; Rabuck, A.
D.; Raghavachari, K.; Foresman, J. B.; Ortiz, J. V.; Cui, Q.; Baboul, A. G.; Clifford, S.;
Cioslowski, J.; Stefanov, B. B.; Liu, G.; Liashenko, A.; Piskorz, P.; Komaromi, I.;
Martin, R. L.; Fox, D. J.; Keith, T.; Al-Laham, M. A.; Peng, C. Y.; Nanayakkara, A.;
Challacombe, M.; Gill, P. M. W.; Johnson, B.; Chen, W.; Wong, M. W.; Gonzalez, C.;
Pople, J. A. Gaussian 03, Revision B.05, Gaussian, Inc.: Pittsburgh, PA, 2004.
47. Zhang, Q. Z.; Wang, H. N.; Sun, T. L.; Wang, W. X. J. Chem. Phys. 2006, 324, 298-306.
48. Hadad, C. M.; Rablen, P. R.; Wiberg, K. B. J. Org. Chem. 1998, 63, 8668-8681.
49. Moller, C.; Plesset, M. S., Phys. Rev. 1934, 46, 618-622.
50. Hay, P. J.; Wadt, W. R. J. Chem. Phys. 1985 82, 270-283.
51. Merrick, J. P.; Moran, D.; Radom, L., J. Phys. Chem. A 2007, 111, 11683-11700.
52. Bierbaum, V. M.; Grabowski, J. J.; DePuy, C. H., J. Phys. Chem. 1984, 88, 1389-1393.
53. Su, T.; Chesnavich, W. J., J. Chem. Phys. 1982, 76, 5183-5185.
54. Sauers, R. R. J. Chem. Theory Comput. 2010 6, 602-606.
55. Shaik, S. S., Acta Chem. Scand. 1990, 44, 205-221.
56. Ren, Y.; Yamataka, H., J. Comput. Chem. 2009, 30, 358-365.
57. Gronert, S.; Pratt, L. M.; Mogali, S., J. Am. Chem. Soc. 2001, 123, 3081-3091.
58. March, J. Advanced Organic Chemistry: Reactions, Mechanisms, and Structure 4th ed.;
John Wiley & Sons, Inc: New York, 1992.
59. Luo, Y. R.; Benson, S. W. Acc. Chem. Res. 1992, 25, 375-381.
60. Ren, Y.; Yamataka, H. J. Org. Chem. 2007, 72, 5660-5667.
61. P.J. Linstrom and W.G. Mallard, Eds., NIST Chemistry WebBook, National Institute
of Standards and Technology, NIST Standard Reference Database Number 69,
Gaithersburg MD, 20899, http://webbook.nist.gov; (retrieved October 23, 2009.)

77
CHAPTER 5
Experimental Validation of the α-Effect in the Gas Phase
Adapted from
Garver, J. M.; Gronert, S.; Bierbaum, V. M. submitted for publication as a communication (J. Am. Chem. Soc.)
Abstract
The α-effect, an enhanced nucleophilicity of an anion with lone pair electrons adjacent to the
attacking atom, has been well documented in solution; however, there is continuing disagreement
whether this effect is a purely solvent induced phenomenon or an intrinsic property of the α-
nucleophiles. To resolve these discrepancies, we explore the α-effect in the bimolecular
nucleophilic substitution (SN2) reaction in the gas phase. Our results show enhanced
nucleophilicity for HOO¯ relative to “normal” alkoxides in three separate reaction series (methyl
fluoride, anisole, and 4-fluoroanisole) validating an intrinsic origin of the α-effect. Caution must
be employed when making comparisons of the α-effect between the condensed and gas phase
due to significant shifts in anion basicity between these media. Variations in electron affinities
and homolytic bond strengths between the normal and α-anions indicate that HOO¯ has
distinctive thermochemical properties.
HOO + CH3+ + e¯
EA(HOO)
HOO¯ + CH3+
MCA
IE(CH3)
HOOCH3 (g) + F¯ (g)
HOO¯ (g) + CH3F (g)
kHOO¯ kCH3O¯
F¯ (g) + CH3OCH3 (g)
CH3O¯ (g) + CH3F (g)
CH3O¯ + CH3+
EA(CH3O)IE(CH3)
CH3O + CH3+ + e¯
HOO + CH3
D0(HOO―CH3)D0(CH3O―CH3)
CH3O + CH3
α-effectkHOO¯ = 4 kCH3O¯
78
5.1 Introduction
Gas-phase kinetic studies1, 2
have provided an indispensable means to probe the
energetics and intrinsic reactivity of prototypical organic reactions, free of solvent and
counterion effects. Experimental and computational work3-10
has provided a wealth of
knowledge on the dynamic, energetic, and steric factors inherent to bimolecular nucleophilic
substitution (SN2) reactions. Reaction rates are strongly influenced by non-covalent interactions,
particularly the ion-stabilizing effect of solvents. These “solvent effects” can not only mask
intrinsic differences, but can become the controlling factor that governs nucleophilicity. One of
the most complex areas of interest with regard to these factors is the enhanced reactivity of
α-nucleophiles. The term α-effect11
has been used to describe the increased reactivity relative to
a given basicity for nucleophiles with a lone pair of electrons adjacent to the attacking atom.
Magnitudes of the α-effect (kα/knormal) in the range of 5−1000 have been reported in solution for
numerous reactions, and mysteriously absent in others.12
Variations in the magnitude of the α-
effect can be attributed to solvent effects generating differential transition state stabilization and
ground state destabilization. Depending on the nucleophile-substrate system studied, either the
transition state stabilization13
or ground state destabilization14
can dominate as the controlling
factor in the overall effect. Differential solvation energies between normal and α-nucleophiles of
16 kJ mol-1
and 24 kJ mol-1
can lead to ground state α-effect rate enhancements by factors of 750
and 15000.12, 14
Due to this complexity, gas phase studies provide a vital link to resolving the
intrinsic nature of the α-effect and providing insight into solvent effects.
Our research group has conducted several studies in an attempt to reveal the intrinsic
nature and origin of the α-effect. Our initial work showed similar reactivity with methyl
formate15
for the reagent pairing of HOO¯ and HO¯ (a standard reference employed in solution).
79
Patterson and Fountain16
suggest that the minor differences in these experimental data actually
support an α-effect and rationalize enhanced reactivity in HOO¯ due to a high degree of single-
electron-transfer17
character. They argue that assessment of the α-effect in the gas phase requires
strict adherence to the matched acidities in reagent pairing between the normal and
α-nucleophiles. More recently, calculations by Ren and Yamataka18, 19
advocate for the existence
of a large α-effect [i.e., ΔΔH‡(HOO¯ vs X¯) = 17.1 kJ mol
-1 ≈ 960 times rate enhancement] in
the gas phase reactions of α-nucleophiles with methyl chloride. However, we found no
significant deviations in the Brønsted correlation for a series of SN2 reactions of normal and α-
nucleophiles with methyl chloride.20
This result may reflect difficulties in experimentally
examining the computed systems or an overestimation of the magnitude of the α-effect based on
the series and range of anionic reactions used to define “normal” barrier heights. Interestingly,
McAnoy et al.21
reported major differences in the branching ratios in the reactions of HOO¯ and
CD3O¯ with dimethyl methylphosphonate. Since HOO¯ and CD3O¯ have similar proton
affinities, this difference in branching ratios was attributed to greater nucleophilicity of HOO¯;
however, the absolute rate constants were not measured. It is not clear if the branching reflects
differences in barriers or simply reaction dynamics. In an effort to resolve the conflicting results,
we investigate the kinetics of SN2 reactions of low exothermicity where a smaller
thermodynamic component of the activation barrier may expose α-nucleophilicity. Our results
clearly show enhanced reactivity for an α-nucleophile (HOO¯) relative to a series of normal
nucleophiles (HO¯, CH3O¯, C2H5O¯, and i-C3H7O¯) in the reactions of methyl fluoride, anisole,
and 4-fluoroanisole. Our most definitive evidence is exhibited in the methyl fluoride reactions
where only the SN2 pathways are present, thus simplifying (versus competitive reaction systems)
the identification of the α-effect.

80
5.2 Experimental
The overall reaction rate constants (300 ± 2 K) and branching fractions were measured
using a tandem flowing afterglow-selected ion flow tube instrument, FA-SIFT.22, 23
Briefly, this
instrument consists of an ion source, an ion selection region, a reaction flow tube, and a detection
system (quadrupole mass filter coupled to an electron multiplier). Reaction rate constants are
measured by monitoring ion signal as a function of reaction distance. Product branching ratios
are determined by extrapolating the observed product yields to zero reaction distance in order to
extract the initial ratios due to primary reactions. The reported reaction efficiencies are the
experimental rate constant divided by the calculated collision rate constants; these values
represent the fraction of collisions that result in reaction. Collision rate constants were
calculated from parameterized trajectory collision rate theory.24, 25
Error bars represent one
standard deviation of the mean in the averages of at least three individual measurements;
absolute uncertainties in these rate constant measurements are ± 20%.
5.3 Results and Discussion
5.3.1 Kinetic Data
The proton affinity (PA)26, 27
of the anions, exothermicity of the SN2 reaction (ΔHrxn),
overall experimental rate constant (kexpt), branching fractions, SN2 reaction efficiency (Eff), and
magnitude of the α-effect as a function of relative reaction efficiencies for the gas phase
reactions of HOO¯ relative to the normal oxyanions (HO¯, CH3O¯, C2H5O¯, and i-C3H7O¯) with
methyl fluoride (CH3F), anisole (CH3OC6H5) and 4-fluoroanisole (CH3OC6H4F) are listed in
Table 5.1. No observable reaction or association products occurred for the reaction of C2H5O¯
with methyl fluoride. Therefore, we place an upper limit for the rate constant and efficiency for
this reaction. While the SN2 mechanism is observed in most of the reactions, access to the proton

Table 5.1 Thermodynamic Parameters, Kinetic Data, and Branching Fractions to Evaluate the α-Effect for HOO¯ Relative to Normal
Oxyanions (HO¯, CH3O¯, C2H5O¯, and i-C3H7O¯) in a Series of Bimolecular Nucleophilic Substitution (SN2) Reactions
aUnits of kJ mol
-1; Proton Affinity (PA) from refs 26 and 27; Exothermicity of the SN2 reaction (ΔHrxn) calculated using heats of formation from ref 27 where
ΔHrxn for 4-fluoroanisole reactions estimated from anisole reactions based on proton affinity difference (12 kJ mol-1
). bOverall experimental rate constant (kexpt)
in units of cm3 molecule
-1 s
-1; error bars represent one standard deviation of the mean of three or more measurements; absolute accuracy is ±20%.
cSN2, proton
transfer (PT), and association product branching fractions are determined by extrapolating the observed product yields to zero reaction distance in order to extract
the initial ratios due to primary reactions; Efficiency (Eff) is the ratio of the branching rate constants (kSN2 = kexpt × branching fraction) to the collision rate
constant (kcol) calculated using parameterized trajectory collision theory (ref 24) and dipole moments and polarizability from ref 25.
81
82
transfer (PT) channel is limited due to the relatively high proton affinities of anisole (1637 ± 2 kJ
mol-1
)28
and 4-fluoroanisole (1614 ± 3 kJ mol-1
)29
. Association products (X¯∙M) were observed
in the larger reaction systems corresponding to the longer lifetimes of the reactant ion-dipole
complex allowing for collisional stabilization by the He buffer gas. The reaction of i-C3H7O¯
with anisole and 4-fluoroanisole formed only association products and therefore did not provide
insight into the SN2 reactivity.
5.3.2 Evaluating the α-effect
The exothermicity of an SN2 reaction is equal to the difference in the methyl cation
affinity of the nucleophile and nucleofuge. Since both nucleophilicity and basicity involve the
donation of electrons to an electrophile, it is not surprising that a strong linear correlation also
exists between proton affinity (X¯ + H+ → HX) and methyl cation affinity (X¯ + CH3
+ →
CH3X).30
Deviations from linearity in reactivity-basicity correlations can reflect the influence of
additional variables or the manifestation of unique energetics in the transition state. The
enhanced reactivity of an α-nucleophile is typically evaluated relative to normal anions of similar
basicity through a Brønsted-type correlation or anionic reagent pairing (kα/knormal). Trends in
reaction efficiencies show enhanced nucleophilicity for HOO¯ compared to the normal alkoxides
(CH3O¯ and C2H5O¯) relative to their proton affinity. The relative α-effect, (EffHOO¯/EffX¯),
more clearly reflects these trends and provides a method to assess the magnitude of the α-effect
(Fig 5.1). As predicted by the Marcus relationship, the largest shifts in relative reactivity occur
in the CH3F system where intrinsic differences would be least masked by thermodynamic driving
forces. The HOO¯ reaction is 50 times more efficient than that of C2H5O¯ even though the
proton affinity of ethoxide is 10 kJ mol-1
higher than that of the peroxide. This result most
clearly reveals the α-effect in the gas phase. More modest enhancements are observed relative to

83
C2H5O¯ with anisole (9 times) and 4-fluoroanisole (12 times) and small comparative differences
exist for all the CH3O¯ reactions (2.3-3.7 times). The ratio of rate constants of HOO¯ to HO¯
(kHOO¯/kHO¯) is a standard reference employed in solution to assess the magnitude of the α-effect.
While HOO¯ displays enhanced reactivity in the gas phase relative to alkoxides, the peroxide
rate does not exceed that of HO¯. This is likely related to the much greater relative basicity of
HO¯ in the gas phase (see below).
5.3.3 Common Scale for Acidity/Basicity (Condensed and Gas Phase)
In the gas phase, acidity is defined as the free-energy change associated with the
deprotonation (HX → X¯ + H+) of a given chemical species. In contrast for solution, acidity is
evaluated using the equilibrium constants of proton transfer. We can devise a common scale for
acidity by translating aqueous pKa values [pKHOH = 15.74, pKCH3OH = 15.54, pKC2H5OH = 15.9
(extrapolated), and pKHOOH = 11.64]31, 32
to free energies of deprotonation at 298 K using the
Gibbs free-energy relationship with equilibrium constants [ΔGbase(HO¯) = 89.84, ΔGbase(CH3O¯)
Figure 5.1 Magnitude of the α-effect for HOO¯ (PA = 1575 kJ mol-1
) relative to CH3O¯ (PA =
1598 kJ mol-1
) and C2H5O¯ (PA = 1585 kJ mol-1
).
3.7 2.3 2.3
50
9.012
0
10
20
30
40
50
60
methyl fluoride anisole 4-fluoroanisole
CH3O¯ vs HOO¯
C2H5O¯
EffHOO¯/EffCH3O¯
EffHOO¯/EffC2H5O¯R
elat
ive
Rat
e E
nh
ance
men
t
>

84
= 88.70, ΔGbase(C2H5O¯) = 90.8, and ΔGbase(HOO¯) = 66.44 kJ mol-1
]. Figure 5.2 depicts the
relative free energy of deprotonation with respect to HOO¯ for both the gas phase and aqueous
solution. While there is little difference in free energies of deprotonation for the normal
nucleophiles in solution relative to HOO¯ [ΔΔG(HO¯) = 23.4, ΔΔG(CH3O¯) = 22.3, and
ΔΔG(C2H5O¯) = 24.3 kJ mol-1
], significant differences exist in the gas phase [ΔΔG(HO¯) =
59.4, ΔΔG(CH3O¯) = 25.1, and ΔΔG(C2H5O¯) = 11.7 kJ mol-1
].26, 27
Methoxide is the
nucleophile that maintains the most similar relative basicity to HOO¯ in both media. On the
other hand, HO¯ is much more basic in the gas phase relative to HOO¯. Therefore, HO¯ would
act as a “super” nucleophile in the gas phase relative to solution and it is unlikely that an α-effect
could overcome this difference in relative basicity in order for HOO¯ to be more reactive in our
studies.
Figure 5.2 Suppression of the differences in relative free energies of deprotonation in
aqueous solution [∆ΔG = ΔGbase(X¯) – ΔGbase(HOO¯) for both the gas phase and
aqueous solution in kJ mol-1
].
0
10
20
30
40
50
60
0
10
20
30
40
50
60∆
∆G
ga
sp
ha
se
(kJ
mo
l-1)
HOO‾ (g)
C2H5O‾ (g)
CH3O‾ (g)
HO‾ (g)
∆∆
Ga
qu
eo
us
(kJ m
ol -1)
HOO‾ (aq)
HO‾ (aq)
CH3O‾ (aq)
C2H5O‾ (aq)
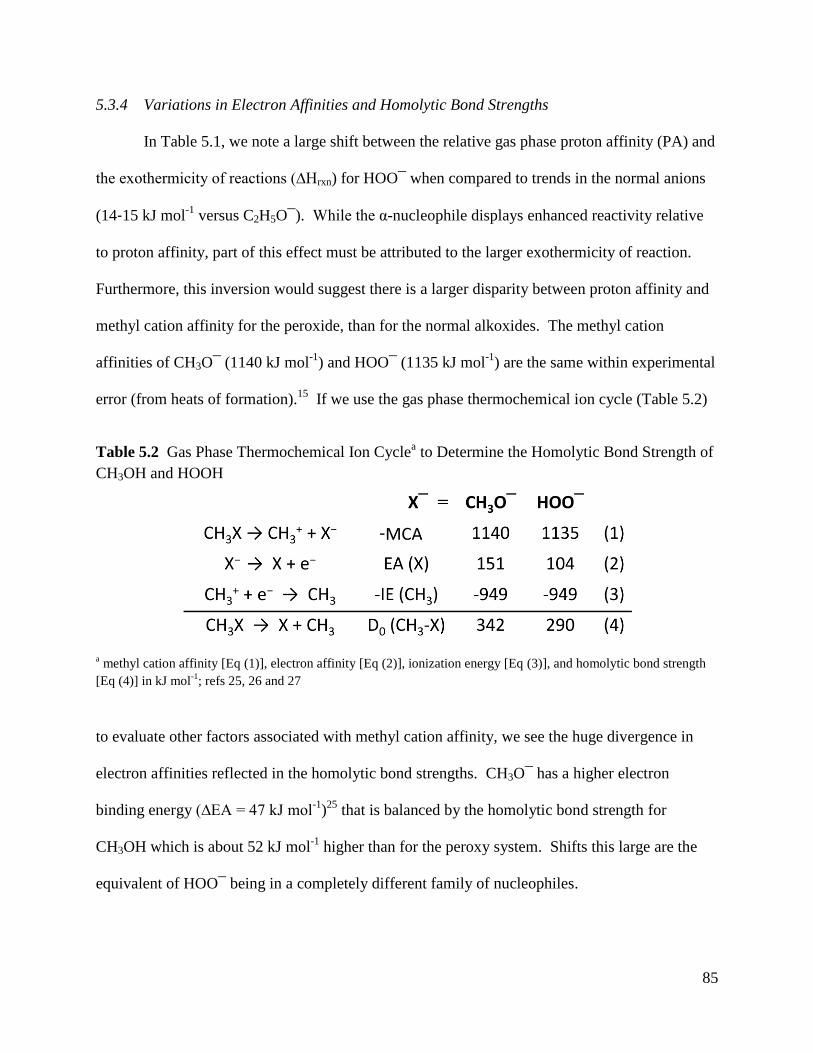
85
5.3.4 Variations in Electron Affinities and Homolytic Bond Strengths
In Table 5.1, we note a large shift between the relative gas phase proton affinity (PA) and
the exothermicity of reactions (∆Hrxn) for HOO¯ when compared to trends in the normal anions
(14-15 kJ mol-1
versus C2H5O¯). While the α-nucleophile displays enhanced reactivity relative
to proton affinity, part of this effect must be attributed to the larger exothermicity of reaction.
Furthermore, this inversion would suggest there is a larger disparity between proton affinity and
methyl cation affinity for the peroxide, than for the normal alkoxides. The methyl cation
affinities of CH3O¯ (1140 kJ mol-1
) and HOO¯ (1135 kJ mol-1
) are the same within experimental
error (from heats of formation).15
If we use the gas phase thermochemical ion cycle (Table 5.2)
Table 5.2 Gas Phase Thermochemical Ion Cyclea to Determine the Homolytic Bond Strength of
CH3OH and HOOH
a methyl cation affinity [Eq (1)], electron affinity [Eq (2)], ionization energy [Eq (3)], and homolytic bond strength
[Eq (4)] in kJ mol-1
; refs 25, 26 and 27
to evaluate other factors associated with methyl cation affinity, we see the huge divergence in
electron affinities reflected in the homolytic bond strengths. CH3O¯ has a higher electron
binding energy (∆EA = 47 kJ mol-1
)25
that is balanced by the homolytic bond strength for
CH3OH which is about 52 kJ mol-1
higher than for the peroxy system. Shifts this large are the
equivalent of HOO¯ being in a completely different family of nucleophiles.
86
5.4 Conclusion
In summary, we report enhanced nucleophilicity for HOO¯ relative to normal alkoxides
in three reaction systems validating an intrinsic origin of the α-effect. Similarities in the relative
basicities (in both the condensed and gas phase) and methyl cation affinities suggest the reagent
pairing of CH3O¯ and HOO¯ should be employed in the evaluation of the α-effect, as well as in
drawing correlations with solution. Large shifts between the relative gas phase proton affinity
and the exothermicity of reaction for HOO¯ when compared to trends in the normal anions
indicate differences between the natures of the nucleophiles. Variations in electron affinities and
homolytic bond strengths between the methoxy and peroxy systems imply that significant
variations would exist between electrostatic and orbital interactions within the transition states of
normal and α-nucleophiles.
87
5.5 References
1. Gronert, S. Chem. Rev. 2001, 101, 329-360.
2. Bohme, D. K. Can. J. Chem. 2008, 86, 177-198.
3. Hu, W. P.; Truhlar, D. G. J. Am. Chem. Soc. 1996, 118, 860-869.
4. Laerdahl, J. K.; Uggerud, E. Int. J. Mass Spectrom. 2002, 214, 277-314.
5. Shaik, S. S.; Schlegel, H. B.; Wolfe, S. Theoretical Aspects of Physical Organic
Chemistry: The SN2 Reaction. Wiley: New York, 1992.
6. Viggiano, A. A.; Midey, A. J. J. Phys. Chem. A 2000, 104, 6786-6790.
7. Hase, W. L. Science 1994, 266, 998-1002.
8. Graul, S. T.; Bowers, M. T. J. Am. Chem. Soc. 1994, 116, 3875-3883.
9. Hoz, S.; Basch, H.; Wolk, J. L.; Hoz, T.; Rozental, E. J. Am. Chem. Soc. 1999, 121, 7724-
7725.
10. Gronert, S.; Fagin, A. E.; Okamoto, K.; Mogali, S.; Pratt, L. M. J. Am. Chem. Soc. 2004,
126, 12977-12983.
11. Edwards, J. O.; Pearson, R. G. J. Am. Chem. Soc. 1962, 84, 16-24.
12. Buncel, E.; Um I. H. Tetrahedron 2004, 60, 7801-7825.
13. Um, I. H.; Shin, Y. H.; Han, J. Y.; Buncel, E. Can. J. Chem. 2006, 84, 1550-1556.
14. Kim, M. S.; Min, S. W.; Seo, J. A.; Um, I. H. Bull. Korean Chem. Soc. 2009, 30, 2913-
2917.
15. DePuy, C. H.; Della, E. W.; Filley, J.; Grabowski, J. J.; Bierbaum, V. M. J. Am. Chem.
Soc. 1983, 105, 2481-2482.
16. Patterson, E. V.; Fountain, K. R. J. Org. Chem. 2006, 71, 8121-8125.
17. Hoz, S. J. Org. Chem. 1982, 47, 3545-3547.
18. Ren, Y.; Yamataka, H. J. Org. Chem. 2007, 72, 5660-5667.
19. Ren, Y.; Yamataka, H. Chem. Eur. J. 2007, 13, 677-682.
20. Villano, S. M.; Eyet, N.; Lineberger, W. C.; Bierbaum, V. M. J. Am. Chem. Soc. 2009,
131, 8227-8233.
21. McAnoy, A. M.; Paine, M. R. L.; Blanksby, S. J. Org. Biomol. Chem. 2008, 6, 2316-
2326.
22. Van Doren, J. M.; Barlow, S. E.; DePuy, C. H.; Bierbaum, V. M. Int. J. Mass Spectrom.
1987, 81, 85-100.
23. Bierbaum, V. M. In Encyclopedia of Mass Spectrometry; Editor, Gross, M. L., Caprioli,
R., Eds.; Elsevier: Amsterdam, 2003; Vol. 1, p 98.
24. Su, T.; Chesnavich, W. J. J. Chem. Phys. 1982, 76, 5183-5185.
25. CRC Handbook of Chemistry and Physics, 89th ed.; Editor, Lide, D. R., Ed.; CRC Press:
Boca Raton, Fl., 2008.
26. Ervin, K. M.; DeTuro, V. F. J. Phys. Chem. A 2002, 106, 9947-9956.
27. Bartmess, J. E. "Negative Ion Energetics Data" in NIST Chemistry WebBook, NIST
Standard Reference Database Number 69, Eds. Linstrom, P.J and Mallard, W.G.,
National Institute of Standards and Technology, Gaithersburg MD, 20899,
http://webbook.nist.gov, (retrieved 1 May, 2011).
28. This Work: HO¯ + C6H5OCH3 → C6H4OCH3¯+ H2O, kf = 6.7 ± 0.2 x 10⁻¹⁰
cm3 s
-1 and
C6H4OCH3¯+ H2O → HO¯+ C6H5OCH3, kr = 5.00 ± 0.03 x 10⁻¹⁰
cm3 s
-1; ΔacidG298 =
1606 ± 2 kJ mol-1
and ΔacidH298 = 1637 ± 2 kJ mol-1, where TΔacidS298 = 31 kJ mol
-1.

88
29. This Work: HO¯ + FC6H4OCH3 FC6H3OCH3¯+ H2O, kf = 1.1 ± 0.4 x 10⁻¹¹
cm3 s
-1
and FC6H3OCH3¯+ H2O HO¯+ FC6H4OCH3, kr = 7.85 ± 0.12 x 10
-10 cm
3 s
-1;
ΔacidG298 = 1582 ± 3 kJ mol-1
and ΔacidH298 = 1614 ± 3 kJ mol-1, where TΔacidS298 =
32 kJ mol-1
.
30. Uggerud, E. Pure Appl. Chem. 2009, 81, 709-717.
31. Ballinger, P.; Long, F. A. J. Am. Chem. Soc. 1960, 82, 795-798.
32. Serjeant, E. P.; Dempsey, B. Ionisation constants of organic acids in aqueous solution
(IUPAC Chemical Data Series); Pergamon Press: Oxford; New York, 1979.

89
CHAPTER 6
Resolving the α-effect in Gas Phase SN2 Reactions:
A Marcus Theory Approach
Adapted from
Garver, J. M.; Yang, Z.; Nichols C. M.; Worker, B. B.; Gronert, S.; Bierbaum, V. M. (in preparation)
Overview
Recently, we reported experimental validation of the α-effect in the gas phase. However, an
earlier study by our group showed a lack of enhanced reactivity in a series of SN2 reactions of
α-nucleophiles with methyl chloride conflicting with computational predictions. [Ren, Y.;
Yamataka, H. Chem. Eur. J. 2007, 13, 677-682.] In an attempt to resolve these discrepancies,
we investigate SN2 reactions of low exothermicity where the smaller thermodynamic component
of the activation barrier may expose α-nucleophilicity. The reaction efficiencies for the reactions
of several normal nucleophiles [C6H5O¯, HC(O)O¯, CH3C(O)O¯] and alpha-nucleophiles
[HC(O)OO¯, CH3C(O)OO¯] with CH3Cl are added to our previous Brønsted plot of normal and
α-nucleophile reactions with methyl chloride. Further analysis of the methyl chloride data
indicate that variations in intrinsic character are masked at higher exothermicities. Marcus
theory indicates that converging thermodynamic driving forces allow a narrow window for
resolving intrinsic differences in the gas phase. The presence of the α-effect is suggested in the
Energ
y
Attacking (C-O Bond)
Energ
y
Leaving (C-Cl Bond)
Energ
y
Reaction Coordinate (Intrinsic)
ΔG‡intrnisic
Energ
y
ΔGrxn
Reaction Coordinate (w/ Thermodynamics)
ΔG‡activation
Thermodynamic Driving Force
En
erg
y
(C-O Bond)
En
erg
y
(C-Cl Bond)
En
erg
y
Reaction Coordinate (Intrinsic)
ΔG‡intrnisic

90
reactions of some α-nucleophiles with methyl chloride at lower basicities, however the normal
alkoxides with similar proton affinities in these regions are limited and have non-homologous
properties. Variations in the intrinsic Marcus barriers of the normal anion(s) defining “normal”
reactivity will play a key role in the magnitude of the α-effect. Significantly lower electron
affinities are associated with the formation of the α-oxyanions compared to the normal oxyanions
(X + e¯ → X¯) suggesting that the ease of charge transfer between the nucleophile and transition
state is responsible for the lower barriers of the α-nucleophiles.
91
6.1 Introduction
Gas phase kinetic studies have provided an indispensable means to probe the energetics
and intrinsic reactivity of prototypical organic reactions. Recently, there has been renewed
interest in these fundamental processes driven by the need to characterize solvent effects in new
“green” solvents. Significant rate enhancements and control of mechanistic selectivity have been
observed for nucleophiles in ionic liquids.1-3
Related to this work is the attempt to resolve the
origin of the enhanced reactivity of α-nucleophiles. These supernucleophiles have gained
international interest for their potential use in chemical decontamination and environmental
cleanup. The α-effect is well documented in solution; however, differential solvation energies
between normal and α-nucleophiles can dominate as the controlling factor in the overall effect.
Due to this complexity, gas phase studies provide a vital link to resolving the intrinsic nature of
the α-effect and providing insight into solvent effects.
The term α-effect was coined by Pearson and Edwards in 1962 to describe a category of
nucleophiles with a lone pair of electrons adjacent to the attacking atom that display enhanced
reactivity.4 This enhanced reactivity is evaluated relative to the basicity of the anion and is
predicated on rate-energy relationships. The typical magnitude of these rate enhancements in
condensed phase studies is reported at 5 to 100 times faster for α-nucleophiles as compared to
normal nucleophiles, however relative rates as high as 104 have been observed.
4-14 While several
theories (ground-state destabilization, transition-state stabilization, product stabilization, solvent
effects, etc.) have been proposed to explain the origin of the α-effect, no conclusive evidence has
been forwarded which identifies a dominant factor.15
Since static dielectric effects of solvents, as well as transport phenomena, can have
significant influence on ionic reactions conducted in solution, gas phase studies provide a means
of resolving solvent effects from intrinsic reactivity. Bimolecular ion-molecule gas phase

92
reactions are characterized by a classic double-well potential energy surface (PES) model16
where the central barrier reflects a complex interaction of dynamic, energetic, and steric factors
inherent to the reactants. In solution, this barrier is modified by the differential charge
stabilization energy between the delocalized transition state relative to the reactants and products
resulting in a single-barrier PES. These “solvent effects” are evident in the large differences
between reaction rate constants of identical gas and condensed phase reactions,17, 18
in the
reversal of ordering of acidities and basicities in solution versus the gas phase,19, 20
as well as in
the enhanced nucleophilicity of polarizable nucleophiles in solution versus the gas phase.16
Furthermore, experimental investigations probing the magnitude of the α-effect in mixed
solvents reported separate ground-state desolvation and stabilization of transition-state effects,
emphasizing the importance of solvent interactions as a factor in these reactivity trends.13, 21-24
Although originally derived to describe barriers to electron-transfer reactions, Marcus
rate theory has proven effective in separating the thermodynamic component of activation energy
and allowing the "intrinsic" nature of anions to be studied in gas-phase SN2 reactions.25-31
Application of Marcus theory32
to a generic gas-phase SN2 potential energy surface (Fig 6.1)
provides a conceptual understanding of the relationship between kinetics and
thermodynamics.26, 27
Marcus theory (Eq 6.1) allows the central barrier (ΔH‡
activation) to be
viewed primarily as an intrinsic barrier (ΔH‡
intrinsic) modified by an exothermic driving force
(ΔHdriving force = [½ ΔHrxn + (ΔHrxn)2/(16 × ΔH
‡intrinsic)] ).
30, 31
ΔH‡
activation = ΔH‡
intrinsic + ½ ΔHrxn + (ΔHrxn)2/(16 × ΔH
‡intrinsic) (6.1)
Since experimental studies evaluate this activation barrier relative to the energy of separated
reactants, this barrier is often referenced to the reactants (ΔH‡
overall). For an identity reaction in
which the attacking and leaving group are the same (a thermoneutral process), the activation

93
barrier is entirely a function of the intrinsic properties of the reactants. However, for a non-
identity reaction where the attacking and leaving groups are different, there is a thermodynamic
contribution to the activation barrier. For an exothermic reaction (-ΔHrxn), there is a driving
force that lowers the intrinsic barrier, resulting in a smaller overall activation barrier. The
parallels between the free energy of activation and the free energy of reaction allow correlations
to be established between reactivity (kinetics) and basicity (thermodynamics). Based on these
parallels, linear free-energy relationships tend to exist within exothermic reactions for a family of
nucleophiles in which the attacking atom and steric effects remain the same.33-35
Deviations
Figure 6.1. Application of Marcus theory to a generic gas-phase SN2 potential energy
surface depicting a) the “intrinsic” central barrier (ΔH‡
intrinsic) of a thermoneutral identity
reaction compared to b) the lowering of the intrinsic barrier by a thermodynamic driving
force (ΔH‡
driving force) in an exothermic non-identity reaction to produce a modified central
barrier (ΔH‡
activation). This activation barrier is often referenced to the energy of separated
reactants (ΔH‡
overall).
Reaction Coordinate
ΔHrxn = 0
a) X– + RX X–····RX [X····R····X]–‡ RX····X– RX + X–
ΔH‡intrinsic
ΔHrxn
X– + RY X–····RY [X····R····Y]–‡ RX····Y– RX + Y–b)
ΔH‡overall
ΔH‡intrinsic
ΔH‡activation
ΔH‡driving force

94
from linearity in reactivity-basicity correlations can reflect the influence of additional variables
or the manifestation of unique energetics in the transition state. The enhanced reactivity of the α-
nucleophiles is typically evaluated from the deviations in the linearity of Hammett or Brönsted-
type plots, where the log of the reactivity is plotted as a function of enthalpy of reaction.36
Recent high-level computational studies15, 37, 38
by Ren and Yamataka have inferred an
inherent stability of the SN2 transition states for α-nucleophiles relative to normal nucleophiles in
reactions with alkyl chlorides. However, the lack of enhanced reactivity in a series of SN2
reactions of α-nucleophiles with methyl chloride in a gas phase investigation by Villano et al.39
produce conflicting interpretations of the presence of an α-effect in this reaction system. In an
attempt to resolve these discrepancies, we investigate the SN2 processes in reactions of low
exothermicity where the smaller thermodynamic component of the activation barrier may expose
α-nucleophilicity. The reaction efficiencies for the reactions of several normal nucleophiles
[C6H5O¯, HC(O)O¯, CH3C(O)O¯] and alpha-nucleophiles [HC(O)OO¯, CH3C(O)OO¯] with
CH3Cl are added to our previous Brønsted plot of normal and α-nucleophile reactions with
methyl chloride. While the presence of the α-effect is suggested at lower basicities, a rapid drop
in reaction efficiencies below the detection limits of our instrument hinders the ability to define
“normal” reactivity trends. This result is perplexing, since definitive evidence of enhanced
nucleophilicity for HOO¯ relative to the proton affinities of normal alkoxides (HO¯, CH3O¯, and
C2H5O¯) in three separate reaction series (methyl fluoride, anisole, and 4-fluoroanisole) has been
recently reported by our lab.40
A Marcus theory approach to understanding the relationship
between the intrinsic and thermodynamic contributions to the overall activation barrier reveals
factors that influence both experimental and computational studies. Continuing in the Marcus
context, we utilized the computational barriers to evaluate intrinsic differences. An “average”
95
intrinsic barrier is determined by computationally extracting an intrinsic barrier for HO¯,
CH3O¯, C2H5O¯, i-C3H7O¯, and HOO¯ with methyl chloride, methyl fluoride, anisole, and 4-
fluoroanisole at two different levels of theory.
6.2 Experimental
6.2.1 Ion-Molecule Reactions
These reactions were carried out in a flowing afterglow-selected ion flow tube (FA-SIFT)
mass spectrometer, which has been previously described.41
Briefly, this instrument consists of
four sections: an ion source, an ion selection region, a reaction flow tube, and a detection system.
A flowing afterglow ion source is used to produce ions, which are mass-selected using a
quadrupole mass filter prior to injection into the reaction flow tube. Hydroxide was prepared by
electron ionization (70 eV) of methane and nitrous oxide (2:1 ratio). Most other ionic reagents
were generated by proton abstraction of neutrals by HO¯. The peroxyformate, HC(O)OO¯, and
peroxyacetate anions, CH3C(O)OO¯, were synthesized in a gas-phase Baeyer-Villiger reaction of
HOO¯ with methyl formate and methyl acetate as previously described.42, 43
Injected ions are
entrained in a flow of helium (200 std cm3 s
-1, 0.5 torr) and thermalized to 300 ± 2 K prior to
reactions with neutral reagents that are added through multiple inlets along the length of the
reaction flow tube. Ionic reactants and products are analyzed in the detection region using a
triple-quadrupole mass filter and an electron multiplier. The reactions are carried out under
pseudo-first order conditions (reactant ion ~105 ions cm
-3; neutral reactant ~10
11 molecules cm
-3),
and the reported branching ratios and reaction rate coefficients are the averages of at least three
individual measurements. Product branching ratios are determined by extrapolating the observed
product yields to zero reaction distance in order to extract the initial ratios due to primary
reactions. The reported reaction efficiencies are the experimental rate constants divided by the

96
calculated collision rate constants. Collision rate constants were calculated from parameterized
trajectory collision rate theory.44
Error bars represent one standard deviation in the data;
absolute uncertainties in these rate constant measurements are ± 20%. The detection system was
tuned to minimize mass discrimination, and no further corrections were made in the analysis.
6.2.2 Materials
All compounds were obtained from commercial vendors. These compounds include
anisole, C6H5OCH3, Aldrich, 99.7% (anhydrous); 4-fluoroanisole, FC6H4OCH3, Aldrich, 99%;
methyl chloride, CH3Cl, Matheson, 99.5%; methyl fluoride, CH3F, Matheson, 99.99%;
2-propanol, (CH3)2CHOH, Aldrich, 99.9%; ethanol, C2H5OH, Decon Laboratories, 200 proof;
methanol, CH3OH, Aldrich, 99.9%; water, H2O, distilled; methyl formate, HC(O)OCH3,
Sigma-Aldrich, anhydrous, 99%; methyl acetate, CH3C(O)OCH3, Fluka, >99.9%; phenol,
C6H5OH, Sigma-Aldrich, ~99%; formic acid HC(O)OH, Sigma-Aldrich, ≥95%; and acetic acid,
CH3C(O)OH, Sigma-Aldrich, ≥99%. The reagents were protected from light and stored under
vacuum. Helium buffer gas (99.995%) was purified by passage through a molecular sieve trap
immersed in liquid nitrogen.
6.2.3 Computational Methods
Ab initio molecular orbital calculations were carried out with the G3MP2 method using
the Gaussian 09 suite of programs.45
Frequency calculations were conducted for all species to
establish their nature as local minima or transition states. Enthalpy changes were calculated
from the energies of the optimized structures, and thermal corrections included for 298 K
without scaling of the calculated vibrational frequencies.
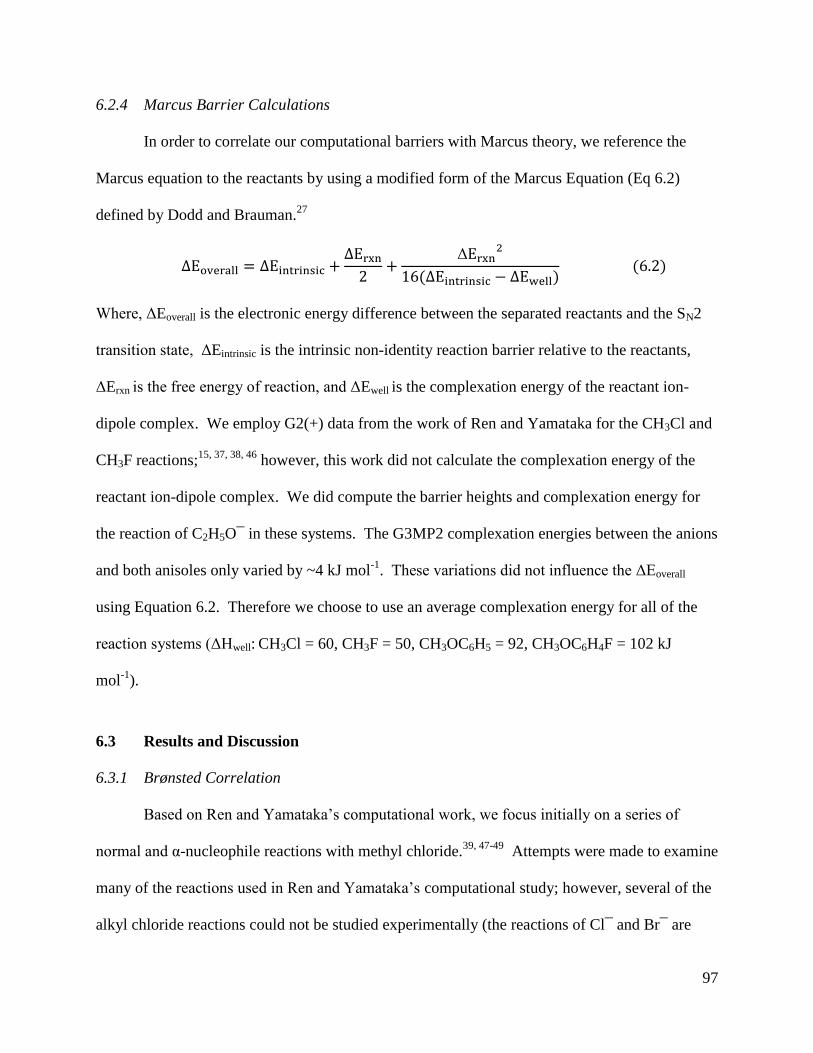
97
6.2.4 Marcus Barrier Calculations
In order to correlate our computational barriers with Marcus theory, we reference the
Marcus equation to the reactants by using a modified form of the Marcus Equation (Eq 6.2)
defined by Dodd and Brauman.27
Δ
Where, ΔEoverall is the electronic energy difference between the separated reactants and the SN2
transition state, ΔEintrinsic is the intrinsic non-identity reaction barrier relative to the reactants,
ΔErxn is the free energy of reaction, and ΔEwell is the complexation energy of the reactant ion-
dipole complex. We employ G2(+) data from the work of Ren and Yamataka for the CH3Cl and
CH3F reactions;15, 37, 38, 46
however, this work did not calculate the complexation energy of the
reactant ion-dipole complex. We did compute the barrier heights and complexation energy for
the reaction of C2H5O¯ in these systems. The G3MP2 complexation energies between the anions
and both anisoles only varied by ~4 kJ mol-1
. These variations did not influence the ΔEoverall
using Equation 6.2. Therefore we choose to use an average complexation energy for all of the
reaction systems (ΔHwell: CH3Cl = 60, CH3F = 50, CH3OC6H5 = 92, CH3OC6H4F = 102 kJ
mol-1
).
6.3 Results and Discussion
6.3.1 Brønsted Correlation
Based on Ren and Yamataka’s computational work, we focus initially on a series of
normal and α-nucleophile reactions with methyl chloride.39, 47-49
Attempts were made to examine
many of the reactions used in Ren and Yamataka’s computational study; however, several of the
alkyl chloride reactions could not be studied experimentally (the reactions of Cl¯ and Br¯ are

98
below the detection limits of our instrument; HSO¯, FO¯, and ClCH2CH2O¯ could not be
generated in measureable abundances). Since methyl chloride does not contain β-hydrogens, this
reaction is assumed to proceed through a typical SN2 process. The experimental data for these
reactions are shown in terms of a Brønsted-type plot in Figure 6.2 where the y-axis is the
logarithm of the reaction efficiency and the x-axis is the gas phase proton affinity of the anion.
Blue represents the normal oxyanions and red the oxygen alpha nucleophiles.
In Figure 6.2, we note that in general the reactivity follows basicity trends; however, the
plot flattens at the higher basicities as the reaction efficiency approaches the collision rate. At
Figure 6.2. Brønsted-type plot where y-axis is the logarithm of the reaction efficiency
(krxn/kcol) and the x-axis is the gas phase proton affinity of the anion (ΔH298) for the SN2
reaction of Nu¯ with CH3Cl. Experimental data at 300 ± 2 K from this work (anions 14-18)
and references 39, 48, and 49 updated using parameterized trajectory theory (ref 44) to
calculate kcol. (■ normal oxyanions, α-oxyanions): 1. HO¯ 2. CH3O¯ 3. C2H5O¯
4. i-C3H7O¯ 5. HOO¯ 6. t-C4H9O¯ 7. CFH2CH2O¯ 8. CF2HCH2O¯ 9. CF3CH2O¯
10. CH3SO¯ 11. ClO¯ 12. CF3CF2CH2O¯ 13. BrO¯ 14. HC(O)OO¯ 15. C6H5O¯
16. HC(O)O¯ 17. CH3C(O)O¯ 18. CH3C(O)OO¯
0.001
0.01
0.1
1600155015001450
Rea
ctio
n E
ffic
ien
cy
(krx
n/k
col)
Anion Proton Affinity (kJ mol-1)
7
23
4
56
8
12
9
1
1110
13
16*
14
15*17*18* *Upper limit (krxn/kcol < 0.0005)
99
the lower basicities there is a rapid drop in reaction efficiency. This result is attributed to the
diminishing thermodynamic driving force contributions to the overall activation barrier. The rate
constant for HC(O)OO¯ is 1.77 ± 0.05 x 10⁻¹¹
cm3 s
-1. The changes in ion signal intensities were
too low to measure an accurate rate constant for C6H5O¯, HC(O)O¯, CH3C(O)O¯, and
CH3C(O)OO¯ (hence an upper limit of 1 x 10-12
cm3 s
-1). The overall trends in Figure 6.2 do not
show any significant deviations between the α-anions and the normal anions. Small shifts may
hint that the α-anions are more reactive than normal anions at lower basicities (11, 13 and 14
versus 12 and 15). ClO¯ and BrO¯ are slightly more efficient than CF3CF2CH2O¯ and
HC(O)OO¯ is more efficient than C6H5O¯. However, the homologous properties and intrinsic
barriers of the phenoxide ion deviate from other straight-chain alkoxides and fluoroalkoxides,25
making the definition of “normal” reactivity more difficult. Despite this ambiguity, the presence
of an α-effect is suggested in the reactions of other α-nucleophiles.
6.3.2 Marcus Theory (Variations in Intrinsic Nature of Anions)
Limitations associated with employing a reactivity-basicity relationship to evaluate
intrinsic nucleophilicity are revealed within the context of the Marcus model. The intrinsic
barriers (no thermodynamic driving force) for identity or exchange reactions (X¯ + CH3X)
provide a direct measure of inherent nucleophilicity. Pellerite and Brauman found the intrinsic
barriers for gas-phase SN2 identity reactions correlate with methyl cation affinities (MCA),
where MCA(X¯) for CH3X → CH3+ + X¯ is defined by Equation 6.3.
29
ΔH‡
intrinsic ∝ MCA(X¯) = ΔH° = D°(CH3-X) - EA(X•) + IE(CH3) (6.3)
In this equation, D° is the homolytic dissociation energy of the CH3-X bond, EA(X•) is the
electron affinity of the X radical, and IE(CH3) is the methyl radical ionization energy. Based on
this relationship, intrinsic barriers are larger for nucleophiles with strong bonds to carbon and

100
with low electron affinities. Expanding on this relationship, Streitwieser highlighted that
differences in the strengths in carbon bonds versus hydrogen bonds for different classes of
compounds can lead to large deviations in correlations between nucleophilicity and basicity.
Therefore, any Brønsted-type correlations between basicity and nucleophilicity to resolve
intrinsic reactivity must employ related groups of bases where the reacting atom is the same.
Ren and Yamataka use an SN2 reaction barrier height-basicity relationship to estimate a
17.1 kJ mol-1
α-effect for HOO¯ relative to a Brønsted correlation of normal nucleophiles with
CH3Cl.38
However, this correlation was defined with a wide class of nucleophiles. If the normal
anion Brønsted correlation is defined for only CH3O¯ and HO¯, the size of the α-effect for
HOO¯ drops to 9.8 kJ mol-1. This suggests that the magnitude of the α-effect may be smaller
than originally predicted and that the intrinsic differences in anions may be small or masked.
6.3.3 Marcus Theory (Convergence of Overall Activation Barriers)
It is instructive to use Marcus theory to take a more in-depth look at the magnitude of
intrinsic barriers and their contribution to the overall activation barriers. While minor variations
in intrinsic nucleophilicity exist for a given nucleophile (depending on the method employed to
calculate the identity exchange reaction barrier), general trends in the energetics indicate that
typical differences in intrinsic barriers within a homologous class of nucleophiles are small (< 10
kJ mol-1
).25, 50
Computational and experimental studies31, 51, 52
have shown that the additive
postulate of these intrinsic barriers utilized in determining the non-identity intrinsic barrier has
excellent predictive power to determine overall activation barriers. The intrinsic barrier for a
non-identity reaction is the average of the intrinsic exchange barriers for the reactant ion and
product ion, ΔH‡
intrinsic(X,Y) = [(ΔH‡
intrinsic(X,X) + ΔH‡
intrinsic(Y,Y))/2]. As a result, the intrinsic
reactivity differences between a series of anions with a given substrate are halved.
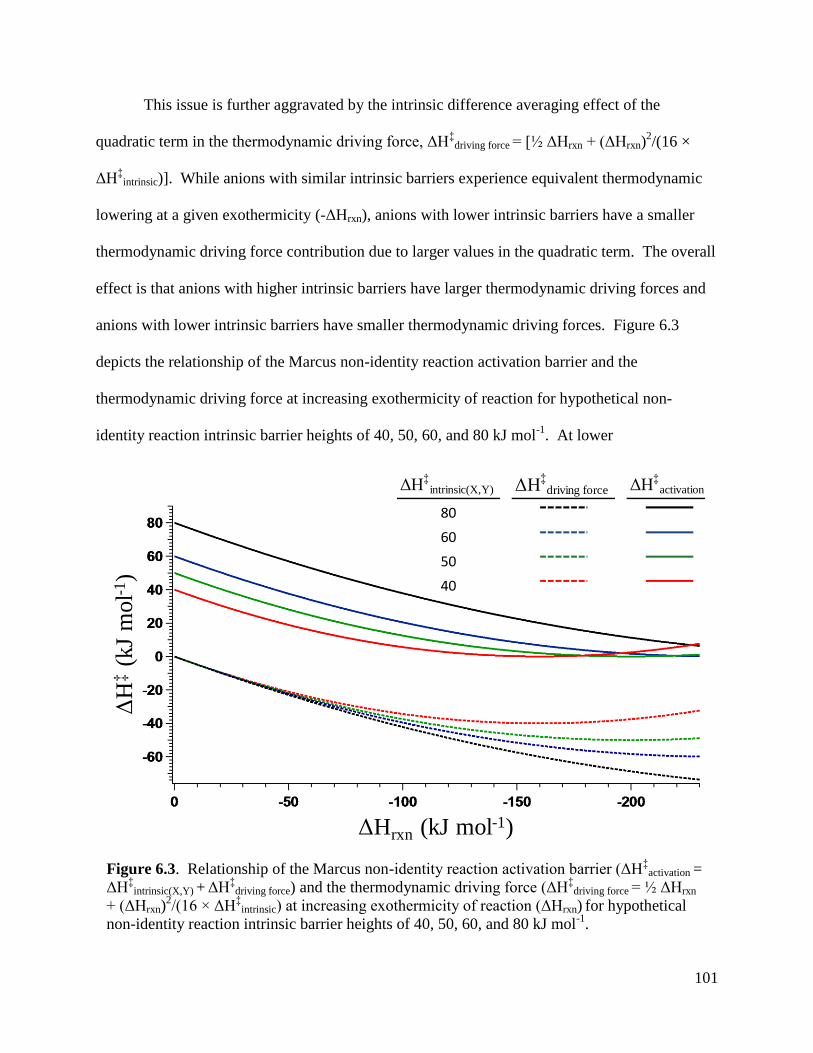
101
This issue is further aggravated by the intrinsic difference averaging effect of the
quadratic term in the thermodynamic driving force, ΔH‡
driving force = [½ ΔHrxn + (ΔHrxn)2/(16 ×
ΔH‡
intrinsic)]. While anions with similar intrinsic barriers experience equivalent thermodynamic
lowering at a given exothermicity (-ΔHrxn), anions with lower intrinsic barriers have a smaller
thermodynamic driving force contribution due to larger values in the quadratic term. The overall
effect is that anions with higher intrinsic barriers have larger thermodynamic driving forces and
anions with lower intrinsic barriers have smaller thermodynamic driving forces. Figure 6.3
depicts the relationship of the Marcus non-identity reaction activation barrier and the
thermodynamic driving force at increasing exothermicity of reaction for hypothetical non-
identity reaction intrinsic barrier heights of 40, 50, 60, and 80 kJ mol-1
. At lower
Figure 6.3. Relationship of the Marcus non-identity reaction activation barrier (ΔH‡
activation =
ΔH‡
intrinsic(X,Y) + ΔH‡
driving force) and the thermodynamic driving force (ΔH‡
driving force = ½ ΔHrxn
+ (ΔHrxn)2/(16 × ΔH
‡intrinsic) at increasing exothermicity of reaction (ΔHrxn) for hypothetical
non-identity reaction intrinsic barrier heights of 40, 50, 60, and 80 kJ mol-1
.
ΔH‡
(kJ
mol-1
)
ΔHrxn (kJ mol-1)
ΔH‡
intrinsic(X,Y) ΔH‡
driving force ΔH‡
activation
80
60
50
40

102
exothermicities, thermodynamic driving forces correlate almost directly to the exothermicity of
reaction and the relative differences in intrinsic barriers are maintained in the overall activation
barrier. As the exothermicity of reaction increases, the relative contributions from the
thermodynamic driving force for the reactions with smaller intrinsic barriers diminish and the
overall activation barriers begin to converge masking the differences in intrinsic barriers. The
rate of convergence is delayed in reactions with higher intrinsic barriers due to the steeper
curvature of the free-energy surfaces for the reactant and/or product states. Good nucleophiles
(poor leaving groups) have low intrinsic barriers and converge quickly. Poor nucleophiles (good
leaving groups) have large intrinsic barriers and maintain intrinsic differences over a wider range
of exothermicities. With respect to this relationship, it is interesting to note that the magnitude of
the α-effect for nucleophilic cleavage of esters in solution is marginal with poor leaving groups
and increases with leaving group ability.53
Hypothetically, the Marcus inversion region (Figure 6.3: ΔH‡
intrinsic(X,Y) = 40 kJ mol-1
at
ΔHrxn > -150 kJ mol-1
) could be reached in extremely exothermic reactions with low barriers;
however, under these conditions reactions in the gas phase are controlled by the collision rate
and this aspect cannot be experimentally probed. At the lower end of the exothermicity scale,
without a sufficiently high thermodynamic driving force to overcome endothermic intrinsic
barriers (ΔH‡
driving force > ΔH‡
intrinsic(X,Y)), the reaction rates are below the detection limits of our
instrument (~1 x 10-13
cm3 s
-1). In summary, there is a narrow window in the gas phase for
which small variations in intrinsic reactivity can be effectively evaluated.
6.3.4 Overall and Intrinsic Barriers
Ultimately we are interested in the true intrinsic nature of the α-effect; therefore, we
utilized the computational barriers to evaluate intrinsic differences for HO¯, CH3O¯, C2H5O¯,
103
i-C3H7O¯, and HOO¯ with methyl chloride, methyl fluoride, anisole, and 4-fluoroanisole. Since
the G2(+) method has been employed in several computational studies15, 37, 38
on the α-effect in
methyl chloride and methyl fluoride systems, we made use of these barriers for comparison with
our experimental data. However, in the larger anisole systems we chose to employ the G3MP2
method, which is still a high level of theory but less expensive computationally. Table 6.1 lists
the anion proton affinities (PA), exothermicities of reaction (ΔHrxn), reaction efficiencies (Eff),
relative α-effects (EffHOO¯/EffX¯), overall activation barrier (ΔH‡
overall), Marcus barriers [intrinsic
barriers (ΔH‡
(X,X), ΔH‡
(Y,Y), and ΔH‡
(X,Y)), the thermodynamic driving force (ΔH‡
driving force), and
activation barriers (ΔH‡
overall)] for the SN2 reactions. The ∆Hrxn was determined from
experimental heats of formation.54
The Marcus intrinsic barrier for the anions in each reaction,
ΔH‡
(X,X), was extracted by matching the Marcus ΔH‡
overall to the G2(+)/G3MP2 ΔH‡
overall (full
description of the method is given in the experimental section). Our use of Marcus barriers is an
inverse variation of the method typically employed. Many studies use identity reactions to
estimate an overall intrinsic barrier, then apply thermodynamic driving forces to generate an
overall activation barrier. Computational barriers are very sensitive to the level of theory
employed and any system limitations could be compounded in an identity reaction. We attempt
to average out these errors by extracting intrinsic barriers for the anions from the computational
overall activation barriers of three different systems and two different levels of theories.
We immediately note that there is a lack of correlation between the computational barrier
heights in the methyl chloride reactions and our experimental data. While Marcus theory
predicts intrinsic differences to converge in highly exothermic reactions, the similarities in

Table 6.1. The α-effect and Intrinsic Reactivity for the SN2 Reactions of HO¯, CH3O¯, C2H5O¯, and HOO¯ with Methyl Chloride,
Methyl Fluoride, Anisole and 4-Fluoroanisole (energies in units of kJ mol-1
)
aProton affinities (PA), H
+ + X¯ → HX in kJ mol
-1: HO¯ (1633)
54, CH3O¯ (1598±2)
58, C2H5O¯ (1585±3)
58, HOO¯ (1575±2).
55
bExothermicity of reaction
(ΔHrxn) calculated using heats of formation from ref 54; ΔHrxn for 4-fluoroanisole reactions estimated from anisole reactions based on proton affinity difference
(12 kJ mol-1
). cRelative α-effect using a ratio of SN2 reaction efficiencies (EffHOO¯/EffX¯) .
dG2(+) method: methyl chloride/fluoride ref 15, 36-38 (C2H5O¯ this
work); G3MP2 method: anisoles. eMarcus barriers: non-identity reaction intrinsic barrier, ΔH
‡(X,Y) = [(ΔH
‡(X,X) + ΔH
‡intrinsic(Y,Y))/2]; thermodynamic driving force
[ΔH‡
driving force = ½ ΔHrxn + (ΔHrxn)2/(16 × (ΔH
‡intrinsic(X,Y)+ ΔHwell)] where ΔHwell (CH3Cl = 60, CH3F = 50, CH3OC6H5 = 92, CH3OC6H4F = 102 kJ mol
-1);
activation barrier, ΔH‡
overall = (ΔH‡
intrinsic(X,Y) + ΔH‡
driving force); Marcus barriers for CH3Cl unreliable due to dominance of thermodynamic contributions (see
discussion). fNo SN2 products;100% proton transfer.
α-effectc
G2(+)/G3MP2d
Reaction (X ‾ + M) PA(X ‾ )a ΔHrxn
b SN2 Eff ΔH‡
overall ΔH‡
(X,X) ΔH‡
(Y,Y) ΔH‡
(X,Y) ΔH‡
driving force ΔH‡
overall
HO‾ + CH3Cl 1633 -210 0.67 0.76 -55.5 10.5 9.8 10.2 -65.7 -55.5
CH3O‾ + CH3Cl 1598 -189 0.59 0.86 -50.6 17.0 9.8 13.4 -64.0 -50.6
C2H5O‾ + CH3Cl 1585 -179 0.59 0.86 -43.4 33.7 9.8 21.8 -65.0 -43.3
HOO‾ + CH3Cl 1575 -184 0.51 -56.6 -9.5 9.8 0.2 -56.8 -56.6
HO‾ + CH3F 1633 -91 0.0042 0.62 -15.6 56.7 -11.0 22.9 -38.5 -15.6
CH3O‾ + CH3F 1598 -70 0.0007 3.7 -14.1 43.6 -11.0 16.3 -30.4 -14.1
C2H5O‾ + CH3F 1585 -60 <0.00005 >50 -5.2 52.9 -11.0 21.0 -27.0 -6.0
HOO‾ + CH3F 1575 -65 0.0026 -19.4 28.1 -11.0 8.6 -28.0 -19.4
HO‾ + CH3OC6H5 1633 -162 0.13 0.69 -28.6 40.5 39.2 39.9 -68.4 -28.6
CH3O‾ + CH3OC6H5 1598 -141 0.04 2.3 -21.6 39.4 39.2 39.3 -60.9 -21.6
C2H5O‾ + CH3OC6H5 1585 -131 0.01 9.0 -11.2 53.8 39.2 46.5 -57.7 -11.2
HOO‾ + CH3OC6H5 1575 -135 0.09 -25.6 26.7 39.2 33.0 -58.6 -25.6
HO‾ + CH3OC6H4F 1633 -174 ---f --- -36.6 38.1 35.2 36.7 -73.2 -36.6
CH3O‾ + CH3OC6H4F 1598 -153 0.10 2.3 -29.6 37.2 35.2 36.2 -65.8 -29.6
C2H5O‾ + CH3OC6H4F 1585 -143 0.02 12 -19.2 51.8 35.2 43.5 -62.7 -19.2
HOO‾ + CH3OC6H4F 1575 -147 0.23 -33.9 23.8 35.2 29.5 -63.4 -33.9
Marcus Barrierse
(relative to reactants)Kinetic Datab α-effect
Reaction (X ‾ + M) PA (X ‾ ) ΔHrxn kexpt (x10-10
) SN2 PT Assocation
HO‾ + CH3F 1633 -91 0.120 ± 0.021 100% (0.0042) --- --- 0.62
CH3O‾ + CH3F 1598 ± 2 -70 0.017 ± 0.001 100% (0.0007) --- --- 3.7
C2H5O‾ + CH3F 1585 ± 3 -60 < 0.001 <0.00005 --- --- >50
HOO‾ + CH3F 1575 ± 4 -65 0.060 ± 0.002 100% (0.0026) --- ---
HO‾ + anisole 1633 -162 13.1 ± 0.2 28% (0.13) 51% 20% 0.69
CH3O‾ + anisole 1598 ± 2 -141 2.74 ± 0.01 32% (0.04) --- 68% 2.3
C2H5O‾ + anisole 1585 ± 3 -131 1.38 ± 0.10 10% (0.01) --- 90% 9.0
HOO‾ + anisole 1575 ± 4 -135 3.49 ± 0.05 54% (0.09) --- 46%
i -C3H7O‾ + anisole 1576 ± 3 -121 --- --- --- 100%
HO‾ + 4-fluoroanisole 1633 -174 23.0 ± 0.6 --- 100% ---
CH3O‾ + 4-fluoroanisole 1598 ± 2 -153 10.7 ± 0.4 32% (0.10) 10% 58% 2.3
C2H5O‾ + 4-fluoroanisole 1585 ± 3 -143 6.88 ± 0.21 9% (0.02) --- 91% 12
HOO‾ + 4-fluoroanisole 1575 ± 4 -147 10.4 ± 0.5 70% (0.23) --- 30%
i -C3H7O‾ + 4-fluoroanisole 1576 ± 3 -133 --- --- --- 100%
Thermodynamic Dataa
Branching Fraction (Eff)c
104

105
reaction efficiencies and the lack of an α-effect in methyl chloride is more likely a characteristic
of gas phase reactions with low activation barriers. DePuy et al. concluded that extremely
exothermic gas phase SN2 reactions have low central barriers that have little influence on
reaction rates.48
In these cases, the probability of reaction is dominated by the volume in phase
space that leads to products compared to the total volume, and reaction rate constants are not
sensitive to small changes in barrier heights. This lack of sensitivity is reflected by the reactions
of CH3O¯ and C2H5O¯ with methyl chloride, which have indistinguishable reaction efficiencies.
While the Marcus theory method of determining barriers has proven to give excellent correlation
with experimental and computational barriers, this relationship begins to breakdown in highly
exothermic reactions with low barriers (ΔHrxn ≫ ΔH‡
intrinsic).51
Clearly there is a breakdown in
the Marcus barriers for the methyl chloride reactions due to the overwhelming thermodynamic
contributions; the intrinsic barriers are only listed to highlight this dominance.
The other computational barriers (ΔH‡
overall for both methods) compare well with our
experimental efficiencies. While the methyl chloride series of reaction barriers and efficiencies
are mostly a reflection of the exothermicity of reaction, the barrier heights for the methyl fluoride
series lie close to the entrance channel resulting in high sensitivity of reaction efficiency relative
to small changes in barrier heights. The similarities of exothermicity and structure for anisole
and 4-fluoroanisole are reflected in a consistency of relative differences in barrier heights and
efficiencies in both series (i.e., CH3O¯ vs HOO¯: Δ∆H‡
~4 kJ = 2 x Eff and C2H5O¯ vs HOO¯:
Δ∆H‡
~14.5 kJ = 10 x Eff). While the relative differences in the G2(+) results have similar
trends with the G3MP2 values, the relative differences in barrier heights and efficiencies for
HO¯ and HOO¯ are at odds in the methyl fluoride system. Based on trends in all of the systems,
it appears that the G2(+) HO¯ barrier is about 5 kJ mol-1
higher than would be expected to match
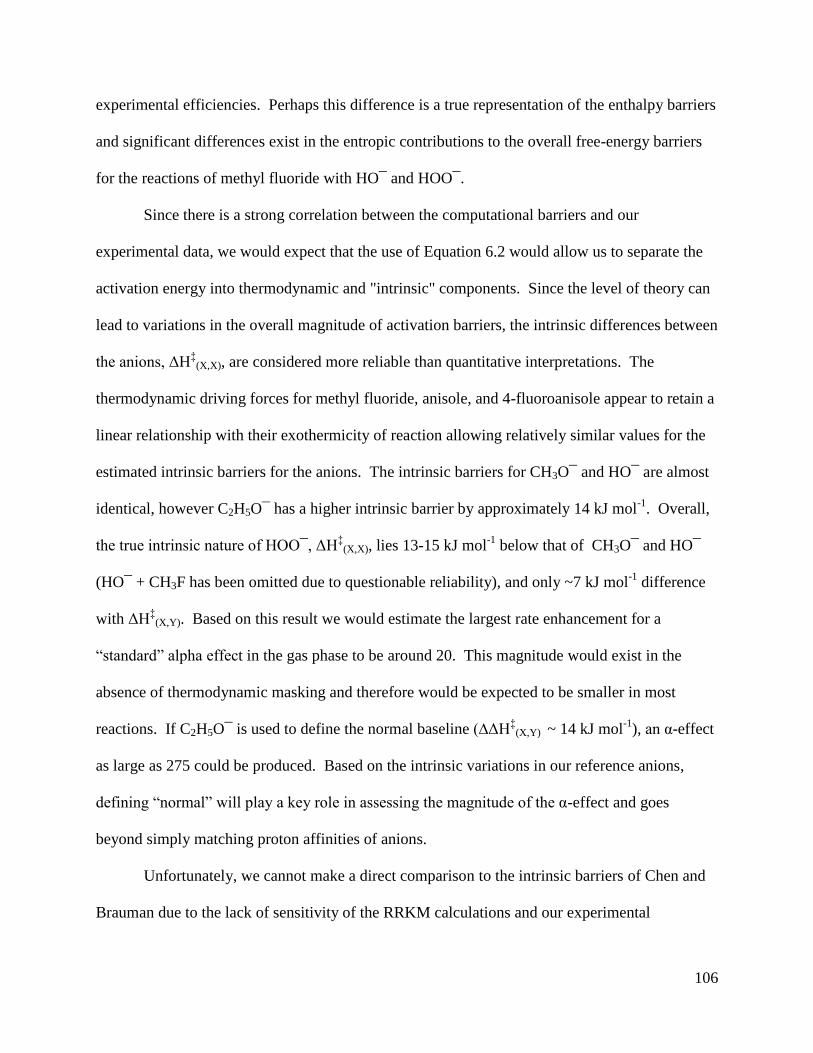
106
experimental efficiencies. Perhaps this difference is a true representation of the enthalpy barriers
and significant differences exist in the entropic contributions to the overall free-energy barriers
for the reactions of methyl fluoride with HO¯ and HOO¯.
Since there is a strong correlation between the computational barriers and our
experimental data, we would expect that the use of Equation 6.2 would allow us to separate the
activation energy into thermodynamic and "intrinsic" components. Since the level of theory can
lead to variations in the overall magnitude of activation barriers, the intrinsic differences between
the anions, ΔH‡
(X,X), are considered more reliable than quantitative interpretations. The
thermodynamic driving forces for methyl fluoride, anisole, and 4-fluoroanisole appear to retain a
linear relationship with their exothermicity of reaction allowing relatively similar values for the
estimated intrinsic barriers for the anions. The intrinsic barriers for CH3O¯ and HO¯ are almost
identical, however C2H5O¯ has a higher intrinsic barrier by approximately 14 kJ mol-1
. Overall,
the true intrinsic nature of HOO¯, ΔH‡
(X,X), lies 13-15 kJ mol-1
below that of CH3O¯ and HO¯
(HO¯ + CH3F has been omitted due to questionable reliability), and only ~7 kJ mol-1
difference
with ΔH‡
(X,Y). Based on this result we would estimate the largest rate enhancement for a
“standard” alpha effect in the gas phase to be around 20. This magnitude would exist in the
absence of thermodynamic masking and therefore would be expected to be smaller in most
reactions. If C2H5O¯ is used to define the normal baseline (∆ΔH‡
(X,Y) ~ 14 kJ mol-1
), an α-effect
as large as 275 could be produced. Based on the intrinsic variations in our reference anions,
defining “normal” will play a key role in assessing the magnitude of the α-effect and goes
beyond simply matching proton affinities of anions.
Unfortunately, we cannot make a direct comparison to the intrinsic barriers of Chen and
Brauman due to the lack of sensitivity of the RRKM calculations and our experimental
107
measurements in the highly exothermic CH3Cl reactions. Still it is informative to apply their
interpretation of some factors causing variations in intrinsic reactivity to our work. While Chen
and Brauman rationalize higher barriers in some of their nucleophiles as a consequence of a
concentrated charge in the nucleophile and a delocalized charge in the transition state, an
opposite argument could be made for lower barriers in the peroxide anion.25
The unique nature
of HOO¯ (two equally electronegative atoms adjacent in the attacking group with lone pair
electrons) delocalizes charge to stabilize the anion and at the same time localizes the charge near
the bond forming in the transition state. The similarities of charge distribution between the
nucleophile and transition state lead to significantly lower barriers compared to normal
nucleophiles. Furthermore, unlike normal nucleophiles, this minor shift in charge distribution
would result in a more consistent transition in both thermodynamic and “kinetic” reactivity from
a protic to a polar aprotic solvent based on the polar group and hydroxyl substitution model of
Chen and Brauman.25
6.3.5 Molecular Electron Affinity (Ease of Electron Transfer for the Nucleophile to TS)
It is important to note that there is approximately a 10 kJ mol-1
shift between the relative
gas phase proton affinity (PA) and the exothermicity of reactions (∆Hrxn) for HOO¯ (see Table
6.1). This inversion would suggest that there is a larger disparity between proton affinities and
methyl cation affinities for the peroxide, than for the normal alkoxides. One of the key
parameters which influences both proton affinities and methyl cation affinities is the molecular
electron affinities (X + e¯ → X¯). Upon inspection, there is a significant difference in electron
affinity for the formation of the normal anions HO¯ (1.83 eV), CH3O¯ (1.57 eV), C2H5O¯ (1.71
eV), and i-C3H7O¯ (1.85 eV) relative to the formation of HOO¯ (1.08 eV).55
Intriguingly, this
lower electron affinity relative to gas phase anion basicity holds for other peroxy α-nucleophiles

108
CH3OO¯ (1.16 eV), C2H5OO¯ (1.19 eV), (CH3)3COO¯ (1.20 eV), and C6H5OO¯ (1.06 eV)
versus t-C4H9O¯ (1.91 eV), FCH2CH2O¯ (2.22 eV), and C6H5O¯ (2.25 eV).55
Perhaps the
significantly lower electron affinity influences the intrinsic reactivity of the α-nucleophiles. This
can be understood in terms of the ease of transferring an electron from the attacking group to the
leaving group (X¯ → TS¯). As the electron binding energy of the attacking anion increases,
more energy is required in the transition state to transfer the charge to the leaving group. A more
rigorous assessment of this factor in SN2 transition state stabilization can be found in several
recent articles by Hoz,56
Fountain,7 and Sauers
57 on ionization energies and single electron
transfer (SET) character.
6.3.6 Variations in Solvent Effects
An interesting observation is the huge shift in vertical detachment energies (VDE)
reported for HO¯ when transitioning to solution (ΔVDEgas phase = 10.8 eV versus ΔVDEaqueous =
0.7 eV).57
With such a large solvent effect on ionization energy, we were curious to determine if
there were any trends in properties based on electron affinities for the gas phase versus the
condensed phase data. Figure 6.4 depicts our assessment of proton affinity in the gas phase
versus the pKa of the same anion in water. There is undoubtedly a differential solvation energy
between normal nucleophiles and α-nucleophiles from their associated proton affinities in the gas
phase. Although there is some scatter in the relationships, the aqueous normal anions are about
three orders of magnitude more basic than the aqueous α-nucleophiles. Since we would expect
the delocalized α-nucleophiles to be less solvated than normal nucleophiles, the higher acidity of
the α-nucleophiles indicates weaker bonds to hydrogen than the normal nucleophiles. This
interpretation is supported by the finding that oximate α-nucleophiles are less solvated than
109
normal phenoxide nucleophiles in H2O by about 16 kJ mol-1 (a ground state solvation α-effect of
750).13
6.4 Conclusion
Our investigation of the α-effect in gas phase SN2 reactions provides insight into the
intrinsic reactivity of α-nucleophiles and solvent effects on nucleophilicity. Our results are fully
consistent with the current framework of computational and condensed phase studies of the
α-effect. Our analysis of reactivity trends, acidity/basicity in the gas phase versus solution, and
computational barriers has led to the following findings.
(1) Masking of intrinsic differences in the gas phase. The overall trends in the magnitude of
the α-effect in the gas phase are consistent with Marcus theory. Variations in intrinsic
Figure 6.4. Differential solvation effects relative to gas-phase proton affinities (aqueous
pKa versus gas phase proton affinity) between normal nucleophiles (■) and α-nucleophiles
(●). 1. HO¯ 2. CH3O¯ 3. C2H5O¯ 4. i-C3H7O¯ 5. HOO¯ 6. CH3OO¯ 7. t-C4H9O¯
8. CFH2CH2O¯ 9. t-C4H9OO¯ 10. C6H5CH2O¯ 11. CF2HCH2O¯ 12.CF3CH2O¯ 13. ClO¯
14. CF3CF2CH2O¯ 15. BrO¯ 16. HC(O)OO¯ 17. C6H5O¯
7
8
9
10
1600155015001450
7
2
34
56
8
14
9
1
13
1615
12
10
11
17pK
a(H
2O
)
Gas-Phase Proton Affinity (kJ mol-1)
pK
a(H
2O
)
Gas-Phase Proton Affinity (kJ mol-1)
110
character can be easily masked at higher exothermicities of reaction due to a convergence
of overall activation barriers and the lack of sensitivity of the reactant ion-dipole complex
to small central barriers. At lower exothermicities, the limit of detection restricts the
range in which small intrinsic differences can be resolved.
(2) Intrinsic Marcus Barriers. The reference anion(s) defining “normal” reactivity will play
a key role in assessing the magnitude of the α-effect. Variations in the intrinsic barriers
of the normal anions (~14 kJ) could produce a range of rate enhancements from 20 to 275
for HOO¯ in a comparison of purely intrinsic reactions. Experimentally, we would
expect the magnitude of the α-effect to be smaller and more consistent as thermodynamic
contributions will mask intrinsic differences and cause overall barriers to converge.
(3) Lower Molecular Electron Affinity for the α-nucleophiles. Significantly lower electron
affinities (~0.6 eV) are associated with the formation of the α-oxyanions compared to the
normal oxyanions (X + e¯ → X¯). Nucleophilicity is often correlated with electron
affinity and bond-strength effects. The ease of charge transfer between the nucleophile
and transition state is a key concept in explaining barrier heights. The lower barriers for
the α-nucleophiles can be rationalized by a localized “softness” in the anion leading to
similarities of charge distribution between the nucleophile and transition state when
compared to the localized charge distribution of normal nucleophiles.
(4) Differential Solvation Effects for the α-Nucleophiles. Significant differences in aqueous
solvation energies (ΔpKa ~3) between normal nucleophiles and α-nucleophiles from their
associated proton affinities in the gas phase suggests differential solvation plays a
dominant role in the magnitude of the α-effect in solution.
111
6.5 References
1. Kim, D. W.; Ahn, D.-S.; Oh, Y.-H.; Lee, S.; Kil, H. S.; Oh, S. J.; Lee, S. J.; Kim, J. S.;
Ryu, J. S.; Moon, D. H.; Chi, D. Y. J. Am. Chem. Soc. 2006, 128, 16394-16397.
2. Kim, D. W.; Song, C. E.; Chi, D. Y. J. Org. Chem. 2003, 68, 4281-4285.
3. Kim, D. W.; Song, C. E.; Chi, D. Y. J. Am. Chem. Soc. 2002, 124, 10278-10279.
4. Edwards, J. O.; Pearson, R. G. J. Am. Chem. Soc. 1962, 84, 16-24.
5. Fountain, K. R.; Felkerson, C. J.; Driskell, J. D.; Lamp, B. D. J. Org. Chem. 2003, 68,
1810-1814.
6. Fountain, K. R.; Tad-y, D. B.; Paul, T. W.; Golynskiy, M. V. J. Org. Chem. 1999, 64,
6547-6553.
7. Fountain, K. R. J. Phys. Org. Chem. 2005, 18, 481-485.
8. Dixon, J. E.; Bruice, T. C. J. Am. Chem. Soc. 1972, 94, 2052-2056.
9. Dixon, J. E.; Bruice, T. C. J. Am. Chem. Soc. 1971, 93, 6592-6597.
10. Gregory, M. J.; Bruice, T. C. J. Am. Chem. Soc. 1967, 89, 4400-4402.
11. Gregory, M. J.; Bruice, T. C. J. Am. Chem. Soc. 1967, 89, 2327-2330.
12. Pratt, R. F.; Bruice, T. C. J. Org. Chem. 1972, 37, 3563-3564.
13. Buncel, E.; Um, I. H. Tetrahedron 2004, 60, 7801-7825.
14. Kirby, A. J.; Manfredi, A. M.; Souza, B. S.; Medeiros, M.; Priebe, J. P.; Brandao, T. A.
S.; Nome, F. Arkivoc 2009, 3, 28-38.
15. Ren, Y.; Yamataka, H. J. Org. Chem. 2007, 72, 5660-5667.
16. Olmstead, W. N.; Brauman, J. I. J. Am. Chem. Soc. 1977, 99, 4219-4228.
17. Bohme, D. K.; Rakshit, A. B.; Mackay, G. I., J. Am. Chem. Soc. 1982, 104, 1100-1101.
18. Bohme, D. K.; Mackay, G. I. J. Am. Chem. Soc. 1981, 103, 978-979.
19. Brauman, J. I.; Blair, L. K. J. Am. Chem. Soc. 1970, 92, 5986-5992.
20. Taft, R. W. Prog. Phys. Org. Chem. 1983, 14, 247-350.
21. Um, I. H.; Han, J. Y.; Buncel, E. Chem.–Eur. J. 2009, 15, 1011-1017.
22. Um, I. H.; Buncel, E. J. Org. Chem. 1999, 65, 577-582.
23. Um, I. H.; Hwang, S.-J.; Buncel, E. J. Org. Chem. 2006, 71, 915-920.
24. Kim, M. S.; Min, S. W.; Seo, J. A.; Um, I. H. Bull. Korean Chem. Soc. 2009, 30, 2913-
2917.
25. Chen, X.; Brauman, J. I. J. Am. Chem. Soc. 2008, 130, 15038-15046.
26. Dodd, J. A.; Brauman, J. I. J. Am. Chem. Soc. 1984, 106, 5356-5357.
27. Dodd, J. A.; Brauman, J. I. J. Phys. Chem. 1986, 90, 3559-3562.
28. Pellerite, M. J.; Brauman, J. I. J. Am. Chem. Soc. 1980, 102, 5993-5999.
29. Pellerite, M. J.; Brauman, J. I. J. Am. Chem. Soc. 1983, 105, 2672-2680.
30. Laerdahl, J. K.; Uggerud, E. Int. J. Mass Spectrom. 2002, 214, 277-314.
31. Wladkowski, B. D.; Brauman, J. I. J. Phys. Chem. 1993, 97, 13158-13164.
32. Marcus, R. A. J. Phys. Chem. 1968, 72, 891-899.
33. Bordwell, F. G.; Cripe, T. A.; Hughes, D. L. Advances in Chemistry Series 1987, 215,
137-153.
34. Uggerud, E., J. Phys. Org. Chem. 2006, 19, 461-466.
35. Uggerud, E., Chem.–Eur. J. 2006, 12, 1127-1136.
36. Jencks, W. P. Chem. Rev.1985, 85, 511-527.
37. Ren, Y.; Yamataka, H. Org. Lett. 2006, 8, 119-121.
38. Ren, Y.; Yamataka, H. Chem.–Eur. J. 2007, 13, 677-682.
112
39. Villano, S. M.; Eyet, N.; Lineberger, W. C.; Bierbaum, V. M. J. Am. Chem. Soc. 2009,
131, 8227-8233.
40. Garver, J. M.; Gronert, S.; Bierbaum, V. M. submitted (J. Am. Chem. Soc.)
41. Van Doren, J. M.; Barlow, S. E.; DePuy, C. H.; Bierbaum, V. M. Int. J. Mass Spectrom.
Ion Proc. 1987, 81, 85-100.
42. Villano, S. M.; Eyet, N.; Wren, S. W.; Ellison, G. B.; Bierbaum, V. M.; Lineberger, W.
C. Eur. J. Mass Spectrom. 2010, 16, 255-268.
43. Villano, S. M.; Eyet, N.; Wren, S. W.; Ellison, G. B.; Bierbaum, V. M.; Lineberger, W.
C. J. Phys. Chem. A 2010, 114, 191-200.
44. Su, T.; Chesnavich, W. J., J. Chem. Phys. 1982, 76, 5183-5185.
45. Gaussian 09, Revision A.1, Frisch, M. J.; Trucks, G. W.; Schlegel, H. B.; Scuseria, G. E.;
Robb, M. A.; Cheeseman, J. R.; Scalmani, G.; Barone, V.; Mennucci, B.; Petersson, G.
A.; Nakatsuji, H.; Caricato, M.; Li, X.; Hratchian, H. P.; Izmaylov, A. F.; Bloino, J.;
Zheng, G.; Sonnenberg, J. L.; Hada, M.; Ehara, M.; Toyota, K.; Fukuda, R.; Hasegawa,
J.; Ishida, M.; Nakajima, T.; Honda, Y.; Kitao, O.; Nakai, H.; Vreven, T.; Montgomery,
Jr., J. A.; Peralta, J. E.; Ogliaro, F.; Bearpark, M.; Heyd, J. J.; Brothers, E.; Kudin, K. N.;
Staroverov, V. N.; Kobayashi, R.; Normand, J.; Raghavachari, K.; Rendell, A.; Burant, J.
C.; Iyengar, S. S.; Tomasi, J.; Cossi, M.; Rega, N.; Millam, N. J.; Klene, M.; Knox, J. E.;
Cross, J. B.; Bakken, V.; Adamo, C.; Jaramillo, J.; Gomperts, R.; Stratmann, R. E.;
Yazyev, O.; Austin, A. J.; Cammi, R.; Pomelli, C.; Ochterski, J. W.; Martin, R. L.;
Morokuma, K.; Zakrzewski, V. G.; Voth, G. A.; Salvador, P.; Dannenberg, J. J.;
Dapprich, S.; Daniels, A. D.; Farkas, Ö.; Foresman, J. B.; Ortiz, J. V.; Cioslowski, J.;
Fox, D. J. Gaussian, Inc., Wallingford CT, 2009.
46. Ren, Y.; Yamataka, H. J. Comput. Chem. 2009, 30, 358-365.
47. Bohme, D. K.; Young, L. B. J. Am. Chem. Soc. 1970, 92, 7354-7358.
48. DePuy, C. H.; Gronert, S.; Mullin, A.; Bierbaum, V. M. J. Am. Chem. Soc. 1990, 112,
8650-8655.
49. Downard, K. M.; Bowie, J. H.; O'Hair, R. A. J.; Krempp, M.; DePuy, C. H. Int. J. Mass
Spectrom. Ion Processes 1992, 120, 217-229.
50. Hoz, S.; Basch, H.; Wolk, J. L.; Hoz, T.; Rozental, E. J. Am. Chem. Soc. 1999, 121,
7724-7725.
51. Glukhovtsev, M. N.; Pross, A.; Radom, L. J. Am. Chem. Soc. 1996, 118, 6273-6284.
52. Gonzales, J. M.; Allen, W. D.; Schaefer, H. F. J. Phys. Chem. A 2005, 109, 10613-
10628.
53. Nomura, Y.; Kubozono, T.; Hidaka, M.; Horibe, M.; Mizushima, N.; Yamamoto, N.;
Takahashi, T.; Komiyama, M. Bioorg. Chem. 2004, 32, 26-37.
54. Bartmess, J. E. "Negative Ion Energetics Data" in NIST Chemistry WebBook, NIST
Standard Reference Database Number 69, Eds. Linstrom, P.J and Mallard, W.G.,
National Institute of Standards and Technology, Gaithersburg MD, 20899,
http://webbook.nist.gov
55. Lide, D. R. CRC Handbook of Chemistry and Physics, 89th Ed.CRC Press: Boca Raton,
Fl., 2008; p U552-U552.
56. Hoz, S. J. Org. Chem. 1982, 47, 3545-3547.
57. Sauers, R. R. J. Chem. Theory Comput. 2010, 6, 602-606.
58. Adriaanse, C.; Sulpizi, M.; VandeVondele, J.; Sprik, M. J. Am. Chem. Soc. 2009, 131,
6046-6047.
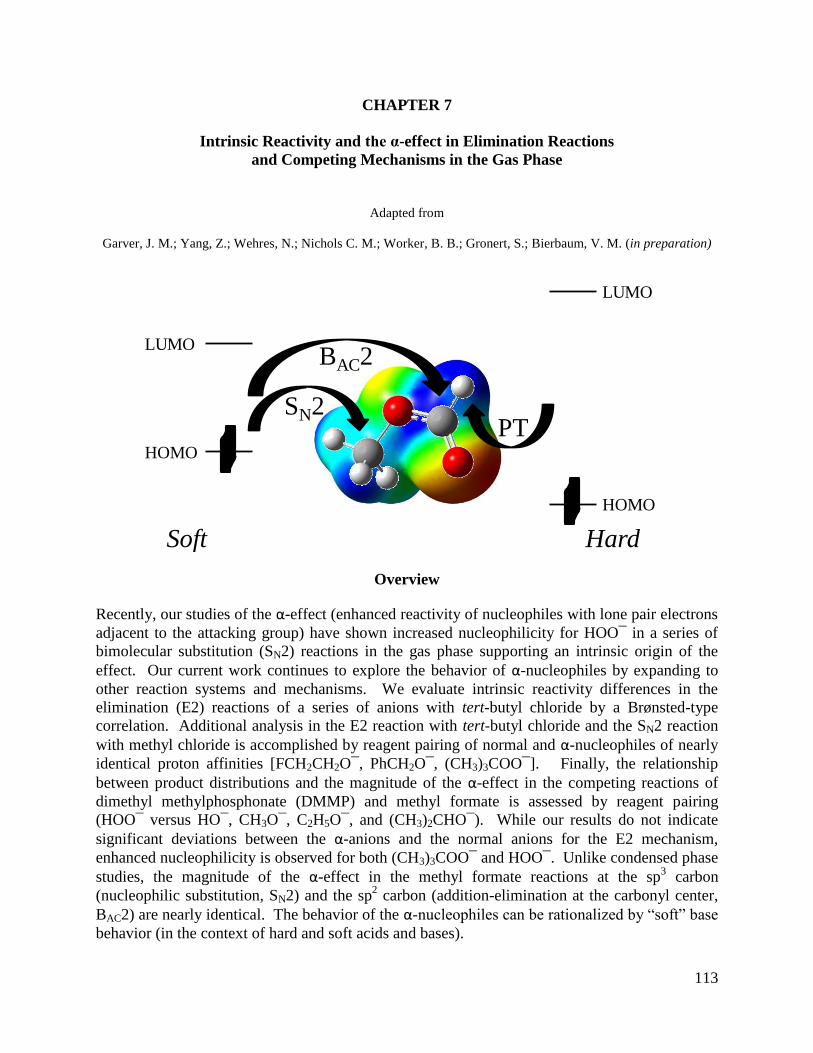
113
CHAPTER 7
Intrinsic Reactivity and the α-effect in Elimination Reactions
and Competing Mechanisms in the Gas Phase
Adapted from
Garver, J. M.; Yang, Z.; Wehres, N.; Nichols C. M.; Worker, B. B.; Gronert, S.; Bierbaum, V. M. (in preparation)
Overview
Recently, our studies of the α-effect (enhanced reactivity of nucleophiles with lone pair electrons
adjacent to the attacking group) have shown increased nucleophilicity for HOO¯ in a series of
bimolecular substitution (SN2) reactions in the gas phase supporting an intrinsic origin of the
effect. Our current work continues to explore the behavior of α-nucleophiles by expanding to
other reaction systems and mechanisms. We evaluate intrinsic reactivity differences in the
elimination (E2) reactions of a series of anions with tert-butyl chloride by a Brønsted-type
correlation. Additional analysis in the E2 reaction with tert-butyl chloride and the SN2 reaction
with methyl chloride is accomplished by reagent pairing of normal and α-nucleophiles of nearly
identical proton affinities [FCH2CH2O¯, PhCH2O¯, (CH3)3COO¯]. Finally, the relationship
between product distributions and the magnitude of the α-effect in the competing reactions of
dimethyl methylphosphonate (DMMP) and methyl formate is assessed by reagent pairing
(HOO¯ versus HO¯, CH3O¯, C2H5O¯, and (CH3)2CHO¯). While our results do not indicate
significant deviations between the α-anions and the normal anions for the E2 mechanism,
enhanced nucleophilicity is observed for both (CH3)3COO¯ and HOO¯. Unlike condensed phase
studies, the magnitude of the α-effect in the methyl formate reactions at the sp3 carbon
(nucleophilic substitution, SN2) and the sp2 carbon (addition-elimination at the carbonyl center,
BAC2) are nearly identical. The behavior of the α-nucleophiles can be rationalized by “soft” base
behavior (in the context of hard and soft acids and bases).
SN2
BAC2
PT
Soft Hard
HOMO
HOMO
LUMO
LUMO
114
7.1 Introduction
Gas phase kinetic studies have provided an indispensable means to probe the energetics
and intrinsic reactivity of prototypical organic reactions. This work has led to significant insight
on biochemical processes and the mechanism of substrate discrimination.1-3
Other groups have
focused on gas phase degradation reactions to evaluate the effectiveness of nucleophiles in the
breakdown of neurotoxins and chemical warfare agents.4, 5
These efforts have allowed the
intrinsic behavior of fundamental reactions to be revealed and extrapolated to solvents and
biological environments. Chemical reaction rates are strongly influenced by noncovalent
interactions, particularly the ion-stabilizing effect of solvents. Gas phase studies allow the
factors inherent to the reactants to be revealed in the absence of solvent effects. When these
factors are resolved, the true relationship between the intrinsic character and solvent effects can
be understood. One of the most complex areas of interest with regard to these factors is the
enhanced reactivity of α-nucleophiles. Recently, our studies of the α-effect have shown
enhanced nucleophilicity for HOO¯ relative to the proton affinities of normal alkoxides (HO¯,
CH3O¯, and C2H5O¯) in three separate series of gas phase bimolecular substitution (SN2)
reactions supporting an underlying intrinsic origin of the α-effect.6 Our current work focuses on
the α-effect in other gas phase reaction mechanisms and systems to further elucidate the nature of
the α-effect and to allow these effects to be compared to those in solution.
The term α-effect7 has been used to describe the increased reactivity relative to a given
basicity for nucleophiles with a lone pair of electrons adjacent to the attacking atom. Magnitudes
of the α-effect (kα/knormal) in the range of 5−1000 have been reported in solution for numerous
reactions, and mysteriously absent in others.8-14
A multifaceted puzzle, the rate enhancement of
α-nucleophiles has been found to be highly dependent on the nature of the substrate and the
115
environment of the reaction. The α-effect has been shown to be small or absent for substrates in
which there is a low correlation coefficient (βnuc) in the Brønsted relationship.47
The βnuc value is
taken as a measure of the extent of bond formation in the transition state (TS). Therefore it is
understandable that a smaller TS stabilizing interaction between the α-nucleophile and substrate
would be present in a more reactant-like TS. In the Hammond Postulate context, the TS will
lower and shift towards product character with increasing leaving group stability, even if the TS
more closely resembles the reactants. In some cases the magnitude of the α-effect becomes not
only dependent on, but primarily driven by the basicity of the leaving group.15
The magnitude of
the α-effect is also highly dependent on the hybridization (sp > sp2 > sp
3)13
and polarizability16
of
the electrophilic center. These interactions follow the principle of hard and soft acids and bases
(HSAB),17
which can be understood by employing perturbation molecular orbital theory.18
Whereas the energies of interaction for hard acids and bases (non-polarizable) are primarily
controlled by electrostatic attractions, soft acids and bases (polarizable) depend on orbital mixing
interactions. Hard (normal) anions have a tendency to react poorly with more electronegative sp2
and sp carbon atoms and polarizable electrophilic centers (softer electrophiles), while the diffuse
nature of the nucleophilic center of the α-anions19
causes a local softness.20
The joint efforts of the Buncel and Um groups have shed light on the α-effect in
solution.13, 16, 21-26
Variations in the magnitude of the α-effect can be attributed to differential
transition state (TS) stabilization and ground state (GS) destabilization effects. Depending on the
nucleophile-substrate system studied, either the TS stabilization22
or GS destabilization27
can
dominate as the controlling factor in the overall effect. Differential solvation energies between
normal and α-nucleophiles of 16 kJ mol-1
and 24 kJ mol-1
can lead to GS α-effects (kα/knormal) of
116
750 and 15000.13, 27
Due to this complexity, gas phase studies provide a vital link to resolving
the intrinsic nature of the α-effect and provide insight into solvent effects.
Gas phase anion chemistry probes the underlying factors that govern many of the
common organic reaction schemes (substitutions, eliminations, Grignard additions, aldol
condensations, hydrolysis of esters, etc.) and gives rise to a framework from which solvent
effects can be understood. Bimolecular ion-neutral gas phase reactions are typically
characterized by a classic double-well potential energy surface (PES) model28
where the central
barrier reflects a complex interaction of dynamic, energetic, and steric factors inherent to the
reactants. In solution, this barrier is modified by the differential charge stabilization energy
between the delocalized transition state relative to the reactants and products resulting in a
single-barrier PES. These “solvent effects” are evident in the large differences between reaction
rate constants of identical gas and condensed phase reactions,29, 30
in the reversal of ordering of
acidities and basicities,31, 32
as well as in the enhanced nucleophilicity of polarizable nucleophiles
in solution.28
Recently our research group has reported an α-effect in the gas phase for HOO¯ relative
to the proton affinities of normal alkoxides (HO¯, CH3O¯, and C2H5O¯) in three separate
reaction series (methyl fluoride, anisole, and 4-fluoroanisole) validating an intrinsic origin of the
effect.6 Based on these results, a Marcus theory
33 approach was employed to resolve
discrepancies between experimental34
and computational35, 36
studies on the existence of the α-
effect in SN2 reactions with CH3Cl.37
Marcus theory indicates that the intrinsic differences
between normal and α-nucleophiles are small and can be easily masked by thermodynamic
driving forces. Furthermore, large variations between the ionic character of the α-nucleophiles
and normal nucleophiles can be magnified by solvent effects.

117
Based on our new understanding of the expected magnitude of the α-effect and the
narrow window for resolving small intrinsic differences in the gas phase, we expand our studies
of the behavior of α-nucleophiles to other reaction systems and mechanisms. Often gas phase
nucleophilic substitution reactions are in competition with other processes, such as elimination
and proton transfer reactions. Although all of these processes can be described with a
double-well potential energy surface (Figure 7.1), differences in the transition states lead to
variations in the controlling factors for the reaction pathways. The proton transfer TS has
significant “ion-triplet” character,38, 39
[X¯···H+···¯RY], where “loose” electrostatic forces result
in a nearly barrierless reaction. Due to the shallow barrier, most proton transfer reactions have
single-well reaction characteristics where the reactivity is primarily related to the exothermicity
of reaction (∆Hrxn). The bimolecular elimination (E2) and substitution (SN2) reactions are
Figure 7.1 Generic gas phase double-well potential energy surfaces for competing
bimolecular elimination (E2), bimolecular substitution (SN2), and proton transfer
(PT) reactions.
Reaction Coordinate
ΔHrxn
X– + CH3CH2Y X–····RY
H
C C
Y
HH
H
H
X
‡ ― δ−
δ−
E2
SN2
ΔHcomplex
‡ ― PT
δ− δ− X C
CH3
H H
Y
‡ ―
‡ ― HX CH2CH2Y

118
controlled by their central barriers. The highly structured E2 and SN2 TS are entropically
hindered raising the enthalpic barriers depicted in Figure 7.1 (The E2 TS is looser and has
smaller entropic barriers than the SN2 TS40
). In envisioning these entropic effects for the
reactions depicted above, nearly equivalent controlling free-energy barriers and competing
processes are expected. Proton transfer is often statistically favored over the SN2 process and
will dominate product distributions when proton transfer is thermodynamically favored. Even
when 5 kJ mol-1
endothermic, an “entropy-driven” proton transfer reaction will compete with an
SN2 channel with a central barrier that lies 29 kJ mol-1
below the energy of the separated
reactants.41
In fact, SN2 entropic barriers are so large that the E2 channel will dominate in
systems where the SN2 barrier is marginally smaller (4−8 kJ mol-1
) than the E2 barrier.42
Seemingly small changes in the relative barrier heights (such as those in the α-effect) can have
large effects on product distributions.
In this study, we investigate the reactivity trends and α-effect for a series of reactions in
single-channel reaction substrates (tert-butyl chloride and methyl chloride), as well as two
competitive reaction systems (dimethyl methylphosphonate and methyl formate). A Brønsted-
type correlation is employed to discern differences in reactivity as a function of proton affinity in
the E2 reactions of a series of anions with tert-butyl chloride. To refine our assessment of
intrinsic differences, we narrowed our focus to reagent pairing of normal and α-nucleophiles
(FCH2CH2O¯, PhCH2O¯, (CH3)3COO¯) in the E2 reaction with tert-butyl chloride and the SN2
reaction with methyl chloride. We then expand our reagent pairing (HOO¯ versus HO¯, CH3O¯,
C2H5O¯, and (CH3)2CHO¯) in the competing reactions of dimethyl methylphosphonate and
methyl formate to assess the relationship between product distributions and the magnitude of the
119
α-effect. Computational transition state barriers and exothermicities of reaction are employed to
aid in our discussions of intrinsic differences between anions.
7.2 Experimental
7.2.1 Ion-Molecule Reactions
These reactions were carried out in a flowing afterglow-selected ion flow tube (FA-SIFT)
mass spectrometer, which has been previously described.43
Briefly, this instrument consists of
four sections: an ion source, an ion selection region, a reaction flow tube, and a detection system.
A flowing afterglow ion source is used to produce ions, which are mass-selected using a
quadrupole mass filter prior to injection into the reaction flow tube. Hydroxide was prepared by
electron ionization (70 eV) of methane and nitrous oxide (2:1 ratio). Most other ionic reagents
were generated by proton abstraction of neutrals by HO¯. The peroxyformate, HC(O)OO¯, and
peroxyacetate anions, CH3C(O)OO¯, were synthesized in a gas-phase Baeyer-Villiger reaction of
HOO¯ with methyl formate and methyl acetate as previously described.44, 45
Injected ions are
entrained in a flow of helium (200 std cm3 s
-1, 0.5 torr) and thermalized to 300 ± 2 K prior to
reactions with neutral reagents that are added through multiple inlets along the length of the
reaction flow tube. Ionic reactants and products are analyzed in the detection region using a
triple-quadrupole mass filter and an electron multiplier. The reactions are carried out under
pseudo-first order conditions (reactant ion ~105 ions cm
-3; neutral reactant ~10
11 molecules cm
-3),
and the reported branching ratios and reaction rate coefficients are the averages of at least three
individual measurements. Product branching ratios are determined by extrapolating the observed
product yields to zero reaction distance in order to extract the initial ratios due to primary
reactions. The reported reaction efficiencies are the experimental rate constant divided by the
calculated collision rate constants. Collision rate constants were calculated from parameterized
120
trajectory collision rate theory.46
Error bars represent one standard deviation in the data;
absolute uncertainties in these rate constant measurements are ± 20%. The detection system was
tuned to minimize mass discrimination, and no further corrections were made in the analysis.
7.2.2 Materials
All compounds were obtained from commercial vendors. These compounds include tert-
butyl chloride, (CH3)3CCl, Aldrich, 99%; methyl chloride, CH3Cl, Matheson, 99.5%; dimethyl
methylphosphonate, CH3PO(OCH3)2, Aldrich, 97%; methyl formate, HCOOCH3, Aldrich, 99%
(anhydrous); tert-butyl hydrogenperoxide, (CH3)3COOH, Aldrich, 90% (10% H2O);
2-fluoroethanol, FCH2CH2OH, Aldrich, 95%; benzyl alcohol, C6H5CH2OH, Aldrich, 99.8%
(anhydrous); hydrogen peroxide, HOOH, Sigma-Aldrich, 50 wt. % solution in water; methanol,
CH3OH, Aldrich, 99.9%; methanol-d4, CD3OD, CDN Isotopes, 99.8% D; ethanol, C2H5OH,
Decon Laboratories, 200 proof; Ethyl-1,1-d2 alcohol, CH3CD2OH, Aldrich, 98% D; 2-propanol,
(CH3)2CHOH, Aldrich, 99%; methyl acetate, CH3C(O)OCH3, Fluka, >99.9%; phenol, C6H5OH,
Sigma-Aldrich, ~99%; formic acid HC(O)OH, Sigma-Aldrich, ≥95%; and acetic acid,
CH3C(O)OH, Sigma-Aldrich, ≥99%. The reagents were protected from light and stored under
vacuum. Helium buffer gas (99.995%) was purified by passage through a molecular sieve trap
immersed in liquid nitrogen.
7.2.3 Computational Methods
Ab initio molecular orbital calculations were carried out with the G3MP2 method using
the Gaussian 09 suite of programs.47
Frequency calculations were carried out for all species to
establish their nature as local minima or transition states. Enthalpy changes were calculated
from the energies of the optimized structures, and thermal corrections included for 298 K
without scaling of the calculated vibrational frequencies.

121
7.3 Results and Discussion
7.3.1 Brønsted Correlation (E2 Mechanism)
Recent computational work by Ren and Yamataka indicate the existence of the α-effect in
the gas phase for a series of E2 reactions with alkyl chlorides.48, 49
Since competition exists
between the SN2 and E2 processes within the ethyl and isopropyl chloride substrates and both
reactions produce the same ionic product (non-distinguishable in mass spectrometry), we
employed tert-butyl chloride as the substrate for our E2 investigation. Because of steric
hindrance, the SN2 reaction is severely inhibited for tert-butyl chloride and therefore the
reactivity measured is directly related to the E2 process.42, 50-52
The experimental data for the
reactions of the normal and α-anions are shown in terms of a Brønsted-type plot in Figure 7.2
where the y-axis is the logarithmic scale of the reaction efficiency and the x-axis is the gas phase
proton affinity44, 45, 53, 54
of the anion. Due to variations in collision rates, reaction efficiencies are
employed to normalize the reaction rate constants for comparisons. These values represent the
fraction of collisions that result in a reaction. Blue represents the normal oxyanions and red the
oxygen α-nucleophiles. Efficiencies are determined from previously reported experimental rate
constants34, 55, 56
and this work (anions 11−15) at 300 ± 2 K. Our measured rate constants for
HC(O)O¯, C6H5O¯ , and HC(O)OO¯ were 6.23 ± 0.35 x 10⁻¹²
, 4.00 ± 0.21 x 10⁻¹²
, and 2.75 ±
0.41 x 10⁻¹¹
cm3 s
-1, respectively. The changes in ion signal intensities were too low to measure
an accurate rate constant for CH3C(O)O¯ and CH3C(O)OO¯ (hence an upper limit of 1 x 10-12
cm3 s
-1).

122
In Figure 7.2, we note that the free-energy relationship between reactivity and basicity is
predominantly linear; however, there is a slight curvature in the plot that increases at lower
basicities. Although there is a strong correlation of reactivity with basicity, the non-linear
behavior indicates significant contributions from other factors to the activation barrier. Such
curvature has been attributed to minor shifts in TS structures.57
The term “variable E2 transition
state” has been used to describe the E2 mechanism due to the varying degrees of proton transfer
from Cβ to the attacking base, the formation of a π bond between Cα and Cβ, and the departure of
a leaving group Y¯ from Cα in the TS.58
For strong bases, very strong hydrogen bonding exists
Figure 7.2 Brønsted correlation where y-axis is the logarithmic scale of the E2 reaction
efficiency for the anion with (CH3)3CCl and the x-axis is the gas phase proton affinity of the
anion (refs 44, 45, 53, 54). Reaction efficiencies calculated with rate constants (krxn) from this
work (anions 11-15) and refs 34, 55, 56 and parameterized trajectory theory (ref 46) collision
rates (kcol). (■ normal oxyanions, α-oxyanions): 1. HO¯ 2. CH3O¯ 3. C2H5O¯ 4. HOO¯
5. CFH2CH2O¯ 6. (CH3)3COO¯ 7. CF3CH2O¯ 8. ClO¯ 9. CF3CF2CH2O¯ 10. BrO¯
11. HC(O)OO¯ 12. C6H5O¯ 13. HC(O)O¯ 14. CH3C(O)O¯ 15. CH3C(O)OO¯
0.001
0.01
0.1
1600155015001450
Rea
ctio
n E
ffic
ien
cy(k
rxn/k
col)
Anion Proton Affinity (kJ mol-1)
5
234
9
7 1
8
10
11
14*15* *Upper limit (krxn/kcol < 0.0005)
6
13
12

123
between the anion and proton resulting in a TS with a large degree of carbanionic character at
Cα. As the strength of the base decreases, larger shifts in electron density within the substrate are
required to facilitate the departure of the leaving group resulting in more carbocation character at
the Cα in the TS. This shift in the nature of the TS is perpendicular to the reaction coordinate and
produces non-linear behavior in Brønsted correlations.57
The Brønsted plot would be curved,
concave downward, with increasing tangent angles for less reactive anions. This type of trend is
supported by electron density shifts in the NPA (natural population analysis computational
method) charge distributions and corresponding deformation energies reported by Ren and
Yamataka.48, 49
This implies a dependence of the E2 mechanism on the charge distribution
within the attacking group, as well as the proton affinity. A similar relationship was reported by
means of a two-parameter (proton affinity and electronegativity) equation to estimate barrier
heights in the E2 reactions.59
It is important to attribute some of the curvature in our Brønsted
correlations to a flattening at higher basicities as the reaction efficiencies approach the collision
rate. However, the ability to resolve intrinsic differences in reagent pairs at a proton affinity of
1550 kJ mol-1
(see below), shows that the reactivity is still primarily controlled by barrier heights
at the heart of the Brønsted plot.
While the ability to make linear correlations from our data is restricted, the overall trends
in Figure 7.2 do not show any significant deviations between the α-anions and the normal anions.
Small shifts may hint that the α-anions are more reactive than normal anions at lower basicities
(anions 8 and 10 relative to 9) and less reactive than more basic normal anions (anions 6 and 4
relative to 3 and 5). It is interesting to note that Ren and Yamataka’s data also suggest smaller
shifts in NPA charge distributions and deformation energies for the α-anions when compared to
the normal anions.48, 49
Based on the variable transition state model, smaller shifts would result
124
in a more linear relationship with proton affinity. If such a relationship exists, the variations in
reactivity are extremely small (within the experimental uncertainty of our measurements) and
cannot be confirmed without more definitive experimental evidence.
7.3.2 Reagent Pairing [FCH2CH2O¯, C6H5CH2O¯, (CH3)3COO¯]
Due to the non-linear behavior in our Brønsted correlations, we attempted to find normal
oxyanions and α-oxyanions of similar structure and proton affinities to evaluate as reagent pairs.
The selection of the anion of tert-butyl hydroperoxide as the α-nucleophile allowed us to pair
both the anion of benzyl alcohol and 2-fluoroethoxide in our α-effect evaluations. The proton
affinities (PA), exothermicity of reaction (ΔHrxn), reaction rate constants (krxn), reaction
efficiency (Eff), α-effect (Effα/EffNormal), and computational barrier heights (ΔH‡) for these
anions in the SN2 reactions with methyl chloride and the E2 reactions with tert-butyl chloride are
listed in Table 7.1. In both the SN2 and E2 system the reaction rate constants are moderately fast
resulting in similar reaction efficiencies (Eff = 0.24−0.56) which correspond well with the
G3MP2 activation barriers.
7.3.2.1 SN2 Reactions
Our reaction rate constants and efficiencies are slightly higher than those reported for
CH3Cl with FCH2CH2O¯ (Eff = 0.19) and C6H5CH2O¯ (Eff = 0.20) by Chen and Brauman, but
the agreement is reasonable considering the variations in the experimental techniques.60
Differences in the experimental conditions (ΔT 50 K) between the Fourier transform ion
cyclotron resonance spectrometer (FT-ICR) and FA-SIFT MS result in slight shifts in TS barriers
due to the negative temperature dependence of the tight SN2 TS in the double-well potential
energy surface. The α-effect (1.6 and 2.1) is manifested in the relative reaction efficiencies for
the SN2 reactions. The limited magnitude of the effect (≤ 20) is consistent with earlier estimates

Table 7.1. Thermodynamic and Kinetic Data with Associated Barriers for the Reagent Pairing [FCH2CH2O¯, C6H5CH2O¯, and
(CH3)3COO¯] in the SN2 Reactions with CH3Cl and the E2 Reactions with (CH3)3CCl to Evaluate the α-effect.
aproton affinities from ref 53; G3MP2 proton affinities (kJ mol
-1): FCH2CH2O¯ (1544), C6H5CH2O¯ (1538), (CH3)3COO¯ (1547).
bExothermicity of reaction
(ΔHrxn) calculated from gas phase heats of formation (ΔHf) from ref 53 and an estimated ΔHf for the SN2 neutral products using additivity rules; numbers in
parentheses are calculated ΔHrxn using the G3MP2 method. cError bars represent one standard deviation of the mean of three or more measurements; absolute
accuracy is ± 20% ; efficiency (Eff) is the ratio of the branching rate constants (kPT or SN2 = krxn × BR) to the collision rate constant (kcol) calculated using
parameterized trajectory collision theory (ref 46).
EffαEffnormal
α-effect ΔH‡ (kJ mol-1)
PA (X ‾ )a ΔHrxn
b (G3MP2) krxn (x10-10
cm3
s-1
)c Eff G3MP2
FCH2CH2O‾ + CH3Cl 1553 ± 12 -130 (-149) 6.28 ± 0.20 0.31 1.6 -37.4
C6H5CH2O‾ + CH3Cl 1548 ± 9 -125 (-148) 4.46 ± 0.09 0.24 2.1 -31.8
(CH3)3COO‾ + CH3Cl 1552 ± 9 -141 (-164) 9.74 ± 0.20 0.51 -44.9
FCH2CH2O‾ + (CH3)3CCl 1553 ± 12 -88.3 (-80.0) 12.3 ± 0.2 0.56 0.9 -35.1
C6H5H2O‾ + (CH3)3CCl 1548 ± 9 -83.3 (-73.7) 5.17 ± 0.10 0.27 1.9 -32.2
(CH3)3COO‾ + (CH3)3CCl 1552 ± 9 -87.3 (-82.3) 10.2 ± 0.2 0.51 -39.6
Kinetic DataThermodynamic Data (kJ mol-1
)
E2
SN2
Reaction (X ‾ + M)
125
126
of nucleophilic intrinsic differences (~ 7 kJ mol-1) between α-peroxyanions and normal
oxyanions.37
Our computational SN2 barriers support both a slightly higher intrinsic barrier for
C6H5CH2O¯ relative to FCH2CH2O¯ and a lower barrier for (CH3)3COO¯ relative to both normal
anions. While the α-nucleophile displays enhanced reactivity relative to proton affinity, part of
this effect must be attributed to the larger exothermicity of reaction (>10 kJ mol-1
). A similar
disparity between the proton affinities and methyl cation affinities of the hydrogen peroxide
anion compared to normal alkoxides has been reported in our earlier work.6
7.3.2.2 E2 Reactions
Our experimental reaction efficiencies correlate extremely well with the proton affinities
and exothermicities of reaction, which is expected due to the deprotonation component of the E2
mechanism. Such strong correlations show a high sensitivity in reactivity to proton affinities.
The proton affinity of C6H5CH2O¯ is about 5 kJ mol-1
lower than that of the other anions,
therefore FCH2CH2O¯ and (CH3)3COO¯ provide the best reagent pairing to evaluate the α-effect
in the E2 system. The reaction efficiency of (CH3)3COO¯ is slightly less than that of
FCH2CH2O¯; however, the efficiencies are the same within experimental error. Even though our
computational E2 barriers are higher than those for the SN2 reactions, our overall reaction rate
constants are slightly larger due to a smaller entropic barrier in the E2 TS. The differences
between the E2 barriers are also smaller than those of the SN2 system, suggesting more similar
reaction efficiencies and smaller intrinsic differences between anions. A lower computational
barrier for (CH3)3COO¯ relative to FCH2CH2O¯ suggests the existence of an α-effect that is not
reflected in our experimental data. Assuming our capability to resolve reactivity differences of ±
20%, the reaction efficiencies should be able to reflect differences in overall activation barrier
heights greater than 1 kJ mol-1
. In more exothermic reactions smaller barriers will have less

127
influence on the reactant ion-dipole complex and this sensitivity will decrease. Work by Chen
and Brauman using RRKM fitting to estimate barrier heights from reaction efficiencies suggests
that at similar barrier heights to those in our reaction studies this sensitivity decreases to around 4
kJ mol-1
.60
While we are attempting to understand differences in experimental data and trends in
computational data, we recognize that the barrier heights have the inherent chemical inaccuracy
(~ 10 kJ mol-1
) of any computational method. If an α-effect does exist in the E2 reaction,
intrinsic differences between (CH3)3COO¯ and FCH2CH2O¯ must be small (≤ 4 kJ mol-1
) to be
experimentally masked at the given computational barrier levels and measured reaction
efficiencies.
7.3.3 Dimethyl Methylphosphonate
Several gas phase studies of negative ions reacting with the organophosphate nerve agent
(GX) surrogate, dimethyl methylphosphonate (DMMP), have been performed.5, 61, 62
As the
basicity of the anions approaches the proton affinity of DMMP (1560 ± 12 kJ mol-1
)62
, both the
SN2 and PT channels become active (Scheme 7.1). McAnoy et al. reported significant
differences in the branching ratios (SN2:PT) in the reactions of HOO¯ (89%:11%) and CD3O¯
(3%:97%) with DMMP. Since HOO¯ and CD3O¯ have similar proton affinities, this difference
Scheme 7.1
P
OCH3
H3C OCH3
O+ HX
X +
+ CH3X
proton transfer
SN2 (carbon)
P
OCH3
H2C OCH3
O
P
OCH3
H3C O
O

128
in branching ratios was attributed to a greater nucleophilicity of HOO¯; however, the absolute
rate constants were not measured, which may have allowed an assessment of the α-effect. In an
effort to further resolve the intrinsic reactivity of the HOO¯ anion, we have measured the overall
reaction rate constants (krxn) and branching fractions (BR) for the reactions of HOO¯, CD3O¯,
and (CH3)2CHO¯ with DMMP. These results and the associated exothermicities of reaction
(∆Hrxn) and SN2 barriers (∆H‡) relative to the reactants calculated by the G3MP2 method are
listed in Table 7.2.
The reported branching fractions in Table 7.2 are consistent with previously reported
values.5,62
The overall rate constants are relatively large for gas phase reactions, yet the reaction
efficiencies are less than 50% of the collision rate. This is surprising given that all the reactions
have access to a barrierless PT channel, especially in the more exothermic CD3O¯ reaction.
McAnoy et al. estimated Arrhenius pre-exponential factors that favored the SN2 (carbon) process
over the PT channel.5 If the SN2 process is favored in reaction dynamics, the PT transfer
efficiency could be significantly reduced. It does not appear that the PT reactions of CD3O¯ and
(CH3)2CHO¯ reach the collision controlled limit and non-statistical dynamics may play a role.
The most striking feature in the data is the large shift in partitioning to favor the SN2
products for HOO¯ relative to the normal anions supporting the conclusion of McAnoy et al. that
the α-effect does exist in this system. Our computational SN2 barriers support this enhanced
nucleophilicity for HOO¯. The shift in exothermicities of the SN2 reaction reflects a disparity
between the proton affinities and methyl cation affinities of the α-nucleophile relative to the
normal anions in our study. In the reactions studied by Lum and Grabowski, the branching ratios
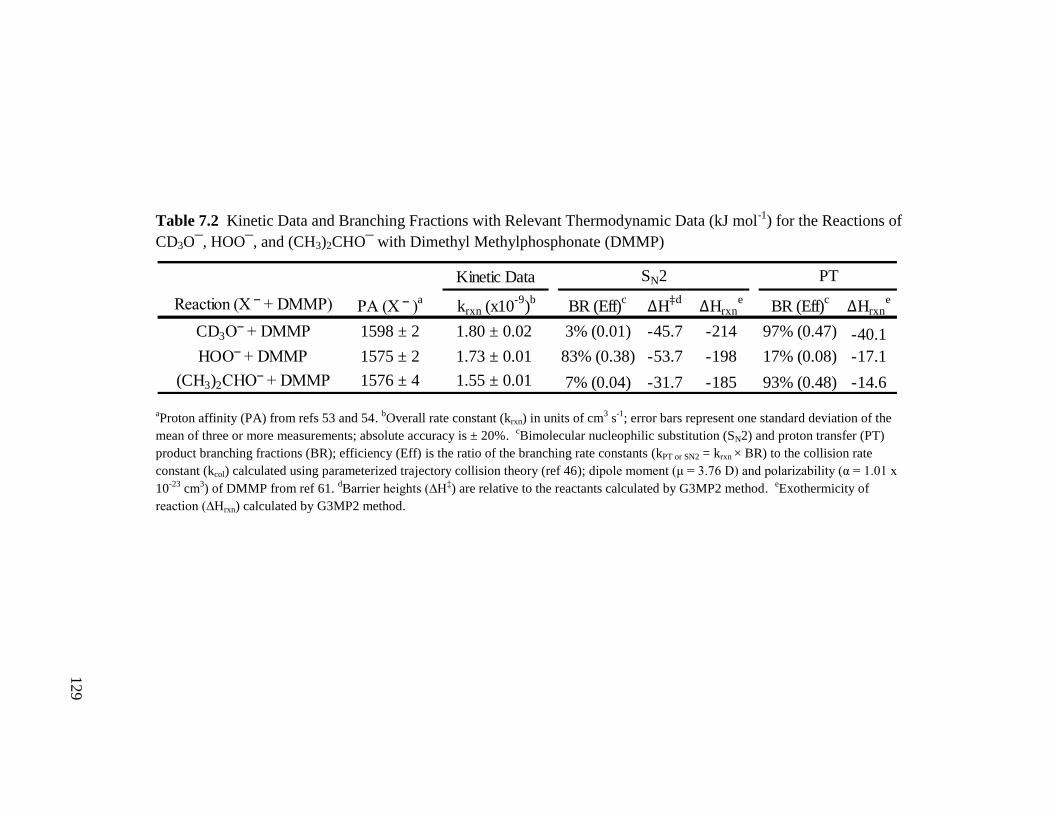
Table 7.2 Kinetic Data and Branching Fractions with Relevant Thermodynamic Data (kJ mol-1
) for the Reactions of
CD3O¯, HOO¯, and (CH3)2CHO¯ with Dimethyl Methylphosphonate (DMMP)
aProton affinity (PA) from refs 53 and 54.
bOverall rate constant (krxn) in units of cm
3 s
-1; error bars represent one standard deviation of the
mean of three or more measurements; absolute accuracy is ± 20%. cBimolecular nucleophilic substitution (SN2) and proton transfer (PT)
product branching fractions (BR); efficiency (Eff) is the ratio of the branching rate constants (kPT or SN2 = krxn × BR) to the collision rate
constant (kcol) calculated using parameterized trajectory collision theory (ref 46); dipole moment (μ = 3.76 D) and polarizability (α = 1.01 x
10-23
cm3) of DMMP from ref 61.
dBarrier heights (∆H
‡) are relative to the reactants calculated by G3MP2 method.
eExothermicity of
reaction (∆Hrxn) calculated by G3MP2 method.
Kinetic Data
Reaction (X ‾ + DMMP) PA (X ‾ )a
krxn (x10-9
)b
BR (Eff)c
ΔH‡d
ΔHrxne
BR (Eff)c
ΔHrxne
CD3O‾ + DMMP 1598 ± 2 1.80 ± 0.02 3% (0.01) -45.7 -214 97% (0.47) -40.1
HOO‾ + DMMP 1575 ± 2 1.73 ± 0.01 83% (0.38) -53.7 -198 17% (0.08) -17.1
(CH3)2CHO‾ + DMMP 1576 ± 4 1.55 ± 0.01 7% (0.04) -31.7 -185 93% (0.48) -14.6
SN2 PT
129
130
(SN2:PT) shift slightly towards the SN2 products as the proton affinity of the anion decreases
approaching the proton affinity of DMMP. This result indicates a slowing of the PT process
relative to the SN2 reaction with decreasing anion basicity. The overall rate constant and
partitioning is clearly dominated by the proton transfer channel in our studies of the CD3O¯
reaction. Any attempt to evaluate the magnitude of the α-effect from these data would be
flawed. However, the increase in the SN2 products in the (CH3)2CHO¯ reaction (even with a
higher barrier), suggests that the PT process has slowed enough to allow the SN2 barrier to be
reflected in partitioning and therefore in the overall rate constant and efficiencies. The SN2
barrier heights indicate a significant intrinsic difference in the nucleophilicity of HOO¯ relative
to (CH3)2CHO¯. If we were to evaluate the α-effect (Eff HOO¯/Eff(CH3)2CHO¯) with DMMP of this
reagent pair, HOO¯ is 9.5 times more efficient. While this is a fairly significant effect for a gas
phase reaction, it is difficult to separate the true effect of the PT channel on partitioning.
Furthermore, the possible influence of non-statistical dynamics makes the situation more
complex and the analysis problematic.
7.3.4 Methyl Formate
Several gas phase studies have examined nucleophilic reactions with methyl formate.63-67
While secondary reactions lead to variations in products, there are three primary reaction
channels (Scheme 7.2): proton transfer (PT), bimolecular nucleophilic substitution (SN2), and
addition-elimination at the carbonyl center (BAC2). Since the direct proton transfer channel for
most of our reactions is endothermic, the dominant PT process observed in our studies is driven
by the formation of CO and solvated anionic clusters (Riveros reaction68). While the α-effect has
been reported for nucleophilic ester cleavage in solution,15
the reactions of esters in solution are
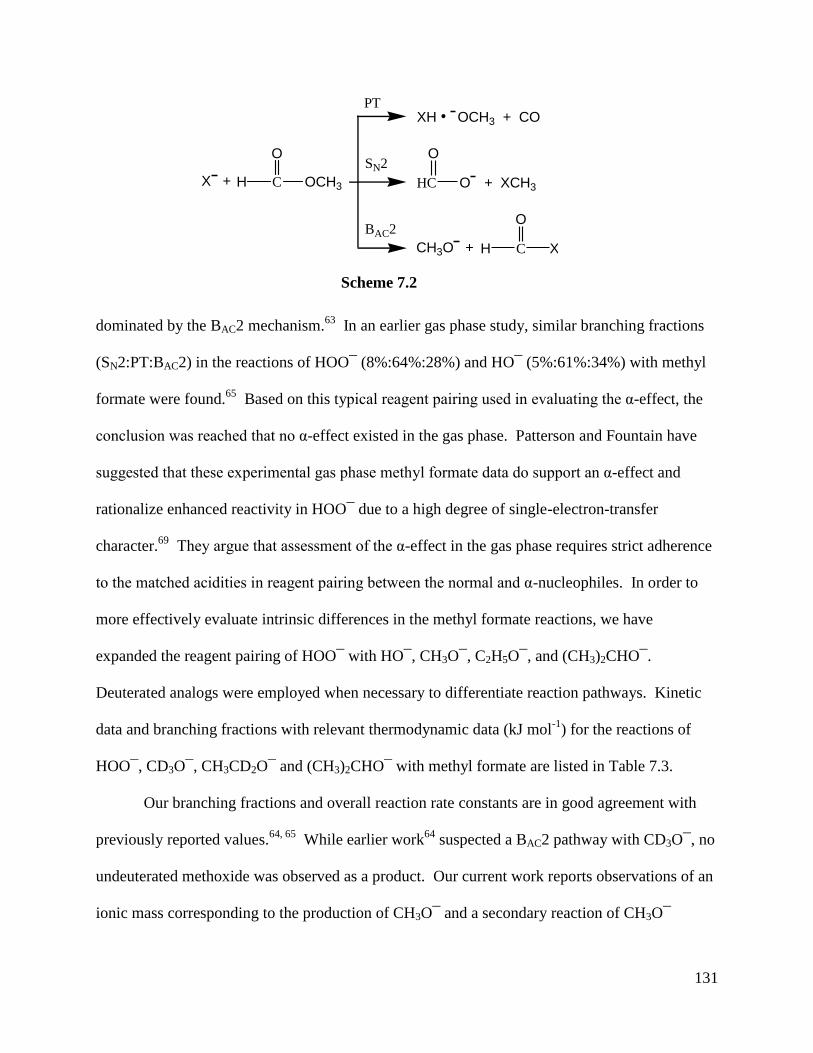
131
dominated by the BAC2 mechanism.63
In an earlier gas phase study, similar branching fractions
(SN2:PT:BAC2) in the reactions of HOO¯ (8%:64%:28%) and HO¯ (5%:61%:34%) with methyl
formate were found.65
Based on this typical reagent pairing used in evaluating the α-effect, the
conclusion was reached that no α-effect existed in the gas phase. Patterson and Fountain have
suggested that these experimental gas phase methyl formate data do support an α-effect and
rationalize enhanced reactivity in HOO¯ due to a high degree of single-electron-transfer
character.69
They argue that assessment of the α-effect in the gas phase requires strict adherence
to the matched acidities in reagent pairing between the normal and α-nucleophiles. In order to
more effectively evaluate intrinsic differences in the methyl formate reactions, we have
expanded the reagent pairing of HOO¯ with HO¯, CH3O¯, C2H5O¯, and (CH3)2CHO¯.
Deuterated analogs were employed when necessary to differentiate reaction pathways. Kinetic
data and branching fractions with relevant thermodynamic data (kJ mol-1
) for the reactions of
HOO¯, CD3O¯, CH3CD2O¯ and (CH3)2CHO¯ with methyl formate are listed in Table 7.3.
Our branching fractions and overall reaction rate constants are in good agreement with
previously reported values.64, 65
While earlier work64
suspected a BAC2 pathway with CD3O¯, no
undeuterated methoxide was observed as a product. Our current work reports observations of an
ionic mass corresponding to the production of CH3O¯ and a secondary reaction of CH3O¯
Scheme 7.2
CH OCH3
O
X +
SN2
BAC2
PTOCH3 + COXH
HC O
O
+ XCH3
CH X
O
CH3O +

132
through a PT channel to produce a CH3O¯•CH3OH cluster in both the CD3O¯ and the
CH3CD2O¯ reactions. We attribute this formation of CH3O¯ to the BAC2 channel because the PT
channel capable of producing the non-solvated CH3O¯ for both anions is more endothermic by
approximately 45 kJ mol-1
(see appendix 3). Based on this assumption, we report branching
fractions and efficiencies for the BAC2 channel in these reactions. A trace (< 1%) of SN2
products (HCOO¯) is observed in the reaction of methyl formate with CH3CD2O¯; however, we
could not effectively extrapolate the small yield to zero reaction distance to determine an exact
branching fraction. Therefore, we place an upper limit of 1% and approximate an α-effect at this
limit for CH3CD2O¯.
All of the reactions with methyl formate have a high efficiency. While the total reaction
efficiency of HO¯ is 72%, the other anions span a narrow range of 61-64%. Trends in branching
fractions and associated efficiencies indicate that the relative differences in barriers are
influencing the partitioning of products and the data can be used to evaluate intrinsic differences
in each channel. Computational analysis of the methyl formate reaction system by Pliego and
Riveros indicates that the PT channel follows a single-well potential, the SN2 reaction occurs by
a double-well potential, and the BAC2 reaction progresses through a multi-well potential with the
controlling barrier being the formation of a tetrahedral intermediate.71
Table 7.3 displays the
controlling barriers for the SN2 and BAC2 processes and the exothermicity of reaction for the PT
formation of the solvated products determined by the G3MP2 method. The SN2 and BAC2
reaction efficiencies track nicely with the corresponding barrier heights; however, the
efficiencies of the PT channel seem low for the given exothermicities of reaction. The PT
pathway has been described as a direct formation of a methoxide ion bound to two neutral
molecules (CH3O¯∙CO∙HX), rather than a step-wise proton abstraction from the formyl group.71
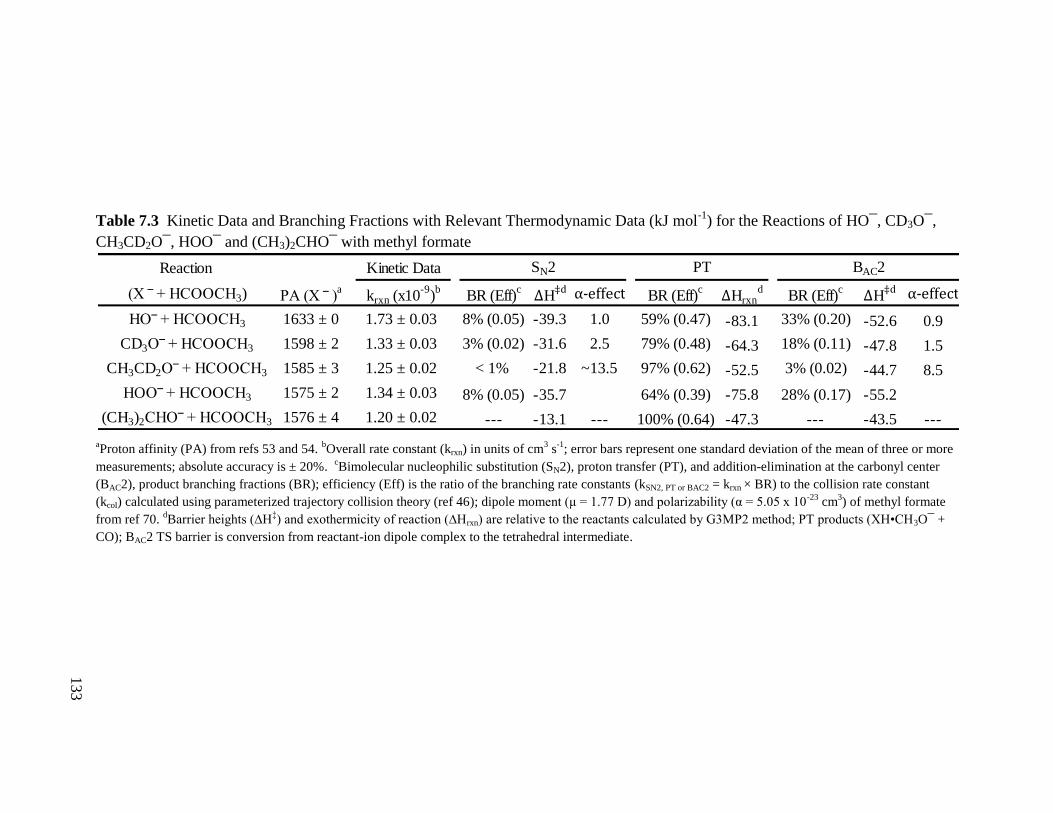
Table 7.3 Kinetic Data and Branching Fractions with Relevant Thermodynamic Data (kJ mol-1
) for the Reactions of HO¯, CD3O¯,
CH3CD2O¯, HOO¯ and (CH3)2CHO¯ with methyl formate
aProton affinity (PA) from refs 53 and 54.
bOverall rate constant (krxn) in units of cm
3 s
-1; error bars represent one standard deviation of the mean of three or more
measurements; absolute accuracy is ± 20%. cBimolecular nucleophilic substitution (SN2), proton transfer (PT), and addition-elimination at the carbonyl center
(BAC2), product branching fractions (BR); efficiency (Eff) is the ratio of the branching rate constants (kSN2, PT or BAC2 = krxn × BR) to the collision rate constant
(kcol) calculated using parameterized trajectory collision theory (ref 46); dipole moment (μ = 1.77 D) and polarizability (α = 5.05 x 10⁻²³
cm3) of methyl formate
from ref 70. dBarrier heights (∆H
‡) and exothermicity of reaction (∆Hrxn) are relative to the reactants calculated by G3MP2 method; PT products (XH•CH3O¯ +
CO); BAC2 TS barrier is conversion from reactant-ion dipole complex to the tetrahedral intermediate.
Reaction Kinetic Data
(X ‾ + HCOOCH3) PA (X ‾ )a
krxn (x10-9
)b
BR (Eff)c ΔH
‡d α-effect BR (Eff)c ΔHrxn
dBR (Eff)
c ΔH‡d α-effect
HO‾ + HCOOCH3 1633 ± 0 1.73 ± 0.03 8% (0.05) -39.3 1.0 59% (0.47) -83.1 33% (0.20) -52.6 0.9
CD3O‾ + HCOOCH3 1598 ± 2 1.33 ± 0.03 3% (0.02) -31.6 2.5 79% (0.48) -64.3 18% (0.11) -47.8 1.5
CH3CD2O‾ + HCOOCH3 1585 ± 3 1.25 ± 0.02 < 1% -21.8 ~13.5 97% (0.62) -52.5 3% (0.02) -44.7 8.5
HOO‾ + HCOOCH3 1575 ± 2 1.34 ± 0.03 8% (0.05) -35.7 64% (0.39) -75.8 28% (0.17) -55.2
(CH3)2CHO‾ + HCOOCH3 1576 ± 4 1.20 ± 0.02 --- -13.1 --- 100% (0.64) -47.3 --- -43.5 ---
SN2 PT BAC2
133
134
While this allows an energetically favorable single-well pathway, the overall process is less
facile than the typical proton transfer process. Whereas the PT reaction proceeds through the
formyl group proton, both the SN2 and BAC2 processes originate from the reactant ion-dipole
complex hydrogen bonded to the methyl group of the ester. The relative branching ratios
(SN2:BAC2) from RRKM calculations (15%:85%)71
for the decomposition of this complex in the
reaction of HO¯ with methyl formate show good agreement with our data (20%:80%). This
indicates that competition between the SN2 and the BAC2 mechanisms behaves statistically and
supports our use of relative differences in these channels to evaluate the α-effect.
As we review the magnitude of the α-effect for the SN2 and BAC2 reactions in Table 7.3,
the relative change in reaction efficiencies definitely favors HOO¯ compared to the normal
anions as the proton affinity decreases. Unfortunately, the rate constant for these pathways in the
most closely matched normal anion ((CH3)2CHO¯) is completely masked by the competing PT
channel. This result prevents us from determining an upper limit for the rate constant and
thereby estimating the relative magnitude of the α-effect. Nevertheless, the trends in both
reaction efficiencies and computational barriers would suggest at least an order of magnitude
enhancement in reactivity. We note that the BAC2 process is a nucleophilic attack at a sp2 carbon
which in solution has shown a significantly higher enhanced reactivity with α-nucleophiles as
compared to studies on the nucleophilic attack at the sp3 carbon.
13 It appears that the magnitude
of the α-effect in the methyl formate system is the same or slightly higher at the sp3 carbon when
compared to the sp2 carbon site of attack. Based on this result, we would suggest that a large
component of the magnitude of the α-effect observed in sp2 hybridized systems is due to solvent
effects. This suggestion is consistent with the dominance of the BAC2 mechanism in solution
with esters, which is not observed in the gas phase. Pliego and Riveros have attributed the

135
reversal in the dominance of the PT to the BAC2 mechanism from gas to condensed phase for
HO¯ with methyl formate to a reduction in basicity upon solvation.71
While we do not observe a significant difference in the α-effect between sp2 and sp
3
hybridized carbon, the principles behind the hard (non-polarizable) and soft (polarizable) base
rationale still seem to apply as an underlying factor in the reactivity of the α-nucleophiles. Lee
and Grabowski have reported “hard” base behavior (preference for deprotonation/elimination)
for alkoxides and a preference for nucleophilic attack in the “soft” base enolates.72
One could
envision the diffuse nature of the nucleophilic center of the α-anions19
producing a local
“softness”,20
which would influence their reactivity relative to normal nucleophiles. Our
observation of large disparities between the proton affinities and methyl cation affinities of the
α-nucleophiles compared to the normal nucleophiles points to some variation in the hard/soft
nature between the anions.
7.4 Conclusion
Our investigation of the α-effect for the elimination (E2) and substitution (SN2 and BAC2)
mechanisms in the gas phase provides valuable insight into the intrinsic nature of the α-
nucleophiles. Our analyses of the reactivity trends and associated thermodynamic factors for the
reaction systems in our study have led to the following findings.
(1) Brønsted correlations and reagent pairing for the E2 reactions of tert-butyl chloride do
not indicate significant deviations between the α-anions and the normal anions. If an “α-
effect” does exist in the E2 reactions, intrinsic differences must be small (≤ 4 kJ mol-1
) to
be experimentally masked for the observed reaction efficiencies in our study.
136
(2) The E2 reactions are very sensitive to the proton affinity/exothermicity and the nature of
the attacking anion. Therefore Brønsted relationships should be restricted to a narrow
range of proton affinities. Even small differences in proton affinities (~ 5 kJ mol-1
) for
normal anions could generate large shifts in reactivity; therefore, the proton affinities of
reagent pairs must be strongly correlated to assess intrinsic differences.
(3) An α-effect was observed for the SN2 reaction of (CH3)3COO¯ relative to C6H5CH2O¯
(2.1) and FCH2CH2O¯ (1.5) with CH3Cl. However part of this effect must be attributed
to the greater exothermicity of reaction (> 10 kJ mol-1
) of the α-nucleophile.
(4) Reagent pairing in the reactions of HOO¯ and (CH3)2CHO¯ with DMMP shows an
enhanced SN2 channel for the α-nucleophile that is 9.5 times more efficient. While this is
a relatively large α-effect compared to the other reaction systems in this study, it is
difficult to separate the effect of the PT channel on partitioning and the possible influence
of non-statistical dynamics in this reaction system. In addition to enhanced reactivity
within a reaction channel, the small shifts in barriers, as a result of the α-effect, in
competitive reaction systems can generate significant shifts in product distributions and
thereby mask channels.
(5) Our data for the reactions of methyl formate show enhanced nucleophilicity for HOO¯ in
both the SN2 and BAC2 mechanisms. Unlike condensed phase studies, the magnitude of
the α-effect is the same or smaller for attack at a sp2 carbon (~10) versus a sp
3 carbon
(~13.5). We propose that the difference in effects between media is driven by shifts in
reactivity between reaction channels as a result of solvent effects.
(6) Observation of large disparities between the proton affinities and methyl cation affinities
of the α-nucleophiles compared to the normal nucleophiles in our study implies an

137
inherent difference in the nature of the attacking groups. We suggest that the diffuse
nature of the attacking group of the α-nucleophiles produces a local softness (in the
context of HSAB) that influences their reactivity relative to normal nucleophiles.
138
7.5 References
1. Kurinovich, M. A.; Lee, J. K. J. Am. Chem. Soc. 2000, 122, 6258-6262.
2. Sun, X.; Lee, J. K. J. Org. Chem. 2010, 75, 1848-1854.
3. Zhachkina, A.; Lee, J. K. J. Am. Chem. Soc. 2009, 131, 18376-18385.
4. Creek, J. A. M.; McAnoy, A. M.; Brinkworth, C. S. Rapid Commun. Mass Spectrom.
2010, 24, 3419-3424.
5. McAnoy, A. M.; Paine, M. R. L.; Blanksby, S. J. Org. Biomol. Chem. 2008, 6, 2316-
2326.
6. Garver, J. M.; Gronert, S.; Bierbaum, V. M. submitted (J. Am. Chem. Soc.)
7. Edwards, J. O.; Pearson, R. G. J. Am. Chem. Soc. 1962, 84, 16-24.
8. Dixon, J. E.; Bruice, T. C. J. Am. Chem. Soc. 1971, 93, 6592-6597.
9. Dixon, J. E.; Bruice, T. C. J. Am. Chem. Soc. 1972, 94, 2052-2056.
10. Gregory, M. J.; Bruice, T. C. J. Am. Chem. Soc. 1967, 89, 4400-4402.
11. Gregory, M. J.; Bruice, T. C. J. Am. Chem. Soc. 1967, 89, 2327-2330.
12. Pratt, R. F.; Bruice, T. C. J. Org. Chem. 1972, 37, 3563-3564.
13. Buncel, E.; Um, I. H. Tetrahedron 2004, 60, 7801-7825.
14. McIsaac, J. E.; Subbaraman, L. R.; Subbaraman, J.; Mulhausen, H. A.; Behrman, E. J.,
J. Org. Chem. 1972, 37, 1037-1041.
15. Nomura, Y.; Kubozono, T.; Hidaka, M.; Horibe, M.; Mizushima, N.; Yamamoto, N.;
Takahashi, T.; Komiyama, M. Bioorg. Chem. 2004, 32, 26-37.
16. Um, I. H.; Han, J. Y.; Buncel, E. Chem.–Eur. J. 2009, 15, 1011-1017.
17. Pearson, R. G.; Songstad, J. J. Am. Chem. Soc. 1967, 89, 1827-1836.
18. Klopman, G. J. Am. Chem. Soc. 1968, 90, 223-234.
19. Heaton, M. M. J. Am. Chem. Soc. 1978, 100, 2004-2008.
20. Pearson, R. G. Proceedings of the National Academy of Sciences 1986, 83, 8440-8441.
21. Um, I. H.; Buncel, E. J. Am. Chem. Soc. 2001, 123, 11111-11112.
22. Um, I. H.; Hwang, S. J.; Buncel, E. J. Org. Chem. 2006, 71, 915-920.
23. Um, I. H.; Shin, Y. H.; Han, J. Y.; Buncel, E. Can. J. Chem. 2006, 84, 1550-1556.
24. Um, I. H.; Buncel, E. J. Org. Chem. 1999, 65, 577-582.
25. Um, I. H.; Hwang, S. J.; Buncel, E. J. Org. Chem. 2006, 71, 915-920.
26. Um, I. H.; Im, L.-R.; Buncel, E. J. Org. Chem. 2010, 75, 8571-8577.
27. Kim, M. S.; Min, S. W.; Seo, J. A.; Um, I. H. Bull. Korean Chem. Soc. 2009, 30, 2913-
2917.
28. Olmstead, W. N.; Brauman, J. I. J. Am. Chem. Soc. 1977, 99, 4219-4228.
29. Bohme, D. K.; Rakshit, A. B.; Mackay, G. I. J. Am. Chem. Soc. 1982, 104, 1100-1101.
30. Bohme, D. K.; Mackay, G. I. J. Am. Chem. Soc. 1981, 103, 978-979.
31. Brauman, J. I.; Blair, L. K. J. Am. Chem. Soc. 1970, 92, 5986-5992.
32. Taft, R. W. Prog. Phys. Org. Chem. 1983, 14, 247-350.
33. Marcus, R. A. J. Phys. Chem. 1968, 72, 891-899.
34. Villano, S. M.; Eyet, N.; Lineberger, W. C.; Bierbaum, V. M. J. Am. Chem. Soc. 2009,
131, 8227-8233.
35. Ren, Y.; Yamataka, H. Org. Lett. 2006, 8, 119-121.
36. Ren, Y.; Yamataka, H. Chem.–Eur. J. 2007, 13, 677-682.
37. Garver, J. M.; Yang, Z.; Nichols C. M.; Worker, B. B.; Gronert, S.; Bierbaum, V. M. (in
preparation)
139
38. Gronert, S.; Keeffe, J. R. J. Org. Chem. 2006, 71, 5959-5968.
39. Keeffe, J. R.; Gronert, S.; Colvin, M. E.; Tran, N. L. J. Am. Chem. Soc. 2003, 125,
11730-11745.
40. Hu, W. P.; Truhlar, D. G. J. Am. Chem. Soc. 1996, 118, 860-869.
41. Ren, J.; Brauman, J. I. J. Am. Chem. Soc. 2004, 126, 2640-2646.
42. Gronert, S.; Fagin, A. E.; Okamoto, K.; Mogali, S.; Pratt, L. M. J. Am. Chem. Soc. 2004,
126, 12977-12983.
43. Van Doren, J. M.; Barlow, S. E.; DePuy, C. H.; Bierbaum, V. M. Int. J. Mass Spectrom.
Ion Proc. 1987, 81, 85-100.
44. Villano, S. M.; Eyet, N.; Wren, S. W.; Ellison, G. B.; Bierbaum, V. M.; Lineberger, W.
C. Eur. J. Mass Spectrom. 2010, 16, 255-268.
45. Villano, S. M.; Eyet, N.; Wren, S. W.; Ellison, G. B.; Bierbaum, V. M.; Lineberger, W.
C. J. Phys. Chem. A 2010, 114, 191-200.
46. Su, T.; Chesnavich, W. J. J. Chem. Phys. 1982, 76, 5183-5185.
47. Gaussian 09, Revision A.1, Frisch, M. J.; Trucks, G. W.; Schlegel, H. B.; Scuseria, G. E.;
Robb, M. A.; Cheeseman, J. R.; Scalmani, G.; Barone, V.; Mennucci, B.; Petersson, G.
A.; Nakatsuji, H.; Caricato, M.; Li, X.; Hratchian, H. P.; Izmaylov, A. F.; Bloino, J.;
Zheng, G.; Sonnenberg, J. L.; Hada, M.; Ehara, M.; Toyota, K.; Fukuda, R.; Hasegawa,
J.; Ishida, M.; Nakajima, T.; Honda, Y.; Kitao, O.; Nakai, H.; Vreven, T.; Montgomery,
Jr., J. A.; Peralta, J. E.; Ogliaro, F.; Bearpark, M.; Heyd, J. J.; Brothers, E.; Kudin, K. N.;
Staroverov, V. N.; Kobayashi, R.; Normand, J.; Raghavachari, K.; Rendell, A.; Burant, J.
C.; Iyengar, S. S.; Tomasi, J.; Cossi, M.; Rega, N.; Millam, N. J.; Klene, M.; Knox, J. E.;
Cross, J. B.; Bakken, V.; Adamo, C.; Jaramillo, J.; Gomperts, R.; Stratmann, R. E.;
Yazyev, O.; Austin, A. J.; Cammi, R.; Pomelli, C.; Ochterski, J. W.; Martin, R. L.;
Morokuma, K.; Zakrzewski, V. G.; Voth, G. A.; Salvador, P.; Dannenberg, J. J.;
Dapprich, S.; Daniels, A. D.; Farkas, Ö.; Foresman, J. B.; Ortiz, J. V.; Cioslowski, J.;
Fox, D. J. Gaussian, Inc., Wallingford CT, 2009.
48. Ren, Y.; Yamataka, H. J. Org. Chem. 2007, 72, 5660-5667.
49. Ren, Y.; Yamataka, H. J. Comput. Chem. 2009, 30, 358-365.
50. Gronert, S.; DePuy, C. H.; Bierbaum, V. M. J. Am. Chem. Soc. 1991, 113, 4009-4010.
51. Gronert, S.; Fagin, A.; Okamoto, K.; Pratt, L. M.; Mogali, S. Abstr. Pap. Am. Chem. Soc.
2003, 226, U181-U181.
52. Gronert, S.; Fagin, A. E.; Wong, L. J. Am. Chem. Soc. 2007, 129, 5330-5331.
53. Bartmess, J. E. "Negative Ion Energetics Data" in NIST Chemistry WebBook, NIST
Standard Reference Database Number 69, Eds. Linstrom, P.J and Mallard, W.G.,
National Institute of Standards and Technology, Gaithersburg MD, 20899,
http://webbook.nist.gov.
54. Ervin, K. M.; DeTuro, V. F. J. Phys. Chem. A 2002, 106, 9947-9956.
55. Bohme, D. K.; Young, L. B. J. Am. Chem. Soc. 1970, 92, 7354-7358.
56. DePuy, C. H.; Gronert, S.; Mullin, A.; Bierbaum, V. M. J. Am. Chem. Soc. 1990, 112,
8650-8655.
57. Kurz, J. L. Chem. Phys. Lett. 1978, 57, 243-246.
58. Bartsch, R. A.; Zavada, J., Chem. Rev. 1980, 80, 453-494.
59. Wu, X. P.; Sun, X. M.; Wei, X. G.; Ren, Y.; Wong, N. B.; Li, W. K. J. Chem. Theory
Comput. 2009, 5, 1597-1606.
60. Chen, X.; Brauman, J. I. J. Am. Chem. Soc. 2008, 130, 15038-15046.

140
61. Midey, A. J.; Miller, T. M.; Viggiano, A. A. J. Phys. Chem. A 2009, 113, 4982-4989.
62. Lum, R. C.; Grabowski, J. J. J. Am. Chem. Soc. 1993, 115, 7823-7832.
63. Frink, B. T.; Hadad, C. M. J. Chem. Soc., Perkin Trans. 2 1999, 31, 2397-2407.
64. DePuy, C. H.; Grabowski, J. J.; Bierbaum, V. M.; Ingemann, S.; Nibbering, N. M. M. J.
Am. Chem. Soc. 1985, 107, 1093-1098.
65 DePuy, C. H.; Della, E. W.; Filley, J.; Grabowski, J. J.; Bierbaum, V. M. J. Am. Chem.
Soc. 1983, 105, 2481-2482.
66. Takashima, K.; Riveros, J. M. J. Am. Chem. Soc. 1978, 100, 6128-6132.
67. Johlman, C. L.; Wilkins, C. L. J. Am. Chem. Soc. 1985, 107, 327-332.
68. Isolani, P. C.; Riveros, J. M. Chem. Phys. Lett. 1975, 33, 362-364.
69. Patterson, E. V.; Fountain, K. R. J. Org. Chem. 2006, 71, 8121-8125.
70. Lide, D. R. CRC Handbook of Chemistry and Physics, 89th Ed. CRC Press: Boca Raton,
Fl., 2008; p U552-U552.
71. Pliego, J. J. R.; Riveros, J. M. Chem.–Eur. J. 2001, 7, 169-175.
72. Lee, J. K.; Grabowski, J. J. J. Org. Chem. 1996, 61, 9422-9429.
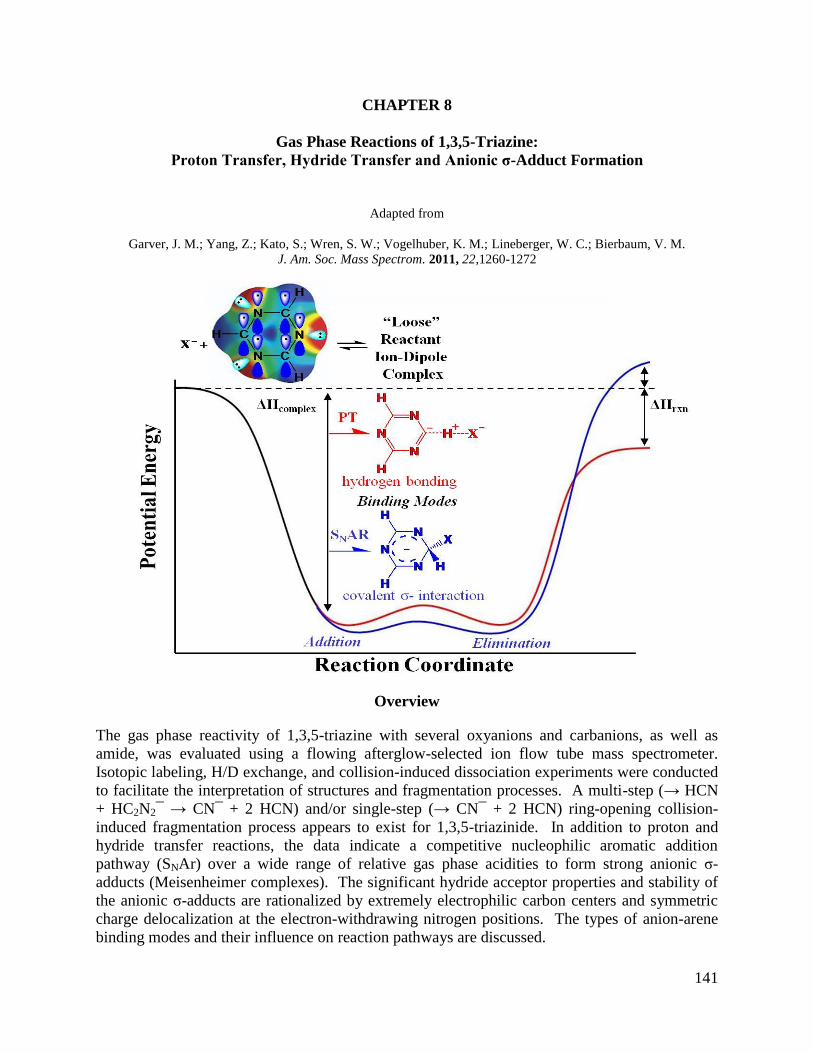
141
CHAPTER 8
Gas Phase Reactions of 1,3,5-Triazine:
Proton Transfer, Hydride Transfer and Anionic σ-Adduct Formation
Adapted from
Garver, J. M.; Yang, Z.; Kato, S.; Wren, S. W.; Vogelhuber, K. M.; Lineberger, W. C.; Bierbaum, V. M.
J. Am. Soc. Mass Spectrom. 2011, 22,1260-1272
Overview
The gas phase reactivity of 1,3,5-triazine with several oxyanions and carbanions, as well as
amide, was evaluated using a flowing afterglow-selected ion flow tube mass spectrometer.
Isotopic labeling, H/D exchange, and collision-induced dissociation experiments were conducted
to facilitate the interpretation of structures and fragmentation processes. A multi-step (→ HCN
+ HC2N2¯ → CN¯ + 2 HCN) and/or single-step (→ CN¯ + 2 HCN) ring-opening collision-
induced fragmentation process appears to exist for 1,3,5-triazinide. In addition to proton and
hydride transfer reactions, the data indicate a competitive nucleophilic aromatic addition
pathway (SNAr) over a wide range of relative gas phase acidities to form strong anionic σ-
adducts (Meisenheimer complexes). The significant hydride acceptor properties and stability of
the anionic σ-adducts are rationalized by extremely electrophilic carbon centers and symmetric
charge delocalization at the electron-withdrawing nitrogen positions. The types of anion-arene
binding modes and their influence on reaction pathways are discussed.

142
8.1 Introduction
The chemical compound 1,3,5-triazine, (C3N3H3), also known as s-triazine, is a
symmetric six-membered N-heterocyclic aromatic ring consisting of alternating carbon and
nitrogen atoms. N-heterocycles are important constituents of many natural and synthetic
products (plastics, drugs, petrochemicals, food, paints, etc.) and offer the high-energy, high-
density properties desired in energetic materials (explosives, pyrotechnics, propellants, and
fuels).1 Furthermore, nitrogen ring compounds are biologically relevant as model nucleobases
due to their H-acceptor abilities2 and their role in bioactivity.
3 Triazine derivatives are
commonly used in herbicides,4 pharmaceutical products,
5, 6 and as light stabilizers in
polymers.7, 8
Many of the unique chemical and physical properties of the triazine compounds
arise from the interaction of the carbon atoms with the electron-withdrawing nitrogen atoms
within the aromatic ring.2, 9
While the structure-reactivity relationships of nitroaromatics have
been extensively studied, more recently the electrostatic interaction of anions with
electron-deficient arenes and heteroarenes has gained interest.10, 11
Our investigation of the gas
phase reactivity of the electrophilic 1,3,5-triazine and the complexes formed during these
reactions has revealed significant hydride acceptor properties and proven insightful into anion-
arene interactions.
Polycyclic or heterocyclic conjugated systems tend to exhibit thermodynamic and kinetic
stability.12
This “aromatic” stability can influence physicochemical properties, as well as the
forces that govern reaction pathways.13
While the incorporation of nitrogen within an aromatic
ring has little effect on aromaticity, there are significant effects on reactivity.14
Typically the
л-electron density of an aromatic ring makes it susceptible to reactions by electrophilic agents,
however the addition of an electron-withdrawing group activates the compound to nucleophilic
143
attack via an SNAr mechanism.15
The SNAr mechanism is believed to be a two-step addition-
elimination pathway which proceeds through a Meisenheimer complex (anionic σ-adduct)
intermediate. In solution, these complexes typically serve as reaction intermediates; however, in
the gas phase these species can be isolated and characterized in the absence of complicating
solvent interactions.16, 17
Both transition states18
and stable intermediates19
of anionic σ-adducts have been
reported in the gas phase reaction. To understand the reactivity of the prototypical SNAr reaction
Fernández et al.20
conducted a theoretical investigation of the stability of these structures relative
to intrinsic nucleophilicity. Interestingly, unlike aliphatic nucleophilic substitution reactions
(SN2), the identity SNAr reactions (where nucleophile and leaving group are the same) for
aromatics with nucleophiles belonging to the same period of the periodic table have almost
identical barrier heights. However, in non-identity reactions the exothermicity of reaction
provides a thermodynamic driving force which influences barrier heights. The intrinsic stability
of the complex is dominated by the electronic nature of the aromatic substrate. During the
formation of the anionic σ-adduct, a critical balance between the stabilization due to bond
formation and destabilization from the destruction of aromaticity dictates the relative potential
energy (minimum or transition state) of the complex. Less stable structures gain stability
through more planar orientations through distortions of the typical tetrahedral (sp3)
Meisenheimer-type geometry. These findings correlate nicely with the anion-arene interactions
described by Hay and Bryantsev21
and the experimental results of Hiraoka et al.22
To ensure common nomenclature in discussions of anion–arene interactions, Hay and
Bryantsev have proposed characterization of complexes by geometric features and the degree of
covalency.21
Figure 8.1 depicts the primary binding motif categories as (a) aryl H-bonding

144
(when acidic hydrogens are present), (b) noncovalent anion–π complexes, (c) weakly covalent
σ-adducts, and (d) strongly covalent σ-adducts. “Strongly covalent σ-adducts” have extensive
mixing of the anion and arene-type molecular orbitals (MOs) to form the typical tetrahedral (sp3)
Meisenheimer-type structures. “Noncovalent anion-л complexes” exhibit ring-centered
geometries which are bound with electrostatic forces. Moderate interaction between the anion
and arene MOs yields “weakly covalent σ-adducts” with off-center configurations. Employing
these definitions, true electrostatic binding of anions with aryl rings is rare and most
supramolecular bonding and solid state interactions display off-center arrangements.10
Computations suggest that strong nucleophiles produce strongly covalent σ-adducts,
while less nucleophilic anions form weakly covalent σ-adducts depending on electron deficiency
in the aromatic ring.21
Gas phase spectroscopic evidence of these two types of structural motifs
supports this relationship.23
The amount of interaction between the electrons of the anion and the
л-system is enhanced and stabilized by electron deficiencies in the aromatic ring. The degree of
Figure 8.1 Binding modes for complexes of anions with charge-neutral arenes (a) C–H
hydrogen bonding, (b) noncovalent anion–π interaction, (c) weakly covalent σ-interaction,
and (d) strongly covalent σ-interaction.21
- Reproduced by permission of The Royal
Chemical Society.
(a)
(b) (c) (d)
145
electron deficiency in aryl compounds can be modulated through substitution of electron
withdrawing groups, such as –F, –CN and –NO2. However, electron-withdrawing groups can
inductively weaken the strength of hydrogen bonds which enhances the proton transfer
processes. Therefore when aryl C–H groups are present, both hydrogen bound anion complexes
and anionic σ-adducts must be considered. Studies of substituted benzenes suggest that gas
phase nucleophilic attack on the ring is feasible only when the acidity of the aromatic
compounds is lower than or comparable to that of the nucleophile.24, 25
While hydrogen bound
complexes may be present at a wide range of relative acidities, the proton transfer channel does
not become active until about the same relative acidity range as that of nucleophilic substitution.
For highly basic nucleophiles, the proton transfer reaction is significantly favored over the
substitution reaction.24, 26
Depending on the nature of the anion and arene, gas phase reactions have shown the
aromatic nucleophilic substitution channel to be in competition with multiple pathways (proton
transfer, E2 elimination, SN2, etc.).26-29
Of particular interest to our current work is the presence
of a hydride transfer channel with 1,3,5-triazine to form a hydride-Meisenheimer complex.
Recently, these complexes have been identified in the biodegradation of nitroaromatics.30-34
Although fragmentation patterns of the hydride-Meisenheimer complex of trinitrotoluene, [TNT
+ H]¯, were studied by Yinon et al., reduction and hydrolysis in their heated source prevented
identification of stable hydride σ-adducts.35
Other hydride transfer mechanisms for the anionic
reductions of carbonyls and activated olefins have been observed in the gas phase;36-40
however,
to our knowledge hydride transfer to neutral aromatics and stable anionic hydride σ-adducts have
not been reported in the gas phase. A computational study by Gronert and Keeffe on factors
influencing hydride transfer indicates that electron withdrawing groups increase hydride ion
146
affinity and reaction rates, while resonance lowers barriers to hydride transfer.41
From this
perspective, electrophilic aromatic rings offer intriguing hydride donor and acceptor properties.
In the present study, we investigate the reactivity of 1,3,5-triazine with amide and several
oxyanions and carbanions, as well as evaluate the reaction products using collision-induced
dissociation. A flowing afterglow-selected ion flow tube (FA-SIFT) mass spectrometer was
utilized to measure kinetic data and analyze the dissociation process. Isotopic labeling and H/D
exchange experiments were conducted to facilitate the interpretation of fragmentation processes
and the structures of products. In addition, theoretical calculations were carried out to elucidate
the structures of the intermediates/transition states/products and the driving energetics behind the
mechanistic processes. Our results are discussed in terms of relative gas phase acidities, anion-
arene interactions, and σ-adduct stability.
8.2 Experimental
8.2.1 Ion-Molecule Reactions
All reactions were carried out using a flowing afterglow-selected ion flow tube (FA-
SIFT) mass spectrometer, which has been previously described.42
Briefly, this instrument
consists of four sections: an ion source, an ion selection region, a reaction flow tube, and a
detection system. A flowing afterglow ion source is used to produce ions, which are
mass-selected using the ion selection region quadrupole mass filter prior to injection into the
reaction flow tube. Primary anions were prepared by electron ionization (70 eV) of methane and
nitrous oxide (2:1 ratio) to produce hydroxide or of ammonia to produce amide. Other ionic
reagents were generated by proton abstraction of neutrals by either NH2¯ or HO¯. Injected ions
are entrained in a flow of helium (200 std cm3 s
-1, 0.5 torr) and thermalized to 300 ± 2 K prior to
reactions with neutral reagents that are added through multiple inlets along the length of the
147
reaction flow tube. Ionic reactants and products are analyzed in the detection region using a
triple-quadrupole mass filter and an electron multiplier. The reactions are carried out under
pseudo-first order conditions (reactant ion ~105 ions cm
-3; neutral reactant ~10
11 molecules cm
-3),
and the reported branching ratios and reaction rate coefficients are the averages of at least three
individual measurements. Product branching ratios are determined by extrapolating the observed
product yields to zero reaction distance in order to extract the initial ratios due to primary
reactions. The reported reaction efficiencies are the experimental rate constant divided by the
calculated collision rate constant (Eff = kexpt/kcol). Collision rate constants were calculated from
parameterized trajectory collision rate theory.43
Error bars represent one standard deviation in
the data; absolute uncertainties in these rate constant measurements are ± 20%. The detector was
tuned to minimize mass discrimination, and no further corrections were made in the analysis.
8.2.2 Collision-Induced Dissociation
The source and selection region of the FA-SIFT mass spectrometer has been previously
employed in collision-induced dissociation experiments to investigate fragmentation pathways
and estimate dissociation energies.44-46
Collisional activation is accomplished by injecting the
anion or adduct at varied injection energies (Elab) of 10-80 eV, defined as the voltage difference
between the source flow tube and the injection orifice. Collisions with helium take place in the
vicinity of the injection orifice (i.e., SIFT-CID) that connects the quadrupole region and the
second flow tube. Nominal center-of-mass collision energies (Ecm) can be calculated using the
relation Ecm = Elab × mHe/(mHe + mion), where mHe and mion are the masses of He and the reactant
ion, respectively. However, SIFT–CID occurs under multiple-collision conditions thereby
enabling fragmentation at collision energies that are lower than threshold energies. The Ecm
should thus be taken as the lower bound for the actual internal excitation of the anions. The
148
mass spectra of the precursor and fragment ions were analyzed to elucidate the chemical
structures of molecules.
8.2.3 H/D Exchange
Hydrogen/deuterium (H/D) exchange reactions of gas phase ions have proven to be
powerful tools for probing ion structures in the FA-SIFT. 47, 48
In our H/D exchange analysis,
gaseous D2O was added near the middle of our reaction flow tube downstream of the first four
neutral reactant inlets. The extent of H/D exchange for reactant and product ions was evaluated
by m/z shifts in the mass spectra.
8.2.4 Materials
All compounds were obtained from commercial vendors and liquid samples were purified
by several freeze-pump-thaw cycles before use. These compounds include 1,3,5-triazine,
C3N3H3, 97%; ammonia, NH3, Airgas, 99.9995%; 2-methylpropene, CH2=C(CH3)2, Phillips 66,
99+%; 1,4-diazine, C4H4N2, Aldrich, 99+%; furan, C4H4O, Aldrich, 99+%; pyridine, C5H5N,
Fluka, 99.8%; difluoromethane, F2CH2, Aldrich 99.7%; fluorobenzene, C6H5F, Aldrich, 99%;
difluorobenzene, C6H4F2, Aldrich, 99%; 2-methylfuran, (CH3)C4H3O, Aldrich 99%; 1,4-
dimethylbenzene, (CH3)2C6H4, EM Science, 98%; cyclopentanol, C5H9OH, Aldrich, 99%:
ethanol, C2H5OH, Decon Laboratories, 200 proof; methanol, CH3OH, Aldrich, 99.9%; methanol-
d4, CD3OD, CDN Isotopes, 99.8% D; water, H2O, distilled; water, H218
O, Cambridge Isotope
Laboratories, 80% 18
O; D2O, Cambridge Isotope Laboratories, 99.9% D. Helium buffer gas
(99.995%) was purified by passage through a molecular sieve trap immersed in liquid nitrogen.
8.2.5 Computational Methods
Ab initio molecular orbital calculations were carried out with the B3LYP method using
the 6-311++G(d,p) and aug-CC-pVTZ basis sets using the Gaussian 09 suite of programs.49
149
Frequency calculations were carried out for all species to establish their nature as local minima
or transition states. Enthalpy changes were calculated from the energies of the optimized
structures, and thermal corrections were included for 298 K without any scaling of the calculated
vibrational frequencies.
8.3 Results and Discussion
The bimolecular ion-neutral reactions between the conjugate base and neutral species of
1,3,5-triazine, oxygen-centered reactants (water, methanol, cyclopentanol, and ethanol), carbon-
centered reactants (2-methylpropene, 1,4-dimethylbenzene, 1,4-diazine, pyridine, fluorobenzene,
difluorobenzene, furan, and 2-methylfuran) and a nitrogen-centered reactant (ammonia) were
investigated by using FA-SIFT mass spectrometry. Proton and hydride transfer reactions were
observed; however, the formation of a collision stabilized adduct/cluster dominated most of the
reactions studied. Of significant interest was the type of anion-arene binding motif present
within these complexes and the influence of this interaction on reaction pathways.
8.3.1 Elucidation of Structure, Mechanisms, and Energetics
Collision-induced dissociation (CID) mass spectrometry was employed to investigate the
key structural features, energetics, and thermochemical properties of our gas-phase ion-molecule
reactions. In CID, selected precursor ions are activated by multiple collisions with a buffer gas
which increases the internal vibrational and rotational energy of the ion until dissociation occurs.
Mass shifts corresponding to isotopic labeling and fragmentation patterns allow the elucidation
of structure and insight into reaction and dissociation mechanisms. In a simple bond-breaking
process, the dissociation product intensities yield information regarding bond energies within the
precursor ion. Coarse decomposition threshold energies can be extracted from energy-dependent
precursor ion breakdown curves. However, in more complex processes, the product intensities

150
will be associated with activation energies that reflect bond breaking and bond formation.
Application of the extended kinetic method to the fragmentation ratios of proton-bound ion
complexes allows the relative proton affinity of an unknown to be determined relative to a series
of reference bases.
Figure 8.2a displays the FA-SIFT mass spectrum for the reaction of HO¯ + 1,3,5-triazine.
The major product ion of the reaction is deprotonated 1,3,5-triazine (m/z 80); a small
contribution from the stabilized ion-dipole complex is observed at m/z 98 ([HO•C3H3N3]¯).
Minor ion peaks at m/z 26 (CN¯), m/z 44, and m/z 71 suggest either appreciable contributions
from impurities or a fragmentation pathway. Similar ion peaks from CID of the hydroxide-1,3,5-
triazine cluster, [HO•C3H3N3]¯ (Figure 8.2b) are observed. This suggests that the HO¯ + 1,3,5-
triazine product ion peaks at m/z 26, 44, and 71 originate from the reactant ion-dipole cluster,
[HO•C3H3N3]¯, as opposed to impurities. Further supporting this interpretation is the observed
isotopic shift (inset, Figure 8.2a) of m/z 44 to 46 and m/z 71 to 73 when H18
O¯ was utilized in
both the reaction and cluster generation. Clearly 18
O is incorporated into the products and
fragments; however this result can be explained through either an electrostatic clustering
interaction (m/z 44, [CN¯• • • H2O] and m/z 71, [C2HN2¯• • • H2O]) or a covalent bonding
interaction (m/z 44, [NH=CHO¯ ] and m/z 71, [C2N2H3O¯]).
To resolve the nature of these peaks, the m/z 44 ion was generated in the source from the
reaction of HO¯ + 1,3,5-triazine; unfortunately, the m/z 71 ion could not be generated in
sufficient quantities to study. Mass selection and injection of the m/z 44 ion over an Ecm
injection energy range of 1-2 eV, resulted only in an ion peak at m/z 42. If the m/z 44 ion were a
water cluster a peak at m/z 26 should have been observed. The peak at m/z 42 (NCO¯) is
consistent with loss of H2 from NH=CHO¯. CID of the m/z 96 ion produced the same m/z 42

Figure 8.2 FA-SIFT Mass Spectra of (a) the reaction of HO¯ + 1,3,5-triazine with insets of isotopic shift studies. (b) CID of the
hydroxide-1,3,5-triazine species, [HO•C3H3N3] ¯, at an Ecm injection voltage of 1.2 eV. (c) The reaction of CH3O¯ + 1,3,5-triazine
with insets of isotopic shift studies. (d) CID of the methoxide-1,3,5-triazine species, [CH3O•C3H3N3]¯, at Ecm of 0.65 eV.
c)a)
b) d)
151

152
peak, implying that this ion has a keto-type structure generated from the loss of H2 from an m/z
98 covalently bound adduct. Therefore, the peaks at m/z 26 (CN¯), m/z 44 (NH=CHO¯), and
m/z 71 (C2N2H3O¯) indicate an addition mechanism prior to a ring-opening fragmentation
process, signifying the presence of a covalent σ-adduct motif within the stabilized ion-dipole
complex.
Figure 8.2c displays the mass spectrum of the reaction of CH3O¯ + 1,3,5-triazine. The
major product ion of the reaction is the hydride transfer product of 1,3,5-triazine to produce a
hydride-Meisenheimer complex, C3H4N3¯ (m/z 82). This product was confirmed by an isotopic
shift (inset, Figure 8.2c) of m/z 82 to 83 for the reaction of CD3O¯ with 1,3,5-triazine.
Additional peaks show the presence of deprotonated 1,3,5-triazine at m/z 80, a stabilized species
at m/z 112, and minor peaks at m/z 26 and 44. CID of the stable species (Figure 8.2d) does not
reveal additional fragmentation pathways.
The presence of a ring-opening fragmentation pathway led to concerns that the C3H2N3¯
(m/z 80) species (Scheme 8.1) could be the intact 1,3,5-triazinide (1) and/or its ring-opened
structure (2). Hydrogen migration during ring opening may give rise to a second ring-opened
species (2’).
Scheme 8.1
Scheme 1. Intact and ring-opened C3H2N3¯ (m/z 80) species
N
N
N
N
C
N C
N
CH2N
C
N CH
N
CH
1 2 2'
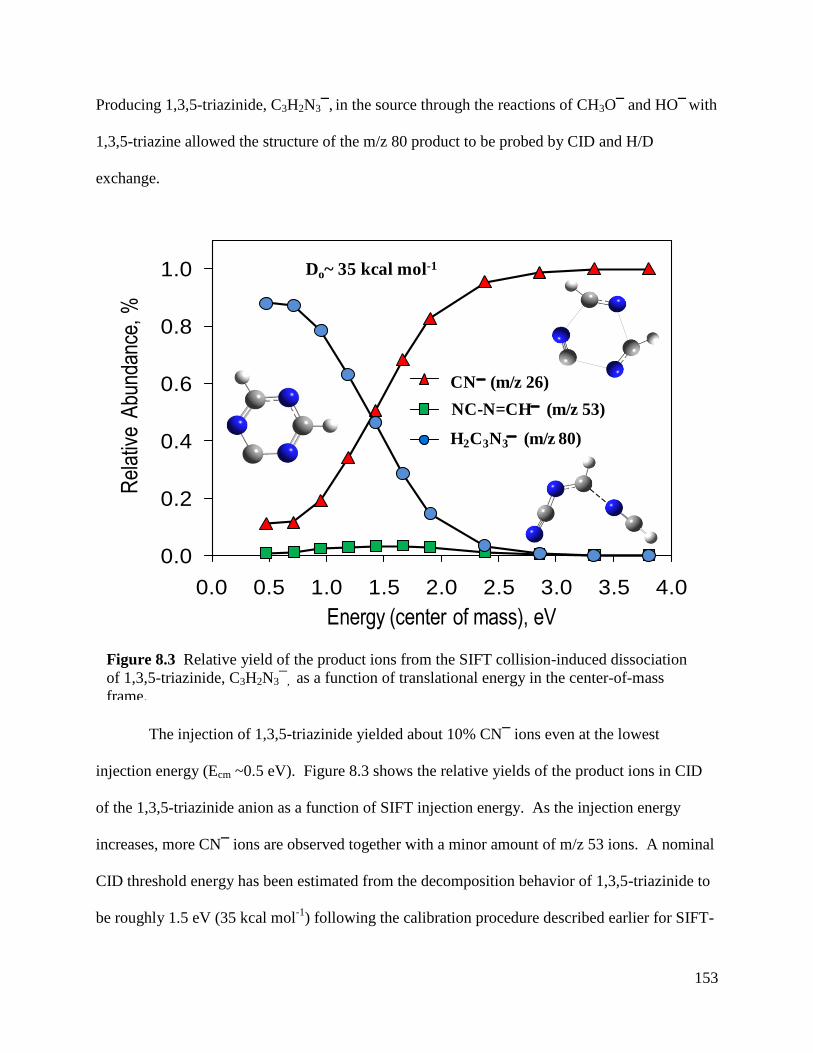
153
Producing 1,3,5-triazinide, C3H2N3¯, in the source through the reactions of CH3O¯ and HO¯ with
1,3,5-triazine allowed the structure of the m/z 80 product to be probed by CID and H/D
exchange.
The injection of 1,3,5-triazinide yielded about 10% CN¯ ions even at the lowest
injection energy (Ecm ~0.5 eV). Figure 8.3 shows the relative yields of the product ions in CID
of the 1,3,5-triazinide anion as a function of SIFT injection energy. As the injection energy
increases, more CN¯ ions are observed together with a minor amount of m/z 53 ions. A nominal
CID threshold energy has been estimated from the decomposition behavior of 1,3,5-triazinide to
be roughly 1.5 eV (35 kcal mol-1
) following the calibration procedure described earlier for SIFT-
Figure 8.3 Relative yield of the product ions from the SIFT collision-induced dissociation
of 1,3,5-triazinide, C3H2N3¯, as a function of translational energy in the center-of-mass
frame.
0.0
0.2
0.4
0.6
0.8
1.0
0.0 0.5 1.0 1.5 2.0 2.5 3.0 3.5 4.0
Rel
ativ
e A
bund
ance
, %
Energy (center of mass), eV
Do~ 35 kcal mol-1
0.0
0.2
0.4
0.6
0.8
1.0
0 10 20 30 40 50 60 70 80
Rel
ati
ve
Ab
un
da
nce
, %
Ecom (kcal mol-1)
H2C3N3― (m/z 80)
NC-N=CH― (m/z 53)
CN― (m/z 26)
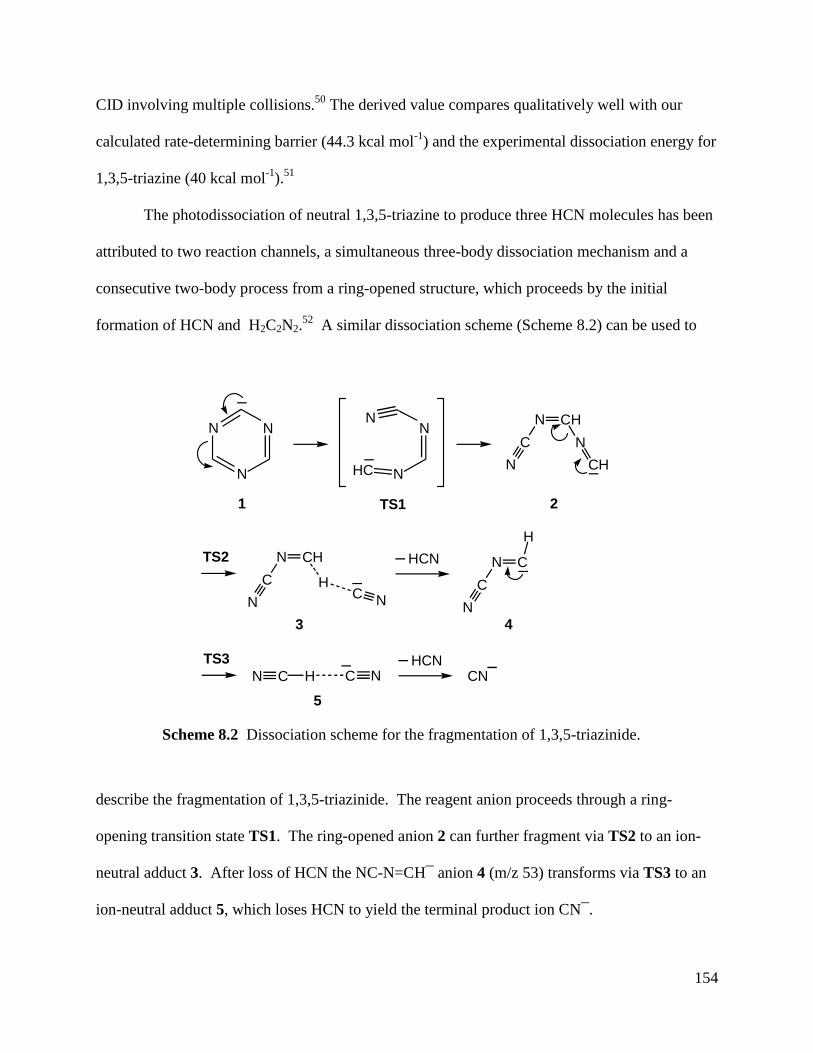
154
CID involving multiple collisions.50
The derived value compares qualitatively well with our
calculated rate-determining barrier (44.3 kcal mol-1
) and the experimental dissociation energy for
1,3,5-triazine (40 kcal mol-1
).51
The photodissociation of neutral 1,3,5-triazine to produce three HCN molecules has been
attributed to two reaction channels, a simultaneous three-body dissociation mechanism and a
consecutive two-body process from a ring-opened structure, which proceeds by the initial
formation of HCN and H2C2N2.52
A similar dissociation scheme (Scheme 8.2) can be used to
describe the fragmentation of 1,3,5-triazinide. The reagent anion proceeds through a ring-
opening transition state TS1. The ring-opened anion 2 can further fragment via TS2 to an ion-
neutral adduct 3. After loss of HCN the NC-N=CH¯ anion 4 (m/z 53) transforms via TS3 to an
ion-neutral adduct 5, which loses HCN to yield the terminal product ion CN¯.
Scheme 8.2 Dissociation scheme for the fragmentation of 1,3,5-triazinide.
N
N
N N
N
N
HC N
C
N CH
N
CH
N
C
N CH
HC
NN
C
N C
H
HCN
CN
TS1
TS2
1 2
3 4
N C H NC
5
HCNTS3
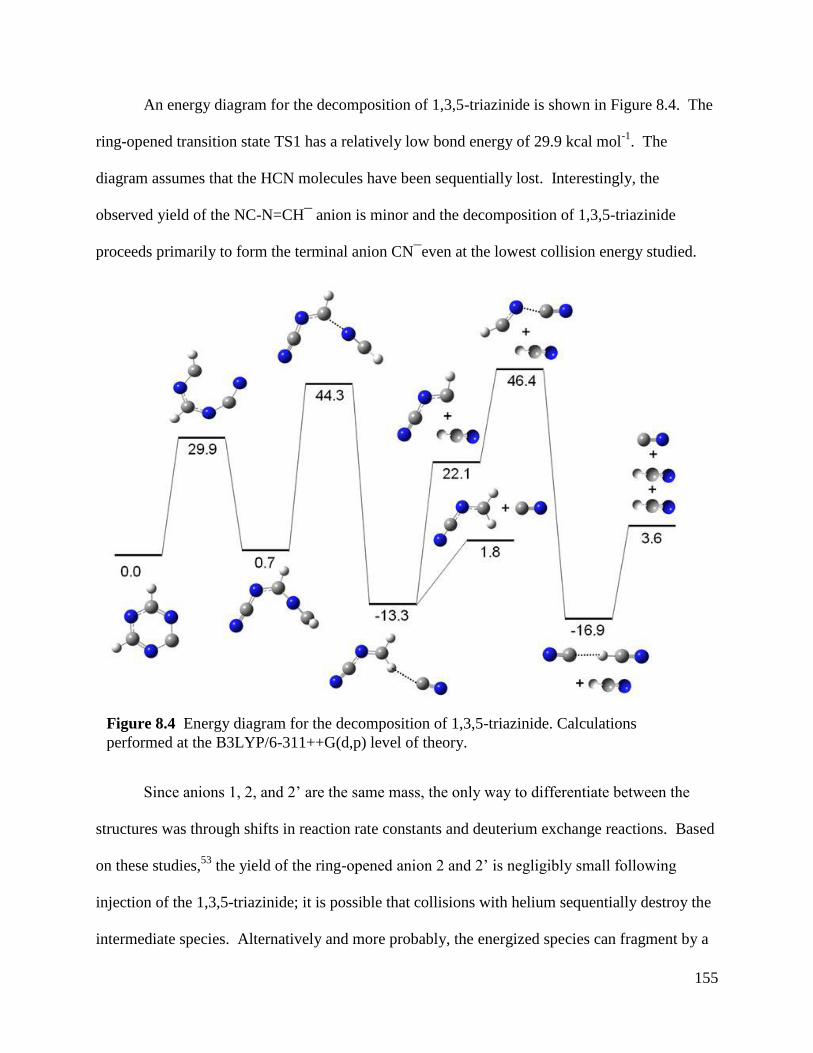
155
An energy diagram for the decomposition of 1,3,5-triazinide is shown in Figure 8.4. The
ring-opened transition state TS1 has a relatively low bond energy of 29.9 kcal mol-1
. The
diagram assumes that the HCN molecules have been sequentially lost. Interestingly, the
observed yield of the NC-N=CH¯ anion is minor and the decomposition of 1,3,5-triazinide
proceeds primarily to form the terminal anion CN¯even at the lowest collision energy studied.
Since anions 1, 2, and 2’ are the same mass, the only way to differentiate between the
structures was through shifts in reaction rate constants and deuterium exchange reactions. Based
on these studies,53
the yield of the ring-opened anion 2 and 2’ is negligibly small following
injection of the 1,3,5-triazinide; it is possible that collisions with helium sequentially destroy the
intermediate species. Alternatively and more probably, the energized species can fragment by a
Figure 8.4 Energy diagram for the decomposition of 1,3,5-triazinide. Calculations
performed at the B3LYP/6-311++G(d,p) level of theory.

156
multi-step and/or single-step process in which the species are stabilized by the complexation
energy of the fragment ion and neutral product. This stabilizing effect will significantly lower
the energy barriers in Figure 8.4.
The presence of a ring-opened structure was further evaluated using H/D exchange. This
technique allows the barrier for internal proton transfer or the proton affinity difference between
the two deprotonated species (i.e., DO¯ and C3H2N3¯ ) to be assessed. An endothermic gas
phase H/D exchange process can be driven by the complexation energy (ΔHcomplexation ~ 15-20
kcal mol-1
) within an ion-dipole complex. Based on the computational proton affinities at the
B3LYP/6-311++G** level of theory for the isomeric forms of 1,3,5-triazinide [386.7 kcal mol-1
for (1), 356.8 kcal mol-1
for (2), and 356.1 kcal mol-1
for (2’)] relative to the experimental proton
affinity of hydroxide [390.3 kcal mol-1
] the only ion-dipole complex capable of undergoing H/D
exchange is the ring-closed form (1) as shown in Scheme 8.1. Experimentally, the C3H2N3¯
anion formed from both HO¯ and CH3O¯ deprotonation showed two H/D exchanges with D2O
(inset, Figure 8.2a) strongly suggesting that the ring-closed structure (1) is the dominant species.
The experimental and computational data indicate that the mechanistic reaction pathways most
likely proceed through an intact 1,3,5-triazinide or triazine structure.
All of the carbanion [C4H7¯, C4H3N2¯, C4H3O¯, C5H4N¯, FC6H4¯, F2C6H3¯,
(CH3)2C6H3¯, (CH3)C4H2O¯ ] reactions with 1,3,5-triazine resulted almost exclusively in the
formation of a stabilized ion-dipole complex. CID of these carbanion complexes did not display
an addition-fragmentation pathway, only deprotonated forms of the anionic species. However,
the ratio of CID fragment ions did not correlate with relative proton affinities as would be
expected by kinetic method techniques. The method generally assumes that the peak intensities
157
reflect the difference in Gibbs free energy between the transition state of a proton-bound
complex and the two competing dissociation channels.
One would expect a decreasing ratio of carbanions to 1,3,5-triazinide as the proton affinity of the
carbanion increases; nonetheless, in all cases, a majority of the 1,3,5-triazinide (>90%) retained
the proton (see Appendix 3 for relative abundances). This deviation from thermodynamic
relationships indicates either a significant barrier to proton transfer or a non-proton bound form
of ion-dipole complex (this aspect is discussed below).
8.3.2 Reactivity of 1,3,5-Triazine
The gas phase reactions formed a number of primary and secondary products; the latter
tend to be anionic clusters with the neutral reactant. Table 8.1 lists the series of 1,3,5-triazine
(M) reactions along with the corresponding proton affinity54
of the reactant anion (X¯), the
overall rate constant, reaction efficiency, and the initial product ion distribution. The primary
product ions in Table 8.1 correspond to a proton transfer reaction, (M-H)¯, a stabilized anion-
arene complex (X¯∙M), a hydride transfer reaction (M+H)¯, and a fragmentation pathway
(m/z 26, 44, 71) originating from an SNAr process. The carbanion reactions displayed only
traces (< 1%) of deprotonated 1,3,5-triazine (M-H)¯. The m/z 44 peak is only observed in
reactions with oxyanions. The additional peak observed at m/z 71 for the reaction with HO¯
corresponds to a loss of HCN from the reactant ion-dipole complex (m/z 98).
Our data show both the proton transfer and the addition SNAr pathways to be active. This
is expected since the acidities of 1,3,5-triazine and the nucleophiles are similar as discussed in
the introduction. Variations in product ion distribution can be interpreted as a competition
between the exit channel for proton transfer and conversion within the ion-dipole complex.
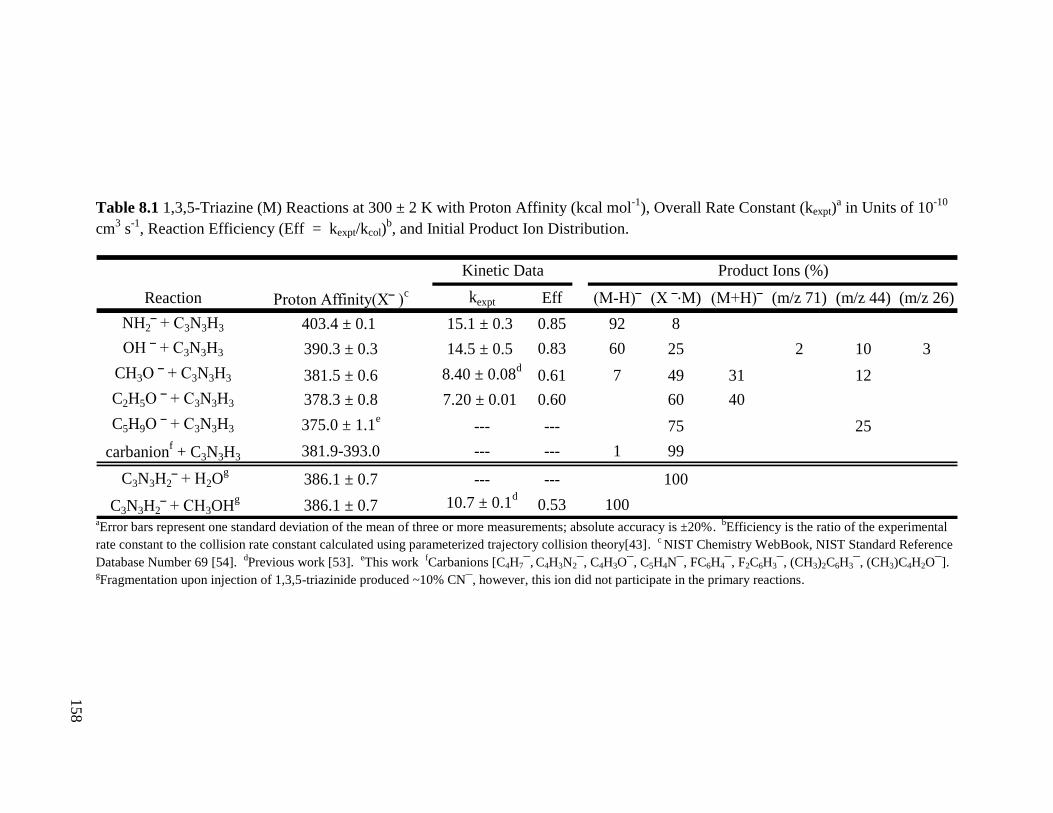
Table 8.1 1,3,5-Triazine (M) Reactions at 300 ± 2 K with Proton Affinity (kcal mol-1
), Overall Rate Constant (kexpt)a in Units of 10
-10
cm3 s
-1, Reaction Efficiency (Eff = kexpt/kcol)
b, and Initial Product Ion Distribution.
Reaction Proton Affinity(X‾ )c kexpt Eff (M-H)‾ (X ‾∙M) (M+H)‾ (m/z 71) (m/z 44) (m/z 26)
NH2‾ + C3N3H3 403.4 ± 0.1 15.1 ± 0.3 0.85 92 8
OH ‾ + C3N3H3 390.3 ± 0.3 14.5 ± 0.5 0.83 60 25 2 10 3
CH3O ‾ + C3N3H3 381.5 ± 0.6 8.40 ± 0.08d
0.61 7 49 31 12
C2H5O ‾ + C3N3H3 378.3 ± 0.8 7.20 ± 0.01 0.60 60 40
C5H9O ‾ + C3N3H3 375.0 ± 1.1e
--- --- 75 25
carbanionf + C3N3H3 381.9-393.0 --- --- 1 99
C3N3H2‾ + H2Og
386.1 ± 0.7 --- --- 100
C3N3H2‾ + CH3OHg
386.1 ± 0.7 10.7 ± 0.1d
0.53 100
Product Ions (%)Kinetic Data
aError bars represent one standard deviation of the mean of three or more measurements; absolute accuracy is ±20%.
bEfficiency is the ratio of the experimental
rate constant to the collision rate constant calculated using parameterized trajectory collision theory[43]. c NIST Chemistry WebBook, NIST Standard Reference
Database Number 69 [54]. dPrevious work [53].
eThis work
fCarbanions [C4H7¯,
C4H3N2¯, C4H3O¯, C5H4N¯, FC6H4¯, F2C6H3¯, (CH3)2C6H3¯, (CH3)C4H2O¯].
gFragmentation upon injection of 1,3,5-triazinide produced ~10% CN¯, however, this ion did not participate in the primary reactions.
158
159
Normally this competition is between exit channels, however the elimination step of the SNAr
mechanism for 1,3,5-triazine is thermodynamically inhibited since hydride is such a poor leaving
group. We will simplify our discussion by treating the stabilized anion-arene complex, (X¯∙M),
as a single isomer composed of the anionic σ-adduct. Although a small amount of the proton-
bound isomer exists, computations (see below) suggest that the Meisenheimer complex is
significantly lower in energy (consistent with the strong stabilizing effect of electron-
withdrawing nitrogen) than the H-bonded complex and would dominate a Boltzmann distribution
at equilibrium.
The product ion distributions for the gas phase anionic reactions with 1,3,5-triazine can
be interpreted as a competition between a proton transfer pathway and the addition mechanism of
the SNAr reaction. Most gas phase ion-molecule reaction mechanisms are represented by a
double-well potential energy curve55
where ion-dipole interactions form a potential minimum
before significant changes in chemical bonding occurs in the central barrier. Often, there is more
than one energetically accessible potential minimum within the reactant-ion dipole complex. As
the nucleophile (X¯) approaches the arene, either a H-bonding or an electrostatic interaction
develops along a minimum energy reaction pathway leading to two different reactant ion-dipole
complexes, an aryl H-bonded complex and a Meisenheimer complex. Most proton transfer
reactions have very low transition state barriers producing single-well reaction characteristics.
Based on this single-well feature, the reactivity of proton transfer has direct correlations with the
relative proton affinity of an anion. On the other hand, the SNAr (addition-elimination) reaction
proceeds by nucleophilic attack on an electrophilic carbon to produce a resonance-stabilized
Meisenheimer complex. (The hydride transfer reaction is an alternate pathway from the H-
bonded complex driven by the exothermic formation of an aldehyde, see pathway below.) A
160
conversion barrier between the two pathways is highly likely based on previously reported
calculations which suggest that large barriers may exist between binding motifs.56
The presence
of a conversion barrier is reasonable based on the large geometry changes and shifts in electron
density between the σ-adduct and H-bonded complexes. Based on this overall picture, when an
ion-dipole complex is formed there are three possible outcomes: dissociation back into reactants,
an ensuing proton/hydride transfer (if the exit barrier is low enough), or stabilization through
collisions with the carrier gas (if the lifetime of the complex is long enough).
As anticipated, there is a strong correlation between the degree of proton transfer and the
relative gas phase proton affinity between 1,3,5-triazinide (ΔacidH298 = 386.1 ± 0.7 kcal mol-1
)53
and the anions (non-carbon centered). The high proton affinity of NH2− (ΔacidH298 = 403.40 ±
0.10 kcal mol-1
)54
generates a highly exothermic pathway to the ammonia and triazinide
products. The proton transfer rate constant for reaction of amide with 1,3,5-triazine is kPT = 1.42
× 10-9
cm3 s
-1 (kPT = kexpt × branching fraction) with a reaction efficiency of 80%. With this large
thermodynamic driving force of 17.3 kcal mol-1
one would expect near collision rate reaction
efficiency. The lower reaction efficiency observed and the presence of a stable complex suggest
that conversion between the two reaction pathways is inhibited and reaction rates can be
influenced by the type of anion-arene complexes that are energetically accessible.
The proton transfer rate constant for reaction of HO¯ (ΔacidH298 = 390.3 ± 0.03 kcal
mol-1
)54
with 1,3,5-triazine is kPT = 8.70 × 10⁻¹⁰
cm3 s
-1 with a reaction efficiency of 50%. This
reaction is exothermic by only 4.2 kcal mol-1
and formation of the anionic σ-adduct becomes
competitive; the product ion ratios are 60% proton transfer and 40% Meisenheimer complex
(25% stable complex and 15% fragmentation). Proton transfer becomes endothermic by 4.6 kcal
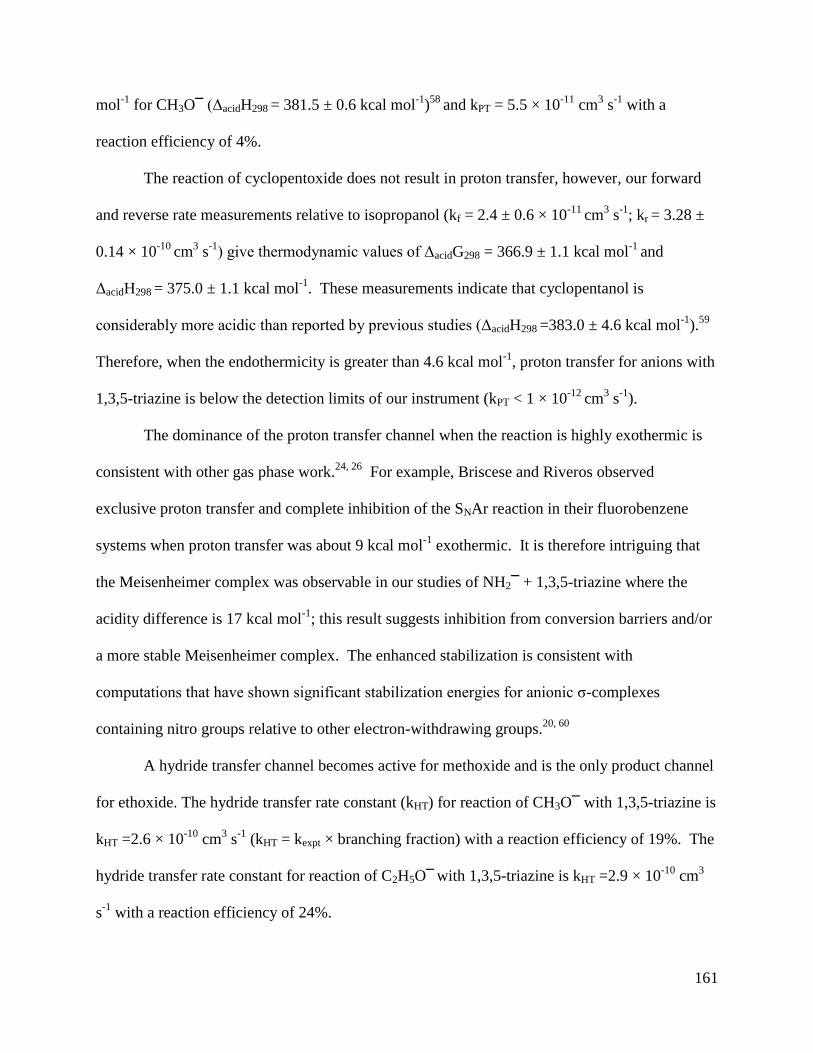
161
mol-1
for CH3O¯ (ΔacidH298 = 381.5 ± 0.6 kcal mol-1
)58
and kPT = 5.5 × 10⁻¹¹
cm3 s
-1 with a
reaction efficiency of 4%.
The reaction of cyclopentoxide does not result in proton transfer, however, our forward
and reverse rate measurements relative to isopropanol (kf = 2.4 ± 0.6 × 10⁻¹¹
cm3 s
-1; kr = 3.28 ±
0.14 × 10⁻¹⁰
cm3 s
-1) give thermodynamic values of ΔacidG298 = 366.9 ± 1.1 kcal mol
-1 and
ΔacidH298 = 375.0 ± 1.1 kcal mol-1
. These measurements indicate that cyclopentanol is
considerably more acidic than reported by previous studies (ΔacidH298 =383.0 ± 4.6 kcal mol-1
).59
Therefore, when the endothermicity is greater than 4.6 kcal mol-1
, proton transfer for anions with
1,3,5-triazine is below the detection limits of our instrument (kPT < 1 × 10-12
cm3 s
-1).
The dominance of the proton transfer channel when the reaction is highly exothermic is
consistent with other gas phase work.24, 26
For example, Briscese and Riveros observed
exclusive proton transfer and complete inhibition of the SNAr reaction in their fluorobenzene
systems when proton transfer was about 9 kcal mol-1
exothermic. It is therefore intriguing that
the Meisenheimer complex was observable in our studies of NH2¯ + 1,3,5-triazine where the
acidity difference is 17 kcal mol-1
; this result suggests inhibition from conversion barriers and/or
a more stable Meisenheimer complex. The enhanced stabilization is consistent with
computations that have shown significant stabilization energies for anionic σ-complexes
containing nitro groups relative to other electron-withdrawing groups.20, 60
A hydride transfer channel becomes active for methoxide and is the only product channel
for ethoxide. The hydride transfer rate constant (kHT) for reaction of CH3O¯ with 1,3,5-triazine is
kHT =2.6 × 10⁻¹⁰
cm3 s
-1 (kHT = kexpt × branching fraction) with a reaction efficiency of 19%. The
hydride transfer rate constant for reaction of C2H5O¯ with 1,3,5-triazine is kHT =2.9 × 10
-10 cm
3
s-1
with a reaction efficiency of 24%.
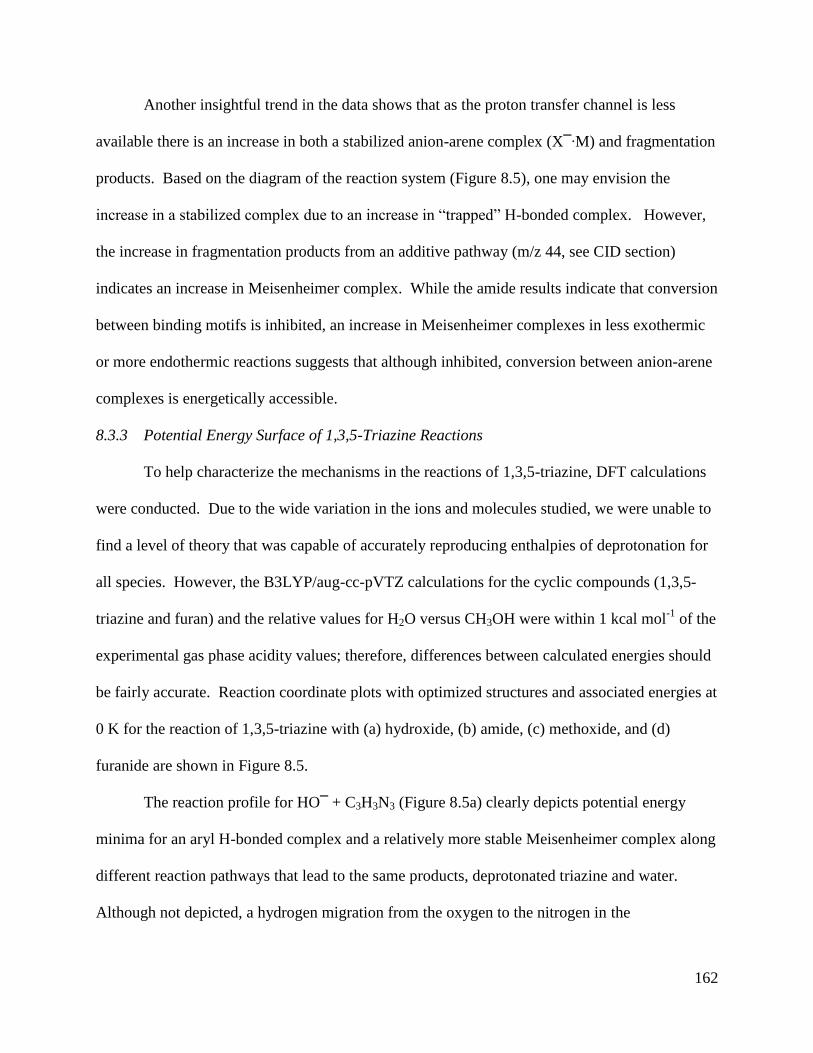
162
Another insightful trend in the data shows that as the proton transfer channel is less
available there is an increase in both a stabilized anion-arene complex (X¯∙M) and fragmentation
products. Based on the diagram of the reaction system (Figure 8.5), one may envision the
increase in a stabilized complex due to an increase in “trapped” H-bonded complex. However,
the increase in fragmentation products from an additive pathway (m/z 44, see CID section)
indicates an increase in Meisenheimer complex. While the amide results indicate that conversion
between binding motifs is inhibited, an increase in Meisenheimer complexes in less exothermic
or more endothermic reactions suggests that although inhibited, conversion between anion-arene
complexes is energetically accessible.
8.3.3 Potential Energy Surface of 1,3,5-Triazine Reactions
To help characterize the mechanisms in the reactions of 1,3,5-triazine, DFT calculations
were conducted. Due to the wide variation in the ions and molecules studied, we were unable to
find a level of theory that was capable of accurately reproducing enthalpies of deprotonation for
all species. However, the B3LYP/aug-cc-pVTZ calculations for the cyclic compounds (1,3,5-
triazine and furan) and the relative values for H2O versus CH3OH were within 1 kcal mol-1
of the
experimental gas phase acidity values; therefore, differences between calculated energies should
be fairly accurate. Reaction coordinate plots with optimized structures and associated energies at
0 K for the reaction of 1,3,5-triazine with (a) hydroxide, (b) amide, (c) methoxide, and (d)
furanide are shown in Figure 8.5.
The reaction profile for HO¯ + C3H3N3 (Figure 8.5a) clearly depicts potential energy
minima for an aryl H-bonded complex and a relatively more stable Meisenheimer complex along
different reaction pathways that lead to the same products, deprotonated triazine and water.
Although not depicted, a hydrogen migration from the oxygen to the nitrogen in the

Figure 8.5. Reaction coordinate plots for the reaction of 1,3,5-triazine with (a) hydroxide, (b) amide (c) methoxide, and (d) furanide.
Calculations at the B3LYP/aug-cc-pVTZ level of theory. Energy values at 0 K are relative to separated reactants (kcal mol-1
).
0.0
-11.5
8.2
-14.5
TSH-
++
-12.9
-7.3
TSH+
-20.9 +
-13.2
-29.1
0.0-3.5
-41.4
0.0 ++
-14.2
-9.5 -4.5 -11.0
0.0
-18.3 -18.9 -18.5
-1.3
-36.5
-15.4
++
0.0
-16.6 -16.3
-23.2
-15.2
-44.0
-15.7
+
+
a) b)
c) d)
HO¯ + C3H3N3 NH2¯ + C3H3N3
CH3O¯ + C3H3N3 C4H3O¯ + C3H3N3
163
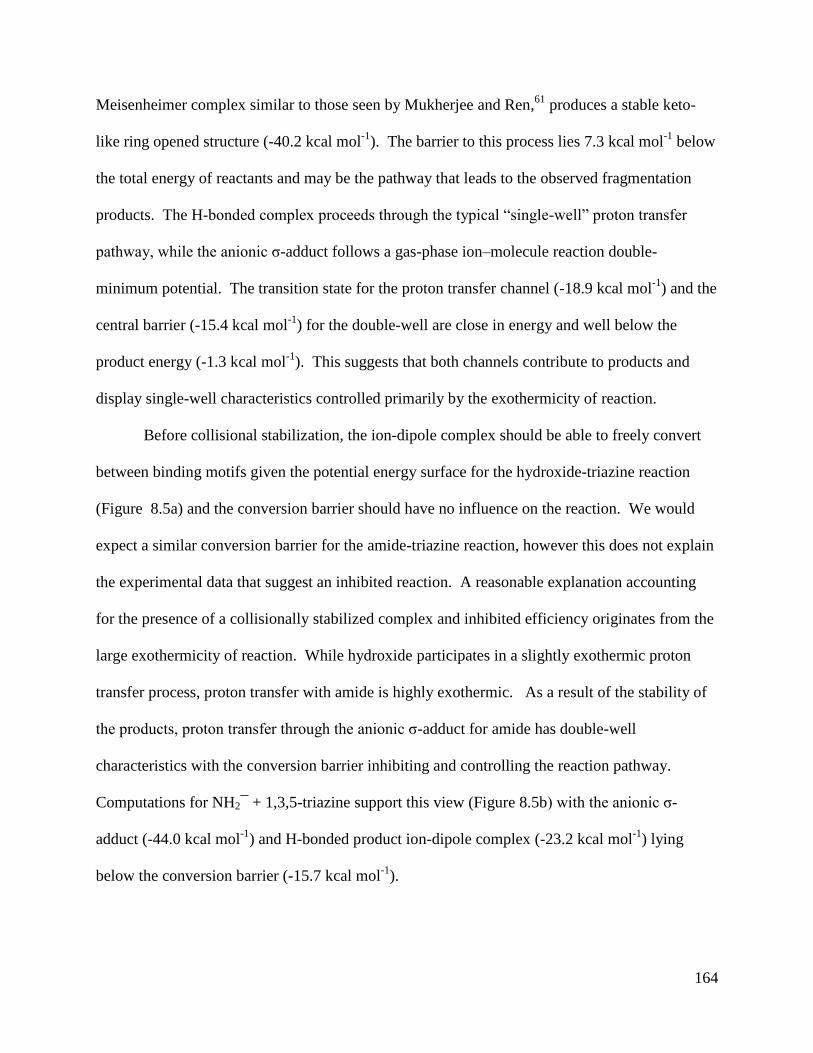
164
Meisenheimer complex similar to those seen by Mukherjee and Ren,61
produces a stable keto-
like ring opened structure (-40.2 kcal mol-1
). The barrier to this process lies 7.3 kcal mol-1
below
the total energy of reactants and may be the pathway that leads to the observed fragmentation
products. The H-bonded complex proceeds through the typical “single-well” proton transfer
pathway, while the anionic σ-adduct follows a gas-phase ion–molecule reaction double-
minimum potential. The transition state for the proton transfer channel (-18.9 kcal mol-1
) and the
central barrier (-15.4 kcal mol-1
) for the double-well are close in energy and well below the
product energy (-1.3 kcal mol-1
). This suggests that both channels contribute to products and
display single-well characteristics controlled primarily by the exothermicity of reaction.
Before collisional stabilization, the ion-dipole complex should be able to freely convert
between binding motifs given the potential energy surface for the hydroxide-triazine reaction
(Figure 8.5a) and the conversion barrier should have no influence on the reaction. We would
expect a similar conversion barrier for the amide-triazine reaction, however this does not explain
the experimental data that suggest an inhibited reaction. A reasonable explanation accounting
for the presence of a collisionally stabilized complex and inhibited efficiency originates from the
large exothermicity of reaction. While hydroxide participates in a slightly exothermic proton
transfer process, proton transfer with amide is highly exothermic. As a result of the stability of
the products, proton transfer through the anionic σ-adduct for amide has double-well
characteristics with the conversion barrier inhibiting and controlling the reaction pathway.
Computations for NH2¯ + 1,3,5-triazine support this view (Figure 8.5b) with the anionic σ-
adduct (-44.0 kcal mol-1
) and H-bonded product ion-dipole complex (-23.2 kcal mol-1
) lying
below the conversion barrier (-15.7 kcal mol-1
).

165
The reaction profile for CH3O¯ + C3H3N3 (Figure 8.5c) also indicates the presence of an
aryl H-bonded complex and a relatively more stable Meisenheimer complex. The H-bonded
complex and anionic σ-adduct follow single-well characteristics to proton transfer products and a
double-well potential leading to hydride transfer products. The proton transfer process is
endothermic and is expected to be extremely slow. The alternate hydride transfer pathway is
exothermic by 12.9 kcal mol-1
and should be the dominant channel kinetically controlled by the
slightly higher central barrier (-7.3 kcal mol-1
). This relationship is observed in the product ion
ratios of 7% proton transfer and 31% hydride transfer.
The presence of a hydride transfer pathway is intriguing, since often competing processes
can interfere with detection of this mechanism. Hydride transfer involves motion of a proton
with an electron pair between electron deficient sites. The hydride affinities for closed shell
neutrals range from 6 to 106 kcal mol-1
.62
Our computations suggest that the hydride affinity of
1,3,5-triazine is 52 kcal mol-1
(similar to acrylonitile, C3H3N, at 56 kcal mol-1
)62
indicating a
moderately strong bonding interaction between the 1s2 electrons of the hydride and the π*
orbitals. Gronert and Keeffe discuss this “in phase” interaction within a three-nuclei (C∙∙∙H∙∙∙C)
transition state framework in terms of maxim overlap to account for non-linear geometries.41
Our calculated bond angle (157°) and HOMO for the methoxide reaction depict this type of
constructive interaction. Weak hydrogen bonding between the oxygen of the anion and the
hydrogen attached to the carbon at the site of attack may facilitate this orientation of the
transition state as well as lower the overall energy. In addition to high hydrogen binding
energies, hydride acceptors tend to have high electron binding energies. Computations suggest
that the electron-withdrawing character of –CN and –NO2 groups produce very stable hydride
adducts corresponding to positive electron affinities (2.4 kcal mol-1
and 27.7 kcal mol-1
,
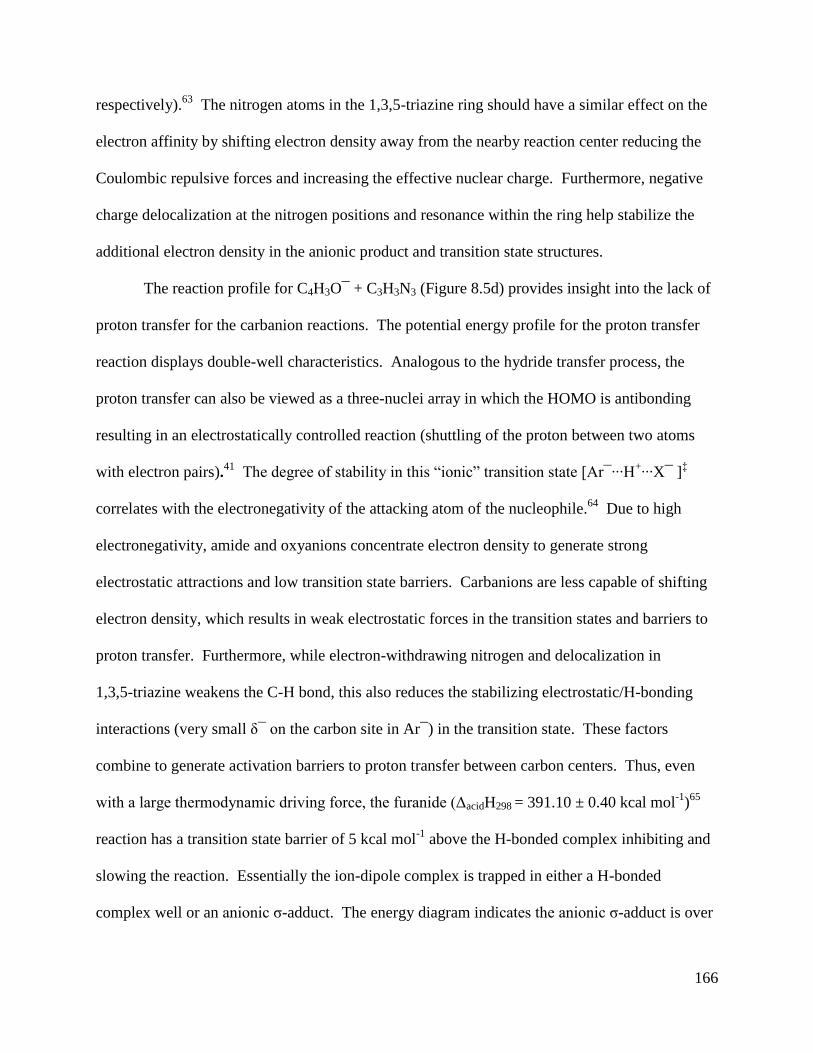
166
respectively).63
The nitrogen atoms in the 1,3,5-triazine ring should have a similar effect on the
electron affinity by shifting electron density away from the nearby reaction center reducing the
Coulombic repulsive forces and increasing the effective nuclear charge. Furthermore, negative
charge delocalization at the nitrogen positions and resonance within the ring help stabilize the
additional electron density in the anionic product and transition state structures.
The reaction profile for C4H3O¯ + C3H3N3 (Figure 8.5d) provides insight into the lack of
proton transfer for the carbanion reactions. The potential energy profile for the proton transfer
reaction displays double-well characteristics. Analogous to the hydride transfer process, the
proton transfer can also be viewed as a three-nuclei array in which the HOMO is antibonding
resulting in an electrostatically controlled reaction (shuttling of the proton between two atoms
with electron pairs).41
The degree of stability in this “ionic” transition state [Ar¯∙∙∙H+∙∙∙X¯ ]
‡
correlates with the electronegativity of the attacking atom of the nucleophile.64
Due to high
electronegativity, amide and oxyanions concentrate electron density to generate strong
electrostatic attractions and low transition state barriers. Carbanions are less capable of shifting
electron density, which results in weak electrostatic forces in the transition states and barriers to
proton transfer. Furthermore, while electron-withdrawing nitrogen and delocalization in
1,3,5-triazine weakens the C-H bond, this also reduces the stabilizing electrostatic/H-bonding
interactions (very small δ¯ on the carbon site in Ar¯) in the transition state. These factors
combine to generate activation barriers to proton transfer between carbon centers. Thus, even
with a large thermodynamic driving force, the furanide (ΔacidH298 = 391.10 ± 0.40 kcal mol-1
)65
reaction has a transition state barrier of 5 kcal mol-1
above the H-bonded complex inhibiting and
slowing the reaction. Essentially the ion-dipole complex is trapped in either a H-bonded
complex well or an anionic σ-adduct. The energy diagram indicates the anionic σ-adduct is over
167
30 kcal mol-1
more stable than the H-bonded complex, and therefore is statistically favored. This
trapping of the ion-dipole complex prohibits thermodynamically controlled conversion between
proton bound forms resulting in the lack of deprotonated 1,3,5-triazine in our CID studies.
One final aspect revealed in our computations (see Appendix 4 for specific bond lengths
and angles of the Meisenheimer complexes) is the slight distortion of the aromatic ring (sp3 bond
angle character range of the Nu―C―H bonds was 99-108°, and the dihedral angle range of the
CNu―plane of ring was 7-10°, where CNu is the site of nucleophilic addition) and the short
adduct bond lengths (< 1.5 Å, covalent). Therefore, all of the Meisenheimer complexes formed
are in the strong σ-adduct category. This result is expected due to the high bond energies
associated with C-N, C-C, and C-O bonds. In addition, the exceptionally high stability of these
adducts is generated by the symmetric nature of the ring where most of the electron density is
localized at the nitrogen positions, thereby delocalizing the charge over the entire ring.
8.4 Conclusion
Our investigation of the reactions of 1,3,5-triazine has provided a more detailed
understanding of the influence of anion-arene interactions on mechanisms and product
distributions in the gas phase. Analysis of reactivity trends, collision-induced fragmentation
processes and H/D exchange experiments revealed intriguing structure-reactivity relationships
generated by the electron-withdrawing character of the heteroaromatic nitrogen. The major
conclusions drawn from this work include the following.
(7) A multi-step and/or single-step ring-opening collision-induced fragmentation appears to
exist for 1,3,5-triazinide, similar to the photodissociation pathways reported for neutral
1,3,5-triazine.

168
(8) The electron-withdrawing nitrogen atoms in the 1,3,5-triazine ring significantly reduce
Coulombic repulsive forces to generate extremely electrophilic carbon centers. The
presence of a major hydride transfer process indicates the strength of this effect.
(9) The symmetric nature of the nitrogen atoms in the ring allows stabilization of the
negative charge density in the anionic products through delocalization over the entire
ring. This effect is manifested in the high stability of the strong covalent σ-adducts.
(10) The SNAr addition pathway in 1,3,5-triazine is competitive over a wider range of relative
gas phase acidity differences than previously reported for other aromatic systems.
(11) Our data suggest that the type of interactions initially formed in the loose anion-arene
complexes and the transition state barriers between binding motifs can significantly
influence competition between different channels which may be operative in gas-phase
reactions.

169
8.5 References
1. Agrawal, J. P. Progr. Energy Combust. Sci. 1998, 24, 1-30.
2. Alves, W. A. Vib. Spectrosc.2010, 53, 285-288.
3. Ali, T. E. S. Eur. J. Med. Chem. 2009, 44, 4385-4392.
4. Pelizzetti, E.; Maurino, V.; Minero, C.; Carlin, V.; Pramauro, E.; Zerbinati, O.; Tosato,
M. L. Environ. Sci. Technol. 1990, 24, 1559-1565.
5. Eisa, H. M.; Tantawy, A. S.; Elkerdawy, M. M. Pharmazie 1991, 46, 182-184.
6. Klenke, B.; Stewart, M.; Barrett, M. P.; Brun, R.; Gilbert, I. H. J. Med. Chem. 2001, 44,
3440-3452.
7. Valet, A. Prog. Org. Coat. 1999, 35, 223-233.
8. Rogers, J.; Moyer, B.; Kalscheur, G.; Emig, N. JCT Coatingstech 2007, 4, 82-86.
9. Turker, L.; Atalar, T.; Gumus, S.; Camur, Y. J. Hazard. Mater. 2009, 167, 440-448.
10. Berryman, O. B.; Johnson, D. W. Chem. Commun. 2009, 22, 3143-3153.
11. Wheeler, S. E.; Houk, K. N. J. Phys. Chem. A 2010,114, 8658-8664.
12. Ciesielski, A.; Krygowski, T. M.; Cyranski, M. K.; Dobrowolski, M. A.; Balaban, A. T.
J. Chem. Inf. Model. 2009, 49, 369-376.
13. Katritzky, A. R.; Barczynski, P.; Musumarra, G.; Pisano, D.; Szafran, M. J. Am. Chem.
Soc. 1989, 111, 7-15.
14. Schlosser, M.; Ruzziconi, R. Synthesis-Stuttgart 2010, 13, 2111-2123.
15. Mąkosza, M. Russ. Chem. Bull. 1996, 45, 491-504.
16. Dillow, G. W.; Kebarle, P. J. Am. Chem. Soc. 1988, 110, 4877-4882.
17. Zheng, Y. J.; Ornstein, R. L. J. Am. Chem. Soc. 1997, 119, 648-655.
18. Giroldo, T.; Xavier, L. A.; Riveros, J. M. Angew. Chem. 2004, 43, 3588-3590.
19. Chiavarino, B.; Crestoni, M. E.; Fornarini, S.; Lanucara, F.; Lemaire, J.; Maitre, P.
Angew. Chem. 2007, 46, 1995-1998.
20. Fernandez, I.; Frenking, G.; Uggerud, E. J. Org. Chem. 2010, 75, 2971-2980.
21. Hay, B. P.; Bryantsev, V. S. Chem. Commun. 2008, 21, 2417-2428.
22. Hiraoka, K.; Mizuse, S.; Yamabe, S. J. Phys. Chem. 1987, 91, 5294-5297.
23. Chiavarino, B.; Crestoni, M. E.; Fornarini, S.; Lanucara, F.; Lemaire, J.; Maitre, P.;
Scuderi, D. Chem.-Eur. J. 2009, 15, 8185-8195.
24. Briscese, S. M. J.; Riveros, J. M. J. Am. Chem. Soc. 1975, 97, 230-231.
25. Schneider, H.; Vogelhuber, K. M.; Schinle, F.; Weber, J. M. J. Am. Chem. Soc. 2007,
129, 13022-13026.
26. Chen, H.; Chen, H. W.; Cooks, R. G. J. Am. Soc. Mass Spectrom. 2004, 15, 998-1004.
27. Paul, G. J. C.; Kebarle, P. J. Am. Chem. Soc. 1991, 113, 1148-1154.
28. Danikiewicz, W.; Bienkowski, T.; Kozlowska, D.; Zimnicka, M. J. Am. Soc. Mass
Spectrom. 2007, 18, 1351-1363.
29. Ingemann, S.; Nibbering, N. M. M.; Sullivan, S. A.; DePuy, C. H. J. Am. Chem. Soc.
1982, 104, 6520-6527.
30. Khan, H.; Harris, R. J.; Barna, T.; Craig, D. H.; Bruce, N. C.; Munro, A. W.; Moody, P.
C. E.; Scrutton, N. S. J. Biol. Chem. 2002, 277, 21906-21912.
31. Behrend, C.; Heesche-Wagner, K. Appl. Environ. Microbiol. 1999, 65, 1372-1377.
32. Vorbeck, C.; Lenke, H.; Fischer, P.; Knackmuss, H. J. J. Bacteriol. 1994, 176, 932-
934.

170
33. Ziganshin, A. M.; Gerlach, R.; Borch, T.; Naumov, A. V.; Naumova, R. P. Appl. Environ.
Microbiol. 2007, 73, 7898-7905.
34. Rieger, P. G.; Sinnwell, V.; Preuss, A.; Francke, W.; Knackmuss, H. J. J. Bacteriol.
1999, 181, 1189-1195.
35. Yinon, J.; Johnson, J. V.; Bernier, U. R.; Yost, R. A.; Mayfield, H. T.; Mahone, W. C.;
Vorbeck, C. J. Mass Spectrom. 1995, 30, 715-722.
36. Artau, A.; Ho, Y.; Kenttamaa, H.; Squires, R. R. J. Am. Chem. Soc. 1999, 121, 7130-
7137.
37. DePuy, C. H.; Bierbaum, V. M.; Schmitt, R. J.; Shapiro, R. H. J. Am. Chem. Soc. 1978,
100, 2920-2921.
38. Ingemann, S.; Kleingeld, J. C.; Nibbering, N. M. M. J. Chem. Soc., Chem. Commun.
1982, 17, 1009-1011.
39. Bernasconi, C. F.; Stronach, M. W.; DePuy, C. H.; Gronert, S. J. Phys. Org. Chem. 1990,
3, 346-348.
40. Bernasconi, C. F.; Stronach, M. W.; DePuy, C. H.; Gronert, S. J. Am. Chem. Soc. 1990,
112, 9044-9052.
41. Gronert, S.; Keeffe, J. R. J. Am. Chem. Soc. 2005, 127, 2324-2333.
42. Van Doren, J. M.; Barlow, S. E.; DePuy, C. H.; Bierbaum, V. M. Int. J. Mass Spectrom.
Ion Processes 1987, 81, 85-100.
43. Su, T.; Chesnavich, W. J. J. Chem. Phys. 1982, 76, 5183-5185.
44. Kato, S.; Lineberger, W. C.; Bierbaum, V. M. Int. J. Mass Spectrom. 2007, 266, 166-179.
45. Blanksby, S. J.; Kato, S.; Bierbaum, V. M.; Ellison, G. B. Aust. J. Chem. 2003, 56, 459-
472.
46. Custer, T. G.; Kato, S.; Fall, R.; Bierbaum, V. M. Int. J. Mass Spectrom. 2003, 223, 427-
446.
47. Kato, S.; DePuy, C. H.; Gronert, S.; Bierbaum, V. M. J. Am. Soc. Mass Spectrom. 1999,
10, 840-847.
48. DePuy, C. H.; Kato, S. H/D Exchange Reactions. In Encyclopedia of Mass Spectrometry:
Theory and Ion Chemistry, Armentrout, P. B., Ed. Elsevier: Amsterdam, 2003; Vol. 1, pp
670-674.
49. Gaussian 03 (Revision-B.05), Frish, M. J.; Trucks, G. W.; Schlegel, H. B.; Scuseria, G.
E.; Robb, M. A.; Cheeseman, J. R.; Montgomery, J. J. A.; Vreven, T.; Kudin, K. N.;
Burant, J. C.; Millam, J. M.; Iyengar, S. S.; Tomasi, J.; Barone, V.; Mennucci, B.; Cossi,
M.; Scalmani, G.; Rega, N.; Petersson, G. A.; Nakatsuji, H.; Hada, M.; Ehara, M.;
Toyota, K.; Fukuda, R.; Hasegawa, J.; Ishida, M.; Nakajima, T.; Honda, Y.; Kitao, O.;
Nakai, H.; Klene, M.; Li, X.; Knox, J. E.; Hratchian, H. P.; Cross, J. B.; Bakken, V.;
Adamo, C.; Jaramillo, J.; Gomperts, R.; Stratmann, R. E.; Yazyev, O.; Austin, A. J.;
Cammi, R.; Pomelli, C.; Ochterski, J. W. A., P. Y.; Morokuma, K.; Voth, G. A.;
Salvador, P.; Dannenberg, J. J.; Zakrzewski, V. G.; Dapprich, S.; Daniels, A. D.; Strain,
M. C.; Farkas, O.; Malick, D. K.; Rabuck, A. D.; Raghavachari, K.; Foresman, J. B.;
Ortiz, J. V.; Cui, Q.; Baboul, A. G.; Clifford, S.; Cioslowski, J.; Stefanov, B. B.; Liu, G.;
Liashenko, A.; Piskorz, P.; Komaromi, I.; Martin, R. L.; Fox, D. J.; Keith, T.; Al-Laham,
M. A.; Peng, C. Y.; Nanayakkara, A.; Challacombe, M.; Gill, P. M. W.; Johnson, B.;
Chen, W.; Wong, M. W.; Gonzalez, C.; Pople, J. A.; Gaussian, Inc.: Pittsburgh, PA,
2004.

171
50. Ichino, T.; Gianola, A. J.; Kato, S.; Bierbaum, V. M.; Lineberger, W. C. J. Phys. Chem. A
2007, 111, 8374-8383.
51. Wiberg, K. B.; Nakaji, D.; Breneman, C. M. J. Am. Chem. Soc. 1989, 111, 4178-4190.
52. Dyakov, Y. A.; Mebel, A. M.; Lin, S. H.; Lee, Y. T.; Ni, C. K. J. Phys. Chem. A 2007,
111, 9591-9599.
53. Wren, S. W.; Vogelhuber, K. M.; Garver, J. M.; Kato, S.; Sheps, L.; Bierbaum, V. M.;
Lineberger, W. C. In preparation
54. Bartmess, J. E. "Negative Ion Energetics Data" in NIST Chemistry WebBook, NIST
Standard Reference Database Number 69, Eds. Linstrom, P.J and Mallard, W.G.,
National Institute of Standards and Technology, Gaithersburg MD, 20899,
http://webbook.nist.gov.
55. Olmstead, W. N.; Brauman, J. I. J. Am. Chem. Soc. 1977, 99, 4219-4228.
56. Dotterer, S. K.; Harris, R. L. J. Org. Chem. 1988, 53, 777-779.
57. Wickhamjones, C. T.; Ervin, K. M.; Ellison, G. B.; Lineberger, W. C. J. Chem. Phys.
1989, 91, 2762-2763.
58. Ervin, K. M.; DeTuro, V. F. J. Phys. Chem. A 2002, 106, 9947-9956.
59. Alconcel, L. S.; Continetti, R. E. Chem. Phys. Lett. 2002, 366, 642-649.
60. Glukhovtsev, M. N.; Bach, R. D.; Laiter, S. J. Org. Chem. 1997, 62, 4036-4046.
61. Mukherjee, S.; Ren, J. H. J. Am. Soc. Mass Spectrom. 2010, 21, 1720-1729.
62. Goebbert, D. J.; Wenthold, P. G. Int. J. Mass Spectrom. 2006, 257, 1-11.
63. Vianello, R.; Peran, N.; Maksic, Z. B. Eur. J. Org. Chem. 2007, 3, 526-539.
64. Keeffe, J. R.; Gronert, S.; Colvin, M. E.; Tran, N. L. J. Am. Chem. Soc. 2003, 125,
11730-11745.
65. Clifford, E. P.; Wenthold, P. G.; Lineberger, W. C.; Ellison, G. B.; Wang, C. X.;
Grabowski, J. J.; Vila, F.; Jordan, K. D. J. Chem. Soc., Perkin Trans. 2 1998, 5, 1015-
1022.
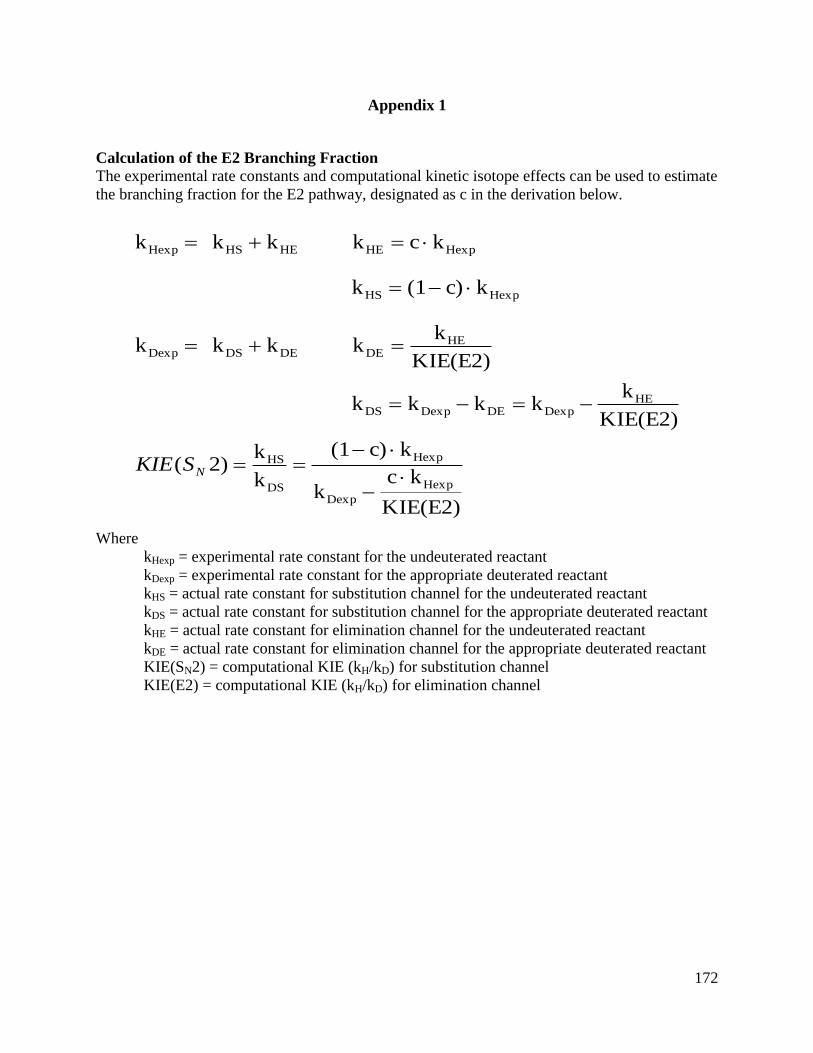
172
Appendix 1
Calculation of the E2 Branching Fraction The experimental rate constants and computational kinetic isotope effects can be used to estimate
the branching fraction for the E2 pathway, designated as c in the derivation below.
KIE(E2)
kck
kc)(1
k
k)2(
KIE(E2)
kkkkk
KIE(E2)
kkkkk
kc)(1k
kckkkk
Hexp
Dexp
Hexp
DS
HS
HEDexpDEDexpDS
HEDEDEDSDexp
HexpHS
HexpHEHEHSHexp
NSKIE
Where
kHexp = experimental rate constant for the undeuterated reactant
kDexp = experimental rate constant for the appropriate deuterated reactant
kHS = actual rate constant for substitution channel for the undeuterated reactant
kDS = actual rate constant for substitution channel for the appropriate deuterated reactant
kHE = actual rate constant for elimination channel for the undeuterated reactant
kDE = actual rate constant for elimination channel for the appropriate deuterated reactant
KIE(SN2) = computational KIE (kH/kD) for substitution channel
KIE(E2) = computational KIE (kH/kD) for elimination channel
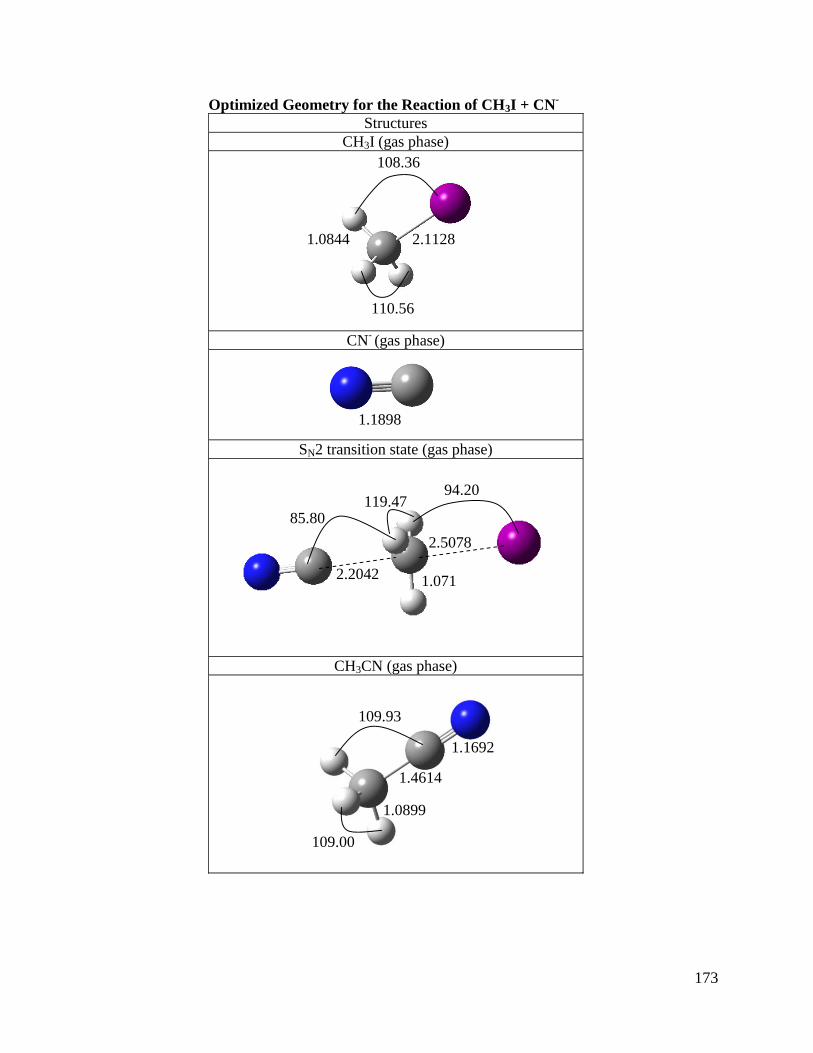
173
Optimized Geometry for the Reaction of CH3I + CN-
Structures
CH3I (gas phase)
CN- (gas phase)
SN2 transition state (gas phase)
CH3CN (gas phase)
110.56
108.36
2.1128 1.0844
1.4614
1.1692
109.93
109.00
1.0899
94.20
85.80 119.47
2.5078
2.2042 1.071
1.1898
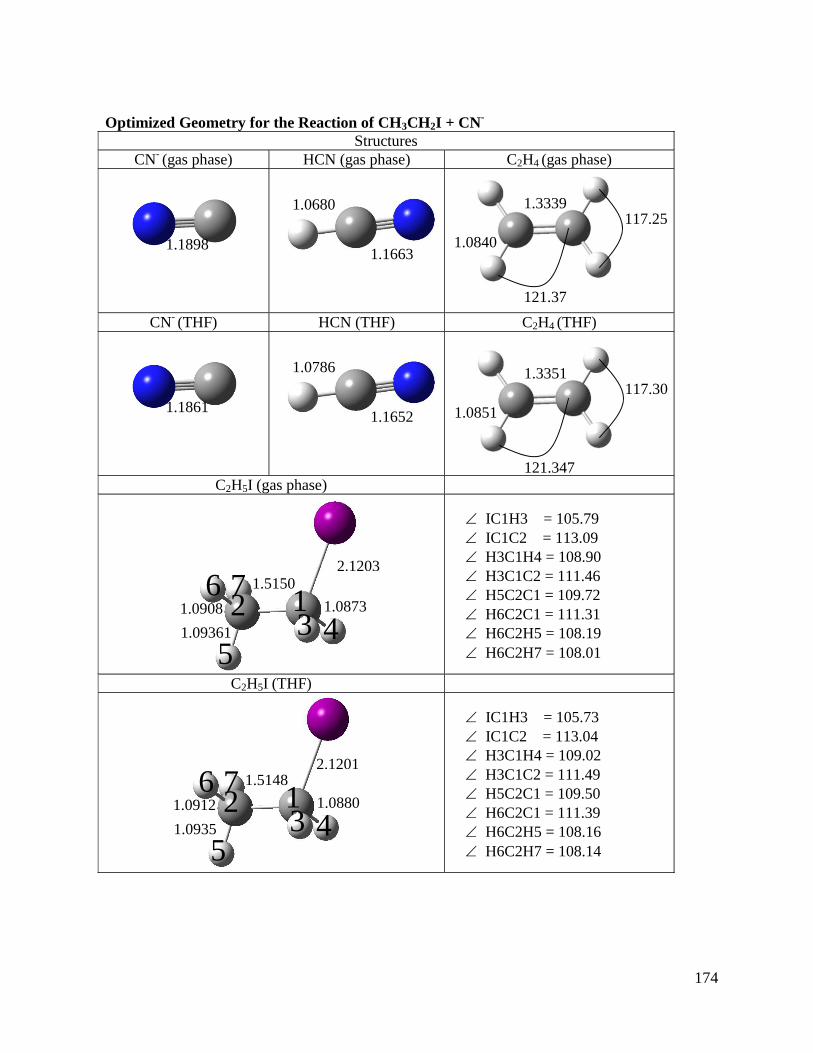
174
Optimized Geometry for the Reaction of CH3CH2I + CN-
Structures
CN- (gas phase) HCN (gas phase) C2H4 (gas phase)
CN- (THF) HCN (THF) C2H4 (THF)
C2H5I (gas phase)
C2H5I (THF)
1.1898 1.1663
1.0680 1.3339
1.0840
121.37
117.25
2.1203
1.0873
1.5150
1.09361
1.0908 1 2 3 4
5
6 7
IC1H3 = 105.79
IC1C2 = 113.09
H3C1H4 = 108.90
H3C1C2 = 111.46
H5C2C1 = 109.72
H6C2C1 = 111.31
H6C2H5 = 108.19
H6C2H7 = 108.01
2.1201
2
1.0880
1.5148
1.0935
1.0912
1
1 2 3 4
5
6 7
IC1H3 = 105.73
IC1C2 = 113.04
H3C1H4 = 109.02
H3C1C2 = 111.49
H5C2C1 = 109.50
H6C2C1 = 111.39
H6C2H5 = 108.16
H6C2H7 = 108.14
1.1861 1.1652
1.0786
2 1.3351
`
1.0851
91.084
0
121.347
117.30

175
Optimized Geometry for the Reaction of CH3CH2I + CN-
Structures
C2H5CN (gas phase)
C2H5CN (THF)
E2 transition state (gas phase)
C8C1H3 = 108.14
C8C1C2 = 111.83
C1C8N = 179.02
H3C1H4 = 107.15
H3C1C2 = 110.71
H5C2C1 = 109.85
H6C2C1 = 110.69
H6C2H5 = 108.60
H6C2H7 = 108.32 1.0905
1 2 3 4
5
6 7 8
1.1700
1.4645
1.0925
1.0903
1.5323
2.4514
1.1791 1.3503
1.4768
1.4132
1.0906
1.0853
1
2 8
3 4
5 6
7
H6C2H7 = 112.77
H3C1H4 = 112.71
H6C2H5 = 101.31
C1C2H5 = 104.84
C2H5C8 = 172.48
H5C8N = 177.41
H3C1C2 = 116.06
H3C1I = 94.40
C8C1H3 = 107.83
C8C1C2 = 111.81
C1C8N = 179.29
H3C1H4 = 107.36
H3C1C2 = 110.91
H5C2C1 = 109.44
H6C2C1 = 110.79
H6C2H5 = 108.59
H6C2H7 = 108.59 1.0904
1 2 3 4
5
6 7 8
1.1695
1.4634
1.0935
1.0906
1.5323

176
Optimized Geometry for the Reaction of CH3CH2I + CN-
Structures
SN2 transition state(gas phase)
SN2 transition state (THF)
2.5542 2.2143
1.1846
1.0884 1.0893
1.0715
1.5136
1
2
8 3
6 5 C1C7H5 = 111.05
C1C2H6 = 109.98
H6C2H5 = 107.37
H3C1H4 = 117.82
H3C1C2 = 120.82
H3C1I = 89.73
H3C1C8 = 82.88
C1C8I = 165.58
NC8C1 = 178.82
2.5753 2.1872
1.1833
1.0881
8
1.0889
1.0732
1.5126
1
2
8 3
6 5 C1C2H5 = 111.17
C1C2H6 = 110.18
H6C2H5 = 108.67
H3C1H4 = 117.96
H3C1C2 = 120.91
H3C1I = 89.72
H3C1C8 = 83.50
C1C8I =164.26
NC8C1 = 175.09

177
Appendix 2
Exothermicities (fH298 taken from NIST WebBook) and Computational Reaction
Barriersa (MP2/6-311++G(2d,p) for C, N, and H and the LanL2DZ effective core potential
for I) relative to the separated reactants.
Reaction ΔHrxn SN2
(kcal mol-1)
ΔH‡ SN2
(kcal mol-1)
ΔHrxn E2
(kcal mol-1)
ΔH‡ E2 (kcal
mol-1)
SN2
preference
(kcal mol-1)
Cl- + CH3I -13.9 6.2 --- --- ---
Cl- + C2H5I -14.8 9.4 1.5 16.0 6.6
Cl- + i -C3H7I -14.6 11.9 -0.5 14.6 2.7
Cl- + t -C4H9I -16.5 23.1 0.2 13.1 -10.00.0
CN- + CH3I -48.0 3.2 --- --- ---
CN- + C2H5I -48.3 7.5 -16.0 11.0 3.5
CN- + i -C3H7I -49.5 12.1 -17.8 10.3 -1.8
CN- + t -C4H9I -46.0 25.4 -17.2 14.5 -10.90.0
HS- + CH3I -34.3 0.1 --- --- ---
HS- + C2H5I -34.7 2.8 -16.2 9.0 6.2
HS- + i -C3H7I -36.4 6.6 -18.1 8.2 1.6
HS- + t -C4H9I -34.2 20.8 -17.4 6.6 -14.2
aWhen the SN2 barrier heights are above the energy of the reactants, the reaction rate constants are expected to be
very low. Based on our reaction efficiencies the absolute values of the computational barrier heights are too high.
While higher levels of theory might improve the quantitative accuracy of our reaction barriers, our focus is on
qualitative comparisons to experimental data. Therefore, our methodology only employs quantitative ratios of
energies and discusses trends in geometry and charge distribution which are less sensitive to the level of theory
employed. Reasonably good agreement of the computational KIE with the experimental SN2 KIEs and estimated
product distributions indicates that the theoretical level is adequate for qualitative analysis and RTS comparisons for
the methyl, ethyl and isopropyl iodide reactions for a given nucleophile. Additionally, the relative SN2 and E2
barrier heights (SN2 preference = ΔHrxn E2 - ΔHrxn SN2) are consistent with our experimental data.
Covalent Potential Electronegativity Scale
Covalent potential scale of EN (Vx) is defined
Vx = nx/rx
where n is the number of valence electrons in X (the central atom) and r is the covalent radius of
X in the hybridized valence state (i.e., N≡C-C≡N, C-C = 1.393 Å, rC = 0.5 • 1.393 Å = 0.6965
Å).
VCl = 7/1.02 Å = 6.86
VC = 4/0.697 Å = 5.74
VS = 6/1.03 Å = 5.83

178
Appendix 3
Reaction coordinate plot for the reaction of methoxide with methyl formate. Calculations
using the G3MP2 method. Energy values at 0 K are relative to separated reactants (kJ
mol-1
).
0.0
-98.7
-164.0
-59.4 TS
+
+
-64.3
-31.6
G3MP2
TSSN2
-63.7
-47.8TSBAC2
+
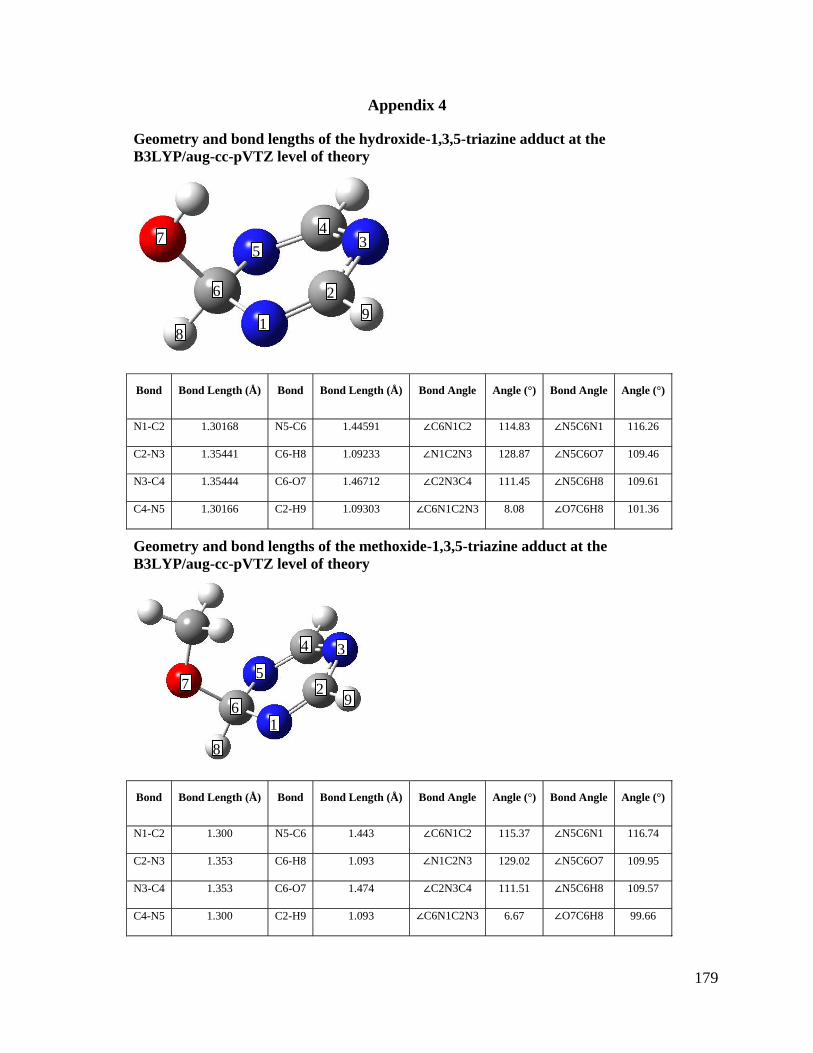
179
Appendix 4
Geometry and bond lengths of the hydroxide-1,3,5-triazine adduct at the
B3LYP/aug-cc-pVTZ level of theory
Bond Bond Length (Å) Bond Bond Length (Å) Bond Angle Angle (°) Bond Angle Angle (°)
N1-C2 1.30168 N5-C6 1.44591 ∠C6N1C2 114.83 ∠N5C6N1 116.26
C2-N3 1.35441 C6-H8 1.09233 ∠N1C2N3 128.87 ∠N5C6O7 109.46
N3-C4 1.35444 C6-O7 1.46712 ∠C2N3C4 111.45 ∠N5C6H8 109.61
C4-N5 1.30166 C2-H9 1.09303 ∠C6N1C2N3 8.08 ∠O7C6H8 101.36
Geometry and bond lengths of the methoxide-1,3,5-triazine adduct at the
B3LYP/aug-cc-pVTZ level of theory
Bond Bond Length (Å) Bond Bond Length (Å) Bond Angle Angle (°) Bond Angle Angle (°)
N1-C2 1.300 N5-C6 1.443 ∠C6N1C2 115.37 ∠N5C6N1 116.74
C2-N3 1.353 C6-H8 1.093 ∠N1C2N3 129.02 ∠N5C6O7 109.95
N3-C4 1.353 C6-O7 1.474 ∠C2N3C4 111.51 ∠N5C6H8 109.57
C4-N5 1.300 C2-H9 1.093 ∠C6N1C2N3 6.67 ∠O7C6H8 99.66
1
2
3 4
6
5 7
8
9
1
2
3 4
6
5 7
8
9
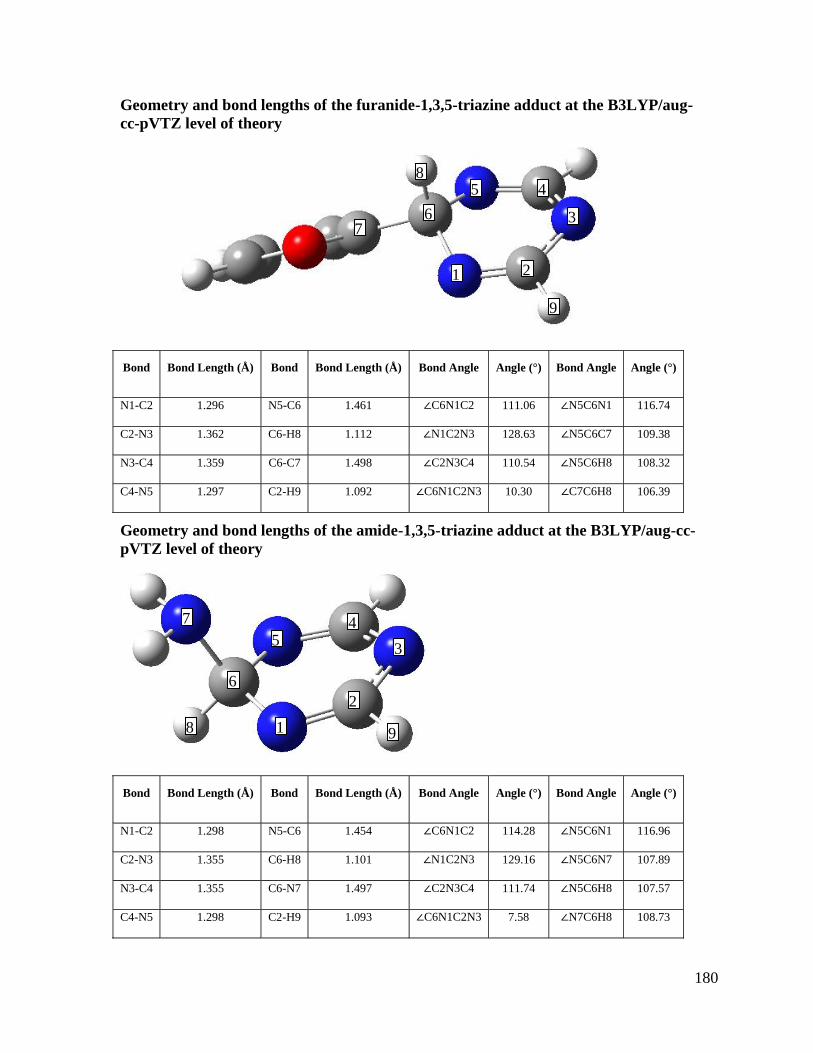
180
Geometry and bond lengths of the furanide-1,3,5-triazine adduct at the B3LYP/aug-
cc-pVTZ level of theory
Bond Bond Length (Å) Bond Bond Length (Å) Bond Angle Angle (°) Bond Angle Angle (°)
N1-C2 1.296 N5-C6 1.461 ∠C6N1C2 111.06 ∠N5C6N1 116.74
C2-N3 1.362 C6-H8 1.112 ∠N1C2N3 128.63 ∠N5C6C7 109.38
N3-C4 1.359 C6-C7 1.498 ∠C2N3C4 110.54 ∠N5C6H8 108.32
C4-N5 1.297 C2-H9 1.092 ∠C6N1C2N3 10.30 ∠C7C6H8 106.39
Geometry and bond lengths of the amide-1,3,5-triazine adduct at the B3LYP/aug-cc-
pVTZ level of theory
Bond Bond Length (Å) Bond Bond Length (Å) Bond Angle Angle (°) Bond Angle Angle (°)
N1-C2 1.298 N5-C6 1.454 ∠C6N1C2 114.28 ∠N5C6N1 116.96
C2-N3 1.355 C6-H8 1.101 ∠N1C2N3 129.16 ∠N5C6N7 107.89
N3-C4 1.355 C6-N7 1.497 ∠C2N3C4 111.74 ∠N5C6H8 107.57
C4-N5 1.298 C2-H9 1.093 ∠C6N1C2N3 7.58 ∠N7C6H8 108.73
1 2
3
4
6
5
7
8
9
1
2
3
4
6
5
7
8 9
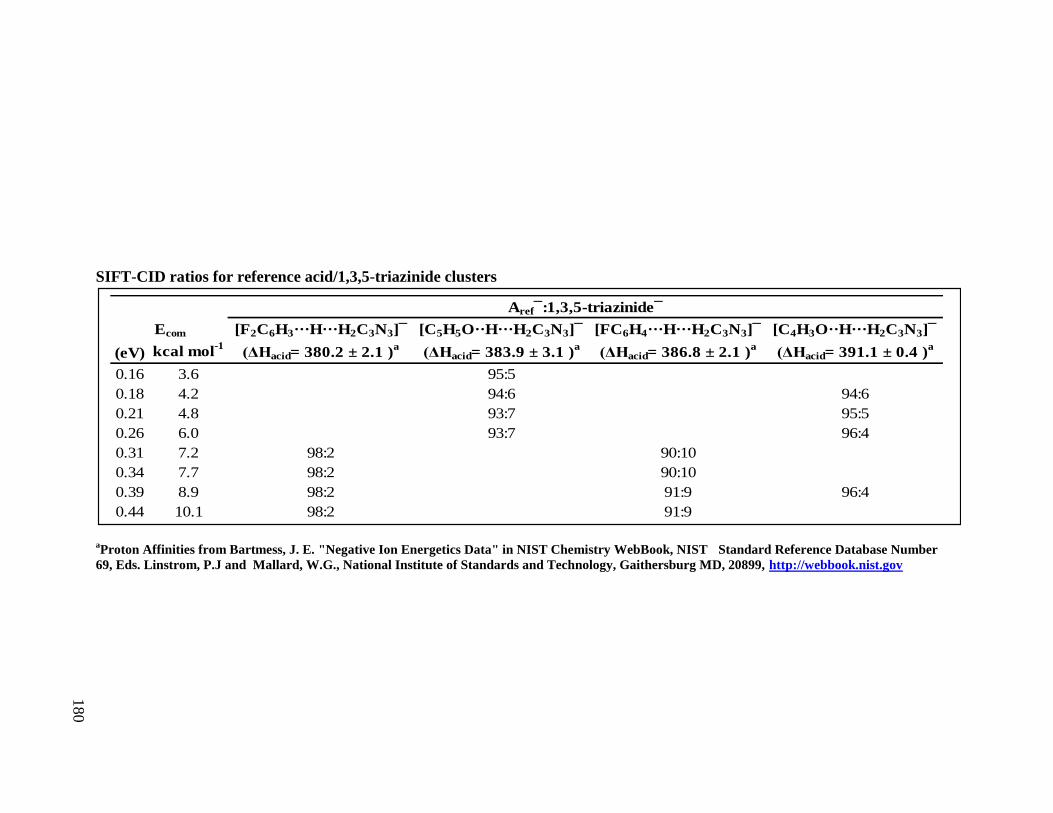
SIFT-CID ratios for reference acid/1,3,5-triazinide clusters
aProton Affinities from Bartmess, J. E. "Negative Ion Energetics Data" in NIST Chemistry WebBook, NIST Standard Reference Database Number
69, Eds. Linstrom, P.J and Mallard, W.G., National Institute of Standards and Technology, Gaithersburg MD, 20899, http://webbook.nist.gov
[F2C6H3···H···H2C3N3]¯ [C5H5O··H···H2C3N3]¯ [FC6H4···H···H2C3N3]¯ [C4H3O··H···H2C3N3]¯
(eV) kcal mol-1
(ΔHacid= 380.2 ± 2.1 )a
(ΔHacid= 383.9 ± 3.1 )a
(ΔHacid= 386.8 ± 2.1 )a
(ΔHacid= 391.1 ± 0.4 )a
0.16 3.6 95:5
0.18 4.2 94:6 94:6
0.21 4.8 93:7 95:5
0.26 6.0 93:7 96:4
0.31 7.2 98:2 90:10
0.34 7.7 98:2 90:10
0.39 8.9 98:2 91:9 96:4
0.44 10.1 98:2 91:9
Aref¯:1,3,5-triazinide¯
Ecom
180
182
Bibliography
Adriaanse, C.; Sulpizi, M.; VandeVondele, J.; Sprik, M. J. Am. Chem. Soc. 2009, 131, 6046-
6047.
Agrawal, J. P. Progr. Energy Combust. Sci. 1998, 24, 1-30.
Alconcel, L. S.; Continetti, R. E. Chem. Phys. Lett. 2002, 366, 642-649.
Ali, T. E. S. Eur. J. Med. Chem. 2009, 44, 4385-4392.
Almerindo, G. I.; Pliego, J. R. Org. Lett. 2005, 7, 1821-1823.
Alves, W. A. Vib. Spectrosc.2010, 53, 285-288.
Anslyn, E. V.; Dougherty, D. A. Modern Physical Organic Chemistry. University Science
Books: United States, 2006.
Artau, A.; Ho, Y.; Kenttamaa, H.; Squires, R. R. J. Am. Chem. Soc. 1999, 121, 7130-7137.
Bachrach, S. M.; Mulhearn, D. C. J. Phys. Chem. 1996, 100, 3535-3540.
Ballinger, P.; Long, F. A. J. Am. Chem. Soc. 1960, 82, 795-798.
Balucani, N. Int. J. Mol. Sci. 2009, 10, 2304-2335.
Bartmess, J. E. "Negative Ion Energetics Data" in NIST Chemistry WebBook, NIST Standard
Reference Database Number 69, Eds. Linstrom, P.J and Mallard, W.G., National Institute
of Standards and Technology, Gaithersburg MD, 20899, http://webbook.nist.gov.
Bartsch, R. A.; Zavada, J., Chem. Rev. 1980, 80, 453-494.
Behrend, C.; Heesche-Wagner, K. Appl. Environ. Microbiol. 1999, 65, 1372-1377.
Bernasconi, C. F.; Stronach, M. W.; DePuy, C. H.; Gronert, S. J. Phys. Org. Chem. 1990, 3, 346-
348.
Bernasconi, C. F.; Stronach, M. W.; DePuy, C. H.; Gronert, S. J. Am. Chem. Soc. 1990, 112,
9044-9052.
Berryman, O. B.; Johnson, D. W. Chem. Commun. 2009, 22, 3143-3153.
Bickelhaupt, F. M.; Baerends, E. J.; Nibbering, N. M. M. Chem. Eur. J. 1996, 2, 196-207.
Bickelhaupt, F. M. J. Comput. Chem. 1999, 20, 114-128.
183
Bierbaum, V. M.; Grabowski, J. J.; DePuy, C. H. J. Phys. Chem. 1984, 88, 1389-1393.
Bierbaum, V. M. In Encyclopedia of Mass Spectrometry; Editor, Gross, M. L., Caprioli, R., Eds.;
Elsevier: Amsterdam, 2003; Vol. 1, p 98.
Blanksby, S. J.; Kato, S.; Bierbaum, V. M.; Ellison, G. B. Aust. J. Chem. 2003, 56, 459-472.
Bogdanov, B.; McMahon, T. B. Int. J. Mass Spectrom. 2005, 241, 205-223.
Bohme, D. K.; Young, L. B. J. Am. Chem. Soc. 1970, 92, 7354-7358.
Bohme, D. K.; Mackay, G. I. J. Am. Chem. Soc. 1981, 103, 978-979.
Bohme, D. K.; Raksit, A. B.; Mackay, G. L. J. Am. Chem. Soc. 1982, 104, 1100-1101.
Bohme, D. K.; Raksit, A. B. Can. J. Chem. 1985, 63, 3007-3011.
Bohme, D. K. Can. J. Chem. 2008, 86, 177-198.
Bordwell, F. G.; Cripe, T. A.; Hughes, D. L. Advances in Chemistry Series 1987, 215, 137-153.
Bradley, J. D.; Gerrans, G. C. J. Chem. Educ. 1973, 50, 463-466.
Brauman, J. I.; Blair, L. K. J. Am. Chem. Soc. 1970, 92, 5986-5992.
Briscese, S. M. J.; Riveros, J. M. J. Am. Chem. Soc. 1975, 97, 230-231.
Buncel, E.; Um I. H. Tetrahedron 2004, 60, 7801-7825.
Carey, F. A.; Sundberg, R. J. Advanced Organic Chemistry: Part A: Structure and Mechanism.
5th ed.; Springer: New York, 2007.
Chabinyc, M. L.; Craig, S. L.; Regan, C. K.; Brauman, J. I. Science 1998, 279, 1882-1886.
Chattaraj, P. K. J. Phys. Chem. A 2001, 105, 511-513.
Chen, X.; Brauman, J. I. J. Am. Chem. Soc. 2008, 130, 15038-15046.
Chen, H.; Chen, H. W.; Cooks, R. G. J. Am. Soc. Mass Spectrom. 2004, 15, 998-1004.
Chiavarino, B.; Crestoni, M. E.; Fornarini, S.; Lanucara, F.; Lemaire, J.; Maitre, P. Angew.
Chem. 2007, 46, 1995-1998.
Chiavarino, B.; Crestoni, M. E.; Fornarini, S.; Lanucara, F.; Lemaire, J.; Maitre, P.;
Scuderi, D. Chem.-Eur. J. 2009, 15, 8185-8195.

184
Ciesielski, A.; Krygowski, T. M.; Cyranski, M. K.; Dobrowolski, M. A.; Balaban, A. T. J. Chem.
Inf. Model. 2009, 49, 369-376.
Clifford, E. P.; Wenthold, P. G.; Lineberger, W. C.; Ellison, G. B.; Wang, C. X.; Grabowski, J.
J.; Vila, F.; Jordan, K. D. J. Chem. Soc., Perkin Trans. 2 1998, 5, 1015-1022.
Cooks, R. G.; Koskinen, J. T.; Thomas, P. D. J. Mass Spectrom. 1999, 34, 85-92.
Cooks, R. G.; Wong, P. S. H. Acc. Chem. Res. 1998, 31, 379-386.
CRC Handbook of Chemistry and Physics, 89th ed.; Editor, Lide, D. R., Ed.; CRC Press: Boca
Raton, Fl., 2008.
Creek, J. A. M.; McAnoy, A. M.; Brinkworth, C. S. Rapid Commun. Mass Spectrom. 2010, 24,
3419-3424.
Custer, T. G.; Kato, S.; Fall, R.; Bierbaum, V. M. Int. J. Mass Spectrom. 2003, 223, 427-446.
Danikiewicz, W.; Bienkowski, T.; Kozlowska, D.; Zimnicka, M. J. Am. Soc. Mass Spectrom.
2007, 18, 1351-1363.
Davico, G. E.; Bierbaum, V. M. J. Am. Chem. Soc. 2000, 122, 1740-1748.
Davico, G. E. J. Phys. Chem. A 2006, 110, 13112-13121.
DePuy, C. H.; Bierbaum, V. M.; Schmitt, R. J.; Shapiro, R. H. J. Am. Chem. Soc. 1978, 100,
2920-2921.
DePuy, C. H.; Della, E. W.; Filley, J.; Grabowski, J. J.; Bierbaum, V. M. J. Am. Chem. Soc.
1983, 105, 2481-2482.
DePuy, C. H.; Grabowski, J. J.; Bierbaum, V. M.; Ingemann, S.; Nibbering, N. M. M. J. Am.
Chem. Soc. 1985, 107, 1093-1098.
DePuy, C. H.; Gronert, S.; Mullin, A.; Bierbaum, V. M. J. Am. Chem. Soc. 1990, 112, 8650-
8655.
DePuy, C. H. J. Org. Chem. 2002, 67, 2393-2401.
DePuy, C. H.; Kato, S. “H/D Exchange Reactions.” In Encyclopedia of Mass Spectrometry:
Theory and Ion Chemistry, Armentrout, P. B., Ed. Elsevier: Amsterdam, 2003; Vol. 1, pp
670-674.
Dillow, G. W.; Kebarle, P. J. Am. Chem. Soc. 1988, 110, 4877-4882.
Dixon, J. E.; Bruice, T. C. J. Am. Chem. Soc. 1971, 93, 6592-6597.
185
Dixon, J. E.; Bruice, T. C. J. Am. Chem. Soc. 1972, 94, 2052-2056.
Dmitrenko, O.; Thorpe, C.; Bach, R. D. J. Org. Chem. 2007, 72, 8298-8307.
Dodd, J. A.; Brauman, J. I. J. Am. Chem. Soc. 1984, 106, 5356-5357.
Dodd, J. A.; Brauman, J. I. J. Phys. Chem. 1986, 90, 3559-3562.
Dotterer, S. K.; Harris, R. L. J. Org. Chem. 1988, 53, 777-779.
Downard, K. M.; Bowie, J. H.; O'Hair, R. A. J.; Krempp, M.; DePuy, C. H. Int. J. Mass
Spectrom. Ion Processes 1992, 120, 217-229.
Dyakov, Y. A.; Mebel, A. M.; Lin, S. H.; Lee, Y. T.; Ni, C. K. J. Phys. Chem. A 2007, 111,
9591-9599.
Edwards, J. O.; Pearson, R. G. J. Am. Chem. Soc. 1962, 84, 16-24.
Eisa, H. M.; Tantawy, A. S.; Elkerdawy, M. M. Pharmazie 1991, 46, 182-184.
Engberts, J. B. F. N. Pure Appl. Chem. 1997, 69, 231-233.
Ermolaeva, L. V.; Appolonova, S. A.; Plemenkov, V. V.; Konovalov, A. I. Theochem. J. Mol.
Struct. 1997, 398, 451-455.
Ervin, K. M. Chem. Rev. 2001, 101, 391-444.
Ervin, K. M.; DeTuro, V. F. J. Phys. Chem. A 2002, 106, 9947-9956.
Eyet, N.; Villano, S. M.; Kato, S.; Bierbaum, V. M. J. Am. Soc. Mass Spectrom. 2007, 18, 1046-
1051.
Eyet, N.; Villano, S. M.; Bierbaum, V. M. J. Am. Soc. Mass Spectrom. 2008, 19, 1296-1302.
Fang, Y. R.; MacMillar, S.; Eriksson, J.; Kolodziejska-Huben, M.; Dybala-Defratyka, A.;
Paneth, P.; Matsson, O.; Westaway, K. C. J. Org. Chem. 2006, 71, 4742-4747.
Ferguson, E. E.; Fehsenfeld, F.C.; Schmeltekopf, A.L. Adv. At. Mol. Phys. 1969, 5, 1-69.
Fernandez, I.; Frenking, G.; Uggerud, E. J. Org. Chem. 2010, 75, 2971-2980.
Flores, A. E.; Gronert, S. J. Am. Chem. Soc. 1999, 121, 2627-2628.
Fountain, K. R.; Tad-y, D. B.; Paul, T. W.; Golynskiy, M. V. J. Org. Chem. 1999, 64, 6547-
6553.
186
Fountain, K. R.; Felkerson, C. J.; Driskell, J. D.; Lamp, B. D. J. Org. Chem. 2003, 68, 1810-
1814.
Fountain, K. R. J. Phys. Org. Chem. 2005, 18, 481-485.
Frink, B. T.; Hadad, C. M. J. Chem. Soc., Perkin Trans. 2 1999, 31, 2397-2407.
Frisch, M. J.; Trucks, G. W.; Schlegel, H. B.; Scuseria, G. E.; Robb, M. A.; Cheeseman, J. R.;
Scalmani, G.; Barone, V.; Mennucci, B.; Petersson, G. A.; Nakatsuji, H.; Caricato, M.;
Li, X.; Hratchian, H. P.; Izmaylov, A. F.; Bloino, J.; Zheng, G.; Sonnenberg, J. L.; Hada,
M.; Ehara, M.; Toyota, K.; Fukuda, R.; Hasegawa, J.; Ishida, M.; Nakajima, T.; Honda,
Y.; Kitao, O.; Nakai, H.; Vreven, T.; Montgomery, Jr., J. A.; Peralta, J. E.; Ogliaro, F.;
Bearpark, M.; Heyd, J. J.; Brothers, E.; Kudin, K. N.; Staroverov, V. N.; Kobayashi, R.;
Normand, J.; Raghavachari, K.; Rendell, A.; Burant, J. C.; Iyengar, S. S.; Tomasi, J.;
Cossi, M.; Rega, N.; Millam, N. J.; Klene, M.; Knox, J. E.; Cross, J. B.; Bakken, V.;
Adamo, C.; Jaramillo, J.; Gomperts, R.; Stratmann, R. E.; Yazyev, O.; Austin, A. J.;
Cammi, R.; Pomelli, C.; Ochterski, J. W.; Martin, R. L.; Morokuma, K.; Zakrzewski, V.
G.; Voth, G. A.; Salvador, P.; Dannenberg, J. J.; Dapprich, S.; Daniels, A. D.; Farkas,
Ö.; Foresman, J. B.; Ortiz, J. V.; Cioslowski, J.; Fox, D. J. Gaussian 09, Revision A.1,
Gaussian, Inc., Wallingford CT, 2009.
Frisch, M. J.; Trucks, G. W.; Schlegel, H. B.; Scuseria, G. E.; Robb, M. A.; Cheeseman, J. R.;
Montgomery, J. J. A.; Vreven, T.; Kudin, K. N.; Burant, J. C.; Millam, J. M.; Iyengar, S.
S.; Tomasi, J.; Barone, V.; Mennucci, B.; Cossi, M.; Scalmani, G.; Rega, N.; Petersson,
G. A.; Nakatsuji, H.; Hada, M.; Ehara, M.; Toyota, K.; Fukuda, R.; Hasegawa, J.; Ishida,
M.; Nakajima, T.; Honda, Y.; Kitao, O.; Nakai, H.; Klene, M.; Li, X.; Knox, J. E.;
Hratchian, H. P.; Cross, J. B.; Bakken, V.; Adamo, C.; Jaramillo, J.; Gomperts, R.;
Stratmann, R. E.; Yazyev, O.; Austin, A. J.; Cammi, R.; Pomelli, C.; Ochterski, J. W.;
Ayala, P. Y.; Morokuma, K.; Voth, G. A.; Salvador, P.; Dannenberg, J. J.; Zakrzewski,
V. G.; Dapprich, S.; Daniels, A. D.; Strain, M. C.; Farkas, O.; Malick, D. K.; Rabuck, A.
D.; Raghavachari, K.; Foresman, J. B.; Ortiz, J. V.; Cui, Q.; Baboul, A. G.; Clifford, S.;
Cioslowski, J.; Stefanov, B. B.; Liu, G.; Liashenko, A.; Piskorz, P.; Komaromi, I.;
Martin, R. L.; Fox, D. J.; Keith, T.; Al-Laham, M. A.; Peng, C. Y.; Nanayakkara, A.;
Challacombe, M.; Gill, P. M. W.; Johnson, B.; Chen, W.; Wong, M. W.; Gonzalez, C.;
Pople, J. A. Gaussian 03, Revision B.05, Gaussian, Inc.: Pittsburgh, PA, 2004.
Garver, J. M.; Fang, Y.; Eyet, N.; Villano, S. M.; Bierbaum, V. M.; Westaway, K. C. J. Am.
Chem. Soc. 2010, 132, 3808-3814.
Garver, J. M.; Gronert, S.; Bierbaum, V. M. submitted as a communication (J. Am. Chem. Soc.)
Garver, J. M.; Yang, Z.; Nichols C. M.; Worker, B. B.; Gronert, S.; Bierbaum, V. M. (in
preparation)
Giroldo, T.; Xavier, L. A.; Riveros, J. M. Angew. Chem. 2004, 43, 3588-3590.
Glad, S. S.; Jensen, F. J. Am. Chem. Soc. 1994, 116, 9302-9310.
187
Glad, S. S.; Jensen, F. J. Phys. Chem. 1996, 100, 16892-16898.
Glad, S. S.; Jensen, F. J. Am. Chem. Soc. 1997, 119, 227-232.
Glad, S. S.; Jensen, F. J. Org. Chem. 1997, 62, 253-260.
Glukhovtsev, M. N.; Pross, A.; Radom, L. J. Am. Chem. Soc. 1996, 118, 6273-6284.
Glukhovtsev, M. N.; Bach, R. D.; Laiter, S. J. Org. Chem. 1997, 62, 4036-4046.
Goebbert, D. J.; Wenthold, P. G. Int. J. Mass Spectrom. 2006, 257, 1-11.
Gonzales, J. M.; Allen, W. D.; Schaefer, H. F. J. Phys. Chem. A 2005, 109, 10613-10628.
Graul, S. T.; Bowers, M. T. J. Am. Chem. Soc. 1994, 116, 3875-3883.
Gregory, M. J.; Bruice, T. C. J. Am. Chem. Soc. 1967, 89, 4400-4402.
Gregory, M. J.; Bruice, T. C. J. Am. Chem. Soc. 1967, 89, 2327-2330.
Gronert, S.; DePuy, C. H.; Bierbaum, V. M. J. Am. Chem. Soc. 1991, 113, 4009-4010.
Gronert, S.; Lee, J. M. J. Org. Chem. 1995, 60, 4488-4497.
Gronert, S.; Pratt, L. M.; Mogali, S., J. Am. Chem. Soc. 2001, 123, 3081-3091.
Gronert, S. Chem. Rev. 2001, 101, 329-360.
Gronert, S. Acc. Chem. Res. 2003, 36, 848-857.
Gronert, S.; Fagin, A.; Okamoto, K.; Pratt, L. M.; Mogali, S. Abstr. Pap. Am. Chem. Soc. 2003,
226, U181-U181.
Gronert, S.; Fagin, A. E.; Okamoto, K.; Mogali, S.; Pratt, L. M. J. Am. Chem. Soc. 2004, 126,
12977-12983.
Gronert, S.; Keeffe, J. R. J. Am. Chem. Soc. 2005, 127, 2324-2333.
Gronert, S.; Keeffe, J. R. J. Org. Chem. 2006, 71, 5959-5968.
Gronert, S.; Fagin, A. E.; Wong, L. J. Am. Chem. Soc. 2007, 129, 5330-5331.
Hadad, C. M.; Rablen, P. R.; Wiberg, K. B. J. Org. Chem. 1998, 63, 8668-8681.
Haib, J.; Stahl, D. Org. Mass Spectrom. 1992, 27, 377-382.
188
Hase, W. L. Science 1994, 266, 998-1002.
Hay, B. P.; Bryantsev, V. S. Chem. Commun. 2008, 21, 2417-2428.
Hay, P. J.; Wadt, W. R. J. Chem. Phys. 1985, 82, 270-283.
Heaton, M. M. J. Am. Chem. Soc. 1978, 100, 2004-2008.
Hiraoka, K.; Mizuse, S.; Yamabe, S. J. Phys. Chem. 1987, 91, 5294-5297.
Hoaglund-Hyzer, C.S.; Counterman, A.E.; Clemmer, D.E. Chem. Rev. 1999, 99, 3037-3079.
Hoz, S. J. Org. Chem. 1982, 47, 3545-3547.
Hoz, S.; Basch, H.; Wolk, J. L.; Hoz, T.; Rozental, E. J. Am. Chem. Soc. 1999, 121, 7724-7725.
Hu, W. P.; Truhlar, D. G. J. Am. Chem. Soc. 1994, 116, 7797-7800.
Hu, W. P.; Truhlar, D. G. J. Am. Chem. Soc. 1995, 117, 10726-10734.
Hu, W. P.; Truhlar, D. G. J. Am. Chem. Soc. 1996, 118, 860-869.
Hynes, J. T. Annu. Rev. Phys. Chem. 1985, 36, 573-597.
Ichino, T.; Gianola, A. J.; Kato, S.; Bierbaum, V. M.; Lineberger, W. C. J. Phys. Chem. A
2007, 111, 8374-8383.
Ingemann, S.; Nibbering, N. M. M.; Sullivan, S. A.; DePuy, C. H. J. Am. Chem. Soc. 1982, 104,
6520-6527.
Ingemann, S.; Kleingeld, J. C.; Nibbering, N. M. M. J. Chem. Soc., Chem. Commun. 1982, 17,
1009-1011.
Isolani, P. C.; Riveros, J. M. Chem. Phys. Lett. 1975, 33, 362-364.
Jencks, W. P. Chem. Rev.1985, 85, 511-527.
Johlman, C. L.; Wilkins, C. L. J. Am. Chem. Soc. 1985, 107, 327-332.
Jones, M. E.; Ellison, G. B. J. Am. Chem. Soc. 1989, 111, 1645-1654.
Jordan, F.; Li, H.; Brown, A. Biochem. 1999, 38, 6369-6373.
Kahn, K.; Bruice, T. C. J. Phys. Chem. B 2003, 107, 6876-6885.

189
Kato, S.; DePuy, C. H.; Gronert, S.; Bierbaum, V. M. J. Am. Soc. Mass Spectrom. 1999, 10, 840-
847.
Kato, S.; Davico, G. E.; Lee, H. S.; DePuy, C. H.; Bierbaum, V. M. Int. J. Mass Spectrom. 2001,
210, 223-229.
Kato, S.; Hacaloglu, J.; Davico, G. E.; DePuy, C. H.; Bierbaum, V. M. J. Phys. Chem. A 2004,
108, 9887-9891.
Kato, S.; Lineberger, W. C.; Bierbaum, V. M. Int. J. Mass Spectrom. 2007, 266, 166-179.
Katritzky, A. R.; Barczynski, P.; Musumarra, G.; Pisano, D.; Szafran, M. J. Am. Chem. Soc.
1989, 111, 7-15.
Keeffe, J. R.; Gronert, S.; Colvin, M. E.; Tran, N. L. J. Am. Chem. Soc. 2003, 125, 11730-11745.
Khan, H.; Harris, R. J.; Barna, T.; Craig, D. H.; Bruce, N. C.; Munro, A. W.; Moody, P. C. E.;
Scrutton, N. S. J. Biol. Chem. 2002, 277, 21906-21912.
KIDA (KInetic Database for Astrochemistry, http://kida.obs.u-bordeaux1.fr).
Kim, D. W.; Ahn, D.-S.; Oh, Y.-H.; Lee, S.; Kil, H. S.; Oh, S. J.; Lee, S. J.; Kim, J. S.; Ryu, J.
S.; Moon, D. H.; Chi, D. Y. J. Am. Chem. Soc. 2006, 128, 16394-16397.
Kim, D. W.; Song, C. E.; Chi, D. Y. J. Org. Chem. 2003, 68, 4281-4285.
Kim, D. W.; Song, C. E.; Chi, D. Y. J. Am. Chem. Soc. 2002, 124, 10278-10279.
Kim, M. S.; Min, S. W.; Seo, J. A.; Um, I. H. Bull. Korean Chem. Soc. 2009, 30, 2913-2917.
Kirby, A. J.; Manfredi, A. M.; Souza, B. S.; Medeiros, M.; Priebe, J. P.; Brandao, T. A. S.;
Nome, F. Arkivoc 2009, 3, 28-38.
Klenke, B.; Stewart, M.; Barrett, M. P.; Brun, R.; Gilbert, I. H. J. Med. Chem. 2001, 44, 3440-
3452.
Klopman, G. J. Am. Chem. Soc. 1968, 90, 223-234.
Koshy, K. M.; Robertson, R. E. J. Am. Chem. Soc. 1974, 96, 914-916.
Kurinovich, M. A.; Lee, J. K. J. Am. Chem. Soc. 2000, 122, 6258-6262.
Kurz, J. L. Chem. Phys. Lett. 1978, 57, 243-246.
Laerdahl, J. K.; Uggerud, E. Int. J. Mass Spectrom. 2002, 214, 277-314.

190
Lee, J. K.; Grabowski, J. J. J. Org. Chem. 1996, 61, 9422-942
Lide, D. R. CRC Handbook of Chemistry and Physics, 89th Ed. CRC Press: Boca Raton, Fl.,
2008; p U552-U552.
Linstrom, P.J.; Mallard, W.G. Eds., NIST Chemistry WebBook, National Institute of Standards
and Technology, NIST Standard Reference Database Number 69, Gaithersburg MD,
20899, http://webbook.nist.gov;
Lowry, T. H.; Richardson, K. S. Mechanism and Theory in Organic Chemistry. Harper and Row:
New York, 1987.
Lum, R. C.; Grabowski, J. J. J. Am. Chem. Soc. 1992, 114, 9663-9665.
Lum, R. C.; Grabowski, J. J. J. Am. Chem. Soc. 1993, 115, 7823-7832.
Luo, Y. R.; Benson, S. W. Acc. Chem. Res. 1992, 25, 375-381.
Lundegaard, C.; Jensen, K. F. Biochem. 1999, 38, 3327-3334.
Mackay, G. I.; Bohme, D. K. J. Am. Chem. Soc. 1978, 100, 327-329.
Mąkosza, M. Russ. Chem. Bull. 1996, 45, 491-504.
March, J. Advanced Organic Chemistry: Reactions, Mechanisms, and Structure 4th ed.; John
Wiley & Sons, Inc: New York, 1992.
Marcus, R. A. J. Phys. Chem. 1968, 72, 891-899.
McAnoy, A. M.; Paine, M. R. L.; Blanksby, S. J. Org. Biomol. Chem. 2008, 6, 2316-2326.
McIsaac, J. E.; Subbaraman, L. R.; Subbaraman, J.; Mulhausen, H. A.; Behrman, E. J., J. Org.
Chem. 1972, 37, 1037-1041.
Merrick, J. P.; Moran, D.; Radom, L. J. Phys. Chem. A 2007, 111, 11683-11700.
Midey, A. J.; Miller, T. M.; Viggiano, A. A. J. Phys. Chem. A 2009, 113, 4982-4989.
Miller, J. A.; Kee, R. J.; Westbrook, C. K., Annu. Rev. Phys. Chem. 1990, 41, 345-387.
Moller, C.; Plesset, M. S. Phys. Rev. 1934, 46, 618-622.
Mugnai, M.; Cardini, G.; Schettino, V. J. Phys. Chem. A 2003, 107, 2540-2547.
Mukherjee, S.; Ren, J. H. J. Am. Soc. Mass Spectrom. 2010, 21, 1720-1729.

191
Nielson, P. Aa.; Glad, S. S.; Jensen, F. J. J. Am. Chem. Soc. 1996, 118, 10577-10583.
NIST Chemistry WebBook, National Institute of Standards and Technology, Gaithersburg MD,
20899, http://webbook.nist.gov
Nomura, Y.; Kubozono, T.; Hidaka, M.; Horibe, M.; Mizushima, N.; Yamamoto, N.;
Takahashi, T.; Komiyama, M. Bioorg. Chem. 2004, 32, 26-37.
O'Hair, R. A. J.; Davico, G. E.; Hacaloglu, J.; Dang, T. T.; DePuy, C. H.; Bierbaum, V. M.
J. Am. Chem. Soc. 1994, 116, 3609-3610.
Ohta, K.; Morokuma, K. J. Phys. Chem. 1985, 89, 5845-5849.
Olmstead, W. N.; Brauman, J. I. J. Am. Chem. Soc. 1977, 99, 4219-4228.
Patterson, E. V.; Fountain, K. R. J. Org. Chem. 2006, 71, 8121-8125.
Paul, G. J. C.; Kebarle, P. J. Am. Chem. Soc. 1991, 113, 1148-1154.
Pearson, R. G.; Songstad, J. J. Am. Chem. Soc. 1967, 89, 1827-1836.
Pearson, R. G. Proceedings of the National Academy of Sciences 1986, 83, 8440-8441.
Pelizzetti, E.; Maurino, V.; Minero, C.; Carlin, V.; Pramauro, E.; Zerbinati, O.; Tosato, M. L.
Environ. Sci. Technol. 1990, 24, 1559-1565.
Pellerite, M. J.; Brauman, J. I. J. Am. Chem. Soc. 1980, 102, 5993-5999.
Pellerite, M. J.; Brauman, J. I. J. Am. Chem. Soc. 1983, 105, 2672-2680.
Pliego, J. J. R.; Riveros, J. M. Chem.–Eur. J. 2001, 7, 169-175.
Poirier, R. A.; Wang, Y. L.; Westaway, K. C. J. Am. Chem. Soc. 1994, 116, 2526-2533.
Pratt, R. F.; Bruice, T. C. J. Org. Chem. 1972, 37, 3563-3564.
Ren, J.; Brauman, J. I. J. Am. Chem. Soc. 2004, 126, 2640-2646.
Ren, Y.; Yamataka, H. Org. Lett. 2006, 8, 119-121.
Ren, Y.; Yamataka, H. J. Org. Chem. 2007, 72, 5660-5667.
Ren, Y.; Yamataka, H. Chem. Eur. J. 2007, 13, 677-682.
Ren, Y.; Yamataka, H., J. Comput. Chem. 2009, 30, 358-365.
192
Rieger, P. G.; Sinnwell, V.; Preuss, A.; Francke, W.; Knackmuss, H. J. J. Bacteriol.
1999, 181, 1189-1195.
Rogers, J.; Moyer, B.; Kalscheur, G.; Emig, N. JCT Coatingstech 2007, 4, 82-86.
Sauers, R. R. J. Chem. Theory Comput. 2010, 6, 602-606.
Schalley, C. A.; Armentrout, P. Threshold Collision-Induced Dissociations for the Determination
of Accurate Gas-Phase Binding Energies and Reaction Barriers. In Modern Mass
Spectrometry, Springer Berlin/Heidelberg: 2003, 225, 233-262.
Schalley, C. A. Int. J. Mass Spec. 2000, 194, 11-39.
Schlosser, M.; Ruzziconi, R. Synthesis-Stuttgart 2010, 13, 2111-2123.
Schneider, H.; Vogelhuber, K. M.; Schinle, F.; Weber, J. M. J. Am. Chem. Soc. 2007, 129,
13022-13026.
Serjeant, E. P.; Dempsey, B. Ionisation constants of organic acids in aqueous solution (IUPAC
Chemical Data Series); Pergamon Press: Oxford; New York, 1979.
Shaik, S. S., Acta Chem. Scand. 1990, 44, 205-221.
Shaik, S. S.; Schlegel, H. B.; Wolfe, S. Theoretical Aspects of Physical Organic Chemistry: The
SN2 Reaction. Wiley: New York, 1992.
Shiner, V. J. Jr.; Dowd, W.; Fisher, R. D.; Hartshorn, S. R.; Kessick, M. A.; Milakofs, L.; Rapp,
M. W. J. Am. Chem. Soc. 1969, 91, 4838-4939.
Simons, J. Molecular Ions Web Site, http://www.hec.utah.edu/anions.
Smith, D.; Mcintosh, B. J.; Adams, N. G. J. Chem. Phys. 1989, 90, 6213-6219.
Steinfeld, J. I.; Francisco, J. S.; Hase, W. L. Chemical Kinetics and Dynamics; Prentice-Hall:
Englewood Cliffs, NJ, 1989.
Su, T.; Chesnavich, W. J. J. Chem. Phys. 1982, 76, 5183-5185.
Sun, X.; Lee, J. K. J. Org. Chem. 2010, 75, 1848-1854.
Tachikawa, H. J. Phys. Chem. A 2001, 105, 1260-1266.
Taft, R. W. Prog. Phys. Org. Chem. 1983, 14, 247-350.
Takashima, K.; Riveros, J. M. J. Am. Chem. Soc. 1978, 100, 6128-6132.
193
Thomas, J. M.; Viggiano, A. A. J. Phys. Chem. A 1999, 103, 2720-2722.
Tondo, D. W.; Pliego, J. R. J. Phys. Chem. A 2005, 109, 507-511.
Toteva, M. M.; Richard, J. P. J. Am. Chem. Soc. 2000, 122, 11073-11083.
Turker, L.; Atalar, T.; Gumus, S.; Camur, Y. J. Hazard. Mater. 2009, 167, 440-448.
Uggerud, E., J. Phys. Org. Chem. 2006, 19, 461-466.
Uggerud, E., Chem.–Eur. J. 2006, 12, 1127-1136.
Uggerud, E. Pure Appl. Chem. 2009, 81, 709-717.
Um, I. H.; Buncel, E. J. Org. Chem. 1999, 65, 577-582.
Um, I. H.; Buncel, E. J. Am. Chem. Soc. 2001, 123, 11111-11112.
Um, I. H.; Hwang, S. J.; Buncel, E. J. Org. Chem. 2006, 71, 915-920.
Um, I. H.; Shin, Y. H.; Han, J. Y.; Buncel, E. Can. J. Chem. 2006, 84, 1550-1556.
Um, I. H.; Han, J. Y.; Buncel, E. Chem.–Eur. J. 2009, 15, 1011-1017.
Um, I. H.; Im, L.-R.; Buncel, E. J. Org. Chem. 2010, 75, 8571-8577.
Valet, A. Prog. Org. Coat. 1999, 35, 223-233.
Van Doren, J. M. The Tandem Flowing Afterglow-SIFT-DRIFT: Developments and
Applications to Gas Phase Ion Chemistry, PhD Thesis, Department of Chemistry and
Biochemistry, University of Colorado at Boulder 1983.
Van Doren, J. M.; Barlow, S. E.; Depuy, C. H.; Bierbaum, V. M. Int. J. Mass Spectrom. Ion
Processes 1987, 81, 85-100.
Vianello, R.; Peran, N.; Maksic, Z. B. Eur. J. Org. Chem. 2007, 3, 526-539.
Viggiano, A. A.; Paschkewitz, J. S.; Morris, R. A.; Paulson, J. F.; Gonzalezlafont, A.; Truhlar,
D. G. J. Am. Chem. Soc. 1991, 113, 9404-9405.
Viggiano, A. A.; Arnold, S. T.; Morris, R. A. Int. Rev. Phys. Chem. 1998, 17, 147-184.
Viggiano, A. A.; Midey, A. J. J. Phys. Chem. A 2000, 104, 6786-6790.
Villano, S. M.; Kato, S.; Bierbaum, V. M. J. Am. Chem. Soc. 2006, 128, 736-737.
194
Villano, S. M.; Eyet, N.; Lineberger, W. C.; Bierbaum, V. M. J. Am. Chem. Soc. 2009, 131,
8227-8233.
Villano, S. M.; Eyet, N.; Wren, S. W.; Ellison, G. B.; Bierbaum, V. M.; Lineberger, W. C. Eur.
J. Mass Spectrom. 2010, 16, 255-268.
Villano, S. M.; Eyet, N.; Wren, S. W.; Ellison, G. B.; Bierbaum, V. M.; Lineberger, W. C. J.
Phys. Chem. A 2010, 114, 191-200.
Vorbeck, C.; Lenke, H.; Fischer, P.; Knackmuss, H. J. J. Bacteriol. 1994, 176, 932-934.
Westaway, K. C. Can. J. Chem. 1978, 56, 2691-2699.
Westaway, K. C.; Waszczylo, Z. Can. J. Chem. 1982, 60, 2500-2520.
Westaway, K. C. Adv. Phys. Org. Chem. 2006, 41, 217-273.
Westaway, K. C.; Fang, Y. R.; MacMillar, S.; Matsson, O.; Poirier, R. A.; Islam, S. M. J. Phys.
Chem. A 2007, 111, 8110-8120.
Westaway, K. C. J. Labelled Compd. Radiopharm. 2007, 50, 989-1005.
Westaway, K. C.; Fang, Y. R.; MacMillar, S.; Matsson, O.; Poirier, R. A.; Islam, S. M. J. Phys.
Chem. A 2008, 112, 10264-10273.
Wheeler, S. E.; Houk, K. N. J. Phys. Chem. A 2010, 114, 8658-8664.
Wiberg, K. B.; Nakaji, D.; Breneman, C. M. J. Am. Chem. Soc. 1989, 111, 4178-4190.
Wickhamjones, C. T.; Ervin, K. M.; Ellison, G. B.; Lineberger, W. C. J. Chem. Phys.1989, 91,
2762-2763.
Wladkowski, B. D.; Brauman, J. I. J. Am. Chem. Soc. 1992, 114, 10643-10644.
Wladkowski, B. D.; Brauman, J. I. J. Phys. Chem. 1993, 97, 13158-13164.
Wolfe, S.; Kim, C. K. J. Am. Chem. Soc. 1991, 113, 8056-8061.
Wren, S. W.; Vogelhuber, K. M.; Garver, J. M.; Kato, S.; Sheps, L.; Bierbaum, V. M.;
Lineberger, W. C. In preparation
Wu, Y.-R.; Hu, W.-P. J. Am. Chem. Soc. 1999, 121, 10168-10177.
Wu, X. P.; Sun, X. M.; Wei, X. G.; Ren, Y.; Wong, N. B.; Li, W. K. J. Chem. Theory Comput.
2009, 5, 1597-1606.
195
Yinon, J.; Johnson, J. V.; Bernier, U. R.; Yost, R. A.; Mayfield, H. T.; Mahone, W. C.;
Vorbeck, C. J. Mass Spectrom. 1995, 30, 715-722.
Zhachkina, A.; Lee, J. K. J. Am. Chem. Soc. 2009, 131, 18376-18385.
Zhang, Q. Z.; Wang, H. N.; Sun, T. L.; Wang, W. X. Chem. Phys. 2006, 324, 298-306.
Zheng, Y. J.; Ornstein, R. L. J. Am. Chem. Soc. 1997, 119, 648-655.
Ziganshin, A. M.; Gerlach, R.; Borch, T.; Naumov, A. V.; Naumova, R. P. Appl. Environ.
Microbiol. 2007, 73, 7898-7905.