FORM 10-Q - Morgan Stanley
97
UNITED STATES SECURITIES AND EXCHANGE COMMISSION Washington, D.C. 20549 FORM 10-Q È QUARTERLY REPORT PURSUANT TO SECTION 13 OR 15(d) OF THE SECURITIES EXCHANGE ACT OF 1934 For the quarterly period ended February 28, 2007 OR ‘ TRANSITION REPORT PURSUANT TO SECTION 13 OR 15(d) OF THE SECURITIES EXCHANGE ACT OF 1934 For the transition period from to Commission file number 1-11758 Morgan Stanley (Exact Name of Registrant as Specified in its Charter) Delaware 36-3145972 (State of Incorporation) (I.R.S. Employer Identification No.) 1585 Broadway New York, NY 10036 (Address of Principal Executive Offices) (Zip Code) Registrant’s telephone number, including area code: (212) 761-4000 Indicate by check mark whether the Registrant (1) has filed all reports required to be filed by Section 13 or 15(d) of the Securities Exchange Act of 1934 during the preceding 12 months (or for such shorter period that the Registrant was required to file such reports), and (2) has been subject to such filing requirements for the past 90 days. Yes È No ‘ Indicate by check mark whether the Registrant is a large accelerated filer, an accelerated filer, or a non-accelerated filer. See definition of “accelerated filer” and “large accelerated filer” in Rule 12b-2 of the Exchange Act. (Check one): Large Accelerated Filer È Accelerated Filer ‘ Non-Accelerated Filer ‘ Indicate by check mark whether the Registrant is a shell company (as defined in Rule 12b-2 of the Exchange Act). Yes ‘ No È As of March 31, 2007, there were 1,053,930,564 shares of the Registrant’s Common Stock, par value $.01 per share, outstanding.
Transcript of FORM 10-Q - Morgan Stanley

UNITED STATESSECURITIES AND EXCHANGE COMMISSION
Washington, D.C. 20549
FORM 10-Q
È QUARTERLY REPORT PURSUANT TO SECTION 13 OR 15(d) OF THESECURITIES EXCHANGE ACT OF 1934
For the quarterly period ended February 28, 2007
OR
‘ TRANSITION REPORT PURSUANT TO SECTION 13 OR 15(d) OF THESECURITIES EXCHANGE ACT OF 1934
For the transition period from to
Commission file number 1-11758
Morgan Stanley(Exact Name of Registrant as Specified in its Charter)
Delaware 36-3145972(State of Incorporation) (I.R.S. Employer Identification No.)
1585 BroadwayNew York, NY 10036
(Address of PrincipalExecutive Offices)
(Zip Code)
Registrant’s telephone number, including area code: (212) 761-4000
Indicate by check mark whether the Registrant (1) has filed all reports required to be filed by Section 13 or 15(d)of the Securities Exchange Act of 1934 during the preceding 12 months (or for such shorter period that theRegistrant was required to file such reports), and (2) has been subject to such filing requirements for the past 90days. Yes È No ‘
Indicate by check mark whether the Registrant is a large accelerated filer, an accelerated filer, or anon-accelerated filer. See definition of “accelerated filer” and “large accelerated filer” in Rule 12b-2 of theExchange Act. (Check one):
Large Accelerated Filer È Accelerated Filer ‘ Non-Accelerated Filer ‘
Indicate by check mark whether the Registrant is a shell company (as defined in Rule 12b-2 of the ExchangeAct). Yes ‘ No È
As of March 31, 2007, there were 1,053,930,564 shares of the Registrant’s Common Stock, par value $.01 pershare, outstanding.

MORGAN STANLEY
INDEX TO QUARTERLY REPORT ON FORM 10-QQuarter Ended February 28, 2007
Page
Part I—Financial InformationItem 1. Financial Statements (unaudited)
Condensed Consolidated Statements of Financial Condition—February 28, 2007 andNovember 30, 2006 . . . . . . . . . . . . . . . . . . . . . . . . . . . . . . . . . . . . . . . . . . . . . . . . . . . . . 1
Condensed Consolidated Statements of Income—Three Months Ended February 28,2007 and 2006 . . . . . . . . . . . . . . . . . . . . . . . . . . . . . . . . . . . . . . . . . . . . . . . . . . . . . . . . . . 3
Condensed Consolidated Statements of Comprehensive Income—Three Months EndedFebruary 28, 2007 and 2006 . . . . . . . . . . . . . . . . . . . . . . . . . . . . . . . . . . . . . . . . . . . . . . . 4
Condensed Consolidated Statements of Cash Flows—Three Months Ended February 28,2007 and 2006 . . . . . . . . . . . . . . . . . . . . . . . . . . . . . . . . . . . . . . . . . . . . . . . . . . . . . . . . . . 5
Notes to Condensed Consolidated Financial Statements . . . . . . . . . . . . . . . . . . . . . . . . . . . 6Report of Independent Registered Public Accounting Firm . . . . . . . . . . . . . . . . . . . . . . . . 42
Item 2. Management’s Discussion and Analysis of Financial Condition and Results ofOperations . . . . . . . . . . . . . . . . . . . . . . . . . . . . . . . . . . . . . . . . . . . . . . . . . . . . . . . . . . . . . 43
Item 3. Quantitative and Qualitative Disclosures About Market Risk . . . . . . . . . . . . . . . . . . . . . . . 81Item 4. Controls and Procedures . . . . . . . . . . . . . . . . . . . . . . . . . . . . . . . . . . . . . . . . . . . . . . . . . . . . 88
Part II—Other InformationItem 1. Legal Proceedings . . . . . . . . . . . . . . . . . . . . . . . . . . . . . . . . . . . . . . . . . . . . . . . . . . . . . . . . . 89Item 1A. Risk Factors . . . . . . . . . . . . . . . . . . . . . . . . . . . . . . . . . . . . . . . . . . . . . . . . . . . . . . . . . . . . . 90Item 2. Unregistered Sales of Equity Securities and Use of Proceeds . . . . . . . . . . . . . . . . . . . . . . . 90Item 6. Exhibits . . . . . . . . . . . . . . . . . . . . . . . . . . . . . . . . . . . . . . . . . . . . . . . . . . . . . . . . . . . . . . . . . 91
i

AVAILABLE INFORMATION
Morgan Stanley files annual, quarterly and current reports, proxy statements and other information with theSecurities and Exchange Commission (the “SEC”). You may read and copy any document we file with the SECat the SEC’s public reference room at 100 F Street, NE, Washington, DC 20549. Please call the SEC at1-800-SEC-0330 for information on the public reference room. The SEC maintains an internet site that containsannual, quarterly and current reports, proxy and information statements and other information that issuers(including Morgan Stanley) file electronically with the SEC. Morgan Stanley’s electronic SEC filings areavailable to the public at the SEC’s internet site, www.sec.gov.
Morgan Stanley’s internet site is www.morganstanley.com. You can access Morgan Stanley’s Investor Relationswebpage at www.morganstanley.com/about/ir. Morgan Stanley makes available free of charge, on or through ourInvestor Relations webpage, its proxy statements, Annual Reports on Form 10-K, Quarterly Reports on Form10-Q, Current Reports on Form 8-K and any amendments to those reports filed or furnished pursuant to theSecurities Exchange Act of 1934, as amended (the “Exchange Act”), as soon as reasonably practicable after suchmaterial is electronically filed with, or furnished to, the SEC. Morgan Stanley also makes available, through itsInvestor Relations webpage, via a link to the SEC’s internet site, statements of beneficial ownership of MorganStanley’s equity securities filed by its directors, officers, 10% or greater shareholders and others under Section 16of the Exchange Act.
Morgan Stanley has a Corporate Governance webpage. You can access information about Morgan Stanley’scorporate governance at www.morganstanley.com/about/company/governance. Morgan Stanley posts thefollowing on its Corporate Governance webpage:
• Composite Certificate of Incorporation;
• Bylaws;
• Charters for our Audit Committee, Compensation, Management Development and Succession Committeeand Nominating and Governance Committee;
• Corporate Governance Policies;
• Policy Regarding Communication with the Board of Directors;
• Policy Regarding Director Candidates Recommended by Shareholders;
• Policy Regarding Corporate Political Contributions;
• Policy Regarding Shareholder Rights Plan;
• Code of Ethics and Business Conduct; and
• Integrity Hotline.
Morgan Stanley’s Code of Ethics and Business Conduct applies to all directors, officers and employees,including its Chief Executive Officer, its Chief Financial Officer and its Controller and Principal AccountingOfficer. Morgan Stanley will post any amendments to the Code of Ethics and Business Conduct and any waiversthat are required to be disclosed by the rules of either the SEC or the New York Stock Exchange, Inc. (“NYSE”)on its internet site. You can request a copy of these documents, excluding exhibits, at no cost, by contactingInvestor Relations, 1585 Broadway, New York, NY 10036 (212-761-4000). The information on MorganStanley’s internet site is not incorporated by reference into this report.
ii

Item 1.
MORGAN STANLEY
CONDENSED CONSOLIDATED STATEMENTS OF FINANCIAL CONDITION(dollars in millions, except share data)
February 28,2007
November 30,2006
(unaudited)
AssetsCash and cash equivalents . . . . . . . . . . . . . . . . . . . . . . . . . . . . . . . . . . . . . . . . . . . . . . . $ 16,636 $ 20,606Cash and securities deposited with clearing organizations or segregated under federal
and other regulations or requirements (including securities at fair value of $10,189at February 28, 2007 and $8,648 at November 30, 2006) . . . . . . . . . . . . . . . . . . . . . 35,739 29,565
Financial instruments owned (approximately $136 billion and $125 billion werepledged to various parties at February 28, 2007 and November 30, 2006,respectively):
U.S. government and agency securities . . . . . . . . . . . . . . . . . . . . . . . . . . . . . . . . . 42,569 39,352Other sovereign government obligations . . . . . . . . . . . . . . . . . . . . . . . . . . . . . . . . 32,349 27,305Corporate and other debt . . . . . . . . . . . . . . . . . . . . . . . . . . . . . . . . . . . . . . . . . . . . 181,963 169,664Corporate equities . . . . . . . . . . . . . . . . . . . . . . . . . . . . . . . . . . . . . . . . . . . . . . . . . 97,082 86,058Derivative contracts . . . . . . . . . . . . . . . . . . . . . . . . . . . . . . . . . . . . . . . . . . . . . . . . 50,952 55,443Physical commodities . . . . . . . . . . . . . . . . . . . . . . . . . . . . . . . . . . . . . . . . . . . . . . . 2,839 3,031
Total financial instruments owned . . . . . . . . . . . . . . . . . . . . . . . . . . . . . . . . . . . . . . . . . 407,754 380,853Securities received as collateral . . . . . . . . . . . . . . . . . . . . . . . . . . . . . . . . . . . . . . . . . . . 82,684 64,588Collateralized agreements:
Securities purchased under agreements to resell . . . . . . . . . . . . . . . . . . . . . . . . . . 192,038 174,866Securities borrowed . . . . . . . . . . . . . . . . . . . . . . . . . . . . . . . . . . . . . . . . . . . . . . . . 277,093 299,631
Receivables:Consumer loans (net of allowances of $790 at February 28, 2007 and $831 at
November 30, 2006) . . . . . . . . . . . . . . . . . . . . . . . . . . . . . . . . . . . . . . . . . . . . . . 22,429 24,173Customers . . . . . . . . . . . . . . . . . . . . . . . . . . . . . . . . . . . . . . . . . . . . . . . . . . . . . . . . 90,320 82,931Brokers, dealers and clearing organizations . . . . . . . . . . . . . . . . . . . . . . . . . . . . . . 14,426 7,633Fees, interest and other . . . . . . . . . . . . . . . . . . . . . . . . . . . . . . . . . . . . . . . . . . . . . . 11,087 9,700
Office facilities and other equipment, at cost (net of accumulated depreciation of$3,790 at February 28, 2007 and $3,645 at November 30, 2006) . . . . . . . . . . . . . . . 4,313 4,086
Goodwill . . . . . . . . . . . . . . . . . . . . . . . . . . . . . . . . . . . . . . . . . . . . . . . . . . . . . . . . . . . . . 3,131 2,792Intangible assets (net of accumulated amortization of $137 million at February 28,
2007 and $109 million at November 30, 2006) . . . . . . . . . . . . . . . . . . . . . . . . . . . . . 1,131 651Other assets . . . . . . . . . . . . . . . . . . . . . . . . . . . . . . . . . . . . . . . . . . . . . . . . . . . . . . . . . . 23,280 19,117
Total assets . . . . . . . . . . . . . . . . . . . . . . . . . . . . . . . . . . . . . . . . . . . . . . . . . . . . . . . . . . . $1,182,061 $1,121,192
1

MORGAN STANLEY
CONDENSED CONSOLIDATED STATEMENTS OF FINANCIAL CONDITION—(Continued)(dollars in millions, except share data)
February 28,2007
November 30,2006
(unaudited)Liabilities and Shareholders’ EquityCommercial paper and other short-term borrowings . . . . . . . . . . . . . . . . . . . . . . . . . . . $ 33,829 $ 29,092Deposits . . . . . . . . . . . . . . . . . . . . . . . . . . . . . . . . . . . . . . . . . . . . . . . . . . . . . . . . . . . . . 37,313 28,343Financial instruments sold, not yet purchased:
U.S. government and agency securities . . . . . . . . . . . . . . . . . . . . . . . . . . . . . . . . . 18,062 26,168Other sovereign government obligations . . . . . . . . . . . . . . . . . . . . . . . . . . . . . . . . 26,192 28,961Corporate and other debt . . . . . . . . . . . . . . . . . . . . . . . . . . . . . . . . . . . . . . . . . . . . 8,436 10,336Corporate equities . . . . . . . . . . . . . . . . . . . . . . . . . . . . . . . . . . . . . . . . . . . . . . . . . 52,086 59,399Derivative contracts . . . . . . . . . . . . . . . . . . . . . . . . . . . . . . . . . . . . . . . . . . . . . . . . 51,574 57,491Physical commodities . . . . . . . . . . . . . . . . . . . . . . . . . . . . . . . . . . . . . . . . . . . . . . . 1,457 764
Total financial instruments sold, not yet purchased . . . . . . . . . . . . . . . . . . . . . . . . . . . . 157,807 183,119Obligation to return securities received as collateral . . . . . . . . . . . . . . . . . . . . . . . . . . . 82,684 64,588Collateralized financings:
Securities sold under agreements to repurchase . . . . . . . . . . . . . . . . . . . . . . . . . . . 288,672 267,566Securities loaned . . . . . . . . . . . . . . . . . . . . . . . . . . . . . . . . . . . . . . . . . . . . . . . . . . 161,839 150,257Other secured financings . . . . . . . . . . . . . . . . . . . . . . . . . . . . . . . . . . . . . . . . . . . . 51,594 45,556
Payables:Customers . . . . . . . . . . . . . . . . . . . . . . . . . . . . . . . . . . . . . . . . . . . . . . . . . . . . . . . . 132,980 134,907Brokers, dealers and clearing organizations . . . . . . . . . . . . . . . . . . . . . . . . . . . . . . 8,806 7,635Interest and dividends . . . . . . . . . . . . . . . . . . . . . . . . . . . . . . . . . . . . . . . . . . . . . . 4,687 4,746
Other liabilities and accrued expenses . . . . . . . . . . . . . . . . . . . . . . . . . . . . . . . . . . . . . . 24,063 24,975Long-term borrowings . . . . . . . . . . . . . . . . . . . . . . . . . . . . . . . . . . . . . . . . . . . . . . . . . . 159,833 144,978
1,144,107 1,085,762
Capital Units . . . . . . . . . . . . . . . . . . . . . . . . . . . . . . . . . . . . . . . . . . . . . . . . . . . . . . . . . . — 66
Commitments and contingenciesShareholders’ equity:
Preferred stock . . . . . . . . . . . . . . . . . . . . . . . . . . . . . . . . . . . . . . . . . . . . . . . . . . . . 1,100 1,100Common stock, $0.01 par value;
Shares authorized: 3,500,000,000 at February 28, 2007 andNovember 30, 2006;
Shares issued: 1,211,701,552 at February 28, 2007 andNovember 30, 2006;
Shares outstanding: 1,061,644,077 at February 28, 2007 and1,048,877,006 at November 30, 2006 . . . . . . . . . . . . . . . . . . . . . . . . . . . . 12 12
Paid-in capital . . . . . . . . . . . . . . . . . . . . . . . . . . . . . . . . . . . . . . . . . . . . . . . . . . . . . 2,084 2,213Retained earnings . . . . . . . . . . . . . . . . . . . . . . . . . . . . . . . . . . . . . . . . . . . . . . . . . . 43,975 41,422Employee stock trust . . . . . . . . . . . . . . . . . . . . . . . . . . . . . . . . . . . . . . . . . . . . . . . 5,773 4,315Accumulated other comprehensive loss . . . . . . . . . . . . . . . . . . . . . . . . . . . . . . . . . (127) (35)Common stock held in treasury, at cost, $0.01 par value;
150,057,475 shares at February 28, 2007 and 162,824,546 shares atNovember 30, 2006 . . . . . . . . . . . . . . . . . . . . . . . . . . . . . . . . . . . . . . . . . . (9,090) (9,348)
Common stock issued to employee trust . . . . . . . . . . . . . . . . . . . . . . . . . . . . . . . . (5,773) (4,315)
Total shareholders’ equity . . . . . . . . . . . . . . . . . . . . . . . . . . . . . . . . . . . 37,954 35,364
Total liabilities and shareholders’ equity . . . . . . . . . . . . . . . . . . . . . . . . . . . . . . . . $1,182,061 $1,121,192
See Notes to Condensed Consolidated Financial Statements.
2
MORGAN STANLEY
CONDENSED CONSOLIDATED STATEMENTS OF INCOME(dollars in millions, except share and per share data)
Three Months EndedFebruary 28,
2007 2006
(unaudited)Revenues:
Investment banking . . . . . . . . . . . . . . . . . . . . . . . . . . . . . . . . . . . . . . . . . . . . . . . . . . . . . . . . . . . . . . . . $ 1,227 $ 982Principal transactions:
Trading . . . . . . . . . . . . . . . . . . . . . . . . . . . . . . . . . . . . . . . . . . . . . . . . . . . . . . . . . . . . . . . . . . . . . 4,158 3,086Investments . . . . . . . . . . . . . . . . . . . . . . . . . . . . . . . . . . . . . . . . . . . . . . . . . . . . . . . . . . . . . . . . . . 920 349
Commissions . . . . . . . . . . . . . . . . . . . . . . . . . . . . . . . . . . . . . . . . . . . . . . . . . . . . . . . . . . . . . . . . . . . . . 1,005 920Fees:
Asset management, distribution and administration . . . . . . . . . . . . . . . . . . . . . . . . . . . . . . . . . . . 1,479 1,268Merchant, cardmember and other fees, net . . . . . . . . . . . . . . . . . . . . . . . . . . . . . . . . . . . . . . . . . . 297 289
Servicing and securitization income . . . . . . . . . . . . . . . . . . . . . . . . . . . . . . . . . . . . . . . . . . . . . . . . . . . 556 596Interest and dividends . . . . . . . . . . . . . . . . . . . . . . . . . . . . . . . . . . . . . . . . . . . . . . . . . . . . . . . . . . . . . . 14,814 10,544Other . . . . . . . . . . . . . . . . . . . . . . . . . . . . . . . . . . . . . . . . . . . . . . . . . . . . . . . . . . . . . . . . . . . . . . . . . . . 222 134
Total revenues . . . . . . . . . . . . . . . . . . . . . . . . . . . . . . . . . . . . . . . . . . . . . . . . . . . . . . . . . . . . . . . . 24,678 18,168Interest expense . . . . . . . . . . . . . . . . . . . . . . . . . . . . . . . . . . . . . . . . . . . . . . . . . . . . . . . . . . . . . . . . . . . 13,485 9,461Provision for consumer loan losses . . . . . . . . . . . . . . . . . . . . . . . . . . . . . . . . . . . . . . . . . . . . . . . . . . . . 195 155
Net revenues . . . . . . . . . . . . . . . . . . . . . . . . . . . . . . . . . . . . . . . . . . . . . . . . . . . . . . . . . . . . . . . . . 10,998 8,552
Non-interest expenses:Compensation and benefits . . . . . . . . . . . . . . . . . . . . . . . . . . . . . . . . . . . . . . . . . . . . . . . . . . . . . . . . . . 4,992 4,242Occupancy and equipment . . . . . . . . . . . . . . . . . . . . . . . . . . . . . . . . . . . . . . . . . . . . . . . . . . . . . . . . . . 280 230Brokerage, clearing and exchange fees . . . . . . . . . . . . . . . . . . . . . . . . . . . . . . . . . . . . . . . . . . . . . . . . . 361 292Information processing and communications . . . . . . . . . . . . . . . . . . . . . . . . . . . . . . . . . . . . . . . . . . . . 369 346Marketing and business development . . . . . . . . . . . . . . . . . . . . . . . . . . . . . . . . . . . . . . . . . . . . . . . . . . 294 238Professional services . . . . . . . . . . . . . . . . . . . . . . . . . . . . . . . . . . . . . . . . . . . . . . . . . . . . . . . . . . . . . . . 499 433Other . . . . . . . . . . . . . . . . . . . . . . . . . . . . . . . . . . . . . . . . . . . . . . . . . . . . . . . . . . . . . . . . . . . . . . . . . . . 339 311
Total non-interest expenses . . . . . . . . . . . . . . . . . . . . . . . . . . . . . . . . . . . . . . . . . . . . . . . . . . . . . . 7,134 6,092
Income from continuing operations before losses from unconsolidated investees and income taxes . . . . . 3,864 2,460Losses from unconsolidated investees . . . . . . . . . . . . . . . . . . . . . . . . . . . . . . . . . . . . . . . . . . . . . . . . . . . . . 44 69Provision for income taxes . . . . . . . . . . . . . . . . . . . . . . . . . . . . . . . . . . . . . . . . . . . . . . . . . . . . . . . . . . . . . . 1,261 789
Income from continuing operations . . . . . . . . . . . . . . . . . . . . . . . . . . . . . . . . . . . . . . . . . . . . . . . . . . . . . . . 2,559 1,602Discontinued operations:
Gain/(loss) from discontinued operations . . . . . . . . . . . . . . . . . . . . . . . . . . . . . . . . . . . . . . . . . . . . . . . 174 (48)Income tax (provision)/benefit . . . . . . . . . . . . . . . . . . . . . . . . . . . . . . . . . . . . . . . . . . . . . . . . . . . . . . . (61) 20
Gain/(loss) on discontinued operations . . . . . . . . . . . . . . . . . . . . . . . . . . . . . . . . . . . . . . . . . . . . . 113 (28)
Net income . . . . . . . . . . . . . . . . . . . . . . . . . . . . . . . . . . . . . . . . . . . . . . . . . . . . . . . . . . . . . . . . . . . . . . . . . . $ 2,672 $ 1,574
Preferred stock dividend requirements . . . . . . . . . . . . . . . . . . . . . . . . . . . . . . . . . . . . . . . . . . . . . . . . . . . . . $ 17 $ —
Earnings applicable to common shareholders . . . . . . . . . . . . . . . . . . . . . . . . . . . . . . . . . . . . . . . . . . . . . . . . $ 2,655 $ 1,574
Earnings per basic common share:Income from continuing operations . . . . . . . . . . . . . . . . . . . . . . . . . . . . . . . . . . . . . . . . . . . . . . . . . . . $ 2.52 $ 1.57Gain/(loss) on discontinued operations . . . . . . . . . . . . . . . . . . . . . . . . . . . . . . . . . . . . . . . . . . . . . . . . . 0.11 (0.03)
Earnings per basic common share . . . . . . . . . . . . . . . . . . . . . . . . . . . . . . . . . . . . . . . . . . . . . . . . . $ 2.63 $ 1.54
Earnings per diluted common share:Income from continuing operations . . . . . . . . . . . . . . . . . . . . . . . . . . . . . . . . . . . . . . . . . . . . . . . . . . . $ 2.40 $ 1.51Gain/(loss) on discontinued operations . . . . . . . . . . . . . . . . . . . . . . . . . . . . . . . . . . . . . . . . . . . . . . . . . 0.11 (0.03)
Earnings per diluted common share . . . . . . . . . . . . . . . . . . . . . . . . . . . . . . . . . . . . . . . . . . . . . . . $ 2.51 $ 1.48
Average common shares outstanding:Basic . . . . . . . . . . . . . . . . . . . . . . . . . . . . . . . . . . . . . . . . . . . . . . . . . . . . . . . . . . . . . . . . . . . . . . . . . . . 1,009,186,993 1,020,041,181
Diluted . . . . . . . . . . . . . . . . . . . . . . . . . . . . . . . . . . . . . . . . . . . . . . . . . . . . . . . . . . . . . . . . . . . . . . . . . . 1,057,912,545 1,061,764,798
See Notes to Condensed Consolidated Financial Statements.
3

MORGAN STANLEY
CONDENSED CONSOLIDATED STATEMENTS OF COMPREHENSIVE INCOME(dollars in millions)
Three MonthsEnded
February 28,
2007 2006
(unaudited)
Net income . . . . . . . . . . . . . . . . . . . . . . . . . . . . . . . . . . . . . . . . . . . . . . . . . . . . . . . . . . . . . . . . . . $2,672 $1,574Other comprehensive income (loss), net of tax:
Foreign currency translation adjustments . . . . . . . . . . . . . . . . . . . . . . . . . . . . . . . . . . . . . . . (102) 33Net change in cash flow hedges . . . . . . . . . . . . . . . . . . . . . . . . . . . . . . . . . . . . . . . . . . . . . . 8 27Minimum pension liability adjustment . . . . . . . . . . . . . . . . . . . . . . . . . . . . . . . . . . . . . . . . . 2 —
Comprehensive income . . . . . . . . . . . . . . . . . . . . . . . . . . . . . . . . . . . . . . . . . . . . . . . . . . . . . . . . . $2,580 $1,634
See Notes to Condensed Consolidated Financial Statements.
4

MORGAN STANLEY
CONDENSED CONSOLIDATED STATEMENTS OF CASH FLOWS(dollars in millions)
Three Months EndedFebruary 28,
2007 2006
(unaudited)CASH FLOWS FROM OPERATING ACTIVITIESNet income . . . . . . . . . . . . . . . . . . . . . . . . . . . . . . . . . . . . . . . . . . . . . . . . . . . . . . . . . . . . . . . $ 2,672 $ 1,574
Adjustments to reconcile net income to net cash used for operating activities:Compensation payable in common stock and options . . . . . . . . . . . . . . . . . . . . . . . . . . 607 763Depreciation and amortization . . . . . . . . . . . . . . . . . . . . . . . . . . . . . . . . . . . . . . . . . . . . 204 179Provision for consumer loan losses . . . . . . . . . . . . . . . . . . . . . . . . . . . . . . . . . . . . . . . . 195 155Gain on sale of Quilter . . . . . . . . . . . . . . . . . . . . . . . . . . . . . . . . . . . . . . . . . . . . . . . . . . (168) —Aircraft-related charges . . . . . . . . . . . . . . . . . . . . . . . . . . . . . . . . . . . . . . . . . . . . . . . . . — 125
Changes in assets and liabilities:Cash and securities deposited with clearing organizations or segregated under federal
and other regulations or requirements . . . . . . . . . . . . . . . . . . . . . . . . . . . . . . . . . . . . (6,171) 1,830Financial instruments owned, net of financial instruments sold, not yet purchased . . . (44,068) (20,398)Securities borrowed . . . . . . . . . . . . . . . . . . . . . . . . . . . . . . . . . . . . . . . . . . . . . . . . . . . . 22,538 (8,655)Securities loaned . . . . . . . . . . . . . . . . . . . . . . . . . . . . . . . . . . . . . . . . . . . . . . . . . . . . . . . 11,582 20,567Receivables and other assets . . . . . . . . . . . . . . . . . . . . . . . . . . . . . . . . . . . . . . . . . . . . . (19,048) (26,298)Payables and other liabilities . . . . . . . . . . . . . . . . . . . . . . . . . . . . . . . . . . . . . . . . . . . . . (1,807) 2,648Securities purchased under agreements to resell . . . . . . . . . . . . . . . . . . . . . . . . . . . . . . (17,172) (1,930)Securities sold under agreements to repurchase . . . . . . . . . . . . . . . . . . . . . . . . . . . . . . . 20,471 8,450
Net cash used for operating activities . . . . . . . . . . . . . . . . . . . . . . . . . . . . . . . . . . . . . . . . . . . (30,165) (20,990)
CASH FLOWS FROM INVESTING ACTIVITIESNet (payments for) proceeds from:
Office facilities and aircraft under operating leases . . . . . . . . . . . . . . . . . . . . . . . . . . . . (295) (129)Business acquisitions, net of cash acquired . . . . . . . . . . . . . . . . . . . . . . . . . . . . . . . . . . (1,167) (1,676)Net principal disbursed on consumer loans . . . . . . . . . . . . . . . . . . . . . . . . . . . . . . . . . . (623) (2,857)Sales of consumer loans . . . . . . . . . . . . . . . . . . . . . . . . . . . . . . . . . . . . . . . . . . . . . . . . . 1,578 6,613
Net cash (used for) provided by investing activities . . . . . . . . . . . . . . . . . . . . . . . . . . . . . . . (507) 1,951
CASH FLOWS FROM FINANCING ACTIVITIESNet proceeds from (payments for):
Short-term borrowings . . . . . . . . . . . . . . . . . . . . . . . . . . . . . . . . . . . . . . . . . . . . . . . . . . 4,523 (1,711)Derivatives financing activities . . . . . . . . . . . . . . . . . . . . . . . . . . . . . . . . . . . . . . . . . . . (578) (168)Other secured financings . . . . . . . . . . . . . . . . . . . . . . . . . . . . . . . . . . . . . . . . . . . . . . . . (409) 3,501Deposits . . . . . . . . . . . . . . . . . . . . . . . . . . . . . . . . . . . . . . . . . . . . . . . . . . . . . . . . . . . . . 8,950 4,668Tax benefits associated with stock-based awards . . . . . . . . . . . . . . . . . . . . . . . . . . . . . 110 14
Net proceeds from:Issuance of common stock . . . . . . . . . . . . . . . . . . . . . . . . . . . . . . . . . . . . . . . . . . . . . . . 332 99Issuance of long-term borrowings . . . . . . . . . . . . . . . . . . . . . . . . . . . . . . . . . . . . . . . . . 21,839 12,093
Payments for:Repayments of long-term borrowings . . . . . . . . . . . . . . . . . . . . . . . . . . . . . . . . . . . . . . (6,484) (1,973)Redemption of Capital Units . . . . . . . . . . . . . . . . . . . . . . . . . . . . . . . . . . . . . . . . . . . . . (66) —Repurchases of common stock . . . . . . . . . . . . . . . . . . . . . . . . . . . . . . . . . . . . . . . . . . . . (1,210) (1,199)Cash dividends . . . . . . . . . . . . . . . . . . . . . . . . . . . . . . . . . . . . . . . . . . . . . . . . . . . . . . . . (305) (290)
Net cash provided by financing activities . . . . . . . . . . . . . . . . . . . . . . . . . . . . . . . . . . . . . . . 26,702 15,034
Net decrease in cash and cash equivalents . . . . . . . . . . . . . . . . . . . . . . . . . . . . . . . . . . . . . . . (3,970) (4,005)Cash and cash equivalents, at beginning of period . . . . . . . . . . . . . . . . . . . . . . . . . . . . . . . . . 20,606 29,414
Cash and cash equivalents, at end of period . . . . . . . . . . . . . . . . . . . . . . . . . . . . . . . . . . . . . . $ 16,636 $ 25,409
See Notes to Condensed Consolidated Financial Statements.
5

MORGAN STANLEY
NOTES TO CONDENSED CONSOLIDATED FINANCIAL STATEMENTS(UNAUDITED)
1. Introduction and Basis of Presentation.
The Company. Morgan Stanley (the “Company”) is a global financial services firm that maintains significantmarket positions in each of its business segments—Institutional Securities, Global Wealth Management Group,Asset Management and Discover.
A summary of the activities of each of the Company’s business segments is as follows:
Institutional Securities includes capital raising; financial advisory services, including advice on mergers andacquisitions, restructurings, real estate and project finance; corporate lending; sales, trading, financing andmarket-making activities in equity securities and related products and fixed income securities and relatedproducts, including foreign exchange and commodities; benchmark indices and risk management analytics;research; and investment activities.
Global Wealth Management Group provides brokerage and investment advisory services covering variousinvestment alternatives; financial and wealth planning services; annuity and other insurance products; creditand other lending products; banking and cash management services; retirement services; and trust andfiduciary services.
Asset Management provides global asset management products and services in equity, fixed income,alternative investments and private equity to institutional and retail clients through proprietary and thirdparty retail distribution channels, intermediaries and the Company’s institutional distribution channel. AssetManagement also engages in investment activities.
Discover offers Discover®-branded credit cards and related consumer products and services and operates theDiscover Network, a merchant and cash access network for Discover Network-branded cards, and PULSE®
EFT Association LP (“PULSE”), an automated teller machine/debit and electronic funds transfer network.Discover also offers consumer finance products and services in the U.K., including Morgan Stanley-branded, Goldfish-branded and various other credit cards issued on the MasterCard and Visa networks.
On December 19, 2006, the Company announced that its Board of Directors had approved the spin-off ofDiscover (the “Discover Spin-off”). The Discover Spin-off, which is subject to regulatory approval and othercustomary conditions, is expected to occur in the third quarter of fiscal 2007.
Basis of Financial Information. The condensed consolidated financial statements are prepared in accordancewith accounting principles generally accepted in the U.S., which require the Company to make estimates andassumptions regarding the valuations of certain financial instruments, consumer loan loss levels, the outcome oflitigation and tax matters, incentive-based compensation accruals and other matters that affect the condensedconsolidated financial statements and related disclosures. The Company believes that the estimates utilized in thepreparation of the condensed consolidated financial statements are prudent and reasonable. Actual results coulddiffer materially from these estimates.
In connection with the Company’s application of Staff Accounting Bulletin No. 108, “Considering the Effects ofPrior Year Misstatements when Quantifying Misstatements in Current Year Financial Statements” in fiscal 2006,the Company has adjusted its opening retained earnings for fiscal 2006 and its financial results for the first twoquarters of fiscal 2006. See Note 24 to the consolidated financial statements for the fiscal year endedNovember 30, 2006, included in the Form 10-K.
The Company maintains various deferred compensation plans for the benefit of certain employees. Beginning inthe quarter ended February 28, 2007, increases or decreases in assets or earnings associated with such plans arereflected in net revenues, and increases or decreases in liabilities associated with such plans are reflected incompensation expense. Previously, the increases or decreases in assets and liabilities associated with these planswere both recorded in net revenues. Prior periods have been reclassified to conform to the current presentation.
6

MORGAN STANLEY
NOTES TO CONDENSED CONSOLIDATED FINANCIAL STATEMENTS—(Continued)(UNAUDITED)
The amount of the reclassification that was recorded in the three months ended February 28, 2007 andFebruary 28, 2006 was $245 million and $94 million, respectively.
All material intercompany balances and transactions have been eliminated.
Consolidation. The condensed consolidated financial statements include the accounts of the Company, itswholly-owned subsidiaries and other entities in which the Company has a controlling financial interest.
For entities where (1) the total equity investment at risk is sufficient to enable the entity to finance its activitiesindependently, and (2) the equity holders bear the economic residual risks of the entity and have the right tomake decisions about the entity’s activities, the Company consolidates those entities it controls through amajority voting interest or otherwise. For entities that do not meet these criteria, commonly known as variableinterest entities (“VIE”), the Company consolidates those entities where the Company absorbs a majority of theexpected losses or a majority of the expected residual returns, or both, of such entity.
Notwithstanding the above, certain securitization vehicles, commonly known as qualifying special purposeentities, are not consolidated by the Company if they meet certain criteria regarding the types of assets andderivatives they may hold, the types of sales they may engage in, and the range of discretion they may exercise inconnection with the assets they hold.
For investments in entities in which the Company does not have a controlling financial interest, but hassignificant influence over operating and financial decisions, the Company generally applies the equity method ofaccounting. As discussed in Note 18, the Company has elected to fair value certain investments that hadpreviously been accounted for under the equity method.
Equity and partnership interests held by entities qualifying for accounting purposes as investment companies arecarried at fair value.
The Company’s U.S. and international subsidiaries include Morgan Stanley & Co. Incorporated (“MS&Co.”),Morgan Stanley & Co. International Limited (“MSIL”), Morgan Stanley Japan Securities Co., Ltd. (“MSJS”),Morgan Stanley Investment Advisors Inc. and Discover Financial Services (formerly NOVUS Credit ServicesInc.). On April 1, 2007, the Company merged Morgan Stanley DW Inc. (“MSDWI”) into MS&Co. Uponcompletion of the merger, the surviving entity, MS&Co., became the Company’s principal U.S. broker-dealer.
Income Statement Presentation. The Company, through its subsidiaries and affiliates, provides a wide varietyof products and services to a large and diversified group of clients and customers, including corporations,governments, financial institutions and individuals. In connection with the delivery of the various products andservices to clients, the Company manages its revenues and related expenses in the aggregate. As such, whenassessing the performance of its businesses, the Company considers its principal trading, investment banking,commissions and interest and dividend income, along with the associated interest expense and provision for loanlosses, as one integrated activity for each of the Company’s separate businesses.
The Company’s cost infrastructure supporting its businesses varies by activity. In some cases, these costs aredirectly attributable to one line of business, and, in other cases, such costs relate to multiple businesses. As such,when assessing the performance of its businesses, the Company does not consider these costs separately, butrather assesses performance in the aggregate along with the related revenues.
Therefore, the Company’s pricing structure considers various items, including the level of expenses incurreddirectly and indirectly to support the cost infrastructure, the risk it incurs in connection with a transaction, theoverall client relationship and the availability in the market for the particular product and/or service.Accordingly, the Company does not manage or capture the costs associated with the products or services sold orits general and administrative costs by revenue line, in total or by product.
7

MORGAN STANLEY
NOTES TO CONDENSED CONSOLIDATED FINANCIAL STATEMENTS—(Continued)(UNAUDITED)
Discontinued Operations.
Quilter Holdings Ltd. The results of Quilter Holdings Ltd. (“Quilter”) are reported as discontinued operationsfor all periods presented through its sale on February 28, 2007. The results of Quilter were formerly included inthe Global Wealth Management Group business segment.
Aircraft Leasing. The Company’s aircraft leasing business was classified as “held for sale” prior to its sale onMarch 24, 2006, and associated revenues and expenses through the date of sale have been reported asdiscontinued operations for the quarter ended February 28, 2006. The results of the Company’s aircraft leasingbusiness were formerly included in the Institutional Securities business segment.
See Note 15 for additional information on discontinued operations.
Revenue Recognition.
Investment Banking. Underwriting revenues and fees for mergers, acquisitions and advisory assignments arerecorded when services for the transactions are determined to be completed, generally as set forth under the termsof the engagement. Transaction-related expenses, primarily consisting of legal, travel and other costs directlyassociated with the transaction, are deferred and recognized in the same period as the related investment bankingtransaction revenue. Underwriting revenues are presented net of related expenses. Non-reimbursed expensesassociated with advisory transactions are recorded within Non-interest expenses.
Commissions. The Company generates commissions from executing and clearing customer transactions onstock, options and futures markets. Commission revenues are recorded in the accounts on trade date.
Asset Management, Distribution and Administration Fees. Asset management, distribution and administrationfees are recognized over the relevant contract period, generally quarterly or annually. In certain management feearrangements, the Company is entitled to receive performance fees when the return on assets under managementexceeds certain benchmark returns or other performance targets. In such arrangements, performance fee revenueis accrued quarterly based on measuring account/fund performance to date versus the performance benchmarkstated in the investment management agreement.
Merchant, Cardmember and Other Fees, Net. Merchant, cardmember and other fees include revenues from feescharged to merchants on credit card sales (net of interchange fees paid to banks that issue cards on theCompany’s merchant and cash access network), transaction processing fees on debit card transactions as well ascharges to cardmembers for late payment fees, overlimit fees, balance transfer fees, credit protection fees andcash advance fees, net of cardmember rewards. Merchant, cardmember and other fees are recognized as earned.Cardmember rewards include various reward programs, including the Cashback Bonus® reward program,pursuant to which the Company pays certain cardmembers a percentage of their purchase amounts based upon acardmember’s level and type of purchases. The liability for cardmember rewards, included in Other liabilitiesand accrued expenses, is computed on an individual cardmember basis and is accumulated as qualifiedcardmembers make progress toward earning a reward through their ongoing purchase activity. In determining theliability for cardmember rewards, the Company considers estimated forfeitures based on historical accountclosure, charge-off and transaction activity. The Company records the cost of its cardmember reward programsas a reduction of Merchant, cardmember and other fees.
Consumer Loans. Consumer loans, which consist primarily of general purpose credit card, mortgage andconsumer installment loans, are generally reported at their principal amounts outstanding less applicableallowances. Interest on consumer loans is recorded to income as earned. Interest is generally accrued on creditcard loans until the date of charge-off, which generally occurs at the end of the month during which an account
8

MORGAN STANLEY
NOTES TO CONDENSED CONSOLIDATED FINANCIAL STATEMENTS—(Continued)(UNAUDITED)
becomes 180 contractually days past due, except in the case of cardmember bankruptcies, probate accounts, andfraudulent transactions. Cardmember bankruptcies and probate accounts are charged off at the end of the month60 days following the receipt of notification of the bankruptcy or death but not later than the 180-day contractualtime frame. Fraudulent transactions are reported in consumer loans at their net realizable value upon receipt ofnotification of the fraud through a charge to operating expenses and are subsequently written off at the end of themonth 90 days following notification but not later than the contractual 180-day time frame. The interest portionof charged-off credit card loans is written off against interest revenue. Origination costs related to the issuance ofcredit cards are charged to earnings over periods not exceeding 12 months.
The Company classifies a portion of its consumer loans as held for sale. Loans held for sale include the lesser ofloans eligible for securitization or sale, or loans that management intends to securitize within three months, net ofamortizing securitizations. These loans are carried at the lower of aggregate cost or fair value.
As discussed in Note 18, the Company has elected to account for certain mortgage lending products at fair value.
Financial Instruments. The Company’s financial assets and financial liabilities are primarily recorded at fairvalue. Fair value is the price that would be received to sell an asset or paid to transfer a liability in an orderlytransaction between market participants at the measurement date.
As a result of the Company’s adoption of Statement of Financial Accounting Standards (“SFAS”) No. 159, “TheFair Value Option for Financial Assets and Financial Liabilities” (“SFAS No. 159”), on December 1, 2006, theCompany elected the fair value option for certain instruments. Such instruments included loans and otherfinancial instruments held by subsidiaries that are not registered broker-dealers as defined in the AICPA Auditand Accounting Guide, Brokers and Dealers in Securities, or that are held by investment companies as defined inthe AICPA Audit and Accounting Guide, Investment Companies. A substantial portion of these positions, as wellas the financial instruments included within Other secured financings, had been accounted for by the Company atfair value prior to the adoption of SFAS No. 159. Changes in the fair value of these positions are included withinPrincipal transactions—trading revenues in the Company’s condensed consolidated statements of income.
Financial Instruments Used for Trading and Investment. Financial instruments owned and Financialinstruments sold, not yet purchased, which include cash and derivative products, are recorded at fair value in thecondensed consolidated statements of financial condition, and gains and losses are reflected net in Principaltransactions—trading revenues in the condensed consolidated statements of income.
The fair value of the Company’s financial instruments are generally based on or derived from bid prices orparameters for Financial instruments owned and ask prices or parameters for Financial instruments sold, not yetpurchased.
A substantial percentage of the fair value of the Company’s financial instruments used for trading and investmentis based on observable market prices, observable market parameters, or is derived from such prices orparameters. The availability of observable market prices and pricing parameters can vary from product toproduct. Where available, observable market prices and pricing parameters in a product (or a related product)may be used to derive a price without requiring significant judgment. In certain markets, such as for products thatare less actively traded, observable market prices or market parameters are not available, and fair value isdetermined using techniques appropriate for each particular product. These techniques involve some degree ofjudgment.
9

MORGAN STANLEY
NOTES TO CONDENSED CONSOLIDATED FINANCIAL STATEMENTS—(Continued)(UNAUDITED)
In the case of financial instruments transacted on recognized exchanges, the observable prices representquotations for completed transactions from the exchange on which the financial instrument is principally traded.Also as a result of the adoption of SFAS No. 157, “Fair Value Measurements” (“SFAS No. 157”), onDecember 1, 2006, the Company no longer utilizes block discounts in cases where it has large holdings ofunrestricted financial instruments with quoted prices that are readily and regularly available in an active market.
In the case of over-the-counter (“OTC”) derivative contracts, fair value is derived primarily using pricingmodels, which may require multiple market input parameters. Where appropriate, valuation adjustments aremade to account for credit quality and market liquidity. These adjustments are applied on a consistent basis andare based upon observable market data where available. The Company also uses pricing models to manage therisks introduced by OTC derivatives. Depending on the product and the terms of the transaction, the fair value ofOTC derivative products can be modeled using a series of techniques, including closed-form analytic formulae,such as the Black-Scholes option pricing model, simulation models or a combination thereof, appliedconsistently. In the case of more established derivative products, the pricing models used by the Company arewidely accepted by the financial services industry. Pricing models take into account the contract terms, includingthe maturity, as well as market parameters such as interest rates, volatility and the creditworthiness of thecounterparty. As a result of the Company’s adoption of SFAS No. 157, the impact of the Company’s own creditspreads are also considered when measuring the fair value of liabilities, including certain OTC derivativecontracts.
Prior to the adoption of SFAS No. 157, the Company followed the provisions of Emerging Issues Task Force(“EITF”) Issue No. 02-3, “Issues Involved in Accounting for Derivative Contracts Held for Trading Purposes andContracts Involved in Energy Trading and Risk Management Activities” (“EITF Issue No. 02-3”). See also Note18. Under EITF Issue No. 02-3, in the absence of observable market prices or parameters in an active market,observable prices or parameters of other comparable current market transactions, or other observable datasupporting a fair value based on a pricing model at the inception of a contract, revenue recognition at theinception of an OTC derivative financial instrument was not permitted. Such revenue was recognized in incomeat the earlier of when there was market value observability or at the end of the contract period. In the absence ofobservable market prices or parameters in an active market, observable prices or parameters of other comparablecurrent market transactions, or other observable data supporting a fair value based on a pricing model at theinception of a contract, fair value was based on the transaction price. With the adoption of SFAS No. 157, theCompany is no longer applying the revenue recognition criteria of EITF Issue No. 02-3.
Substantially all equity and debt investments purchased in connection with private equity and other investmentactivities are valued at fair value and are included within Other assets in the condensed consolidated statementsof financial condition, and gains and losses are reflected in Principal transactions—investment revenues. Thecarrying value of such investments reflects expected exit values based upon appropriate valuation techniquesapplied on a consistent basis. Such techniques employ various market, income and cost approaches to determinefair value at the measurement date. The Company’s partnership interests, including general partnership andlimited partnership interests in real estate funds, are included within Other assets in the condensed consolidatedstatements of financial condition and are recorded at fair value based upon changes in the fair value of theunderlying partnership’s net assets.
Purchases and sales of financial instruments and related expenses are recorded on trade date. The fair value ofOTC financial instruments, including derivative contracts related to financial instruments and commodities, arepresented in the accompanying condensed consolidated statements of financial condition on anet-by-counterparty basis, when appropriate.
10

MORGAN STANLEY
NOTES TO CONDENSED CONSOLIDATED FINANCIAL STATEMENTS—(Continued)(UNAUDITED)
The Company nets cash collateral paid or received against its derivatives inventory under credit support annexes,which the Company views as conditional contracts, pursuant to legally enforceable master netting agreements.
Financial Instruments Used for Asset and Liability Management. The Company applies hedge accounting tovarious derivative financial instruments used to hedge interest rate, foreign exchange and credit risk arising fromassets, liabilities and forecasted transactions. These instruments are included within Financial instrumentsowned—derivative contracts or Financial instruments sold, not yet purchased—derivative contracts within thecondensed consolidated statements of financial condition.
These hedges are designated and qualify for accounting purposes as one of the following types of hedges: hedgesof changes in fair value of assets and liabilities due to the risk being hedged (fair value hedges), hedges of thevariability of future cash flows from forecasted transactions and floating rate assets and liabilities due to the riskbeing hedged (cash flow hedges) and hedges of net investments in foreign operations whose functional currencyis different from the reporting currency of the parent company (net investment hedges).
For all hedges where hedge accounting is being applied, effectiveness testing and other procedures to ensure theongoing validity of the hedges are performed at least monthly. The impact of hedge ineffectiveness and amountsexcluded from the assessment of hedge effectiveness on the condensed consolidated statements of income wasnot material for all periods presented. If a derivative is de-designated as a hedge, it is thereafter accounted for asa financial instrument used for trading.
Fair Value Hedges – Interest Rate Risk.
In the first quarter of fiscal 2007, the Company’s designated fair value hedges consisted primarily of interest rateswaps designated as fair value hedges of changes in the benchmark interest rate of senior long-term fixed rateborrowings. In the first quarter of fiscal 2007, the Company began using regression analysis to perform anongoing prospective and retrospective assessment of the effectiveness of these hedging relationships (i.e., theCompany applied the “long-haul” method of hedge accounting). A hedging relationship is deemed to be effectiveif the fair values of the hedging instrument (derivative) and the hedged item (debt liability) change inverselywithin a range of 80% to 125%.
Previously, the Company’s designated fair value hedges consisted primarily of interest rate swaps, includingswaps with embedded options that mirrored features contained in the hedged items, designated as fair valuehedges of changes in the benchmark interest rate of fixed rate borrowings, including both certificates of depositand senior long-term borrowings. For these hedges, the Company ensured that the terms of the hedginginstruments and hedged items matched and other accounting criteria were met so that the hedges were assumedto have no ineffectiveness (i.e., the Company applied the “shortcut” method of hedge accounting). The Companyalso used interest rate swaps as fair value hedges of the benchmark interest rate risk of host contracts of equity-linked notes that contained embedded derivatives. For these hedging relationships, regression analysis was usedfor the prospective and retrospective assessments of hedge effectiveness.
For qualifying fair value hedges of benchmark interest rates, the changes in the fair value of the derivative andthe changes in the fair value of the hedged liability provide offset of one another and, together with any resultingineffectiveness, are recorded in Interest expense. When a derivative is de-designated as a hedge, any basisadjustment remaining on the hedged liability is amortized to Interest expense over the life of the liability usingthe effective interest method.
11

MORGAN STANLEY
NOTES TO CONDENSED CONSOLIDATED FINANCIAL STATEMENTS—(Continued)(UNAUDITED)
Fair Value Hedges – Credit Risk.
The Company has designated a portion of the credit derivative embedded in a non-recourse structured noteliability as a fair value hedge of the credit risk arising from a loan receivable to which the structured note liabilityis specifically linked. Regression analysis is used to perform prospective and retrospective assessments of hedgeeffectiveness for this hedge relationship. The changes in the fair value of the derivative and the changes in thefair value of the hedged item provide offset of one another and, together with any resulting ineffectiveness, arerecorded in Principal transactions–trading revenues.
Cash Flow Hedges.
Before the sale of the aircraft leasing business (see Note 15), the Company applied hedge accounting to interestrate swaps used to hedge variable rate long-term borrowings associated with this business. Changes in the fairvalue of the swaps were recorded in Accumulated other comprehensive income (loss) in Shareholders’ equity,net of tax effects, and then reclassified to Interest expense as interest on the hedged borrowings was recognized.
In connection with the sale of the aircraft leasing business, the Company de-designated the interest rate swapsassociated with this business effective August 31, 2005 and no longer accounts for them as cash flow hedges.Amounts in Accumulated other comprehensive income (loss) related to those interest rate swaps continue to bereclassified to Interest expense since the related borrowings remain outstanding.
Net Investment Hedges. The Company utilizes forward foreign exchange contracts and non-U.S. dollar-denominated debt to manage the currency exposure relating to its net investments in non-U.S. dollar functionalcurrency operations. No hedge ineffectiveness is recognized in earnings since the notional amounts of thehedging instruments equal the portion of the investments being hedged, and, where forward contracts are used,the currencies being exchanged are the functional currencies of the parent and investee; where debt instrumentsare used as hedges, they are denominated in the functional currency of the investee. The gain or loss fromrevaluing hedges of net investments in foreign operations at the spot rate is deferred and reported withinAccumulated other comprehensive income (loss) in Shareholders’ equity, net of tax effects. The forward pointson the hedging instruments are recorded in Interest and dividend revenues.
Securitization Activities. The Company engages in securitization activities related to commercial andresidential mortgage loans, corporate bonds and loans, U.S. agency collateralized mortgage obligations, creditcard loans and other types of financial assets (see Notes 3 and 4). The Company may retain interests in thesecuritized financial assets as one or more tranches of the securitization, undivided seller’s interests, accruedinterest receivable subordinate to investors’ interests (see Note 4), cash collateral accounts, rights to any excesscash flows remaining after payments to investors in the securitization trusts of their contractual rate of return andreimbursement of credit losses, and other retained interests. The exposure to credit losses from securitized loansis limited to the Company’s retained contingent risk, which represents the Company’s retained interest insecuritized loans, including any credit enhancement provided. The gain or loss on the sale of financial assetsdepends, in part, on the previous carrying amount of the assets involved in the transfer, and each subsequenttransfer in revolving structures, allocated between the assets sold and the retained interests based upon theirrespective fair values at the date of sale. To determine fair values, observable market prices are used if available.However, observable market prices are generally not available for retained interests so the Company estimatesfair value based on the present value of expected future cash flows using its best estimates of the keyassumptions, including forecasted credit losses, payment rates, forward yield curves and discount ratescommensurate with the risks involved. The present value of future net excess cash flows that the Companyestimates it will receive over the term of the securitized loans is recognized in income as the loans aresecuritized. An asset also is recorded and charged to income over the term of the securitized loans, with actualnet excess cash flows continuing to be recognized in income as they are earned.
12

MORGAN STANLEY
NOTES TO CONDENSED CONSOLIDATED FINANCIAL STATEMENTS—(Continued)(UNAUDITED)
In connection with the adoption of SFAS No. 156, “Accounting for Servicing of Financial Assets, an amendmentof FASB Statement No. 140” (“SFAS No. 156”) on December 1, 2006, the Company has elected to fair valuemortgage servicing rights (see Note 3).
Stock-Based Compensation. The Company early adopted SFAS No. 123R, “Share-Based Payment,” using themodified prospective approach as of December 1, 2004. SFAS No. 123R revised the fair value-based method ofaccounting for share-based payment liabilities, forfeitures and modifications of stock-based awards and clarifiedguidance in several areas, including measuring fair value, classifying an award as equity or as a liability andattributing compensation cost to service periods.
For stock-based awards issued prior to the adoption of SFAS No. 123R, the Company’s accounting policy forawards granted to retirement-eligible employees was to recognize compensation cost over the service periodspecified in the award terms. The Company accelerates any unrecognized compensation cost for such awards ifand when a retirement-eligible employee leaves the Company.
For fiscal 2005 year-end stock-based compensation awards that were granted to retirement-eligible employees inDecember 2005, the Company recognized the compensation cost for such awards at the date of grant instead ofover the service period specified in the award terms. As a result, the Company recorded non-cash incrementalcompensation expenses of approximately $395 million in the first quarter of fiscal 2006 for stock-based awardsgranted to retirement-eligible employees as part of the fiscal 2005 year-end award process and for awards grantedto retirement-eligible employees, including new hires, in the first quarter of fiscal 2006. These incrementalexpenses were included within Compensation and benefits expense and reduced income before taxes within theInstitutional Securities ($270 million), Global Wealth Management Group ($80 million), Asset Management($28 million) and Discover ($17 million) business segments.
Consolidated Statements of Cash Flows. For purposes of these statements, cash and cash equivalents consistof cash and highly liquid investments not held for resale with maturities, when purchased, of three months orless. In connection with business acquisitions, the Company assumed liabilities of $7,679 million and $30 millionin the first quarter of fiscal 2007 and fiscal 2006, respectively.
2. Goodwill and Net Intangible Assets.
During the first quarter of fiscal 2007, the Company completed the annual goodwill impairment test (as ofDecember 1 in each fiscal year). The Company’s testing did not indicate any goodwill impairment.
Changes in the carrying amount of the Company’s goodwill and intangible assets for the three month periodended February 28, 2007 were as follows:
InstitutionalSecurities
Global WealthManagement Group
AssetManagement Discover Total
(dollars in millions)
Goodwill:Balance as of November 30, 2006 . . . . . . . . . . $ 701 $ 589 $ 968 $534 $2,792Goodwill acquired during the period(1) . . . . . . 503 — 91 — 594Goodwill disposed during the period(2) . . . . . . — (255) — — (255)
Balance as of February 28, 2007 . . . . . . . . . . . $1,204 $ 334 $1,059 $534 $3,131
13

MORGAN STANLEY
NOTES TO CONDENSED CONSOLIDATED FINANCIAL STATEMENTS—(Continued)(UNAUDITED)
InstitutionalSecurities
Global WealthManagement Group
AssetManagement Discover Total
(dollars in millions)
Intangible assets(3):Balance as of November 30, 2006 . . . . . . . . . . $447 $— $ 3 $201 $ 651Intangible assets acquired during the
period(1) . . . . . . . . . . . . . . . . . . . . . . . . . . . . . 284 — 224 — 508Amortization expense . . . . . . . . . . . . . . . . . . . . (19) — (5) (4) (28)
Balance as of February 28, 2007 . . . . . . . . . . . $712 $— $222 $197 $1,131
(1) Institutional Securities activity primarily represents goodwill and intangible assets acquired in connection with the Company’sacquisitions of Saxon Capital, Inc. and CityMortgage Bank. Asset Management activity represents goodwill and intangible assetsacquired in connection with the Company’s acquisitions of FrontPoint Partners and Brookville Capital Management (see Note 16).
(2) Activity represents goodwill disposed in connection with the Company’s sale of Quilter (see Note 15).(3) Effective December 1, 2006, mortgage servicing rights have been included in net intangible assets. Amounts as of November 30, 2006
have been reclassified to conform with the current presentation.
3. Collateralized and Securitization Transactions.
Securities purchased under agreements to resell (“reverse repurchase agreements”) and Securities sold underagreements to repurchase (“repurchase agreements”), principally government and agency securities, are carried atthe amounts at which the securities subsequently will be resold or reacquired as specified in the respectiveagreements; such amounts include accrued interest. Reverse repurchase agreements and repurchase agreementsare presented on a net-by-counterparty basis, when appropriate. The Company’s policy is to take possession ofsecurities purchased under agreements to resell. Securities borrowed and Securities loaned are carried at theamounts of cash collateral advanced and received in connection with the transactions. Other secured financingsinclude the liabilities related to transfers of financial assets that are accounted for as financings rather than sales,consolidated variable interest entities where the Company is deemed to be the primary beneficiary and certainequity-referenced securities and loans where in all instances these liabilities are payable solely from the cashflows of the related assets accounted for as Financial instruments owned.
The Company pledges its financial instruments owned to collateralize repurchase agreements and other securitiesfinancings. Pledged securities that can be sold or repledged by the secured party are identified as Financialinstruments owned (pledged to various parties) in the condensed consolidated statements of financial condition.The carrying value and classification of securities owned by the Company that have been loaned or pledged tocounterparties where those counterparties do not have the right to sell or repledge the collateral were as follows:
AtFebruary 28,
2007
AtNovember 30,
2006
(dollars in millions)
Financial instruments owned:U.S. government and agency securities . . . . . . . . . . . . . . . . . . . . . . . . . . . . . . . . . . . . . $13,837 $12,111Other sovereign government obligations . . . . . . . . . . . . . . . . . . . . . . . . . . . . . . . . . . . . 866 893Corporate and other debt . . . . . . . . . . . . . . . . . . . . . . . . . . . . . . . . . . . . . . . . . . . . . . . . 51,609 44,237Corporate equities . . . . . . . . . . . . . . . . . . . . . . . . . . . . . . . . . . . . . . . . . . . . . . . . . . . . . . 6,845 6,662
Total . . . . . . . . . . . . . . . . . . . . . . . . . . . . . . . . . . . . . . . . . . . . . . . . . . . . . . . . . . . . $73,157 $63,903
The Company enters into reverse repurchase agreements, repurchase agreements, securities borrowed andsecurities loaned transactions to, among other things, acquire securities to cover short positions and settle othersecurities obligations, to accommodate customers’ needs and to finance the Company’s inventory positions. The
14

MORGAN STANLEY
NOTES TO CONDENSED CONSOLIDATED FINANCIAL STATEMENTS—(Continued)(UNAUDITED)
Company also engages in securities financing transactions for customers through margin lending. Under theseagreements and transactions, the Company either receives or provides collateral, including U.S. government andagency securities, other sovereign government obligations, corporate and other debt, and corporate equities. TheCompany receives collateral in the form of securities in connection with reverse repurchase agreements,securities borrowed and derivative transactions, and customer margin loans. In many cases, the Company ispermitted to sell or repledge these securities held as collateral and use the securities to secure repurchaseagreements, to enter into securities lending and derivative transactions or for delivery to counterparties to covershort positions. At February 28, 2007 and November 30, 2006, the fair value of securities received as collateralwhere the Company is permitted to sell or repledge the securities was $960 billion and $942 billion, respectively,and the fair value of the portion that has been sold or repledged was $762 billion and $780 billion, respectively.
The Company additionally receives securities as collateral in connection with certain securities for securitiestransactions in which the Company is the lender. In instances where the Company is permitted to sell or repledgethese securities, the Company reports the fair value of the collateral received and the related obligation to returnthe collateral in the condensed consolidated statement of financial condition. At February 28, 2007 andNovember 30, 2006, $82,684 million and $64,588 million, respectively, were reported as Securities received ascollateral and an Obligation to return securities received as collateral in the condensed consolidated statements offinancial condition.
The Company manages credit exposure arising from reverse repurchase agreements, repurchase agreements,securities borrowed and securities loaned transactions by, in appropriate circumstances, entering into masternetting agreements and collateral arrangements with counterparties that provide the Company, in the event of acustomer default, the right to liquidate collateral and the right to offset a counterparty’s rights and obligations.The Company also monitors the fair value of the underlying securities as compared with the related receivable orpayable, including accrued interest, and, as necessary, requests additional collateral to ensure such transactionsare adequately collateralized. Where deemed appropriate, the Company’s agreements with third parties specifyits rights to request additional collateral. Customer receivables generated from margin lending activity arecollateralized by customer-owned securities held by the Company. For these transactions, adherence to theCompany’s collateral policies significantly limits the Company’s credit exposure in the event of customerdefault. The Company may request additional margin collateral from customers, if appropriate, and, if necessary,may sell securities that have not been paid for or purchase securities sold, but not delivered from customers.
In connection with its Institutional Securities business, the Company engages in securitization activities related toresidential and commercial mortgage loans, U.S. agency collateralized mortgage obligations, corporate bondsand loans, and other types of financial assets. These assets are carried at fair value, and any changes in fair valueare recognized in the condensed consolidated statements of income. The Company may act as underwriter of thebeneficial interests issued by securitization vehicles. Underwriting net revenues are recognized in connectionwith these transactions. The Company may retain interests in the securitized financial assets as one or moretranches of the securitization. These retained interests are included in the condensed consolidated statements offinancial condition at fair value. Any changes in the fair value of such retained interests are recognized in thecondensed consolidated statements of income. Retained interests in securitized financial assets associated withthe Institutional Securities business were approximately $4.6 billion at February 28, 2007, the majority of whichwere related to residential mortgage loan, U.S. agency collateralized mortgage obligation and commercialmortgage loan securitization transactions. Net gains at the time of securitization were not material in the threemonth period ended February 28, 2007. The assumptions that the Company used to determine the fair value of itsretained interests at the time of securitization related to those transactions that occurred during the quarter werenot materially different from the assumptions included in the table below. Additionally, as indicated in the tablebelow, the Company’s exposure to credit losses related to these retained interests was not material to theCompany’s results of operations.
15

MORGAN STANLEY
NOTES TO CONDENSED CONSOLIDATED FINANCIAL STATEMENTS—(Continued)(UNAUDITED)
The following table presents information on the Company’s residential mortgage loan, U.S. agency collateralizedmortgage obligation and commercial mortgage loan securitization transactions. Key economic assumptions andthe sensitivity of the current fair value of the retained interests to immediate 10% and 20% adverse changes inthose assumptions at February 28, 2007 were as follows (dollars in millions):
ResidentialMortgage
Loans
U.S. AgencyCollateralized
MortgageObligations
CommercialMortgage
Loans
Retained interests (carrying amount/fair value) . . . . . . . . $ 2,654 $ 831 $ 712Weighted average life (in months) . . . . . . . . . . . . . . . . . . 40 57 98Credit losses (rate per annum) . . . . . . . . . . . . . . . . . . . . . 0.00 - 5.00% — 0.00 - 11.35%
Impact on fair value of 10% adverse change . . . . . . $ (156) $ — $ (7)Impact on fair value of 20% adverse change . . . . . . $ (298) $ — $ (13)
Weighted average discount rate (rate per annum) . . . . . . 11.01% 5.62% 6.76%Impact on fair value of 10% adverse change . . . . . . $ (53) $ (17) $ (27)Impact on fair value of 20% adverse change . . . . . . $ (105) $ (33) $ (54)
Prepayment speed assumption(1)(2) . . . . . . . . . . . . . . . . 194-2833 PSA 163-580 PSA —Impact on fair value of 10% adverse change . . . . . . $ (122) $ (3) $ —Impact on fair value of 20% adverse change . . . . . . $ (167) $ (7) $ —
(1) Amounts for residential mortgage loans exclude positive valuation effects from immediate 10% and 20% changes.(2) Commercial mortgage loans typically contain provisions that either prohibit or economically penalize the borrower from prepaying the
loan for a specified period of time.
The table above does not include the offsetting benefit of any financial instruments that the Company may utilizeto hedge risks inherent in its retained interests. In addition, the sensitivity analysis is hypothetical and should beused with caution. Changes in fair value based on a 10% or 20% variation in an assumption generally cannot beextrapolated because the relationship of the change in the assumption to the change in fair value may not belinear. Also, the effect of a variation in a particular assumption on the fair value of the retained interests iscalculated independent of changes in any other assumption; in practice, changes in one factor may result inchanges in another, which might magnify or counteract the sensitivities. In addition, the sensitivity analysis doesnot consider any corrective action that the Company may take to mitigate the impact of any adverse changes inthe key assumptions.
In connection with its Institutional Securities business, during the quarters ended February 28, 2007 and 2006,the Company received proceeds from new securitization transactions of $14.5 billion and $12.9 billion,respectively, and cash flows from retained interests in securitization transactions of $1.7 billion and $1.2 billion,respectively.
Mortgage Servicing Rights. In connection with its Institutional Securities business, the Company may retainservicing rights to certain mortgage loans that are sold through its securitization activities. These transactionscreate an asset referred to as mortgage servicing rights (“MSRs”), which are included within Intangible assets onthe condensed consolidated statements of financial condition.
In March 2006, the Financial Accounting Standards Board (the “FASB”) issued SFAS No. 156, which requiresall separately recognized servicing assets and servicing liabilities to be initially measured at fair value, ifpracticable. The standard permits an entity to subsequently measure each class of servicing assets or servicing
16

MORGAN STANLEY
NOTES TO CONDENSED CONSOLIDATED FINANCIAL STATEMENTS—(Continued)(UNAUDITED)
liabilities at fair value and report changes in fair value in the statement of income in the period in which thechanges occur. The Company adopted SFAS No. 156 on December 1, 2006 and has elected to fair value MSRsheld as of the date of adoption. This election did not have a material impact on the Company’s opening balanceof Retained earnings as of December 1, 2006. The Company also elected to fair value MSRs acquired afterDecember 1, 2006.
The following table presents information about the Company’s MSRs, which relate to its mortgage loan businessactivities (dollars in millions):
Fair value as of the beginning of the period . . . . . . . . . . . . . . . . . . . . . . . . . . . . . . . . . $ 93Additions:
Purchases of servicing assets (1) . . . . . . . . . . . . . . . . . . . . . . . . . . . . . . . . . . . . . . 187Servicing assets that result from transfers of financial assets . . . . . . . . . . . . . . . . 50
Total Additions . . . . . . . . . . . . . . . . . . . . . . . . . . . . . . . . . . . . . . . . . . . . . . . 237Subtractions:
Sales/Disposals . . . . . . . . . . . . . . . . . . . . . . . . . . . . . . . . . . . . . . . . . . . . . . . . . . . (18)Changes in fair value (2):
Due to change in valuation inputs or assumptions used in the valuationmodel . . . . . . . . . . . . . . . . . . . . . . . . . . . . . . . . . . . . . . . . . . . . . . . . . . . . . . . . . —
Other changes in fair value . . . . . . . . . . . . . . . . . . . . . . . . . . . . . . . . . . . . . . . . . . (25)
Fair value as of the end of the period . . . . . . . . . . . . . . . . . . . . . . . . . . . . . . . . . . . . . . $287
Amount of contractually specified (2):Servicing fees . . . . . . . . . . . . . . . . . . . . . . . . . . . . . . . . . . . . . . . . . . . . . . . . . . . . $ 38Late fees . . . . . . . . . . . . . . . . . . . . . . . . . . . . . . . . . . . . . . . . . . . . . . . . . . . . . . . . 6Ancillary fees . . . . . . . . . . . . . . . . . . . . . . . . . . . . . . . . . . . . . . . . . . . . . . . . . . . . 1
$ 45
(1) Includes MSRs obtained in connection with the Company’s acquisition of Saxon Capital, Inc. (see Note 16).(2) These amounts are recorded within Servicing and securitization income in the Company’s condensed consolidated statements of income.
Assumptions Used in Measuring Fair Value:Weighted average discount rate . . . . . . . . . . . . . . . . . . . . . . . . . . . . . . . . . . . . . . . 17.87%Weighted average prepayment speed assumption . . . . . . . . . . . . . . . . . . . . . . . . . 977 PSA
The Company generally utilizes information provided by third parties in order to determine the fair value of itsMSRs. The valuation of MSRs consist of projecting servicing cash flows and discounting such cash flows usingan appropriate risk-adjusted discount rate. These valuations require estimation of various assumptions, includingfuture servicing fees, credit losses and other related costs, discount rates and mortgage prepayment speeds. TheCompany also compares the estimated fair values of the MSRs from the valuations with observable trades ofsimilar instruments or portfolios. Due to subsequent changes in economic and market conditions, the actual ratesof prepayments, credit losses and the value of collateral may differ significantly from the Company’s originalestimates. Such differences could be material. If actual prepayment rates and credit losses were higher than thoseassumed, the value of the Company’s MSRs could be adversely affected. The Company may hedge a portion ofits MSRs through the use of financial instruments, including certain derivative contracts.
17

MORGAN STANLEY
NOTES TO CONDENSED CONSOLIDATED FINANCIAL STATEMENTS—(Continued)(UNAUDITED)
4. Consumer Loans.
Consumer loans were as follows:
AtFebruary 28,
2007
AtNovember 30,
2006
(dollars in millions)
General purpose credit card, mortgage and consumer installment . . . . . . $23,219 $25,004Less:
Allowance for consumer loan losses . . . . . . . . . . . . . . . . . . . . . . . . . 790 831
Consumer loans, net . . . . . . . . . . . . . . . . . . . . . . . . . . . . . . . . . . . . . . . . . . $22,429 $24,173
Activity in the allowance for consumer loan losses was as follows:
Three Months EndedFebruary 28,
2007 2006(1)
(dollars in millions)
Balance at beginning of period . . . . . . . . . . . . . . . . . . . . . . . . . . . . . . . . . . $831 $838Additions:
Provision for consumer loan losses . . . . . . . . . . . . . . . . . . . . . . . . . . 195 155Purchase of loans(2) . . . . . . . . . . . . . . . . . . . . . . . . . . . . . . . . . . . . . . — 44
Deductions:Charge-offs . . . . . . . . . . . . . . . . . . . . . . . . . . . . . . . . . . . . . . . . . . . . . 281 300Recoveries . . . . . . . . . . . . . . . . . . . . . . . . . . . . . . . . . . . . . . . . . . . . . (45) (47)
Net charge-offs . . . . . . . . . . . . . . . . . . . . . . . . . . . . . . . . . . . . . . . . . . . . . . 236 253Translation adjustments and other . . . . . . . . . . . . . . . . . . . . . . . . . . . . . . . — 1
Balance at end of period . . . . . . . . . . . . . . . . . . . . . . . . . . . . . . . . . . . . . . . $790 $785
(1) Certain reclassifications have been made to prior-period amounts to conform to the current period’s presentation.(2) Amount relates to the Company’s acquisition of Goldfish and other acquisitions.
Information on net charge-offs of interest and cardmember fees was as follows:
Three MonthsEnded February 28,
2007 2006
(dollars in millions)
Interest accrued on general purpose credit card loans subsequently charged off, net ofrecoveries (recorded as a reduction of Interest revenue) . . . . . . . . . . . . . . . . . . . . . . . . . . . . . $53 $38
Cardmember fees accrued on general purpose credit card loans subsequently charged off, netof recoveries (recorded as a reduction to Merchant, cardmember and other fee revenue) . . . $23 $22
At February 28, 2007, the Company had commitments to extend credit for consumer loans of approximately$273 billion. Such commitments arise primarily from agreements with customers for unused lines of credit oncertain credit cards, provided there is no violation of conditions established in the related agreement. These
18

MORGAN STANLEY
NOTES TO CONDENSED CONSOLIDATED FINANCIAL STATEMENTS—(Continued)(UNAUDITED)
commitments, substantially all of which the Company can terminate at any time and which do not necessarilyrepresent future cash requirements, are periodically reviewed based on account usage and customercreditworthiness.
At February 28, 2007 and November 30, 2006, $1.0 billion and $2.3 billion, respectively, of the Company’sconsumer loans were classified as held for sale.
The Company received net proceeds from consumer loan sales of $1,578 million and $6,613 million in thequarters ended February 28, 2007 and 2006, respectively.
Credit Card Securitization Activities. The Company’s retained interests in credit card asset securitizationsinclude undivided seller’s interests, accrued interest receivable on securitized credit card receivables, cashcollateral accounts, rights to any excess cash flows (“Residual Interests”) remaining after payments to investorsin the securitization trusts of their contractual rate of return and reimbursement of credit losses, and otherretained interests. The undivided seller’s interests less an applicable allowance for loan losses is recorded inConsumer loans. The Company’s undivided seller’s interests rank pari passu with investors’ interests in thesecuritization trusts, and the remaining retained interests are subordinate to investors’ interests. Accrued interestreceivable and certain other subordinated retained interests are recorded in Other assets at amounts thatapproximate fair value. The Company receives annual servicing fees based on a percentage of the investorprincipal balance outstanding. The Company does not recognize servicing assets or servicing liabilities forservicing rights as the servicing contracts provide just adequate compensation, as defined in SFAS No. 140,“Accounting for Transfers and Servicing of Financial Assets and Extinguishments of Liabilities” (“SFASNo. 140”), to the Company for performing the servicing. Residual Interests and cash collateral accounts arerecorded in Other assets and reflected at fair value with changes in fair value recorded currently in earnings. AtFebruary 28, 2007, the Company had $13,274 million of retained interests, including $9,805 million of undividedseller’s interests, in credit card asset securitizations. The retained interests are subject to credit, payment andinterest rate risks on the transferred credit card assets. The investors and the securitization trusts have no recourseto the Company’s other assets for failure of cardmembers to pay when due.
During the quarters ended February 28, 2007 and 2006, the Company completed credit card asset securitizationsof $1.6 billion and $6.6 billion, respectively, and recognized net securitization losses of $4 million and netsecuritization gains of $139 million, respectively, as servicing and securitization income in the condensedconsolidated statements of income. The amount for the quarter ended February 28, 2006 includes an increase inthe fair value of the Company’s retained interests in securitized receivables primarily resulting from a favorableimpact on charge-offs following the enactment of federal bankruptcy legislation that became effective in October2005. Securitized general purpose credit card loans were $28.3 billion and $26.7 billion at February 28, 2007 andNovember 30, 2006, respectively.
Key economic assumptions used in measuring the Residual Interests at the date of securitization resulting fromcredit card asset securitizations completed during the quarters ended February 28, 2007 and 2006 were asfollows:
Three Months EndedFebruary 28,
2007 2006
Weighted average life (in months) . . . . . . . . . . . . . . . . . . . . . . . . . . . . . . . . . . . . . . . 4.8 3.7 - 4.7Payment rate (rate per month) . . . . . . . . . . . . . . . . . . . . . . . . . . . . . . . . . . . . . . . . . . 20.92% 19.69% - 21.34%Credit losses (rate per annum) . . . . . . . . . . . . . . . . . . . . . . . . . . . . . . . . . . . . . . . . . . 4.36% 4.72% - 5.23%Discount rate (rate per annum) . . . . . . . . . . . . . . . . . . . . . . . . . . . . . . . . . . . . . . . . . . 11.00% 11.00%
19

MORGAN STANLEY
NOTES TO CONDENSED CONSOLIDATED FINANCIAL STATEMENTS—(Continued)(UNAUDITED)
Key economic assumptions and the sensitivity of the current fair value of the Residual Interests to immediate10% and 20% adverse changes in those assumptions were as follows (dollars in millions):
AtFebruary 28,
2007
Residual Interests (carrying amount/fair value) . . . . . . . . . . . . . . . . . . . . . . . . . . . . . . . . . . . . . . . . . . $ 332Weighted average life (in months) . . . . . . . . . . . . . . . . . . . . . . . . . . . . . . . . . . . . . . . . . . . . . . . . . . . . 4.2Weighted average payment rate (rate per month) . . . . . . . . . . . . . . . . . . . . . . . . . . . . . . . . . . . . . . . . . 20.93%
Impact on fair value of 10% adverse change . . . . . . . . . . . . . . . . . . . . . . . . . . . . . . . . . . . . . . . . $ (25)Impact on fair value of 20% adverse change . . . . . . . . . . . . . . . . . . . . . . . . . . . . . . . . . . . . . . . . $ (47)
Weighted average credit losses (rate per annum) . . . . . . . . . . . . . . . . . . . . . . . . . . . . . . . . . . . . . . . . . 4.37%Impact on fair value of 10% adverse change . . . . . . . . . . . . . . . . . . . . . . . . . . . . . . . . . . . . . . . . $ (38)Impact on fair value of 20% adverse change . . . . . . . . . . . . . . . . . . . . . . . . . . . . . . . . . . . . . . . . $ (75)
Weighted average discount rate (rate per annum) . . . . . . . . . . . . . . . . . . . . . . . . . . . . . . . . . . . . . . . . . 11.00%Impact on fair value of 10% adverse change . . . . . . . . . . . . . . . . . . . . . . . . . . . . . . . . . . . . . . . . $ (1)Impact on fair value of 20% adverse change . . . . . . . . . . . . . . . . . . . . . . . . . . . . . . . . . . . . . . . . $ (3)
The sensitivity analysis in the table above is hypothetical and should be used with caution. Changes in fair valuebased on a 10% or 20% variation in an assumption generally cannot be extrapolated because the relationship ofthe change in the assumption to the change in fair value may not be linear. Also, the effect of a variation in aparticular assumption on the fair value of the Residual Interests is calculated independent of changes in any otherassumption; in practice, changes in one factor may result in changes in another (for example, increases in marketinterest rates may result in lower payments and increased credit losses), which might magnify or counteract thesensitivities. In addition, the sensitivity analysis does not consider any corrective action that the Company maytake to mitigate the impact of any adverse changes in the key assumptions.
The table below summarizes certain cash flows received from the securitization master trusts (dollars in billions):
Three MonthsEnded
February 28,
2007 2006
Proceeds from new credit card asset securitizations . . . . . . . . . . . . . . . . . . . . . . . . . . . . . . . . . . . . . $ 1.6 $ 6.6Proceeds from collections reinvested in previous credit card asset securitizations . . . . . . . . . . . . . $16.7 $13.9Contractual servicing fees received . . . . . . . . . . . . . . . . . . . . . . . . . . . . . . . . . . . . . . . . . . . . . . . . . $ 0.1 $ 0.1Cash flows received from retained interests . . . . . . . . . . . . . . . . . . . . . . . . . . . . . . . . . . . . . . . . . . . $ 0.4 $ 0.4
The table below presents quantitative information about delinquencies, net principal credit losses andcomponents of managed general purpose credit card loans, including securitized loans (dollars in millions):
At February 28, 2007Three Months Ended
February 28, 2007
LoansOutstanding
LoansDelinquent
AverageLoans
NetPrincipal
CreditLosses
Managed general purpose credit card loans . . . . . . . . . . . . . . . . . . . $50,730 $1,749 $51,390 $521Less: Securitized general purpose credit card loans . . . . . . . . . . . . . 28,320
Owned general purpose credit card loans . . . . . . . . . . . . . . . . . . . . . $22,410
20

MORGAN STANLEY
NOTES TO CONDENSED CONSOLIDATED FINANCIAL STATEMENTS—(Continued)(UNAUDITED)
5. Long-Term Borrowings and Capital Units.
Long-term Borrowings. Long-term borrowings at February 28, 2007 scheduled to mature within one yearaggregated $20,515 million.
During the quarter ended February 28, 2007, the Company issued senior notes with a carrying value at quarter-end aggregating $22,235 million, including non-U.S. dollar currency notes aggregating $10,299 million.Maturities in the aggregate of these notes by fiscal year are as follows: 2007, $141 million; 2008, $1,985 million;2009, $698 million; 2010, $3,455 million; 2011, $975 million; and thereafter, $14,981 million. In the quarterended February 28, 2007, $6,484 million of senior notes were repaid.
The weighted average maturity of the Company’s long-term borrowings, based upon stated maturity dates, wasapproximately 5.5 years at February 28, 2007.
Capital Units. The Company redeemed all $66 million of the outstanding Capital Units on February 28, 2007.
6. Shareholders’ Equity.
Regulatory Requirements. MS&Co. is and, until it merged into MS&Co. on April 1, 2007, MSDWI was aregistered broker-dealer and registered futures commission merchant and, accordingly, subject to the minimumnet capital requirements of the Securities and Exchange Commission (the “SEC”), the New York StockExchange, Inc. and the Commodity Futures Trading Commission. MS&Co. and MSDWI have consistentlyoperated in excess of these requirements. MS&Co.’s net capital totaled $4,385 million at February 28, 2007,which exceeded the amount required by $2,898 million. MSDWI’s net capital totaled $1,314 million atFebruary 28, 2007, which exceeded the amount required by $1,246 million. MSIL, a London-based broker-dealersubsidiary, is subject to the capital requirements of the Financial Services Authority, and MSJS, a Tokyo-basedbroker-dealer subsidiary, is subject to the capital requirements of the Financial Services Agency. MSIL andMSJS have consistently operated in excess of their respective regulatory capital requirements.
On April 1, 2007, the Company merged MSDWI into MS&Co. Upon completion of the merger, the survivingentity, MS&Co., became the Company’s principal U.S. broker-dealer.
Under regulatory capital requirements adopted by the Federal Deposit Insurance Corporation (the “FDIC”) andother bank regulatory agencies, FDIC-insured financial institutions must maintain (a) 3% to 5% of Tier 1 capital,as defined, to average assets (“leverage ratio”), (b) 4% of Tier 1 capital, as defined, to risk-weighted assets (“Tier1 risk-weighted capital ratio”) and (c) 8% of total capital, as defined, to risk-weighted assets (“total risk-weightedcapital ratio”). At February 28, 2007, the leverage ratio, Tier 1 risk-weighted capital ratio and total risk-weightedcapital ratio of each of the Company’s FDIC-insured financial institutions exceeded these regulatory minimums.
Certain other U.S. and non-U.S. subsidiaries are subject to various securities, commodities and bankingregulations, and capital adequacy requirements promulgated by the regulatory and exchange authorities of thecountries in which they operate. These subsidiaries have consistently operated in excess of their local capitaladequacy requirements. Morgan Stanley Derivative Products Inc., the Company’s triple-A rated derivativeproducts subsidiary, maintains certain operating restrictions that have been reviewed by various rating agencies.
Effective December 1, 2005, the Company became a consolidated supervised entity (“CSE”) as defined by theSEC. As such, the Company is subject to group-wide supervision and examination by the SEC and to minimumcapital requirements on a consolidated basis. As of February 28, 2007, the Company was in compliance with theCSE capital requirements.
21

MORGAN STANLEY
NOTES TO CONDENSED CONSOLIDATED FINANCIAL STATEMENTS—(Continued)(UNAUDITED)
MS&Co. is required to hold tentative net capital in excess of $1 billion and net capital in excess of $500 millionin accordance with the market and credit risk standards of Appendix E of Rule 15c3-1. MS&Co. is also requiredto notify the SEC in the event that its tentative net capital is less than $5 billion. As of February 28, 2007,MS&Co. had tentative net capital in excess of the minimum and the notification requirements.
Treasury Shares. During the quarter ended February 28, 2007, the Company purchased approximately $1.2billion of its common stock through open market purchases at an average cost of $82.02 per share. During thequarter ended February 28, 2006, the Company purchased approximately $1.2 billion of its common stockthrough open market purchases at an average cost of $59.08 per share.
7. Earnings per Common Share.
Basic earnings per share (“EPS”) is computed by dividing income available to common shareholders by theweighted average number of common shares outstanding for the period. Diluted EPS reflects the assumedconversion of all dilutive securities. The following table presents the calculation of basic and diluted EPS (inmillions, except for per share data):
Three MonthsEnded
February 28,
2007 2006
Basic EPS:Income from continuing operations . . . . . . . . . . . . . . . . . . . . . . . . . . . . . . . . . . . . . . . . . . . $2,559 $1,602Gain/(loss) on discontinued operations, net . . . . . . . . . . . . . . . . . . . . . . . . . . . . . . . . . . . . . 113 (28)Preferred stock dividend requirements . . . . . . . . . . . . . . . . . . . . . . . . . . . . . . . . . . . . . . . . . (17) —
Net income applicable to common shareholders . . . . . . . . . . . . . . . . . . . . . . . . . . . . . . . . . $2,655 $1,574
Weighted average common shares outstanding . . . . . . . . . . . . . . . . . . . . . . . . . . . . . . . . . . 1,009 1,020
Earnings per basic common share:Income from continuing operations . . . . . . . . . . . . . . . . . . . . . . . . . . . . . . . . . . . . . . . . . . . $ 2.52 $ 1.57Gain/(loss) on discontinued operations . . . . . . . . . . . . . . . . . . . . . . . . . . . . . . . . . . . . . . . . . 0.11 (0.03)
Earnings per basic common share . . . . . . . . . . . . . . . . . . . . . . . . . . . . . . . . . . . . . . . . . . . . . . . . . $ 2.63 $ 1.54
Diluted EPS:Net income applicable to common shareholders . . . . . . . . . . . . . . . . . . . . . . . . . . . . . . . . . $2,655 $1,574
Weighted average common shares outstanding . . . . . . . . . . . . . . . . . . . . . . . . . . . . . . . . . . 1,009 1,020Effect of dilutive securities:
Stock options and restricted stock units . . . . . . . . . . . . . . . . . . . . . . . . . . . . . . . . . . . . 49 42
Weighted average common shares outstanding and common stock equivalents . . . . . . . . . 1,058 1,062
Earnings per diluted common share:Income from continuing operations . . . . . . . . . . . . . . . . . . . . . . . . . . . . . . . . . . . . . . . . . . . $ 2.40 $ 1.51Gain/(loss) on discontinued operations . . . . . . . . . . . . . . . . . . . . . . . . . . . . . . . . . . . . . . . . . 0.11 (0.03)
Earnings per diluted common share . . . . . . . . . . . . . . . . . . . . . . . . . . . . . . . . . . . . . . . . . . . . . . . $ 2.51 $ 1.48
22

MORGAN STANLEY
NOTES TO CONDENSED CONSOLIDATED FINANCIAL STATEMENTS—(Continued)(UNAUDITED)
The following securities were considered antidilutive and therefore were excluded from the computation ofdiluted EPS:
Three MonthsEnded
February 28,
2007 2006
(shares in millions)
Number of antidilutive securities (including stock options and restricted stock units)outstanding at end of period . . . . . . . . . . . . . . . . . . . . . . . . . . . . . . . . . . . . . . . . . . . . . . . . . . 16 33
Cash dividends declared per common share were $0.27 for the quarters ended February 28, 2007 and 2006.
8. Commitments and Contingencies.
Letters of Credit and Other Financial Guarantees. At February 28, 2007 and November 30, 2006, theCompany had approximately $7.2 billion and $5.8 billion, respectively, of letters of credit and other financialguarantees outstanding to satisfy various collateral requirements.
Securities Activities. In connection with certain of its Institutional Securities business activities, the Companyprovides loans or lending commitments (including bridge financing) to selected clients. The borrowers may berated investment grade or non-investment grade. These loans and commitments have varying terms, may besenior or subordinated and/or secured or non-secured, are generally contingent upon representations, warrantiesand contractual conditions applicable to the borrower, and may be syndicated, hedged or traded by the Company.
The aggregate value of the investment grade and non-investment grade primary and secondary lendingcommitments are shown below:
AtFebruary 28,
2007
AtNovember 30,
2006
(dollars in millions)
Investment grade corporate lending commitments . . . . . . . . . . . . . . . . . . . . . . . . . . . . $34,725 $34,306Non-investment grade corporate lending commitments . . . . . . . . . . . . . . . . . . . . . . . . 24,341 17,809
Total . . . . . . . . . . . . . . . . . . . . . . . . . . . . . . . . . . . . . . . . . . . . . . . . . . . . . . . . . . . . $59,066 $52,115
Financial instruments sold, not yet purchased include obligations of the Company to deliver specified financialinstruments at contracted prices, thereby creating commitments to purchase the financial instruments in themarket at prevailing prices. Consequently, the Company’s ultimate obligation to satisfy the sale of financialinstruments sold, not yet purchased may exceed the amounts recognized in the condensed consolidatedstatements of financial condition.
The Company has commitments to fund other less liquid investments, including at February 28, 2007,$900 million in connection with investment activities, $1,889 million related to forward purchase contractsinvolving mortgage loans, $901 million related to mortgage loan originations and $584 million related tocommercial loan commitments to small businesses and commitments related to securities-based lendingactivities. As of February 28, 2007, the Company also had commitments of $21,191 million related to securedlending transactions. Such commitments to subprime lenders were $5.2 billion, of which $2.3 billion was fundedand fully collateralized. As of March 31, 2007, the amount that was funded and fully collateralized to subprimelenders was $2.5 billion, and the amount of the unfunded commitments was $1.1 billion. Additionally, theCompany has provided and will continue to provide financing, including margin lending and other extensions ofcredit, to clients that may subject the Company to increased credit and liquidity risks.
23

MORGAN STANLEY
NOTES TO CONDENSED CONSOLIDATED FINANCIAL STATEMENTS—(Continued)(UNAUDITED)
At February 28, 2007, the Company had commitments to enter into reverse repurchase and repurchaseagreements of approximately $129 billion and $101 billion, respectively.
Legal. In the normal course of business, the Company has been named, from time to time, as a defendant invarious legal actions, including arbitrations, class actions and other litigation, arising in connection with itsactivities as a global diversified financial services institution. Certain of the actual or threatened legal actionsinclude claims for substantial compensatory and/or punitive damages or claims for indeterminate amounts ofdamages. In some cases, the issuers that would otherwise be the primary defendants in such cases are bankrupt orin financial distress.
The Company is also involved, from time to time, in other reviews, investigations and proceedings (both formaland informal) by governmental and self-regulatory agencies regarding the Company’s business, including,among other matters, accounting and operational matters, certain of which may result in adverse judgments,settlements, fines, penalties, injunctions or other relief. The number of reviews, investigations and proceedingshas increased in recent years with regards to many firms in the financial services industry, including theCompany.
The Company contests liability and/or the amount of damages as appropriate in each pending matter. In view ofthe inherent difficulty of predicting the outcome of such matters, particularly in cases where claimants seeksubstantial or indeterminate damages or where investigations and proceedings are in the early stages, theCompany cannot predict with certainty the loss or range of loss, if any, related to such matters, how or if suchmatters will be resolved, when they will ultimately be resolved, or what the eventual settlement, fine, penalty orother relief, if any, might be. Subject to the foregoing, and except for the pending matters described in theparagraphs below, the Company believes, based on current knowledge and after consultation with counsel, thatthe outcome of the pending matters will not have a material adverse effect on the condensed consolidatedfinancial condition of the Company, although the outcome of such matters could be material to the Company’soperating results and cash flows for a particular future period, depending on, among other things, the level of theCompany’s revenues or income for such period. Legal reserves have been established in accordance with SFASNo. 5, “Accounting for Contingencies” (“SFAS No. 5”). Once established, reserves are adjusted when there ismore information available or when an event occurs requiring a change.
Coleman Litigation. On May 8, 2003, Coleman (Parent) Holdings Inc. (“CPH”) filed a complaint against theCompany in the Circuit Court of the Fifteenth Judicial Circuit for Palm Beach County, Florida. The complaintrelates to the 1998 merger between The Coleman Company, Inc. (“Coleman”) and Sunbeam, Inc. (“Sunbeam”).The complaint, as amended, alleges that CPH was induced to agree to the transaction with Sunbeam based oncertain financial misrepresentations, and it asserts claims against the Company for aiding and abetting fraud,conspiracy and punitive damages. Shortly before trial, which commenced in April 2005, the trial court granted, inpart, a motion for entry of a default judgment against the Company and ordered that portions of CPH’scomplaint, including those setting forth CPH’s primary allegations against the Company, be read to the jury anddeemed established for all purposes in the action. In May 2005, the jury returned a verdict in favor of CPH andawarded CPH $604 million in compensatory damages and $850 million in punitive damages. On June 23, 2005,the trial court issued a final judgment in favor of CPH in the amount of $1,578 million, which includesprejudgment interest and excludes certain payments received by CPH in settlement of related claims againstothers.
On June 27, 2005, the Company filed a notice of appeal with the District Court of Appeal for the Fourth Districtof Florida (the “Court of Appeal”) and posted a supersedeas bond, which automatically stayed execution of the
24

MORGAN STANLEY
NOTES TO CONDENSED CONSOLIDATED FINANCIAL STATEMENTS—(Continued)(UNAUDITED)
judgment pending appeal. Included in cash and securities deposited with clearing organizations or segregatedunder federal and other regulations or requirements in the condensed consolidated statement of financialcondition is $1,840 million of money market deposits that have been pledged to obtain the supersedeas bond. TheCompany filed its initial brief in support of its appeal on December 7, 2005, and, on June 28, 2006, the Court ofAppeal heard oral argument. The Company’s appeal sought to reverse the judgment of the trial court on severalgrounds and asked that the case be remanded for entry of a judgment in favor of the Company or, in thealternative, for a new trial. On March 21, 2007, the Court of Appeal issued an opinion reversing the trial court’saward for compensatory and punitive damages and remanding the case to the trial court for entry of a judgmentfor the Company. The opinion will become final upon disposition of any timely filed motions for rehearing.
Until the March 21, 2007 opinion becomes final, the Company is maintaining a reserve for the Colemanlitigation. The reserve is presently $360 million, which the Company believes to be a reasonable estimate, underSFAS No. 5, of the low end of the range of its probable exposure in the event the Court of Appeal’s March 21,2007 opinion is reversed or modified as a result of further appellate proceedings and the case remanded for a newtrial. If the trial court’s compensatory and/or punitive awards are ultimately upheld on appeal, in whole or in part,the Company may incur an additional expense equal to the difference between the amount affirmed on appeal(and post-judgment interest thereon) and the amount of the reserve. While the Company cannot predict withcertainty the amount of such additional expense, such additional expense could have a material adverse effect onthe condensed consolidated financial condition of the Company and/or the Company’s or Institutional Securities’operating results and cash flows for a particular future period, and the upper end of the range could exceed $1.4billion.
Income Taxes. For information on contingencies associated with income tax examinations, see Note 17.
9. Derivative Contracts.
In the normal course of business, the Company enters into a variety of derivative contracts related to financialinstruments and commodities. The Company uses these instruments for trading and investment purposes, as wellas for asset and liability management. These instruments generally represent future commitments to swap interestpayment streams, exchange currencies, or purchase or sell commodities and other financial instruments onspecific terms at specified future dates. Many of these products have maturities that do not extend beyond oneyear, although swaps, options and equity warrants typically have longer maturities. For further discussion ofthese matters, refer to Note 11 to the consolidated financial statements for the fiscal year ended November 30,2006, included in the Form 10-K.
Future changes in interest rates, foreign currency exchange rates or the fair values of the financial instruments,commodities or indices underlying these contracts ultimately may result in cash settlements exceeding fair valueamounts recognized in the condensed consolidated statements of financial condition. The amounts in thefollowing table represent the fair value of exchange traded and OTC options and other contracts (includinginterest rate, foreign exchange, and other forward contracts and swaps) for derivatives for trading and investmentand for asset and liability management, net of offsetting positions in situations where netting is appropriate. Theasset amounts are not reported net of non-cash collateral, which the Company obtains with respect to certain ofthese transactions to reduce its exposure to credit losses.
Credit risk with respect to derivative instruments arises from the failure of a counterparty to perform according tothe terms of the contract. The Company’s exposure to credit risk at any point in time is represented by the fairvalue of the contracts reported as assets. The Company monitors the creditworthiness of counterparties to thesetransactions on an ongoing basis and requests additional collateral when deemed necessary.
25

MORGAN STANLEY
NOTES TO CONDENSED CONSOLIDATED FINANCIAL STATEMENTS—(Continued)(UNAUDITED)
The Company’s derivatives (both listed and OTC) at February 28, 2007 and November 30, 2006 are summarizedin the table below, showing the fair value of the related assets and liabilities by product:
At February 28, 2007 At November 30, 2006
Product Type Assets Liabilities Assets Liabilities
(dollars in millions)Interest rate and currency swaps, interest rate options, credit
derivatives and other fixed income securities contracts . . . . . . . . . . $19,300 $13,284 $19,444 $15,688Foreign exchange forward contracts and options . . . . . . . . . . . . . . . . . 4,354 4,610 7,325 7,725Equity securities contracts (including equity swaps, warrants and
options) . . . . . . . . . . . . . . . . . . . . . . . . . . . . . . . . . . . . . . . . . . . . . . . 16,409 23,421 16,705 23,155Commodity forwards, options and swaps . . . . . . . . . . . . . . . . . . . . . . 10,889 10,259 11,969 10,923
Total . . . . . . . . . . . . . . . . . . . . . . . . . . . . . . . . . . . . . . . . . . . . . . . $50,952 $51,574 $55,443 $57,491
10. Segment Information.
The Company structures its segments primarily based upon the nature of the financial products and servicesprovided to customers and the Company’s management organization. The Company provides a wide range offinancial products and services to its customers in each of its business segments: Institutional Securities, GlobalWealth Management Group, Asset Management and Discover. For further discussion of the Company’s businesssegments, see Note 1. Certain reclassifications have been made to prior-period amounts to conform to the currentperiod’s presentation.
Revenues and expenses directly associated with each respective segment are included in determining theiroperating results. Other revenues and expenses that are not directly attributable to a particular segment areallocated based upon the Company’s allocation methodologies, generally based on each segment’s respective netrevenues, non-interest expenses or other relevant measures.
As a result of treating certain intersegment transactions as transactions with external parties, the Companyincludes an “Intersegment Eliminations” category to reconcile the segment results to the Company’s consolidatedresults. Income before taxes in Intersegment Eliminations primarily represents the effect of timing differencesassociated with the revenue and expense recognition of commissions paid by Asset Management to the GlobalWealth Management Group associated with sales of certain products and the related compensation costs paid tothe Global Wealth Management Group’s global representatives.
Selected financial information for the Company’s segments is presented below:
Three Months Ended February 28, 2007Institutional
Securities
Global WealthManagement
GroupAsset
Management DiscoverIntersegmentEliminations Total
(dollars in millions)Net revenues excluding net interest . . . . . . $6,838 $1,354 $907 $ 632 $ (62) $ 9,669Net interest . . . . . . . . . . . . . . . . . . . . . . . . . 793 136 (2) 393 9 1,329
Net revenues . . . . . . . . . . . . . . . . . . . . . . . . $7,631 $1,490 $905 $1,025 $ (53) $10,998
Income from continuing operations beforelosses from unconsolidated investeesand income taxes . . . . . . . . . . . . . . . . . . $3,031 $ 220 $236 $ 372 $ 5 $ 3,864
Losses from unconsolidated investees . . . . 43 — — 1 — 44Provision for income taxes . . . . . . . . . . . . . 942 83 96 138 2 1,261
Income from continuing operations(1) . . . $2,046 $ 137 $140 $ 233 $ 3 $ 2,559
26

MORGAN STANLEY
NOTES TO CONDENSED CONSOLIDATED FINANCIAL STATEMENTS—(Continued)(UNAUDITED)
Three Months Ended February 28, 2006(2)Institutional
Securities
Global WealthManagement
GroupAsset
Management DiscoverIntersegmentEliminations Total
(dollars in millions)Net revenues excluding net interest . . . $ 4,927 $ 1,178 $ 702 $ 734 $ (72) $ 7,469Net interest . . . . . . . . . . . . . . . . . . . . . . 624 88 3 355 13 1,083
Net revenues . . . . . . . . . . . . . . . . . . . . . $ 5,551 $ 1,266 $ 705 $ 1,089 $ (59) $ 8,552
Income from continuing operationsbefore losses from unconsolidatedinvestees and income taxes . . . . . . . . $ 1,775 $ 15 $ 172 $ 479 $ 19 $ 2,460
Losses from unconsolidatedinvestees . . . . . . . . . . . . . . . . . . . . . . 68 — — 1 — 69
Provision for income taxes . . . . . . . . . . 531 6 67 178 7 789
Income from continuingoperations(1) . . . . . . . . . . . . . . . . . . . $ 1,176 $ 9 $ 105 $ 300 $ 12 $ 1,602
Net InterestInstitutional
Securities
Global WealthManagement
GroupAsset
Management DiscoverIntersegmentEliminations Total
(dollars in millions)Three Months Ended February 28, 2007Interest and dividends . . . . . . . . . . . . . . $ 13,961 $ 274 $ 13 $ 680 $(114) $ 14,814Interest expense . . . . . . . . . . . . . . . . . . . 13,168 138 15 287 (123) 13,485
Net interest . . . . . . . . . . . . . . . . . . . . . . $ 793 $ 136 $ (2) $ 393 $ 9 $ 1,329
Three Months Ended February 28, 2006(2)Interest and dividends . . . . . . . . . . . . . . $ 9,789 $ 203 $ 5 $ 586 $ (39) $ 10,544Interest expense . . . . . . . . . . . . . . . . . . . 9,165 115 2 231 (52) 9,461
Net interest . . . . . . . . . . . . . . . . . . . . . . $ 624 $ 88 $ 3 $ 355 $ 13 $ 1,083
Total Assets(2)(3)Institutional
Securities
Global WealthManagement
GroupAsset
Management DiscoverIntersegmentEliminations Total
(dollars in millions)At February 28, 2007 . . . . . . . . . . . . . . $1,126,190 $20,661 $5,674 $29,583 $ (47) $1,182,061
At November 30, 2006 . . . . . . . . . . . . . $1,066,238 $21,166 $4,947 $28,897 $ (56) $1,121,192
(1) See Note 15 for a discussion of discontinued operations.(2) Certain reclassifications have been made to prior-period amounts to conform to the current period’s presentation.(3) Corporate assets have been fully allocated to the Company’s business segments.
11. Variable Interest Entities.FASB Interpretation No. 46, as revised (“FIN 46R”), “Consolidation of Variable Interest Entities,” applies tocertain entities in which equity investors do not have the characteristics of a controlling financial interest or donot have sufficient equity at risk for the entity to finance its activities without additional subordinated financialsupport from other parties (“variable interest entities”). Variable interest entities are required to be consolidatedby their primary beneficiaries if they do not effectively disperse risks among parties involved. The primarybeneficiary of a VIE is the party that absorbs a majority of the entity’s expected losses, receives a majority of itsexpected residual returns, or both, as a result of holding variable interests. The Company is involved with variousentities in the normal course of business that may be deemed to be VIEs and may hold interests therein, includingdebt securities, interest-only strip investments and derivative instruments that may be considered variableinterests. Transactions associated with these entities include asset- and mortgage-backed securitizations and
27

MORGAN STANLEY
NOTES TO CONDENSED CONSOLIDATED FINANCIAL STATEMENTS—(Continued)(UNAUDITED)
structured financings (including collateralized debt, bond or loan obligations and credit-linked notes). TheCompany engages in these transactions principally to facilitate client needs and as a means of selling financialassets. The Company consolidates entities in which it is deemed to be the primary beneficiary. For those entitiesdeemed to be qualifying special purpose entities (as defined in SFAS No. 140), which includes the credit cardasset securitization master trusts (see Note 4), the Company does not consolidate the entity.
The Company purchases and sells interests in entities that may be deemed to be VIEs in the ordinary course of itsbusiness. As a result of these activities, it is possible that such entities may be consolidated and deconsolidated atvarious points in time. Therefore, the Company’s variable interests described below may not be held by theCompany at the end of future quarterly reporting periods.
At February 28, 2007, in connection with its Institutional Securities business, the aggregate size of VIEs,including financial asset-backed securitization, mortgage-backed securitization, collateralized debt obligation,credit-linked note, structured note, municipal bond trust, loan issuing, commodities monetization, equity-linkednote, equity fund and exchangeable trust entities, for which the Company was the primary beneficiary of theentities was approximately $33.5 billion, which is the carrying amount of the consolidated assets recorded asFinancial instruments owned that are collateral for the entities’ obligations. The nature and purpose of theseentities that the Company consolidated were to issue a series of notes to investors that provides the investors areturn based on the holdings of the entities. These transactions were executed to facilitate client investmentobjectives. The structured note, equity-linked note, equity fund, certain credit-linked note, certain collateralizeddebt obligation, certain mortgage-backed securitization, certain financial asset-backed securitization andmunicipal bond transactions also were executed as a means of selling financial assets. The Company consolidatesthose entities where it holds either the entire class or a majority of the class of subordinated notes or entered intoa derivative instrument with the VIE, which bears the majority of the expected losses or receives a majority ofthe expected residual returns of the entities. The Company accounts for the assets held by the entities as Financialinstruments owned and the liabilities of the entities as Other secured financings.
At February 28, 2007, also in connection with its Institutional Securities business, the aggregate size of theentities for which the Company holds significant variable interests, which consist of subordinated and otherclasses of beneficial interests, derivative instruments, limited partnership investments and secondary guarantees,was approximately $40.7 billion. The Company’s variable interests associated with these entities, primarilycredit-linked note, structured note, loan and bond issuing, collateralized debt, loan and bond obligation, financialasset-backed securitization, mortgage-backed securitization and tax credit limited liability entities, includinginvestments in affordable housing tax credit funds and underlying synthetic fuel production plants, wereapproximately $21.0 billion consisting primarily of senior beneficial interests, which represent the Company’smaximum exposure to loss at February 28, 2007. The Company may hedge the risks inherent in its variableinterest holdings, thereby reducing its exposure to loss. The Company’s maximum exposure to loss does notinclude the offsetting benefit of any financial instruments that the Company utilizes to hedge these risks.
12. Guarantees.
The Company has certain obligations under certain guarantee arrangements, including contracts andindemnification agreements that contingently require a guarantor to make payments to the guaranteed party basedon changes in an underlying measure (such as an interest or foreign exchange rate, security or commodity price,an index or the occurrence or non-occurrence of a specified event) related to an asset, liability or equity securityof a guaranteed party. Also included as guarantees are contracts that contingently require the guarantor to makepayments to the guaranteed party based on another entity’s failure to perform under an agreement, as well asindirect guarantees of the indebtedness of others. The Company’s use of guarantees is disclosed below by type ofguarantee:
28

MORGAN STANLEY
NOTES TO CONDENSED CONSOLIDATED FINANCIAL STATEMENTS—(Continued)(UNAUDITED)
Derivative Contracts. Certain derivative contracts meet the accounting definition of a guarantee, includingcertain written options, contingent forward contracts and credit default swaps. Although the Company’sderivative arrangements do not specifically identify whether the derivative counterparty retains the underlyingasset, liability or equity security, the Company has disclosed information regarding all derivative contracts thatcould meet the accounting definition of a guarantee. The maximum potential payout for certain derivativecontracts, such as written interest rate caps and written foreign currency options, cannot be estimated, asincreases in interest or foreign exchange rates in the future could possibly be unlimited. Therefore, in order toprovide information regarding the maximum potential amount of future payments that the Company could berequired to make under certain derivative contracts, the notional amount of the contracts has been disclosed.
The Company records all derivative contracts at fair value. For this reason, the Company does not monitor itsrisk exposure to such derivative contracts based on derivative notional amounts; rather, the Company manages itsrisk exposure on a fair value basis. Aggregate market risk limits have been established, and market risk measuresare routinely monitored against these limits. The Company also manages its exposure to these derivativecontracts through a variety of risk mitigation strategies, including, but not limited to, entering into offsettingeconomic hedge positions. The Company believes that the notional amounts of the derivative contracts generallyoverstate its exposure.
Financial Guarantees to Third Parties. In connection with its corporate lending business and other corporateactivities, the Company provides standby letters of credit and other financial guarantees to counterparties. Sucharrangements represent obligations to make payments to third parties if the counterparty fails to fulfill itsobligation under a borrowing arrangement or other contractual obligation.
Market Value Guarantees. Market value guarantees are issued to guarantee return of principal invested to fundinvestors associated with certain European equity funds and to guarantee timely payment of a specified return toinvestors in certain affordable housing tax credit funds. The guarantees associated with certain European equityfunds are designed to provide for any shortfall between the market value of the underlying fund assets andinvested principal and a stipulated return amount. The guarantees provided to investors in certain affordablehousing tax credit funds are designed to return an investor’s contribution to a fund and the investor’s share of taxlosses and tax credits expected to be generated by a fund.
Liquidity Guarantees. The Company has entered into liquidity facilities with special purpose entities and othercounterparties, whereby the Company is required to make certain payments if losses or defaults occur. TheCompany often may have recourse to the underlying assets held by the special purpose entities in the eventpayments are required under such liquidity facilities.
The table below summarizes certain information regarding these guarantees at February 28, 2007:
Maximum Potential Payout/Notional
CarryingAmount
Collateral/Recourse
Years to Maturity
TotalType of Guarantee Less than 1 1-3 3-5 Over 5
(dollars in millions)
Notional amount of derivativecontracts . . . . . . . . . . . . . . . . . . $742,335 $638,755 $1,246,855 $1,100,519 $3,728,464 $36,163 $119
Standby letters of credit and otherfinancial guarantees . . . . . . . . . 3,869 548 654 3,912 8,983 206 1,764
Market value guarantees . . . . . . . 17 150 — 605 772 46 128Liquidity facilities . . . . . . . . . . . . 1,598 — — 110 1,708 — —
29

MORGAN STANLEY
NOTES TO CONDENSED CONSOLIDATED FINANCIAL STATEMENTS—(Continued)(UNAUDITED)
Indemnities. In the normal course of its business, the Company provides standard indemnities to counterpartiesfor certain contingent exposures and taxes, including U.S. and foreign withholding taxes, on interest and otherpayments made on derivatives, securities and stock lending transactions, certain annuity products and otherfinancial arrangements. These indemnity payments could be required based on a change in the tax laws or changein interpretation of applicable tax rulings or a change in factual circumstances. Certain contracts containprovisions that enable the Company to terminate the agreement upon the occurrence of such events. Themaximum potential amount of future payments that the Company could be required to make under theseindemnifications cannot be estimated. The Company has not recorded any contingent liability in the condensedconsolidated financial statements for these indemnifications and believes that the occurrence of any events thatwould trigger payments under these contracts is remote.
Exchange/Clearinghouse Member Guarantees. The Company is a member of various U.S. and non-U.S.exchanges and clearinghouses that trade and clear securities and/or futures contracts. Associated with itsmembership, the Company may be required to pay a proportionate share of the financial obligations of anothermember who may default on its obligations to the exchange or the clearinghouse. While the rules governingdifferent exchange or clearinghouse memberships vary, in general the Company’s guarantee obligations wouldarise only if the exchange or clearinghouse had previously exhausted its resources. In addition, any suchguarantee obligation would be apportioned among the other non-defaulting members of the exchange orclearinghouse. Any potential contingent liability under these membership agreements cannot be estimated. TheCompany has not recorded any contingent liability in the condensed consolidated financial statements for theseagreements and believes that any potential requirement to make payments under these agreements is remote.
General Partner Guarantees. As a general partner in certain private equity and real estate partnerships, theCompany receives distributions from the partnerships according to the provisions of the partnership agreements.The Company may, from time to time, be required to return all or a portion of such distributions to the limitedpartners in the event the limited partners do not achieve a certain return as specified in various partnershipagreements, subject to certain limitations. The maximum potential amount of future payments that the Companycould be required to make under these provisions at February 28, 2007 and November 30, 2006 was $348 millionand $320 million, respectively. As of February 28, 2007 and November 30, 2006, the Company’s accruedliability for distributions that the Company has determined is probable it will be required to refund based on theapplicable refund criteria specified in the various partnership agreements was $26 million and $25 million,respectively.
Securitized Asset Guarantees. As part of the Company’s Institutional Securities and Discover securitizationactivities, the Company provides representations and warranties that certain securitized assets conform tospecified guidelines. The Company may be required to repurchase such assets or indemnify the purchaser againstlosses if the assets do not meet certain conforming guidelines. Due diligence is performed by the Company toensure that asset guideline qualifications are met, and, to the extent the Company has acquired such assets to besecuritized from other parties, the Company seeks to obtain its own representations and warranties regarding theassets. The maximum potential amount of future payments the Company could be required to make would beequal to the current outstanding balances of all assets subject to such securitization activities. Also, in connectionwith originations of residential mortgage loans under the Company’s FlexSource® program, the Company maypermit borrowers to pledge marketable securities as collateral instead of requiring cash down payments for thepurchase of the underlying residential property. Upon sale of the residential mortgage loans, the Company mayprovide a surety bond that reimburses the purchasers for shortfalls in the borrowers’ securities accounts up tocertain limits if the collateral maintained in the securities accounts (along with the associated real estatecollateral) is insufficient to cover losses that purchasers experience as a result of defaults by borrowers on theunderlying residential mortgage loans. The Company requires the borrowers to meet daily collateral calls to
30
MORGAN STANLEY
NOTES TO CONDENSED CONSOLIDATED FINANCIAL STATEMENTS—(Continued)(UNAUDITED)
ensure the marketable securities pledged in lieu of a cash down payment are sufficient. At February 28, 2007 andNovember 30, 2006, the maximum potential amount of future payments the Company may be required to makeunder its surety bond was $116 million and $121 million, respectively. The Company has not recorded anycontingent liability in the condensed consolidated financial statements for these representations and warrantiesand reimbursement agreements and believes that the probability of any payments under these arrangements isremote.
Merchant Chargeback Guarantees. In connection with its Discover business segment, the Company issuescredit cards in the U.S. and U.K. and owns and operates the Discover Network in the U.S. The Company iscontingently liable for certain transactions processed on the Discover Network in the event of a dispute betweenthe cardmember and a merchant. The contingent liability arises if the disputed transaction involves a merchant ormerchant acquirer with whom the Discover Network has a direct relationship. If a dispute is resolved in thecardmember’s favor, the Discover Network will credit or refund the disputed amount to the Discover Networkcard issuer, who in turn credits its cardmember’s account. Discover Network will then charge back thetransaction to the merchant or merchant acquirer. If the Discover Network is unable to collect the amount fromthe merchant or merchant acquirer, it will bear the loss for the amount credited or refunded to the cardmember. Inmost instances, a payment requirement by the Discover Network is unlikely to arise because most products orservices are delivered when purchased, and credits are issued by the merchant acquirer or merchant on returneditems in a timely fashion. However, where the product or service is not provided until some later date followingthe purchase, the likelihood of payment by the Discover Network increases. Similarly, the Company is alsocontingently liable for the resolution of cardmember disputes associated with its general purpose credit cardsissued by its U.K. chartered bank on the MasterCard and Visa networks. The maximum potential amount offuture payments related to these contingent liabilities is estimated to be the portion of the total Discover Networksales transaction volume processed to date as well as the total U.K. cardmember sales transaction volume billedto date for which timely and valid disputes may be raised under applicable law, and relevant issuer andcardmember agreements. The Company believes, however, that this amount is not representative of theCompany’s actual potential loss exposure based on the Company’s historical experience. The actual amount ofthe potential exposure cannot be quantified as the Company cannot determine whether the current or cumulativetransaction volumes may include or result in disputed transactions.
The table below summarizes certain information regarding merchant chargeback guarantees during the quartersended February 28, 2007 and 2006:
Three MonthsEnded
February 28,
2007 2006
Losses related to merchant chargebacks (dollars in millions) . . . . . . . . . . . . . . . . . . . . . . . . . . . . . $ 2.0 $ 0.5Aggregate credit card sales volume (dollars in billions) . . . . . . . . . . . . . . . . . . . . . . . . . . . . . . . . . . 26.4 23.2
The amount of the liability related to the Company’s credit cardmember merchant guarantee was not material atFebruary 28, 2007. The Company mitigates this risk by withholding settlement from merchants or obtainingescrow deposits from certain merchants that are considered higher risk due to various factors such as time delaysin the delivery of products or services. The table below provides information regarding the settlementwithholdings and escrow deposits:
AtFebruary 28,
2007
AtNovember 30,
2006
(dollars in millions)
Settlement withholdings and escrow deposits . . . . . . . . . . . . . . . . . . . . . . . . . . . . . . . . $61.2 $54.7
31

MORGAN STANLEY
NOTES TO CONDENSED CONSOLIDATED FINANCIAL STATEMENTS—(Continued)(UNAUDITED)
Other. The Company may, from time to time, in its role as investment banking advisor be required to provideguarantees in connection with certain European merger and acquisition transactions. If required by the regulatingauthorities, the Company provides a guarantee that the acquirer in the merger and acquisition transaction has orwill have sufficient funds to complete the transaction and would then be required to make the acquisitionpayments in the event the acquirer’s funds are insufficient at the completion date of the transaction. Thesearrangements generally cover the time frame from the transaction offer date to its closing date and therefore aregenerally short term in nature. The maximum potential amount of future payments that the Company could berequired to make cannot be estimated. The Company believes the likelihood of any payment by the Companyunder these arrangements is remote given the level of the Company’s due diligence associated with its role asinvestment banking advisor.
13. Investments in Unconsolidated Investees.
The Company invests in unconsolidated investees that own synthetic fuel production plants. The Companyaccounts for these investments under the equity method of accounting. The Company’s share of the operatinglosses generated by these investments is recorded within Losses from unconsolidated investees, and the taxcredits and the tax benefits associated with these operating losses are recorded within the Provision for incometaxes.
In the quarters ended February 28, 2007 and 2006, the losses from unconsolidated investees were more thanoffset by the respective tax credits and tax benefits on the losses. The table below provides information regardingthe losses from unconsolidated investees, tax credits and tax benefits on the losses:
Three MonthsEnded
February 28,
2007 2006
(dollars in millions)
Losses from unconsolidated investees . . . . . . . . . . . . . . . . . . . . . . . . . . . . . . . . . . . . . . . . . . . . . $44 $69Tax credits . . . . . . . . . . . . . . . . . . . . . . . . . . . . . . . . . . . . . . . . . . . . . . . . . . . . . . . . . . . . . . . . . . 57 74Tax benefits on losses . . . . . . . . . . . . . . . . . . . . . . . . . . . . . . . . . . . . . . . . . . . . . . . . . . . . . . . . . 17 27
Under the current tax law, synthetic fuels tax credits are granted under Section 45K of the Internal RevenueCode. Synthetic fuels tax credits are available in full only when the price of oil is less than a base price specifiedby the tax code, as adjusted for inflation (“Base Price”). The Base Price for each calendar year is determined bythe Secretary of the Treasury by April 1 of the following year. If the annual average price of a barrel of oil in2007 or future years exceeds the applicable Base Price, the synthetic fuels tax credits generated by theCompany’s synthetic fuel facilities will be phased out, on a ratable basis, over the phase-out range. Based onfiscal year to date and futures prices at February 28, 2007, the Company estimates that there will be a partialphase-out of tax credits earned in fiscal 2007. The impact of this partial phase-out is included within Losses fromunconsolidated investees and the Provision for income taxes for the quarter ended February 28, 2007.
The Company has entered into derivative contracts designed to reduce its exposure to rising oil prices and thepotential phase-out of the synthetic fuels tax credits. Changes in fair value relative to these derivative contractsare included within Principal transactions—trading revenues.
32

MORGAN STANLEY
NOTES TO CONDENSED CONSOLIDATED FINANCIAL STATEMENTS—(Continued)(UNAUDITED)
14. Employee Benefit Plans.
The Company maintains various pension and benefit plans for eligible employees.
The components of the Company’s net periodic benefit expense for its pension and postretirement plans were asfollows:
Three MonthsEnded
February 28,
2007 2006
(dollars in millions)
Service cost, benefits earned during the period . . . . . . . . . . . . . . . . . . . . . . . . . . . . . . . . . . . . . . $ 34 $ 35Interest cost on projected benefit obligation . . . . . . . . . . . . . . . . . . . . . . . . . . . . . . . . . . . . . . . . 38 37Expected return on plan assets . . . . . . . . . . . . . . . . . . . . . . . . . . . . . . . . . . . . . . . . . . . . . . . . . . . (35) (34)Net amortization—transition obligation/prior service cost . . . . . . . . . . . . . . . . . . . . . . . . . . . . . (4) (4)Net amortization—actuarial loss . . . . . . . . . . . . . . . . . . . . . . . . . . . . . . . . . . . . . . . . . . . . . . . . . 12 16
Net periodic benefit expense . . . . . . . . . . . . . . . . . . . . . . . . . . . . . . . . . . . . . . . . . . . . . . . . $ 45 $ 50
15. Discontinued Operations.
Quilter. On February 28, 2007, the Company sold Quilter, its standalone U.K. mass affluent business that wasformerly included within the Global Wealth Management Group business segment. The results of Quilter areincluded within discontinued operations for all periods presented. The results for discontinued operations in thequarter ended February 28, 2007 also included a pre-tax gain of $168 million ($109 million after-tax) ondisposition.
Aircraft Leasing. On March 24, 2006, the Company sold its aircraft leasing business to Terra Firma, aEuropean private equity group. The results for discontinued operations in the quarter ended February 28, 2006included a loss of $125 million ($75 million after-tax) related to the impact of the finalization of the salesproceeds and balance sheet adjustments related to the closing (see “Financial Statements and SupplementaryData —Note 18” in Part II, Item 8 of the Form 10-K for further information).
Summarized financial information for the Company’s discontinued operations:
The table below provides information regarding amounts included within discontinued operations (dollarsin millions):
Three MonthsEnded
February 28,
2007 2006
Pre-tax gain/(loss) on discontinued operationsQuilter . . . . . . . . . . . . . . . . . . . . . . . . . . . . . . . . . . . . . . . . . . . . . . . . . . . . . . . . . . . . . . . . . . . . . $174 $ 7Aircraft leasing . . . . . . . . . . . . . . . . . . . . . . . . . . . . . . . . . . . . . . . . . . . . . . . . . . . . . . . . . . . . . . . — (55)
$174 $(48)
33

MORGAN STANLEY
NOTES TO CONDENSED CONSOLIDATED FINANCIAL STATEMENTS—(Continued)(UNAUDITED)
16. Business and Other Acquisitions.
JM Financial. On February 22, 2007, the Company announced that it would dissolve its India joint venturewith JM Financial. The Company has reached an agreement in principle to purchase the joint venture’sinstitutional equities sales, trading and research platform by acquiring JM Financial’s 49% interest and to sell theCompany’s 49% interest in the joint venture’s investment banking, fixed income and retail operation to JMFinancial.
CityMortgage Bank. On December 21, 2006, the Company acquired CityMortgage Bank (“CityMortgage”), aMoscow-based mortgage bank that specializes in originating, servicing and securitizing residential mortgageloans in the Russian Federation. Since the acquisition date, the results of CityMortgage have been includedwithin the Institutional Securities business segment.
Olco Petroleum Group Inc. On December 15, 2006, the Company acquired a 60% equity stake in OlcoPetroleum Group Inc. (“Olco”), a petroleum products marketer and distributor based in eastern Canada. Since theacquisition date, the results of Olco have been included within the Institutional Securities business segment.
Saxon Capital, Inc. On December 4, 2006, the Company acquired Saxon Capital, Inc. (“Saxon”), a servicerand originator of residential mortgages. Since the acquisition date, the results of Saxon have been included withinthe Institutional Securities business segment.
FrontPoint Partners. On December 4, 2006, the Company acquired FrontPoint Partners (“FrontPoint”), aprovider of absolute return investment strategies. Since the acquisition date, the results of FrontPoint have beenincluded within the Asset Management business segment.
The proforma impact of each of the above business acquisitions individually and in the aggregate was notmaterial to the condensed consolidated financial statements. In addition, the allocations of the purchase prices arepreliminary and subject to further adjustment as the valuations of certain intangible assets are still in process.
17. Income Tax Examinations.
The Company is under continuous examination by the Internal Revenue Service (the “IRS”) and other taxauthorities in certain countries, such as Japan and the U.K., and states in which the Company has significantbusiness operations, such as New York. The tax years under examination vary by jurisdiction; for example,the current IRS examination covers 1999-2005. The Company regularly assesses the likelihood of additionalassessments in each of the taxing jurisdictions resulting from these and subsequent years’ examinations.The Company has established tax reserves that the Company believes are adequate in relation to the potential foradditional assessments. Once established, the Company adjusts tax reserves only when more information isavailable or when an event occurs necessitating a change to the reserves. The Company believes that theresolution of tax matters will not have a material effect on the condensed consolidated financial condition of theCompany, although a resolution could have a material impact on the Company’s condensed consolidatedstatement of income for a particular future period and on the Company’s effective income tax rate for any periodin which such resolution occurs.
18. Fair Value Disclosures.
Effective December 1, 2006 the Company early adopted SFAS No. 157 and SFAS No. 159, which requiredisclosures about the Company’s assets and liabilities that are measured at fair value. Further information aboutsuch assets and liabilities is presented below.
34

MORGAN STANLEY
NOTES TO CONDENSED CONSOLIDATED FINANCIAL STATEMENTS—(Continued)(UNAUDITED)
Fair Value Measurements. In September 2006, the FASB issued SFAS No. 157, which defines fair value,establishes a framework for measuring fair value and expands disclosures about fair value measurements. Inaddition, SFAS No. 157 disallows the use of block discounts for large holdings of unrestricted financialinstruments where quoted prices are readily and regularly available in an active market, and nullifies selectguidance provided by EITF Issue No. 02-3, which prohibited the recognition of trading gains or losses at theinception of a derivative contract, unless the fair value of such derivative is obtained from a quoted market price,or other valuation technique that incorporates observable market data. SFAS No. 157 also requires the Companyto consider its own credit spreads when measuring the fair value of liabilities, including derivatives. EffectiveDecember 1, 2006, the Company elected early adoption of SFAS No. 157. In accordance with the provisions ofSFAS No. 157 related to block discounts and EITF Issue No. 02-3, the Company recorded a cumulative effectadjustment of approximately $80 million after-tax as an increase to the opening balance of Retained Earnings asof December 1, 2006, which was primarily associated with EITF Issue No. 02-3. The impact of considering theCompany’s own credit spreads when measuring the fair value of liabilities, including derivatives, did not have amaterial impact on fair value measurements at the date of adoption.
The following tables present information about the Company’s assets and liabilities measured at fair value on arecurring basis as of February 28, 2007, and indicates the fair value hierarchy of the valuation techniques utilizedby the Company to determine such fair value. In general, fair values determined by Level 1 inputs utilize quotedprices (unadjusted) in active markets for identical assets or liabilities that the Company has the ability to access.Fair values determined by Level 2 inputs utilize inputs other than quoted prices included in Level 1 that areobservable for the asset or liability, either directly or indirectly. Level 2 inputs include quoted prices for similarassets and liabilities in active markets, and inputs other than quoted prices that are observable for the asset orliability, such as interest rates and yield curves that are observable at commonly quoted intervals. Level 3 inputsare unobservable inputs for the asset or liability, and includes situations where there is little, if any, marketactivity for the asset or liability. In certain cases, the inputs used to measure fair value may fall intodifferent levels of the fair value hierarchy. In such cases, the level in the fair value hierarchy within which thefair value measurement in its entirety falls has been determined based on the lowest level input that is significantto the fair value measurement in its entirety. The Company’s assessment of the significance of a particular inputto the fair value measurement in its entirety requires judgment, and considers factors specific to the asset orliability.
35

MORGAN STANLEY
NOTES TO CONDENSED CONSOLIDATED FINANCIAL STATEMENTS—(Continued)(UNAUDITED)
Assets and Liabilities Measured at Fair Value on a Recurring Basis as of February 28, 2007
Quoted Prices inActive Markets
forIdentical Assets
(Level 1)
SignificantOther
ObservableInputs
(Level 2)
SignificantUnobservable
Inputs(Level 3)
Counterpartyand CashCollateral
Netting
Balanceas of
February 28,2007
(dollars in millions)
AssetsCash and securities deposited with clearing
organizations or segregated under federaland other regulations or requirements . . . . . . $ 10,189 $ — $ — $ — $ 10,189
Financial instruments owned:U.S. government and agency securities . . . 23,119 19,302 148 — 42,569Other sovereign government
obligations . . . . . . . . . . . . . . . . . . . . . . . 24,869 6,569 911 — 32,349Corporate and other debt(1) . . . . . . . . . . . 560 131,755 36,351 — 168,666Corporate equities . . . . . . . . . . . . . . . . . . . 95,321 522 1,239 — 97,082Derivative contracts . . . . . . . . . . . . . . . . . . 7,799 346,471 12,209 (315,527) 50,952Physical commodities . . . . . . . . . . . . . . . . — 2,839 — — 2,839
Total financial instruments owned . . . . . . . . . . 151,668 507,458 50,858 (315,527) 394,457Consumer loans . . . . . . . . . . . . . . . . . . . . . . . . . — 718 — — 718Net intangible assets(2) . . . . . . . . . . . . . . . . . . . — 287 — — 287Other assets . . . . . . . . . . . . . . . . . . . . . . . . . . . . 869 597 8,994 — 10,460
LiabilitiesCommercial paper and other short-term
borrowings . . . . . . . . . . . . . . . . . . . . . . . . . . . $ — $ 1,590 $ — $ — $ 1,590Deposits . . . . . . . . . . . . . . . . . . . . . . . . . . . . . . . — 5,304 — — 5,304Financial instruments sold, not yet purchased:
U.S. government and agency securities . . . 17,830 232 — — 18,062Other sovereign government
obligations . . . . . . . . . . . . . . . . . . . . . . . 24,752 1,440 — — 26,192Corporate and other debt . . . . . . . . . . . . . . 64 8,304 68 — 8,436Corporate equities . . . . . . . . . . . . . . . . . . . 52,060 11 15 — 52,086Derivative contracts . . . . . . . . . . . . . . . . . . 10,574 340,343 11,933 (311,276) 51,574Physical commodities . . . . . . . . . . . . . . . . — 1,457 — — 1,457
Total financial instruments sold, not yetpurchased . . . . . . . . . . . . . . . . . . . . . . . . . . . . 105,280 351,787 12,016 (311,276) 157,807
Other secured financings . . . . . . . . . . . . . . . . . . — 45,506 6,088 — 51,594Long-term borrowings . . . . . . . . . . . . . . . . . . . . — 15,076 544 — 15,620
(1) At February 28, 2007, there were approximately $13 billion of certain structured loan products included within Financial instrumentsowned—corporate and other debt that were accounted for on an accrual basis.
(2) Amount represents MSRs accounted for at fair value (see Note 3).
36

MORGAN STANLEY
NOTES TO CONDENSED CONSOLIDATED FINANCIAL STATEMENTS—(Continued)(UNAUDITED)
The following table presents additional information about assets and liabilities measured at fair value on arecurring basis and for which the Company has utilized Level 3 inputs to determine fair value:
Changes in Level 3 Assets and Liabilities Measured at Fair Value on a Recurring Basis
BeginningBalance
Total Realized and Unrealized Gainsor (Losses) included in Income
TotalRealized
andUnrealizedGains orLosses
Purchases,Sales,Other
Settlementsand
Issuances,net
NetTransfersIn and/or
Out ofLevel 3
EndingBalance
PrincipalTransactions:
Trading
PrincipalTransactions:Investments
OtherRevenues
(dollars in millions)
AssetsFinancial instruments owned:
U.S. government andagency securities . . . . $ 2 $ (6) $— $— $ (6) $ 152 $— $ 148
Other sovereigngovernmentobligations . . . . . . . . . 162 35 — — 35 682 32 911
Corporate and otherdebt . . . . . . . . . . . . . . 33,941 (5) — — (5) 2,458 (43) 36,351
Corporate equities . . . . . 1,040 37 — — 37 170 (8) 1,239Net derivative
contracts (1)(2) . . . . . 30 547 — — 547 (335) 34 276Other assets (3) . . . . . . . . . . . 6,583 2 569 5 576 1,848 (13) 8,994
LiabilitiesFinancial instruments sold,
not yet purchased:Corporate and other
debt . . . . . . . . . . . . . . 185 (8) — — (8) (167) 42 68Corporate equities . . . . . 9 — — — — 1 5 15
Other secured financings . . . . 4,724 — — — — 1,364 — 6,088Long-term borrowings . . . . . 464 (53) — — (53) 27 — 544
(1) Amounts represent Financial instruments owned—derivative contracts net of Financial instruments sold, not yet purchased—derivativecontracts.
(2) The gains and losses associated with Net derivative contracts were primarily driven by credit products as a result of market movements.(3) The gains and losses associated with Other assets were primarily related to investments in the Company’s real estate funds.
37

MORGAN STANLEY
NOTES TO CONDENSED CONSOLIDATED FINANCIAL STATEMENTS—(Continued)(UNAUDITED)
The following table presents the amounts of unrealized gains or (losses) for the three months ended February 28,2007 relating to those assets and liabilities for which the Company utilized significant Level 3 inputs todetermine fair value and that were still held by the Company at February 28, 2007:
PrincipalTransactions:
Trading
PrincipalTransactions:Investments
OtherRevenues
(dollars in millions)
AssetsFinancial instruments owned:
U.S. government and agency securities . . . . . . . . . . . . . . . . . . . . . . . . . . . $ (6) $— $—Other sovereign government obligations . . . . . . . . . . . . . . . . . . . . . . . . . . 33 — —Corporate and other debt . . . . . . . . . . . . . . . . . . . . . . . . . . . . . . . . . . . . . . (6) — —Corporate equities . . . . . . . . . . . . . . . . . . . . . . . . . . . . . . . . . . . . . . . . . . . 90 — —Net derivative contracts(1) . . . . . . . . . . . . . . . . . . . . . . . . . . . . . . . . . . . . . 741 — —
Other assets(1) . . . . . . . . . . . . . . . . . . . . . . . . . . . . . . . . . . . . . . . . . . . . . . . . . . — 553 5
LiabilitiesFinancial instruments sold, not yet purchased:
Corporate and other debt . . . . . . . . . . . . . . . . . . . . . . . . . . . . . . . . . . . . . . $ 2 $— $—Long-term borrowings . . . . . . . . . . . . . . . . . . . . . . . . . . . . . . . . . . . . . . . . . . . . (53) — —
(1) The amount associated with Net derivative contracts was primarily driven by credit products as a result of market movements. Theamounts associated with Other assets were primarily driven by investments in the Company’s real estate funds.
Both observable and unobservable inputs may be used to determine the fair value of positions that the Companyhas classified within the Level 3 category. As a result, the unrealized gains and losses for assets andliabilities within the Level 3 category presented in the table above may include changes in fair value that wereattributable to both observable (e.g., changes in market interest rates) and unobservable (e.g., changes inunobservable long-dated volatilities) inputs.
The Company also employs various hedging techniques in order to manage risks associated with certainpositions, including those that have been classified within the Level 3 category. Such techniques may include thepurchase or sale of financial instruments that are classified within the Level 1 and/or Level 2 categories. As aresult, the realized and unrealized gains and losses for assets and liabilities within the Level 3 category presentedin the tables above do not reflect the related realized or unrealized gains and losses on hedging instruments thathave been classified by the Company within the Level 1 and/or Level 2 categories.
At February 28, 2007, the Company also had assets and liabilities measured at fair value on a non-recurringbasis. During the quarter ended February 28, 2007, the only fair value measurements for assets and liabilitiesmeasured at fair value on a non-recurring basis were associated with certain assets and liabilities of acquiredbusinesses, including goodwill and intangible assets. Such measurements were determined utilizing Level 3inputs. See Notes 2 and 16 for further information.
Fair Value Option. In February 2007, the FASB issued SFAS No. 159, which provides a fair value optionelection that allows companies to irrevocably elect fair value as the initial and subsequent measurement attributefor certain financial assets and liabilities, with changes in fair value recognized in earnings as they occur. SFASNo. 159 permits the fair value option election on an instrument by instrument basis at initial recognition of anasset or liability or upon an event that gives rise to a new basis of accounting for that instrument. Effective
38

MORGAN STANLEY
NOTES TO CONDENSED CONSOLIDATED FINANCIAL STATEMENTS—(Continued)(UNAUDITED)
December 1, 2006, the Company elected early adoption of SFAS No. 159. As a result of the adoption of SFASNo. 159, the Company recorded a cumulative effect adjustment of approximately $166 million ($102 millionafter-tax) as an increase to the opening balance of Retained earnings as of December 1, 2006.
The following table presents information about the eligible instruments for which the Company elected the fairvalue option and for which a transition adjustment was recorded as of December 1, 2006:
Carrying Value ofInstrument
at December 1, 2006
TransitionAdjustmentto Retained
EarningsGain/(Loss)
Carrying Value ofInstrument
at December 1, 2006(After Adoption of
SFAS No. 159)
(dollars in millions)
Financial instruments owned(1) . . . . . . . . . . . . . . . . . . . . . $ 8,587 $ 16 $ 8,603Consumer loans(2) . . . . . . . . . . . . . . . . . . . . . . . . . . . . . . . . 1,258 7 1,265Other assets(3) . . . . . . . . . . . . . . . . . . . . . . . . . . . . . . . . . . . 1,305 13 1,318Commercial paper and other short-term borrowings(4) . . . 946 (1) 947Deposits(5) . . . . . . . . . . . . . . . . . . . . . . . . . . . . . . . . . . . . . . 3,143 1 3,142Long-term borrowings(4) . . . . . . . . . . . . . . . . . . . . . . . . . . 14,354 130 14,224
Pretax cumulative effect of adoption of the fair valueoption . . . . . . . . . . . . . . . . . . . . . . . . . . . . . . . . . . . . . . . . 166
Deferred taxes . . . . . . . . . . . . . . . . . . . . . . . . . . . . . . . . . . . 64
Cumulative effect of adoption of the fair value option . . . . $102
The transition adjustments were primarily related to the following:
(1) Loans and loan commitments made in connection with the Company’s corporate lending activities. The fair value option was elected forthese positions as they are risk-managed on a fair value basis.
(2) Certain mortgage lending products which are risk-managed by the Institutional Securities business segment on a fair value basis. TheCompany did not elect the fair value option for other eligible instruments within Consumer loans that are managed by the Discover businesssegment.
(3) Certain investments that had been previously accounted for under the equity method, as well as certain interests in clearinghouses. The fairvalue option was elected only for positions that are risk-managed on a fair value basis.
(4) Structured notes and other hybrid long-term debt instruments. The fair value option was elected for these positions as they are risk-managed on a fair value basis. The fair value option was elected for all such instruments issued after December 1, 2006, and a portion of theportfolio of instruments outstanding as of December 1, 2006. The fair value option was not elected for the remaining portion of the portfoliothat existed as of December 1, 2006 due to cost-benefit considerations, including the operational effort involved.
(5) Brokered and callable certificates of deposit issued by certain of the Company’s bank subsidiaries. The fair value option was elected forthese positions as they are risk-managed on a fair value basis. The Company did not elect the fair value option for other eligible instrumentswithin Deposits that are managed by the Discover business segment.
39

MORGAN STANLEY
NOTES TO CONDENSED CONSOLIDATED FINANCIAL STATEMENTS—(Continued)(UNAUDITED)
The following table presents gains and (losses) due to changes in fair value for items measured at fair valuepursuant to election of the fair value option for the three months ended February 28, 2007:
PrincipalTransactions:
Trading
PrincipalTransactions:Investments
NetInterestRevenue
Gains/(Losses) Included inthe Three Months Ended
February 28, 2007(1)
(dollars in millions)
Consumer loans . . . . . . . . . . . . . . . . . . . . . . . . . . . $ 15 $— $ 16 $ 31Other assets . . . . . . . . . . . . . . . . . . . . . . . . . . . . . . — 128 3 131Commercial paper and other short-term
borrowings . . . . . . . . . . . . . . . . . . . . . . . . . . . . . (5) — — (5)Deposits . . . . . . . . . . . . . . . . . . . . . . . . . . . . . . . . . 4 — — 4Long-term borrowings . . . . . . . . . . . . . . . . . . . . . . 136 — (49) 87
(1) In addition to these amounts, as discussed in Note 2, the majority of the instruments within Financial instruments owned and Financialinstruments sold, not yet purchased, are measured at fair value, either through the election of SFAS No. 159 or as required by otheraccounting pronouncements. Changes in the fair value of these instruments are recorded in Principal transactions—trading revenues.
Interest income and expense and dividend income are recorded within the condensed consolidated statements ofincome depending on the nature of the instrument and related market conventions. When interest and dividendsare included as a component of the change in the instruments’ fair value, interest and dividends are includedwithin Principal transactions—trading revenues. Otherwise, they are included within Interest and dividendincome or Interest expense.
As of February 28, 2007, the aggregate contractual principal amount of loans and long-term receivables forwhich the fair value option was elected exceeded the fair value of such loans and long-term receivables byapproximately $22,626 million. The aggregate fair value of loans that were 90 or more days past due as ofFebruary 28, 2007 was $2,174 million. The aggregate contractual principal amount of such loans exceeded theirfair value by approximately $22,230 million.
For the quarter ended February 28, 2007, the estimated changes in the fair value of liabilities for which the fairvalue option was elected that were attributable to changes in instrument-specific credit spreads were notmaterial. As of February 28, 2007, the aggregate contractual principal amount of long-term debt instruments forwhich the fair value option was elected exceeded the fair value of such instruments by approximately $577million.
For the quarter ended February 28, 2007, changes in the fair value of loans and other receivables for whichthe fair value option was elected that were attributable to changes in instrument-specific credit spreads wereestimated to be an immaterial unrealized loss.
Hybrid Financial Instruments. In February 2006, the FASB issued SFAS No. 155, “Accounting for CertainHybrid Financial Instruments” (“SFAS No. 155”), which amends SFAS No. 133 and SFAS No. 140. SFASNo. 155 permits hybrid financial instruments that contain an embedded derivative that would otherwise requirebifurcation to irrevocably be accounted for at fair value, with changes in fair value recognized in the statement ofincome. The fair value election may be applied on an instrument-by-instrument basis. SFAS No. 155 alsoeliminates a restriction on the passive derivative instruments that a qualifying special purpose entity may hold.The Company adopted SFAS No. 155 on December 1, 2006. Since SFAS No. 159 incorporates accounting anddisclosure requirements that are similar to SFAS No. 155, the Company decided to apply SFAS No. 159, ratherthan SFAS No. 155, to its fair value elections for hybrid financial instruments.
40

MORGAN STANLEY
NOTES TO CONDENSED CONSOLIDATED FINANCIAL STATEMENTS—(Continued)(UNAUDITED)
19. Other Accounting Developments.
In June 2005, the FASB ratified the consensus reached in EITF Issue No. 04-5, “Determining Whether a GeneralPartner, or the General Partners as a Group, Controls a Limited Partnership or Similar Entity When the LimitedPartners Have Certain Rights” (“EITF Issue No. 04-5”). Under the provisions of EITF Issue No. 04-5, a generalpartner in a limited partnership is presumed to control that limited partnership and, therefore, should include thelimited partnership in its consolidated financial statements, regardless of the amount or extent of the generalpartner’s interest unless a majority of the limited partners can vote to dissolve or liquidate the partnership orotherwise remove the general partner without having to show cause or the limited partners have substantiveparticipating rights that can overcome the presumption of control by the general partner. EITF Issue No. 04-5was effective immediately for all newly formed limited partnerships and existing limited partnerships for whichthe partnership agreements have been modified. For all other existing limited partnerships for which thepartnership agreements have not been modified, the Company adopted EITF Issue No. 04-5 on December 1,2006. The adoption of EITF Issue No. 04-5 on December 1, 2006 did not have a material impact on theCompany’s condensed consolidated financial statements.
In July 2006, the FASB issued FASB Interpretation No. 48, “Accounting for Uncertainty in Income Taxes, aninterpretation of FASB Statement No. 109” (“FIN 48”). FIN 48 clarifies the accounting for uncertainty in incometaxes recognized in a company’s financial statements and prescribes a recognition threshold and measurementattribute for the financial statement recognition and measurement of a tax position taken or expected to be takenin an income tax return. FIN 48 also provides guidance on derecognition, classification, interest and penalties,accounting in interim periods, disclosure and transition. FIN 48 is effective for the Company as of December 1,2007. The Company is currently evaluating the potential impact of adopting FIN 48.
In September 2006, the FASB issued SFAS No. 158, “Employers’ Accounting for Defined Benefit Pension andOther Postretirement Plans, an amendment of FASB Statements No. 87, 88, 106, and 132(R)” (“SFAS No. 158”).Among other items, SFAS No. 158 requires recognition of the overfunded or underfunded status of an entity’sdefined benefit and postretirement plans as an asset or liability in the financial statements and requires themeasurement of defined benefit and postretirement plan assets and obligations as of the end of the employer’sfiscal year. SFAS No. 158’s requirement to recognize the funded status in the financial statements is effective forfiscal years ending after December 15, 2006, and its requirement to use the fiscal year-end date as themeasurement date is effective for fiscal years ending after December 15, 2008. The Company is currentlyassessing the impact that SFAS No. 158 will have on its condensed consolidated financial statements.
41

REPORT OF INDEPENDENT REGISTERED PUBLIC ACCOUNTING FIRM
To the Board of Directors and Shareholders ofMorgan Stanley:
We have reviewed the accompanying condensed consolidated statement of financial condition of Morgan Stanleyand subsidiaries (the “Company”) as of February 28, 2007, and the related condensed consolidated statements ofincome, comprehensive income and cash flows for the three-month periods ended February 28, 2007 and 2006.These interim financial statements are the responsibility of the management of Morgan Stanley.
We conducted our reviews in accordance with the standards of the Public Company Accounting Oversight Board(United States). A review of interim financial information consists principally of applying analytical proceduresand making inquiries of persons responsible for financial and accounting matters. It is substantially less in scopethan an audit conducted in accordance with the standards of the Public Company Accounting Oversight Board(United States), the objective of which is the expression of an opinion regarding the financial statements taken asa whole. Accordingly, we do not express such an opinion.
Based on our reviews, we are not aware of any material modifications that should be made to such condensedconsolidated interim financial statements for them to be in conformity with accounting principles generallyaccepted in the United States of America.
We have previously audited, in accordance with the standards of the Public Company Accounting OversightBoard (United States), the consolidated statement of financial condition of Morgan Stanley and subsidiaries as ofNovember 30, 2006, and the related consolidated statements of income, comprehensive income, cash flows andchanges in shareholders’ equity for the fiscal year then ended (not presented herein) included in MorganStanley’s Annual Report on Form 10-K for the fiscal year ended November 30, 2006; and in our report datedFebruary 12, 2007, which report contains an explanatory paragraph relating to the adoption, in fiscal 2005, ofStatement of Financial Accounting Standards No. 123(R), “Share-Based Payment” and effective December 1,2005, the change in accounting policy for recognition of equity awards granted to retirement-eligible employeesand an explanatory paragraph relating to, in fiscal 2006, the application of Staff Accounting Bulletin No. 108,“Considering the Effects of Prior Year Misstatements when Quantifying Misstatements in Current Year FinancialStatement”, we expressed an unqualified opinion on those consolidated financial statements. In our opinion, theinformation set forth in the accompanying condensed consolidated statement of financial condition as ofNovember 30, 2006 is fairly stated, in all material respects, in relation to the consolidated statement of financialcondition from which it has been derived.
As discussed in Note 18 to the condensed consolidated interim financial statements, effective December 1, 2006,the Company adopted SFAS No. 157, “Fair Value Measurement” and SFAS No. 159, “The Fair Value Option forFinancial Assets and Financial Liabilities—Including an amendment of FASB Statement No. 115.”
/s/ Deloitte & Touche LLPNew York, New YorkApril 5, 2007
42

Item 2. Management’s Discussion and Analysis of Financial Condition and Results ofOperations.
Introduction.
Morgan Stanley (the “Company”) is a global financial services firm that maintains significant market positions ineach of its business segments—Institutional Securities, Global Wealth Management Group, Asset Managementand Discover. The Company, through its subsidiaries and affiliates, provides a wide variety of products andservices to a large and diversified group of clients and customers, including corporations, governments, financialinstitutions and individuals. A summary of the activities of each of the segments follows:
Institutional Securities includes capital raising; financial advisory services, including advice on mergers andacquisitions, restructurings, real estate and project finance; corporate lending; sales, trading, financing andmarket-making activities in equity securities and related products and fixed income securities and relatedproducts, including foreign exchange and commodities; benchmark indices and risk management analytics;research; and investment activities.
Global Wealth Management Group provides brokerage and investment advisory services covering variousinvestment alternatives; financial and wealth planning services; annuity and other insurance products; creditand other lending products; banking and cash management services; retirement services; and trust andfiduciary services.
Asset Management provides global asset management products and services in equity, fixed income,alternative investments and private equity to institutional and retail clients through proprietary and thirdparty retail distribution channels, intermediaries and the Company’s institutional distribution channel. AssetManagement also engages in investment activities.
Discover offers Discover®-branded credit cards and related consumer products and services and operates theDiscover Network, a merchant and cash access network for Discover Network-branded cards, and PULSE®
EFT Association LP (“PULSE”), an automated teller machine/debit and electronic funds transfer network.Discover also offers consumer finance products and services in the U.K., including Morgan Stanley-branded, Goldfish-branded and various other credit cards issued on the MasterCard and Visa networks.
On December 19, 2006, the Company announced that its Board of Directors had approved the spin-off ofDiscover (the “Discover Spin-off”) (see “Discover Spin-off” herein).
The discussion of the Company’s results of operations below may contain forward-looking statements. Thesestatements, which reflect management’s beliefs and expectations, are subject to risks and uncertainties that maycause actual results to differ materially. For a discussion of the risks and uncertainties that may affect theCompany’s future results, please see “Forward-Looking Statements” immediately preceding Part I, Item 1,“Competition” and “Regulation” in Part I, Item 1, “Risk Factors” in Part I, Item 1A, “Certain Factors AffectingResults of Operations” in Part II, Item 7 and other items throughout the Company’s Annual Report on Form 10-Kfor the fiscal year ended November 30, 2006 (the “Form 10-K”) and the Company’s 2007 Current Reports onForm 8-K.
The Company’s results of operations for the quarters ended February 28, 2007 and 2006 are discussed below.The results of Quilter Holdings Ltd. (“Quilter”), Global Wealth Management Group’s mass affluent business inthe U.K., are reported as discontinued operations for all periods presented through its sale on February 28, 2007.The results of the aircraft leasing business, which was sold on March 24, 2006, are also reported as discontinuedoperations for the three months ended February 28, 2006 (see “Discontinued Operations” herein).
43

Results of Operations.
Executive Summary.
Financial Information.
Three MonthsEnded February 28,
2007 2006(1)
Net revenues (dollars in millions):Institutional Securities . . . . . . . . . . . . . . . . . . . . . . . . . . . . . . . . . . . . . . . . . . . . . . . . . . . . $ 7,631 $5,551Global Wealth Management Group . . . . . . . . . . . . . . . . . . . . . . . . . . . . . . . . . . . . . . . . . 1,490 1,266Asset Management . . . . . . . . . . . . . . . . . . . . . . . . . . . . . . . . . . . . . . . . . . . . . . . . . . . . . . 905 705Discover . . . . . . . . . . . . . . . . . . . . . . . . . . . . . . . . . . . . . . . . . . . . . . . . . . . . . . . . . . . . . . 1,025 1,089Intersegment Eliminations . . . . . . . . . . . . . . . . . . . . . . . . . . . . . . . . . . . . . . . . . . . . . . . . (53) (59)
Consolidated net revenues . . . . . . . . . . . . . . . . . . . . . . . . . . . . . . . . . . . . . . . . . . . . . $10,998 $8,552
Income before taxes (dollars in millions)(2):Institutional Securities . . . . . . . . . . . . . . . . . . . . . . . . . . . . . . . . . . . . . . . . . . . . . . . . . . . . $ 3,031 $1,775Global Wealth Management Group . . . . . . . . . . . . . . . . . . . . . . . . . . . . . . . . . . . . . . . . . 220 15Asset Management . . . . . . . . . . . . . . . . . . . . . . . . . . . . . . . . . . . . . . . . . . . . . . . . . . . . . . 236 172Discover . . . . . . . . . . . . . . . . . . . . . . . . . . . . . . . . . . . . . . . . . . . . . . . . . . . . . . . . . . . . . . 372 479Intersegment Eliminations . . . . . . . . . . . . . . . . . . . . . . . . . . . . . . . . . . . . . . . . . . . . . . . . 5 19
Consolidated income before taxes . . . . . . . . . . . . . . . . . . . . . . . . . . . . . . . . . . . . . . $ 3,864 $2,460
Consolidated net income (dollars in millions) . . . . . . . . . . . . . . . . . . . . . . . . . . . . . . . . . . . $ 2,672 $1,574
Earnings applicable to common shareholders (dollars in millions)(3) . . . . . . . . . . . . . . . . $ 2,655 $1,574
Earnings per basic common share:Income from continuing operations . . . . . . . . . . . . . . . . . . . . . . . . . . . . . . . . . . . . . . . . . $ 2.52 $ 1.57Gain/(loss) on discontinued operations . . . . . . . . . . . . . . . . . . . . . . . . . . . . . . . . . . . . . . . 0.11 (0.03)
Earnings per basic common share . . . . . . . . . . . . . . . . . . . . . . . . . . . . . . . . . . . . . . . $ 2.63 $ 1.54
Earnings per diluted common share:Income from continuing operations . . . . . . . . . . . . . . . . . . . . . . . . . . . . . . . . . . . . . . . . . $ 2.40 $ 1.51Gain/(loss) on discontinued operations . . . . . . . . . . . . . . . . . . . . . . . . . . . . . . . . . . . . . . . 0.11 (0.03)
Earnings per diluted common share . . . . . . . . . . . . . . . . . . . . . . . . . . . . . . . . . . . . . $ 2.51 $ 1.48
Statistical Data.
Book value per common share(4) . . . . . . . . . . . . . . . . . . . . . . . . . . . . . . . . . . . . . . . . . . . . . $ 34.71 $28.12Average common equity (dollars in billions)(5)(6):
Institutional Securities . . . . . . . . . . . . . . . . . . . . . . . . . . . . . . . . . . . . . . . . . . . . . . . . . . . . $ 20.3 $ 16.2Global Wealth Management Group . . . . . . . . . . . . . . . . . . . . . . . . . . . . . . . . . . . . . . . . . 1.7 3.3Asset Management . . . . . . . . . . . . . . . . . . . . . . . . . . . . . . . . . . . . . . . . . . . . . . . . . . . . . . 2.7 2.0
Total from securities businesses . . . . . . . . . . . . . . . . . . . . . . . . . . . . . . . . . . . . . . . . 24.7 21.5Discover . . . . . . . . . . . . . . . . . . . . . . . . . . . . . . . . . . . . . . . . . . . . . . . . . . . . . . . . . . . . . . 5.5 4.6
Total from operating segments . . . . . . . . . . . . . . . . . . . . . . . . . . . . . . . . . . . . . . . . . 30.2 26.1Discontinued operations . . . . . . . . . . . . . . . . . . . . . . . . . . . . . . . . . . . . . . . . . . . . . . . . . . 0.2 0.2Unallocated capital . . . . . . . . . . . . . . . . . . . . . . . . . . . . . . . . . . . . . . . . . . . . . . . . . . . . . . 5.1 3.2
Consolidated . . . . . . . . . . . . . . . . . . . . . . . . . . . . . . . . . . . . . . . . . . . . . . . . . . . . . . . $ 35.5 $ 29.5
44

Statistical Data—(Continued).
Three MonthsEnded February 28,
2007 2006(1)
Return on average common equity(5)(6):Consolidated . . . . . . . . . . . . . . . . . . . . . . . . . . . . . . . . . . . . . . . . . . . . . . . . . . . . . . . . . . 30% 21%Institutional Securities . . . . . . . . . . . . . . . . . . . . . . . . . . . . . . . . . . . . . . . . . . . . . . . . . . . 40% 29%Global Wealth Management Group . . . . . . . . . . . . . . . . . . . . . . . . . . . . . . . . . . . . . . . . 32% 1%Asset Management . . . . . . . . . . . . . . . . . . . . . . . . . . . . . . . . . . . . . . . . . . . . . . . . . . . . . 20% 21%Discover . . . . . . . . . . . . . . . . . . . . . . . . . . . . . . . . . . . . . . . . . . . . . . . . . . . . . . . . . . . . . 17% 26%
Effective income tax rate . . . . . . . . . . . . . . . . . . . . . . . . . . . . . . . . . . . . . . . . . . . . . . . . . . . 33.1% 32.8%
Worldwide employees . . . . . . . . . . . . . . . . . . . . . . . . . . . . . . . . . . . . . . . . . . . . . . . . . . . . . . 57,845 53,870
Consolidated assets under management or supervision byasset class (dollars in billions):
Equity . . . . . . . . . . . . . . . . . . . . . . . . . . . . . . . . . . . . . . . . . . . . . . . . . . . . . . . . . . . . . . . $ 317 $ 288Fixed income . . . . . . . . . . . . . . . . . . . . . . . . . . . . . . . . . . . . . . . . . . . . . . . . . . . . . . . . . . 111 105Money market . . . . . . . . . . . . . . . . . . . . . . . . . . . . . . . . . . . . . . . . . . . . . . . . . . . . . . . . . 90 82Alternative investments . . . . . . . . . . . . . . . . . . . . . . . . . . . . . . . . . . . . . . . . . . . . . . . . . . 29 18Real estate . . . . . . . . . . . . . . . . . . . . . . . . . . . . . . . . . . . . . . . . . . . . . . . . . . . . . . . . . . . . 76 45
Subtotal . . . . . . . . . . . . . . . . . . . . . . . . . . . . . . . . . . . . . . . . . . . . . . . . . . . . . . . . . . 623 538Unit trusts . . . . . . . . . . . . . . . . . . . . . . . . . . . . . . . . . . . . . . . . . . . . . . . . . . . . . . . . . . . . 15 12Other(7) . . . . . . . . . . . . . . . . . . . . . . . . . . . . . . . . . . . . . . . . . . . . . . . . . . . . . . . . . . . . . . 59 52
Total assets under management or supervision(8) . . . . . . . . . . . . . . . . . . . . . . . . . 697 602Share of minority interest assets(9) . . . . . . . . . . . . . . . . . . . . . . . . . . . . . . . . . . . . . 5 —
Total . . . . . . . . . . . . . . . . . . . . . . . . . . . . . . . . . . . . . . . . . . . . . . . . . . . . . . . . . . . . $ 702 $ 602
Institutional Securities:Mergers and acquisitions completed transactions (dollars in billions)(10):
Global market volume . . . . . . . . . . . . . . . . . . . . . . . . . . . . . . . . . . . . . . . . . . . . . . . . . . . $ 141.5 $ 107.8Market share . . . . . . . . . . . . . . . . . . . . . . . . . . . . . . . . . . . . . . . . . . . . . . . . . . . . . . . . . . 33.7% 26.1%Rank . . . . . . . . . . . . . . . . . . . . . . . . . . . . . . . . . . . . . . . . . . . . . . . . . . . . . . . . . . . . . . . . 2 3
Mergers and acquisitions announced transactions (dollars in billions)(10):Global market volume . . . . . . . . . . . . . . . . . . . . . . . . . . . . . . . . . . . . . . . . . . . . . . . . . . . $ 147.0 $ 139.2Market share . . . . . . . . . . . . . . . . . . . . . . . . . . . . . . . . . . . . . . . . . . . . . . . . . . . . . . . . . . 25.9% 29.4%Rank . . . . . . . . . . . . . . . . . . . . . . . . . . . . . . . . . . . . . . . . . . . . . . . . . . . . . . . . . . . . . . . . 6 9
Global equity and equity-related issues (dollars in billions)(10):Global market volume . . . . . . . . . . . . . . . . . . . . . . . . . . . . . . . . . . . . . . . . . . . . . . . . . . . $ 6.0 $ 4.8Market share . . . . . . . . . . . . . . . . . . . . . . . . . . . . . . . . . . . . . . . . . . . . . . . . . . . . . . . . . . 6.0% 6.0%Rank . . . . . . . . . . . . . . . . . . . . . . . . . . . . . . . . . . . . . . . . . . . . . . . . . . . . . . . . . . . . . . . . 8 5
Global debt issues (dollars in billions)(10):Global market volume . . . . . . . . . . . . . . . . . . . . . . . . . . . . . . . . . . . . . . . . . . . . . . . . . . . $ 66.4 $ 76.1Market share . . . . . . . . . . . . . . . . . . . . . . . . . . . . . . . . . . . . . . . . . . . . . . . . . . . . . . . . . . 5.6% 6.7%Rank . . . . . . . . . . . . . . . . . . . . . . . . . . . . . . . . . . . . . . . . . . . . . . . . . . . . . . . . . . . . . . . . 6 3
Global initial public offerings (dollars in billions)(10):Global market volume . . . . . . . . . . . . . . . . . . . . . . . . . . . . . . . . . . . . . . . . . . . . . . . . . . . $ 1.7 $ 1.5Market share . . . . . . . . . . . . . . . . . . . . . . . . . . . . . . . . . . . . . . . . . . . . . . . . . . . . . . . . . . 7.2% 6.5%Rank . . . . . . . . . . . . . . . . . . . . . . . . . . . . . . . . . . . . . . . . . . . . . . . . . . . . . . . . . . . . . . . . 5 4
Pre-tax profit margin(11) . . . . . . . . . . . . . . . . . . . . . . . . . . . . . . . . . . . . . . . . . . . . . . . . . . . . 40% 32%
45

Statistical Data—(Continued).
Three MonthsEnded February 28,
2007 2006(1)
Global Wealth Management Group:Global representatives . . . . . . . . . . . . . . . . . . . . . . . . . . . . . . . . . . . . . . . . . . . . . . . . . . . . . . . 7,993 8,913Annualized net revenue per global representative (dollars in thousands)(12) . . . . . . . . . . . . $ 748 $ 552Client assets by segment (dollars in billions)(12):
$10 million or more . . . . . . . . . . . . . . . . . . . . . . . . . . . . . . . . . . . . . . . . . . . . . . . . . . . . . $ 210 $ 166$1 million – $10 million . . . . . . . . . . . . . . . . . . . . . . . . . . . . . . . . . . . . . . . . . . . . . . . . . 248 220
Subtotal $1 million or more . . . . . . . . . . . . . . . . . . . . . . . . . . . . . . . . . . . . . . . . . . . . . . . . . . 458 386$100,000 – $1 million . . . . . . . . . . . . . . . . . . . . . . . . . . . . . . . . . . . . . . . . . . . . . . . . . . . 174 177Less than $100,000 . . . . . . . . . . . . . . . . . . . . . . . . . . . . . . . . . . . . . . . . . . . . . . . . . . . . . 26 32
Client assets excluding corporate and other accounts . . . . . . . . . . . . . . . . . . . . . . . . . . . 658 595Corporate and other accounts . . . . . . . . . . . . . . . . . . . . . . . . . . . . . . . . . . . . . . . . . . . . . 32 29
Total client assets . . . . . . . . . . . . . . . . . . . . . . . . . . . . . . . . . . . . . . . . . . . . . . . . . . $ 690 $ 624
Fee-based assets as a percentage of total client assets . . . . . . . . . . . . . . . . . . . . . . . . . . . . . . 29% 28%Client assets per global representative (dollars in millions)(13) . . . . . . . . . . . . . . . . . . . . . . . $ 86 $ 70Bank deposit program (dollars in millions)(14) . . . . . . . . . . . . . . . . . . . . . . . . . . . . . . . . . . . $16,364 $ 7,319Pre-tax profit margin(11) . . . . . . . . . . . . . . . . . . . . . . . . . . . . . . . . . . . . . . . . . . . . . . . . . . . . 15% 1%
Asset Management:Assets under management or supervision (dollars in billions)(15) . . . . . . . . . . . . . . . . . . . . . $ 500 $ 442Percent of fund assets in top half of Lipper rankings(16) . . . . . . . . . . . . . . . . . . . . . . . . . . . . 48% 60%Pre-tax profit margin(11) . . . . . . . . . . . . . . . . . . . . . . . . . . . . . . . . . . . . . . . . . . . . . . . . . . . . 26% 24%
Discover (dollars in millions, unless otherwise noted)(17):Period-end credit card loans—Owned . . . . . . . . . . . . . . . . . . . . . . . . . . . . . . . . . . . . . . . . . . $22,410 $19,924Period-end credit card loans—Managed . . . . . . . . . . . . . . . . . . . . . . . . . . . . . . . . . . . . . . . . . $50,730 $47,825Average credit card loans—Owned . . . . . . . . . . . . . . . . . . . . . . . . . . . . . . . . . . . . . . . . . . . . $24,672 $21,976Average credit card loans—Managed . . . . . . . . . . . . . . . . . . . . . . . . . . . . . . . . . . . . . . . . . . . $51,390 $47,575Net principal charge-off rate—Owned . . . . . . . . . . . . . . . . . . . . . . . . . . . . . . . . . . . . . . . . . . 3.78% 4.54%Net principal charge-off rate—Managed . . . . . . . . . . . . . . . . . . . . . . . . . . . . . . . . . . . . . . . . 4.05% 5.06%Return on average receivables—Owned . . . . . . . . . . . . . . . . . . . . . . . . . . . . . . . . . . . . . . . . . 3.84% 5.54%Return on average receivables—Managed . . . . . . . . . . . . . . . . . . . . . . . . . . . . . . . . . . . . . . . 1.84% 2.56%Transaction volume (dollars in billions):
Net sales . . . . . . . . . . . . . . . . . . . . . . . . . . . . . . . . . . . . . . . . . . . . . . . . . . . . . . . . . $ 25.1 $ 22.5Other transaction volume . . . . . . . . . . . . . . . . . . . . . . . . . . . . . . . . . . . . . . . . . . . . 5.2 4.3
Total . . . . . . . . . . . . . . . . . . . . . . . . . . . . . . . . . . . . . . . . . . . . . . . . . . . . . . . . . . . . $ 30.3 $ 26.8
Payment services transaction volume (millions of transactions):Discover network . . . . . . . . . . . . . . . . . . . . . . . . . . . . . . . . . . . . . . . . . . . . . . . . . . 361 339PULSE network . . . . . . . . . . . . . . . . . . . . . . . . . . . . . . . . . . . . . . . . . . . . . . . . . . . . 521 425
Total network transaction volume . . . . . . . . . . . . . . . . . . . . . . . . . . . . . . . . . . . . . . 882 764
Pre-tax profit margin(11) . . . . . . . . . . . . . . . . . . . . . . . . . . . . . . . . . . . . . . . . . . . . . . . . . . . . 36% 44%
(1) Certain prior-period information has been reclassified to conform to the current period’s presentation.(2) Amounts represent income from continuing operations before losses from unconsolidated investees, income taxes and gain (loss) from
discontinued operations.(3) Earnings applicable to common shareholders are used to calculate earnings per share information.(4) Book value per common share equals common shareholders’ equity of $36,854 million at February 28, 2007 and $30,103 million at
February 28, 2006, divided by common shares outstanding of 1,062 million at February 28, 2007 and 1,070 million at February 28, 2006.(5) The computation of average common equity for each business segment is based upon an economic capital model that the Company uses
to determine the amount of equity capital needed to support the risk of its business activities and to ensure that the Company remainsadequately capitalized. Economic capital is defined as the amount of capital needed to run the business through the business cycle and
46

satisfy the requirements of regulators, rating agencies and the market. The Company’s methodology is based on an approach that assignseconomic capital to each segment based on regulatory capital usage plus additional capital for stress losses, goodwill and intangibleassets, and principal investment risk. The economic capital model and allocation methodology may be enhanced over time in response tochanges in the business and regulatory environment. The effective tax rates used in the computation of segment return on averagecommon equity were determined on a separate entity basis.
(6) For the quarter ended February 28, 2007, the Company reassessed the amount of capital required to support the market risks and creditrisks in its Global Wealth Management Group business segment.
(7) Amounts include assets under management or supervision associated with the Global Wealth Management Group business segment.(8) Revenues and expenses associated with these assets are included in the Company’s Asset Management, Global Wealth Management
Group and Institutional Securities business segments.(9) Amount represents Asset Management’s proportional share of assets managed by entities in which it owns a minority interest.(10) Source: Thomson Financial, data as of March 7, 2007—The data for the three months ended February 28, 2007 and 2006 are for the
periods from January 1 to February 28, 2007 and January 1 to February 28, 2006, respectively, as Thomson Financial presents these dataon a calendar-year basis.
(11) Percentages represent income from continuing operations before losses from unconsolidated investees and income taxes as a percentageof net revenues.
(12) Annualized net revenue per global representative amounts equal Global Wealth Management Group’s net revenues divided by thequarterly average global representative headcount for the periods presented.
(13) Client assets per global representative equal total period-end client assets divided by period-end global representative headcount.(14) Bank deposits are held at certain of the Company’s Federal Deposit Insurance Corporation insured depository institutions for the benefit
of retail clients through their brokerage accounts.(15) Amount includes Asset Management’s proportional share of assets managed by entities in which it owns a minority interest.(16) Source: Lipper, one-year performance excluding money market funds as of February 28, 2007 and 2006, respectively.(17) The Company analyzes its financial performance on both a managed loan basis and as reported under U.S. Generally Accepted
Accounting Principles. Managed data include owned and securitized credit card loans. For an explanation of managed data and areconciliation of credit card loan and asset quality data, see “Discover—Managed General Purpose Credit Card Loan Data” herein.
First Quarter 2007 Performance.
Company Results. The Company achieved record net income of $2,672 million and record quarterly dilutedearnings per share of $2.51 for the quarter ended February 28, 2007, both increases of 70% from the comparablefiscal 2006 period. Net revenues (total revenues less interest expense and the provision for loan losses) increased29% to a record $10,998 million and the annualized return on average common equity was 29.9% compared with21.3% in the first quarter of last year. Income from continuing operations was $2,559 million, an increase of 60%from a year ago. Diluted earnings per share from continuing operations were a record $2.40 compared with $1.51in last year’s first quarter. The annualized return on average common equity from continuing operations was28.8% compared with 21.9% in the first quarter of last year.
Non-interest expenses of $7,134 million increased 17% from the prior year period, primarily due to highercompensation costs resulting from higher net revenues, partially offset by the incremental compensation expense($395 million) related to equity awards to retirement-eligible employees in the first quarter of fiscal 2006 (see“Other Items—Stock-Based Compensation” herein).
The Company’s effective income tax rate was 33.1% for the first quarter of fiscal 2007 and 32.8% for the firstquarter of fiscal 2006.
The current quarter’s results included a gain of $168 million ($109 million after-tax) in discontinued operationsrelated to the sale of Quilter on February 28, 2007. Discontinued operations in the first quarter of fiscal 2006included a loss of $125 million ($75 million after-tax) related to the sale of the Company’s aircraft leasingbusiness (see “Other Items—Discontinued Operations” herein).
Institutional Securities. Institutional Securities achieved record income from continuing operations beforelosses from unconsolidated investees and income taxes of $3,031 million, a 71% increase from last year’s firstquarter. Net revenues rose 37% to a record $7,631 million driven by record fixed income and equity sales andtrading revenues, along with higher investment banking revenues. Non-interest expenses increased 22% to$4,600 million, reflecting higher compensation accruals resulting from higher net revenues, as well as highercompensation costs associated with certain employee deferred compensation plans (see “Other Items—DeferredCompensation Plans” herein), partially offset by Institutional Securities’ share ($270 million) of the incrementalcompensation expense related to equity awards to retirement-eligible employees in the first quarter of fiscal2006. Non-compensation expenses increased as a result of higher levels of business activity.
47

Investment banking revenues increased 16% from last year’s first quarter to $1,049 million. Underwritingrevenues rose 20% from last year’s first quarter to $659 million. Advisory fees from merger, acquisition andrestructuring transactions were $390 million, an increase of 10% from last year’s first quarter.
Fixed income sales and trading revenues were a record $3,566 million, up 31% from the previous record in thefirst quarter of fiscal 2006. The increase was driven by strong performances in credit products and interest rateand currency products. Credit products had record revenues, primarily due to favorable positioning in theresidential mortgage markets, improved corporate credit trading and strong customer flows. Interest rate andcurrency product revenues benefited from improved interest rate trading and emerging market revenues.Commodities revenues decreased from last year’s record first quarter, reflecting lower trading results inelectricity, natural gas products and oil liquids. Equity sales and trading revenues increased 36% to a record$2,243 million. The increase was broad based and included higher revenues from derivatives products, primebrokerage, financing products, principal trading strategies and equity cash products.
Principal transaction net investment revenues were $801 million in the quarter compared with $312 million ayear ago. The increase was primarily related to net gains associated with certain of the Company’s investments,including both realized and unrealized gains from investments in the Company’s real estate funds. The currentquarter also included higher revenues related to certain employee deferred compensation plans (see “OtherItems—Deferred Compensation Plans” herein).
Global Wealth Management Group. The Global Wealth Management Group recorded income from continuingoperations before income taxes of $220 million compared with $15 million in the first quarter of fiscal 2006. Netrevenues increased 18% from last year’s first quarter to $1,490 million reflecting higher transactional revenuesdue to increased underwriting activity, higher asset management revenues reflecting growth in fee-basedproducts and higher net interest revenue from the bank deposit sweep program. Total non-interest expensesincreased 2% from a year ago to $1,270 million. Compensation and benefits expense increased, primarilyreflecting higher incentive-based compensation accruals related to higher net revenues, partially offset by GlobalWealth Management Group’s share ($80 million) of the incremental compensation expense related to equityawards to retirement-eligible employees in the first quarter of fiscal 2006. Non-compensation costs decreased,primarily due to lower costs associated with legal and regulatory matters. Total client assets increased to $690billion, up 11% from last year’s first quarter. In addition, client assets in fee-based accounts rose 17% to a record$202 billion at February 28, 2007 and increased to 29% as a percentage of total client assets from 28% a yearago. At quarter-end, the number of global representatives was 7,993, a decline of 920 from a year ago, resultinglargely from planned sales force reductions completed in the second quarter of fiscal 2006 and attrition.
Asset Management. Asset Management recorded income before income taxes of $236 million, a 37% increasefrom last year’s first quarter. Net revenues increased 28% from last year’s first quarter to $905 million driven byhigher investment revenues, primarily in the private equity business, and higher asset management, distributionand administration fees, primarily due to an increase in assets under management and higher performance feesfrom the alternatives business. Non-interest expenses increased 26% to $669 million, largely due to higherincentive-based compensation accruals associated with increased revenues and business investment, partiallyoffset by Asset Management’s share ($28 million) of the incremental compensation expense related to equityawards to retirement-eligible employees in the first quarter of fiscal 2006. Assets under management orsupervision within Asset Management of $500 billion were up $58 billion, or 13%, from the first quarter of lastyear, primarily due to market appreciation, acquisitions and investments in minority stakes. In fiscal 2007, theCompany expects that Asset Management’s profit margins will be affected by its continued investments in itscore business, alternative products and private equity.
Discover. Discover recorded income before losses from unconsolidated investees and income taxes of $372million, a decrease of 22% from the first quarter of fiscal 2006. The first quarter of fiscal 2006 benefited from theeffect of a sharp decline in consumer bankruptcy receipts following the October 2005 enactment of new U.S.bankruptcy legislation, resulting in an increase in the value of the Company’s residual interests in securitizationtransactions and a decrease in the allowance for consumer loan losses. Net revenues of $1,025 million were
48

6% lower than a year ago, primarily due to lower Servicing and securitization income and a higher Provision forconsumer loan losses, partially offset by higher net interest revenues. Non-interest expenses of $653 millionincreased 7% from a year ago, primarily due to higher marketing and business development expenses, higherprofessional services expenses and incremental costs as a result of the acquisition of Goldfish in February 2006.The managed credit card net principal charge-off rate decreased 101 basis points to 4.05% from the same perioda year ago. The managed over-30-day delinquency rate was unchanged at 3.45% from a year ago, and themanaged over-90-day delinquency rate was 8 basis points higher than a year ago at 1.69%. Managed credit cardloans were $50,730 million at quarter-end, a 6% increase from a year ago.
Global Market and Economic Conditions in the Quarter Ended February 28, 2007.
In the U.S., the moderate pace of economic growth that occurred during the second half of fiscal 2006 continuedduring the first quarter of fiscal 2007, reflecting, among other things, generally lower energy prices, although theslowdown in the residential real estate market persisted. The U.S. unemployment rate increased slightly to 4.6%at the end of the quarter from 4.5% at the end of fiscal 2006. Conditions in the U.S. equity markets weregenerally favorable, and major equity market indices rose during most of the quarter and were supported bystrong corporate earnings. Equity markets declined sharply at quarter-end, however, due to concerns about theresidential real estate market and conditions in China’s equity markets. The Federal Reserve Board (the“Fed”) left interest rates unchanged during the quarter and has not raised interest rates since June 2006.Inflationary pressures appeared to be contained, although it continued to be a primary concern of the Fed.
In Europe, economic growth during the first quarter of fiscal 2007 continued to be strong. Major equity marketindices in Europe increased during much of the quarter, reflecting strong corporate earnings as well as mergerand acquisition activity and generally favorable economic conditions. The European Central Bank (the “ECB”)raised the benchmark interest rate by 0.25% during the quarter. In March 2007, the ECB raised the benchmarkinterest rate by an additional 0.25%. The Bank of England raised the benchmark interest rate by 0.25% during thequarter.
In Japan, moderate economic growth continued to be driven by exports and domestic demand. The level ofunemployment also remained relatively low, and Japanese equity market indices increased during the quarter.The Bank of Japan raised the benchmark interest rate from 0.25% to 0.50% during the quarter. Economieselsewhere in Asia also expanded, particularly in China, which benefited from strength in exports, domesticdemand and continued globalization. Although equity market indices in China rose sharply during much of thequarter, they declined at quarter-end. In March 2007, the People’s Bank of China raised the benchmark interestrate by 0.27%.
Business Segments.
The remainder of “Results of Operations” is presented on a business segment basis before discontinuedoperations. Substantially all of the operating revenues and operating expenses of the Company can be directlyattributed to its business segments. Certain revenues and expenses have been allocated to each business segment,generally in proportion to its respective revenues or other relevant measures.
As a result of treating certain intersegment transactions as transactions with external parties, the Companyincludes an Intersegment Eliminations category to reconcile the segment results to the Company’s consolidatedresults. Income before taxes in Intersegment Eliminations represents the effect of timing differences associatedwith the revenue and expense recognition of commissions paid by Asset Management to the Global WealthManagement Group associated with sales of certain products and the related compensation costs paid to theGlobal Wealth Management Group’s global representatives. Income before taxes recorded in IntersegmentEliminations was $5 million in the quarter ended February 28, 2007 and $19 million in the quarter endedFebruary 28, 2006.
Certain reclassifications have been made to prior-period amounts to conform to the current period’s presentation,including the reporting of Quilter within discontinued operations for all periods presented.
49

INSTITUTIONAL SECURITIES
INCOME STATEMENT INFORMATION
Three MonthsEnded February 28,
2007 2006
(dollars in millions)
Revenues:Investment banking . . . . . . . . . . . . . . . . . . . . . . . . . . . . . . . . . . . . . . . . . . . . . . . . . . . . . . $ 1,049 $ 903Principal transactions:
Trading . . . . . . . . . . . . . . . . . . . . . . . . . . . . . . . . . . . . . . . . . . . . . . . . . . . . . . . . . . . 4,029 2,963Investments . . . . . . . . . . . . . . . . . . . . . . . . . . . . . . . . . . . . . . . . . . . . . . . . . . . . . . . . 801 312
Commissions . . . . . . . . . . . . . . . . . . . . . . . . . . . . . . . . . . . . . . . . . . . . . . . . . . . . . . . . . . . 691 610Asset management, distribution and administration fees . . . . . . . . . . . . . . . . . . . . . . . . . 88 43Servicing and securitization income . . . . . . . . . . . . . . . . . . . . . . . . . . . . . . . . . . . . . . . . . 35 —Interest and dividends . . . . . . . . . . . . . . . . . . . . . . . . . . . . . . . . . . . . . . . . . . . . . . . . . . . . 13,961 9,789Other . . . . . . . . . . . . . . . . . . . . . . . . . . . . . . . . . . . . . . . . . . . . . . . . . . . . . . . . . . . . . . . . . 145 96
Total revenues . . . . . . . . . . . . . . . . . . . . . . . . . . . . . . . . . . . . . . . . . . . . . . . . . . . . . . 20,799 14,716Interest expense . . . . . . . . . . . . . . . . . . . . . . . . . . . . . . . . . . . . . . . . . . . . . . . . . . . . . . . . . . . . . 13,168 9,165
Net revenues . . . . . . . . . . . . . . . . . . . . . . . . . . . . . . . . . . . . . . . . . . . . . . . . . . . . . . . 7,631 5,551
Total non-interest expenses . . . . . . . . . . . . . . . . . . . . . . . . . . . . . . . . . . . . . . . . . . . . . . . . . . . . 4,600 3,776
Income from continuing operations before losses from unconsolidated investees and incometaxes . . . . . . . . . . . . . . . . . . . . . . . . . . . . . . . . . . . . . . . . . . . . . . . . . . . . . . . . . . . . . . . . . . . . 3,031 1,775
Losses from unconsolidated investees . . . . . . . . . . . . . . . . . . . . . . . . . . . . . . . . . . . . . . . . . . . 43 68Provision for income taxes . . . . . . . . . . . . . . . . . . . . . . . . . . . . . . . . . . . . . . . . . . . . . . . . . . . . 942 531
Income from continuing operations . . . . . . . . . . . . . . . . . . . . . . . . . . . . . . . . . . . . . $ 2,046 $ 1,176
Investment Banking. Investment banking revenues for the quarter ended February 28, 2007 increased 16%from the comparable period of fiscal 2006. The increase was primarily due to higher revenues from equityunderwriting transactions and merger, acquisition and restructuring activities. Advisory fees from merger,acquisition and restructuring transactions were $390 million, an increase of 10% from the comparable period offiscal 2006. Underwriting revenues were $659 million, an increase of 20% from the comparable period of fiscal2006. Equity underwriting revenues increased 52% to $300 million, reflecting an increase in industry-widetransaction activity. Fixed income underwriting revenues increased 2% to $359 million.
At February 28, 2007, the backlog of merger, acquisition and restructuring transactions and equity and fixedincome underwriting transactions was higher as compared with the first quarter of fiscal 2006. The backlog ofmerger, acquisition and restructuring transactions and equity and fixed income underwriting transactions issubject to the risk that transactions may not be completed due to unforeseen economic and market conditions,adverse developments regarding one of the parties to the transaction, a failure to obtain required regulatoryapproval or a decision on the part of the parties involved not to pursue a transaction.
Sales and Trading. Sales and trading revenues are composed of principal transaction trading revenues,commissions and net interest revenues (expenses). In assessing the profitability of its sales and trading activities,the Company views principal trading, commissions and net interest revenues in the aggregate. In addition,decisions relating to principal transactions are based on an overall review of aggregate revenues and costsassociated with each transaction or series of transactions. This review includes, among other things, anassessment of the potential gain or loss associated with a transaction, including any associated commissions,dividends, the interest income or expense associated with financing or hedging the Company’s positions andother related expenses.
50

Total sales and trading revenues increased 31% from the comparable period of fiscal 2006, reflecting recordfixed income and equity sales and trading revenues.
Sales and trading revenues include the following:
Three MonthsEnded February 28,
2007(1) 2006(1)
(dollars in millions)
Equity . . . . . . . . . . . . . . . . . . . . . . . . . . . . . . . . . . . . . . . . . . . . . . . . . . . . . . . . . . . . . . . . . . . . . $2,243 $1,654Fixed income(2) . . . . . . . . . . . . . . . . . . . . . . . . . . . . . . . . . . . . . . . . . . . . . . . . . . . . . . . . . . . . . 3,566 2,724
(1) Amounts exclude sales and trading revenues of $(296) million and $(181) million for the three months ended February 28, 2007 and2006, respectively, which relate to unallocated net revenues, net revenues associated with corporate lending activities and certain otheradjustments.
(2) Amounts include interest rate and currency products, credit products and commodities. Amounts exclude corporate lending activities.
Equity sales and trading revenues increased 36% to a record $2,243 million in the first quarter of fiscal 2007. Theincrease was broad based and included higher revenues from derivatives products, prime brokerage, financingproducts, principal trading strategies and equity cash products. Derivative revenues increased due to strongcustomer flows, new transaction activity and principal risk taking. Revenues from financing and equity cashproducts also benefited from increased client activity. Prime brokerage generated record revenues reflectingcontinued growth in global client asset balances. Global equity markets trended higher during much of thequarter and created favorable opportunities for principal trading strategies. Although commission revenuesincreased, revenues continued to be affected by intense competition, particularly in the U.S., and a continuedshift toward electronic trading.
Fixed income sales and trading revenues increased 31% to a record $3,566 million driven by strong performancesin credit products and interest rate and currency products. Credit product revenues increased 94%, primarily dueto higher revenues from securitized products. Trading revenues benefited from favorable positioning in theresidential mortgage markets, improved corporate credit trading and strong customer flows. Interest rate andcurrency product revenues increased 17% benefiting from improved interest rate trading and emerging marketrevenues. Commodities decreased 26% from last year’s record first quarter, reflecting lower trading results inelectricity, natural gas products and oil liquids.
In addition to the equity and fixed income sales and trading revenues discussed above, sales and trading revenuesinclude the net revenues from the Company’s corporate lending activities. In the quarter ended February 28,2007, revenues from corporate lending activities decreased by approximately $10 million from the first quarter offiscal 2006, reflecting the impact of mark-to-market valuations on a higher level of new loans made in thequarter, partially offset by higher revenues from principal trading strategies.
Principal Transactions-Investments. Principal transaction net investment revenues aggregating $801 millionwere recognized in the quarter ended February 28, 2007 as compared with $312 million in the quarter endedFebruary 28, 2006. The increase was primarily related to net gains associated with certain of the Company’sinvestments, including both realized and unrealized gains from investments in the Company’s real estate funds,Grifols S.A. and IntercontinentalExchange. The current quarter also included revenues of $237 million related tocertain employee deferred compensation plans (see “Other Items—Deferred Compensation Plans” herein).Principal transaction net investment revenues for the first quarter of fiscal 2006 included $130 million from theCompany’s investment in IntercontinentalExchange.
Asset Management, Distribution and Administration Fees. Asset management, distribution and administrationfees increased $45 million from the comparable period of fiscal 2006, reflecting higher fees associated withcertain real estate fund investments.
51
Servicing and Securitization Income. Servicing and securitization income of $35 million recognized in thefirst quarter of fiscal 2007 was primarily attributable to Saxon Capital, Inc. (“Saxon”), which the Companyacquired on December 4, 2006.
Other. Other revenues increased 51%. The increase was primarily attributable to revenues related to theoperation of pipelines, terminals and barges and the distribution of refined petroleum products associated withTransMontaigne Inc. (“TransMontaigne”), which the Company acquired on September 1, 2006, and higher salesof benchmark indices and risk management analytic products.
Non-Interest Expenses. Non-interest expenses increased 22%. Compensation and benefits expense increased21% primarily reflecting higher incentive-based compensation costs resulting from higher net revenues as well ashigher compensation costs associated with certain employee deferred compensation plans (see “Other Items—Deferred Compensation Plans” herein). The increase was partially offset by Institutional Securities’ share ($270million) of the incremental compensation expense related to equity awards to retirement-eligible employees inthe first quarter of fiscal 2006 (see “Other Items—Stock-Based Compensation” herein). Excluding compensationand benefits expense, non-interest expenses increased 25%. Occupancy and equipment expense increased 35%,primarily due to higher rent and occupancy costs, including additional costs associated with TransMontaigne, theHeidmar Group of companies (“Heidmar”), and a new office building in New York City. The Company acquiredTransMontaigne and Heidmar in September 2006 and the office building in June 2006. Brokerage, clearing andexchange fees increased 29%, primarily reflecting increased equity and fixed income trading activity. Marketingand business development expense increased 32%, primarily due to a higher level of business activity.Professional services expense increased 20%, primarily due to higher consulting and legal costs. Other expensesincreased 34%, reflecting costs associated with TransMontaigne and Heidmar.
52

GLOBAL WEALTH MANAGEMENT GROUP
INCOME STATEMENT INFORMATION
Three MonthsEnded February 28,
2007 2006
(dollars in millions)
Revenues:Investment banking . . . . . . . . . . . . . . . . . . . . . . . . . . . . . . . . . . . . . . . . . . . . . . . . . . . . . . . . $ 166 $ 67Principal transactions:
Trading . . . . . . . . . . . . . . . . . . . . . . . . . . . . . . . . . . . . . . . . . . . . . . . . . . . . . . . . . . . . . 129 125Investments . . . . . . . . . . . . . . . . . . . . . . . . . . . . . . . . . . . . . . . . . . . . . . . . . . . . . . . . . . (2) 1
Commissions . . . . . . . . . . . . . . . . . . . . . . . . . . . . . . . . . . . . . . . . . . . . . . . . . . . . . . . . . . . . . 315 310Asset management, distribution and administration fees . . . . . . . . . . . . . . . . . . . . . . . . . . . 702 638Interest and dividends . . . . . . . . . . . . . . . . . . . . . . . . . . . . . . . . . . . . . . . . . . . . . . . . . . . . . . 274 203Other . . . . . . . . . . . . . . . . . . . . . . . . . . . . . . . . . . . . . . . . . . . . . . . . . . . . . . . . . . . . . . . . . . . 44 37
Total revenues . . . . . . . . . . . . . . . . . . . . . . . . . . . . . . . . . . . . . . . . . . . . . . . . . . . . . . . . 1,628 1,381Interest expense . . . . . . . . . . . . . . . . . . . . . . . . . . . . . . . . . . . . . . . . . . . . . . . . . . . . . . . . . . . . . . . 138 115
Net revenues . . . . . . . . . . . . . . . . . . . . . . . . . . . . . . . . . . . . . . . . . . . . . . . . . . . . . . . . . 1,490 1,266
Total non-interest expenses . . . . . . . . . . . . . . . . . . . . . . . . . . . . . . . . . . . . . . . . . . . . . . . . . . . . . 1,270 1,251
Income from continuing operations before income taxes . . . . . . . . . . . . . . . . . . . . . . . 220 15Provision for income taxes . . . . . . . . . . . . . . . . . . . . . . . . . . . . . . . . . . . . . . . . . . . . . . . . . . . . . . 83 6
Income from continuing operations . . . . . . . . . . . . . . . . . . . . . . . . . . . . . . . . . . . . . . . $ 137 $ 9
Investment Banking. Investment banking revenues increased 148%, driven by robust equity underwritingresults primarily related to a closed end fund offering in the quarter. The increase also reflected strong resultsfrom fixed income underwriting and unit trusts.
Principal Transactions—Trading. Principal transaction trading revenues increased 3%, as higher revenuesfrom corporate fixed income securities, foreign exchange products and equity linked notes were partially offsetby lower revenues from government and municipal fixed income securities.
Principal Transactions—Investments. Principal transaction net investment losses aggregating $2 million wererecognized in the quarter ended February 28, 2007 as compared with net gains aggregating $1 million in thecomparable period. The results in both periods were primarily related to investments in exchanges.
Commissions. Commission revenues increased 2% as compared with the prior-year period reflecting improvedmarket conditions. Commission revenues were limited by growth in other product areas, such as underwrittenproducts, which are included within investment banking revenues.
Asset Management, Distribution and Administration Fees. Asset management, distribution and administrationfees increased 10%, primarily reflecting higher client assets in fee-based accounts.
Client assets in fee-based accounts rose 17% to $202 billion at February 28, 2007 and increased as a percentageof total client assets to 29% of total client assets from 28% in the prior-year period. Client asset balancesincreased to $690 billion at February 28, 2007 from $624 billion at February 28, 2006, primarily due to marketappreciation. Client asset balances in accounts greater than $1 million increased to $458 billion at February 28,2007 from $386 billion at February 28, 2006.
53

Net Interest. Net interest revenues increased 55%, primarily related to increased account balances in the bankdeposit program. Balances in the bank deposit program rose to $16,364 million at February 28, 2007 ascompared with $7,319 million at February 28, 2006.
Non-Interest Expenses. Non-interest expenses increased 2%. Compensation and benefits expense increased7%, primarily reflecting higher incentive-based compensation accruals related to higher net revenues, partiallyoffset by Global Wealth Management Group’s share ($80 million) of the incremental compensation expenserelated to equity awards to retirement-eligible employees in the first quarter of fiscal 2006 (see “Other Items—Stock-Based Compensation” herein). Excluding compensation and benefits expense, non-interest expensesdecreased 9%. Occupancy and equipment expense increased 9%, primarily due to higher rental charges.Professional services expense decreased 6%, largely due to lower costs for outside legal counsel and consultingfees, partially offset by higher sub-advisory fees associated with growth in fee-based assets. Marketing andbusiness development expense increased 27%, primarily due to higher costs associated with a new advertisingcampaign that was launched in the first quarter of fiscal 2007. Other expenses decreased 37%, primarily resultingfrom lower costs associated with legal and regulatory matters, which declined by approximately $40 million.
54

ASSET MANAGEMENT
INCOME STATEMENT INFORMATION
Three MonthsEnded February 28,
2007 2006
(dollars in millions)Revenues:
Investment banking . . . . . . . . . . . . . . . . . . . . . . . . . . . . . . . . . . . . . . . . . . . . . . . . . . . . . $ 14 $ 12Principal transactions:
Investments . . . . . . . . . . . . . . . . . . . . . . . . . . . . . . . . . . . . . . . . . . . . . . . . . . . . . . . 121 36Commissions . . . . . . . . . . . . . . . . . . . . . . . . . . . . . . . . . . . . . . . . . . . . . . . . . . . . . . . . . . 6 7Asset management, distribution and administration fees . . . . . . . . . . . . . . . . . . . . . . . . 732 640Interest and dividends . . . . . . . . . . . . . . . . . . . . . . . . . . . . . . . . . . . . . . . . . . . . . . . . . . . 13 5Other . . . . . . . . . . . . . . . . . . . . . . . . . . . . . . . . . . . . . . . . . . . . . . . . . . . . . . . . . . . . . . . . 34 7
Total revenues . . . . . . . . . . . . . . . . . . . . . . . . . . . . . . . . . . . . . . . . . . . . . . . . . . . . . 920 707Interest expense . . . . . . . . . . . . . . . . . . . . . . . . . . . . . . . . . . . . . . . . . . . . . . . . . . . . . . . . . . . . 15 2
Net revenues . . . . . . . . . . . . . . . . . . . . . . . . . . . . . . . . . . . . . . . . . . . . . . . . . . . . . . 905 705
Total non-interest expenses . . . . . . . . . . . . . . . . . . . . . . . . . . . . . . . . . . . . . . . . . . . . . . . . . . . 669 533
Income before income taxes . . . . . . . . . . . . . . . . . . . . . . . . . . . . . . . . . . . . . . . . . . 236 172Provision for income taxes . . . . . . . . . . . . . . . . . . . . . . . . . . . . . . . . . . . . . . . . . . . . . . . . . . . 96 67
Net income . . . . . . . . . . . . . . . . . . . . . . . . . . . . . . . . . . . . . . . . . . . . . . . . . . . . . . . . $140 $105
Investment Banking. Investment banking revenues increased 17%, primarily reflecting a higher volume ofequity unit trust sales.
Principal Transactions-Investments. Principal transaction net investment gains aggregating $121 million wererecognized in the first quarter of fiscal 2007 as compared with $36 million in the prior-year period. The increasewas primarily related to higher net gains on certain investments in the Company’s private equity portfolio andinvestments in the Company’s alternatives products.
55

Asset Management, Distribution and Administration Fees. Asset management, distribution and administrationfees increased 14%, primarily due to higher fund management and administration fees associated with a 12%increase in average assets under management and higher performance fees from the alternatives business,including those associated with the acquisition of FrontPoint Partners (“FrontPoint”) (see “Other Items—Business and Other Acquisitions” herein).
Asset Management’s period-end and average customer assets under management or supervision were as follows:
At February 28,
Average for the ThreeMonths EndedFebruary 28,
2007 2006(1) 2007 2006(1)
(dollars in billions)
Assets under management or supervision by distribution channel:Americas Retail Morgan Stanley brand . . . . . . . . . . . . . . . . . . . . . . . . . $ 61 $ 64 $ 61 $ 66Americas Retail Van Kampen brand . . . . . . . . . . . . . . . . . . . . . . . . . . . 96 90 96 90Americas Intermediary(2) . . . . . . . . . . . . . . . . . . . . . . . . . . . . . . . . . . . . 61 47 60 46U.S. Institutional . . . . . . . . . . . . . . . . . . . . . . . . . . . . . . . . . . . . . . . . . . . 95 88 94 88Non-U.S. . . . . . . . . . . . . . . . . . . . . . . . . . . . . . . . . . . . . . . . . . . . . . . . . . 97 75 92 71
Total long-term assets under management or supervision . . . . . . . 410 364 403 361
Institutional money markets/liquidity . . . . . . . . . . . . . . . . . . . . . . . . . . . 52 37 51 35Retail money markets . . . . . . . . . . . . . . . . . . . . . . . . . . . . . . . . . . . . . . . 33 41 34 43
Total money markets . . . . . . . . . . . . . . . . . . . . . . . . . . . . . . . . . . . 85 78 85 78
Total assets under management or supervision . . . . . . . . . . . . . . . 495 442 488 439Share of minority interest assets(3) . . . . . . . . . . . . . . . . . . . . . . . . 5 — 5 —
Total . . . . . . . . . . . . . . . . . . . . . . . . . . . . . . . . . . . . . . . . . . . . . . . . $500 $442 $493 $439
At February 28,
Average for the ThreeMonths EndedFebruary 28,
2007 2006(1) 2007 2006(1)
(dollars in billions)
Assets under management or supervision by asset class:Equity . . . . . . . . . . . . . . . . . . . . . . . . . . . . . . . . . . . . . . . . . . . . . . . . . . . $245 $230 $244 $226Fixed income . . . . . . . . . . . . . . . . . . . . . . . . . . . . . . . . . . . . . . . . . . . . . . 94 90 93 91Money market . . . . . . . . . . . . . . . . . . . . . . . . . . . . . . . . . . . . . . . . . . . . . 85 78 85 78Alternative investments . . . . . . . . . . . . . . . . . . . . . . . . . . . . . . . . . . . . . 29 18 27 19Real estate . . . . . . . . . . . . . . . . . . . . . . . . . . . . . . . . . . . . . . . . . . . . . . . . 27 14 25 13
Subtotal . . . . . . . . . . . . . . . . . . . . . . . . . . . . . . . . . . . . . . . . . . . . . . 480 430 474 427Unit trusts . . . . . . . . . . . . . . . . . . . . . . . . . . . . . . . . . . . . . . . . . . . . . . . . 15 12 14 12
Total assets under management or supervision . . . . . . . . . . . . . . . 495 442 488 439Share of minority interest assets(3) . . . . . . . . . . . . . . . . . . . . . . . . 5 — 5 —
Total . . . . . . . . . . . . . . . . . . . . . . . . . . . . . . . . . . . . . . . . . . . . . . . . $500 $442 $493 $439
(1) Certain prior-period information has been reclassified to conform to the current period’s presentation.(2) Americas Intermediary channel primarily represents client flows through defined contribution, insurance and bank trust platforms.(3) Amount represents Asset Management’s proportional share of assets managed by entities in which it owns a minority interest.
56

Activity in Asset Management’s customer assets under management or supervision were as follows:
Three MonthsEnded February 28,
2007 2006
(dollars in billions)
Balance at beginning of period . . . . . . . . . . . . . . . . . . . . . . . . . . . . . . . . . . . . . . . . . . . . . . . $478 $431Net flows by distribution channel:
Americas Retail Morgan Stanley brand . . . . . . . . . . . . . . . . . . . . . . . . . . . . . . . . . . (2) (3)Americas Retail Van Kampen brand . . . . . . . . . . . . . . . . . . . . . . . . . . . . . . . . . . . . — (1)Americas Intermediary(1) . . . . . . . . . . . . . . . . . . . . . . . . . . . . . . . . . . . . . . . . . . . . 1 2U.S. Institutional . . . . . . . . . . . . . . . . . . . . . . . . . . . . . . . . . . . . . . . . . . . . . . . . . . . — (4)Non-U.S. . . . . . . . . . . . . . . . . . . . . . . . . . . . . . . . . . . . . . . . . . . . . . . . . . . . . . . . . . 5 1
Net inflows/(outflows) excluding money markets . . . . . . . . . . . . . . . . . . . . . 4 (5)
Money market net flows:Institutional . . . . . . . . . . . . . . . . . . . . . . . . . . . . . . . . . . . . . . . . . . . . . . . . . . . . . . . 3 4Retail . . . . . . . . . . . . . . . . . . . . . . . . . . . . . . . . . . . . . . . . . . . . . . . . . . . . . . . . . . . . (2) (6)
Total money market net flows . . . . . . . . . . . . . . . . . . . . . . . . . . . . . . . . . . . . . 1 (2)
Net market appreciation . . . . . . . . . . . . . . . . . . . . . . . . . . . . . . . . . . . . . . . . . . . . . . . . . . 10 18
Total net increase . . . . . . . . . . . . . . . . . . . . . . . . . . . . . . . . . . . . . . . . . . . . . . . . . . . . . . . 15 11Acquisitions . . . . . . . . . . . . . . . . . . . . . . . . . . . . . . . . . . . . . . . . . . . . . . . . . . . . . . . . . . . 6 —Net increase in share of minority interest assets(2) . . . . . . . . . . . . . . . . . . . . . . . . . . . . . 1 —
Balance at end of period . . . . . . . . . . . . . . . . . . . . . . . . . . . . . . . . . . . . . . . . . . . . . . . . . . . . $500 $442
(1) Americas Intermediary channel primarily represents client flows through defined contribution, insurance and bank trust platforms.(2) Amount represents Asset Management’s proportional share of assets managed by entities in which it owns a minority interest.
Net inflows (excluding money markets) in the quarter ended February 28, 2007 were primarily associated withpositive flows into Non-U.S. products, partially offset by outflows in Americas Retail Morgan Stanley brandedproducts. For the quarter ended February 28, 2007, positive flows into institutional liquidity assets were partiallyoffset by outflows from certain money market funds that were impacted by the growth of Global WealthManagement Group’s bank deposit program.
Other. Other revenues were $34 million for the fiscal quarter ended February 28, 2007 as compared with $7million in the prior-year period. The increase was primarily due to revenue recognized from the Company’sminority stakes in Avenue Capital Group and Lansdowne Partners, which were acquired in the fourth quarter offiscal 2006.
Non-Interest Expenses. Non-interest expenses increased 26%. Compensation and benefits expense increased45%, primarily reflecting higher incentive-based compensation accruals due to higher net revenues andinvestments in the business, particularly in alternatives. The increase was partially offset by Asset Management’sshare ($28 million) of the incremental compensation expense related to equity awards to retirement-eligibleemployees in the first quarter of fiscal 2006 (see “Other Items—Stock-Based Compensation” herein). Excludingcompensation and benefits expense, non-interest expenses increased 9%. Brokerage, clearing and exchange feesdecreased 12%, primarily reflecting lower amortization expense associated with certain open-ended funds. Thedecrease in amortization expense reflected a lower level of deferred costs in recent periods due to a decrease insales of certain open-ended funds. Professional services expense increased 15%, primarily due to highersub-advisory, consulting and legal fees. Other expenses increased 113%, primarily due to the amortization ofintangible assets associated with the acquisition of FrontPoint.
57
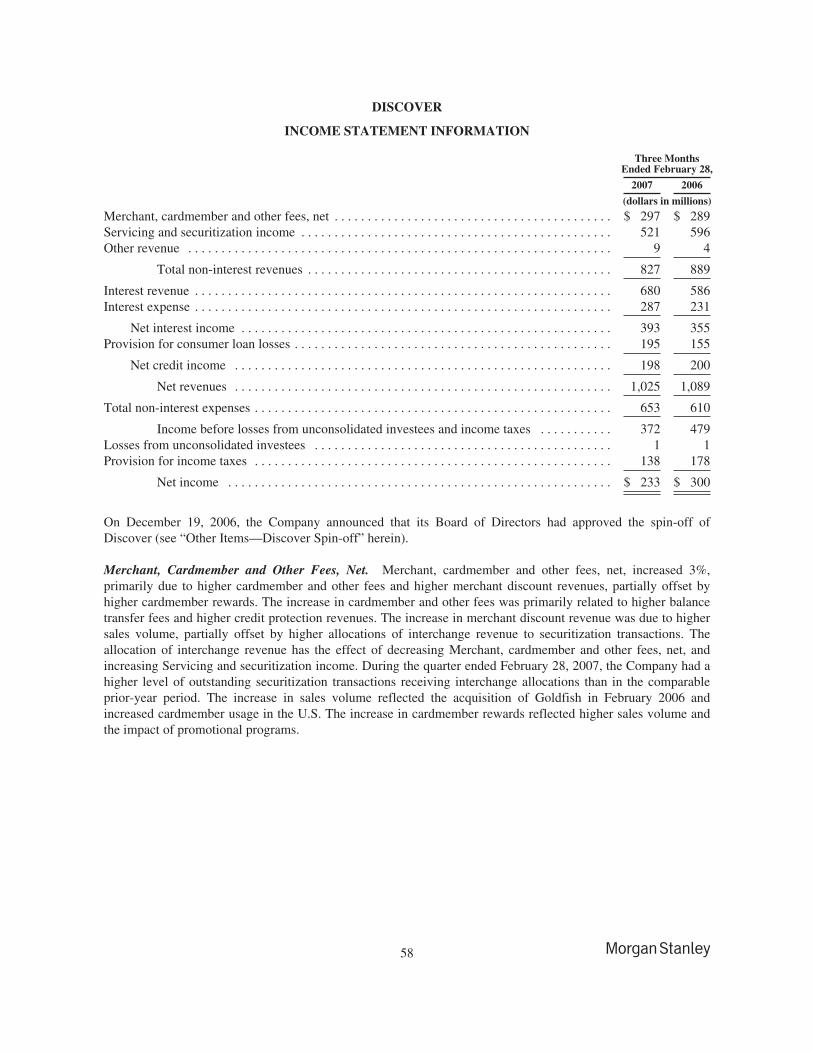
DISCOVER
INCOME STATEMENT INFORMATION
Three MonthsEnded February 28,
2007 2006
(dollars in millions)
Merchant, cardmember and other fees, net . . . . . . . . . . . . . . . . . . . . . . . . . . . . . . . . . . . . . . . . . . $ 297 $ 289Servicing and securitization income . . . . . . . . . . . . . . . . . . . . . . . . . . . . . . . . . . . . . . . . . . . . . . . 521 596Other revenue . . . . . . . . . . . . . . . . . . . . . . . . . . . . . . . . . . . . . . . . . . . . . . . . . . . . . . . . . . . . . . . . 9 4
Total non-interest revenues . . . . . . . . . . . . . . . . . . . . . . . . . . . . . . . . . . . . . . . . . . . . . . 827 889
Interest revenue . . . . . . . . . . . . . . . . . . . . . . . . . . . . . . . . . . . . . . . . . . . . . . . . . . . . . . . . . . . . . . . 680 586Interest expense . . . . . . . . . . . . . . . . . . . . . . . . . . . . . . . . . . . . . . . . . . . . . . . . . . . . . . . . . . . . . . . 287 231
Net interest income . . . . . . . . . . . . . . . . . . . . . . . . . . . . . . . . . . . . . . . . . . . . . . . . . . . . . . . . 393 355Provision for consumer loan losses . . . . . . . . . . . . . . . . . . . . . . . . . . . . . . . . . . . . . . . . . . . . . . . . 195 155
Net credit income . . . . . . . . . . . . . . . . . . . . . . . . . . . . . . . . . . . . . . . . . . . . . . . . . . . . . . . . . 198 200
Net revenues . . . . . . . . . . . . . . . . . . . . . . . . . . . . . . . . . . . . . . . . . . . . . . . . . . . . . . . . . 1,025 1,089
Total non-interest expenses . . . . . . . . . . . . . . . . . . . . . . . . . . . . . . . . . . . . . . . . . . . . . . . . . . . . . . 653 610
Income before losses from unconsolidated investees and income taxes . . . . . . . . . . . 372 479Losses from unconsolidated investees . . . . . . . . . . . . . . . . . . . . . . . . . . . . . . . . . . . . . . . . . . . . . 1 1Provision for income taxes . . . . . . . . . . . . . . . . . . . . . . . . . . . . . . . . . . . . . . . . . . . . . . . . . . . . . . 138 178
Net income . . . . . . . . . . . . . . . . . . . . . . . . . . . . . . . . . . . . . . . . . . . . . . . . . . . . . . . . . . $ 233 $ 300
On December 19, 2006, the Company announced that its Board of Directors had approved the spin-off ofDiscover (see “Other Items—Discover Spin-off” herein).
Merchant, Cardmember and Other Fees, Net. Merchant, cardmember and other fees, net, increased 3%,primarily due to higher cardmember and other fees and higher merchant discount revenues, partially offset byhigher cardmember rewards. The increase in cardmember and other fees was primarily related to higher balancetransfer fees and higher credit protection revenues. The increase in merchant discount revenue was due to highersales volume, partially offset by higher allocations of interchange revenue to securitization transactions. Theallocation of interchange revenue has the effect of decreasing Merchant, cardmember and other fees, net, andincreasing Servicing and securitization income. During the quarter ended February 28, 2007, the Company had ahigher level of outstanding securitization transactions receiving interchange allocations than in the comparableprior-year period. The increase in sales volume reflected the acquisition of Goldfish in February 2006 andincreased cardmember usage in the U.S. The increase in cardmember rewards reflected higher sales volume andthe impact of promotional programs.
58

Servicing and Securitization Income. The table below presents the components of servicing and securitizationincome:
Three MonthsEnded February 28,
2007 2006
(dollars in millions)
Merchant, cardmember and other fees, net . . . . . . . . . . . . . . . . . . . . . . . . . . . . . . . . . . . . . . . $255 $230Other revenue . . . . . . . . . . . . . . . . . . . . . . . . . . . . . . . . . . . . . . . . . . . . . . . . . . . . . . . . . . . . . (4) 139
Total non-interest revenues . . . . . . . . . . . . . . . . . . . . . . . . . . . . . . . . . . . . . . . . . . . . . . . 251 369
Interest revenue . . . . . . . . . . . . . . . . . . . . . . . . . . . . . . . . . . . . . . . . . . . . . . . . . . . . . . . . . . . . 919 889Interest expense . . . . . . . . . . . . . . . . . . . . . . . . . . . . . . . . . . . . . . . . . . . . . . . . . . . . . . . . . . . . 362 310
Net interest income . . . . . . . . . . . . . . . . . . . . . . . . . . . . . . . . . . . . . . . . . . . . . . . . . . . . . 557 579Provision for consumer loan losses . . . . . . . . . . . . . . . . . . . . . . . . . . . . . . . . . . . . . . . . . . . . 287 352
Net credit income . . . . . . . . . . . . . . . . . . . . . . . . . . . . . . . . . . . . . . . . . . . . . . . . . . . . . . 270 227
Servicing and securitization income . . . . . . . . . . . . . . . . . . . . . . . . . . . . . . . . . . . . $521 $596
Servicing and securitization income decreased 13%, primarily due to a decrease in Other revenue and lower netinterest income, partially offset by a lower provision for consumer loan losses and higher Merchant, cardmemberand other fees, net. Other revenue for the quarter ended February 28, 2006 benefited from an increase in the fairvalue of the Company’s retained interests in securitized receivables resulting from lower projected charge-offsfollowing the enactment of new bankruptcy legislation in October 2005. The decrease in Other revenues alsoreflected a lower level of new general purpose credit card securitization transactions in the quarter endedFebruary 28, 2007. The decrease in net interest income was attributable to a lower net interest spread rate,partially offset by a higher level of average securitized general purpose credit card loans. The lower provision forconsumer loan losses was primarily attributable to a lower rate of net principal charge-offs on the securitizedgeneral purpose credit card portfolio. The increase in Merchant, cardmember and other fees, net primarilyreflected a higher level of outstanding securitization transactions that received interchange allocations.
The net proceeds received from general purpose credit card asset securitizations were $1,578 million in thequarter ended February 28, 2007 and $6,613 million in the quarter ended February 28, 2006. The credit card assetsecuritization completed in the quarter ended February 28, 2007 has an expected maturity of approximately threeyears from the date of issuance.
Net Interest Income. Net interest income increased 11% due to an increase in interest revenue, partially offsetby an increase in interest expense. The increase in interest revenue was due to a higher yield and an increase inaverage owned general purpose credit card loans. The increase in average owned general purpose credit cardloans was due to the acquisition of Goldfish and higher sales volume, partially offset by a higher level of averagesecuritized general purpose credit card loans. The increase in interest expense was primarily due to an increase inthe Company’s average cost of borrowings and a higher level of average interest bearing liabilities, primarily tosupport the increase in average owned general purpose credit card loans.
59

The following tables present analyses of Discover’s average balance sheets and interest rates for the quartersended February 28, 2007 and 2006 and changes in net interest income during those periods:
Average Balance Sheet Analysis.
Three Months Ended February 28,
2007 2006
AverageBalance Rate Interest
AverageBalance Rate Interest
(dollars in millions)
ASSETSInterest earning assets:General purpose credit card loans . . . . . . . . . . . . . . . . $24,672 10.44% $ 635 $21,976 9.87% $ 535Other consumer loans . . . . . . . . . . . . . . . . . . . . . . . . . 96 6.56 2 306 7.52 6Investment securities . . . . . . . . . . . . . . . . . . . . . . . . . . 80 5.14 1 39 3.70 —Other . . . . . . . . . . . . . . . . . . . . . . . . . . . . . . . . . . . . . . . 2,983 5.76 42 4,033 4.65 45
Total interest earning assets . . . . . . . . . . . . . . . . . 27,831 9.91 680 26,354 9.02 586Allowance for loan losses . . . . . . . . . . . . . . . . . . . . . . (832) (838)Non-interest earning assets . . . . . . . . . . . . . . . . . . . . . 3,110 2,157
Total assets . . . . . . . . . . . . . . . . . . . . . . . . . . . . . . $30,109 $27,673
LIABILITIES AND SHAREHOLDER’S EQUITYInterest bearing liabilities:Interest bearing deposits
Savings . . . . . . . . . . . . . . . . . . . . . . . . . . . . . . . . . $ 3,453 5.27% $ 45 $ 820 3.86% $ 8Brokered . . . . . . . . . . . . . . . . . . . . . . . . . . . . . . . . 9,920 5.05 123 12,394 4.46 136Other time . . . . . . . . . . . . . . . . . . . . . . . . . . . . . . 1,570 4.87 19 1,783 4.40 19
Total interest bearing deposits . . . . . . . . . . . . . . . 14,943 5.08 187 14,997 4.42 163Other borrowings . . . . . . . . . . . . . . . . . . . . . . . . . . . . . 7,243 5.57 100 6,001 4.55 68
Total interest bearing liabilities . . . . . . . . . . . . . . 22,186 5.24 287 20,998 4.46 231Shareholder’s equity/other liabilities . . . . . . . . . . . . . . 7,923 6,675
Total liabilities and shareholder’s equity . . . . . . . $30,109 $27,673
Net interest income . . . . . . . . . . . . . . . . . . . . . . . . . . . $ 393 $ 355
Net interest margin(1) . . . . . . . . . . . . . . . . . . . . . . . . . 5.73% 5.47%Interest rate spread(2) . . . . . . . . . . . . . . . . . . . . . . . . . 4.67% 4.56%
(1) Net interest margin represents net interest income as a percentage of total interest earning assets.(2) Interest rate spread represents the difference between the rate on total interest earning assets and the rate on total interest bearing
liabilities.
60

Rate/Volume Analysis.
Three Months EndedFebruary 28, 2007 vs. 2006
Increase/(Decrease) due to Changes in: Volume Rate Total
(dollars in millions)
Interest RevenueGeneral purpose credit card loans . . . . . . . . . . . . . . . . . . . . . . . . . . . . . . . . . . . . . . . . . . . $ 65 $ 35 $100Other consumer loans . . . . . . . . . . . . . . . . . . . . . . . . . . . . . . . . . . . . . . . . . . . . . . . . . . . . . (4) — (4)Investment securities . . . . . . . . . . . . . . . . . . . . . . . . . . . . . . . . . . . . . . . . . . . . . . . . . . . . . 1 — 1Other . . . . . . . . . . . . . . . . . . . . . . . . . . . . . . . . . . . . . . . . . . . . . . . . . . . . . . . . . . . . . . . . . . (12) 9 (3)
Total interest revenue . . . . . . . . . . . . . . . . . . . . . . . . . . . . . . . . . . . . . . . . . . . . . . . . . 33 61 94
Interest ExpenseInterest bearing deposits:
Savings . . . . . . . . . . . . . . . . . . . . . . . . . . . . . . . . . . . . . . . . . . . . . . . . . . . . . . . . . . . . 25 12 37Brokered . . . . . . . . . . . . . . . . . . . . . . . . . . . . . . . . . . . . . . . . . . . . . . . . . . . . . . . . . . . (27) 14 (13)Other time . . . . . . . . . . . . . . . . . . . . . . . . . . . . . . . . . . . . . . . . . . . . . . . . . . . . . . . . . . (2) 2 —
Total interest bearing deposits . . . . . . . . . . . . . . . . . . . . . . . . . . . . . . . . . . . . . . . . . . (1) 25 24Other borrowings . . . . . . . . . . . . . . . . . . . . . . . . . . . . . . . . . . . . . . . . . . . . . . . . . . . . . . . . 14 18 32
Total interest expense . . . . . . . . . . . . . . . . . . . . . . . . . . . . . . . . . . . . . . . . . . . . . . . . . 13 43 56
Net interest income . . . . . . . . . . . . . . . . . . . . . . . . . . . . . . . . . . . . . . . . . . . . . . . . . . . . . . . $ 20 $ 18 $ 38
Provision for Consumer Loan Losses. The provision for consumer loan losses increased 26%. The increasereflected a lower net reduction of reserves as compared with the prior-year period, partially offset by lower netcharge-offs. The net reduction in reserves was $38 million in the quarter ended February 28, 2007 as comparedwith a net reduction of $97 million in the comparable prior-year period. The decrease in net charge-offs primarilyreflects a decline in bankruptcy filings following the federal bankruptcy legislation effective in October 2005,partially offset by higher contractual charge-offs in the U.S. as well as higher charge-offs in the U.K., reflectingincreased bankruptcy charge-offs and the Goldfish acquisition.
Delinquencies and Charge-offs. Delinquency rates in both the over 30- and over 90-day categories werehigher for the owned portfolio, primarily reflecting higher delinquencies in the U.K. Net principal charge-offrates were lower in both the owned and managed portfolios, reflecting portfolio credit quality and the continuedfavorable impact following the enactment of federal bankruptcy legislation (see “Managed General PurposeCredit Card Loan Data” herein). While the Company expects credit costs to continue to rise, the Companyexpects charge-off rates to remain relatively low and reach between 4.0% and 4.5% by the end of fiscal 2007.
In response to industry-wide regulatory guidance, the Company has increased minimum payment requirementson certain general purpose credit card loans. Bank regulators have discretion to interpret the guidance or itsapplication, and changes in such guidance or its application by the regulators could impact minimum paymentrequirements. Increases in minimum payment requirements could negatively impact future levels of generalpurpose credit card loans and related interest and fee revenue and charge-offs.
The Company’s future charge-off rates and credit quality are subject to uncertainties that could cause actualresults to differ materially from what has been discussed above. Factors that influence the provision for consumerloan losses include the level and direction of general purpose credit card loan delinquencies and charge-offs,changes in consumer spending and payment behaviors, bankruptcy trends, regulatory changes or new guidance,the seasoning of the Company’s general purpose credit card loan portfolio, interest rate movements and theirimpact on consumer behavior and changes in the Company’s general purpose credit card loan portfolio, includingthe overall mix of accounts, products and loan balances within the portfolio.
61

Non-Interest Expenses. Non-interest expenses increased 7% and reflected incremental costs as a result of theacquisition of Goldfish in February 2006. Compensation and benefits expense decreased 6%, primarily reflectingDiscover’s share ($17 million) of the incremental compensation expense related to equity awards to retirement-eligible employees in the first quarter of fiscal 2006 (see “Other Items—Stock-Based Compensation” herein),partially offset by an increase in salaries and wages in the first quarter of fiscal 2007. Excluding compensationand benefits expense, non-interest expenses increased 16%. Marketing and business development expensesincreased 19%, primarily due to higher marketing costs associated with account acquisition and higher holidaypromotional spending. Professional services expenses increased 27%, primarily due to higher legal andconsulting fees. Other expenses increased 20%, primarily due to an increase in certain operating expenses,including higher accruals for losses associated with fraud and an increase in the amortization of intangible assets.
Managed General Purpose Credit Card Loan Data. The Company analyzes its financial performance on botha “managed” loan basis and as reported under U.S. Generally Accepted Accounting Principles (“U.S. GAAP”)(“owned” loan basis). Managed loan data assume that the Company’s securitized loan receivables have not beensold and present the results of the securitized loan receivables in the same manner as the Company’s ownedloans. The Company operates its Discover business and analyzes its financial performance on a managed basis.Accordingly, underwriting and servicing standards are comparable for both owned and securitized loans. TheCompany believes that managed loan information is useful to investors because it provides information regardingthe quality of loan origination and credit performance of the entire managed portfolio and allows investors tounderstand the related credit risks inherent in owned loans and retained interests in securitizations. In addition,investors often request information on a managed basis, which provides a more meaningful comparison withindustry competitors.
The following table provides a reconciliation of owned and managed average loan balances, returns onreceivables, interest yields and interest rate spreads for the periods indicated:
Reconciliation of General Purpose Credit Card Loan Data (dollars in millions)
Three Months Ended February 28,
2007 2006
AverageBalance
Return onReceivables(1)
InterestYield
InterestRate
SpreadAverageBalance
Return onReceivables(1)
InterestYield
InterestRate
Spread
General Purpose CreditCard Loans:
Owned . . . . . . . . . . . . . . . . . . $24,672 3.84% 10.44% 5.20% $21,976 5.54% 9.87% 5.41%Securitized . . . . . . . . . . . . . . . 26,718 3.55% 13.96% 8.39% 25,599 4.75% 14.08% 9.20%
Managed . . . . . . . . . . . . . . . . $51,390 1.84% 12.27% 6.85% $47,575 2.56% 12.13% 7.44%
(1) Return on receivables is equal to Discover annualized income divided by average owned, securitized or managed credit card receivables,as applicable.
62

The following tables present a reconciliation of owned and managed general purpose credit card loans anddelinquency and net charge-off rates:
Reconciliation of General Purpose Credit Card Loan Asset Quality Data (dollars in millions)
Three Months Ended February 28,
2007 2006
Period-End
Loans
DelinquencyRates
Period-End
Loans
DelinquencyRates
Over30
Days
Over90
Days
Over30
Days
Over90
Days
General Purpose Credit Card Loans:Owned . . . . . . . . . . . . . . . . . . . . . . . . . . . . . . . . . . . . . . . . $22,410 3.16% 1.56% $19,924 2.97% 1.36%Securitized . . . . . . . . . . . . . . . . . . . . . . . . . . . . . . . . . . . . . 28,320 3.67% 1.79% 27,901 3.79% 1.79%
Managed . . . . . . . . . . . . . . . . . . . . . . . . . . . . . . . . . . . . . . $50,730 3.45% 1.69% $47,825 3.45% 1.61%
Three MonthsEnded February 28,
2007 2006
Net Principal Charge-offs:Owned . . . . . . . . . . . . . . . . . . . . . . . . . . . . . . . . . . . . . . . . . . . . . . . . . . . . . . . . . . . . 3.78% 4.54%Securitized . . . . . . . . . . . . . . . . . . . . . . . . . . . . . . . . . . . . . . . . . . . . . . . . . . . . . . . . . 4.30% 5.51%Managed . . . . . . . . . . . . . . . . . . . . . . . . . . . . . . . . . . . . . . . . . . . . . . . . . . . . . . . . . . . 4.05% 5.06%
Net Total Charge-offs (inclusive of interest and fees):Owned . . . . . . . . . . . . . . . . . . . . . . . . . . . . . . . . . . . . . . . . . . . . . . . . . . . . . . . . . . . . 5.01% 5.64%Securitized . . . . . . . . . . . . . . . . . . . . . . . . . . . . . . . . . . . . . . . . . . . . . . . . . . . . . . . . . 6.16% 7.86%Managed . . . . . . . . . . . . . . . . . . . . . . . . . . . . . . . . . . . . . . . . . . . . . . . . . . . . . . . . . . . 5.61% 6.83%
63

Other Items.Deferred Compensation Plans.
The Company maintains various deferred compensation plans for the benefit of certain employees. Beginning inthe quarter ended February 28, 2007, increases or decreases in assets or earnings associated with such plans arereflected in net revenues, and increases or decreases in liabilities associated with such plans are reflected incompensation expense. Previously, the increases or decreases in assets and liabilities associated with these planswere both recorded in net revenues. Prior periods have been reclassified to conform to the current presentation.The amount of the reclassification that was recorded in the three months ended February 28, 2007 andFebruary 28, 2006 was $245 million and $94 million, respectively.
Stock-Based Compensation.
For stock-based awards issued prior to the adoption of SFAS No. 123R, “Share-Based Payment” (“SFASNo. 123R”) as of December 1, 2004, the Company’s accounting policy for awards granted to retirement-eligibleemployees was to recognize compensation cost over the service period specified in the award terms. TheCompany accelerates any unrecognized compensation cost for such awards if and when a retirement-eligibleemployee leaves the Company.
For fiscal 2005 year-end stock-based compensation awards that were granted to retirement-eligible employees inDecember 2005, the Company recognized the compensation cost for such awards on the date of grant instead ofover the service period specified in the award terms. As a result, the Company recorded non-cash incrementalcompensation expenses of approximately $395 million in the first quarter of fiscal 2006 for stock-based awardsgranted to retirement-eligible employees as part of the fiscal 2005 year-end award process and for awards grantedto retirement-eligible employees, including new hires, in the first quarter of fiscal 2006. These incrementalexpenses were included within Compensation and benefits expense and reduced income before taxes within theInstitutional Securities ($270 million), Global Wealth Management Group ($80 million), Asset Management($28 million) and Discover ($17 million) business segments.
Discontinued Operations.
Quilter. On February 28, 2007, the Company sold Quilter, which was formerly included within the GlobalWealth Management Group business segment. The results of Quilter are included within discontinued operationsfor all periods presented. The results for discontinued operations in the quarter ended February 28, 2007 alsoincluded a pre-tax gain of $168 million ($109 million after-tax) on disposition (see Note 15 to the condensedconsolidated financial statements).
Aircraft Leasing. On March 24, 2006, the Company sold its aircraft leasing business to Terra Firma, aEuropean private equity group. The results for discontinued operations in the quarter ended February 28, 2006included a loss of $125 million ($75 million after-tax) related to the impact of the finalization of the salesproceeds and balance sheet adjustments related to the closing (see Note 15 to the condensed consolidatedfinancial statements and “Financial Statements and Supplementary Data —Note 18” in Part II, Item 8 of theForm 10-K for further information).
Discover Spin-off.
On December 19, 2006, the Company announced that its Board of Directors had approved the spin-off of Discoverin order to enhance shareholder value. The Discover Spin-off will allow the Company to focus its efforts on moreclosely aligned firm-wide strategic priorities within its Institutional Securities, Global Wealth Management Groupand Asset Management business segments. The Discover Spin-off is subject to regulatory approval and othercustomary conditions and is expected to occur in the third quarter of fiscal 2007. At the time of the Discover Spin-off, shareholders of the Company will receive shares in Discover on a generally tax-free basis.
Business and Other Acquisitions.
JM Financial. On February 22, 2007, the Company announced that it would dissolve its India joint venturewith JM Financial. The Company has reached an agreement in principle to purchase the joint venture’s
64

institutional equities sales, trading and research platform by acquiring JM Financial’s 49% interest and to sell theCompany’s 49% interest in the joint venture’s investment banking, fixed income and retail operation to JMFinancial.
CityMortgage Bank. On December 21, 2006, the Company acquired CityMortgage Bank (“CityMortgage”), aMoscow-based mortgage bank that specializes in originating, servicing and securitizing residential mortgageloans in the Russian Federation. Since the acquisition date, the results of CityMortgage have been includedwithin the Institutional Securities business segment.
Olco Petroleum Group Inc. On December 15, 2006, the Company acquired a 60% equity stake in OlcoPetroleum Group Inc. (“Olco”), a petroleum products marketer and distributor based in eastern Canada. Since theacquisition date, the results of Olco have been included within the Institutional Securities business segment.
Saxon Capital, Inc. On December 4, 2006, the Company acquired Saxon, a servicer and originator ofresidential mortgages. Since the acquisition date, the results of Saxon have been included within the InstitutionalSecurities business segment.
FrontPoint Partners. On December 4, 2006, the Company acquired FrontPoint, a provider of absolute returninvestment strategies. Since the acquisition date, the results of FrontPoint have been included within the AssetManagement business segment.
Coleman Litigation.
In the first quarter of fiscal 2005, the Company recorded a $360 million charge related to the Coleman litigationmatter (see Note 8 to the condensed consolidated financial statements). For further information, refer to “LegalProceedings” in Part II, Item 1 of this report on Form 10-Q, “Legal Proceedings” in Part I, Item 3 of theForm 10-K and “Financial Statements and Supplementary Data—Note 9” in Part II, Item 8 of the Form 10-K.
On March 21, 2007, the District Court of Appeal for the Fourth District of Florida issued an opinion reversing thetrial court’s award for compensatory and punitive damages and remanding the case to the trial court for entry of ajudgment for the Company. The opinion will become final upon disposition of any timely filed motions forrehearing.
Income Tax Examinations.
The Company is under continuous examination by the Internal Revenue Service (the “IRS”) and other taxauthorities in certain countries, such as Japan and the U.K., and states in which the Company has significantbusiness operations, such as New York. The tax years under examination vary by jurisdiction; for example,the current IRS examination covers 1999-2005. The Company regularly assesses the likelihood of additionalassessments in each of the taxing jurisdictions resulting from these and subsequent years’ examinations.The Company has established tax reserves that the Company believes are adequate in relation to the potential foradditional assessments. Once established, the Company adjusts tax reserves only when more information isavailable or when an event occurs necessitating a change to the reserves. The Company believes that theresolution of tax matters will not have a material effect on the condensed consolidated financial condition of theCompany, although a resolution could have a material impact on the Company’s condensed consolidatedstatement of income for a particular future period and on the Company’s effective income tax rate for any periodin which such resolution occurs.
Accounting Developments.
Limited Partnerships. In June 2005, the Financial Accounting Standards Board (“FASB”) ratified theconsensus reached in Emerging Issues Task Force (“EITF”) Issue No. 04-5, “Determining Whether a GeneralPartner, or the General Partners as a Group, Controls a Limited Partnership or Similar Entity When the LimitedPartners Have Certain Rights” (“EITF Issue No. 04-5”). Under the provisions of EITF Issue No. 04-5, a general
65

partner in a limited partnership is presumed to control that limited partnership and, therefore, should include thelimited partnership in its consolidated financial statements, regardless of the amount or extent of the generalpartner’s interest unless a majority of the limited partners can vote to dissolve or liquidate the partnership orotherwise remove the general partner without having to show cause or the limited partners have substantiveparticipating rights that can overcome the presumption of control by the general partner. EITF Issue No. 04-5was effective immediately for all newly formed limited partnerships and existing limited partnerships for whichthe partnership agreements have been modified. For all other existing limited partnerships for which thepartnership agreements have not been modified, the Company adopted EITF Issue No. 04-5 on December 1,2006. The adoption of EITF Issue No. 04-5 on December 1, 2006 did not have a material impact on theCompany’s condensed consolidated financial statements.
Accounting for Certain Hybrid Financial Instruments. In February 2006, the FASB issued SFAS No. 155,“Accounting for Certain Hybrid Financial Instruments” (“SFAS No. 155”), which amends SFAS No. 133,“Accounting for Derivative Instruments and Hedging Activities,” as amended (“SFAS No. 133”) and SFASNo. 140, “Accounting for Transfers and Servicing of Financial Assets and Extinguishments of Liabilities”(“SFAS No. 140”). SFAS No. 155 permits hybrid financial instruments that contain an embedded derivative thatwould otherwise require bifurcation to irrevocably be accounted for at fair value, with changes in fair valuerecognized in the statement of income. The fair value election may be applied on an instrument-by-instrumentbasis. SFAS No. 155 also eliminates a restriction on the passive derivative instruments that a qualifying specialpurpose entity may hold. The Company adopted SFAS No. 155 on December 1, 2006. Since SFAS No. 159incorporates accounting and disclosure requirements that are similar to SFAS No. 155, the Company decided toapply SFAS No. 159, “The Fair Value Option for Financial Assets and Financial Liabilities” (“SFAS No. 159”),rather than SFAS No. 155, to its fair value elections for hybrid financial instruments.
Accounting for Servicing of Financial Assets. In March 2006, the FASB issued SFAS No. 156, “Accountingfor Servicing of Financial Assets, an amendment of FASB Statement No. 140” (“SFAS No. 156”). SFAS No. 156requires all separately recognized servicing assets and servicing liabilities to be initially measured at fair value, ifpracticable. The standard permits an entity to subsequently measure each class of servicing assets or servicingliabilities at fair value and report changes in fair value in the statement of income in the period in which thechanges occur. The Company adopted SFAS No. 156 on December 1, 2006 and has elected to fair valueservicing rights held as of the date of adoption. This election did not have a material impact on the Company’sopening balance of Retained earnings as of December 1, 2006. The Company also elected to fair value servicingrights acquired after December 1, 2006.
Accounting for Uncertainty in Income Taxes. In July 2006, the FASB issued FASB Interpretation No. 48,“Accounting for Uncertainty in Income Taxes, an interpretation of FASB Statement No. 109” (“FIN 48”). FIN 48clarifies the accounting for uncertainty in income taxes recognized in a company’s financial statements andprescribes a recognition threshold and measurement attribute for the financial statement recognition andmeasurement of a tax position taken or expected to be taken in an income tax return. FIN 48 also providesguidance on derecognition, classification, interest and penalties, accounting in interim periods, disclosure andtransition. FIN 48 is effective for the Company as of December 1, 2007. The Company is currently evaluating thepotential impact of adopting FIN 48.
Fair Value Measurements. In September 2006, the FASB issued SFAS No. 157, “Fair Value Measurements”(“SFAS No. 157”). SFAS No. 157 defines fair value, establishes a framework for measuring fair value andexpands disclosures about fair value measurements. In addition, SFAS No. 157 disallows the use of blockdiscounts for large holdings of unrestricted financial instruments where quoted prices are readily and regularlyavailable in an active market, and nullifies select guidance provided by EITF Issue No. 02-3, “Issues Involved inAccounting for Derivative Contracts Held for Trading Purposes and Contracts Involved in Energy Trading andRisk Management Activities” (“EITF Issue No. 02-3”), which prohibited the recognition of trading gains orlosses at the inception of a derivative contract, unless the fair value of such derivative is obtained from a quotedmarket price, or other valuation technique that incorporates observable market data. SFAS No. 157 also requiresthe Company to consider its own credit spreads when measuring the fair value of liabilities, including
66

derivatives. Effective December 1, 2006, the Company elected early adoption of SFAS No. 157. In accordancewith the provisions of SFAS No. 157 related to block discounts and EITF Issue No. 02-3, the Company recordeda cumulative effect adjustment of approximately $80 million after-tax as an increase to the opening balance ofRetained earnings as of December 1, 2006, which was primarily associated with EITF Issue No. 02-3. Theimpact of considering the Company’s own credit spreads when measuring the fair value of liabilities, includingderivatives, did not have a material impact on fair value measurements at the date of adoption. With the adoptionof SFAS No. 157, the Company will no longer apply the revenue recognition criteria of EITF Issue No. 02-3.
Employee Benefit Plans. In September 2006, the FASB issued SFAS No. 158, “Employers’ Accounting forDefined Benefit Pension and Other Postretirement Plans, an amendment of FASB Statements No. 87, 88, 106,and 132(R)” (“SFAS No. 158”). Among other items, SFAS No. 158 requires recognition of the overfunded orunderfunded status of an entity’s defined benefit and postretirement plans as an asset or liability in the financialstatements and requires the measurement of defined benefit and postretirement plan assets and obligations as ofthe end of the employer’s fiscal year. SFAS No. 158’s requirement to recognize the funded status in the financialstatements is effective for fiscal years ending after December 15, 2006, and its requirement to use the fiscalyear-end date as the measurement date is effective for fiscal years ending after December 15, 2008. TheCompany is currently assessing the impact that SFAS No. 158 will have on its condensed consolidated financialstatements.
Fair Value Option. In February 2007, the FASB issued SFAS No. 159. SFAS No. 159 provides a fair valueoption election that allows companies to irrevocably elect fair value as the initial and subsequent measurementattribute for certain financial assets and liabilities, with changes in fair value recognized in earnings as theyoccur. SFAS No. 159 permits the fair value option election on an instrument by instrument basis at initialrecognition of an asset or liability or upon an event that gives rise to a new basis of accounting for thatinstrument. Effective December 1, 2006, the Company elected early adoption of SFAS No. 159. As a result of theadoption of SFAS No. 159, the Company recorded a cumulative effect adjustment of approximately $102 millionafter-tax as an increase to the opening balance of Retained earnings as of December 1, 2006.
67

Critical Accounting Policies.The Company’s condensed consolidated financial statements are prepared in accordance with U.S. GAAP, whichrequires the Company to make estimates and assumptions (see Note 1 to the condensed consolidated financialstatements). The Company believes that of its significant accounting policies (see Note 2 to the consolidatedfinancial statements for the fiscal year ended November 30, 2006 included in the Form 10-K), the following mayinvolve a higher degree of judgment and complexity.
Fair Value.
The Company’s financial assets and financial liabilities are primarily recorded at fair value. Fair value is theprice that would be received to sell an asset or paid to transfer a liability in an orderly transaction between marketparticipants at the measurement date.
As a result of the Company’s adoption of SFAS No. 159 on December 1, 2006, the Company elected the fairvalue option for certain instruments. Such instruments included loans and other financial instruments held bysubsidiaries that are not registered broker-dealers as defined in the AICPA Audit and Accounting Guide, Brokersand Dealers in Securities, or that are held by investment companies as defined in the AICPA Audit andAccounting Guide, Investment Companies. A substantial portion of these positions, as well as the financialinstruments included within Other secured financings, had been accounted for by the Company at fair value priorto the adoption of SFAS No. 159. Changes in the fair value of these positions are included within Principaltransactions—trading revenues in the Company’s condensed consolidated statements of income.
Financial instruments owned and Financial instruments sold, not yet purchased, which include cash andderivative products, are recorded at fair value in the condensed consolidated statements of financial condition,and gains and losses are reflected net in Principal transactions—trading revenues in the condensed consolidatedstatements of income.
The fair value of the Company’s financial instruments are generally based on or derived from bid prices orparameters for Financial instruments owned and ask prices or parameters for Financial instruments sold, not yetpurchased.
A substantial percentage of the fair value of the Company’s financial instruments used for trading and investmentis based on observable market prices, observable market parameters, or is derived from such prices orparameters. The availability of observable market prices and pricing parameters can vary from product toproduct. Where available, observable market prices and pricing parameters in a product (or a related product)may be used to derive a price without requiring significant judgment. In certain markets, such as for products thatare less actively traded, observable market prices or market parameters are not available for all products, and fairvalue is determined using techniques appropriate for each particular product. These techniques involve somedegree of judgment.
In the case of financial instruments transacted on recognized exchanges, the observable prices representquotations for completed transactions from the exchange on which the financial instrument is principally traded.Also, as a result of the adoption of SFAS No. 157 on December 1, 2006, the Company no longer utilizes blockdiscounts in cases where it has large holdings of unrestricted financial instruments with quoted prices that arereadily and regularly available in an active market.
The price transparency of the particular product will determine the degree of judgment involved in determiningthe fair value of the Company’s financial instruments. Price transparency is affected by a wide variety of factors,including, for example, the type of product, whether it is a new product and not yet established in themarketplace, and the characteristics particular to the transaction. Products for which actively quoted prices orpricing parameters are available or for which fair value is derived from actively quoted prices or pricingparameters will generally have a higher degree of price transparency. By contrast, products that are thinly tradedor not quoted will generally have reduced to no price transparency. Even in normally active markets, the price
68

transparency for actively quoted instruments may be reduced for periods of time during periods of marketdislocation. Alternatively, in thinly quoted markets, the participation of market-makers willing to purchase andsell a product provides a source of transparency for products that otherwise are not actively quoted or duringperiods of market dislocation. For further information on the observability of the pricing inputs used to determinethe fair value of the Company’s financial instruments, see Note 18 to the condensed consolidated financialstatements.
The Company’s cash products include securities issued by the U.S. government and its agencies, other sovereigndebt obligations, certain corporate and other debt securities, corporate equity securities, exchange traded fundsand physical commodities. The fair value of these products is based principally on observable market prices or isderived using observable market parameters. These products generally do not entail a significant degree ofjudgment in determining fair value. Examples of products for which actively quoted prices or pricing parametersare available or for which fair value is derived from actively quoted prices or pricing parameters includesecurities issued by the U.S. government and its agencies, exchange traded corporate equity securities, mostmunicipal debt securities, most corporate debt securities, most high-yield debt securities, physical commodities,certain tradable loan products and most mortgage-backed securities.
In certain circumstances, principally involving loan products and other financial instruments held forsecuritization transactions, the Company determines fair value from within the range of bid and ask prices suchthat fair value indicates the value likely to be realized in a current market transaction. Bid prices reflect the pricethat the Company and others pay, or stand ready to pay, to originators of such assets. Ask prices represent theprices that the Company and others require to sell such assets to the entities that acquire the financial instrumentsfor purposes of completing the securitization transactions. Generally, the fair value of such acquired assets isbased upon the bid price in the market for the instrument or similar instruments. In general, the loans and similarassets are valued at bid pricing levels until structuring of the related securitization is substantially complete andsuch that the value likely to be realized in a current transaction is consistent with the price that a securitizationentity will pay to acquire the financial instruments. Factors affecting securitized value and investor demandrelating specifically to loan products include, but are not limited to, loan type, underlying property type andgeographic location, loan interest rate, loan to value ratios, debt service coverage ratio, investor demand andcredit enhancement levels.
In addition, some cash products exhibit little or no price transparency, and the determination of fair valuerequires more judgment. Examples of cash products with little or no price transparency include certain high-yielddebt, certain collateralized mortgage obligations, certain tradable loan products, distressed debt securities(i.e., securities of issuers encountering financial difficulties, including bankruptcy or insolvency) and equitysecurities that are not publicly traded. Generally, the fair value of these types of cash products is determinedusing one of several valuation techniques appropriate for the product, which can include cash flow analysis,revenue or net income analysis, default recovery analysis (i.e., analysis of the likelihood of default and thepotential for recovery) and other analyses applied consistently.
The Company’s derivative products include exchange traded and OTC derivatives. Exchange traded derivativeshave valuation attributes similar to the cash products valued using observable market prices or market parametersdescribed above. OTC derivatives, whose fair value is derived using pricing models, include a wide variety ofinstruments, such as interest rate swap and option contracts, foreign currency option contracts, credit and equityswap and option contracts, and commodity swap and option contracts.
The following table presents the fair value of the Company’s exchange traded and OTC derivatives includedwithin Financial instruments owned and Financial instruments sold, not yet purchased (dollars in millions):
At February 28, 2007 At November 30, 2006
Assets Liabilities Assets Liabilities
Exchange traded . . . . . . . . . . . . . . . . . . . . . . . . . . . . . . . . . . . . . . . . . . . $12,446 $16,390 $12,554 $17,094OTC . . . . . . . . . . . . . . . . . . . . . . . . . . . . . . . . . . . . . . . . . . . . . . . . . . . . 38,506 35,184 42,889 40,397
Total . . . . . . . . . . . . . . . . . . . . . . . . . . . . . . . . . . . . . . . . . . . . . . . . $50,952 $51,574 $55,443 $57,491
69

The fair value of OTC derivative contracts is derived primarily using pricing models, which may require multiplemarket input parameters. Where appropriate, valuation adjustments are made to account for credit quality andmarket liquidity. These adjustments are applied on a consistent basis and are based upon observable market datawhere available. The Company also uses pricing models to manage the risks introduced by OTC derivatives.Depending on the product and the terms of the transaction, the fair value of OTC derivative products can bemodeled using a series of techniques, including closed-form analytic formulae, such as the Black-Scholes optionpricing model, simulation models or a combination thereof, applied consistently. In the case of more establishedderivative products, the pricing models used by the Company are widely accepted by the financial servicesindustry. Pricing models take into account the contract terms, including the maturity, as well as marketparameters such as interest rates, volatility and the creditworthiness of the counterparty. As a result of theCompany’s adoption of SFAS No. 157 on December 1, 2006, the impact of the Company’s own credit spreadsare also considered when measuring the fair value of liabilities, including certain OTC derivative contracts.
Prior to the adoption of SFAS No. 157 on December 1, 2006, the Company followed the provisions of EITFIssue No. 02-3 (see “Other Items—Accounting Developments” herein). Under EITF Issue No. 02-3, in theabsence of observable market prices or parameters in an active market, observable prices or parameters of othercomparable current market transactions, or other observable data supporting a fair value based on a pricingmodel at the inception of a contract, revenue recognition at the inception of an OTC derivative financialinstrument was not permitted. Such revenue was recognized in income at the earlier of when there was marketvalue observability or at the end of the contract period. In the absence of observable market prices or parametersin an active market, observable prices or parameters of other comparable current market transactions, or otherobservable data supporting a fair value based on a pricing model at the inception of a contract, fair value wasbased on the transaction price. With the adoption of SFAS No. 157, the Company is no longer applying therevenue recognition criteria of EITF Issue No. 02-3.
Many pricing models do not entail material subjectivity because the methodologies employed do not necessitatesignificant judgment, and the pricing inputs are observed from actively quoted markets, as is the case for genericinterest rate swap and option contracts. A substantial majority of OTC derivative products valued by theCompany using pricing models fall into this category. Other derivative products, typically the newest and mostcomplex products, will require more judgment in the implementation of the modeling technique applied due tothe complexity of the modeling assumptions and the reduced price transparency surrounding the model’s marketparameters. The Company manages its market exposure for OTC derivative products primarily by entering intooffsetting derivative contracts or other related financial instruments. The Company’s trading divisions, theFinancial Control Department and the Market Risk Department continuously monitor the price changes of theOTC derivatives in relation to the offsetting positions. For a further discussion of the price transparency of theCompany’s OTC derivative products, see “Quantitative and Qualitative Disclosures about Market Risk—RiskManagement—Credit Risk” in Part II, Item 7A of the Form 10-K.
Substantially all equity and debt investments purchased in connection with private equity and other investmentactivities are valued at fair value and are included within Other assets in the condensed consolidated statementsof financial condition, and gains and losses are reflected in Principal transactions—investment revenues. Thecarrying value of such investments reflects expected exit values based upon appropriate valuation techniquesapplied on a consistent basis. Such techniques employ various market, income and cost approaches to determinefair value at the measurement date. The Company’s partnership interests, including general partnership andlimited partnership interests in real estate funds, are included within Other assets in the condensed consolidatedstatements of financial condition and are recorded at fair value based upon changes in the fair value of theunderlying partnership’s net assets.
The Company employs control processes to validate the fair value of its financial instruments, including thosederived from pricing models. These control processes are designed to assure that the values used for financialreporting are based on observable market prices or market-based parameters wherever possible. In the event thatmarket prices or parameters are not available, the control processes are designed to assure that the valuation
70

approach utilized is appropriate and consistently applied and that the assumptions are reasonable. These controlprocesses include reviews of the pricing model’s theoretical soundness and appropriateness by Companypersonnel with relevant expertise who are independent from the trading desks. Additionally, groups independentfrom the trading divisions within the Financial Control and Market Risk Departments participate in the reviewand validation of the fair values generated from pricing models, as appropriate. Where a pricing model is used todetermine fair value, recently executed comparable transactions and other observable market data are consideredfor purposes of validating assumptions underlying the model. Consistent with market practice, the Company hasindividually negotiated agreements with certain counterparties to exchange collateral (“margining”) based on thelevel of fair values of the derivative contracts they have executed. Through this margining process, one party orboth parties to a derivative contract provides the other party with information about the fair value of thederivative contract to calculate the amount of collateral required. This sharing of fair value information providesadditional support of the Company’s recorded fair value for the relevant OTC derivative products. For certainOTC derivative products, the Company, along with other market participants, contributes derivative pricinginformation to aggregation services that synthesize the data and make it accessible to subscribers. Thisinformation is then used to evaluate the fair value of these OTC derivative products. For more informationregarding the Company’s risk management practices, see “Quantitative and Qualitative Disclosures about MarketRisk—Risk Management” in Part II, Item 7A of the Form 10-K.
Allowance for Consumer Loan Losses.
The allowance for consumer loan losses in the Company’s Discover business is established through a charge tothe provision for consumer loan losses. Provisions are made to reserve for estimated losses in outstanding loanbalances. The allowance for consumer loan losses is a significant estimate that represents management’s estimateof probable losses inherent in the consumer loan portfolio. The allowance for consumer loan losses is primarilyapplicable to the owned homogeneous consumer credit card loan portfolio and is evaluated quarterly foradequacy.
In estimating the allowance for consumer loan losses, the Company uses a systematic and consistently appliedapproach. This process starts with a migration analysis (a technique used to estimate the likelihood that aconsumer loan will progress through the various stages of delinquency and ultimately charge-off) of delinquentand current consumer credit card accounts in order to determine the appropriate level of the allowance forconsumer loan losses. The migration analysis considers uncollectible principal, interest and fees reflected inconsumer loans. In evaluating the adequacy of the allowance for consumer loan losses, management alsoconsiders factors that may impact credit losses, including current economic conditions, recent trends indelinquencies and bankruptcy filings, account collection management, policy changes, account seasoning, loanvolume and amounts, payment rates and forecasting uncertainties. A provision for consumer loan losses ischarged against earnings to maintain the allowance for consumer loan losses at an appropriate level. The use ofdifferent estimates or assumptions could produce different provisions for consumer loan losses (see “Discover—Provision for Consumer Loan Losses” herein).
Legal, Regulatory and Tax Contingencies.
In the normal course of business, the Company has been named, from time to time, as a defendant in variouslegal actions, including arbitrations, class actions and other litigation, arising in connection with its activities as aglobal diversified financial services institution. Certain of the actual or threatened legal actions include claims forsubstantial compensatory and/or punitive damages or claims for indeterminate amounts of damages. In somecases, the issuers that would otherwise be the primary defendants in such cases are bankrupt or in financialdistress.
The Company is also involved, from time to time, in other reviews, investigations and proceedings (both formaland informal) by governmental and self-regulatory agencies regarding the Company’s business, including,among other matters, accounting and operational matters, certain of which may result in adverse judgments,
71

settlements, fines, penalties, injunctions or other relief. The number of these reviews, investigations andproceedings has increased in recent years with regard to many firms in the financial services industry, includingthe Company.
Reserves for litigation and regulatory proceedings are generally determined on a case-by-case basis and representan estimate of probable losses after considering, among other factors, the progress of each case, prior experienceand the experience of others in similar cases, and the opinions and views of internal and external legal counsel.Given the inherent difficulty of predicting the outcome of such matters, particularly in cases where claimantsseek substantial or indeterminate damages or where investigations and proceedings are in the early stages, theCompany cannot predict with certainty the loss or range of loss, if any, related to such matters, how such matterswill be resolved, when they will ultimately be resolved or what the eventual settlement, fine, penalty or otherrelief, if any, might be.
The Company is subject to the income and indirect tax laws of the U.S., its states and municipalities and those ofthe foreign jurisdictions in which the Company has significant business operations. These tax laws are complexand subject to different interpretations by the taxpayer and the relevant governmental taxing authorities. TheCompany must make judgments and interpretations about the application of these inherently complex tax lawswhen determining the provision for income taxes and the expense for indirect taxes and must also make estimatesabout when in the future certain items affect taxable income in the various tax jurisdictions. Disputes overinterpretations of the tax laws may be settled with the taxing authority upon examination or audit. The Companyregularly assesses the likelihood of assessments in each of the taxing jurisdictions resulting from current andsubsequent years’ examinations, and tax reserves are established as appropriate.
The Company establishes reserves for potential losses that may arise out of litigation, regulatory proceedings andtax audits to the extent that such losses are probable and can be estimated in accordance with SFAS No. 5,“Accounting for Contingencies” (“SFAS No. 5”). Once established, reserves are adjusted when there is moreinformation available or when an event occurs requiring a change. Significant judgment is required in makingthese estimates, and the actual cost of a legal claim, tax assessment or regulatory fine/penalty may ultimately bematerially different from the recorded reserves, if any.
See Notes 8 and 17 to the condensed consolidated financial statements for additional information on legalproceedings and income tax examinations.
Special Purpose Entities.
The Company enters into a variety of transactions with special purpose entities (“SPE”), primarily in connectionwith securitization activities. The Company engages in securitization activities related to commercial andresidential mortgage loans, U.S. agency collateralized mortgage obligations, corporate bonds and loans,municipal bonds, credit card loans and other types of financial instruments. In most cases, these SPEs are deemedto be variable interest entities (“VIE”). Unless a VIE is determined to be a qualifying special purpose entity(“QSPE”), the Company is required under accounting guidance to perform an analysis of each VIE at the dateupon which the Company becomes involved with it to determine whether the Company is the primarybeneficiary of the VIE, in which case the Company must consolidate the VIE. QSPEs are not consolidated. Thedetermination of whether an SPE meets the accounting requirements of a QSPE requires significant judgment,particularly in evaluating whether the permitted activities of the SPE are significantly limited and in determiningwhether derivatives held by the SPE are passive and nonexcessive. In addition, the analysis involved indetermining whether an entity is a VIE, and in determining the primary beneficiary of a VIE, also requiressignificant judgment.
72

Liquidity and Capital Resources.
The Company’s senior management establishes the overall liquidity and capital policies of the Company.Through various risk and control committees, the Company’s senior management reviews business performancerelative to these policies, monitors the availability of alternative sources of financing, and oversees the liquidityand interest rate and currency sensitivity of the Company’s asset and liability position. These committees, alongwith the Company’s Treasury Department and other control groups, also assist in evaluating, monitoring andcontrolling the impact that the Company’s business activities have on its condensed consolidated balance sheet,liquidity and capital structure, thereby helping to ensure that its business activities are integrated with theCompany’s liquidity and capital policies.
The Company’s liquidity and funding risk management policies are designed to mitigate the potential risk thatthe Company may be unable to access adequate financing to service its financial obligations when they come duewithout material, adverse franchise or business impact. The key objectives of the liquidity and funding riskmanagement framework are to support the successful execution of the Company’s business strategies whileensuring ongoing and sufficient liquidity through the business cycle and during periods of financial distress. Theprincipal elements of the Company’s liquidity framework are the cash capital policy, the liquidity reserve andstress testing through the contingency funding plan. Comprehensive financing guidelines (collateralized funding,long-term funding strategy, surplus capacity, diversification, staggered maturities and committed credit facilities)support the Company’s target liquidity profile.
For a more detailed summary of the Company’s Liquidity and Capital Policies and funding sources, includingcommitted credit facilities and off-balance sheet funding, refer to “Management’s Discussion and Analysisof Financial Condition and Results of Operations—Liquidity and Capital Resources” in Part II, Item 7 of theForm 10-K.
The Balance Sheet.
The Company monitors and evaluates the composition and size of its balance sheet. Given the nature of theCompany’s market-making and customer financing activities, the size of the balance sheet fluctuates from timeto time. A substantial portion of the Company’s total assets consists of highly liquid marketable securities andshort-term receivables arising principally from its Institutional Securities sales and trading activities. The highlyliquid nature of these assets provides the Company with flexibility in financing and managing its business.
The Company’s total assets increased to $1,182,061 million at February 28, 2007 from $1,121,192 million atNovember 30, 2006. The increase was primarily due to increases in financial instruments owned (largely drivenby increases in corporate and other debt and corporate equities), securities received as collateral and securitiespurchased under agreements to resell, partially offset by a decrease in securities borrowed. The increases werelargely the result of an increase in client business opportunities.
Balance sheet leverage ratios are one indicator of capital adequacy when viewed in the context of a company’soverall liquidity and capital policies. The Company views the adjusted leverage ratio as a more relevant measureof financial risk when comparing financial services firms and evaluating leverage trends. The Company hasadopted a definition of adjusted assets that excludes certain self-funded assets considered to have minimalmarket, credit and/or liquidity risk. These low-risk assets generally are attributable to the Company’s matchedbook and securities lending businesses. Adjusted assets are calculated by reducing gross assets by aggregateresale agreements and securities borrowed less non-derivative short positions and assets recorded under certainprovisions of SFAS No. 140 and FASB Interpretation No. 46 (revised December 2003), “Consolidation ofVariable Interest Entities” (“FIN 46R”). The adjusted leverage ratio reflects the deduction from shareholders’equity of the amount of equity used to support goodwill and intangible assets (as the Company does not view thisamount of equity as available to support its risk capital needs). In addition, the Company views juniorsubordinated debt issued to capital trusts as a component of its capital base given the inherent characteristics of
73

the securities. These characteristics include the long-dated nature (e.g., some have final maturity at issuance of 30years extendible at the Company’s option by a further 19 years, others have a 60-year final maturity at issuance),the Company’s ability to defer coupon interest for up to 20 consecutive quarters and the subordinated nature ofthe obligations in the capital structure. The Company also receives rating agency equity credit for thesesecurities.
The following table sets forth the Company’s total assets, adjusted assets and leverage ratios as of February 28,2007 and November 30, 2006 and for the average month-end balances during the quarter ended February 28,2007:
Balance at Average Month-End Balance
February 28,2007
November 30,2006
For the QuarterEnded February 28, 2007
(dollars in millions, except ratio data)
Total assets . . . . . . . . . . . . . . . . . . . . . . . . . . . . . . . . . . . . . $1,182,061 $1,121,192 $1,166,926Less: Securities purchased under agreements to resell . . . (192,038) (174,866) (188,409)
Securities borrowed . . . . . . . . . . . . . . . . . . . . . . . . . (277,093) (299,631) (294,859)Add: Financial instruments sold, not yet purchased . . . . . 157,807 183,119 165,189Less: Derivative contracts sold, not yet purchased . . . . . . (51,574) (57,491) (52,523)
Subtotal . . . . . . . . . . . . . . . . . . . . . . . . . . . . . . . . 819,163 772,323 796,324Less: Segregated customer cash and securities
balances . . . . . . . . . . . . . . . . . . . . . . . . . . . . . . . . . . . . . (21,264) (16,782) (18,640)Assets recorded under certain provisions of SFAS
No. 140 and FIN 46R . . . . . . . . . . . . . . . . . . . . . . . (124,163) (100,236) (113,151)Goodwill and net intangible assets(1) . . . . . . . . . . . . (4,262) (3,443) (4,045)
Adjusted assets . . . . . . . . . . . . . . . . . . . . . . . . . . . . . . . . . . $ 669,474 $ 651,862 $ 660,488
Common equity . . . . . . . . . . . . . . . . . . . . . . . . . . . . . . . . . $ 36,854 $ 34,264 35,516Preferred equity . . . . . . . . . . . . . . . . . . . . . . . . . . . . . . . . . 1,100 1,100 1,100
Shareholders’ equity . . . . . . . . . . . . . . . . . . . . . . . . . . . . . . 37,954 35,364 36,616Junior subordinated debt issued to capital trusts . . . . . . . . 4,885 4,884 4,884
Subtotal . . . . . . . . . . . . . . . . . . . . . . . . . . . . . . . . 42,839 40,248 41,500Less: Goodwill and net intangible assets(1) . . . . . . . . . . . . (4,262) (3,443) (4,045)
Tangible shareholders’ equity . . . . . . . . . . . . . . . . . . . . . . $ 38,577 $ 36,805 $ 37,455
Leverage ratio(2) . . . . . . . . . . . . . . . . . . . . . . . . . . . . . . . . 30.6x 30.5x 31.2x
Adjusted leverage ratio(3) . . . . . . . . . . . . . . . . . . . . . . . . . 17.4x 17.7x 17.6x
(1) Effective December 1, 2006, mortgage servicing rights have been included in net intangible assets. Amounts as of November 30, 2006have been reclassified to conform with the current presentation.
(2) Leverage ratio equals total assets divided by tangible shareholders’ equity.(3) Adjusted leverage ratio equals adjusted assets divided by tangible shareholders’ equity.
Activity in the Quarter Ended February 28, 2007.
The Company’s total capital consists of shareholders’ equity, long-term borrowings (debt obligations scheduledto mature in more than 12 months) and junior subordinated debt issued to capital trusts. At February 28, 2007,total capital was $177,270 million, an increase of $15,136 million from November 30, 2006. The Companyredeemed all $66 million of its outstanding Capital Units on February 28, 2007.
During the quarter ended February 28, 2007, the Company issued senior notes with a carrying value at quarter-end aggregating $22.2 billion, including non-U.S. dollar currency notes aggregating $10.3 billion. In connection
74

with the note issuances, the Company has entered into certain transactions to obtain floating interest rates basedprimarily on short-term London Interbank Offered Rates (“LIBOR”) trading levels. At February 28, 2007, theaggregate outstanding principal amount of the Company’s Senior Indebtedness (as defined in the Company’ssenior debt indentures) was approximately $186 billion (including guaranteed obligations of the indebtedness ofsubsidiaries). The weighted average maturity of the Company’s long-term borrowings, based upon statedmaturity dates, was approximately 5.5 years at February 28, 2007.
During the quarter ended February 28, 2007, the Company purchased approximately $1.2 billion of its commonstock (approximately 15 million shares) through open market purchases at an average cost of $82.02 (see also“Unregistered Sales of Equity Securities and Use of Proceeds” in Part II, Item 2). In December 2006, theCompany announced that its Board of Directors had authorized the repurchase of up to $6 billion of theCompany’s outstanding common stock. This share repurchase authorization replaces the Company’s previousrepurchase authorizations with one repurchase program for capital management purposes that will consider,among other things, business segment capital needs, as well as equity-based compensation and benefit planrequirements. The Company expects to exercise the authorization over 12-18 months at prices the Companydeems appropriate, subject to its unallocated capital position, market conditions and regulatory considerations.
Economic Capital.
The Company uses an economic capital model to determine the amount of equity capital needed to support therisk of its business activities and to ensure that the Company remains adequately capitalized. The Companycalculates economic capital on a going-concern basis, which is defined as the amount of capital needed to run thebusiness through the business cycle and satisfy the requirements of regulators, rating agencies and the market.Business unit economic capital allocations are evaluated by benchmarking to similarly rated peer firms bybusiness segment. The Company believes this methodology provides an indication of the appropriate level ofcapital for each business segment as if each were an independent operating entity.
Economic capital requirements are allocated to each business segment and are sub-allocated to product lines asappropriate. This process is intended to align equity capital with the risks in each business, provide businessmanagers with tools for measuring and managing risk, and allow senior management to evaluate risk-adjustedreturns (such as return on economic capital and shareholder value added) to facilitate resource allocationdecisions.
The Company’s methodology is based on a going-concern approach that assigns equity to each business unitbased on regulatory capital usage plus additional capital for stress losses, including principal investment risk.Regulatory capital, including additional capital assigned for goodwill and intangible assets, is a minimumrequirement to ensure the Company’s access to funding and credibility in the market. The Company believes itmust be able to sustain stress losses and maintain capital substantially above regulatory minimums whilesupporting ongoing business activities. The difference between the Company’s consolidated book equity andaggregate equity requirements denotes the Company’s unallocated capital position, which is not currentlyreflected in business segment performance metrics.
The Company assesses stress loss capital across various dimensions of market, credit, business and operationalrisks. Stress losses are defined at the 90% to 95% confidence interval in order to capture worst potential losses in10 to 20 years. Stress loss calculations are tangible and transparent and avoid reliance on extreme loss statisticalmodels.
Market risk scenarios capture systematic, idiosyncratic and random market risk through the use of internalmarket stress data. Credit risk is included in the form of idiosyncratic counterparty default events. Business riskincorporates earnings volatility due to variability in revenue flows, with estimates on the mix of fixed versusvariable expenses at various points in the business cycle. Operational stress losses primarily reflect legal riskacross the Company.
75
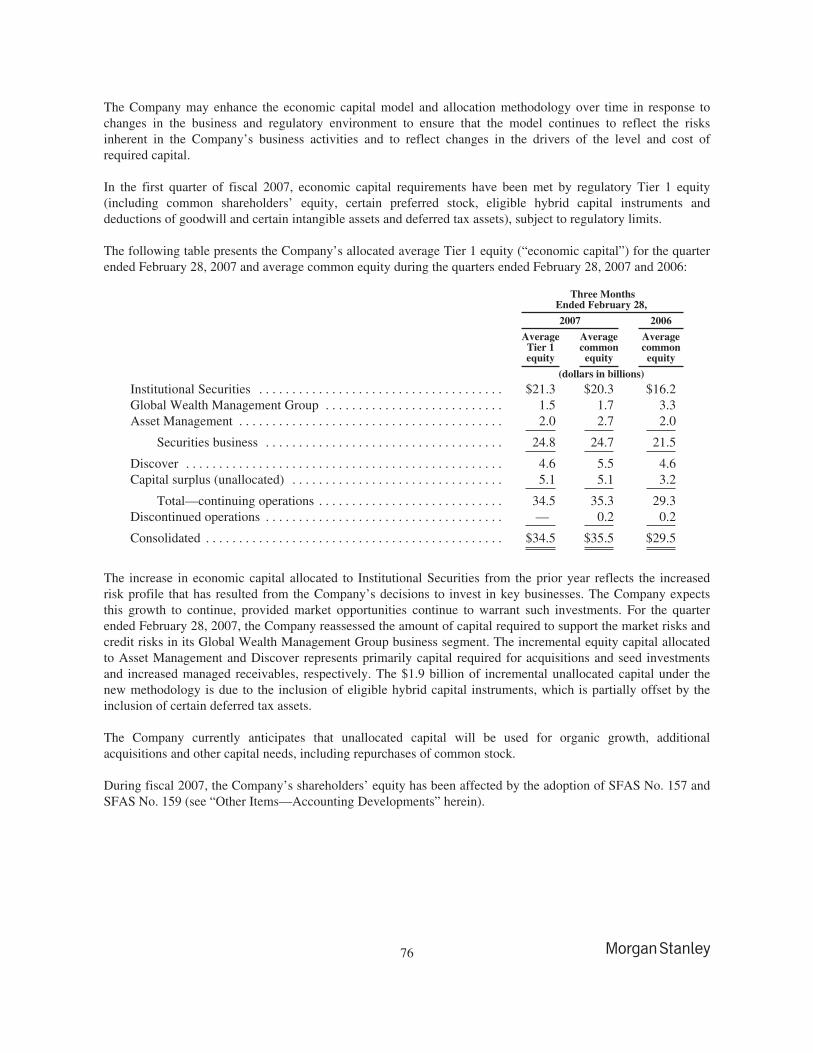
The Company may enhance the economic capital model and allocation methodology over time in response tochanges in the business and regulatory environment to ensure that the model continues to reflect the risksinherent in the Company’s business activities and to reflect changes in the drivers of the level and cost ofrequired capital.
In the first quarter of fiscal 2007, economic capital requirements have been met by regulatory Tier 1 equity(including common shareholders’ equity, certain preferred stock, eligible hybrid capital instruments anddeductions of goodwill and certain intangible assets and deferred tax assets), subject to regulatory limits.
The following table presents the Company’s allocated average Tier 1 equity (“economic capital”) for the quarterended February 28, 2007 and average common equity during the quarters ended February 28, 2007 and 2006:
Three MonthsEnded February 28,
2007 2006
AverageTier 1equity
Averagecommonequity
Averagecommonequity
(dollars in billions)
Institutional Securities . . . . . . . . . . . . . . . . . . . . . . . . . . . . . . . . . . . . . $21.3 $20.3 $16.2Global Wealth Management Group . . . . . . . . . . . . . . . . . . . . . . . . . . . 1.5 1.7 3.3Asset Management . . . . . . . . . . . . . . . . . . . . . . . . . . . . . . . . . . . . . . . . 2.0 2.7 2.0
Securities business . . . . . . . . . . . . . . . . . . . . . . . . . . . . . . . . . . . . 24.8 24.7 21.5
Discover . . . . . . . . . . . . . . . . . . . . . . . . . . . . . . . . . . . . . . . . . . . . . . . . 4.6 5.5 4.6Capital surplus (unallocated) . . . . . . . . . . . . . . . . . . . . . . . . . . . . . . . . 5.1 5.1 3.2
Total—continuing operations . . . . . . . . . . . . . . . . . . . . . . . . . . . . 34.5 35.3 29.3Discontinued operations . . . . . . . . . . . . . . . . . . . . . . . . . . . . . . . . . . . . — 0.2 0.2
Consolidated . . . . . . . . . . . . . . . . . . . . . . . . . . . . . . . . . . . . . . . . . . . . . $34.5 $35.5 $29.5
The increase in economic capital allocated to Institutional Securities from the prior year reflects the increasedrisk profile that has resulted from the Company’s decisions to invest in key businesses. The Company expectsthis growth to continue, provided market opportunities continue to warrant such investments. For the quarterended February 28, 2007, the Company reassessed the amount of capital required to support the market risks andcredit risks in its Global Wealth Management Group business segment. The incremental equity capital allocatedto Asset Management and Discover represents primarily capital required for acquisitions and seed investmentsand increased managed receivables, respectively. The $1.9 billion of incremental unallocated capital under thenew methodology is due to the inclusion of eligible hybrid capital instruments, which is partially offset by theinclusion of certain deferred tax assets.
The Company currently anticipates that unallocated capital will be used for organic growth, additionalacquisitions and other capital needs, including repurchases of common stock.
During fiscal 2007, the Company’s shareholders’ equity has been affected by the adoption of SFAS No. 157 andSFAS No. 159 (see “Other Items—Accounting Developments” herein).
76

Liquidity Management Policies.
The primary goal of the Company’s liquidity and funding activities is to ensure adequate financing over a widerange of potential credit ratings and market environments. Given the highly liquid nature of the Company’sbalance sheet, day-to-day funding requirements are largely fulfilled through the use of stable collateralizedfinancing. The Company has centralized management of credit-sensitive unsecured funding sources in theTreasury Department. In order to meet target liquidity requirements and withstand an unforeseen contraction incredit availability, the Company has designed a liquidity management framework.
Liquidity ManagementFramework: Designed to:
Contingency FundingPlan
Ascertain the Company’s ability to manage a prolonged liquidity contraction andprovide a course of action over a one-year time period to ensure orderly functioningof the businesses. The contingency funding plan sets forth the process and theinternal and external communication flows necessary to ensure effectivemanagement of the contingency event. Analytical processes exist to periodicallyevaluate and report the liquidity risk exposures of the organization undermanagement-defined scenarios.
Cash Capital Ensure that the Company can fund its balance sheet while repaying its financialobligations maturing within one year without issuing new unsecured debt. TheCompany attempts to achieve this by maintaining sufficient cash capital (long-termdebt and equity capital) to finance illiquid assets and the portion of its securitiesinventory that is not expected to be financed on a secured basis in a credit-stressedenvironment.
Liquidity Reserve Maintain, at all times, a liquidity reserve composed of immediately available cashand cash equivalents and a pool of unencumbered securities that can be sold orpledged to provide same-day liquidity to the Company. The reserve is periodicallyassessed and determined based on day-to-day funding requirements and strategicliquidity targets. The liquidity reserve averaged approximately $52 billion for thequarter ended February 28, 2007, of which approximately $46 billion on averagewas held at the parent company.
Liquidity Reserve.
The Company seeks to maintain a target liquidity reserve that is sized to cover daily funding needs and to meetstrategic liquidity targets, including coverage of a significant portion of expected cash outflows over a short-termhorizon in a potential liquidity crisis. This liquidity reserve is held in the form of cash deposits with banks and apool of unencumbered securities. The Company manages the pool of unencumbered securities, against whichfunding can be raised, on a global basis, and securities for the pool are chosen accordingly. The U.S. andnon-U.S. components, held in the form of a reverse repurchase agreement at the parent company, consist of U.S.and European government bonds and other high-quality collateral and at February 28, 2007 were approximately$49 billion and averaged approximately $38 billion for the quarter ended February 28, 2007. The parent companycash component of the liquidity reserve at February 28, 2007 was approximately $3 billion and averagedapproximately $8 billion for the quarter ended February 28, 2007. The Company believes that diversifying theform in which its liquidity reserve (cash and securities) is maintained enhances its ability to quickly andefficiently source funding in a stressed environment. The Company’s funding requirements and target liquidityreserve may vary based on changes in the level and composition of its balance sheet, timing of specifictransactions, client financing activity, market conditions and seasonal factors.
77

Credit Ratings.
The Company’s reliance on external sources to finance a significant portion of its day-to-day operations makesaccess to global sources of financing important. The cost and availability of unsecured financing generally aredependent on the Company’s short-term and long-term credit ratings. Factors that are significant to thedetermination of the Company’s credit ratings or that otherwise affect its ability to raise short-term and long-termfinancing include the Company’s level and volatility of earnings, relative positions in the markets in which itoperates, geographic and product diversification, retention of key personnel, risk profile, risk managementpolicies, cash liquidity, capital structure, corporate lending credit risk, and legal and regulatory developments. Inaddition, continuing consolidation in the credit card industry presents Discover with stronger competitors thatmay challenge future growth. A deterioration in any of the previously mentioned factors or combination of thesefactors may lead rating agencies to downgrade the credit ratings of the Company, thereby increasing the cost tothe Company in obtaining unsecured funding. In addition, the Company’s debt ratings can have a significantimpact on certain trading revenues, particularly in those businesses where longer term counterparty performanceis critical, such as OTC derivative transactions, including credit derivatives and interest rate swaps.
In connection with certain OTC trading agreements and certain other agreements associated with the InstitutionalSecurities business, the Company would be required to provide additional collateral to certain counterparties inthe event of a downgrade by either Moody’s Investors Service or Standard & Poor’s. At February 28, 2007, theamount of additional collateral that would be required in the event of a one-notch downgrade of the Company’ssenior debt credit rating was approximately $643 million. Of this amount, $554 million relates to bilateralarrangements between the Company and other parties where upon the downgrade of one party, the downgradedparty must deliver incremental collateral to the other. These bilateral downgrade arrangements are a riskmanagement tool used extensively by the Company as credit exposures are reduced if counterparties aredowngraded.
As of March 31, 2007, the Company’s credit ratings were as follows:
CommercialPaper
SeniorDebt
Dominion Bond Rating Service Limited . . . . . . . . . . . . . . . . . . . . . . . . . . . . . . . . . . . . R-1 (middle) AA (low)Fitch Ratings(1) . . . . . . . . . . . . . . . . . . . . . . . . . . . . . . . . . . . . . . . . . . . . . . . . . . . . . . . F1+ AA-Moody’s Investors Service . . . . . . . . . . . . . . . . . . . . . . . . . . . . . . . . . . . . . . . . . . . . . . . P-1 Aa3Rating and Investment Information, Inc. . . . . . . . . . . . . . . . . . . . . . . . . . . . . . . . . . . . . a-1+ AAStandard & Poor’s(2) . . . . . . . . . . . . . . . . . . . . . . . . . . . . . . . . . . . . . . . . . . . . . . . . . . . A-1 A+
(1) On December 19, 2006, Fitch Ratings changed the outlook on the Company’s senior debt ratings from Stable to Negative.(2) On October 27, 2006, Standard & Poor’s changed the outlook on the Company’s senior debt ratings from Stable to Positive.
78

Commitments.
The Company’s commitments associated with outstanding letters of credit, other financial guarantees, investmentactivities, and corporate lending and financing commitments as of February 28, 2007 are summarized below byperiod of expiration. Since commitments associated with letters of credit, other financial guarantees, andcorporate lending and financing arrangements may expire unused, the amounts shown do not necessarily reflectthe actual future cash funding requirements:
Years to Maturity
TotalLess
than 1 1-3 3-5 Over 5
(dollars in millions)
Letters of credit and other financial guarantees(1) . . . . . . . . $ 7,164 $ 38 $ — $ — $ 7,202Investment activities . . . . . . . . . . . . . . . . . . . . . . . . . . . . . . . . 403 305 8 184 900Investment grade corporate lending commitments(2) . . . . . . 5,174 5,836 18,638 5,077 34,725Non-investment grade corporate lending commitments(2) . . 7,144 2,096 3,237 11,864 24,341Commitments for secured lending transactions(3) . . . . . . . . 11,658 6,854 33 2,646 21,191Commitments to purchase mortgage loans(4) . . . . . . . . . . . . 1,889 — — — 1,889Commitments to originate mortgage loans(5) . . . . . . . . . . . . 901 — — — 901Other commitments(6) . . . . . . . . . . . . . . . . . . . . . . . . . . . . . . 279 303 2 — 584
Total(7) . . . . . . . . . . . . . . . . . . . . . . . . . . . . . . . . . . . . . . $34,612 $15,432 $21,918 $19,771 $91,733
(1) This amount represents the Company’s outstanding letters of credit and other financial guarantees, which are primarily used to satisfyvarious collateral requirements.
(2) The Company’s investment grade and non-investment grade primary and secondary lending commitments are made in connection withcorporate lending and other business activities. Credit ratings for primary commitments are determined by the Company’s InstitutionalCredit Department using methodologies generally consistent with those employed by external rating agencies. Credit ratings of BB+ orlower are considered non-investment grade.
(3) This amount represents lending commitments extended by the Company to companies that are secured by assets of the borrower. Loansmade under these arrangements typically are at variable rates and generally provide for over-collateralization based upon thecreditworthiness of the borrower.
(4) This amount represents the Company’s forward purchase contracts involving mortgage loans.(5) This amount represents residential mortgage loan commitments to individuals.(6) This amount includes commercial loan commitments to small businesses and commitments related to securities-based lending activities.(7) See Note 8 to the condensed consolidated financial statements.
As of February 28, 2007, the Company had commitments for secured lending transactions to subprime lenders of$5.2 billion, of which $2.3 billion was funded and fully collateralized. The unfunded commitments were $2.9billion, which is included within commitments for secured lending transactions in the table above. As ofMarch 31, 2007, the amount that was funded and fully collateralized to subprime lenders was $2.5 billion, andthe amount of the unfunded commitments was $1.1 billion.
The table above does not include commitments to extend credit for consumer loans of approximately $273billion. Such commitments arise primarily from agreements with customers for unused lines of credit on certaincredit cards, provided there is no violation of conditions established in the related agreement. Thesecommitments, substantially all of which the Company can terminate at any time and which do not necessarilyrepresent future cash requirements, are periodically reviewed based on account usage and customercreditworthiness. In addition, in the ordinary course of business, the Company guarantees the debt and/or certaintrading obligations (including obligations associated with derivatives, foreign exchange contracts and thesettlement of physical commodities) of certain subsidiaries. These guarantees generally are entity or productspecific and are required by investors or trading counterparties. The activities of the subsidiaries covered by theseguarantees (including any related debt or trading obligations) are included in the Company’s condensedconsolidated financial statements.
79

At February 28, 2007, the Company had commitments to enter into reverse repurchase and repurchaseagreements of approximately $129 billion and $101 billion, respectively.
Principal Investments.
Principal investing activities are capital investments in companies, generally for proprietary purposes, tomaximize total returns to the Company. The Company has committed to increasing its principal investingactivity. At February 28, 2007, the Company had aggregate principal investments with a carrying value ofapproximately $2.4 billion, which are included within Other assets in the condensed consolidated statement offinancial condition.
Regulatory Requirements.
Effective December 1, 2005, the Company became a consolidated supervised entity (“CSE”) as defined by theSEC. As such, the Company is subject to group-wide supervision and examination by the SEC and to minimumcapital requirements on a consolidated basis. As of February 28, 2007, the Company was in compliance with theCSE capital requirements.
80
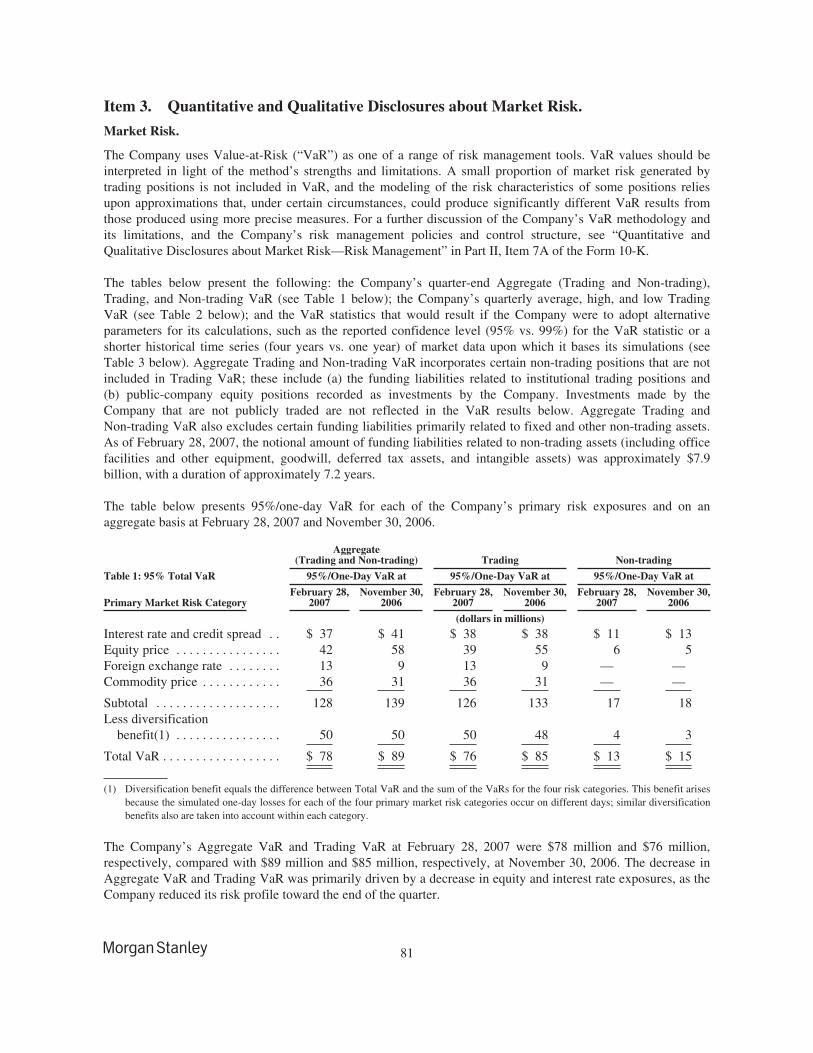
Item 3. Quantitative and Qualitative Disclosures about Market Risk.
Market Risk.
The Company uses Value-at-Risk (“VaR”) as one of a range of risk management tools. VaR values should beinterpreted in light of the method’s strengths and limitations. A small proportion of market risk generated bytrading positions is not included in VaR, and the modeling of the risk characteristics of some positions reliesupon approximations that, under certain circumstances, could produce significantly different VaR results fromthose produced using more precise measures. For a further discussion of the Company’s VaR methodology andits limitations, and the Company’s risk management policies and control structure, see “Quantitative andQualitative Disclosures about Market Risk—Risk Management” in Part II, Item 7A of the Form 10-K.
The tables below present the following: the Company’s quarter-end Aggregate (Trading and Non-trading),Trading, and Non-trading VaR (see Table 1 below); the Company’s quarterly average, high, and low TradingVaR (see Table 2 below); and the VaR statistics that would result if the Company were to adopt alternativeparameters for its calculations, such as the reported confidence level (95% vs. 99%) for the VaR statistic or ashorter historical time series (four years vs. one year) of market data upon which it bases its simulations (seeTable 3 below). Aggregate Trading and Non-trading VaR incorporates certain non-trading positions that are notincluded in Trading VaR; these include (a) the funding liabilities related to institutional trading positions and(b) public-company equity positions recorded as investments by the Company. Investments made by theCompany that are not publicly traded are not reflected in the VaR results below. Aggregate Trading andNon-trading VaR also excludes certain funding liabilities primarily related to fixed and other non-trading assets.As of February 28, 2007, the notional amount of funding liabilities related to non-trading assets (including officefacilities and other equipment, goodwill, deferred tax assets, and intangible assets) was approximately $7.9billion, with a duration of approximately 7.2 years.
The table below presents 95%/one-day VaR for each of the Company’s primary risk exposures and on anaggregate basis at February 28, 2007 and November 30, 2006.
Aggregate(Trading and Non-trading) Trading Non-trading
Table 1: 95% Total VaR 95%/One-Day VaR at 95%/One-Day VaR at 95%/One-Day VaR at
Primary Market Risk CategoryFebruary 28,
2007November 30,
2006February 28,
2007November 30,
2006February 28,
2007November 30,
2006
(dollars in millions)
Interest rate and credit spread . . $ 37 $ 41 $ 38 $ 38 $ 11 $ 13Equity price . . . . . . . . . . . . . . . . 42 58 39 55 6 5Foreign exchange rate . . . . . . . . 13 9 13 9 — —Commodity price . . . . . . . . . . . . 36 31 36 31 — —
Subtotal . . . . . . . . . . . . . . . . . . . 128 139 126 133 17 18Less diversification
benefit(1) . . . . . . . . . . . . . . . . 50 50 50 48 4 3
Total VaR . . . . . . . . . . . . . . . . . . $ 78 $ 89 $ 76 $ 85 $ 13 $ 15
(1) Diversification benefit equals the difference between Total VaR and the sum of the VaRs for the four risk categories. This benefit arisesbecause the simulated one-day losses for each of the four primary market risk categories occur on different days; similar diversificationbenefits also are taken into account within each category.
The Company’s Aggregate VaR and Trading VaR at February 28, 2007 were $78 million and $76 million,respectively, compared with $89 million and $85 million, respectively, at November 30, 2006. The decrease inAggregate VaR and Trading VaR was primarily driven by a decrease in equity and interest rate exposures, as theCompany reduced its risk profile toward the end of the quarter.
81

The Company views average Trading VaR over a period of time as more representative of trends in the businessthan VaR at any single point in time. Table 2 below, which presents the high, low and average 95%/one-dayTrading VaR during the quarters ended February 28, 2007 and November 30, 2006, represents substantially all ofthe Company’s trading activities. Certain market risks included in the year-end Aggregate VaR discussed aboveare excluded from these measures (e.g., equity price risk in public company equity positions recorded asinvestments by the Company and certain funding liabilities related to trading positions).
Average Trading VaR for the quarter ended February 28, 2007 increased to $90 million from $61 million for thequarter ended November 30, 2006, reflecting increases in all primary market risk categories. The increase inequity price VaR was predominately driven by increased exposure to equity products. The increase in commodityprice VaR was predominately driven by increased exposure to gas and electricity products. The increase ininterest rate and credit spread VaR was predominately driven by increased exposure to interest rate sensitiveproducts. The increase in foreign exchange rate VaR was predominately driven by increased directional exposureto foreign currencies.
Table 2: 95% High/Low/Average Trading VaR Daily 95%/One-Day VaRfor the Quarter Ended
February 28, 2007
Daily 95%/One-Day VaRfor the Quarter Ended
November 30, 2006
Primary Market Risk Category High Low Average High Low Average
(dollars in millions)
Interest rate and credit spread . . . . . . . . . . . . . . . . . . . . . . . . . . . $46 $36 $39 $40 $29 $34Equity price . . . . . . . . . . . . . . . . . . . . . . . . . . . . . . . . . . . . . . . . . 53 37 45 55 24 32Foreign exchange rate . . . . . . . . . . . . . . . . . . . . . . . . . . . . . . . . . 19 10 15 23 8 12Commodity price . . . . . . . . . . . . . . . . . . . . . . . . . . . . . . . . . . . . 48 28 40 35 26 30Trading VaR . . . . . . . . . . . . . . . . . . . . . . . . . . . . . . . . . . . . . . . . $99 $76 $90 $85 $49 $61
VaR Statistics Under Varying Assumptions.
VaR statistics are not readily comparable across firms because of differences in the breadth of products includedin each firm’s VaR model, in the statistical assumptions made when simulating changes in market factors, and inthe methods used to approximate portfolio revaluations under the simulated market conditions. These differencescan result in materially different VaR estimates for similar portfolios. As a result, VaR statistics are more reliableand relevant when used as indicators of trends in risk taking within a firm rather than as a basis for inferringdifferences in risk taking across firms. Table 3 below presents the VaR statistics that would result if theCompany were to adopt alternative parameters for its calculations, such as the reported confidence level (95%versus 99%) for the VaR statistic or a shorter historical time series (four years versus one year) for market dataupon which it bases its simulations:
Table 3: Average 95% and 99% Trading VaR withFour-Year/One-Year Historical Time Series
Average 95%/One-Day VaRfor the Quarter Ended
February 28, 2007
Average 99%/One-Day VaRfor the Quarter Ended
February 28, 2007
Primary Market Risk CategoryFour-Year
Factor HistoryOne-Year
Factor HistoryFour-Year
Factor HistoryOne-Year
Factor History
(dollars in millions)
Interest rate and credit spread . . . . . . . . . . . . . . . . . $39 $ 32 $ 65 $ 51Equity price . . . . . . . . . . . . . . . . . . . . . . . . . . . . . . . 45 57 69 103Foreign exchange rate . . . . . . . . . . . . . . . . . . . . . . . 15 17 22 28Commodity price . . . . . . . . . . . . . . . . . . . . . . . . . . . 40 45 61 59Trading VaR . . . . . . . . . . . . . . . . . . . . . . . . . . . . . . $90 $101 $137 $146
In addition, if the Company were to report Trading VaR (using a four-year historical time series) with respect toa 10-day holding period, the Company’s 95% and 99% Average Trading VaR for the quarter ended February 28,2007 would have been $284 million and $433 million, respectively.
82

Distribution of VaR Statistics and Net Revenues for the quarter ended February 28, 2007.
As shown in Table 2 above, the Company’s average 95%/one-day Trading VaR for the quarter endedFebruary 28, 2007 was $90 million. The histogram below presents the distribution of the Company’s daily 95%/one-day Trading VaR for the quarter ended February 28, 2007. The most frequently occurring value was between$87 million and $96 million, while for approximately 83% of trading days during the quarter, VaR rangedbetween $78 million and $96 million.
Daily 95%/One-day Trading VaR(dollars in millions)
0
2
4
6
8
10
12
14
16
75
to
78
78
to
81
81
to
84
84
to
87
87
to
90
90
to
93
93
to
96
96
to
99
Nu
mb
er o
f D
ays
83

One method of evaluating the reasonableness of the Company’s VaR model as a measure of the Company’spotential volatility of net revenue is to compare the VaR with actual trading revenue. Assuming no intra-daytrading, for a 95%/one-day VaR, the expected number of times that trading losses should exceed VaR during thefiscal year is 13, and, in general, if trading losses were to exceed VaR more than 21 times in a year, the accuracyof the VaR model could be questioned. Accordingly, the Company evaluates the reasonableness of its VaRmodel by comparing the potential declines in portfolio values generated by the model with actual trading results.The histogram below shows the distribution of daily net revenue during the quarter ended February 28, 2007 forthe Company’s trading businesses (including net interest and non-agency commissions but excluding primary,fee-based and prime brokerage revenue credited to the trading businesses). There were no days during the quarterended February 28, 2007 in which the Company incurred daily trading losses in excess of the 95%/one-dayTrading VaR. Additionally, there were no days during the quarter where the largest one-day loss exceeded thelowest 95% One-day Aggregate Trading VaR reported in Table 2 above.
Daily Net Trading Revenue(excluding primary revenue)
(dollars in millions)
0
1
2
3
4
5
6
7
8
9
Gain(Loss)
Nu
mb
er o
f D
ays
-15
to -
10-1
0 to
-5
-5 t
o 0
0 to
55
to 1
010
to
1515
to
2020
to
2525
to
3030
to
3535
to
4040
to
4545
to
5050
to
5555
to
6060
to
6565
to
7070
to
7575
to
8080
to
8585
to
9090
to
9595
to
100
100
to 1
0510
5 to
110
110
to 1
1511
5 to
120
120
to 1
2512
5 to
130
130
to 1
3513
5 to
140
140
to 1
4514
5 to
150
150
to 1
5515
5 to
160
160
to 1
65>
165
As of February 28, 2007, interest rate risk exposure associated with the Company’s consumer lending activities,included within Discover, as measured by the reduction in pre-tax income resulting from a hypothetical,immediate 100 basis point increase in interest rates, had not changed significantly from November 30, 2006.
Credit Risk.
For a further discussion of the Company’s credit risks, see “Quantitative and Qualitative Disclosures aboutMarket Risks—Credit Risk” in Part II, Item 7A of the Form 10-K.
Credit Exposure-Corporate Lending. In connection with certain of its Institutional Securities businessactivities, the Company provides loans or lending commitments (including bridge financing) to selected clients.The borrowers may be rated investment grade or non-investment grade. These loans and commitments havevarying terms, may be senior or subordinated, may be secured or unsecured, are generally contingent uponrepresentations, warranties and contractual conditions applicable to the borrower, and may be syndicated ortraded by the Company. At February 28, 2007 and November 30, 2006, the aggregate value of primaryinvestment grade loans and financial accommodations was $6.2 billion and $6.4 billion, respectively, and theaggregate value of primary non-investment grade loans and positions was $3.9 billion and $3.4 billion,respectively. At February 28, 2007 and November 30, 2006, the aggregate value of primary lending
84

commitments outstanding was $53.2 billion and $49.2 billion, respectively. In connection with these businessactivities (which include corporate funded loans and lending commitments), the Company had hedges with anotional amount of $29.9 billion and $26.5 billion at February 28, 2007 and November 30, 2006, respectively,including both internal and external hedges utilized by the lending business. The table below shows theCompany’s credit exposure from its corporate lending positions and commitments as of February 28, 2007. Sincecommitments associated with these business activities may expire unused, they do not necessarily reflect theactual future cash funding requirements:
Corporate Lending Commitments and Funded Loans
Years to Maturity Total CorporateLending
Exposure(2)Corporate
LoansCredit Rating(1) Less than 1 1-3 3-5 Over 5
(dollars in millions)
AAA . . . . . . . . . . . . . . . . . . . . . . . . . . . . . . $ 371 $ — $ 268 $ — $ 639 $ —AA . . . . . . . . . . . . . . . . . . . . . . . . . . . . . . . 2,802 2,103 2,402 815 8,122 1,155A . . . . . . . . . . . . . . . . . . . . . . . . . . . . . . . . . 1,363 2,519 6,601 1,024 11,507 294BBB . . . . . . . . . . . . . . . . . . . . . . . . . . . . . . 2,015 2,696 10,387 1,173 16,271 4,749Non-investment grade . . . . . . . . . . . . . . . . 7,794 2,658 3,570 12,753 26,775 3,930
Total . . . . . . . . . . . . . . . . . . . . . . . . . . $14,345 $9,976 $23,228 $15,765 $63,314 $10,128
Notional amount of hedges owned . . . . . . . $29,856
(1) Obligor credit ratings are determined by Institutional Credit using methodologies generally consistent with those employed by externalrating agencies.
(2) Total corporate lending exposure includes both primary lending commitments and funded loans.
Credit Exposure-Derivatives. The table below presents a summary by counterparty credit rating and remainingcontract maturity of the fair value of OTC derivatives in a gain position at February 28, 2007. Fair valuerepresents the risk reduction arising from master netting agreements, where applicable, and, in the final column,net of collateral received (principally cash and U.S. government and agency securities):
OTC Derivative Products—Financial Instruments Owned(1)
Years to Maturity
Cross-Maturityand CashCollateralNetting(3)
Net ExposurePost-CashCollateral
Net ExposurePost-
CollateralCredit Rating(2) Less than 1 1-3 3-5 Over 5
(dollars in millions)
AAA . . . . . . . . . . . . . . $ 1,443 $ 930 $ 855 $ 2,673 $ (1,970) $ 3,931 3,875AA . . . . . . . . . . . . . . . 6,525 5,005 4,736 14,126 (16,959) 13,433 12,426A . . . . . . . . . . . . . . . . . 3,358 2,509 2,126 5,941 (6,696) 7,238 6,355BBB . . . . . . . . . . . . . . 2,014 2,079 2,722 1,689 (2,389) 6,115 4,355Non-investment
grade . . . . . . . . . . . . 2,973 1,797 2,551 2,307 (3,379) 6,249 3,183Unrated(4) . . . . . . . . . 688 666 172 510 (496) 1,540 342
Total . . . . . . . . . . $17,001 $12,986 $13,162 $27,246 $(31,889) $38,506 $30,536
(1) Fair values shown present the Company’s exposure to counterparties related to the Company’s OTC derivative products. The table doesnot include the effect of any related hedges utilized by the Company. The table also excludes fair values corresponding to other creditexposures, such as those arising from the Company’s lending activities.
(2) Obligor credit ratings are determined by Institutional Credit using methodologies generally consistent with those employed by externalrating agencies.
(3) Amounts represent the netting of receivable balances with payable balances for the same counterparty across maturity categories.Receivable and payable balances with the same counterparty in the same maturity category are netted within such maturity category,where appropriate. Cash collateral received is netted on a counterparty basis, provided legal right of offset exists.
85

(4) In lieu of making an individual assessment of the creditworthiness of unrated companies, the Company makes a determination that thecollateral held with respect to such obligations is sufficient to cover a substantial portion of its exposure. In making this determination,the Company takes into account various factors, including legal uncertainties and market volatility.
The following tables summarize the fair values of the Company’s OTC derivative products recorded in Financialinstruments owned and Financial instruments sold, not yet purchased by product category and maturity atFebruary 28, 2007, including on a net basis, where applicable, reflecting the fair value of related non-cashcollateral for financial instruments owned:
OTC Derivative Products—Financial Instruments Owned
Years to Maturity
Cross-Maturityand CashCollateralNetting(1)
Net ExposurePost-CashCollateral
Net ExposurePost-
CollateralProduct Type Less than 1 1-3 3-5 Over 5
(dollars in millions)
Interest rate and currencyswaps, interest rateoptions, credit derivativesand other fixed incomesecurities contracts . . . . . . $ 4,129 $ 5,132 $ 8,172 $25,413 $(23,606) $19,240 $16,165
Foreign exchange forwardcontracts and options . . . . 4,215 698 78 8 (645) 4,354 3,714
Equity securities contracts(including equity swaps,warrants and options) . . . . 3,761 2,447 743 238 (2,535) 4,654 2,449
Commodity forwards,options and swaps . . . . . . 4,896 4,709 4,169 1,587 (5,103) 10,258 8,208
Total . . . . . . . . . . . . . . . $17,001 $12,986 $13,162 $27,246 $(31,889) $38,506 $30,536
(1) Amounts represent the netting of receivable balances with payable balances for the same counterparty across maturity and productcategories. Receivable and payable balances with the same counterparty in the same maturity category are netted within the maturitycategory, where appropriate. Cash collateral received is netted on a counterparty basis, provided legal right of offset exists.
OTC Derivative Products—Financial Instruments Sold, Not Yet Purchased(1)
Years to Maturity
Cross-Maturityand CashCollateralNetting(2) TotalProduct Type Less than 1 1-3 3-5 Over 5
(dollars in millions)
Interest rate and currency swaps, interestrate options, credit derivatives and otherfixed income securities contracts . . . . . . $ 4,529 $ 5,261 $ 6,915 $16,269 $(19,779) $13,195
Foreign exchange forward contracts andoptions . . . . . . . . . . . . . . . . . . . . . . . . . . 4,667 502 77 24 (659) 4,611
Equity securities contracts (includingequity swaps, warrants and options) . . . . 3,889 3,006 1,876 688 (1,434) 8,025
Commodity forwards, options andswaps . . . . . . . . . . . . . . . . . . . . . . . . . . . 6,941 5,086 1,430 1,499 (5,603) 9,353
Total . . . . . . . . . . . . . . . . . . . . . . . . . . $20,026 $13,855 $10,298 $18,480 $(27,475) $35,184
(1) Since these amounts are liabilities of the Company, they do not result in credit exposures.(2) Amounts represent the netting of receivable balances with payable balances for the same counterparty across maturity and product
categories. Receivable and payable balances with the same counterparty in the same maturity category are netted within the maturitycategory, where appropriate. Cash collateral paid is netted on a counterparty basis, provided legal right of offset exists.
86

The Company’s derivatives (both listed and OTC) at February 28, 2007 and November 30, 2006 are summarizedin the table below, showing the fair value of the related assets and liabilities by product:
At February 28, 2007 At November 30, 2006
Product Type Assets Liabilities Assets Liabilities
(dollars in millions)
Interest rate and currency swaps, interest rate options, creditderivatives and other fixed income securities contracts . . . . . . . . . . $19,300 $13,284 $19,444 $15,688
Foreign exchange forward contracts and options . . . . . . . . . . . . . . . . . 4,354 4,610 7,325 7,725Equity securities contracts (including equity swaps, warrants and
options) . . . . . . . . . . . . . . . . . . . . . . . . . . . . . . . . . . . . . . . . . . . . . . . 16,409 23,421 16,705 23,155Commodity forwards, options and swaps . . . . . . . . . . . . . . . . . . . . . . . 10,889 10,259 11,969 10,923
Total . . . . . . . . . . . . . . . . . . . . . . . . . . . . . . . . . . . . . . . . . . . . . . . . $50,952 $51,574 $55,443 $57,491
Each category of OTC derivative products in the above tables includes a variety of instruments, which can differsubstantially in their characteristics. Instruments in each category can be denominated in U.S. dollars or in one ormore non-U.S. currencies.
The Company determines the fair values recorded in the above tables using various pricing models. For adiscussion of fair value as it affects the condensed consolidated financial statements, see “Management’sDiscussion and Analysis of Financial Condition and Results of Operations—Critical Accounting Policies” in PartI, Item 2 and Note 1 to the condensed consolidated financial statements. As discussed under “Critical AccountingPolicies,” the structure of the transaction, including its maturity, is one of several important factors that mayimpact the price transparency. The impact of maturity on price transparency can differ significantly amongproduct categories. For example, single currency and multi-currency interest rate derivative products involvinghighly standardized terms and the major currencies (e.g., the U.S. dollar or the euro) will generally have greaterprice transparency from published external sources even in maturity ranges beyond 20 years. Credit derivativeswith highly standardized terms and liquid underlying reference instruments can have price transparency frompublished external sources in a maturity ranging up to 10 years, while equity and foreign exchange derivativeproducts with standardized terms in major currencies can have price transparency from published externalsources within a two-year maturity range. Commodity derivatives with standardized terms and delivery locationscan have price transparency from published external sources within various maturity ranges up to 10 years,depending on the commodity. In most instances of limited price transparency based on published externalsources, dealers in these markets, in their capacities as market-makers and liquidity providers, provide pricetransparency beyond the above maturity ranges.
Country Exposure. The Company monitors its credit exposure and risk to individual countries. Credit exposureto a country arises from the Company’s lending activities and derivatives activities in a country. At February 28,2007, approximately 5% of the Company’s credit exposure (for credit exposure arising from primary corporateloans and lending commitments and current exposure arising from the Company’s OTC derivatives contracts)was to emerging markets, and no one emerging market country accounted for more than 1% of the Company’scredit exposure. Country credit ratings are derived using methodologies generally consistent with those employedby external rating agencies.
Industry Exposure. The Company also monitors its credit exposure and risk to individual industries.At February 28, 2007, the Company’s material credit exposure (for credit exposure arising from primarycorporate loans and lending commitments and current exposure arising from the Company’s OTC derivativescontracts) was to entities engaged in the following industries: utilities, financial institutions, sovereign-relatedentities, media, transportation, consumer-related entities and healthcare.
87

Item 4. Controls and Procedures
Under the supervision and with the participation of the Company’s management, including our Chief ExecutiveOfficer and Chief Financial Officer, we conducted an evaluation of the effectiveness of the Company’sdisclosure controls and procedures (as defined in Rule 13a-15(e) of the Securities Exchange Act of 1934, asamended (the “Exchange Act”)). Based on this evaluation, our Chief Executive Officer and Chief FinancialOfficer concluded that our disclosure controls and procedures were effective as of the end of the period coveredby this report.
No change in the Company’s internal control over financial reporting (as defined in Rule 13a-15(f) of theExchange Act) occurred during the period covered by this report that materially affected, or is reasonably likelyto materially affect, the Company’s internal control over financial reporting.
88

Part II OTHER INFORMATION
Item 1. Legal Proceedings
In addition to the matters described in the Company’s Annual Report on Form 10-K for the fiscal year endedNovember 30, 2006 (the “Form 10-K”) and those described below, in the normal course of business, theCompany has been named, from time to time, as a defendant in various legal actions, including arbitrations, classactions and other litigation, arising in connection with its activities as a global diversified financial servicesinstitution. Certain of the actual or threatened legal actions include claims for substantial compensatory and/orpunitive damages or claims for indeterminate amounts of damages. In some cases, the issuers that wouldotherwise be the primary defendants in such cases are bankrupt or in financial distress.
The Company is also involved, from time to time, in other reviews, investigations and proceedings (both formaland informal) by governmental and self-regulatory agencies regarding the Company’s business, including,among other matters, accounting and operational matters, certain of which may result in adverse judgments,settlements, fines, penalties, injunctions or other relief. The number of these reviews, investigations andproceedings has increased in recent years with regard to many firms in the financial services industry, includingthe Company.
The Company contests liability and/or the amount of damages in each pending matter. In view of the inherentdifficulty of predicting the outcome of such matters, particularly in cases where claimants seek substantial orindeterminate damages or where investigations and proceedings are in the early stages, the Company cannotpredict with certainty the loss or range of loss, if any, related to such matters, how or if such matters will beresolved, when they will ultimately be resolved, or what the eventual settlement, fine, penalty or other relief, ifany, might be. Subject to the foregoing, and except for the Coleman Litigation (see also Note 8 in “Notes toCondensed Consolidated Financial Statements” in Part I, Item 1), the Company believes, based on currentknowledge and after consultation with counsel, that the outcome of the pending matters will not have a materialadverse effect on the consolidated financial condition of the Company, although the outcome of such matterscould be material to the Company’s operating results for a particular future period, depending on, among otherthings, the level of the Company’s revenues or income for such period.
The following developments have occurred with respect to certain matters previously reported in the Form 10-K.
Coleman Litigation.
On March 21, 2007, the District Court of Appeal for the Fourth District of Florida issued an opinion reversing thetrial court’s award for compensatory and punitive damages and remanding the matter to the trial court for entryof judgment for the Company. The opinion will become final upon disposition of any timely filed motions forrehearing.
Global Wealth Management Group Employment Matters.
Wage and Hour Matters. On January 19, 2007, a putative class action, captioned Christopher D. Bart and EricN. Wulff v. Morgan Stanley DW Inc., seeking to recover unpaid overtime for a class of financial advisors wasfiled in the U.S. District Court for the Northern District of Ohio, Eastern District—Cleveland.
Gender Matters. On February 22, 2007, in Joanne Augst-Johnson et al. v. Morgan Stanley DW Inc., theCompany reached agreement to resolve the matter. The agreement, which is subject to, among other things, courtapproval, will resolve all of the class-wide and individual plaintiffs’ claims raised in the complaint.
On March 21, 2007, in Daisy Jaffe v. Morgan Stanley DW Inc., the court issued an order extending the stay untilApril 15, 2007.
89

AOL Time Warner Litigation.
In February 2007 and March 2007, the parties entered into settlement agreements that resolved all claims in thecoordinated California action, the Ohio action and the West Virginia Action, with the exception of plaintiffs’claims against Ernst & Young.
Item 1A. Risk Factors
For a discussion of the risk factors affecting the Company, see “Risk Factors” in Part I, Item 1A of the Form10-K.
Item 2. Unregistered Sales of Equity Securities and Use of Proceeds
The table below sets forth the information with respect to purchases made by or on behalf of the Company of itscommon stock during the quarterly period ended February 28, 2007.
Issuer Purchases of Equity Securities(dollars in millions, except per share amounts)
Period
TotalNumber of
SharesPurchased
Average PricePaid Per
Share
Total Number ofShares PurchasedAs Part of PubliclyAnnounced Plansor Programs (D)
Approximate DollarValue of Sharesthat May Yet BePurchased Under
the Plans orPrograms
Month #1(December 1, 2006—December 31, 2006)Share Repurchase Program (A) . . . . . . . . . . . . 986,000 $80.50 986,000 $5,920,626,462Employee Transactions (B) . . . . . . . . . . . . . . . 455,692 $80.83 N/A N/AOdd-Lot Tender Shares (C) . . . . . . . . . . . . . . . 184,604 $78.41 184,604 N/A
Month #2(January 1, 2007—January 31, 2007)Share Repurchase Program (A) . . . . . . . . . . . . 7,485,067 $81.88 7,485,067 $5,307,745,610Employee Transactions (B) . . . . . . . . . . . . . . . 1,023,829 $81.62 N/A N/AOdd-Lot Tender Shares (C) . . . . . . . . . . . . . . . 25,816 $80.40 25,816 N/A
Month #3(February 1, 2007—February 28, 2007)Share Repurchase Program (A) . . . . . . . . . . . . 6,071,415 $82.43 6,071,415 $4,807,283,856Employee Transactions (B) . . . . . . . . . . . . . . . 92,510 $79.64 N/A N/AOdd-Lot Tender Shares (C) . . . . . . . . . . . . . . . 2,359 $81.70 2,359 N/A
TotalShare Repurchase Program (A) . . . . . . . . . . . . 14,542,482 $82.02 14,542,482 $4,807,283,856Employee Transactions (B) . . . . . . . . . . . . . . . 1,572,031 $81.28 N/A N/AOdd-Lot Tender Shares (C) . . . . . . . . . . . . . . . 212,779 $78.69 212,779 N/A
(A) On December 19, 2006, the Company announced that its Board of Directors authorized the repurchase of up to $6 billion of theCompany’s outstanding stock under a new share repurchase program (the “Share Repurchase Program”). The Share Repurchase Programreplaces the Company’s Equity Anti-dilution Program and Capital Management Program with one repurchase program for capitalmanagement purposes that will consider, among other things, business segment capital needs, as well as equity-based compensation andbenefit plan requirements. The Company expects to exercise the authorization over 12-18 months at prices the Company deemsappropriate, subject to its unallocated capital position, market conditions and regulatory considerations.
90

(B) Includes: (1) shares delivered or attested to in satisfaction of the exercise price and/or tax withholding obligations by holders of employeestock options (granted under employee stock compensation plans) who exercised options; (2) restricted shares withheld (under the termsof grants under employee stock compensation plans) to offset tax withholding obligations that occur upon vesting and release ofrestricted shares; and (3) shares withheld (under the terms of grants under employee stock compensation plans) to offset tax withholdingobligations that occur upon the delivery of outstanding shares underlying restricted stock units. The Company’s employee stockcompensation plans provide that the value of the shares delivered or attested, or withheld, shall be valued using the fair market value ofthe Company common stock on the date the relevant transaction occurs, using a valuation methodology established by the Company.
(C) Repurchases by the Company pursuant to an odd lot tender offer authorized by the Company’s Board of Directors on September 19,2006. Pursuant to the offer, which ended in March 2007, the Company offered to purchase all shares of common stock held bystockholders holding less than 100 shares of common stock.
(D) Share purchases under publicly announced programs are made pursuant to open-market purchases, Rule 10b5-1 plans or privatelynegotiated transactions (including with employee benefit plans) as market conditions warrant and at prices the Company deemsappropriate.
Item 6. Exhibits
An exhibit index has been filed as part of this Report on Page E-1.
91

SIGNATURE
Pursuant to the requirements of the Securities Exchange Act of 1934, the Registrant has duly caused thisreport to be signed on its behalf by the undersigned thereunto duly authorized.
MORGAN STANLEY(Registrant)
By: /S/ DAVID H. SIDWELL
David H. Sidwell,Principal Financial Officer
By: /S/ PAUL C. WIRTH
Paul C. Wirth,Controller and Principal Accounting Officer
Date: April 5, 2007
92

EXHIBIT INDEX
MORGAN STANLEY
Quarter Ended February 28, 2007
ExhibitNo. Description
3 Amended and Restated Certificate of Incorporation, as amended to date.
10 Amendment to Morgan Stanley 401(k) Plan.
11 Statement Re: Computation of Earnings Per Common Share (The calculation of per share earnings is inPart I, Item 1, Note 8 to the Condensed Consolidated Financial Statements (Earnings per Share) and isomitted in accordance with Section (b)(11) of Item 601 of Regulation S-K).
12 Statement Re: Computation of Ratio of Earnings to Fixed Charges and Computation of Earnings toFixed Charges and Preferred Stock Dividends.
15 Letter of awareness from Deloitte & Touche LLP, dated April 5, 2007, concerning unaudited interimfinancial information.
31.1 Rule 13a-14(a) Certification of Chief Executive Officer.
31.2 Rule 13a-14(a) Certification of Chief Financial Officer.
32.1 Section 1350 Certification of Chief Executive Officer.
32.2 Section 1350 Certification of Chief Financial Officer.
E-1