Forests in a changing climate: a sourcebook for integrating REDD+ into academic programmes 2014
134
Forests in a Changing Climate: A Sourcebook for Integrating REDD+ into Academic Programmes
-
Upload
united-nations-environment-programme -
Category
Documents
-
view
218 -
download
0
description
Â
Transcript of Forests in a changing climate: a sourcebook for integrating REDD+ into academic programmes 2014

Forests in a Changing Climate:A Sourcebook for Integrating REDD+
into Academic Programmes
UN-REDDP R O G R A M M E
The United Nations Collaborative Programmeon Reducing Emissions from Deforestation andforest Degradation in Developing Countries.
Empowered lives.Resilient nations.
Forests have long been regarded as critical ecosystems for their importance in terms of biodiversity and benefits for local communities. Recently a focus on forests and their role in mitigating climate change has led to the development of the REDD+ mechanism: ‘reducing emissions from deforestation and forest degradation, and the role of conservation, sustainable management of forests, and enhancement of forest carbon stocks’. A rational development paradigm seeks to build and maintain natural capital, and aims to transition to the sustainable management of forests. REDD+ can identify strategic options for improved land-use and better forest management, and transform the current development paradigm, drawing on science based evidence and technical advice. Consequently there is a demonstrated need for increased knowledge and expertise on all aspects of REDD+ including sustainable land management in forests and forest-related ecosystems.
‘Forests in a Changing Climate: Sourcebook for REDD+’ is designed to give an overview of the key topics related to forests and climate change, under the overarching and evolving REDD+ narrative. The purpose is to facilitate the integration of this new knowledge domain into multi-disciplinary University programmes. The sourcebook provides case studies and detailed references in each module, and can be used comprehensively or selectively in the design and delivery of academic programmes related to REDD+.

UNEP promotes environmentally sound practices
globally and in its own activities. This report is printed on paper from sustainable forests including recycled fibre. The paper is chlorine free, and the inks vegetable-based.
Our distribution policy aims to reduce UNEP’s carbon footprint
Copyright © United Nations Environment Programme, 2014
This publication may be reproduced in whole or in part and in any form for educational or nonprofit purposes without special permission from the copyright holder, provided acknowledgement of the source is made.
UNEP would appreciate receiving a copy of any publication that uses this publication as a source. No use of this publication may be made for resale or for any other commercial purpose whatsoever without prior permission in writing from the United Nations Environment Programme.
Disclaimer
The designations employed and the presentation of the material in this publication do not imply the expression of any opinion whatsoever on the part of the United Nations Environment Programme concerning the legal status of any country, territory, city or area or of its authorities, or concerning delimitation of its frontiers or boundaries. Moreover, the views expressed do not necessarily represent the decision or the stated policy of the United Nations Environment Programme, nor does citing of trade names or commercial processes constitute endorsement.
This publication should be referenced as follows:
UNEP (2014) Forests in a Changing Climate: A Sourcebook for Integrating REDD+ into Academic Programmes, United Nations Environment Programme, Nairobi, Kenya
Design/layout/printing
Picture Editor: Suzannah Goss
Design and Layout: Jennifer Odallo/UNON
Cover Design: Catherine Kimeu/UNON
Printing: UNON Publishing Services Section – ISO 14001:2004-certified
Cover photos ©: (Above) Primary forest in Gede Pangrango, Indonesia – Ricky Martin/CIFOR(Below left) Eastern gorilla, Congo Basin – Douglas Sheil/CIFOR, (Below, right) Intensive logging activities, Kinabatangan River, Sabah, Borneo – Frans Lanting/ GETTY IMAGES
Back cover ©: Students learning in a forest setting – Storm Stanley
ISBN number: 978-92-807-3392-1
Job number: DEP/1807/NA

F O R E S T S I N A C H A N G I N G C L I M A T E i
UN-REDDP R O G R A M M EThe United Nations Collaborative Programmeon Reducing Emissions from Deforestation andforest Degradation in Developing Countries.
Empowered lives.Resilient nations.
FORESTS IN A CHANGING CLIMATE: A Sourcebook for Integrating REDD+
into Academic Programmes

F O R E S T S I N A C H A N G I N G C L I M A T Eii
UNEP / UN-REDD+ PROJECT TEAMMahesh Pradhan, ChiefEnvironmental Education and Training Unit, UNEP
Tim Christophersen, Senior Programme Officer Forests and Climate Change, UNEP – UN-REDD Programme
Pablo Fuentenebro, Associate Programme Officer Environmental Education and Training Unit, UNEP
Julie Greenwalt, Programme Analyst UNEP – UN-REDD Programme
John Erik Prydz, Programme Officer UNEP – UN-REDD Programme
Suzannah Goss, Programme Officer,UNEP – UN-REDD Programme
Jaime Webbe, Consultant,UNEP – UN-REDD Programme
YALE UNIVERSITY PROJECT TEAMBenjamin Cashore, Professor of Environmental Governance & Political Science Yale School of Forestry & Environmental Studies
Sébastien Jodoin, PhD Candidate Yale School of Forestry & Environmental Studies
LEAD AUTHORS Kristofer Covey, PhD CandidateYale School of Forestry & Environmental Studies
Sébastien Jodoin, PhD Candidate Yale School of Forestry & Environmental Studies
Namrata Kala, PhD Candidate Yale School of Forestry & Environmental Studies
Katherine Lofts, Associate FellowCentre for International Sustainable Development Law
Lucía Ruiz Bustos, MEM Graduate Yale School of Forestry & Environmental Studies
Max Tattenbach, MEM Candidate Yale School of Forestry & Environmental Studies
REVIEWERS
UNEPTim ChristophersenJulie GreenwaltNiklas HagelbergJohn Erik PrydzThomas EntersGabriel Labbate
UN-REDD SecretariatWahida Patwa-Shah
UNEP FIIain Henderson
UNEP-WCMCLera MilesBlaise BodinLucy Goodman
FAOAdam Gerrand
UNDPKimberly ToddGaya SriskantanClaudia von Segesser-ZarateSilje Haugland

F O R E S T S I N A C H A N G I N G C L I M A T E iii
FOREWORD .........................................................................................................................................................................................vi
INTRODUCTION .................................................................................................................................................................................. 1
PEDAGOGY ......................................................................................................................................................................................... 3Education for sustainable development ....................................................................................................................................... 3Target Audience .......................................................................................................................................................................... 3Using this Sourcebook................................................................................................................................................................. 4
EXPECTED LEARNING OUTCOMES ....................................................................................................................................................... 5
MODULE 1: Forest carbon and climate change .................................................................................................................................... 91.1 Fundamentals: The role of forests in the global carbon cycle .............................................................................................. 9
1.1.1 Photosynthesis, respiration and carbon sequestration in terrestrial ecosystems ....................................................... 91.1.2 Forests as carbon stores ....................................................................................................................................... 101.1.3 Carbon Sequestration and Storage across Biomes ................................................................................................ 101.1.4 Stand Dynamics and Carbon Sequestration in Forests........................................................................................... 101.1.2 The Contribution of Deforestation and Forest Degradation to Climate Change .................................................... 12
1.2 Initiatives, Tools & Methodologies..................................................................................................................................... 121.2.1 Sustainable Forest Management for Climate Change Mitigation .......................................................................... 12
1.3 Case Studies ................................................................................................................................................................... 141.3.1 Tropical Deforestation, Fire and Carbon Loss in the Amazon Basin ........................................................................ 141.3.2 Carbon Sequestration in Wood Products ............................................................................................................. 15
1.4 Key Issues for Discussion .................................................................................................................................................. 151.4.1 The role of forests in the carbon cycle .................................................................................................................. 151.4.2 Patterns of forest development ........................................................................................................................... 151.4.3 Distribution of carbon across biome ..................................................................................................................... 151.4.4 Deforestation and the carbon cycle ...................................................................................................................... 15
1.5 References ....................................................................................................................................................................... 16
MODULE 2: The multiple benefits of forests ...................................................................................................................................... 232.1 Fundamentals .................................................................................................................................................................. 23
2.1.1 Ecosystem services: linking ecosystems and society .............................................................................................. 232.1.2 Benefits of forests in a REDD+ context ................................................................................................................. 24
2.2 Initiatives, Tools & Methodologies..................................................................................................................................... 252.2.1 Mapping benefits ................................................................................................................................................ 252.2.2 Monitoring additional REDD+ impacts ................................................................................................................. 252.2.3 Methods for valuing economic benefits of forests ................................................................................................ 25
2.3 Case studies ..................................................................................................................................................................... 27
2.4 Key issues for discussion................................................................................................................................................... 29
2.5 References ....................................................................................................................................................................... 30
MODULE 3: Drivers of deforestation and forest degradation ............................................................................................................. 333.1 Fundamentals .................................................................................................................................................................. 33
3.1.1 Recent trends in deforestation and forest degradation ......................................................................................... 33
3.2 Initiatives, tools and metholodgies.................................................................................................................................... 343.2.1 Measurement of Deforestation and Forest Degradation ....................................................................................... 34
Table of contents

F O R E S T S I N A C H A N G I N G C L I M A T Eiv
3.2.2 Factors Affecting Deforestation and Forest Degradation – Overview of Methodologies ......................................... 353.2.3 Proximate Causes ................................................................................................................................................ 363.2.4 Indirect Causes .................................................................................................................................................... 37
3.3 Case studies ..................................................................................................................................................................... 393.3.1 Subnational Differences in Deforestation Drivers – The Case of Thailand .............................................................. 393.3.2 Macroeconomic Changes and Deforestation – Structural Adjustment in Ghana ................................................... 39
3.4 Key issues for discussion................................................................................................................................................... 413.4.1 Challenges in the measurement of deforestation and forest degradation ............................................................. 413.4.2 Heterogeneity in the relative importance of and interactions between drivers ....................................................... 413.4.3 Future projections of changes in forest cover ....................................................................................................... 41
3.5 References ....................................................................................................................................................................... 42
MODULE 4: Solutions to reverse deforestation and forest degradation .............................................................................................. 434.1 Fundamentals .................................................................................................................................................................. 43
4.2 Initiatives, tools and metholodgies.................................................................................................................................... 444.2.1 Solutions in the Forestry Sector ............................................................................................................................ 444.2.2 Solutions in Related Economic Sectors ................................................................................................................. 47
4.3 Case Studies .................................................................................................................................................................... 504.3.1 The Nature of Agricultural Technological Change and Impacts on Deforestation: Evidence from the
Brazilian Amazon ................................................................................................................................................. 504.3.2 The Potential Role of Forest Certification Programs in Reducing Deforestation and Forest Degradation ................. 50
4.4 Key issues for discussion .................................................................................................................................................. 524.4.1 Robust evaluation of the drivers of efficacy of solutions ....................................................................................... 524.4.2 Potential for multi-sectoral, multi-level solutions .................................................................................................. 52
4.5 References ....................................................................................................................................................................... 53
MODULE 4: The REDD+ approach ..................................................................................................................................................... 555.1 Fundamentals ................................................................................................................................................................... 55
5.1.1 The emergence of REDD+ In the UN climate regime ............................................................................................. 555.1.2 The Features of a Global REDD+ Mechanism within the UNFCCC ......................................................................... 565.1.3 The Phases of REDD+ ........................................................................................................................................... 57
5.2 Initiatives, Tools & Methodologies .................................................................................................................................... 57
5.3 Case Studies ................................................................................................................................................................... 59
5.4 Key Issues for Discussion .................................................................................................................................................. 605.4.1 Reasons for the emergence of REDD+ .................................................................................................................. 605.4.2 The politics of REDD+ .......................................................................................................................................... 605.4.3 The effectiveness of REDD+ ................................................................................................................................. 60
5.5 References ....................................................................................................................................................................... 61
MODULE 6: The REDD+ Readiness Phase: implementation framework, governance issues & enabling investments ............................ 636.1 Fundamentals .................................................................................................................................................................. 63
6.1.1 Elements of the REDD+ Readiness phase .............................................................................................................. 636.1.2 Implementation framework, governance issues and enabling investments ............................................................ 646.1.3 REDD+ Demonstration Projects ............................................................................................................................ 67
6.2 Initiatives, Tools & Methodologies .................................................................................................................................... 63
6.3 Case Studies ................................................................................................................................................................... 69
6.4 Key Issues for Discussion .................................................................................................................................................. 706.4.1 Learning from REDD+ Demonstration projects ..................................................................................................... 706.4.2 Political nature and implications of REDD+ Readiness ........................................................................................... 70
6.5 References ....................................................................................................................................................................... 71
MODULE 7: Systems for measurement, reporting and verification of forests ...................................................................................... 737.1 Fundamentals ................................................................................................................................................................... 73
7.2 Initiatives, Tools & Methodologies ..................................................................................................................................... 737.2.1 Information on Tropical Forest Ecosystems............................................................................................................ 737.2.2 MRV systems and performance based incentive mechanisms .............................................................................. 757.2.3 Components of modern MRV systems ................................................................................................................. 757.2.4 Community and participatory monitoring of forests ............................................................................................. 767.2.5 The role of technology for efficient MRV systems ................................................................................................ 77
7.3 Case studies ..................................................................................................................................................................... 78
7.4 Key questions for discussion ............................................................................................................................................. 797.4.1 Technology transfer around MRV ......................................................................................................................... 797.4.2 Community-based management systems ............................................................................................................. 797.4.4 Tradeoffs in data collection .................................................................................................................................. 79
7.5 References ....................................................................................................................................................................... 80

F O R E S T S I N A C H A N G I N G C L I M A T E v
MODULE 8: Performance based incentives for reducing deforestation and forest degradation ........................................................... 818.1 Fundamentals .................................................................................................................................................................. 81
8.2 Initiatives, Tools & Methodologies .................................................................................................................................... 818.2.1 Preliminary Institutional Framework ..................................................................................................................... 828.2.2 Nature of Contracts ............................................................................................................................................. 838.2.3 Monitoring, Reporting and Verification (MRV) ...................................................................................................... 84
8.3 Case studies ..................................................................................................................................................................... 858.3.1 Cost Effectiveness and Sustainability of PES Programs: Evidence from the Sloping Lands Conversion
Program (SLCP), China ......................................................................................................................................... 858.3.2 Environmental Effectiveness of PES Programs: Evidence from Costa Rica .............................................................. 86
8.4 Key issues for discussion................................................................................................................................................... 868.4.1 Effective Implementation of PES programs in Fragile States .................................................................................. 868.4.2 Optimal Contracting Mechanisms in Various Contexts ......................................................................................... 868.4.2 Using Scientific and Socio-Economic Data for Site Selection ................................................................................ 87
8.5 References ...................................................................................................................................................................... 88
MODULE 9: Social and environmental safeguards ............................................................................................................................. 899.1 Fundamentals .................................................................................................................................................................. 89
9.1.1 Social and environmental risks and opportunities offered by REDD+ ..................................................................... 899.1.2 REDD+ Safeguards in the UNFCCC ...................................................................................................................... 90
9.2 Initiatives, Tools & Methodologies..................................................................................................................................... 91
9.3 Case studies .................................................................................................................................................................... 94
9.4 Key issues for discussion................................................................................................................................................... 949.4.1 The effectiveness of safeguards ............................................................................................................................ 949.4.2 Ensuring additional social and environmental benefits from REDD+ ...................................................................... 94
9.5 References ....................................................................................................................................................................... 95
MODULE 10: The cost of REDD+: concepts, methods and approaches .............................................................................................. 9710.1 Fundamentals .................................................................................................................................................................. 97
10.2 Tools, Initiatives and Methodologies ................................................................................................................................. 9710.2.1 Identifying the costs of REDD+ costs .................................................................................................................... 9710.2.2 Estimating the costs of REDD+ ............................................................................................................................ 9910.2.3 Components necessary for implementation of REDD+........................................................................................ 10010.2.4 Costs curves of REDD+ interventions .................................................................................................................. 101
10.3 Case Studies .................................................................................................................................................................. 102
10.4 Key issues for discussion................................................................................................................................................. 10310.4.1 Limitations of MAC curves ................................................................................................................................. 10310.4.2 Opportunity costs as the basis for REDD+ Payments ........................................................................................... 103
10.5 References .................................................................................................................................................................... 104
MODULE 11: Funding for REDD+ .................................................................................................................................................... 10511.1 Fundamentals ............................................................................................................................................................... 105
11.2 Initiatives, Tools & Methodologies .................................................................................................................................. 10511.2.1 International sources for climate finance ........................................................................................................... 10511.2.3 Public funding and public-private partnerships .................................................................................................. 11011.2.4 Opportunities and constraints of carbon markets .............................................................................................. 11011.2.5 Funding mechanisms and funding sources ......................................................................................................... 112
11.3 Case studies ................................................................................................................................................................... 112
11.4 Key issues for discussion................................................................................................................................................. 11311.4.1 Compliance carbon markets .............................................................................................................................. 11311.4.2 Local governments and public-private patnerships ............................................................................................. 11311.4.3 The establishment of CTFs ................................................................................................................................. 113
11.5 References ..................................................................................................................................................................... 114
MODULE 12: Beyond REDD+, the green economy transition ........................................................................................................... 11512.1 Fundamentals ................................................................................................................................................................ 115
12.1.1 Shaping a green development pathway ............................................................................................................. 115
12.2 Initiatives, Tools & Methodologies................................................................................................................................... 120
12.3 Case Studies ................................................................................................................................................................. 122
12.4 Key issues for Discussion ................................................................................................................................................ 12312.4.1 Country-specific economic scenarios .................................................................................................................. 12312.4.2 Resource scarcity ................................................................................................................................................ 12312.4.3 Governance reforms .......................................................................................................................................... 123
12.5 References ..................................................................................................................................................................... 124

F O R E S T S I N A C H A N G I N G C L I M A T Evi
Foreword
Tackling the issues of climate change requires a wide array of expertise and innovative ideas as well as an understanding of both the policy elements and the scientific facts related to the most challenging phenomenon of our time. Despite the overwhelming attention to climate change, it is still a relatively new field of study and it is constantly evolving
based on the latest scientific findings, international agreements, national commitments and the realities on the ground.
One important element of the climate change mitigation discussions is the role of forests and specifically the internationally-agreed activities for Reducing Emissions from Deforestation and forest Degradation while promoting conservation, sustainable management of forests and enhancing forest carbon stocks (REDD+). REDD+ encapsulates many of the challenges and opportunities for addressing climate change and the need for increasing expertise in order to do so. For REDD+ programmes to be successfully devised in countries, technical understanding is needed on carbon accounting, national forest inventories, spatial planning and biodiversity. In addition, there is a need for addressing environmental governance, cross-sectorial policies and legal reforms, and stakeholder participation. Some elements are very specific to REDD+ such as the social and environmental safeguards outlined in the UNFCCC Cancun Agreements (2010), and the Warsaw Framework for REDD+ implementation (2013), while others are about a larger paradigm shift in national development strategies, which is not limited to REDD+ or forests but rather address issues related to the transition to an inclusive Green Economy.
This sourcebook is designed to give an overview of the key topics related to forests and climate change, under the overarching and evolving REDD+ narrative; with the purpose of facilitating the integration of this new knowledge domain into academic programmes. The sourcebook provides detailed references for further study in each module, and can be used comprehensively or with a focus on a specific topic of interest or relevance for the course of study.
From a pedagogical point of view, Forests in a Changing Climate is aimed at university professors and graduate students from different academic disciplines (forestry, public policy, environmental science, economics, etc.) interested in teaching a course or conducting a lecture on REDD+. The content of the book is largely based on the knowledge generated by the United Nations Collaborative Programme on Reducing Emissions from Deforestation and Forest Degradation in Developing Countries (UN-REDD Programme). Members of UNEP’s Global Universities Partnership on Environment and Sustainability (GUPES), especially those working on forests and environment, are encouraged to use the sourcebook and provide feedback. Although the sourcebook is primarily for academia, the text will also be a very useful resource for policy makers and practitioners in the environment and forestry sectors, who seek to gain a deeper knowledge of REDD+. Engaging academia and training the next generation of experts is crucial in order to ensure that the world’s best efforts are directed at solving the climate change crisis. We hope that this sourcebook will increase knowledge of REDD+, a tremendous opportunity to conserve and manage the world’s forests for all their values while also providing much needed climate change mitigation.
Mette L. Wilkie Director
Division of Environmental Policy Implementation, UNEP
F O R E S T S I N A C H A N G I N G C L I M A T E 1
Since the mid-2000s, governments, multilateral organisations, non-governmental organisations, indigenous and local communities, research centres,
universities and corporations have been working toward the establishment and operationalization of a common set of policy approaches and incentives to reduce emissions from deforestation and forest degradation and support the conservation, sustainable management, and enhancement of forest carbon stocks in developing countries (REDD+). Although these efforts primarily seek to lay the ground-work for the adoption of a REDD+ mechanism in a new international agreement providing long-term cooperative action on climate change, the knowledge, skills, method-ologies, resources, networks, and institutions that they have fostered have significant and far-reaching implications for environmental governance, policy-making and research.
This sourcebook seeks to take stock of the knowledge, approaches, tools and initiatives that have been developed for REDD+ by a range of actors and to facilitate their integration into multi-disciplinary higher education programmes, especially in countries actively engaged in REDD+ readiness efforts and preparations. In particular, the sourcebook aims:
integration of REDD+ concepts and methods into relevant university postgraduate programmes building in particular on the UN-REDD Programme’s body of knowledge and experience in developing countries;
available in the UN-REDD Programme, in particular
that may be useful to their postgraduate programmes in related fields such as forestry, agro-forestry, climate change, environmental science, public policy, economics, etc.
centres of excellence for mainstreaming REDD+ education, research, development and outreach to a large number of actors, and to build, through university education systems, the professional capacity and leadership needed for reducing emissions from deforestation and forest degradation.
This sourcebook is structured around a series of 12 modules covering the different aspects of REDD+. The sourcebook begins with four modules that discuss the context in which REDD+ has been developed and introduces the relationship between forest carbon and climate change (module 1), the multiple benefits of forests (module 2), the causes of deforestation and forest degradation (module 3), and solutions to reverse deforestation and forest degradation (module 4). The sourcebook then introduces the REDD+ approach (module 5) and the REDD+ readiness process (module 6). A third set of modules focus on specific aspects of implementing REDD+: systems for monitoring, reporting and verification of forests (module 7), performance based incentives for reducing deforestation and forest degradation (module 8), social, environmental and governance safeguards (module 9), the costs of REDD+ (module 10), and funding for REDD+ (module 11). The sourcebook concludes with a module that situates REDD+ within broader efforts aimed at fostering a global transition to a green economy (module 12).
Introduction

F O R E S T S I N A C H A N G I N G C L I M A T E2
Olli
vier
Gira
rd/C
IFO
R
Sustainable development – Shea butter is filtered before being packaged in Leo, Burkina Faso

F O R E S T S I N A C H A N G I N G C L I M A T E 3
EDUCATION FOR SUSTAINABLE DEVELOPMENT
Education for sustainable development, or ESD, is a new vision for education that aims to “integrate the principles, values, and practices of sustainable development into all aspects of education and learning. This education effort will encourage change in behavior that will create a more sustainable future in terms of environmental integrity, economic viability, and a just society for present and future generations1.” ESD is rooted in Agenda 21, the outcome document of the 1992 UN Conference on Environment and Development (the “Earth Summit”), which emphasizes the importance of education in achieving sustainable development in Chapter 36, “Promoting Education, Public Awareness, and Training2.”
The goal of ESD is to encourage individuals in all countries and contexts to understand the complexities and synergies of sustainable development issues, connect these issues to their own lives, and become responsible to create a better future. ESD addresses various aspects of the global problems we face, including climate change, disaster risk reduction, biodiversity loss, poverty reduction, and sustainable consumption3. ESD focuses on participatory learning appro-aches and promotes critical thinking, collaborative decision-making, and visioning of future scenarios. These skills are necessary to motivate and empower individuals and communities to work towards a solution4.
1 UNESCO Education Center (2005). “United Nations Decade of Education for Sustainable Development (2005-2014): International Implementation Scheme.” http://unesdoc.unesco.org/images/0014/001486/148654e.pdf
2 UN Documents Cooperation Circles (1992). “Agenda 21, Chapter 36: Promoting Education, Public Awareness, and Training.” http://www.un-documents.net/a21-36.htm.
3 UNESCO Website (Accessed 2013). Education for Sustainable Development. http://www.unesco.org/new/en/education/themes/leading-the-international-agenda/education-for-sustainable-development/
4 UNESCO (2012). “ESD: Building a Better, Fairer World for the 21st Century.” http://unesdoc.unesco.org/images/0021/002166/216673E.pdf
In its broadest sense, ESD is education for social transformation. It impacts all aspects of education, from policy and financing to administration and curriculum development. The key educational priorities of ESD are to:
and media attention; and
make decisions and carry out work in a more sustain-able manner5
TARGET AUDIENCE
This sourcebook is aimed at university professors and graduate students coming from different academic disciplines (forestry, public policy, environmental science, economics, legal studies, agronomy, etc.) interested in teaching a course or a lecture on REDD+. Although it is primarily oriented towards an academic audience, it could also be adapted to develop capacity-building, training, and education courses and materials for a broad range of audiences.
5 UNESCO (2005).“The UN Decade of Education for Sustainable Development: The DESD at a Glance.” http://unesdoc.unesco.org/images/0014/001416/141629e.pdf
Pedagogy

F O R E S T S I N A C H A N G I N G C L I M A T E4
USING THIS SOURCEBOOK
Each module in this sourcebook builds upon, and refers to a wide range of academic and policy knowledge, with a particular focus on existing training materials and resources available on REDD+ and the unique body of knowledge and experience accumulated by the UN-REDD Programme and its partners.
Each module is structured around the following sections: : a summary of concepts, history, is-
sues and controversies, pros and cons of different ap-proaches, and data;
: an explana-tion of key initiatives, applications and methods devel-oped to support the operationalization of REDD+ by experts and professionals in the field;
: brief illustrations of on-the-ground achievements, challenges, and opportunities in the op-erationalization of REDD+;
: a list of 2-4 key issues or questions relating to the operationalization of REDD+, with suggested questions; and
: a list of references cited in the module.
Each module can be used by professors teaching a course or lecture on REDD+. In particular, the content in the sourcebook can be used in the following manner:
the sourcebook as a whole can be used to design a course and associated syllabus (see in this regard the expected learning out-comes in the next section);
the sourcebook, especially the sections on fundamentals, initiatives, tools, and methodologies, and case studies, can be used to develop a lecture on a given topic;
the list of initiatives, tools and methodologies as well as the list of references can be assigned to students as readings;
the case studies and the key issues for discussion can be used as opportunities to foster in-class discussions; and
the sourcebook, especially the sections on initiatives, tools, and methodologies and key issues for discussions, can be used to develop homework or tests for students.

F O R E S T S I N A C H A N G I N G C L I M A T E 5
Expected learning outcomes
MODULE 1 – FOREST CARBON AND CLIMATE CHANGE
Expected learning outcomes:
global carbon cycle;
degradation to climate change;-
agement for climate change mitigation and adaptation;-
bon stocks and flows in different forest systems.
MODULE 2 – THE MULTIPLE BENEFITS OF FORESTS
Expected learning outcomes:
timber production and carbon sequestration;
-nomic benefits;
-tection;
Green Economy transition – Environment conservation sign
Cris
tian
Baitg
/GET
TY IM
AG
ES

F O R E S T S I N A C H A N G I N G C L I M A T E6
the multiple benefits of forests.
MODULE 3 – CAUSES OF DEFORESTATION AND FOREST DEGRADATION
Expected learning outcomes:
forest degradation in the tropics;
forest degradation and the connections between direct and underlying factors;
between deforestation and economic growth;
factors driven by global forces;
deforestation and forest degradation;
to assess the different factors of deforestation and to anticipate future deforestation scenarios and impact.
MODULE 4 – SOLUTIONS TO REVERSE DEFORESTATION AND FOREST DEGRADATION
Expected learning outcomes:
forest sector, in particular solutions related to agriculture, energy and land-use planning and management.
and analyse the conditions under which intensification of agriculture can work as a solution to reduce pressure on forest ecosystems.
the relevance of integrated approaches that combine different interventions;
solution and multiple strategies and responses to address deforestation exist and need to be considered in response to varying circumstances.
MODULE 5 – THE REDD+ APPROACH: INCENTIVES FOR VOLUNTARY NATIONAL EFFORTS AT REDUCING EMISSIONS FROM DEFORESTATION AND FOREST DEGRADATION
Expected learning outcomes:
on sustainable forest management and the emergence of REDD+;
approach and the need for addressing the drivers of deforestation at a varying scales from small projects to national scales;
MODULE 6 – THE REDD+ READINESS PHASE: INSTITUTIONAL FRAMEWORK, GOVERNANCE ISSUES AND ENABLING INVESTMENTS
Expected learning outcomes:
national strategy and know about the different phases of a national REDD+ process;
for a REDD+ national programme;
reference scenario for REDD+;
need to be in place for a REDD+ programme;
regarding carbon rights and benefit-sharing of carbon revenues;
capacities that need to be place for REDD+;
context of REDD+ and analyze the main elements of land tenure reform;
context of REDD+ and analyze the main elements of land use planning reform;
factors contributing to the business environment, for the realization of REDD+.
MODULE 7 – SYSTEMS FOR MONITORING, REPORTING AND VERIFICATION OF FORESTS
Expected learning outcomes:
regarding forest ecosystems in the tropics;
formance based incentive mechanisms such as REDD+;
and modern MRV systems;
of forests.
sensing techniques, for efficient MRV systems.
MODULE 8 – PERFORMANCE BASED INCENTIVES FOR REDUCING DEFORESTATION AND FOREST DEGRADATION
Expected learning outcomes:
services and the use of PES in the context of REDD+;
in reducing deforestation, forest degradation, and in promoting sustainable forest management, conservation or increases in forest carbon stocks;

F O R E S T S I N A C H A N G I N G C L I M A T E 7
development assistance) and performance-based mechanisms like REDD+;
with governments, in particular with fragile states.
MODULE 9 – SOCIAL, ENVIRONMENTAL AND GOVERNANCE SAFEGUARDS
Expected learning outcomes:
well as compromises or trade-offs that can exist be-tween maximizing carbon sequestration and other benefits, such as biodiversity and food security;
and investments in the forest and related sectors, in particular for vulnerable people and the environment;
governance issues can jeopardize the success of reforms and investments in forest related sectors;
governance of forest related sectors, in particular to promote effective participation, transparency, and ac-
countability mechanisms (including free, prior and in-formed consent, forest law enforcement and govern-ance etc.);
and governance safeguards in the context of REDD+;
systems to enforce the safeguards.
between ownership of land (tenure) and access and usage rights to forests and forest goods and services.
MODULE 10 – THE COSTS OF REDD+
Expected learning outcomes:
implementation costs and transaction costs;
needed for the different phases of REDD+ and discuss the idea that REDD+ is perceived as a relatively cheap climate change mitigation strategy;
strategic decisions;
Bamboo bicycle in London
Bam
boo
Bicy
cle
Clu
b –
Lond
on

F O R E S T S I N A C H A N G I N G C L I M A T E8
MODULE 11 – FUNDING FOR REDD+
Expected learning outcomes:
climate finance;
complexity of producing quality carbon credits from forest related interventions;
carbon markets (including the voluntary market);
private partnerships in the early stages of a REDD+ programme;
at national level and reflect on potential sources of domestic funding according to the context.
MODULE 12 – BEYOND REDD+, THE GREEN ECONOMY TRANSITION
Expected learning outcomes:
management in the forest and related sectors can trigger positive development outcomes;
investments to shape a more sustainable and equitable development pathway;
and simulations through qualitative and quantitative models, to support policy decisions towards the green economy;
forest related interventions;
can trigger positive spillover effects on the economy and help reduce inequalities.

F O R E S T S I N A C H A N G I N G C L I M A T E 9
M O D U L E 1Forest carbon and climate change
1.1 FUNDAMENTALS: THE ROLE OF FORESTS IN THE GLOBAL CARBON CYCLE
1.1.1 Photosynthesis, Respiration and Carbon Sequestration in Terrestrial EcosystemsThrough photosynthesis, trees and other plants take up atmospheric carbon dioxide (CO2) and sequester it in their living tissues as biomass. Respiration in forests, both autotrophic (from plants) and heterotrophic (from non-plant organisms), causes the release of CO2 reducing this total sequestration. Carbon (C) moving through a forest ecosystem in a given period of time (termed flux) is by convention considered negative when moving from the atmosphere to biomass (sequestration), and positive when moving from biomass into the atmosphere (release). Terrestrial Gross Primary Productivity (GPP), or total photosynthesis, is the largest single land-based carbon flux. Net Primary Productivity (NPP) is the remaining portion of GPP after accounting for autotrophic respiration from plants; Net Ecosystem Productivity (NEP) further accounts for the reduction in sequestration due to heterotrophic respiration from animals, fungi and other non-plants. Net Biome Productivity (NBP) recognizes additional losses from disturbances, like fire and harvesting (Fig. 1).
Total terrestrial GPP amounts to a -123 Pg C yr-1 (1 Pg = 1 billion tonnes) flux, 60% of which is produced by tropical forest and savannah ecosystems (Beer et al. 2010). Approximately half of this is respired back to the atmosphere by plants, resulting in a value for terrestrial NPP of ~60 Pg C yr-1. NEP is still smaller at 10 Pg C yr-1. When all losses are accounted for (NBP), the terrestrial sink is currently on the order of 1 Pg C yr-1 (IPCC 2000).
Figure 1. The forest carbon cycle is best described by classifying it as 4 fluxes: Gross Primary Productivity (GPP), carbon assimilation from photosynthesis; Net Primary Productivity (NPP), photosynthesis excluding plant respiration (Ra); Net Ecosystem Production (NEP), which further subtracts to account for loss due to heterotrophic respiration (Rh); and Net Biome Production (NBP), total sequestration accounting for all losses. The width of arrows is representative of the relative size of the fluxes. Source: Schulze et al. (2000)
NBPNEP
NPP
GPP
PS-Products
Growth Ra
Har
vest
Litter CWD
Soil organic matter
Black carbon
R h (soi
l org
anic
mat
ter)
R h (litt
er, C
WD
)
Carb
on lo
sses
of s
ite
R h (bla
ck c
arbo
n)
new active
passiveFire
Mortality
new Biomass
old
Wood-products
CO2
CO2CO2 CO2CO2 CO2 CO2

F O R E S T S I N A C H A N G I N G C L I M A T E10
The Forest Floor – soils, leaf litter and Bride Veil Stinkhorn (Phallus indusiastus), Uganda. The ability of forests to sequester carbon from the atmosphere depends on nutrients available in the forest soils.Recent research shows that forests growing in fertile soils with ample nutrients are able to sequester about 30% of the carbon that they take up during photosynthesis. In contrast, forests growing in nutrient-poor soils may retain only 6% of that carbon.
1.1.2 Forests as Carbon StoresThe fluxes described above result in short- (NPP), medium- (NEP), and long- (NBP), term storage of C in “pools”. The forest carbon pool is the largest terrestrial reserve, holding more than ¾ of all above ground terrestrial carbon (IPCC 2000, Houghton 2007). While forest soil is generally recognized as a large reservoir for carbon (~40% of total terrestrial carbon storage), the size of the forest soil carbon pools is difficult to assess and remains one of largest uncertainties in global CO2 budgeting efforts (Goodale et al. 2002, Ryan and Law 2005). Although turnover in litter and woody debris is relatively rapid, a small percentage of the total forest carbon pool is the result of storage in decaying plant detritus (Bowden et al. 1993, Soepadmo 1993). Numerous studies have investigated the absolute and relative sizes of these distinct pools in various forest types and age-classes in each of the forested
biomes. They are summarized in Appendix I included at the end of this module.
1.1.3 Carbon Sequestration and Storage across Biomes
Tropical forest systems sequester carbon faster, and store more carbon, than comparable temperate and boreal forests. Indeed, tropical forests are responsible for approximately 33% of terrestrial NPP and hold nearly ¼ of above ground terrestrial carbon (Bonan 2008). While still significant, mid- and high-latitude forests have relatively slower rates of carbon uptake and lower per area carbon stock (Fig. 2).
1.1.4 Stand Dynamics and Carbon Sequestration in Forests
Forests are dynamic. Decades of forest ecosystem modeling have established the important role of both autogenic stand development processes – driven by species level traits – and disturbance in regulating the development of forest stands, and thus, their influence on climate (Bonan 2008). The interaction of these internal drivers with external disturbances means forests can develop along numerous independent pathways (Camp and Oliver 2004). Despite nearly endless combinations, general patterns in the development of forest assemblages are well recognized (Oliver 1992). Tree species are separated into guilds based on their regeneration ecology, tolerance to shade, and relative growth rate (Ashton 1992). These distinct species characteristics lead to regular patterns in canopy stratification, where initially fast growing, shade intolerant species dominate a young forest’s canopy, with more tolerant species below. As early serial dominants slow in growth rate, or are damaged by disturbance, they are gradually replaced by shifting waves of progressively more shade tolerant species. Numerous developmental models exist, each more or less suited for specific interests or geographic areas (Odum 1969, Shugart and West 1980, Bormann and Likens 1981, Oliver 1981, Franklin et al. 2002). While distinct, each of these models describes predictable shifts in stand structure or process as new individuals occupy a site following disturbance and compete for resources. Over time additional disturbances impact the stand, freeing growing space and shifting competitive dynamics.
Oliver and Larson (1996) describe a four-stage progression starting with the rapid invasion of a forest stand after major disturbance (Stand Initiation); followed by a period of intense competition and high rates of competition mortality (Stem Exclusion); then canopy species lose vigor and new cohorts establish (Understory Reinitiation); and finally, this newly established cohort ascends to the canopy (Old Growth). Forest stands move dynamically through these stages at varying rates and along a nearly infinite number of trajectories depending on a wide range of factors including site, species composition and disturbance pattern. As forest development progresses, predictable changes in stand level respiration, nutrient processing, carbon sequestration and storage occur (Fig. 3). These patterns are the result of competition for limited
Dou
glas
She
il/C
IFO
R

F O R E S T S I N A C H A N G I N G C L I M A T E 11
resources driven by site factors (edaphic, topographic, physiographic), disturbance type (scale, intensity and interval) and accompanying changes in , individual- and stand-scale, photosynthate allocation and respiration. Forest stands will move through these stages at varying rates, and will reach different maxima. High-productivity sites will not only have higher peak sequestration rates,
but also attain these rates sooner than comparable species assemblages on less productive sites (Oliver and Larson 1996). Forest stand age is a major factor in sequestration rate, with young, productive temperate forests sequestering 5-6 t C ha-1 yr-1 (Schwalm et al. 2010) whereas reduced rates of sequestration and larger respiration debts mean that old growth forests sequester
Figure 2. Forests and Carbon. (A and B) Current extent and total (above and below ground) terrestrial carbon storage for forest and non-forest, and biomes. (C) Stand level NEP by biome. Tropical forests have relatively higher rates of carbon sequestration. (D) Carbon Density. Forests generally hold proportionally greater quantities of carbon per unit area than non-forests; Tropical forests store more carbon per unit area than do Temperate or Boreal systems. Source: Bonan (2008).
Figure 3. General Patterns in Stand Development and Carbon Sequestration. As forests age, predictable shifts in stand structure and underlying physiological processes lead to corresponding shifts in carbon uptake, release and storage. During Stand Initiation, newly establishing vegetation colonizes a site. Following disturbance, growing space is not fully occupied leading relatively low rates of carbon uptake; relatively low standing biomass (and thus total carbon storage) is also characteristic of this phase of development. In Stem Exclusion, rapidly growing trees fully occupy the site and begin vigorous competition. Rates of sequestration (net production) are highest in this stage. As the stand progressing into the Understory Re-initiation phase, disturbance and senescence lead to mortality, growing space in the stand is left unoccupied resulting in a decreased rates of carbon uptake; however, standing carbon pools continue to grow. Carbon storage and respiration are maximized in the Old Growth stage; current sequestration rates are the lowest. Despite high respiration rates and relatively low carbon uptake, there is ample evidence that forests remain sinks for atmospheric carbon even in Old Growth. Source: Covey et al. (2012).
Global carbon
Carb
on s
tock
(Pg
C)
Non forest Forest Tropical forest Temperate forest Boreal forest
2500
2000
1500
1000
500
0
B Stand carbon flux
NEP
(g C
m-2
year
1 )
Tropical forest Temperate forest Boreal forest
400
300
200
100
0
C
HumidEvergreenDeciduous
Semi aridEvergreenDeciduous
Carbon density
Carb
on s
tock
s (T
g C
Km-2
)
Non forest Forest Tropical forest Temperate forest Boreal forest
0.05
0.06
0.07
0.04
0.03
0.02
0.01
0
D
Area
Are
a (m
illio
n km
2 )
Non forest Forest Tropical forest Temperate forest Boreal forest
120
100
80
60
40
20
0
A

F O R E S T S I N A C H A N G I N G C L I M A T E12
a global average of ~2 t C ha-1 yr-1 (Luyssaert et al. 2008). Though their rates of sequestration are lower, old growth forests accumulate biomass over long periods of steady growth and are important stores of carbon. Most of this old growth biomass is stored in the large stems characteristic of these stands. In the tropics ~70% of the variation in above ground biomass can be explained by the density of large trees (Slik et al. 2013).
1.1.2 The Contribution of Deforestation and Forest Degradation to Climate Change
The problem of deforestation and its consequences are well recognized. In addition to reductions in biodiversity (Brook et al. 2003), deforestation and the degradation of forested ecosystems cause substantial losses in terrestrial carbon sequestration and storage (Woodwell et al. 1983). The World Resources Institute estimates that historically forests covered ~47% of the earth’s surface; deforestation, particularly in the tropics, has reduced global forest area to ~30% (WRI 2009). Though recent trends show a reduction in the pace of deforestation, huge areas of forest continue to disappear. An average of 13 million hectares is estimated to have been lost every year during the 2000s as compared with the 16 million hectares a year during the 1990s (Fig.4) (FAO 2010).
Because deforestation — and poor management that leads to degradation — reduces total stored carbon and due the low rate at which these stores are replenished, the loss of forest cover has had a marked effect on global carbon
budgets. The Intergovernmental Panel on Climate Change estimates that 1.6 Pg C yr-1 was lost to deforestation in the 1990s; the majority of this loss was due to deforestation in the tropics (IPCC 2007). Despite a recently slowing rate of deforestation, global forest carbon is still being reduced at a rate of 0.5 Gt yr-1; between now and 2050 as much as 20.3 Pg C could be lost due to fire and deforestation in the Amazon Basin alone (Poulter et al. 2010).
1.2 INITIATIVES, TOOLS & METHODOLOGIES
1.2.1 Sustainable Forest Management for Climate Change Mitigation
Just as the process of deforestation and forest ecosystem degradation can lead to increased emissions of CO2, sustainable management of forests can help to increase carbon sequestration. By preserving existing high-carbon tropical forests and using techniques like reduced impact logging (RIL) when harvesting, managers can increase forest carbon stores (Putz and Pinard 1993). It has also been suggested that managers “move beyond RIL” and enact silviculture that accounts for the complex nature of mixed-species stratified forests by catering to the establishment, and release, of diverse suites of species over long rotation lengths (Sist et al. 2003b, Peña-Claros et al. 2008). Appropriate forest management can increase relative carbon stores by increasing the average carbon stored per acre, or by preventing forest conversion to other uses; in some cases managed forests can even have lower rates of deforestation than in ostensibly protected areas (Cid-Liccardi et al. 2012).
Figure 1.4. Global Annual Average Change in Forest Area. Rates of global forest decline remain significant, particularly in the tropics. Increases in the extent of mid- and high latitude forests offset some of the decline in forest cover; however, these forests sequester carbon more slowly, and have smaller total carbon storage pools. Much of notable decline in forest cover in Brazil, Indonesia and Australia is the result of forest conversion and fire.Source: FAO, 2010.
Net lossMore than 500 000250 000–500 00050 000–250 000
Small change (gain or loss)
Less than 50 000
Net gain
50 000–250 000
250 000–500 000
More than 500 000
F O R E S T S I N A C H A N G I N G C L I M A T E 13
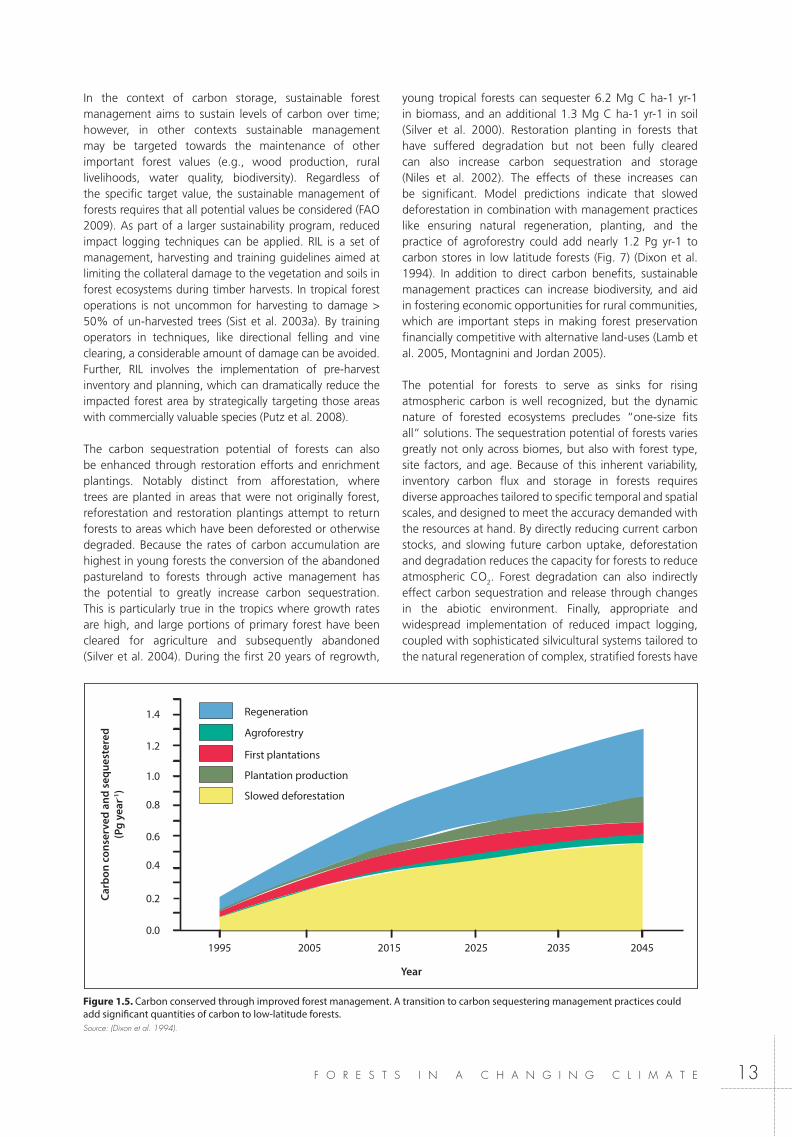
young tropical forests can sequester 6.2 Mg C ha-1 yr-1 in biomass, and an additional 1.3 Mg C ha-1 yr-1 in soil (Silver et al. 2000). Restoration planting in forests that have suffered degradation but not been fully cleared can also increase carbon sequestration and storage (Niles et al. 2002). The effects of these increases can be significant. Model predictions indicate that slowed deforestation in combination with management practices like ensuring natural regeneration, planting, and the practice of agroforestry could add nearly 1.2 Pg yr-1 to carbon stores in low latitude forests (Fig. 7) (Dixon et al. 1994). In addition to direct carbon benefits, sustainable management practices can increase biodiversity, and aid in fostering economic opportunities for rural communities, which are important steps in making forest preservation financially competitive with alternative land-uses (Lamb et al. 2005, Montagnini and Jordan 2005).
The potential for forests to serve as sinks for rising atmospheric carbon is well recognized, but the dynamic nature of forested ecosystems precludes “one-size fits all” solutions. The sequestration potential of forests varies greatly not only across biomes, but also with forest type, site factors, and age. Because of this inherent variability, inventory carbon flux and storage in forests requires diverse approaches tailored to specific temporal and spatial scales, and designed to meet the accuracy demanded with the resources at hand. By directly reducing current carbon stocks, and slowing future carbon uptake, deforestation and degradation reduces the capacity for forests to reduce atmospheric CO
2. Forest degradation can also indirectly effect carbon sequestration and release through changes in the abiotic environment. Finally, appropriate and widespread implementation of reduced impact logging, coupled with sophisticated silvicultural systems tailored to the natural regeneration of complex, stratified forests have
Figure 1.5. Carbon conserved through improved forest management. A transition to carbon sequestering management practices could add significant quantities of carbon to low-latitude forests. Source: (Dixon et al. 1994).
In the context of carbon storage, sustainable forest management aims to sustain levels of carbon over time; however, in other contexts sustainable management may be targeted towards the maintenance of other important forest values (e.g., wood production, rural livelihoods, water quality, biodiversity). Regardless of the specific target value, the sustainable management of forests requires that all potential values be considered (FAO 2009). As part of a larger sustainability program, reduced impact logging techniques can be applied. RIL is a set of management, harvesting and training guidelines aimed at limiting the collateral damage to the vegetation and soils in forest ecosystems during timber harvests. In tropical forest operations is not uncommon for harvesting to damage > 50% of un-harvested trees (Sist et al. 2003a). By training operators in techniques, like directional felling and vine clearing, a considerable amount of damage can be avoided. Further, RIL involves the implementation of pre-harvest inventory and planning, which can dramatically reduce the impacted forest area by strategically targeting those areas with commercially valuable species (Putz et al. 2008).
The carbon sequestration potential of forests can also be enhanced through restoration efforts and enrichment plantings. Notably distinct from afforestation, where trees are planted in areas that were not originally forest, reforestation and restoration plantings attempt to return forests to areas which have been deforested or otherwise degraded. Because the rates of carbon accumulation are highest in young forests the conversion of the abandoned pastureland to forests through active management has the potential to greatly increase carbon sequestration. This is particularly true in the tropics where growth rates are high, and large portions of primary forest have been cleared for agriculture and subsequently abandoned (Silver et al. 2004). During the first 20 years of regrowth,
Regeneration1.4
1.2
1.0
0.8
0.6
0.4
0.2
0.0
1995 2005 2015
Year
Carb
on c
onse
rved
and
seq
uest
ered
(Pg
year
-1)
2025 2035 2045
Agroforestry
First plantations
Plantation production
Slowed deforestation

F O R E S T S I N A C H A N G I N G C L I M A T E14
Figure 1.6. Amazon Basin Biomass Carbon. Model projections of the carbon storage implications from the interaction of fire, climate change and deforestation under various scenarios. Source: Poulter et al. (2010).
Although high levels of moisture generally preclude fire in wet tropical forests, fire is not uncommon in the modern Amazon; indeed, large areas of the Amazon burn every year. Deforestation can have direct effects on the fire susceptibility of tropical systems. Forest clearing facilitates the establishment of fire susceptible grasses and increases the amount of flammable coarse woody debris. In addition to providing fine fuels, clearing alters the abiotic environment. One study found temperatures in deforested areas were nearly 10°C higher and relative humidity 30% lower than in adjacent intact primary forest (Uhl and Kauffman 1990).
The potential exists for these regional and stand level changes to interact with anticipated climate warming, leading to less predictable synergistic outcomes with the potential for significant additional carbon release. Poulter et al (2010) used a global vegetation model in an attempt to disentangle the effects of these complex interactions. Their study showed not only the potential for huge carbon losses in the next century – approximately 40 Pg total - but also the opportunity for changes in governance, management and conservation to prevent this loss, and increase the total carbon stored in standing biomass (Fig. 6). The additive effects of reducing losses, and simultaneously increasing storage made action in the Amazon Basin a top carbon conservation priority. Halting deforestation and
the potential to greatly increase carbon sequestration and storage in forests.
1.3 CASE STUDIES
1.3.1 Tropical Deforestation, Fire and Carbon Loss in the Amazon Basin
Over the past five decades, considerable attention has been paid to the problem of deforestation, habitat fragmentation, and the accompanying loss of ecosystem function in the Amazon Basin — the largest continuous tropical forest in the world (Skole and Compton 1993). The drivers of this environmental degradation shifted from small-scale, state-supported rural farmers in the 1960s to large commercial ranching and timber operations starting in the 1980s, accelerating the pace of forest clearing (Rudel et al. 2009). Regional climate simulations suggest that even in the near term this dramatic forest loss could have substantial consequences for the region. Forest clearing could elevate mean surface temperatures and lengthen the dry season, while at the same time speeding evaporation and reducing precipitation (Lean and Warrilow 1989, Shukla et al. 1990). In addition to hampering restoration efforts, these changes in climate have the potential to dramatically increase the risk of catastrophic fire – and carbon release – in the Amazon.
2020
-20
-10
No deforestation BAU Governance
20
10
0
2040 2060 2080 2100
Year
Chan
ge in
abo
ve g
roun
d liv
ebi
omas
s (P
g C)

F O R E S T S I N A C H A N G I N G C L I M A T E 15
1.4 KEY ISSUES FOR DISCUSSION
1.4.1 The role of forests in the carbon cycleIn order to understand the role that forests play in the carbon cycle, it is important to understand the way that carbon moves through the global carbon cycle. The most common ways that carbon is transferred through the cycle is through primary production, respiration, and fire. Building off the discussion above, define and discuss the terms “sequestration,” “storage” and “flux.” Specifically, how are these different, and why is important to track each of them separately?
1.4.2 Patterns of forest developmentForests are dynamic, constantly developing through species interaction and competition, as well as reacting to external disturbances (Boonan 2008). While the re-initiation of species has the potential to produce innumerable combinations within a forest, there are well recognized patterns of forest development, including stand initiation, stem inclusion, understory reinitiation, and old growth (Oliver and Larson 1996). How does carbon sequestration and storage change as forest stands age? Which forest ages store the most carbon? Which have the largest rates of sequestration?
1.4.3 Distribution of carbon across biomesDifferent forest biomes store carbon and undergo primary production at different rates (Bonan 2008). Therefore, it is easier to compare forests within the same biome type than across biomes. Discuss the distribution of forest carbon across the various biomes. How does the rate of carbon sequestration in forests relate to current carbon stores? Is the total forested area in a biome a good indicator of total carbon stored? Why or why not?
1.4.4 Deforestation and the carbon cycleIt is well recognized that deforestation and degradation have resulted in substantial losses in terrestrial carbon storage and sequestration (Woodwell et al. 1983). This forest loss has been most marked in the tropics, with global forest carbon still being lost at a rate of 0.5 Gt yr -1 (Poulter et al. 2010). Thinking of this carbon loss as part of the carbon cycle, how does deforestation impact carbon sequestration and storage? Discuss tools available, and actions that can be taken to conserve existing forest carbon and encourage more rapid sequestration in the future. Do you think forest management can play a role in decreasing deforestation and increasing terrestrial carbon storage?
implementing rigorous forest governance can prevent the release of massive amounts of CO2 from the Amazon Basin over the next century.
1.3.2 Carbon Sequestration in Wood Products In addition to stand development and harvesting dynamics, the carbon balance of forested ecosystems is impacted by the longevity of the products removed derived from harvested wood (Harmon et al. 1990, Houghton et al. 1999). If a high proportion of wood removed during a harvest is used for long-lived products like houses and furniture, then the carbon lost during harvest can be greatly reduced. If, however, short-lived products like fuelwood or paper are the dominant product, the carbon benefit is often reduced. One study following the life cycle of harvested carbon in India, where fuelwood is a major product, noted that approximately 90% of the carbon removed from the stand was released to the atmosphere in the year after felling; the authors estimated that just 0.8% of the harvested carbon would be sequestered in products after 100 years (Gundimeda 2001). Studies like this one make obvious the carbon advantage of high-value, long-lived products. Because high-value products originate from
well-formed trees that may be more common in managed forests, some authors have suggested that intensively managed stands may sequester more carbon than unmanaged forests (Perez-Garcia et al. 2005); however, these findings remain controversial (Ray et al. 2009). Working in temperate forests, found that harvesting intensity and frequency drove long-term carbon dynamics, with lower intensities and longer intervals leading to greater storage (Nunery and Keeton 2010). While these findings suggest wood products are unlikely to completely offset the carbon lost during harvest, these authors did not consider the effects of using harvested wood products as substitutes for more fossil fuel intensive materials, a potentially important factor (Petersen and Solberg 2005). A comparison of emissions produced through wood-framed and concrete construction demonstrates this substitution effect. Here, the effect can be so strong as to make forest harvesting a net-positive, reducing overall CO2 release to the atmosphere (Gustavsson et al. 2006). Though complex and difficult to measure, the carbon sequestered in wood products and related substitution effects are certainly important considerations in determining the overall climate balance of forested ecosystems.

F O R E S T S I N A C H A N G I N G C L I M A T E16
1.5 REFERENCES
2008. Green Jobs: Towards Decent Work in a Sustainable, Low Carbon World. Nairobi.
2009. UN-REDD Programme Newsletter. Multiple benefits -issues and options for REDD.
2010a. Meeting of the FIP Sub-Committee. Terms of Reference for the development of a dedicated grant mechanism for indigenous peoples and local communities, Manila, Philippines.
2010b. The UN-REDD Programme Strategy 2011-2015, Geneva, Switzerland.
2010c. Using InVEST to Establish Land-based carbon offsets. Natural Capital Project 5.
2010a. Report of FIP Expert Group: Recommendations for Pilots Under the FIP. Manila, Philippines.
2011a. Forests: Investing in natural capital. Towards a Green Economy: Pathways to Sustainable Development and Poverty
2011b. Towards a Green Economy: Pathways to Sustainable Development and Poverty Reduction.
2012a. Forest Investment Program: Indonesia forest investment plan. Jakarta.
2012b. Inclusive Wealth Report 2012. Measuring progress towards sustainability. Cambridge University Press, Cambridge.
2012c. Integrating Ecosystem Services into Development Planning: a stepwise approach for practitioners based on the TEEB approach. ESchborn.
2012d. Moving Beyond GDP. World Bank, Washington D.C.
2012e. The Natural Capital Project. InVEST Tips Sheet: Using InVEST to assess the feasibility of REDD+.
2012f. Working towards sustainable development: opportunities for decent work and social inclusion in a green economy, Geneva.
2013a. Agroforestry crucial to ensure food security of millions, says UN agency. Global Food Security.
2013b. ARIES: ARtificial Intelligence for Ecosystem Services. Introduction to ARIES.
2013c. The Global Partnership on Wealth Accounting and the Valuation of Ecosystem Services: Annual Report. World Bank, Washington D.C.
2013d. Measurement Framework in Support of Sustainable Development and Green Economy Policy. SEEA Briefing Note.
2013a. SEEA Experimental Ecosystem Accounting Briefing Note. SEEA Briefing Note.
Acey, C. S. e. and T. H. Culhane. 2013. Green jobs, livelihoods, and the post-carbon economy in African cities. Local Environment: The International Journal of Justice and Sustaianbility.
Angelsen, A. 2009. Realising REDD+: National strategy and policy options. CIFOR, Bogor, Indonesia.
Ashton, P. M. S. 1992. Establishment and early growth of advance regeneration of canopy trees in moist mixed-species forest. Pages 101-124 in M. J. Kelty, B. C. Larson, and C. D.
Oliver, editors. The ecology and silviculture of mixed-species forest: a festchrift for David M. Smith. Kluwer, Boston.
Beer, C., M. Reichstein, E. Tomelleri, P. Ciais, M. Jung, N. Carvalhais, C. Rödenbeck, M. A. Arain, D. Baldocchi, G. B. Bonan, A. Bondeau, A. Cescatti, G. Lasslop, A. Lindroth, M. Lomas, S. Luyssaert, H. Margolis, K. W. Oleson, O. Roupsard, E. Veenendaal, N. Viovy, C. Williams, F. I. Woodward, and D. Papale. 2010. Terrestrial Gross Carbon Dioxide Uptake: Global Distribution and Covariation with Climate. Science 329:834-838.
Bonan, G. B. 2008. Forests and climate change: Forcings, feedbacks, and the climate benefits of forests. Science 320:1444-1449.
Bormann, F. H. and G. E. Likens. 1981. Pattern and process in a forested ecosystem. Springer-Verlag, New York, NY.
Bowden, R. D., K. J. Nadelhoffer, R. D. Boone, J. M. Melillo, and J. B. Garrison. 1993. Contributions of aboveground litter, belowground litter, and root respiration to total soil respiration in a temperate mixed hardwood forest. Canadian Journal of Forest Research 23:1402-1407.
Brook, B. W., N. S. Sodhi, and P. K. L. Ng. 2003. Catastrophic extinctions follow deforestation in Singapore. Nature 424:420-426.
Camp, A. E. and C. D. Oliver. 2004. Forest Dynamics. Pages 1053-1062 in B. Jeffery, editor. Encyclopedia of Forest Sciences. Elsevier, Oxford.
Cid-Liccardi, C. D., T. Kramer, P. M. S. Ashton, and B. Griscom. 2012. Managing Carbon Sequestration in Tropical Forests. Pages 183-204 in P. M. S. Ashton, M. Tyrrell, D. Spalding, and B. Gentry, editors. Managing Forest Carbon in a Changing Climate. Springer, New York.
Covey, K., J. Orefice, and X. Lee. 2012. The Physiological Ecology of Carbon Science in Forest Stands. Pages 31-49 in M. S. Ashton, M. L. Tyrrell, D. Spalding, and B. Gentry, editors. Managing Forest Carbon in a Changing Climate. Springer Netherlands.
Dickson, B., M. Bertzky, T. Christophersen, C. Epple, V. Kapos, L. Miles, U. Narloch, and K. Trumper. 2012. REDD+ Beyond Carbon: Supporting Decisions on Safeguards and Multiple Benefits. Issue 02.
Dixon, R. K., S. Brown, R. A. Houghton, A. M. Solomon, M. C. Trexler, and J. Wisniewski. 1994. Carbon Pools and Flux of Global Forest Ecosystems. Science 263:185-190.
Doswald, N., M. Osti, and L. Miles. 2010. Methods for assessing and monitoring change in the ecosystem-derived benefits of afforestation, reforestation, and forest restoration.in U. W. C. M. Centre, editor. Multiple Benefits Series 6. Prepared in behalf of the UN-REDD Programme., Cambridge.
FAO. 2009. Sustainable management of forests and REDD+: Negotiations Need Clear Terminology.
FAO. 2010. Global Forest Resources Assessment 2010. Food and Agriculture Organization of the United Nations, Rome.
Franklin, J. F., T. A. Spies, R. V. Pelt, A. B. Carey, D. A. Thornburgh, D. R. Berg, D. B. Lindenmayer, M. E. Harmon, W. S. Keeton, D. C. Shaw, K. Bible, and J. Chen. 2002. Disturbances and structural development of natural forest ecosystems with silvicultural implications, using Douglas-fir forests as an example. Forest Ecology and Management 155:399-423.

F O R E S T S I N A C H A N G I N G C L I M A T E 17
Goodale, C. L., M. J. Apps, R. A. Birdsey, C. B. Field, L. S. Heath, R. A. Houghton, J. C. Jenkins, G. H. Kohlmaier, W. Kurz, S. Liu, G.-J. Nabuurs, S. Nilsson, and A. Z. Shvidenko. 2002. Forest Carbon Sinks In The Northern Hemisphere. Ecological Applications 12:891-899.
Gundimeda, H. 2001. A Framework for Assessing Carbon Flow in Indian Wood Products. Environment, Development and Sustainability 3:229-251.
Gustavsson, L., K. Pingoud, and R. Sathre. 2006. Carbon Dioxide Balance of Wood Substitution: Comparing Concrete- and Wood-Framed Buildings. Mitigation and Adaptation Strategies for Global Change 11:667-691.
Harmon, M. E., W. K. Ferrell, and J. F. Franklin. 1990. Effects on Carbon Storage of Conversion of Old-Growth Forests to Young Forests. Science 247:699-702.
Hernández, S. A., C. Brown, L. Miles, and V. Kapos. 18-22 February 2008. Forest certification: how do Latin American standards address biodiversity? Pages 136-138 Mainstreaming Biodiversity Issues into Forestry and Agriculture, Abstracts of Poster Presentations at the 13th Meeting of the Subsidiary Body on Scientific, Technical and Technological Advice of the Convention on Biological Diversity, Rome, Italy.
Houghton, R. A. 2007. Balancing the Global Carbon Budget. Annual Review of Earth and Planetary Sciences 35:313-347.
Houghton, R. A., J. L. Hackler, and K. T. Lawrence. 1999. The U.S. Carbon Budget: Contributions from Land-Use Change. Science 285:574-578.
IPCC. 2000. Intergovernmental Panel on Climate Change Special Report: Land Use, Land-use Change, and Forestry. Page 375 in R. Watson, I. Noble, B. Bolin, N. Ravindranath, D. Verardo, and D. Dokken, editors. Cambridge University Press, Cambridge.
IPCC. 2007. Climate Change 2007: Mitigation. Contribution of Working Group III to the Fourth Assessment Report of the Intergovernmental Panel on Climate Change. Cambridge University Press, 9.
Kumar, P. 2010. Key Messages and Linkages with National and Local Policies.in P. Kumar, editor. The Economics of Ecosystems and Biodiversity Ecological and Economic Foundations. Earthscan, London and Washington.
Lamb, D., P. D. Erskine, and J. A. Parrotta. 2005. Restoration of Degraded Tropical Forest Landscapes. Science 310:1628-1632.
Lean, J. and D. A. Warrilow. 1989. Simulation of the regional climatic impact of Amazon deforestation. Nature 342:411-413.
Luyssaert, S., E. D. Schulze, A. Borner, A. Knohl, D. Hessenmoller, B. E. Law, P. Ciais, and J. Grace. 2008. Old-growth forests as global carbon sinks. Nature 455:213-215.
Meister, K., P. M. S. Ashton, D. Craven, and H. Griscom. 2012. Carbon Dynamics of Tropical Forests. Pages 51-75 in P. M. S. Ashton, M. Tyrrell, D. Spalding, and B. Gentry, editors. Managing Forest Carbon in a Changing Climate. Springer, New York.
Milakovsky, B., B. R. Frey, and T. James. 2012. Carbon Dynamics in the Boreal Forest. Pages 109-135 in P. M. S. Ashton, M. Tyrrell, D. Spalding, and B. Gentry, editors. Managing Forest Carbon in a Changing Climate. Springer, New York.
Montagnini, F. and C. F. Jordan. 2005. Tropical Forest Ecology: The Basis for Conservation and Management. Springer, New York.
Musampa Kamungandu, C., L. Mane, P. Lola Amani, M. Bertzy, C. Ravilious, M. Osti, L. Miles, V. KApos, and B. Dickson. 2012. Mapping potential biodoversity benefits from REDD+. The Democratic Republic of Congo.in D. UN-REDD Programme, editor. Prepared by UNEP-WCMS; Ministry of the Environment, NAture Conservation and Tourism of the DRC; and the Satellite Observatory for Central African Forests., Cambridge, UK.
Nair, C. T. S. and R. Rutt. 2009. Creating forestry jobs to boost the economy and build a green future. Unasylva 233 60:3-10.
Niles, J. O., S. Brown, J. Pretty, A. S. Ball, and J. Fay. 2002. Potential carbon mitigation and income in developing countries from changes in use and management of agricultural and forest lands. Philosophical Transactions of the Royal Society of London. Series A: Mathematical, Physical and Engineering Sciences 360:1621-1639.
Nunery, J. S. and W. S. Keeton. 2010. Forest carbon storage in the northeastern United States: Net effects of harvesting frequency, post-harvest retention, and wood products. Forest ecology and management 259:1363-1375.
Ocampo, J. A. 2010. The transition to a green economy: benefits, challenges, and risks from a sustainable development perspective Summary of Background Papers.
Odum, E. P. 1969. Strategy of Ecosystem Development. Science 164:262-&.
Oliver, C. D. 1981. Forest Development in North-America Following Major Disturbances. Forest Ecology and Management 3:153-168.
Oliver, C. D. 1992. Similarities of stand structure patterns based on uniformities of stand development processes throughout the world--some evidence and the application to silviculture through adaptive management. Pages 11-26 in M. J. Kelty, B. C. Larson, and C. D. Oliver, editors. The Ecology and Silviculture of Mixed-Species Forests: A Festschrift for David M. Smith. Kluwer Academic Publishers, Boston.
Oliver, C. D. and B. C. Larson. 1996. Forest Stand Dynamics. 2nd edition. John Wiley & Sons, Inc.
Peña-Claros, M., T. S. Fredericksen, A. Alarcón, G. M. Blate, U. Choque, C. Leaño, J. C. Licona, B. Mostacedo, W. Pariona, Z. Villegas, and F. E. Putz. 2008. Beyond reduced-impact logging: Silvicultural treatments to increase growth rates of tropical trees. Forest Ecology and Management 256:1458-1467.
Perez-Garcia, J., B. Lippke, J. Comnick, and C. Manriquez. 2005. An Assessment of Carbon Pools, Storage, and Wood Products Market Substitution Using Life-Cycle Analysis Results. Wood and Fiber Science 37:140-148.
Petersen, A. K. and B. Solberg. 2005. Environmental and economic impacts of substitution between wood products and alternative materials: a review of micro-level analyses from Norway and Sweden. Forest Policy and Economics 7:249-259.
Poulter, B., L. AragÃO, U. Heyder, M. Gumpenberger, J. Heinke, F. Langerwisch, A. Rammig, K. Thonicke, and W. Cramer. 2010. Net biome production of the Amazon Basin in the 21st century. Global Change Biology 16:2062-2075.

F O R E S T S I N A C H A N G I N G C L I M A T E18
Putz, F. E. and M. A. Pinard. 1993. Reduced-Impact Logging as a Carbon-Offset Method. Conservation Biology 7:755-757.
Putz, F. E., P. Sist, T. Fredericksen, and D. Dykstra. 2008. Reduced-impact logging: Challenges and opportunities. Forest Ecology and Management 256:1427-1433.
Rametsteiner, E. and M. Simula. 2003. Forest certification -an instrument to promote sustainable forest management? Journal of Environmental Management 67:87-98.
Ravilious, C., M. Bertzky, and L. Miles. 2011. Identifying and mapping the biodiversity and ecosystem-based multiple benefits of REDD. A manual for the ExploringMultipleBenefits tool.in U. W. C. M. Centre, editor. Multiple Benefits Series 8. Prepared on behalf of the UN-REDD Programme, Cambridge, UK.
Ray, D. G., R. S. Seymour, N. A. Scott, and W. S. Keeton. 2009. Mitigating climate change with managed forests: Balancing expectations, opportunity, and risk. Journal of Forestry 107:50-51.
Rudel, T. K., R. Defries, G. P. Asner, and W. F. Laurance. 2009. Changing Drivers of Deforestation and New Opportunities for Conservation. Conservation Biology 23:1396-1405.
Ryan, M. G. and B. E. Law. 2005. Interpreting, Measuring, and Modeling Soil Respiration. Biogeochemistry 73:3-27.
Schulze, E. D., C. Wirth, and M. Heimann. 2000. Managing Forests After Kyoto. Science 289:2058-2059.
Schwalm, C. R., C. A. Williams, K. Schaefer, R. Anderson, M. A. Arain, I. Baker, A. Barr, T. A. Black, G. Chen, J. M. Chen, P. Ciais, K. J. Davis, A. Desai, M. Dietze, D. Dragoni, M. L. Fischer, L. B. Flanagan, R. Grant, L. Gu, D. Hollinger, R. C. Izaurralde, C. Kucharik, P. Lafleur, B. E. Law, L. Li, Z. Li, S. Liu, E. Lokupitiya, Y. Luo, S. Ma, H. Margolis, R. Matamala, H. McCaughey, R. K. Monson, W. C. Oechel, C. Peng, B. Poulter, D. T. Price, D. M. Riciutto, W. Riley, A. K. Sahoo, M. Sprintsin, J. Sun, H. Tian, C. Tonitto, H. Verbeeck, and S. B. Verma. 2010. A model-data intercomparison of CO2 exchange across North America: Results from the North American Carbon Program site synthesis. Journal of Geophysical Research: Biogeosciences 115:G00H05.
Shugart, H. H., Jr. and D. C. West. 1980. Forest Succession Models. BioScience 30:308-313.
Shukla, J., C. Nobre, and P. Sellers. 1990. Amazon Deforestation and Climate Change. Science 247:1322-1325.
Silver, W. L., L. M. Kueppers, A. E. Lugo, R. Ostertag, and V. Matzek. 2004. CARBON SEQUESTRATION AND PLANT COMMUNITY DYNAMICS FOLLOWING REFORESTATION OF TROPICAL PASTURE. Ecological Applications 14:1115-1127.
Silver, W. L., R. Ostertag, and A. E. Lugo. 2000. The Potential for Carbon Sequestration Through Reforestation of Abandoned Tropical Agricultural and Pasture Lands. Restoration Ecology 8:394-407.
Sist, P., R. Fimbel, D. Sheil, R. Nasi, M.-H. Chevallier, eacute, egrave, and ne. 2003a. Towards sustainable management of mixed dipterocarp forests of South-east Asia: moving beyond minimum diameter cutting limits. Environmental Conservation 30:364-374.
Sist, P., D. Sheil, K. Kartawinata, and H. Priyadi. 2003b. Reduced-impact logging in Indonesian Borneo: some results confirming the need for new silvicultural prescriptions. Forest Ecology and Management 179:415-427.
Skole, D. and T. Compton. 1993. Tropical Deforestation and Habitat Fragmentation in the Amazon: Satellite Data from 1978 to 1988. Science 260:1905-1910.
Slik, J. W. F., G. Paoli, K. McGuire, I. Amaral, J. Barroso, M. Bastian, L. Blanc, F. Bongers, P. Boundja, C. Clark, M. Collins, G. Dauby, Y. Ding, J.-L. Doucet, E. Eler, L. Ferreira, O. Forshed, G. Fredriksson, J.-F. Gillet, D. Harris, M. Leal, Y. Laumonier, Y. Malhi, A. Mansor, E. Martin, K. Miyamoto, A. Araujo-Murakami, H. Nagamasu, R. Nilus, E. Nurtjahya, Á. Oliveira, O. Onrizal, A. Parada-Gutierrez, A. Permana, L. Poorter, J. Poulsen, H. Ramirez-Angulo, J. Reitsma, F. Rovero, A. Rozak, D. Sheil, J. Silva-Espejo, M. Silveira, W. Spironelo, H. ter Steege, T. Stevart, G. E. Navarro-Aguilar, T. Sunderland, E. Suzuki, J. Tang, I. Theilade, G. van der Heijden, J. van Valkenburg, T. Van Do, E. Vilanova, V. Vos, S. Wich, H. Wöll, T. Yoneda, R. Zang, M.-G. Zhang, and N. Zweifel. 2013. Large trees drive forest aboveground biomass variation in moist lowland forests across the tropics. Global
Soepadmo, E. 1993. Tropical rain forests as carbon sinks. Chemosphere 27:1025-1039.
Tallis, H., T. Ricketts, A. Guerry, S. Wood, R. Sharp, E. Nelson, D. Ennaanay, S. Wolny, N. Olwero, K. Vigerstol, D. Pennington, G. Mendoza, J. Aukema, J. Foster, J. Forrest, D. Cameron, K. Arkema, E. Lonsdorf, C. Kennedy, G. Verutes, C.-K. Kim, G. Guannel, M. Papenfus, J. Toft, M. Marsik, J. Bernhardt, and R. Griffin. 2013. InVEST 2.5.3 User’s Guide. The Natural Capital Project. The Natural Capital Project, Stanford.
Tyrrell, M., J. Ross, and M. J. Kelty. 2012. Carbon Dynamics of Temperate Forests. Pages 51-75 in P. M. S. Ashton, M. Tyrrell, D. Spalding, and B. Gentry, editors. Managing Forest Carbon in a Changing Climate. Springer, New York.
Uhl, C. and J. B. Kauffman. 1990. Deforestation, Fire Susceptibility, and Potential Tree Responses to Fire in the Eastern Amazon. Ecology 71:437-449.
Woodwell, G. M., J. E. Hobbie, R. A. Houghton, J. M. Melillo, B. Moore, B. J. Peterson, and G. R. Shaver. 1983. Global deforestation: contribution to atmospheric carbon dioxide. Journal Name: Science (Washington, D.C.); (United States); Journal Volume: 222:4628:Medium: X; Size: Pages: 1081-1086.
WRI. 2009. Forest Landscape Initiative.in W. R. Institute, editor. World Resources Institute.

F O R E S T S I N A C H A N G I N G C L I M A T E 19
APPENDIX I. FOREST CARBON POOLS BY BIOME (ADAPTED FROM MILAKOVSKY ET AL. (2012), TYRRELL ET AL. (2012) AND MEISTER ET AL. (2012))
Boreal Forests Carbon pools (Mg C ha-1)
Source Site characteristics Above Ground Biomass Bryophytes/mosses
Litter Soil
Location Forest type Age
Malhi et al. (1999)
Interior Canada Black Spruce Sphagnum site
115 49.2 (11%) 6.2 (1%) 390.4 (85%)
Goulden et al. (1998)
Interior Canada Black Spruce 120 40 ± 20 (14%) 45 ± 13 (16%) 200 ± 50 (70%)
Goulden et al. (1998)
Interior Canada Black Spruce 120 40 ± 20 (23%) 46 ± 13 (26%) 90 ± 51 (70%)
Gower et al. (1997)
Interior Canada Black Spruce 115-155 49.2–57.2 (11–12%) 390.4–418.4 (87–88%)
Aspen 53–67 57.0–93.3 (32–59%) 15.9–19.4 (9–12%)
36.0–97.2 (23–55%)
Jack pine 25 7.8–12.3 (10–24%) 18.1–40.3 (36–53%)
20.2–28.4 (37–40%)
Jack pine 65 29.0–34.6 (42–51%) 3.5-5.1 (5-7%) 11.5–14.6 (17–21%)
14.2–25.8 (20–38%)
Temperate Forests Carbon Pools (Mg C ha-1)
Source Forest type Stand age
Above grounda
Below ground
Litter & CWD
Organic soil
horizons
Soil Soil sample depth (cm)
Barford et al. (2001)
1 Oak-dominated hardwood, Massachusetts, USA
30–100 100
Fahey et al. (2005)
1 Northern hardwood, NewHampshire, USA
70–100 95 25 13 30 127 20+
Bascietto et al. (2004)
1 European beech Germany
70–150 132–177
Edwards et al. (1989)
1 Oak/hickory, Tennessee, USA
41–83 92–109 15–16 55 100
Fang et al. (2005)
1 All – Japan 27.6 6
Finzi et al. (1998)
1 Mixed hardwood/hemlock, Connecticut, USA
59–75 15
Gough et al. (2008)
1 Mixed northern hardwood, Michigan, USA
6–90 (average = 85)
76 23 4 80 Unreported
Hanson et al. (2003)
1 Oak, Tennessee, USA 58–100 108 4 4 64 100
Harris et al. (1975); Edwards et al. (1989)
1 Tulip poplar, Tennessee, USA
41–83 90–96 2–9 97–125 100
Malhi et al. (1999)
1 Oak-Hickory, Tennessee, USA
55 79a 7–11 8–27 (w/roots)
7–55 Unreported

F O R E S T S I N A C H A N G I N G C L I M A T E20
Temperate Forests Carbon Pools (Mg C ha-1)
Source Forest type Stand age
Above grounda
Below ground
Litter & CWD
Organic soil
horizons
Soil Soil sample depth (cm)
Morrison (1990) 1 Sugar maple, Ontario, Canada
Old growth
104–122a 14–16 185–202 100
Ruark and Bockheim (1988)
1 Quaking aspen, Wisconsin, USA
8–66 17–74a 4–8 4–9 33–65 60
Yuan et al. (2008)
1 White pine, Ontario, Canada
65 83 17
Peichl and Arain (2006)
1 White pine, Ontario, Canada
15 40 5 34 Unreported
Peichl and Arain (2006)
1 White pine, Ontario, Canada
30 52 9 30 Unreported
Peichl and Arain (2006)
1 White pine, Ontario, Canada
65 100 19 37 Unreported
Yuan et al. (2008)
1 Balsam-fir, New Brunswick, Canada
27 78 18
Zhang and Wang (2010)
1 Various hardwood/conifer, Northeastern China
42–59 105 6 161 Unreported
Zhu et al. (2010)
1 Montane conifer/birch, Northeastern China
100+ 124 29 14 70 100
Law et al. (2003)
2 Pinus ponderosa, Oregon, USA
20 6 3 12 99 100
Law et al. (2003)
2 Pinus ponderosa, Oregon, USA
70 53 17 10 76 100
Law et al. (2003)
2 Pinus ponderosa, Oregon, USA
100 102 33 20 102 100
Law et al. (2003)
2 Pinus ponderosa, Oregon, USA
250 134 42 14 64 100
Law et al. (1999, 2000)
2 Pinus ponderosa, Oregon, USA
Mixed 98
Hamilton et al. (2002)
2 Loblolly pine, North Carolina, USA
15 51 10
Hooker and Compton (2003)
2 White pine, Rhode Island, USA
10–114 8–183a 0–33 58–102 70
Maier and Kress (2000)
2 Loblolly pine, North Carolina, USA
11 11–22 3–7
Sharma et al. (2010)
3 Montane oak, Garhwal, India
Old growth
115
Mendoza-Ponce and Galicia (2010)
3 Montane pine, Mexico
12 106 1 7
Mendoza-Ponce and Galicia (2010)
3 Montane pine, Mexico
30 63 1 8
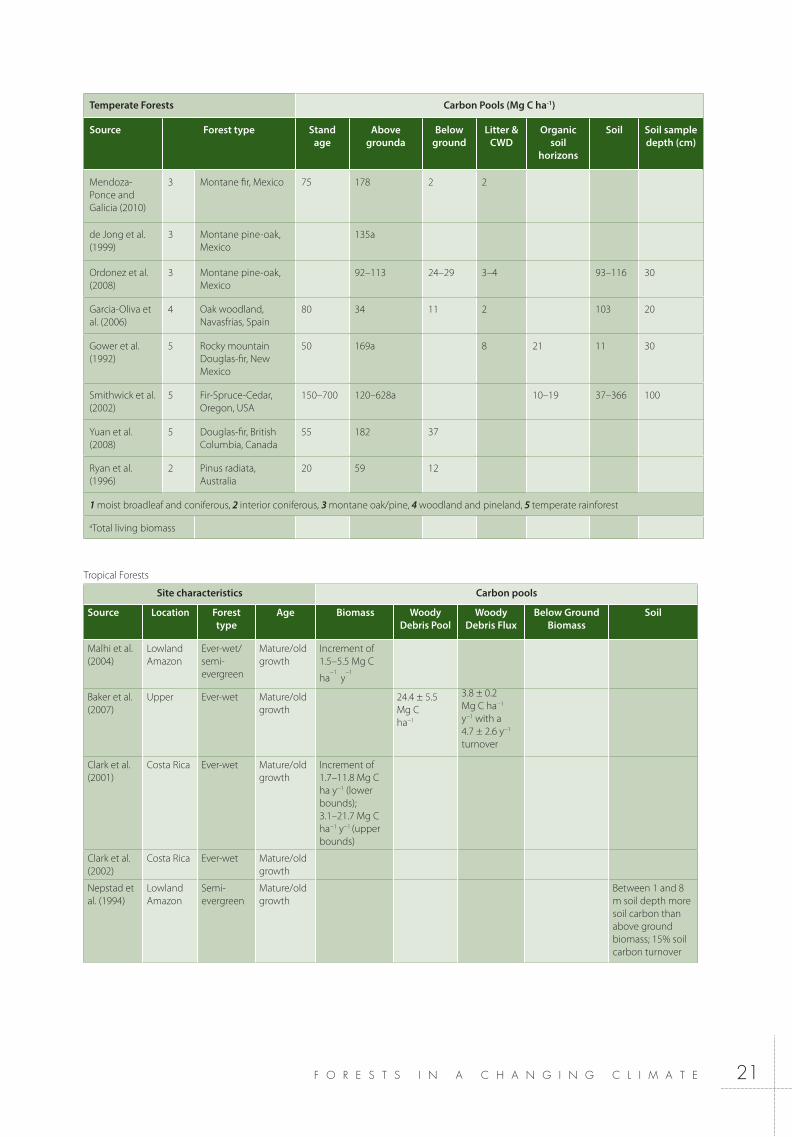
F O R E S T S I N A C H A N G I N G C L I M A T E 21
Temperate Forests Carbon Pools (Mg C ha-1)
Source Forest type Stand age
Above grounda
Below ground
Litter & CWD
Organic soil
horizons
Soil Soil sample depth (cm)
Mendoza-Ponce and Galicia (2010)
3 Montane fir, Mexico 75 178 2 2
de Jong et al. (1999)
3 Montane pine-oak, Mexico
135a
Ordonez et al. (2008)
3 Montane pine-oak, Mexico
92–113 24–29 3–4 93–116 30
Garcia-Oliva et al. (2006)
4 Oak woodland, Navasfrias, Spain
80 34 11 2 103 20
Gower et al. (1992)
5 Rocky mountain Douglas-fir, New Mexico
50 169a 8 21 11 30
Smithwick et al. (2002)
5 Fir-Spruce-Cedar, Oregon, USA
150–700 120–628a 10–19 37–366 100
Yuan et al. (2008)
5 Douglas-fir, British Columbia, Canada
55 182 37
Ryan et al. (1996)
2 Pinus radiata, Australia
20 59 12
1 moist broadleaf and coniferous, 2 interior coniferous, 3 montane oak/pine, 4 woodland and pineland, 5 temperate rainforest
aTotal living biomass
Tropical Forests
Site characteristics Carbon pools
Source Location Forest type
Age Biomass Woody Debris Pool
Woody Debris Flux
Below Ground Biomass
Soil
Malhi et al. (2004)
LowlandAmazon
Ever-wet/semi-evergreen
Mature/old growth
Increment of 1.5–5.5 Mg C
ha−1 y
−1
Baker et al.(2007)
Upper Ever-wet Mature/old growth
24.4 ± 5.5 Mg Cha−1
3.8 ± 0.2 Mg C ha−1 y−1 with a 4.7 ± 2.6 y−1 turnover
Clark et al. (2001)
Costa Rica Ever-wet Mature/old growth
Increment of1.7–11.8 Mg C ha y−1 (lower bounds); 3.1–21.7 Mg C ha−1 y−1 (upper bounds)
Clark et al. (2002)
Costa Rica Ever-wet Mature/old growth
Nepstad et al. (1994)
LowlandAmazon
Semi- evergreen
Mature/old growth
Between 1 and 8 m soil depth more soil carbon than above ground biomass; 15% soil carbon turnover

F O R E S T S I N A C H A N G I N G C L I M A T E22
Site characteristics Carbon pools
Source Location Forest type
Age Biomass Woody Debris Pool
Woody Debris Flux
Below Ground Biomass
Soil
Feeley et al. (2007)
Lowland Malaya; Panama
Ever-wet Mature/old growth
Decreases in growth recorded in 24–71% trees in Panama; 58–95% trees in Malaya
Espeleta and Clark (2007)
Costa Rica Ever-wet Mature/old growth
Houghton et al. (2001)
Amazon Ever-wet/ Semi- evergreen
Mature/old growth
Mean total standing and below ground biomass 177 Mg C ha−1
Ten fold variation over 7 year period; four fold change across edaphic gradient of soil water availability/fertility
Lewis et al. (2004)
Amazon Ever-wet/ Semi- evergreen
Mature/old growth
Basal area has been increasing at 0.10 ± 0.04 M2 ha−1 y−1 between 1971 and 2002
Lewis et al. (2009)
CentralAfrica
Ever-wet/ Semi- evergreen
Mature/old growth
Above-ground biomass has been increasing at 0.63 Mg C ha−1 y−1
Phillips et al. (2008)
Amazon Ever-wet/ Semi- evergreen
Mature/old growth
Above-ground biomass has been increasing at 0.62 Mg C ha−1 y−1
Robinson(2007)
TropicalForests
68% higher amounts of below-ground biomass than previously estimated
Paoli and Curran (2007)
Borneo Ever-wet Mature/old growth
Above-ground biomass increment5.8–23.6 Mg ha−1 y−1
Annual fine litter input 5.1–11.0Mg ha−1 y−1
Total amounts of annual NPPrelated to soil fertility– phosphorus
Whigham et al. (1991)
Yucatan, Mexico
Semi- evergreen
Early secondary
A hurricane can increase dead and downed coarse woody debris by 50%
Wilcke et al. (2004)
Ecuador Montane Mature/old growth 9.1 Mg ha−1
biomass

F O R E S T S I N A C H A N G I N G C L I M A T E 23
2.1 FUNDAMENTALS
M O D U L E 2The multiple benefits of forests
Figure 2.1. Graphic typology of forests’ ecosystem services
2.1.1 Ecosystem services: linking ecosystems and society
The vast array of goods and services obtained directly or indirectly from nature to improve human welfare are known as ‘ecosystem services’ (Hassan et al., 2005 p. 27). These services are the linkages between a set of biophysical structures and functions and a set of benefits society enjoys. This complex interaction between ecosystems6 and human well-being have been present for as long as history has been recorded. Still, it was not until a few decades ago that natural capital’s relevance to human welfare was acknowledged. The concept of ecosystem service was first introduced by the Study of Critical Environmental Problems (1970) and entered a phase of redefinition and framing during the following two decades (de Groot R. S., 1987; Daily, 1997; Mooney & Ehrlich, 1997; Costanza, et al., 1997; Fisher et al., 2009; Gómez-Baggethun et al., 2009). It was not until the early 2000s, with the declaration of the Millennium Development Goals and the publication of the Millennium Ecosystem Assessment (2005), that ecosystem services became a part of international policy agenda.
In order to classify and easily identify ecosystem6 services four broad categories have been recognized: provision, regulation, support, and cultural services (see Fig. 2.1). Provisioning services refer to those products people obtain directly from ecosystems. Examples of these include food, fuel, fiber, medicinal materials, fresh water, and genetic resources. Regulating services are those obtained from the regulation of ecosystem processes, like air quality maintenance, climate and water regulation, erosion control, regulation of plagues and diseases, and pollination. Supporting services are indirect services necessary to produce other ecosystem services, such as habitats, photosynthesis, nutrient cycling, and soil formation. Cultural services denote non-material services that people obtain through recreation, education and science, aesthetics appreciation, and cognitive experiences (Costanza, 1997; de Groot, 2002; Hassan et al., 2005 p.
6 Ecosystems understood as the set of communities, populations, species, genes, and abiotic components that interact in a finite space and time, including humans.
ECOSYSTEM SERVICESBiophysical structures
and functions for human welfare
PROVISION
CULT
URA
L REGU
LATION
SUPPORT
FibreN
utrient cycling
Fuel
Photosynthesis
Food
Habitat
Spiritual and
cognitive
experiences
Pollination
Aesthetics
Regulation
plagues and diseases
Science
Erosion controlEducation
Water regulation
Recreation
Climate
regulation
Soil formation
Air quality
Genet
ic re
source
s
Med
ical
m
ater
ials
Fres
h w
ater

F O R E S T S I N A C H A N G I N G C L I M A T E24
29; de Groot, 2010, pp. 39-40). These ecosystem services are underpinned by biodiversity and constitute potential benefits that may be achieved if REDD+ is successful in maintaining and enhancing forests (Dickson & Osti, 2010, p. 4).
In this context, the conservation of forests through REDD+ activities that go beyond carbon-only approaches offers an opportunity to maintain, restore, and enhance multiple ecosystem services through environmental, social, and economic benefits. By securing the provision of ecosystem services and improving social benefits, REDD+ has the potential to draw on broader constituencies; demonstrate that it is achieving a broader range of values; and even generate additional income (Dickson et al. 2012). At the same time that these social and environmental benefits imply certain opportunities, they entail risks that are further discussed in Module 9 of this sourcebook.
Understanding the additional benefits that REDD+ has to offer, besides carbon sequestration, is of great importance to design and implement effective strategies, initiatives, and tools to enhance environment, society, and economic welfare.
2.1.2 Benefits of forests in a REDD+ contextEcosystem services, by definition, contribute to human well-being through environmental, social, and economic
benefits. This section briefly describes each type of benefit and how they can be analyzed to better support REDD+ decision-making processes.
Environmental benefits refer to the interactions between biophysical structures and functions that allow human subsistence through provisioning, regulating, and supporting ecosystem services. Estimating these benefits can be done through different techniques, including biophysical indexes, spatial analyses, direct economic welfare, or even by approximations of their indirect use. Benefits related to the environment can be enhanced through human actions, for example by restoring watersheds or improving watershed management.
Social benefits include cultural services as well as recognition of indigenous rights, poverty alleviation, gender equity, equitable land tenure, and participatory governance assessments. Designing REDD+ initiatives that recognize social benefits, incorporate local communities, and are based on informed decisions can improve livelihoods and bring into consideration new job opportunities that could have been overlooked without a multiple benefit approach (see Module 9 of this sourcebook for further information on environmental and social safeguards).
The economic values that ecosystem services provide to humans are known as economic benefits. In this sense,
Improving economic welfare – sustainable supply of mushrooms being sold at market, sourced from healthy forests nearby
Fion
a Pa
umga
rten/
CIF
OR

F O R E S T S I N A C H A N G I N G C L I M A T E 25
to better capture ecosystem services’ benefits and assess tradeoffs to conserve natural resources, various valuation techniques have been developed to assign monetary values to ecosystem services.
Benefits provided by forests interact in different ways and can be grouped into ‘bundles’ (Cumming & Peterson, 2005, p. 47; Farley & Costanza, 2010). For example, a freshwater bundle includes services like water quality, erosion control, nutrient cycling, and fauna and microorganism habitat conditions, among others. Potentially, if ecosystem services are managed in clusters, better synergies can be weaved to conserve ecosystems (Redford & Adams, 2009) and thus achieve sustainable resource management. Although the bundle-approach is quite new within the study of ecosystem services, it is a great opportunity to include them in payment for environmental services programmes (Porras et al., 2008, p. 8; Wendland et al., 2010; Maes et al., 2011, p. 58; Estrada Carmona & DeClerck, 2012, p. 203) and a multiple benefit approach to REDD+ mechanisms.
The fact that many REDD+ projects are in areas with rich biodiversity and ecosystem services, demonstrates the possibility of having multiple environmental, social, and economic benefits. Yet, the extent to which these multiple benefits will be delivered at national programme scale depends on the design and implementation of REDD+. The UN-REDD Programme supports these efforts through consultation with pilot countries; developing a framework for understanding factors that determine land use and land-use change; doing spatial analyses; developing tools to assist decision makers in promoting synergies, addressing conflicts, and managing trade-offs; offering international consultative workshops on multiple benefits; and providing regional training on the use of the tools developed (2009).
2.2 INITIATIVES, TOOLS & METHODOLOGIES
2.2.1 Mapping benefitsIn order to identify and map the biodiversity and ecosystem-based multiple benefits, UN-REDD and the German Environment Ministry (BMU) have funded the development of a multiple benefits mapping toolbox. These raster geospatial analysis tools help to identify, map, and understand the spatial relationship between ecosystem carbon stocks, other ecosystem services, biodiversity, land-use, and pressures on natural resources.
The ultimate objective of this toolbox is designed to be a starting point for decision-making on REDD+ activities by bringing multiple benefits to the table and open discussions onhow best to incorporate them into spatial planning. The tool box can be adapted to specific national priorities and needs. The tools are designed to: enable rapid assessments of carbon stocks based on best available data; the identification of areas where REDD+ can potentially secure biodiversity and other ecosystem services in addition to carbon; and illustrate the distribution of carbon stocks in relation to land-use
plans; and the identification of areas of importance based on multiple ecosystem services benefits. The maps and statistics generated using this toolbox can assist countries in identifying what spatial distribution of REDD+ activities will promote and support the environmental and social safeguards. This tool is not designed to prepare carbon datasets that meet the requirements of REDD+ Measuring, Reporting, and Verification (MRV); rather to produce a rapid assessment of carbon stocks to allow analyses of this type where an accepted national map is not yet available (Ravilious et al. 2011).
2.2.2 Monitoring additional REDD+ impactsWhile carbon sequestration has been taken as the primary objective for REDD+, the protection and enhancement of other ecosystem-based benefits can also be achieved through sustainable forest management practices. However, the only way to ensure that ecosystem functions are being enhanced is through assessments. Therefore, monitoring is essential where there is a desire to assess the changes in the delivery of ecosystem services (Doswald et al. 2010).
The objective of monitoring systems is to measure changes in the condition of the resource(s) of interest. In this case, monitoring for REDD+ impacts focuses on ensuring that benefits are taking place as part of sustainable forest practices. One way to define which indicators to use is through the Driving Force-Pressure-State-Impact Response (DPSIR) framework, which aims to describe the interactions between society and the environment. Indicators used under the DPSIR framework include: driving forces that are affecting the conditions of that natural resource; pressures, or factors causing harm to the resource of interest; state of the natural resource; impacts, that track the negative effects of different practices; and response, referring to those indicators that track the efforts made with regards to the desired objective. The selection of reliable indicators will be essential to implement the monitoring system (Doswald et al. 2010).
Reporting and verification of these indicators can vary according to the natural resource being assessed. Transparency, consistency, and accuracy are three principles to keep in mind for reporting. Verification, on the other hand, allows for the process to become more credible and can potentially increase local people’s involvement with the project by doing community-based in situ monitoring. Indigenous and local communities’ knowledge could significantly contribute to verification processes making of REDD+ a successful and inclusive scheme.
2.2.3 Methods for valuing economic benefits of forests
From an economic point of view, resource valuation techniques help better allocate resources for society. These techniques are used to economically value multiple benefits, and its effectiveness depends upon identifying the additional benefit and its use(s) and analyzing the market dynamics.

F O R E S T S I N A C H A N G I N G C L I M A T E26
then hypothetical markets can be modeled in order to elicit values. Therefore, three method categories have been identified: direct market valuation approach, revealed preference approach, and stated preferences approach (see Appendix 2.1). Direct market valuation approaches refer to the exchange value that ecosystem services have in trade, mainly applicable to provision services, but also relevant for regulation and support services (Barbier et al., 2011). Revealed preference approaches are based on the observation of individual choices in existing markets related to the ecosystem service that is subject to valuation (Pascual & Muradian, 2010, p. 200). This way, economic agents reveal preferences through choices. In contrast, stated preference approaches simulate scenarios that involve surveys addressing hypothetical changes in the provision of ecosystem services.
Figure 2.2. Biomass carbon map for the Democratic Republic of the CongoSource: Musampa Kamungandu et al. (2012)
The Economics of Ecosystems and Biodiversity (TEEB) reports compile a valuation database, disaggregated by biome, region, and ecosystem service. The TEEB approach suggests that economic values of ecosystem services’ benefits account for the total economic value (TEV) of the benefit provided at a given ecological point and the resilience value of the given ecosystem (Pascual & Muradian, 2010, p. 239). Within this framework, valuation techniques focus mainly on use values and are measured in monetary terms (Farber et al., 2002), allowing for easier comparisons.
Information to assess values is derived from individual behaviors provided by market transactions. In the absence of markets, price information can be taken from indirect means of value assessment. If none of the above exists,
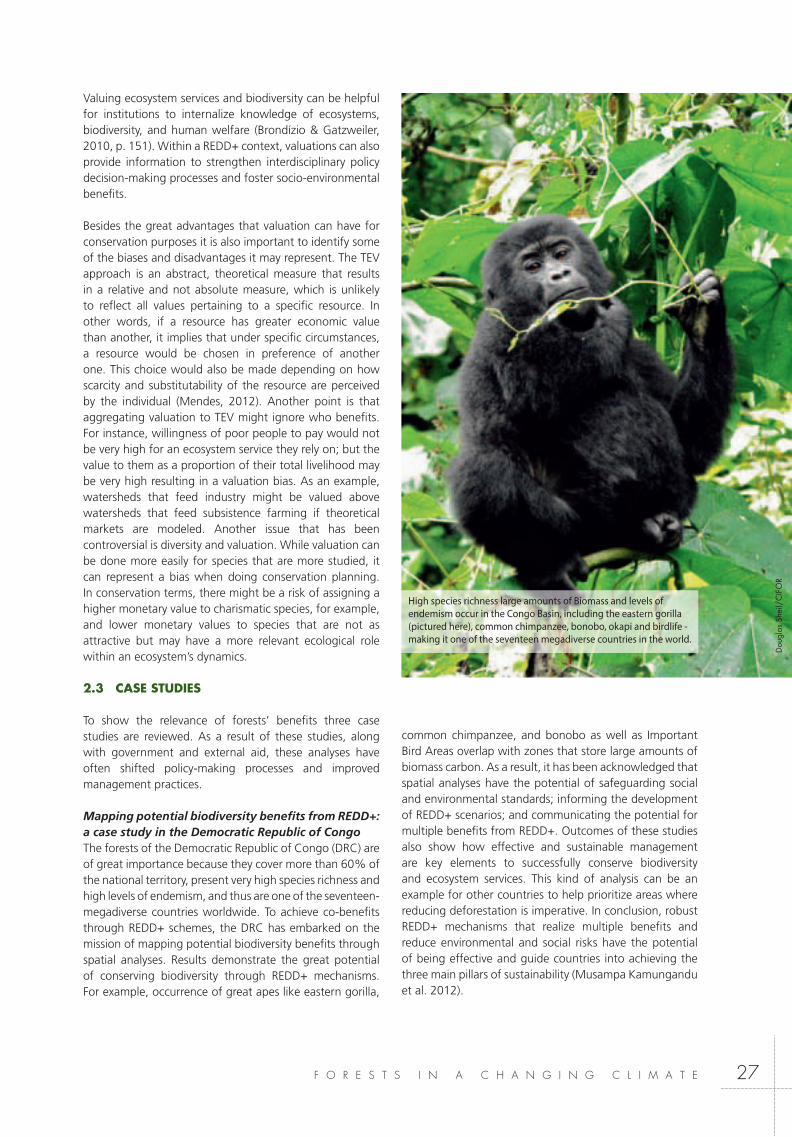
F O R E S T S I N A C H A N G I N G C L I M A T E 27
Valuing ecosystem services and biodiversity can be helpful for institutions to internalize knowledge of ecosystems, biodiversity, and human welfare (Brondízio & Gatzweiler, 2010, p. 151). Within a REDD+ context, valuations can also provide information to strengthen interdisciplinary policy decision-making processes and foster socio-environmental benefits.
Besides the great advantages that valuation can have for conservation purposes it is also important to identify some of the biases and disadvantages it may represent. The TEV approach is an abstract, theoretical measure that results in a relative and not absolute measure, which is unlikely to reflect all values pertaining to a specific resource. In other words, if a resource has greater economic value than another, it implies that under specific circumstances, a resource would be chosen in preference of another one. This choice would also be made depending on how scarcity and substitutability of the resource are perceived by the individual (Mendes, 2012). Another point is that aggregating valuation to TEV might ignore who benefits. For instance, willingness of poor people to pay would not be very high for an ecosystem service they rely on; but the value to them as a proportion of their total livelihood may be very high resulting in a valuation bias. As an example, watersheds that feed industry might be valued above watersheds that feed subsistence farming if theoretical markets are modeled. Another issue that has been controversial is diversity and valuation. While valuation can be done more easily for species that are more studied, it can represent a bias when doing conservation planning. In conservation terms, there might be a risk of assigning a higher monetary value to charismatic species, for example, and lower monetary values to species that are not as attractive but may have a more relevant ecological role within an ecosystem’s dynamics.
2.3 CASE STUDIES
To show the relevance of forests’ benefits three case studies are reviewed. As a result of these studies, along with government and external aid, these analyses have often shifted policy-making processes and improved management practices.
Mapping potential biodiversity benefits from REDD+: a case study in the Democratic Republic of CongoThe forests of the Democratic Republic of Congo (DRC) are of great importance because they cover more than 60% of the national territory, present very high species richness and high levels of endemism, and thus are one of the seventeen-megadiverse countries worldwide. To achieve co-benefits through REDD+ schemes, the DRC has embarked on the mission of mapping potential biodiversity benefits through spatial analyses. Results demonstrate the great potential of conserving biodiversity through REDD+ mechanisms. For example, occurrence of great apes like eastern gorilla,
common chimpanzee, and bonobo as well as Important Bird Areas overlap with zones that store large amounts of biomass carbon. As a result, it has been acknowledged that spatial analyses have the potential of safeguarding social and environmental standards; informing the development of REDD+ scenarios; and communicating the potential for multiple benefits from REDD+. Outcomes of these studies also show how effective and sustainable management are key elements to successfully conserve biodiversity and ecosystem services. This kind of analysis can be an example for other countries to help prioritize areas where reducing deforestation is imperative. In conclusion, robust REDD+ mechanisms that realize multiple benefits and reduce environmental and social risks have the potential of being effective and guide countries into achieving the three main pillars of sustainability (Musampa Kamungandu et al. 2012).
High species richness large amounts of Biomass and levels of endemism occur in the Congo Basin, including the eastern gorilla (pictured here), common chimpanzee, bonobo, okapi and birdlife - making it one of the seventeen megadiverse countries in the world.
Dou
glas
She
il/C
IFO
R

F O R E S T S I N A C H A N G I N G C L I M A T E28
Valuing the Benefits of Non-Timber Forest Products in the Congo BasinNon-timber forest products (NTFP) have been identified as the most valuable products obtained from the Congo Basin because of their importance to rural livelihoods, providing jobs, income, health, and environmental services (Ndoye & Chupezi Tieguhong, 2004). Efforts to value these products include direct market valuations of bushmeat and others, like edibles, medicines, and handicraft materials. Estimations of total volume of bushmeat harvesting are
The supply of the five main NTFP -honey, Gnetum spp., African mango (Irvingia spp.), sfou (Dacryodes edulis), and red stinkwood (Prunus africana) - have an annual turnover of US $45 million, while the annual income for
main NTFP and medicinal plants exports have an estimated value of US $96 million (Nhlom, 2011). While these economic values reflect the importance of NTFP for local incomes, it also raises questions about the sustainability of product exploitation. The reality of Congo Basin countries is that there is a lack of legal frameworks that regulate NTFP harvest, extraction is very costly because of poor infrastructure, and sustainable management is an issue left as a secondary priority. Opportunities to improve the NTFP sector rely on working with different stakeholders – especially women who often are a majority in this sector - to have participative policy options and secure tenure; increasing employment by having local professionals in the sector; and improving sustainable harvest techniques (Ingram et al., 2005, pp. 149-153). REDD+ schemes can allow for sustainable use and ensure social safeguards are put into practice.
Payment for Environmental Services Scheme in Mexico to Conserve Bundles of Ecosystem Service Mexico’s PES program7 was first implemented in 2003 with the objective of having voluntary transactions in which users of ecosystem services would pay landowners for ecosystem services provided in their properties8. Although the initial implementation of the program faced several difficulties, including few financial resources, a shortage of staff, and few monitoring and verification tools, the program has thus far shown to be successful. Currently, this program pays for hydrological and biodiversity services allowing different regions to receive payments according to the service they primarily provide. Funding has increased over the years and has had positive impacts at a national scale covering 3.2 million ha, around 1.6% of Mexico’s territory (SEMARNAT, 2012, p. 109). Both the Mexican
7 Payment for Environmental Services (PES) systems initially argued that payments would bring together buyers and sellers to achieve conservation and development objectives (van Noordwijk, et al., 2012). For example, a payment for biodiversity would benefit both the landowner and avoid land use change as a result of the compensation payment.
8 A second objective to this program was additionality, which consisted on achieving behavioral changes of landowners, e.g. conserving instead of converting their land.
and Costa Rican PES programmes were pioneering in Latin America, and have served as examples for other countries in the region. If PES schemes are to be part of REDD+ initiatives, further research should look into identifying behavioural changes regarding conservation and productive activities as a follow up result. Other issues that ought to be considered include accountability at community and national levels, design of payment contracts and permanence of the program, and allocation or use of money once the payment reaches the landowner (Alix-García et al., 2009).

F O R E S T S I N A C H A N G I N G C L I M A T E 29
Measuring and mapping: limitationsMeasuring and mapping biodiversity and other ecosystem services are needed to determine where REDD+ schemes might have more impacts. However, it is not always clear how different environmental services and biodiversity can best be quantified. For example, measuring biodiversity can be done to a certain extent but it is very difficult to draw accurate numbers. Indexes and indicators have been proposed in order to better inform policy decisions that can have impacts on biodiversity. An alternative is to use areas that have already been identified as a conservation priority (such as Key Biodiversity Areas) to support decision-making. Mapping ecosystem services is also a big issue that keeps being discussed. Not all environmental services can be mapped and even if they could be, there are still many restrictions regarding accuracy. Limitations must be acknowledged in REDD+ schemes, and it is essential to develop more accurate tools for REDD+ success. In this context, which other quantification and mapping tools could be used?
Intrinsic valuesAs discussed in section 2.2, there is great opportunity for valuation to be used for better decision-making. However, some caveats which exist need to be further discussed and considered, because they remain so controversial. The intrinsic characteristic of certain ecosystem services is independent of any use – direct or indirect – associated to them (O’Neill, 1992), and some argue that there is little need for the quantification of economic values if the policy choice is based primarily on ethical values. From an economic point of view, and utilitarian approach, intrinsic characteristics are often associated to existence values; thus, resulting in a potential substitution of the conferred benefit. From a non-utilitarian perspective, intrinsic values can potentially limit consumption and substitution possibilities (Stern, 1997). How can economic valuation restraints be better acknowledged within a REDD+ context? Should economic values be put on intrinsic values?
Commodification of natureValuing ecosystem services has been a controversial topic since it first began. The idea of deliberately assigning an economic value to ecosystem services has been termed ‘commodization’ (Castree, 2003). Hence, whenever an ecosystem is commoditized this is expressed in monetary terms and has mistakenly been taken as a price value. Valuing ecosystem services does not necessarily mean pricing or transforming ecosystem services into marketable goods and services at the owner or state’s best convenience. Also, it does not imply the privatization of ecosystem services. Yet, monetary valuations have not been accepted by many and continue to be a controversial topic (Kosoy & Corbera, 2010). How can valuation be used as a tool for better and consented decision-making processes?
2.4 KEY ISSUES FOR DISCUSSION

F O R E S T S I N A C H A N G I N G C L I M A T E30
2.5 REFERENCES
Alix-García, J., de Janvry, A., Sadoulet, E., & Torres, J. (2009). Lessons Learned from Mexico’s Payment for Environmental Services Program. En L. Lipper, T. Sakuyama, R. Stringer, & D. Zilberman, Payment for Environmental Services in Agricultural Landscapes. Online: Springer.
Adamowicz, W., Louviere, J., & Williams, M. (1994). Combining Revealed and Stated Preference Methods for Valuing Environmental Amenities. Journal of Environmental Economics and Management , 26, 271-292.
Adger, W., Brown, K., Cervigni, R., & Moran, D. (1995). Total Economic Value of Forests in Mexico. Ambio , 24 (5), 286-296.
Barbier, E. B., Hacker, S. D., Kennedy, C., Koch, E. W., Stier, A. C., & Silliman, B. R. (2011). The Value of Estuarine and Coastal Ecosystem Services. Ecological Monographs , 81 (2), 169-193.
Bockstael, N. E., Freeman, A., Kopp, R. J., Portney, P. R., & Smith, V. (2000). On Measuring Economic Values for Nature. Environmental Science Technology , 34, 1384-1389.
Boyd, J., & Banzhaf, S. (2007). What are Ecosystem Services? the Need for Stndardized Environmental Accounting Units. Ecological Economics , 63 (2-3), 616-626.
Bonan, G. B. (2008). Forests and Climate Change: Forcings, Feedbacks, and the Climate Benefits of Forests. Science , 320, 1444-1449.
Brondízio, E. S., & Gatzweiler, F. W. (2010). The Socio-cultural Context of Ecosystem and Biodiversity Valuation. En P. Kumar (Ed.), The Economics of Ecosystems and Biodiversity Ecological and Economic Foundations (págs. 149-182). Washington, D.C., USA: Island Press.
Cumming, G., & Peterson, G. (2005). Chapter 3: Ecology in Global Scenarios. En S.
Carpenter, P. Pingali, E. Bennett, & M. Zurek (Edits.), Ecosystems and Human Well-being: Scenarios, Volume 2. Findings of the Scenarios Working Group, Millenium Ecosystem Assessment (págs. 45-70). Washington, D.C.: Island Press.
Castree, N. (2003). Commodifying what Nature? Progress in Human Geography , 27 (3), 273-297.
Carson, R. M., & Bergstrom, J. C. (December de 2003). A Review of Ecosystem Vauation Techniques. Department of Agricultural & Applied Economics College of Agricultural & Environmental Sciences The University of Georgia .
Costanza, R., d’Agre, R., de Groot, R., Farber, S., Grasso, M., Hannon, B., y otros. (1997). The value of the world’s ecosystem services and natural capital. Nature , 387, 253-260.
Daily, G. C. (1997). Introduction: What are Ecosystem Services? En G. C. Daily (Ed.), Nature’s Services: Societal Dependence on Natural Ecosystems (págs. 1-10). Washington, D.C.: Island Press.
de Groot, R. S. (1987). Environmental Functions as a Unifying Concept for Ecology and Economics. The Environmentalist , 7 (2), 105-109.
de Groot, R. S., Wilson, M. A., & Boumans, R. M. (2002). A Typology for the Classification, Description and Valuation of Ecosystem Functions, Goods and Services. Ecological Economics , 41, 393-408.
de Groot, R. (2010). Integrating the Ecological and Economic Dimensions in Biodiversity and Ecosystem Service Valuation. En The Economics of Ecosystems and Biodiversity Ecological and Economical Foundations (págs. 10-40). Washington, D.C., USA: Island Pres.
de Groot, R., Alkermade, R., Braat, L., Hein, L., & Willemen, L. (2010). Challenges in integrating the concept of ecosystem services and values in landscape planning, management and decision making. Ecological Complexity , 7 (3), 260-272.
Dickson, B., & Osti, M. (2010). What are the ecosystem-dervied benefits of REDD and why do they matter? Multiple Benefits Series 1 . Cambridge: UNEP World Conservation Monitoring Centre.
Dickson, B., Bertzky, M., Christophersen, T., Epple, C., Kapos, V., Miles, L., y otros. (2012). REDD+ Beyond Carbon: Supporting Decisions on Safeguards and Multiple Benefits. Issue 02, UN-REDD Programme.
Ding, H., Silvestri, S., Chiabai, A., & Nunes, P. A. (May 2010). A Hybrid Approach to the Valuation of Climate Change Effects on Ecosystem Services: Evidence from the European Forests. FEEM Working Paper No. 50.
Doswald, N., Osti, M., & Miles, L. (2010). Methods for assessing and monitoring change in the ecosystem-derived benefits of afforestation, reforestation, and forest restoration. Multiple Benefits Series 6 . (U. W. Centre, Ed.) Cambridge: Prepared in behalf of the UN-REDD Programme.
Estrada Carmona, N., & DeClerck, F. (2012). Chapter 14: Payment for Ecosystem Services for Energy, Biodiversity Conservation, and Poverty Reduction in Costa Rica. En J. C. Ingram, F. DeClerck, & C. Rumbaitis del Rio, Integrating Ecology and Poverty Reduction: The Application of Ecology in Development Solutions (págs. 191-210). New York: Springer.
Führer, E. (2000). Forest functions, ecosystem stability and management. Forest Ecology and Management , 132, 29-38.
FAO. (2012). State of the World’s Forests 2012. Rome.
Farley, J., & Costanza, R. (2010). Payments for Ecosystem Services: From Local to Global. Ecological Economics, 69, 2060-2068.
Farber, S. C., Costanza, R., & Wilson, M. A. (2002). Economic and Ecological Concepts for Valuins Ecoystem Services. Ecological Economics , 41 (3), 375-392.
Fisher, B., Turner, R. K., & Morling, P. (2009). Defining and Classifying Ecosystem Services for Decision Making. Ecological Economics , 68, 643-653.
Hanley, N., Wright, R. E., & Adamowicz, V. (1998). Using Choice Experiments to Value the Environment. Environmental and Resource Economics , 11 (3-4), 413-428.
Holling, C. S. (1973). Resilience and Stability of Ecological Systems. Annual Review of Ecology and Systematics , 4, 1-23.
Gómez-Baggethun, E., de Groot, R., Lomas, P. I., & Montes, C. (2009). The History of Ecosystem Services in Economic Theory and Practice: From Early Notions to Markets and Payment Schemes. Ecological Economics , 69, 1209-1218.
IUCN (The World Conervation Union). (2009). Counting the Environmental Costs of Natural Disasters.

F O R E S T S I N A C H A N G I N G C L I M A T E 31
Ingram, V., & Bongers, G. (2009). Valuation of Non-Timber Forest Product Chainsin the Congo Basin. Center for International Forestry Research (CIFOR), Yaoundé, Cameroon.
Ingram, V., Ndoye, O., Midoko Iponga, D., Chupezi Tieguhong, J., & Nasi, R. (2005). Non-Timber Forest Products: Contribution to National Economy and Strategies for Sustainable Management. CIFOR, FAO, IRET.
Kosoy, N., & Corbera, E. (2010). Payments for Ecosystem Services as Commodity Fetishism. Ecological Economics , 69, 1228-1236.
Mendes, I. 2012. Economic Valuation as a Framework Incentive to Enforce Conservation in B. Sladonja (Ed.) Protected Area Management.
Musampa Kamungandu, C., Mane, L., Lola Amani, P., Bertzy, M., Ravilious, C., Osti, M., y otros. (2012). Mapping potential biodoversity benefits from REDD+. The Democratic Republic of Congo. (D. UN-REDD Programme, Ed.) Cambridge, UK: Prepared by UNEP-WCMS; Ministry of the Environment, Nature Conservation and Tourism of the DRC; and the Satellite Observatory for Central African Forests.
Maes, J., Paracchini, M., & Zulian, G. (2011). A European Assessment of the Provision of Ecosystem Services. European Commission Joint Research Centre Institue for Environment and Sustainability, JRC Scientific and Technical Reports.
Martín-López, B., Iniesta-Arandia, I., García-Llorenete, M., Palomo, I., Casado-Arzuaga, I., García del Amo, D., y otros. (2012). Uncovering Ecosystem Service Bundles through Social Prefernces. PLoS ONE , 7 (6), e38970.
Mooney, H. A., & Ehrlich, P. R. (1997). Ecosystem services: a fragmentary history. En G. C. Daily (Ed.), Nature’s Services: Societal Dependence on Natural Ecosystems (págs. 11-19). Washington, D.C.: Island Press.
National Research council of the National Academies. (2004). Valuing Ecosystem Services: Toward Better Environmental Decision-Making. Washington, D.C.: The National Academies Press.
Ndoye, O., & Chupezi Tieguhong, J. (2004). Forest Resource and Rural Livelihoods: The Conflict Between Timber and Non-Timber Forest Products in the Congo Basin. Scandinavian Journal of Forest Research , 19 (S4), 36-44.
Nhlom, J. H. (2011). The Economic Value of Congo Basin Protected Areas Goods and Services. Journal of Sustainable Development , 4 (1), 130-142.
Plummer, M. L. (2009). Assessing Benefit Transfer for the Valuation of Ecosystem Services. Frontiers in Ecology and the Environment , 7 (1), 38-45.
Pascual, U., & Muradian, R. (2010). The Economics of Valuing Ecosystem Services and Biodiversity. En The Economics of Ecosystems and Biodiversity Ecological and Economical Foundations (págs. 183-255). Washington, D.C., USA: Island Press.
Pearce, D., & Moran, D. (1994). The Economic Value of Biodiversity. London, UK: Earthscan Publication Limited.
Postel, S., & Carpenter, S. (1997). Freshwater Ecosystem Services. En G. C. Daily, Nature’s Services (págs. 195-214). Washington, D.C., USA: Island Press.
Porras, I., Grieg-Gran, M., & Neves, N. (2008). All that Glitters: A Review of Payments for Watershed Services in Developing
Countries. International Institute for Environment and Development, London.
O´Neill, J. (1992). The Varieties of Intrinsic Values. The Monist , 75 (2), 119-137.
Ravilious, C., Bertzky, M., & Miles, L. (2011). Identifying and mapping the biodiversity and ecosystem-based multiple benefits of REDD+. A manual for the Exploring Multiple Benefits tool. Multiple Benefits Series 8 . (U. W. Centre, Ed.) Cambridge, UK: Prepared on behalf of the UN-REDD Programme.
Reyers, B. (2010). Measuring Biophysical Quantities and the Use of Indicators. En P. Kumar (Ed.), The Economics of Ecosystems and Biodiversity Ecological and Economical Foundations (págs. 113-147). Washington, D.C., USA: Island Press.
Redford, K. H., & Adams, W. M. (2009). Payment for Ecosystem Services and the Challenges of Saving Nature. Conservation Biology , 23 (4), 785-787.
Stern, D. I. (1997). The Capital Theory Approach to Sustainability: A Critical Appraisal. Journal of Economic Issues , 31 (1), 145-173.
Salles, J.-M. (2011). Valuing Biodiversity and Ecosystem Services: Why Put Economic Values on Nature? Comptes Rendus Biologies , 334, 469-482.
Sanford, M. P. (2009). Valuing Mangrove Ecosystems as Coastal Protection in Post-Tsnuami South Asia. Natural Areas Journal, 29 (1), 91-95.
SEMARNAT (Secretaría de Medio Ambiente y Recursos Naturales). (2012). Evaluación de Consistencia y Resultados 2011-2012 Proárbol Programa de Pago por Servicios Ambientales.
Shvidenko, A., Barber, C. V., & Persson, R. (2005). Forest and Woodland Systems. En R. Hassan, R. Scholes, & N. Ash, Ecosystems and Human Well-being: Current State and Trends, Volume I (The Millenium Ecosystem Assessment Series ed.). Washington, D.C.: Island Press.
Spaninks, F., & van Beukering, P. (1997). Economic Valuation of Mangrove Ecosystems: Potential and Limitations. Environmental Economic Program, IIED, Institute for Environmental Studies, CREED, CREED Working Paper No. 14.
Tudor Rose & UNFF. (2011). Forests for People. Leicester, England, UK.
Turner, R., Paavola, J., Cooper, P., Farber, S., Jessamy, V., & Georgiou, S. (2003). Valuing Nature: Lessons Learned and Future Research Directions. Ecological Economics, 46, 493-510.
Wendland, K. J., Honzák, M., Portela, R., Vitale, B., Rubinoff, S., & Randrianarisoa, J. (2010). Targeting and Implementing Payments for Ecosystem Services: Opportunities for bundling biodiversity conservation with cabon and water services in Madagascar. Ecological Economics , 69 (11), 2093-2107.
UN-REDD Programme. (August de 2009). UN-REDD Programme Newsletter. Multiple benefits -issues and options for REDD , Issue no. 1.
van Noordwijk, M., Leimona, B., Jindal, R., Villamor, G. B., Vardhan, M., Namirembe, S., y otros. (2012). Payments for Environmental Services: Evolution Toward Efficient and Fair Incentives for Multifunctional Landscapes. Annual Review of Environment and Resources , 37, 389-420.
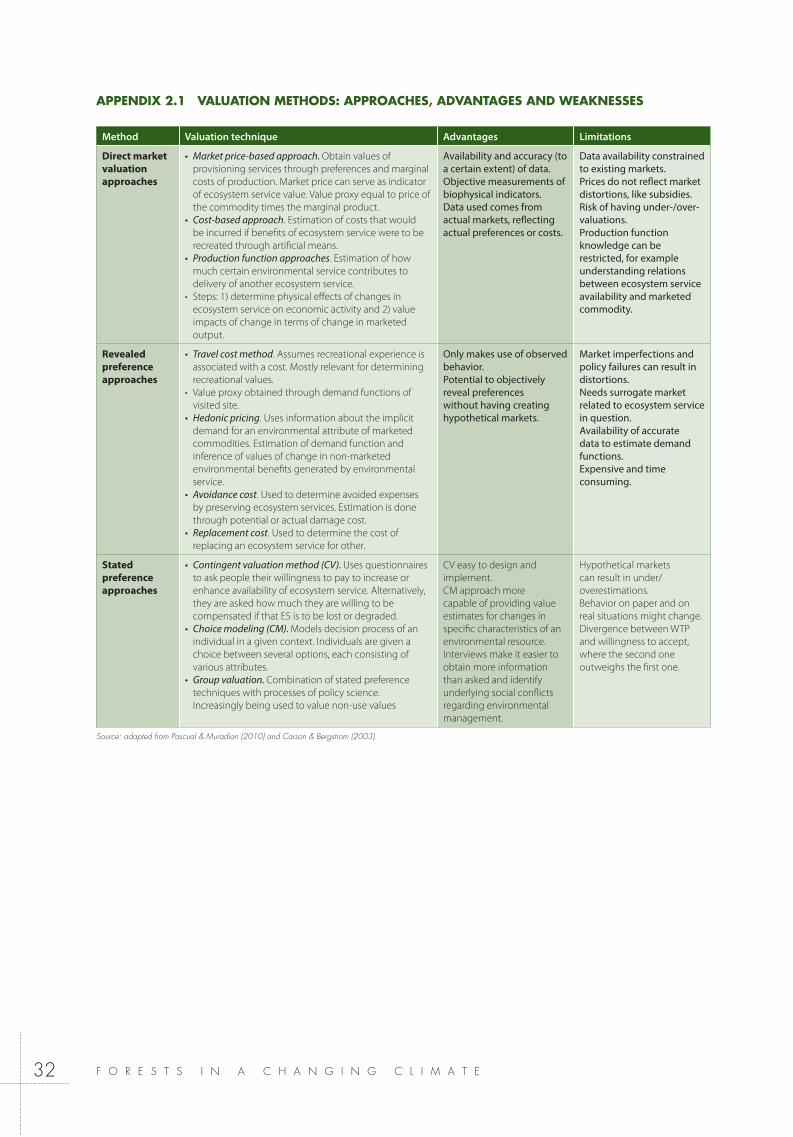
F O R E S T S I N A C H A N G I N G C L I M A T E32
APPENDIX 2.1 VALUATION METHODS: APPROACHES, ADVANTAGES AND WEAKNESSES
Method Valuation technique Advantages Limitations
Direct market valuation approaches
Market price-based approach. Obtain values of provisioning services through preferences and marginal costs of production. Market price can serve as indicator of ecosystem service value. Value proxy equal to price of the commodity times the marginal product.Cost-based approach. Estimation of costs that would be incurred if benefits of ecosystem service were to be recreated through artificial means.Production function approaches. Estimation of how much certain environmental service contributes to delivery of another ecosystem service.Steps: 1) determine physical effects of changes in ecosystem service on economic activity and 2) value impacts of change in terms of change in marketed output.
Availability and accuracy (to a certain extent) of data.Objective measurements of biophysical indicators.Data used comes from actual markets, reflecting actual preferences or costs.
Data availability constrained to existing markets. Prices do not reflect market distortions, like subsidies. Risk of having under-/over-valuations.Production function knowledge can be restricted, for example understanding relations between ecosystem service availability and marketed commodity.
Revealed preference approaches
Travel cost method. Assumes recreational experience is associated with a cost. Mostly relevant for determining recreational values.Value proxy obtained through demand functions of visited site.Hedonic pricing. Uses information about the implicit demand for an environmental attribute of marketed commodities. Estimation of demand function and inference of values of change in non-marketed environmental benefits generated by environmental service.Avoidance cost. Used to determine avoided expenses by preserving ecosystem services. Estimation is done through potential or actual damage cost.Replacement cost. Used to determine the cost of replacing an ecosystem service for other.
Only makes use of observed behavior.Potential to objectively reveal preferences without having creating hypothetical markets.
Market imperfections and policy failures can result in distortions. Needs surrogate market related to ecosystem service in question.Availability of accurate data to estimate demand functions.Expensive and time consuming.
Stated preference approaches
Contingent valuation method (CV). Uses questionnaires to ask people their willingness to pay to increase or enhance availability of ecosystem service. Alternatively, they are asked how much they are willing to be compensated if that ES is to be lost or degraded.Choice modeling (CM). Models decision process of an individual in a given context. Individuals are given a choice between several options, each consisting of various attributes.Group valuation. Combination of stated preference techniques with processes of policy science. Increasingly being used to value non-use values
CV easy to design and implement.CM approach more capable of providing value estimates for changes in specific characteristics of an environmental resource.Interviews make it easier to obtain more information than asked and identify underlying social conflicts regarding environmental management.
Hypothetical markets can result in under/ overestimations. Behavior on paper and on real situations might change. Divergence between WTP and willingness to accept, where the second one outweighs the first one.
Source: adapted from Pascual & Muradian (2010) and Carson & Bergstrom (2003).
F O R E S T S I N A C H A N G I N G C L I M A T E 33
M O D U L E 3Drivers of deforestation and forest degradation
3.1 FUNDAMENTALS
3.1.1 Recent Trends in Deforestation and Forest Degradation
Deforestation and forest degradation impact ecosystems and humanity in numerous ways. If methane and other greenhouse gas emissions that result from land use changes are included in addition to the CO2 released during deforestation, loss of forest cover accounts for about 20-25% of anthropogenic greenhouse gas emissions (Houghton 2005). In addition, it causes decreases in the supply of other ecosystem services provided by forests such as biodiversity loss and non-timber forest product’s Forest degradation is widely recognized to be a crucial contributor to forest-related greenhouse gas emissions (Asner et al., 2005), although a harmonized definition of forest degradation is not in use. It broadly refers to activities that, while not reducing the area under cover, reduce canopy cover, and “which negatively affect the structure or function of the stand or site, and thereby lower the capacity to supply products and/or services.” (FAO 2006)9.
Tropical forests in particular have a vital role in regulating the global carbon reservoir, since they store about 50% more carbon per land unit area than non-tropical forests, and contain as much carbon in their soils and vegetation as boreal and temperate forests combined (UNFCCC 2006). However, these have also been the epicenter of large-scale forest loss in recent decades.
Figure 3.1 illustrates how the majority of forest loss between 1990 and 2010 occurred in tropical regions, with subtropical, temperate and boreal zones registering slight increases in forest areas. 5.2 million hectares per year was lost between 2000 and 2010, down from a loss of 8.3 million hectares per year in the period 1990–2000 (FAO 2010). However, between 2002 and 2004, the highest rates of deforestation over any 3-year period were recorded in the Amazon (IPNE 2004 estimates quoted in Foley et al. 2007). Understanding the causal mechanisms driving deforestation and forest degradation is thus a vital aspect of setting up well-targeted, cost-effective and equitable mechanisms in framework agreements that seek to mitigate forest loss, such as REDD+.
9 The UNFCCC defines deforestation to be a “measurable sustained decrease in crown cover from greater than the minimum crown cover (set at 10-30%) to less than the minimum crown cover (mCC)”. Forest degradation Is defined as a “measurable sustained decrease in crown cover with crown cover remaining greater than mCC”(UNFCCC 2006). However, several studies, including some of those referenced here, may use alternative definitions.

F O R E S T S I N A C H A N G I N G C L I M A T E34
3.2 INITIATIVES, TOOLS, AND METHODOLOGIES
3.2.1 Measurement of Deforestation and Forest Degradation
Recent technological innovations have greatly eased constraints in forest cover measurement, with a range of new remote-sensing techniques creating more recent and temporally consistent datasets. However, current technologies still imply a tradeoff between precision and costs (UNFCCC 2006). Some satellite estimates using optical sensors such as MODIS and ENVIRISAT-MERIS provide data at a high temporal frequency but a coarse geographic resolution, whereas others such as Landsat which are higher-cost provide data at a finer geographic resolution but lower temporal frequency.
Forest degradation can be measured by sensors such as IKONOS and Quickbird, in addition to other newer technologies that also have the ability to overcome measurement issues related to cloud cover such as radar and LIDAR. However, these technologies are relatively higher-cost, and usually used for hotspot-analysis of areas undergoing rapid deforestation or degradation, rather than comprehensive wall-to-wall measurement. Combining remote-sensing estimates with ground-level estimates when economically feasible, provide the most reliable sources of forest loss.
A recent initiative with immense potential to enhance the efficacy of monitoring, data sharing, and advocacy, is Global Forest Watch 2.0, an online platform to map near real-time deforestation and make this data widely available. The platform will bring together cutting-edge, remote-sensing and crowd-sourcing technologies with the latest NASA satellite data, and enable stakeholders, across the world, to access the data in a transparent manner. It is expected to launch in late 2013, and has the potential to enable stake-
Factors driving deforestation and forest degradation include the conversion of forest to agricultural use. Subsistence agriculture in the Mau Forest Complex, Kenya.Ri
ccar
do G
anga
le
Figure 3.1. Net forest loss, 1990-2010. Source: FAO, 2010.

F O R E S T S I N A C H A N G I N G C L I M A T E 35
holders to make and update decisions using near real-time data, which has not been possible before on a large-scale.
3.2.2 Factors Affecting Deforestation and Forest Degradation – Overview of Methodologies
Methods that assess the relative importance of factors affecting deforestation and forest degradation draw on a variety of qualitative and quantitative approaches, ranging from examining the national communications of countries to the UNFCCC (UNFCCC 2006) to studies that examine local case studies (Geist and Lambin 2001), to models that combine and analyze satellite data on deforestation and socio-economic data at the regional, national and sub-national level (Pfaff 2012, Cropper et al. 1994, Nelson and Hellerstein 1997). Recently, the UN-REDD national programmes for several countries including Zambia and DRC have undertaken studies that seek to identify the drivers of deforestation using both qualitative and quantitative methods.
A substantial portion of the literature distinguishes direct causes (also known as proximate causes) of deforestation and degradation such as agricultural expansion and logging, from indirect causes like institutional factors that affect deforestation, such as property rights systems regimes. It is important to note that the causes may, and often are, inter-connected. For instance, the study undertaken by the UN-REDD national programme for Zambia on the drivers of deforestation found agricultural expansion (a direct cause) to be one of the main drivers of forest cover loss between 1989 and 2002. However, economy-wide structural adjustment
undertaken around the same time (an indirect factor), through cuts in employment in non-agricultural sectors such as mining, would influence the amount of labor force in agriculture, which in turn would affect the magnitude and rate of agricultural expansion (Vinya et al 2011).
This chapter reviews the literature on factors causing deforestation and forest degradation, and underscores the variation in the relative importance of several underlying drivers. It also highlights the necessity of understanding the interactions between these factors to arrive at context-specific policy recommendations for a particular country or region. While some factors discussed may be relevant for one kind of forest loss but not the other – for instance, livestock grazing and fuel wood extraction which impacts forest degradation more than deforestation; a variety of underlying factors such as government policies and property rights systems affect both. Thus, they are discussed as common causal mechanisms in this chapter, with the specific factors identified as such.
Intensive logging activities – logging camp and tropical timber awaiting transfer to freighters, Kinabatangan River, Sabah, Borneo, is a common sight across South East Asia
Table 3.2: Drivers of deforestation and degradation as presented in the synthesis of relevant information from national communications to the UNFCCC
Driver Number of Parties
Forest conversion to agricultural uses 33
Harvesting for fuel wood and charcoal 25
Improper forest management, including selective logging and over-exploitation
17
Fire and biomass burning 13
Population pressure 13
Development pressure, such as expanding urbanization, settlements and new infrastructure
11
Illegal logging 8
Policies and laws that drive land use conversion
7
Exploitation of mineral resources, mining 4
Table 1 highlights some of the main causes of deforestation and forest degradation as identified by countries in their national communications to the UNFCCC. Forest conversion to agricultural uses is the most cited reason, with harvesting for fuel wood and charcoal, a primary driver of forest degradation, cited as the second most important Source: Reproduced from UNFCCC (2006).
Fran
s La
ntin
g/G
ETTY
IMA
GES

F O R E S T S I N A C H A N G I N G C L I M A T E36
However, the relative importance of both proximate and indirect factors may depend on the institutional context in not only the forest sector, but also other interlinked sectors such as agriculture and trade. The two fundamental underlying factors that crucially determine forest area and health are the relative returns to land under forests and rules of access. These in turn are determined by a multitude of socio-economic factors. The conclusions that emerge from these studies are that: a) there are several interlinked factors impacting deforestation and forest degradation, b) their relative importance varies across regions and over time within regions, and c) understanding the linkages between these factors is vital to understanding the chains of causality leading to deforestation and forest degradation.
3.2.3 Proximate Causes 3.2.3.1 Agricultural ExpansionThe most prominent proximate cause that has been high-lighted in much of the literature is agricultural expansion. It has been identified as a crucial factor affecting deforestation both at the global and regional scale in numerous scientific studies as well as countries’ REDD+ readiness documents (UNFCCC 2006). The term “agricultural expansion” en-compasses a host of related activities such as conversion to pastureland, permanent cropping, shifting cultivation, and livestock grazing, which in particular causes forest degradation (Hosunuma et al. 2012).
Across regions however, there is heterogeneity in the particular agricultural activity that is linked to forest loss.
Within agricultural expansion, conversion to pastureland for cattle ranching is a much more frequent cause for deforestation in mainland South America, while shifting cultivation and permanent agriculture is a more common cause across regions (Geist and Lambin 2001).
Indirect policy factors such as agricultural subsidies, govern-ment development projects and weak property rights can exacerbate deforestation related to agricultural expansion by increasing the relative returns of agricultural expansion (Deacon 1994, Vinya et al 2011, Pfaff 2012). Related biophysical factors such as soil quality can affect which regions are selected to be cleared, with areas of higher soil quality being cleared in greater quantities (Pfaff2012). Thus, there is a wide range of factors affecting which forest sites are chosen to be cleared for agricultural expansion, and within this broad term, the particular activity that may replace forest cover may also vary by region.
3.2.3.2 Infrastructure ExpansionInfrastructure expansion can have a dynamic impact on deforestation and forest degradation, since in the initial stages, the availability of infrastructure eases the constraints on these activities and may also lead to increased settlement in these areas. This settlement may further increase demand for forest products, which in turn exacerbates deforestation and forest degradation. Careful analyses for a variety of countries and regions (Cropper et al. 1994 for Thailand, Nelson and Hellerstein 1997 for Central Mexico, Chomitz and Grey 1996 for Belize, and Pfaff 2012 for Brazil to name a few) have found that
Road Construction through the Amazon basin for transport or logging opens up arrays of forest to slash and burn migrant farmers. Farmers burn the trees for ash fertilizer allowing brief crop periods, the land is then abandoned and more forest destroyed, such as the forested slopes on the Satipo-Puerto Prado Road, Peru.
Uni
vers
al Im
ages
Gro
up/G
ETTY
IMA
GES

F O R E S T S I N A C H A N G I N G C L I M A T E 37
infrastructural expansion in general and roads in particular can lead to increased deforestation. Geist and Lambin 2001 use a different methodology, and consider 152 subnational case studies; their findings are in agreement with the studies cited above. These findings also correspond to the national communications to the UNFCCC detailed in Table 1. However, as discussed in section 3.2.3.2, while infrastructure expansion increases the ease with which wood and other forest products can be extracted and exported, a variety of other factors such as high timber prices and government projects promoting re-settlement in forested areas are often present in conjunction with this expansion, which intensifies the level of deforestation and forest degradation that may have occurred in the presence of infrastructure expansion alone.
3.2.3.3 Wood Extraction Activities such as logging (selective logging as well as clear-cutting) and fuel wood extraction can be classified into this category. Logging has been identified as a major factor related to deforestation, with a significant portion of this activity undertaken illegally in some regions, as discussed in section 3.2.4.3. Furthermore, selective logging and fuel-wood extraction are major causes of forest degradation worldwide (UNFCCC 2006). In particular, the former is relatively more prevalent in Latin America and Asia, and
the latter relatively more prevalent in Africa (Hosunuma et al 2012). Commercial logging is often found to cause large-scale deforestation particularly in areas with highly productive forests and at times when global timber prices are high (Kummer and Turner 1991). However, as with other direct causes, it is often a part of a dynamic process that is undertaken in conjunction with other activities such as resettlement and agricultural expansion, and the final magnitude of the impact caused by wood extraction activities depends on political institutions and socio-economic factors, many of which are discussed in the next section.
3.2.4 Indirect Causes
3.2.4.1 Population Growth and DensityPopulation growth and density has been linked to deforestation and forest degradation in numerous studies (Cropper et al 1994, Deacon 1994, Zhang et al 2000, and Vinya et al 2011). Intuitively, the reason for why these factors should be positively related to loss of forest cover is clear – a higher population per square mile indicates greater pressure on nearby forest resources, and a higher population growth rate implies a faster escalation of these resource pressures. However some studies (Geist and Lambin 2001, Kummer and Turner 1994) find only
Densely populated informal dwellings in Kibeira, Kenya. A close link exists between urbanisation and deforestation, implying that areas with the highest rates of population growth and industrialisation may be particularly at risk from deforestation.
Nig
el P
avitt
/GET
TY IM
AG
ES

F O R E S T S I N A C H A N G I N G C L I M A T E38
a limited impact of population density. Geist and Lambin find that migration into a forested region is more heavily represented as a cause of deforestation in Latin America and Africa but not in Asia, while Kummer and Turner find the correlation between population change and deforestation in the Philippines to be only 0.05. Pfaff (2012) in a study on Brazilian deforestation establishes that the impact of population density varies by what the baseline population is i.e. the initial influx of migration that accompanies deforestation has a higher impact than later in-migration of the same magnitude. The study undertaken by the UN-REDD national programme for Zambia found a close link between urbanization and deforestation using hotspot analysis, which implies that areas with the highest rates of population growth and industrialization may be particularly at risk for deforestation (Vinya et al 2011). A concern amongst some studies that find population to be a major causal factor in deforestation and forest degradation is that they do not include other variables that
are associate with population, thereby possibly inflating the role of population in the analysis (Pfaff 2012); however, further research is required to clarify this hypothesis.
3.2.4.2 Economic Growth and Forest Cover – Is there an Environmental Kuznets Curve, and at What Point?Theoretically, economic growth can decrease forest cover by causing an increased demand for forest products which increases the returns to forest exploitation, or improve forest cover if the increased income leads to higher demand for the non-use amenities of forests, such as carbon sequestration and recreation. Another theoretical argument combines these two effects and posits that initially, economic growth will decrease forest cover as the demand for forest products and thus returns to deforestation dominate the second effect. Once it has reached a certain point, however, further economic growth will lead to increased forest cover, as the second effect is now larger. Thus, economic growth and forest cover have been hypothesized to have an inverted U-shaped relationship, an Environmental Kuznets Curve (EKC), akin to the Kuznets curve that illustrates the relationship between economic growth and income inequality.
Empirically however, the relationship between economic growth and deforestation has not been incontrovertibly established across studies. There are several cross-country studies (Cropper and Griffiths 1994, Barbier and Burgess 2001) that have examined the relationship between forest cover and economic growth, mostly represented by GDP
and Griffiths (1994) find regional heterogeneity in the income-deforestation link, with some evidence of an EKC in Latin America and Africa, but none in Asia. A higher rate of income leads to lower deforestation but the effect is small across all regions. Furthermore, the income levels at which higher income leads to higher forest cover is quite large (about $5,000 per capita), which is in keeping with the findings of later studies (Antler and Heidebrink 1995) and Barbier and Burgess 2001). Furthermore, later studies emphasize that whether an EKC can be found or not is sensitive to which other variables are included in the model, and the income level at which deforestation starts falling is about double the mean income level in their sample of countries (Barbier and Burgess 2001). A recent study uses household-level data for India, and finds that increased demand for forest products leads to increased afforestation, since the relative returns to forest land are higher. However, they emphasize that a significant reason why this effect occurs is due to a lack of openness to trade in India at the time of their study, which meant that local increases in demand were met by local forests (Foster and Rosenzweig 2003).
These studies indicate that while economic growth may be a driving mechanism for deforestation and forest degradation, the variety of causal chains that link these two imply that neither the magnitude nor the direction of the direct relationship between them is clear or static. C
olin
Mat
thie
u/G
ETTY
IMA
GES
Global demand for cocoa products such as these chocolates on sale in Brussels, Belgium, is driving land clearances to expand cocoa plantations.

F O R E S T S I N A C H A N G I N G C L I M A T E 39
Thus, it is vital to understand the underlying factors such as the sources of economic growth and institutional linkages to understand the nature of this causal relationship in a particular setting.
3.2.4.3 Global Factors and Socio-Economic Institutions in Forestry and Complementary SectorsInstitutions and policies in complementary sectors can affect deforestation by affecting the relative returns to various land uses. Agricultural subsidies increase the private returns to agricultural activities relative to forest land and may affect deforestation disproportionately in areas where other facilitating conditions, such as roads and other infrastructure are present. Government policies related to resource ownership risk, the regulatory climate for private investment, as well as levels of external debt can negatively impact forest cover (Bohn and Deacon 2000). Government development projects in forested regions may also increase deforestation, since many of them are aimed at increasing infrastructural availability which eases the constraints in logging transport (Geist and Lambin 2001, Pfaff 2012).
Corruption and lack of enforcement of forest laws can be a major driver of forest cover loss, usually through its complicity in illegal logging. Up to two-thirds of forest sector production in Indonesia may be based on undocumented
year loss of value to its government and citizens (World Bank 2006). Furthermore, policies that are aimed at increasing government efficiency such as increasing the number of administrative units can in fact increase deforestation in an environment where corruption causes local officials to use their increased power to allow greater illegal logging (Burgess et al. 2012).
Global factors such as agricultural and timber prices can exacerbate deforestation and forest degradation, with their impact largely determined by country-level and local factors such as openness to trade (Foster and Rosenzweig 2003), local institutions and corruption levels (Burgess et al. 2012), as well as the presence of transport infrastructure (Pfaff 2012).
3.3 CASE STUDIES
3.3.1. Subnational Differences in Deforestation Drivers – The Case of Thailand
In a study of the factors causing deforestation in Thailand, Cropper et al. use quinquennial data for 58 forested provinces in Thailand to estimate the impacts of population pressures and income on deforestation. They consider the time interval between 1976 and 1989, a particularly relevant time for the question under consideration, since Thailand lost nearly 30% of its forest cover during this period.
During 1961 and 1988, agricultural land increased by 13.12 million hectares in Thailand, while forest land
declined by 13.6 million hectares. Cropper et al. construct and estimate an economic model of land use change from forest to its profitable use, which in this context is agriculture. They find that the elasticity of forest-to-total-area with respect to population density is -0.41
Furthermore, the corresponding elasticities with respect to road density are -0.20 and -1.09, respectively. Thus, the impact of population density is twice as large and the
Some of these changes can be attributed to the baseline characteristics of these regions- for instance, the Northeast region has is lower population density, lower quality land, and more dependence on subsistence agriculture than the Central region. However, in 1973, agricultural household density in the North and South were comparable, but a much larger fraction of forested area in the South was subsequently cleared. This indicates the importance of considering the impact and interactions of complementary factors while analyzing causal mechanisms driving deforestation, since that may influence how important a particular factor shall be in affecting forest cover.
3.3.2. Macroeconomic Changes and Deforestation – Structural Adjustment in Ghana
Deforestation rates in Ghana between 1990 and 2000 were nearly 2% per annum (FAO 2010), one of the highest in Africa and higher than most countries worldwide. The agricultural sector, particularly forest clearing for cocoa production, has been a major contributing factor. Structural Adjustment Programmes (SAPs) alter the relative returns to different economic activities, sometimes by affecting relative returns to domestic production versus exports production. The results of this case study relate in particular to the discussion in section 3.4.2 on how the relative importance of certain mechanisms causing forest loss can change over time.
In the pre-adjustment years, timber royalties were low and wood extraction was subsidized. Post-structural adjustment, domestic returns to logging were higher due to currency devaluation, and royalties on extraction increased as well. These factors could lead to lower deforestation if accompanied by increased efficiency in logging. Furthermore, the relative returns to various land uses were also affected by other economic changes accompanying the structural adjustment process such as removal of certain agricultural subsidies, changes in the availability of some agricultural inputs, and the introduction of high-yielding maize varieties.
Benhin and Barbier (2003) analyze the impacts of major proximate causes of deforestation – timber production and expansion on land under cocoa and maize – before and after structural adjustment was implemented in Ghana.

F O R E S T S I N A C H A N G I N G C L I M A T E40
They estimate a four-equation recursive model consisting of demand equations for timber extraction, land under cocoa, land under maize, and an equation of forest loss that is affected by the first three factors. They use data between 1965 and 1995 and find that while the impact of industrial roundwood production and expansion of land
under maize remained similar before and after structural adjustment, the impacts of changes in cocoa harvested land reduced significantly after the implementation of structural adjustment. Thus, the relative importance of factors driving deforestation may change significantly over time in response to changes in related sectors.

F O R E S T S I N A C H A N G I N G C L I M A T E 41
3.4.1 Challenges in the Measurement of Deforestation and Forest Degradation Measuring deforestation and forest degradation over time can be challenging, as estimates from different sources may not be strictly comparable due to the use of different measurement techniques and forest definitions. For instance, rates of deforestation measured using surveys and inventories are generally, although not always, higher than estimates derived using remote sensing (UNFCCC 2006). Several of the lower-cost remote sensing techniques used to measure deforestation discussed in section 3.2.1 do not have the capability to reliably measure forest degradation, which recent research (Foley et al. 2007) indicates may be more pervasive than previously believed. Furthermore, Asner et al. (2005) find that areas of selective logging in the Amazon overlap with earlier estimated deforestation areas by only 6%, and when included in deforestation estimates, nearly double the land areas affected by these activities in the Amazon.
Consistent estimates of the contribution of deforestation and forest degradation to carbon emissions is even more methodologically challenging. A recent consensus amongst scientists (Harris et al. 2012) concluded that emissions from tropical deforestation between 2000 and 2005 were 3.0 ± 1.1 Gt CO2 yr-1 (0.8 ± 0.3 Pg C yr-1), although the study also emphasized the high degree of uncertainty attributable in part to lack of consistent and reliable data.
3.4.2 Heterogeneity in the Relative Importance of and Interactions Between Drivers While certain proximate factors such as conversion to agriculture and infrastructural expansion are widely associated with deforestation and forest degradation, their relative importance across countries and regions as well as over time in the same regions may vary. Furthermore, studies indicate that even at the sub-national level, mechanisms leading to deforestation and forest degradation may vary. For instance, the impetus for agricultural expansion may be provided by higher global timber prices that increase the returns to forest clearing, which is then followed by agricultural expansion in the deforested areas, as in the case of south-east Asia until the 1980s (Repetto 1988, Kummer and Turner 1991). In some cases, the agricultural expansion driver alone may not have been enough to result in the loss of forest cover that resulted from the interactions between the underlying factors.
The reason for the varying relative importance of proximate factors lies in the context in question, and the corresponding institutional elements that determine the final impact of a single factor. For instance, as discussed in sections 3.2.4.3 and 3.3.2, openness to trade and changes in returns to commodities export markets may affect how an increased demand for forest products influences forest cover. Furthermore, section 3.2.4.3 discusses how weak property rights that are difficult to enforce may lead to a higher rate of deforestation and forest degradation in response to increased demand for forest products.
3.4.3 Future Projections of Changes in Forest CoverFuture trends in deforestation and forest degradation will be shaped by the interactions of a variety of atmospheric and anthropogenic factors. Since large tropical forests often play a role in local and regional climate stabilization, climate change and human-induced deforestation may lead to positive feedbacks in the deforestation-climate change loop, particularly since forests close to the edges and degraded forests are more vulnerable to desiccation and fire (Malhi et al. 2008). By 2050, current trends in agricultural expansion will eliminate a total of 40% of Amazon forests (Soares-Filho et. al 2006). While there is evidence that future trends of deforestation and forest degradation may slow as global populations rise at slower rates and increasing urbanization densities decrease pressure on forest land (Wright and Muller‐Landau 2006), these changes will also take place in an environment of increased natural variability due to climate change.
3.4 KEY ISSUES FOR DISCUSSION

F O R E S T S I N A C H A N G I N G C L I M A T E42
3.5 REFERENCES
Allen, Julia C., and Douglas F. Barnes. “The causes of deforestation in developing countries.” Annals of the association of American Geographers 75.2 (1985): 163-184.
Antle, John M., and Gregg Heidebrink. “Environment and development: theory and international evidence.” Economic Development and Cultural Change 43.3 (1995): 603-625.
Asner, Gregory P., David E. Knapp, Eben N. Broadbent, Paulo JC Oliveira, Michael Keller, and Jose N. Silva. “Selective logging in the Brazilian Amazon.” Science 310, no. 5747 (2005): 480-482.
Barbier, Edward B., and Joanne C. Burgess. “The economics of tropical deforestation.” Journal of Economic Surveys 15.3 (2002): 413-433.
Benhin, James KA, and Edward B. Barbier. “Structural Adjustment Programme, deforestation and biodiversity loss in Ghana.” Environmental and Resource Economics 27.3 (2004): 337-366.
Bohn, Henning, and Robert T. Deacon. “Ownership risk, investment, and the use of natural resources.” American Economic Review (2000): 526-549.
Burgess, Robin, et al. The political economy of deforestation in the tropics. No. w17417. National Bureau of Economic Research, 2011.
Chomitz, Kenneth M., and David A. Gray. “Roads, land use, and deforestation: a spatial model applied to Belize.” The World Bank Economic Review 10.3 (1996): 487-512.
Cropper, Maureen, and Charles Griffiths. “The interaction of population growth and environmental quality.” The American Economic Review 84.2 (1994): 250-254.
Cropper, Maureen, Charles Griffiths, and Muthukumara Mani. “Roads, population pressures, and deforestation in Thailand, 1976-89.” World Bank Policy Research Working Paper 1726 (1997).
Deacon, Robert T. “Deforestation and the Rule of Law in a Cross-Section of Countries.” Land Economics (1994): 414-430.
Foley, Jonathan A., et al. “Amazonia revealed: forest degradation and loss of ecosystem goods and services in the Amazon Basin.” Frontiers in Ecology and the Environment 5.1 (2007): 25-32.
Food and Agriculture Organization of the United Nations. “Definitional issues related to reducing emissions from deforestation in developing countries Draft for Discussion and Comments Presented at UNFCCC SBSTA Workshop on Reducing Emissions from Deforestation in Developing Countries” (FAO, Rome, Aug.-Sept. 2006)
Food and Agriculture Organization of the United Nations. Forestry Department (Rome). “Global Forest Resources Assessment 2010: Main Report.” 2010.
Foster, Andrew D., and Mark R. Rosenzweig. “Economic growth and the rise of forests.” The Quarterly Journal of Economics 118.2 (2003): 601-637.
Geist, Helmut, Eric F. Lambin, and International Geosphere-Biosphere Program” Global Changes”. “What Drives Tropical
Deforestation: A Meta-analysis of Proximate and Underlying Causes of Defoestation Based on Subnational Case Study Evidence.” (2001).
Harris, Nancy, Sandra Brown, Stephen C. Hagen, Alessandro Baccini, and Richard Houghton. “Progress Toward A Consensus On Carbon Emissions From Tropical Deforestation.” (2012).
Hosonuma, Noriko, Martin Herold, Veronique De Sy, Ruth S. De Fries, Maria Brockhaus, Louis Verchot, Arild Angelsen, and Erika Romijn. “An assessment of deforestation and forest degradation drivers in developing countries.” Environmental Research Letters 7, no. 4 (2012): 044009.
Houghton, R.A. 2005. Tropical deforestation as a source of greenhouse gas emissions. Chapter 1 In Tropical deforestation and climate change edited by P. Moutinho and S. Schwartzman. Amazon Institute for Environmental Research, pp. 13-21.
Kummer, David M., and B. L. Turner. “The human causes of deforestation in Southeast Asia.” Bioscience (1994): 323-328.
Malhi, Yadvinder, J. Timmons Roberts, Richard A. Betts, Timothy J. Killeen, Wenhong Li, and Carlos A. Nobre. “Climate change, deforestation, and the fate of the Amazon.” science 319, no. 5860 (2008): 169-172.
Nelson, Gerald C., and Daniel Hellerstein. “Do roads cause deforestation? Using satellite images in econometric analysis of land use.” American Journal of Agricultural Economics 79.1 (1997): 80-88.
Pfaff, Alexander SP. “What drives deforestation in the Brazilian Amazon?: evidence from satellite and socioeconomic data.” Journal of Environmental Economics and Management 37.1 (1999): 26-43.
Repetto, Robert. “The forest for the trees? Government policies and the misuse of forest resources.” World Resources Institute, 1988.
Soares-Filho, Britaldo Silveira, Daniel Curtis Nepstad, Lisa M. Curran, Gustavo Coutinho Cerqueira, Ricardo Alexandrino Garcia, Claudia Azevedo Ramos, Eliane Voll, Alice McDonald, Paul Lefebvre, and Peter Schlesinger. “Modelling conservation in the Amazon basin.” Nature 440, no. 7083 (2006): 520-523.
Van der Werf, G. R., et al. “CO2 emissions from forest loss.” Nature Geoscience 2.11 (2009): 737-738.
Vinya, R., S. Syampungani, E. C. Kasumu, C. Monde, and R. Kasubika. “Preliminary Study on the Drivers of Deforestation and Potential for REDD+ in Zambia.” (2011).
World Bank. “Sustaining Indonesia’s Forests: Strategy for the World Bank 2006-2009.”(2006).
Wright, S. Joseph, and Helene C. Muller Landau. “The Future of Tropical Forest Species1.” Biotropica 38, no. 3 (2006): 287-301.
Zhang, Yaoqi, Jussi Uusivuori, and Jari Kuuluvainen. “Econometric analysis of the causes of forest land use changes in Hainan, China.” Canadian Journal of Forest Research 30.12 (2000): 1913-1921.

F O R E S T S I N A C H A N G I N G C L I M A T E 43
4.1 FUNDAMENTALS
M O D U L E 4Solutions to reverse deforestation and forest degradation
The previous modules have underscored the spatial and temporal variation in the relative importance of various drivers of deforestation and forest degradation. Well-targeted and effective solutions that seek to mitigate and reverse this forest loss must accordingly be heterogeneous and flexible as well. This module details the broad range of possible solutions in the forestry and related sectors to reduce deforestation and forest degradation, and discusses their relative relevance in different contexts. The applicability and efficacy of solutions, singly and in combinations, will depend on bio-physical, institutional and socio-economic factors.
A fundamental aspect of these solutions is the degree to which activities, institutions, and policies in related sectors – energy, land-use planning and agriculture - affect the outcomes in the forest sector. A primary reason for this is that policies and institutions in related sectors change the relative economic returns to forest land, and the consequent level of forest cover is thus the result of these interactions. Furthermore, as module 3 discussed, expansion or mismanagement of activities in related sectors is often a driver for deforestation and forest degradation. To increase forest cover and quality, it is not only essential to have well-targeted policies and conducive institutional environments in the forest sector, but also ensure that policies in related sectors facilitate, not undercut, these objectives. Sustainable solutions in related sectors are thus vital to reversing deforestation and forest degradation.
In addition to the solutions discussed in detail in this module, there are other possible solutions that have the potential to reduce deforestation and forest degradation, but whose links to improving forest cover have not been robustly established in the literature. These include international initiatives to halt forest loss, including debt for nature swaps, making international development loans conditional on forest conservation, and enhanced donor coordination to ensure that the objectives of forest conservation are not weakened by loans with contradictory objectives (Pfaff et al. 2010). Furthermore, recent initiatives in the private sector and public-private partnerships that aim to mitigate tropical deforestation include labeling and certification programs that certify sustainably produced goods, as well as new and expanded legislation in OECD countries to mitigate the supply of illegally logged timber imports. Examples of the latter include the Lacey Act in the United States and the Forest Law Enforcement, Governance and Trade (FLEGT) Action Plan of the European Union. Since these initiatives are relatively recent and implemented in conjunction with several other initiatives, further research is required to establish the potential for these solutions to enhance forest cover, as discussed in section 4.4.

F O R E S T S I N A C H A N G I N G C L I M A T E44
4.2 INITIATIVES, TOOLS AND METHOLODGIES
4.2.1 Solutions in the Forestry Sector
4.2.1.1 Direct SolutionsThe most direct solutions to increasing forest cover are policies that address the problem through two different approaches - improved forest management techniques and command-and-control regulations.
Improved forest management techniques include practices that seek to minimize the environmentally harmful impacts of logging using methods such as directional felling, assisted natural regeneration of functional species, lengthening rotations, reducing harvest damage and or accelerating replanting rates (FAO 1996, IPCC 2007). These practices reduce forest carbon emissions both by increasing the efficiency in logging, reducing harvest damage, as well as reducing vulnerability to forest fires.Certain aspects of such improved harvesting practices have been incorporated into codes of practice (for forest harvesting), although as the FAO model code for harvesting emphasizes, it is vital to customize these practices to the forest condition (primary, secondary, degraded) as well as the site characteristics. These codes of practice consider each stage of forest harvest - harvest planning, forest road engineering, cutting, extraction, landing operations, transport operations, harvesting assessment, and the forest harvesting workforce (FAO 1996) – and recommend
practices to minimize impact in each process. Putz et al. (2008) examine a large-scale, long-term study in Malaysia of the carbon benefits of a certain set of improved forest management practices (called Protocol S1), and find that even conservative estimates indicate significantly higher forest carbon in forests that were managed using these techniques. They extend their results to estimate the potential impacts of scaling these techniques to other regions. Figure 4.1 indicates the potential impacts on forest carbon emissions that would result from a large-scale adoption of these techniques at the region level.
Examples of command and control regulations include tree-cutting bans and protected areas. Tree-cutting bans have been imposed in several countries such as those in Kyrgyzstan, Mali, Pakistan, New Zealand, Sri Lanka, Vietnam and China. The results of the bans have been fairly heterogeneous (Waggener et al 2001, Ciesla 2002), and reflect the importance of environmental and social context in determining the relative success of such bans. A similar regulation in the Brazilian Amazon requires that landowners keep 80% of their private lands under forest, although this regulation has not been historically successful (Vosti et al. 2002), except in certain areas (IPCC 2007).
Declaration of protected areas is one of the most extensively used policies to address forest loss, evinced by the fact that protected areas now cover over 12% of the earth’s surface (Chape et al. 2008).
Timber with Forest Stewardship Council logo ready for export from the Republic of Congo
Joha
nnes
Refi
sch

F O R E S T S I N A C H A N G I N G C L I M A T E 45
Figure 4.2 illustrates the rapid growth in the number of protected areas since 1911, although international protected areas have become a prominent part only since the early 21st century. Evaluating the performance of protected areas contains some methodological challenges, some of which have been addressed only recently. One such challenge is that protected areas are often in regions with a low threat of deforestation (Pfaff et al, 2010), and differ from representative land in a region along several
dimensions such as higher elevations, steeper slopes and greater distances to roads and cities (Joppa and Pfaff 2009).
Thus, even if protected areas appear to be effective, it is not straightforward to conclude whether the impact of protected areas – in areas with high risk of forest loss will be as effective. Joppa and Pfaff (2009) examine the impact of protected areas on reduction in the conversion
Figure 4.1: Annual Reductions in Global Carbon Emissions that Would Result from Adoption of Improved Tropical Forest Management Practices (Protocol S1)Source: Putz et al. (2008)
Figure 4.2 – Growth in number of nationally and internationally designated protected areas (1911-2011)Source: IUCN and UNEP-WCMC (2012) The World Database on Protected Areas (WDPA): February 2012. Cambridge, UK: UNEP-WCMC.
L America
0.5
0.4
0.3
0.2
0.1
0
Conventional selective logging
Improved forest management
Carb
on e
mitt
ed (G
tC/y
)
Asia Africa
0.16 GtC
International protected areas
Tota
l num
ber o
f pro
tect
ed a
reas
National protected areas
19111916
19211926
19311936
19411946
19511956
19611966
19711976
19811986
19911996
20012006
2011
Year
180,000
160,000
140,000
120,000
100,000
80,000
60,000
40,000
20,000
0

F O R E S T S I N A C H A N G I N G C L I M A T E46
of land parcels from natural vegetation in 147 countries, using matching methods to account for the non-random allocation of land to protected areas. They find that for 75% of the countries, protected areas do reduce land conversion, although the magnitude of the impact falls in 80% of the cases when the more careful methodology is used. They also find considerable heterogeneity in the impact of protected areas across different characteristics, with areas with flatter elevation, and those close to roads and cities benefiting more by being classified as protected. Other studies (Pfaff et al. 2010) find that protected areas can be effective in areas with high deforestation risk if strong enforcement capacity is present, such as the Chico Mendes Extractive Reserve in the Amazon. While protected areas have the capability to mitigate forest cover loss under certain conditions, unless used in conjunction with other policies, they are not designed to address the issue of relative returns to various land uses.
4.2.1.2 Indirect SolutionsIndirect forestry policies are primarily of two types - those that aim to directly or indirectly increase the relative returns to forest land, and those that aim to encourage and facilitate sustainable forestry institutions at the community level. The former category may be policies that manipulate logging and concession policies, legislation that increases the risk of non-compliance with sustainable supply chain activities such as the Lacey Act in the United States, and most importantly, payments for ecosystem services (PES) and similar conservation incentive type programs such as incentives for allocating land to conservation easements .
PES and conservation incentives are most similar in motivation and policy design to the REDD+ framework. Like REDD+, they seek to align the incentives of society as a whole and the individuals and communities in charge of forest management to achieve the societally beneficial level of forest cover. Payments or other incentives such as grain are provided to these communities conditional on certain pre-defined criteria (such as a certain level of forest cover) being met. An example of such a program is the Grain for Green program in China. These programs have the potential to increase the returns to forest land relative to other uses such as agriculture, but the efficacy, cost-effectiveness, equity, and sustainability of these programs depends on a variety of features of policy design as well as socio-economic and institutional characteristics such as the opportunity cost of forest land, clarity regarding property rights regimes, and the presence of effective monitoring, reporting and verification (MRV) mechanisms. These, and other features of and possibilities of PES and conservation incentives programs, are discussed in detail in Module 8.
Indirect policies in the second category – those that seek to facilitate the creation of institutions that promote sustainable forestry practices – include devolution of forest use decisions to communities, as well as other measures promoting community forestry. Decentralization and devolution can take many forms, and thus the impacts of
such policies on forest cover and quality can vary widely (Burgess et al. 2011, Chhatre and Agrawal 2009, Andersson et al. 2010). Furthermore, the ability of local institutions to truly represent local interests influences both their efficacy as well as the equity impacts of decentralization. Under certain circumstances, decentralization can increase deforestation by increasing the impetus for logging due to local elite capture of resources and corruption, as evinced by the findings of Burgess et al. (2011) in the case of Indonesia.
Community Forestry Management (CFM) is a specific form of devolution, wherein the rights and responsibilities regarding forest management are given to communities or households dependent on those forests. The motivation behind these initiatives is that such regulations would promote efficient management of forests as well as have positive equity impacts on the forest communities. The assumptions that underlie these initiatives are that a) local community leaders who are empowered with these decisions represent the interests of the forest communities without favoritism, b) that adequate financial and administrative capacities are present, or made available via national institutions, to enable communities to implement their decisions, and c) sub-national and national institutions such as forestry departments are able and willing to cooperate with forest communities. Chhatre and Agrawal (2009) find a positive relationship between the extent of local autonomy in forest governance and carbon storage potential of forests, as well as the extent of local autonomy and livelihood benefits, using data from 10 countries in Africa, Asia, and Latin America, indicating that CFM can lead to increased provision of global public goods such as carbon storage as well as benefits to local forest communities. Somanathan et al. (2009) find similar results in their study of forest communities in north India, as do Andersson et al. (2010) in their study of 300 local governments in Bolivia, Guatemala, and Peru. Overall, empirical evidence indicates that such initiatives tends to work well in areas where the devolution of forest management responsibilities are accompanied by the authority to take decisions regarding forest management (Agrawal and Ribot 1999), have the authority to raise revenues locally (Andersson et al 2010), and are accountable to local constituencies (Agrawal and Ribot 1999).
Devolution of decision-making to households and communities dependent on forests include the challenge of ensuring gender equality in forest management. Deforestation, forest degradation, and policies that restrict access to forests usually increase women and children’s labor since they are customarily in charge of firewood collection, through increased search time and effort (IFAD 2009). Agarwal (2001), in a study undertaken in India and Nepal, finds that even initiatives that aim to include local decision-making in forests management such as community forestry groups (CFGs), had limited women’s’ participation not only in active decision-making capacities, but also in nominal participation such as group

F O R E S T S I N A C H A N G I N G C L I M A T E 47
membership. Given the significant proportion of women’s labor allocated to household and economic activities related to forests, adequate representation of women in groups responsible for decision-making regarding forests is crucial to sustainable and equitable forest management.
4.2.2 Solutions in Related Economic Sectors
4.2.2.1 Climate-Smart Agriculture as a Solution to Deforestation and Forest Degradation Module 3 highlighted the significant role of agricultural expansion in driving deforestation and forest degradation, in combination with a variety of other complimentary conditions, such as infrastructure expansion. Agriculture conversion impacts forest land not only via direct loss of forest cover, but also through indirect mechanisms such as increasing fire risk in forest areas close to cleared areas for agriculture. Morton et al. (2008) find that high-frequency fires typical of deforestation comprised more that 40% of fires detected via satellite imagery between 2003 and 2007 in Amazonia.
There are a variety of solutions in the agricultural sector that have the potential for reducing GHG emissions without adversely affecting productivity, collectively known as Reduced Emissions Agricultural Policies (REAP) (CIFOR 2009). Amongst these solutions, those that increase returns to currently cropped land or incorporate trees into current cropping systems may impact forest cover directly, the former through reduced pressure to convert forest land to other uses, although as detailed below, the impacts of such practices are not the same across technologies or contexts . In addition, there are agricultural practices that directly and indirectly enhance forest cover by increasing the relative returns to currently cropped land, thereby
reducing pressure to convert forest land. For instance, incorporating trees into current cropping systems via agro-forestry, can potentially provide several ecosystem services such as carbon sinks in addition to agricultural income, and directly increase the availability of land under forests (assuming plantations are designated as forests). Furthermore, agricultural practices that increase the fertility of currently cropped land may also indirectly lead to greater forest cover, by increasing the relative returns to currently cropped land, thereby precluding the need to convert forest land. It is crucial to emphasize, however, that the impacts of these initiatives, even those that increase the relative returns to currently cropped land, may vary depending on numerous economic, technological, and institutional factors.
While the theoretical argument of the increased intensification leading to greater forest cover through reduced pressure to convert forest land into agriculture is intuitive, theory also indicates channels whereby the opposite effect may occur. These channels may operate through either increased profitability of farming causing greater forest clearing, or if high levels of complementarity exist between land and other inputs, and other inputs are relatively expensive. Other factors affecting the net impact of empirical evidence include the degree of openness to trade, how technological change impacts frontier and non-frontier agriculture, the price elasticities in input and output markets, and enforcement capacity of forest institutions (Angelsen 1998). Figure 3, reproduced from Rudel et al (2009), indicates that increase in yields of ten major crops over the 35 years between 1970 and 2005 have not been accompanied by proportional decreases in cultivated area, which is indicative evidence that technological changes may not reduce pressure on forest land significantly. The authors
Figure 4.3. Global Trends Over Time in Yield, Cultivated Area, and Prices for Ten Major Crops, 1970-2005Source: Rudel et al. (2009)
Prices Cultivated areaYield
Year
Hec
tare
s (t
hous
ands
)
USD
(PPP
)
Hec
togr
ams
per H
ecta
re
1970 1975 1980 1985 1990 1995 2000 2005
540000
590000
640000
690000
750000
55000
50000
45000
40000
35000
30000
1970
1970
1970
1970
1970

F O R E S T S I N A C H A N G I N G C L I M A T E48
also find that the exceptions to this finding were countries with grain imports and conservation set-aside programs.
In accordance with theory, empirical findings regarding this question are also heterogenous. Foster and Rosenzweig (2003) find that agricultural intensification did not cause increased forest area in India, attributing the increased forest area to increased demand for forest products. Morton et al. (2006) too find that agricultural intensification may not arrest forest loss, using data from the Brazilian Amazon. In contrast, Shively and Pagiola (2004) use panel data between 1994 and 2000 from the southern Palawan, a frontier region in the Philippines, and find that agricultural intensification – in this case being irrigation projects - reduced forest pressure through increased agricultural wages and non-agricultural employment opportunities, thereby causing both reduced forest clearing as well as lower poverty. Furthermore, there is evidence that technologies promoting agricultural intensification may have indirect impacts on deforestation contrary to their direct impacts. For instance, while the introduction of cassava in Zambia led to reduced pressure on forest land and lower deforestation in the short-run, it also led to higher population and greater deforestation around lakes and towns in the longer run. Similarly, while the introduction of capital-intensive maize production technologies in the same region reduced deforestation in the short-run, the impacts largely disappeared with the removal of agricultural subsidies promoting these technologies (CAB International 2001).
Cattaneo (2001) investigates the impacts of varying technological change – for annual crops, perennial crops and livestock systems – on deforestation in the Brazilian Amazon. He finds the impacts of different types of agricultural technological change may have varying impacts on forest clearing, that the short-run and long-run impacts of these changes may be different, and finally, that the impact of a certain type of technological change may vary depending on whether small-holder agriculturalists or large-scale farmers adopt the technology. Ewers et al analyze data from 124 countries from 1979 to 1999 and find that while yields of 23 staple crops increase over time, total cropped area decreased only for a subset of developing countries, and that land freed by increases in yields of staple crops was in some cases used for growing other crops. And that , in countries where yields increased most, the decreases in forest areas were smaller.
Thus, currently available theoretical and empirical evidence highlights the numerous channels via which agricultural intensification can affect the relative returns to forested land, such as pre-technological change local institutions and the nature of technological change, and underscores the importance of understanding these conditions in order to facilitate policy decisions that seek to use agricultural intensification as a solution to deforestation and forest degradation.
4.2.2.2 Sustainable Energy Solutions and Deforestation and Forest DegradationThere are primarily two drivers in the energy sector linked with deforestation and forest degradation. First, fuel-wood extraction is a leading cause of forest degradation (UNFCCC 2006). Secondly expansion of land under biofuels is linked with deforestation. The latter driver comprises a subset of agricultural expansion activities that are discussed in detail in Module 3.
Extraction of fuel-wood and consequent forest degradation can increase with changes in the energy sector such as lower availability of alternative fuels for heating or cooking. About 2.7 billion people worldwide rely on biomass for their fuel needs, and these fuels account for 90% of household energy consumption in some counties (OECD 2006). As Figure 4 indicates, the vast majority of people relying on biomass for their primary cooking fuel needs are in rural areas, with Sub-Saharan Africa and Asia comprising the highest percentages of this population. Dependence on biomass for cooking for traditional cook stoves has also been associated with detrimental health impacts (WHO 2011). Traditional biomass and coal stoves used by almost half of the world’s population are associated with large mortality and morbidity burdens, including about 2 million deaths annually from chronic obstructive pulmonary disease as well as pneumonia in children under the age of 5 (WHO 2011). Scenario modeling undertaken by the WHO indicates that a significant portion of this is largely avoidable with the implementation of advanced biomass or biogas cook stoves. In addition to direct health impacts, there are other costs associated with dependence on biomass for energy, including the opportunity costs of time involved in collection, as well as compromised safety for women and children largely responsible for collection. These latter costs are exacerbated by deforestation and forest degradation, which reduce the level of collectible biomass.
Furthermore, events in local and international energy markets such as price increases can make forest clearing for alternative forest fuels such as charcoal economically viable. This phenomenon is documented by Elnagheeb and Bromley (1993), who find that increased prices of charcoal increase acreage under sorghum in Sudan, since higher fuel prices make clearing forest land more economically viable, and post-clearing, the land is converted to agriculture.
Biofuel production mandates, like other agricultural expansionary pressures, reduce the relative returns from forest land. The global magnitude of biofuels production on deforestation is complex to identify due to not only data considerations, but also varying definitions of deforestation, the multiple uses of crops that are used for biofuels, and the heterogeneous impacts of the particular feedstock used in production (Gao et al 2011). Furthermore, the possible impacts of second-generation biofuels on deforestation and forest degradation are

F O R E S T S I N A C H A N G I N G C L I M A T E 49
Dav
id M
urdi
yars
o/C
IFO
R
Mangrove – many reforestation programmes across Asia take into consideration careful land-use planning, such as the CIFOR project in West Kalimantan
relatively understudied. Gao et al (2011) examine seven major and eight smaller hotspots for biofuel production and deforestation across Latin America, sub-Saharan Africa, and Asia, and conclude that large-scale biofuel expansion is likely to induce further deforestation, largely driven by land-use pressures and insufficient institutional capacity required to manage land-uses sustainably.
In absence of targeted polices that seek to increase efficiency in the use of these fuels and facilitate the transition to other fuels, this number is projected to increase due to population growth (OECD 2006), although the impacts are likely to be heterogeneous by region, and may be reversed in certain regions. Policies that seek to minimize the dependence of populations on these fuels, for public health, economic and environmental reasons, would require mobilization across sectors, such as government subsidies, improved public distribution systems, policies to reduced dependence on commodity price fluctuations, and microfinance initiatives to encourage adoption of more energy-efficient cook stoves and diversification into alternative fuels such as Liquefied Petroleum Gas (LPG). Thus, concerted, multi-sector initiatives have the potential to mitigate the impacts of energy demand on forest cover, by targeting the demand-side drivers of deforestation and forest degradation, combined with policies in the forest sector such as community forestry to facilitate sustainable fuelwood extraction which impact the supply side.
4.2.2.3 Land Use Planning: Landscape Approaches as a Solution to Deforestation and Forest DegradationForward-thinking and consistent land use planning at the landscape level are a crucial solution to deforestation and forest degradation in primarily two ways. The first set of such decisions include the site selection for infrastructural projects in general and roads in particular, which have been linked robustly to deforestation and forest degradation in numerous regional and sub-regional studies, as detailed in Module 3. Thus, site selection of infrastructural projects to balance the tradeoffs of maximal socio-economic returns with minimum impact on deforestation and forest degradation is a challenge that will crucially impact forest cover in the coming decades.
The second set of land use decisions which are vital for forest cover is land use decisions in related economic sectors. As illustrated in Module 3 and section 4.2.2.1, polices in related sectors, i.e. regional agricultural policies such as input subsidies or price support mechanisms, or international policies such as biofuel production mandates that affect the relative returns to forest land critically impact forest cover. Land-use management that mitigates the impacts on deforestation and forest degradation requires a) coordination amongst agencies at the international, national and sub-national levels, as well as across various ministries and government departments, and b) a better understanding of the returns to expansion of land under
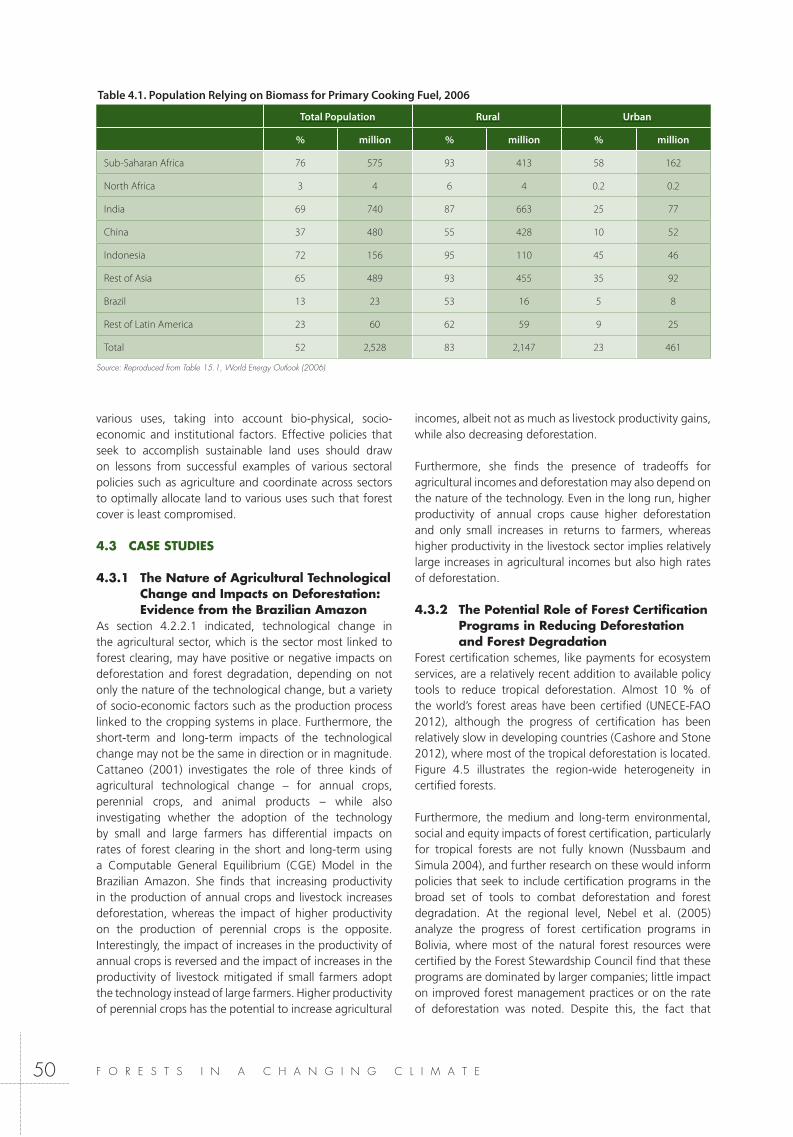
F O R E S T S I N A C H A N G I N G C L I M A T E50
various uses, taking into account bio-physical, socio-economic and institutional factors. Effective policies that seek to accomplish sustainable land uses should draw on lessons from successful examples of various sectoral policies such as agriculture and coordinate across sectors to optimally allocate land to various uses such that forest cover is least compromised.
4.3 CASE STUDIES
4.3.1 The Nature of Agricultural Technological Change and Impacts on Deforestation: Evidence from the Brazilian Amazon
As section 4.2.2.1 indicated, technological change in the agricultural sector, which is the sector most linked to forest clearing, may have positive or negative impacts on deforestation and forest degradation, depending on not only the nature of the technological change, but a variety of socio-economic factors such as the production process linked to the cropping systems in place. Furthermore, the short-term and long-term impacts of the technological change may not be the same in direction or in magnitude.Cattaneo (2001) investigates the role of three kinds of agricultural technological change – for annual crops, perennial crops, and animal products – while also investigating whether the adoption of the technology by small and large farmers has differential impacts on rates of forest clearing in the short and long-term using a Computable General Equilibrium (CGE) Model in the Brazilian Amazon. She finds that increasing productivity in the production of annual crops and livestock increases deforestation, whereas the impact of higher productivity on the production of perennial crops is the opposite. Interestingly, the impact of increases in the productivity of annual crops is reversed and the impact of increases in the productivity of livestock mitigated if small farmers adopt the technology instead of large farmers. Higher productivity of perennial crops has the potential to increase agricultural
incomes, albeit not as much as livestock productivity gains, while also decreasing deforestation.
Furthermore, she finds the presence of tradeoffs for agricultural incomes and deforestation may also depend on the nature of the technology. Even in the long run, higher productivity of annual crops cause higher deforestation and only small increases in returns to farmers, whereas higher productivity in the livestock sector implies relatively large increases in agricultural incomes but also high rates of deforestation.
4.3.2 The Potential Role of Forest Certification Programs in Reducing Deforestation and Forest Degradation
Forest certification schemes, like payments for ecosystem services, are a relatively recent addition to available policy tools to reduce tropical deforestation. Almost 10 % of the world’s forest areas have been certified (UNECE-FAO 2012), although the progress of certification has been relatively slow in developing countries (Cashore and Stone 2012), where most of the tropical deforestation is located. Figure 4.5 illustrates the region-wide heterogeneity in certified forests.
Furthermore, the medium and long-term environmental, social and equity impacts of forest certification, particularly for tropical forests are not fully known (Nussbaum and Simula 2004), and further research on these would inform policies that seek to include certification programs in the broad set of tools to combat deforestation and forest degradation. At the regional level, Nebel et al. (2005) analyze the progress of forest certification programs in Bolivia, where most of the natural forest resources were certified by the Forest Stewardship Council find that these programs are dominated by larger companies; little impact on improved forest management practices or on the rate of deforestation was noted. Despite this, the fact that
Table 4.1. Population Relying on Biomass for Primary Cooking Fuel, 2006
Total Population Rural Urban
% million % million % million
Sub-Saharan Africa 76 575 93 413 58 162
North Africa 3 4 6 4 0.2 0.2
India 69 740 87 663 25 77
China 37 480 55 428 10 52
Indonesia 72 156 95 110 45 46
Rest of Asia 65 489 93 455 35 92
Brazil 13 23 53 16 5 8
Rest of Latin America 23 60 62 59 9 25
Total 52 2,528 83 2,147 23 461
Source: Reproduced from Table 15.1, World Energy Outlook (2006)
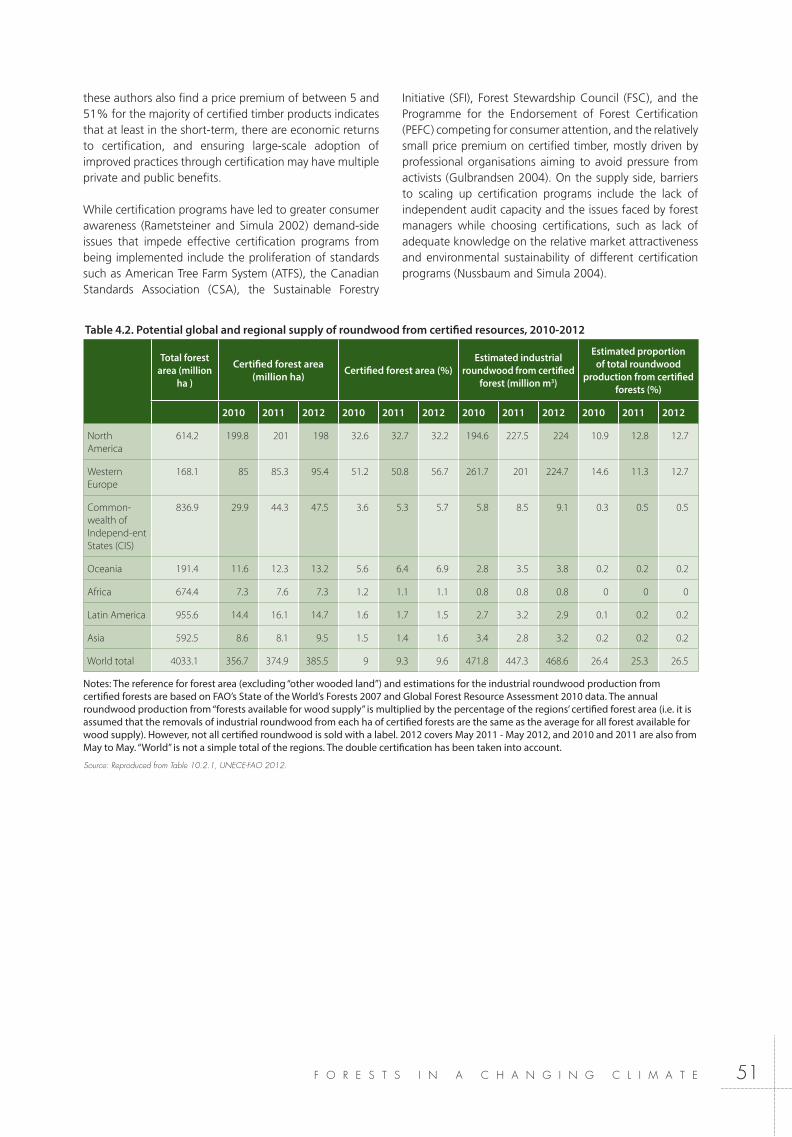
F O R E S T S I N A C H A N G I N G C L I M A T E 51
Table 4.2. Potential global and regional supply of roundwood from certified resources, 2010-2012
Total forest area (million
ha )
Certified forest area (million ha) Certified forest area (%)
Estimated industrial roundwood from certified
forest (million m3)
Estimated proportion of total roundwood
production from certified forests (%)
2010 2011 2012 2010 2011 2012 2010 2011 2012 2010 2011 2012
North America
614.2 199.8 201 198 32.6 32.7 32.2 194.6 227.5 224 10.9 12.8 12.7
Western Europe
168.1 85 85.3 95.4 51.2 50.8 56.7 261.7 201 224.7 14.6 11.3 12.7
Common-wealth of Independ-ent States (CIS)
836.9 29.9 44.3 47.5 3.6 5.3 5.7 5.8 8.5 9.1 0.3 0.5 0.5
Oceania 191.4 11.6 12.3 13.2 5.6 6.4 6.9 2.8 3.5 3.8 0.2 0.2 0.2
Africa 674.4 7.3 7.6 7.3 1.2 1.1 1.1 0.8 0.8 0.8 0 0 0
Latin America 955.6 14.4 16.1 14.7 1.6 1.7 1.5 2.7 3.2 2.9 0.1 0.2 0.2
Asia 592.5 8.6 8.1 9.5 1.5 1.4 1.6 3.4 2.8 3.2 0.2 0.2 0.2
World total 4033.1 356.7 374.9 385.5 9 9.3 9.6 471.8 447.3 468.6 26.4 25.3 26.5
Notes: The reference for forest area (excluding “other wooded land”) and estimations for the industrial roundwood production from certified forests are based on FAO’s State of the World’s Forests 2007 and Global Forest Resource Assessment 2010 data. The annual roundwood production from “forests available for wood supply” is multiplied by the percentage of the regions’ certified forest area (i.e. it is assumed that the removals of industrial roundwood from each ha of certified forests are the same as the average for all forest available for wood supply). However, not all certified roundwood is sold with a label. 2012 covers May 2011 - May 2012, and 2010 and 2011 are also from May to May. “World” is not a simple total of the regions. The double certification has been taken into account.
Source: Reproduced from Table 10.2.1, UNECE-FAO 2012.
these authors also find a price premium of between 5 and 51% for the majority of certified timber products indicates that at least in the short-term, there are economic returns to certification, and ensuring large-scale adoption of improved practices through certification may have multiple private and public benefits.
While certification programs have led to greater consumer awareness (Rametsteiner and Simula 2002) demand-side issues that impede effective certification programs from being implemented include the proliferation of standards such as American Tree Farm System (ATFS), the Canadian Standards Association (CSA), the Sustainable Forestry
Initiative (SFI), Forest Stewardship Council (FSC), and the Programme for the Endorsement of Forest Certification (PEFC) competing for consumer attention, and the relatively small price premium on certified timber, mostly driven by professional organisations aiming to avoid pressure from activists (Gulbrandsen 2004). On the supply side, barriers to scaling up certification programs include the lack of independent audit capacity and the issues faced by forest managers while choosing certifications, such as lack of adequate knowledge on the relative market attractiveness and environmental sustainability of different certification programs (Nussbaum and Simula 2004).

F O R E S T S I N A C H A N G I N G C L I M A T E52
4.4 KEY ISSUES FOR DISCUSSION
4.4.1 Robust Evaluation of the Drivers of Efficacy of SolutionsAs section 4.1 discussed, in addition to the solutions detailed here, there are numerous other initiatives that have the potential to reduce deforestation and forest degradation. However, there is insufficient research regarding their efficacy both in absolute and relative terms. These include not only initiatives that have been in existence for several decades such as debt for nature swaps, conservation easements, and international donor coordination, but also recent initiatives such as forest certification and labeling. Even for solutions such as decentralization on which there is a vast literature, including on which institutional factors lead to successful outcomes (Agrawal and Ribot 1999, Andersson et al 2010), policy decisions would benefit from research on magnitude of these conditions – for instance, if local representation is vital to the success of decentralization, what is relative magnitude of local representation which bodes well for success?
Key research questions that would greatly enhance the efficacy of policies include a) the absolute and relative efficacy of these policy solutions, b) the baseline conditions that influence the efficacy of these solutions, and the direction and magnitude of the influence, c) the performance of these solutions when implemented in conjunction with other policy solutions, including those in non-forestry sectors.
4.4.2 Potential for Multi-Sectoral, Multi-Level SolutionsThe prevalent socio-economic, bio-physical, and institutional conditions, and consequently the drivers of deforestation and forest degradation, vary spatially and temporally. A clearer understanding of how these linkages work would enable multi-sectoral, multi-level policies that are more effective at targeting the underlying causes of forest loss, in a manner that is cost-effective and equitable. For instance, payments for ecosystem services are likely to be effective, as well as promote socio-economic development in regions where relatively large sections of the population are economically dependent on forests communities, and protected areas are likely to be more effective in regions close to cities.
In parallel, understanding which agricultural technologies are conducive to reducing pressure from forest land would facilitate the dual goals of economic development and greater forest cover, which in turn may provide ecosystem services favorable for the agricultural sector in the long-term. National policies promoting infrastructure development or agricultural subsidies should consider the tradeoffs of forest loss with socio-economic development, and international loans that finance these projects should consider the short and long-term environmental impacts. Furthermore, robust monitoring, reporting and verification (MRV) mechanisms are vital to evaluate the performance of these policy tools, which has the potential to inform future policy decisions. Decades of forest conservation initiatives have numerous lessons for designing effective policies across sectors and levels of governance. However, understanding how local conditions determine the optimal portfolio of policies, and how these should respond to local socio-economic changes over time is essential for not only improving extant policies, but designing future policy frameworks such as REDD+ to be effective, equitable, and flexible, in addition to being well-coordinated with policies in related sectors.

F O R E S T S I N A C H A N G I N G C L I M A T E 53
4.5 REFERENCES
Agarwal, Bina. “Participatory exclusions, community forestry, and gender: An analysis for South Asia and a conceptual framework.” World development 29, no. 10 (2001): 1623-1648.
Agrawal, Arun, and Jesse Ribot. “Accountability in decentralization: A framework with South Asian and West African cases.” The Journal of Developing Areas (1999): 473-502.
Alves, D. S., J. L. G. Pereira, C. L. De Sousa, J. V. Soares, and F. Yamaguchi. “Characterizing landscape changes in central Rondonia using Landsat TM imagery.” International Journal of Remote Sensing 20, no. 14 (1999): 2877-2882.
Andam, Kwaw S., Paul J. Ferraro, Alexander Pfaff, G. Arturo Sanchez-Azofeifa, and Juan A. Robalino. “Measuring the effectiveness of protected area networks in reducing deforestation.” Proceedings of the National Academy of Sciences 105, no. 42 (2008): 16089-16094.
Andersson, Krister, and Clark C. Gibson. “Decentralized governance and environmental change: local institutional moderation of deforestation in Bolivia.” Journal of Policy Analysis and Management 26, no. 1 (2007): 99-123.
Angelsen, Arild. “Agricultural expansion and deforestation: modelling the impact of population, market forces and property rights.” Journal of development economics 58, no. 1 (1999): 185-218.
Angelsen, Arild, and David Kaimowitz, eds. Agricultural technologies and tropical deforestation. CABi, 2001.
Banana, Abwoli Y., Nathan D. Vogt, Joseph Bahati, and William Gombya-Ssembajjwe. “Decentralized governance and ecological health: why local institutions fail to moderate deforestation in Mpigi district of Uganda.” Scientific Research and Essay 2, no. 10 (2007): 434-445.
Brockhaus, Maria. Realising REDD+: National strategy and policy options. CIFOR, 2009.
Burgess, Robin, Matthew Hansen, Benjamin A. Olken, Peter Potapov, and Stefanie Sieber. The political economy of deforestation in the tropics. No. w17417. National Bureau of Economic Research, 2011.
Cattaneo, Andrea. “Deforestation in the Brazilian Amazon: comparing the impacts of macroeconomic shocks, land tenure, and technological change.” Land Economics 77, no. 2 (2001): 219-240.
Cashore, Benjamin, and Michael W. Stone. “Can legality verification rescue global forest governance?: Analyzing the potential of public and private policy intersection to ameliorate forest challenges in Southeast Asia.” Forest Policy and Economics (2012).
Chape, Stuart, Mark D. Spalding, and Martin D. Jenkins, eds. The world’s protected areas: status, values and prospects in the 21st century. University of California Press, 2008.
Chhatre, Ashwini, and Arun Agrawal. “Trade-offs and synergies between carbon storage and livelihood benefits from forest commons.” Proceedings of the National Academy of Sciences 106, no. 42 (2009): 17667-17670.
Ciesla, William, M. “Juniper forests—a special challenge for sustainable forestry.” Forests, trees and livelihoods 12, no. 3 (2002): 195-207.
Davidson, Ogunlade R. Climate Change 2007: Mitigation: Contribution of Working Group III to the Fourth Assessment Report of the Intergovernmental Panel on Climate Change. Edited by Bert Metz. Intergovernmental Panel on Climate Change, 2007.
Dykstra, Dennis P., Rudolf Heinrich, and David A. Harcharic. FAO model code of forest harvesting practice. Rome, Italy: Food and Agriculture Organization of the United Nations, 1996.Elnagheeb, Abdelmoneim H., and Daniel W. Bromley. “Extensification of agriculture and deforestation: Empirical evidence from Sudan.” Agricultural Economics 10, no. 2 (1994): 193-200.
Ewers, Robert M., Jörn PW Scharlemann, Andrew Balmford, and Rhys E. Green. “Do increases in agricultural yield spare land for nature?” Global Change Biology 15, no. 7 (2009): 1716-1726.Foster, Andrew D., and Mark R. Rosenzweig. “Economic growth and the rise of forests.” The Quarterly Journal of Economics 118, no. 2 (2003): 601-637.
Gao, Yan, et al. A global analysis of deforestation due to biofuel development. Cifor, (2011).
Gulbrandsen, Lars H. “Overlapping public and private governance: Can forest certification fill the gaps in the global forest regime?.” Global Environmental Politics 4, no. 2 (2004): 75-99.International Fund for Agricultural Development. Gender in Agriculture Sourcebook. World Bank Publications, 2009.
Joppa, Lucas N., and Alexander Pfaff. “High and far: biases in the location of protected areas.” PLoS One 4, no. 12 (2009): e8273.
Kanowski, Peter J., Constance L. McDermott, and Benjamin W. Cashore. “Implementing REDD+: lessons from analysis of forest governance.” Environmental science & policy 14, no. 2 (2011): 111-117.
Metz, B. , O.R. Davidson, P.R. Bosch, R. Dave, L.A. Meyer (eds) Contribution of Working Group III to the Fourth Assessment Report of the Intergovernmental Panel on Climate Change, (2007) Cambridge University Press, Cambridge, United Kingdom and New York, NY, USA.
Morton, D. C., R. S. Defries, J. T. Randerson, L. Giglio, W. Schroeder, and G. R. Van Der Werf. “Agricultural intensification increases deforestation fire activity in Amazonia.” Global Change Biology 14, no. 10 (2008): 2262-2275.
Morton, Douglas C., Ruth S. DeFries, Yosio E. Shimabukuro, Liana O. Anderson, Egidio Arai, Fernando del Bon Espirito-Santo, Ramon Freitas, and Jeff Morisette. “Cropland expansion changes deforestation dynamics in the southern Brazilian Amazon.” Proceedings of the National Academy of Sciences 103, no. 39 (2006): 14637-14641.
Nussbaum, Ruth, and Marku Simula. “Forest certification: a review of impacts and assessment frameworks.” New Haven: Yale University, School of Forestry and Environmental Studies, The Forests Dialogue (2004).
Organisation for Economic Co-operation and Development. World Energy Outlook 2006.
Organisation for Economic Co-operation and Development, 2006.
Olivieri, Silvio, R. Waller, and C. Borja. “World Database of Protected Areas.” Center for Applied Biodiversity Science,

F O R E S T S I N A C H A N G I N G C L I M A T E54
Conservation International and the United Nations Environment Program, World Conservation Monitoring Centre. CD-ROM (2005).
Pfaff, Alexander, Erin O. Sills, Gregory S. Amacher, Michael J. Coren, Kathleen Lawlor, and Charlotte Streck. “Policy impacts on deforestation: lessons learned from past experiences to inform new initiatives.” (2010).
Putz, Francis E., Pieter A. Zuidema, Michelle A. Pinard, Rene GA Boot, Jeffrey A. Sayer, Douglas Sheil, Plinio Sist, and Jerome K. Vanclay. “Improved tropical forest management for carbon retention.” PLoS Biology 6, no. 7 (2008): e166.
Rudel, Thomas K., Laura Schneider, Maria Uriarte, B. L. Turner, Ruth DeFries, Deborah Lawrence, Jacqueline Geoghegan et al. “Agricultural intensification and changes in cultivated areas, 1970–2005.” Proceedings of the National Academy of Sciences 106, no. 49 (2009): 20675-20680.
Shively, Gerald E., and Stefano Pagiola. “Agricultural intensification, local labor markets, and deforestation in the Philippines.” Environment and Development Economics 9, no. 2 (2004): 241-266.
Somanathan, Eswaran, R. Prabhakar, and Bhupendra Singh Mehta. “Decentralization for cost-effective conservation.” Proceedings of the National Academy of Sciences 106, no. 11 (2009): 4143-4147.
UNECE-FAO. Forest Products Annual Market Review 2011-2012. United Nations Publications, 2012.
UNFCCC. “Scientific, socio-economic, technical and methodological issues related to deforestation in developing countries.” Background Paper for the Workshop on Reducing Emissions from Deforestation in Developing Countries. (2006).
Vosti, Stephen A., Julie Witcover, and Chantal Line Carpentier. Agricultural intensification by smallholders in the western Brazilian Amazon: From deforestation to sustainable land use. No. 130. International Food Policy Research Institute, 2002.
Waggener, Thomas R., Thomas Enters, and Tan Lay Cheng. Forests out of bounds. Ed. Patrick B. Durst. Food and Agriculture Organization of the United Nations, Regional Office for Asia and the Pacific, 2001.
World Health Organization. “Health in the green economy: health co-benefits of climate change mitigation, housing sector.” Geneva: WHO, 2011.
World Health Organization. “Health in the green economy: health co-benefits of climate change mitigation, Household Energy in Developing Countries.” Geneva: WHO, 2011. Policy Brief.

F O R E S T S I N A C H A N G I N G C L I M A T E 55
5.1 FUNDAMENTALS
M O D U L E 5The REDD+ approach
5.1.1 The Emergence of REDD+ in the U.N. Climate RegimeThe potential role of forests in mitigating climate change was first recognized in the U.N. Framework Convention on Climate Change itself, which obliges state parties to promote the sustainable management, conservation and enhancement of forests, among other identified carbon sinks and reservoirs (UNFCCC, 1992, art. 4(1)(d)). The Kyoto Protocol further enables Industrialized states to take measures to reduce or limit emissions from land use, land-use change, and forestry (LULUCF) as part of their climate mitigation commitments (Schlamadinger et al. 2007). Until the mid-2000s however, the U.N. climate regime did little to address the most significant global source of carbon emissions from LULUCF – deforestation and forest degradation in developing countries – especially since tropical deforestation was largely excluded from the scope of application of the clean development mechanism (CDM) (see section 5.4 below).
To a large extent, the neglect of deforestation in developing countries in the first fifteen years of the U.N. climate regime reflects the broader political dynamics of global climate governance. Addressing forestry-related emissions in developing countries has long been a politically controversial issue within the UNFCCC (Humphreys 2008, 433-442). In accordance with the underlying principle of common but differentiated responsibilities, common responsibilities to stabilize the climate should be implemented in a manner that takes into account the historical contribution of developed and developing countries to current levels of GHG emissions and their respective capabilities for undertaking mitigation actions. Developed countries should therefore “take the lead in combating climate change and the adverse effects thereof” (UNFCCC 1992, art. 3(1)). Viewed in this light, the inclusion of tropical deforestation in the climate regime raises sensitive issues of equity, does little to move the world away from a fossil-fuel based economy, and may in fact delay or prevent significant mitigation action in developed countries (Ebeling 2008, 44-45; Okereke and Dooley 2010). Moreover, the potential imposition of international rules and solutions aimed at removing or lessening tropical deforestation raises a number of contentious political issues in developing countries themselves, including concerns about national sovereignty, economic well-being, and local impacts and livelihoods (Peskett and Brockhaus 2009). Lastly, a number of technical concerns have hindered early action on tropical deforestation, including the challenges of ensuring that reductions in emissions from deforestation are not eventually reversed by later activities (non-permanence), represent a net positive change in terms of an established reference level scenario (additionality), and are not otherwise negated by increases in deforestation activities elsewhere (leakage) (Streck et al. 2008, 5-6).
Yet, with the rising urgency over the impending consequences of climate change and growing frustration over the failure of industrialized and emerging economies to take action to mitigate climate change, numerous actors began to see the reduction of tropical deforestation as a relatively inexpensive, simple, and rapid way of reducing a significant share of global GHG emissions (Stern 2006, 537; Angelsen and McNeill 2012, 35). The idea of establishing a global mechanism to reduce emissions from deforestation and forest degradation in developing countries quickly emerged and gained traction in the U.N. climate regime from 2005 to 2010. In December 2005, a submission of the governments of Costa Rica and Papua New Guinea called for state parties to the UNFCCC to take action to reduce emissions from deforestation in developing countries (Governments of Papua New Guinea and Costa Rica 2005). Two years later, as part of the Bali Action Plan, the UNFCCC COP formally initiated negotiations to provide incentives and policy approaches for reducing emissions from deforestation and forest degradation and supporting the conservation and sustainable management of forests, and the enhancement of forest carbon stocks in developing countries (UNFCCC COP 2008, para. 1(b)(ii)).
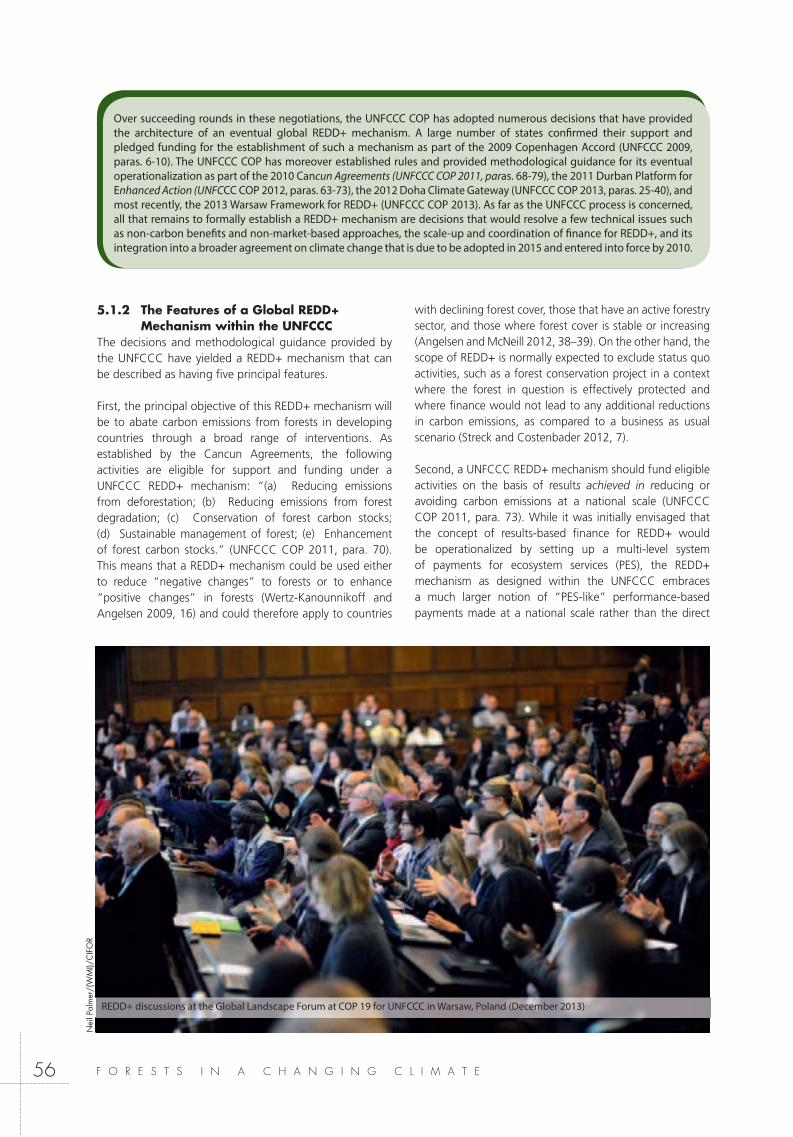
F O R E S T S I N A C H A N G I N G C L I M A T E56
REDD+ discussions at the Global Landscape Forum at COP 19 for UNFCCC in Warsaw, Poland (December 2013)
Nei
l Pal
mer
/(W
MI)/
CIF
OR
Over succeeding rounds in these negotiations, the UNFCCC COP has adopted numerous decisions that have provided the architecture of an eventual global REDD+ mechanism. A large number of states confirmed their support and pledged funding for the establishment of such a mechanism as part of the 2009 Copenhagen Accord (UNFCCC 2009, paras. 6-10). The UNFCCC COP has moreover established rules and provided methodological guidance for its eventual operationalization as part of the 2010 Cancun Agreements (UNFCCC COP 2011, paras. 68-79), the 2011 Durban Platform for Enhanced Action (UNFCCC COP 2012, paras. 63-73), the 2012 Doha Climate Gateway (UNFCCC COP 2013, paras. 25-40), and most recently, the 2013 Warsaw Framework for REDD+ (UNFCCC COP 2013). As far as the UNFCCC process is concerned, all that remains to formally establish a REDD+ mechanism are decisions that would resolve a few technical issues such as non-carbon benefits and non-market-based approaches, the scale-up and coordination of finance for REDD+, and its integration into a broader agreement on climate change that is due to be adopted in 2015 and entered into force by 2010.
5.1.2 The Features of a Global REDD+ Mechanism within the UNFCCC
The decisions and methodological guidance provided by the UNFCCC have yielded a REDD+ mechanism that can be described as having five principal features.
First, the principal objective of this REDD+ mechanism will be to abate carbon emissions from forests in developing countries through a broad range of interventions. As established by the Cancun Agreements, the following activities are eligible for support and funding under a UNFCCC REDD+ mechanism: “(a) Reducing emissions from deforestation; (b) Reducing emissions from forest degradation; (c) Conservation of forest carbon stocks; (d) Sustainable management of forest; (e) Enhancement of forest carbon stocks.” (UNFCCC COP 2011, para. 70). This means that a REDD+ mechanism could be used either to reduce “negative changes” to forests or to enhance “positive changes” in forests (Wertz-Kanounnikoff and Angelsen 2009, 16) and could therefore apply to countries
with declining forest cover, those that have an active forestry sector, and those where forest cover is stable or increasing (Angelsen and McNeill 2012, 38–39). On the other hand, the scope of REDD+ is normally expected to exclude status quo activities, such as a forest conservation project in a context where the forest in question is effectively protected and where finance would not lead to any additional reductions in carbon emissions, as compared to a business as usual scenario (Streck and Costenbader 2012, 7).
Second, a UNFCCC REDD+ mechanism should fund eligible activities on the basis of results achieved in reducing or avoiding carbon emissions at a national scale (UNFCCC COP 2011, para. 73). While it was initially envisaged that the concept of results-based finance for REDD+ would be operationalized by setting up a multi-level system of payments for ecosystem services (PES), the REDD+ mechanism as designed within the UNFCCC embraces a much larger notion of “PES-like” performance-based payments made at a national scale rather than the direct

F O R E S T S I N A C H A N G I N G C L I M A T E 57
and conditional provision of incentives at a project scale (Angelsen and McNeill 2012, 42-46). Of course, even if the UNFCCC REDD+ mechanism does not function as a genuine PES system, this does not exclude the possibility that developing countries may initiate PES systems or authorize PES projects as part of their domestic REDD+ programmes.
Third, REDD+ activities eligible for funding under a UNFCCC mechanism must be measured, reported, and verified (MRV) (UNFCCC COP 2011, para. 71(c)) and assessed on the basis of a previously developed forest emissions level or forest reference level (UNFCCC COP 2011, para. 71(b); UNFCCC COP, 2012b). The design of both of these elements of the REDD+ mechanism has led to contentious negotiations between countries committed to safeguarding the integrity of a REDD+ mechanism and countries concerned with safeguarding their sovereignty as well as ensuring that REDD+ does not blur the distinction between industrialized countries that must take action to reduce their carbon emissions and developing countries that are only encouraged to undertake nationally-appropriate mitigation actions. In both cases, the UNFCCC COP and SBSTA has provided methodological guidance as well as set up a review process that includes a technical assessment by international experts (UNFCCC COP, 2013c; UNFCCC COP, 2013d).
Fourth, the UNFCCC COP has reiterated, in line with the principle of common, but differentiated responsibilities, that the pursuit of REDD+ activities by developing countries is subject to their national capabilities, capacities, and circumstances and is moreover contingent on the delivery of adequate and predictable levels of financial and technical support received from developed countries (UNFCCC COP 2011, para. 71, 74 and 76; UNFCCC COP, 2013b; see also module 11 of this sourcebook). The Durban Platform further specifies that finance for REDD+ activities “may come from a wide variety of sources, public and private, bilateral and multilateral, including alternative sources” and recognizes that “appropriate market-based activities” could be developed for this purpose (UNFCCC COP 2012, para. 65-66). The nature and level of public and private finance that may eventually be available for the implementation of results-based actions for REDD+ will depend on a host of factors, including the decisions within the UNFCCC regarding the coordination of funding, the progress of REDD+ readiness efforts in a given country, the national policies and regulations of host developing countries, and whether developed country governments or firms have committed to ambitious climate mitigation objectives that create a demand for emissions reductions achieved through REDD+ (Angelsen and McNeill 2012, 46).
Fifth, the UNFCCC COP has recognized that beyond the need to contribute to climate mitigation, a REDD+ mechanism should also engage with a series of important environmental, economic, and social objectives. The Cancun Agreements thus provide that REDD+ activities should, among other considerations, “[b]e consistent with the objective of environmental integrity and take into account the multiple functions of forests and other
ecosystems,” “[b]e consistent with Parties’ national sustainable development needs and goals,” and “[b]e implemented in the context of sustainable development and reducing poverty, while responding to climate change.” (UNFCCC COP 2011, Annex I, para. 1) To that end, the UNFCCC COP has adopted a series of environmental and social safeguards for REDD+ activities, which include requirements that activities be consistent with transparent forest governance, Indigenous rights, and biodiversity (Ibid., para. 2) and has recognized “the importance incentivizing non-carbon benefits for the long-term sustainability of the implementation of [REDD+] activities.” (UNFCCC COP, 2013b, para. 70).
5.1.3 The Phases of REDD+Despite the many unsettled issues that remain, the decisions adopted by the UNFCCC COP have nonetheless provided some of the initial political direction and conceptual guidance necessary for REDD+ to move forward from a promising idea to an incipient global mechanism. The Cancun Agreements provide that any country interested in participating in an eventual REDD+ mechanism must establish the institutional and technical conditions for its domestic implementation. The broad scope, multi-scale nature, and overall complexity of a future REDD+ mechanism has required a gradual approach to its implementation that can be broken down into three principal phases:
development of national strategies or action plans, policies and measures, and capacity-building.
implementation of national strategies or action plans, national policies and measures, and the development of results-based demonstration activities.
made for results-based actions that are fully measured, reported and verified in accordance with international standards (UNFCCC COP 2011, para. 73; Wertz-Kanounnikoff & Angelsen 2009, 14-15).
As is explained in module 6, over 75 developing countries are participating in the first two phases, known as the REDD+ readiness phase, and are thus seeking to lay the groundwork for their eventual participation in a global REDD+ mechanism.
5.2 INITIATIVES, TOOLS & METHODOLOGIES
UNFCCC Guidance on REDD+The UNFCCC, particularly in the Cancun Agreements and the Warsaw Framework for REDD+, has provided some of the basic conceptual and methodological guidance for the implementation of REDD+ activities in developing countries.
The REDD+ PartnershipThe REDD+ Partnership was created in 2010 to serve as the interim international platform for REDD+ pending its full establishment under the UNFCCC. Launched at the Oslo Climate and Forest Conference in May 2010, the REDD+
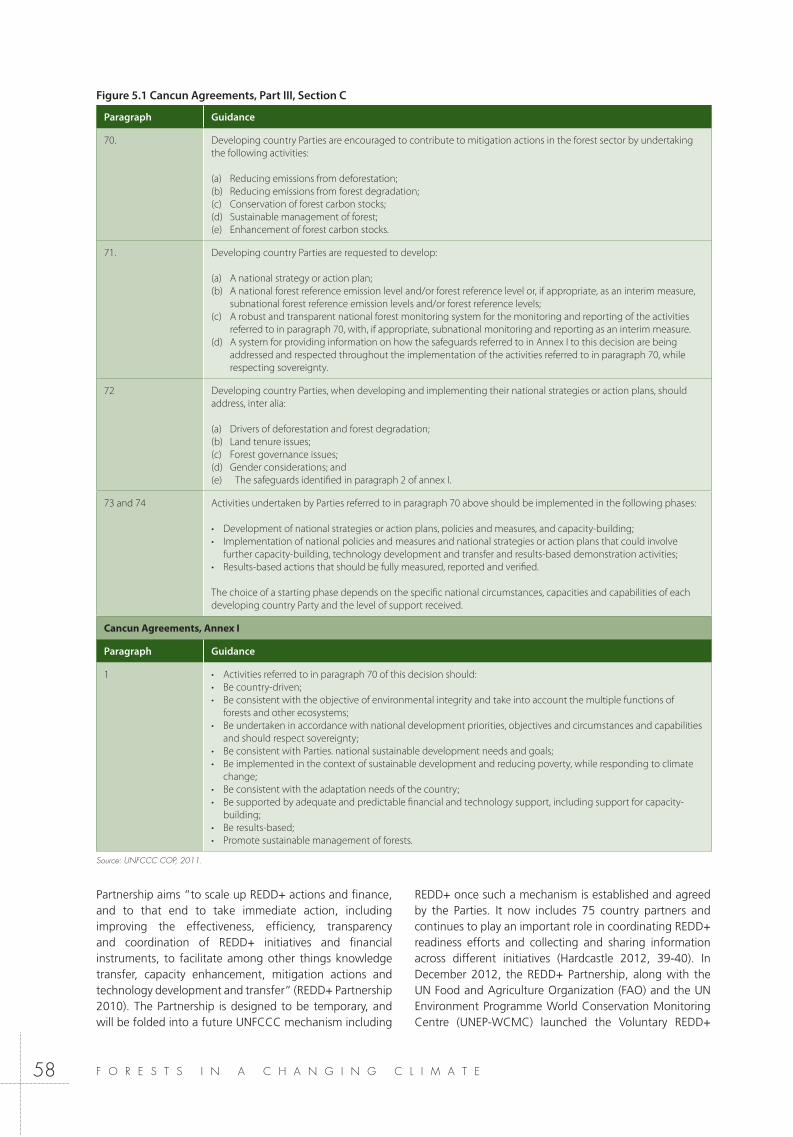
F O R E S T S I N A C H A N G I N G C L I M A T E58
Partnership aims “to scale up REDD+ actions and finance, and to that end to take immediate action, including improving the effectiveness, efficiency, transparency and coordination of REDD+ initiatives and financial instruments, to facilitate among other things knowledge transfer, capacity enhancement, mitigation actions and technology development and transfer” (REDD+ Partnership 2010). The Partnership is designed to be temporary, and will be folded into a future UNFCCC mechanism including
REDD+ once such a mechanism is established and agreed by the Parties. It now includes 75 country partners and continues to play an important role in coordinating REDD+ readiness efforts and collecting and sharing information across different initiatives (Hardcastle 2012, 39-40). In December 2012, the REDD+ Partnership, along with the UN Food and Agriculture Organization (FAO) and the UN Environment Programme World Conservation Monitoring Centre (UNEP-WCMC) launched the Voluntary REDD+
Paragraph Guidance
70. Developing country Parties are encouraged to contribute to mitigation actions in the forest sector by undertaking the following activities:
(a) Reducing emissions from deforestation;(b) Reducing emissions from forest degradation;(c) Conservation of forest carbon stocks;(d) Sustainable management of forest; (e) Enhancement of forest carbon stocks.
71. Developing country Parties are requested to develop:
(a) A national strategy or action plan; (b) A national forest reference emission level and/or forest reference level or, if appropriate, as an interim measure,
subnational forest reference emission levels and/or forest reference levels; (c) A robust and transparent national forest monitoring system for the monitoring and reporting of the activities
referred to in paragraph 70, with, if appropriate, subnational monitoring and reporting as an interim measure. (d) A system for providing information on how the safeguards referred to in Annex I to this decision are being
addressed and respected throughout the implementation of the activities referred to in paragraph 70, while respecting sovereignty.
72 Developing country Parties, when developing and implementing their national strategies or action plans, should address, inter alia:
(a) Drivers of deforestation and forest degradation;(b) Land tenure issues; (c) Forest governance issues;(d) Gender considerations; and (e) The safeguards identified in paragraph 2 of annex I.
73 and 74 Activities undertaken by Parties referred to in paragraph 70 above should be implemented in the following phases:
Development of national strategies or action plans, policies and measures, and capacity-building;Implementation of national policies and measures and national strategies or action plans that could involve further capacity-building, technology development and transfer and results-based demonstration activities;Results-based actions that should be fully measured, reported and verified.
The choice of a starting phase depends on the specific national circumstances, capacities and capabilities of each developing country Party and the level of support received.
Cancun Agreements, Annex I
Paragraph Guidance
1 Activities referred to in paragraph 70 of this decision should: Be country-driven; Be consistent with the objective of environmental integrity and take into account the multiple functions of forests and other ecosystems; Be undertaken in accordance with national development priorities, objectives and circumstances and capabilities and should respect sovereignty; Be consistent with Parties. national sustainable development needs and goals; Be implemented in the context of sustainable development and reducing poverty, while responding to climate change; Be consistent with the adaptation needs of the country; Be supported by adequate and predictable financial and technology support, including support for capacity-building; Be results-based; Promote sustainable management of forests.
Source: UNFCCC COP, 2011.
Figure 5.1 Cancun Agreements, Part III, Section C
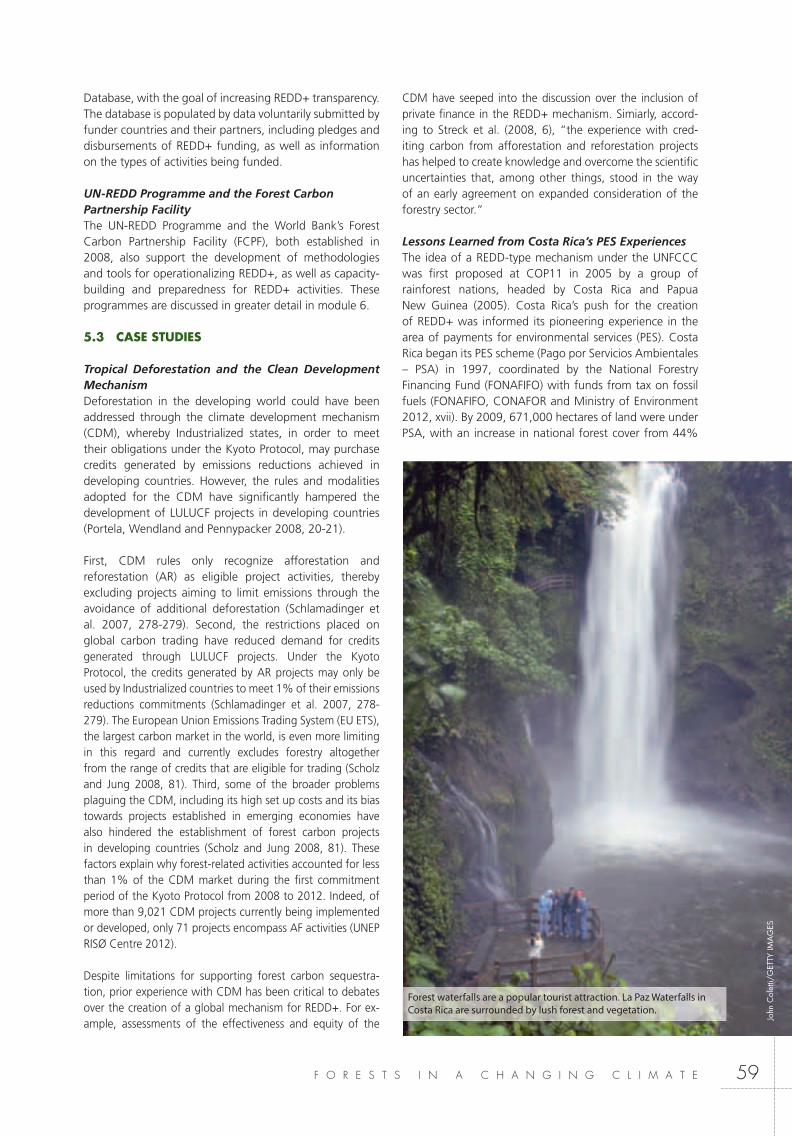
F O R E S T S I N A C H A N G I N G C L I M A T E 59
Database, with the goal of increasing REDD+ transparency. The database is populated by data voluntarily submitted by funder countries and their partners, including pledges and disbursements of REDD+ funding, as well as information on the types of activities being funded.
UN-REDD Programme and the Forest Carbon Partnership FacilityThe UN-REDD Programme and the World Bank’s Forest Carbon Partnership Facility (FCPF), both established in 2008, also support the development of methodologies and tools for operationalizing REDD+, as well as capacity-building and preparedness for REDD+ activities. These programmes are discussed in greater detail in module 6.
5.3 CASE STUDIES
Tropical Deforestation and the Clean Development MechanismDeforestation in the developing world could have been addressed through the climate development mechanism (CDM), whereby Industrialized states, in order to meet their obligations under the Kyoto Protocol, may purchase credits generated by emissions reductions achieved in developing countries. However, the rules and modalities adopted for the CDM have significantly hampered the development of LULUCF projects in developing countries (Portela, Wendland and Pennypacker 2008, 20-21).
First, CDM rules only recognize afforestation and reforestation (AR) as eligible project activities, thereby excluding projects aiming to limit emissions through the avoidance of additional deforestation (Schlamadinger et al. 2007, 278-279). Second, the restrictions placed on global carbon trading have reduced demand for credits generated through LULUCF projects. Under the Kyoto Protocol, the credits generated by AR projects may only be used by Industrialized countries to meet 1% of their emissions reductions commitments (Schlamadinger et al. 2007, 278-279). The European Union Emissions Trading System (EU ETS), the largest carbon market in the world, is even more limiting in this regard and currently excludes forestry altogether from the range of credits that are eligible for trading (Scholz and Jung 2008, 81). Third, some of the broader problems plaguing the CDM, including its high set up costs and its bias towards projects established in emerging economies have also hindered the establishment of forest carbon projects in developing countries (Scholz and Jung 2008, 81). These factors explain why forest-related activities accounted for less than 1% of the CDM market during the first commitment period of the Kyoto Protocol from 2008 to 2012. Indeed, of more than 9,021 CDM projects currently being implemented or developed, only 71 projects encompass AF activities (UNEP RISØ Centre 2012).
Despite limitations for supporting forest carbon sequestra-tion, prior experience with CDM has been critical to debates over the creation of a global mechanism for REDD+. For ex-ample, assessments of the effectiveness and equity of the
CDM have seeped into the discussion over the inclusion of private finance in the REDD+ mechanism. Simiarly, accord-ing to Streck et al. (2008, 6), “the experience with cred-iting carbon from afforestation and reforestation projects has helped to create knowledge and overcome the scientific uncertainties that, among other things, stood in the way of an early agreement on expanded consideration of the forestry sector.”
Lessons Learned from Costa Rica’s PES ExperiencesThe idea of a REDD-type mechanism under the UNFCCC was first proposed at COP11 in 2005 by a group of rainforest nations, headed by Costa Rica and Papua New Guinea (2005). Costa Rica’s push for the creation of REDD+ was informed its pioneering experience in the area of payments for environmental services (PES). Costa Rica began its PES scheme (Pago por Servicios Ambientales – PSA) in 1997, coordinated by the National Forestry Financing Fund (FONAFIFO) with funds from tax on fossil fuels (FONAFIFO, CONAFOR and Ministry of Environment 2012, xvii). By 2009, 671,000 hectares of land were under PSA, with an increase in national forest cover from 44%
Forest waterfalls are a popular tourist attraction. La Paz Waterfalls in Costa Rica are surrounded by lush forest and vegetation.
John
Col
etti/
GET
TY IM
AG
ES
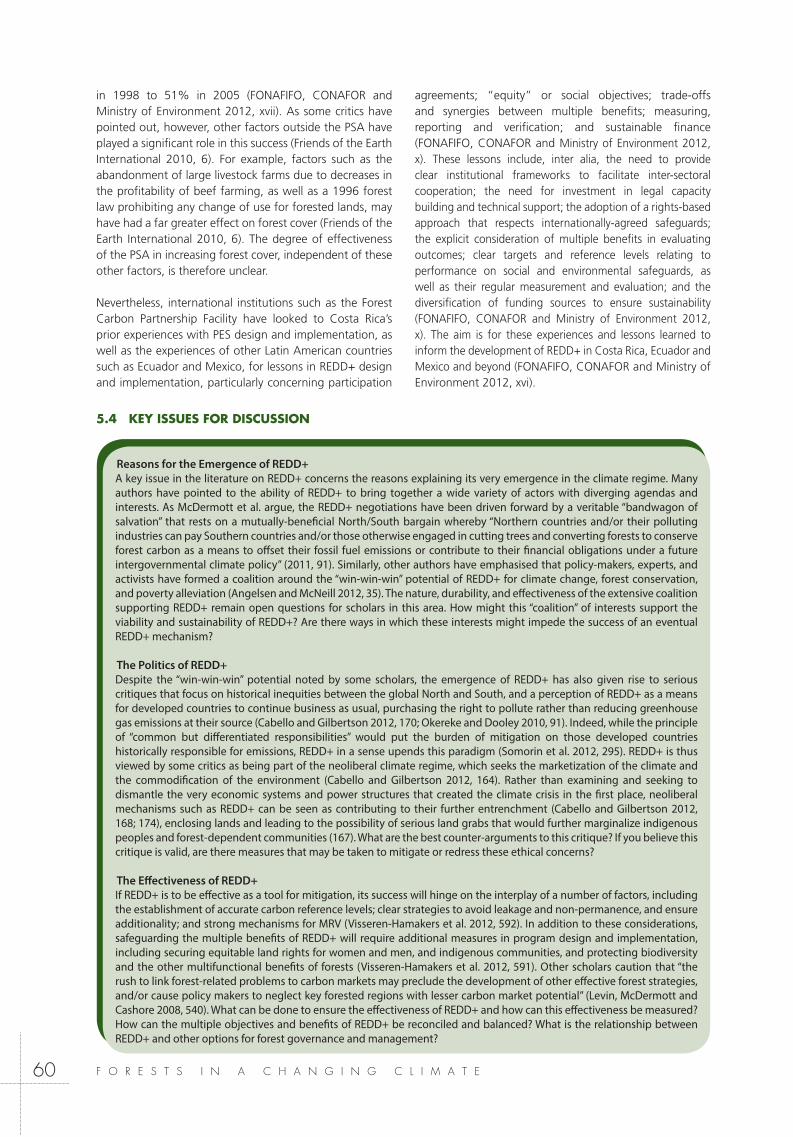
F O R E S T S I N A C H A N G I N G C L I M A T E60
in 1998 to 51% in 2005 (FONAFIFO, CONAFOR and Ministry of Environment 2012, xvii). As some critics have pointed out, however, other factors outside the PSA have played a significant role in this success (Friends of the Earth International 2010, 6). For example, factors such as the abandonment of large livestock farms due to decreases in the profitability of beef farming, as well as a 1996 forest law prohibiting any change of use for forested lands, may have had a far greater effect on forest cover (Friends of the Earth International 2010, 6). The degree of effectiveness of the PSA in increasing forest cover, independent of these other factors, is therefore unclear.
Nevertheless, international institutions such as the Forest Carbon Partnership Facility have looked to Costa Rica’s prior experiences with PES design and implementation, as well as the experiences of other Latin American countries such as Ecuador and Mexico, for lessons in REDD+ design and implementation, particularly concerning participation
agreements; “equity” or social objectives; trade-offs and synergies between multiple benefits; measuring, reporting and verification; and sustainable finance (FONAFIFO, CONAFOR and Ministry of Environment 2012, x). These lessons include, inter alia, the need to provide clear institutional frameworks to facilitate inter-sectoral cooperation; the need for investment in legal capacity building and technical support; the adoption of a rights-based approach that respects internationally-agreed safeguards; the explicit consideration of multiple benefits in evaluating outcomes; clear targets and reference levels relating to performance on social and environmental safeguards, as well as their regular measurement and evaluation; and the diversification of funding sources to ensure sustainability (FONAFIFO, CONAFOR and Ministry of Environment 2012, x). The aim is for these experiences and lessons learned to inform the development of REDD+ in Costa Rica, Ecuador and Mexico and beyond (FONAFIFO, CONAFOR and Ministry of Environment 2012, xvi).
Reasons for the Emergence of REDD+A key issue in the literature on REDD+ concerns the reasons explaining its very emergence in the climate regime. Many authors have pointed to the ability of REDD+ to bring together a wide variety of actors with diverging agendas and interests. As McDermott et al. argue, the REDD+ negotiations have been driven forward by a veritable “bandwagon of salvation” that rests on a mutually-beneficial North/South bargain whereby “Northern countries and/or their polluting industries can pay Southern countries and/or those otherwise engaged in cutting trees and converting forests to conserve forest carbon as a means to offset their fossil fuel emissions or contribute to their financial obligations under a future intergovernmental climate policy” (2011, 91). Similarly, other authors have emphasised that policy-makers, experts, and activists have formed a coalition around the “win-win-win” potential of REDD+ for climate change, forest conservation, and poverty alleviation (Angelsen and McNeill 2012, 35). The nature, durability, and effectiveness of the extensive coalition supporting REDD+ remain open questions for scholars in this area. How might this “coalition” of interests support the viability and sustainability of REDD+? Are there ways in which these interests might impede the success of an eventual REDD+ mechanism?
The Politics of REDD+Despite the “win-win-win” potential noted by some scholars, the emergence of REDD+ has also given rise to serious critiques that focus on historical inequities between the global North and South, and a perception of REDD+ as a means for developed countries to continue business as usual, purchasing the right to pollute rather than reducing greenhouse gas emissions at their source (Cabello and Gilbertson 2012, 170; Okereke and Dooley 2010, 91). Indeed, while the principle of “common but differentiated responsibilities” would put the burden of mitigation on those developed countries historically responsible for emissions, REDD+ in a sense upends this paradigm (Somorin et al. 2012, 295). REDD+ is thus viewed by some critics as being part of the neoliberal climate regime, which seeks the marketization of the climate and the commodification of the environment (Cabello and Gilbertson 2012, 164). Rather than examining and seeking to dismantle the very economic systems and power structures that created the climate crisis in the first place, neoliberal mechanisms such as REDD+ can be seen as contributing to their further entrenchment (Cabello and Gilbertson 2012, 168; 174), enclosing lands and leading to the possibility of serious land grabs that would further marginalize indigenous peoples and forest-dependent communities (167). What are the best counter-arguments to this critique? If you believe this critique is valid, are there measures that may be taken to mitigate or redress these ethical concerns? The Effectiveness of REDD+If REDD+ is to be effective as a tool for mitigation, its success will hinge on the interplay of a number of factors, including the establishment of accurate carbon reference levels; clear strategies to avoid leakage and non-permanence, and ensure additionality; and strong mechanisms for MRV (Visseren-Hamakers et al. 2012, 592). In addition to these considerations, safeguarding the multiple benefits of REDD+ will require additional measures in program design and implementation, including securing equitable land rights for women and men, and indigenous communities, and protecting biodiversity and the other multifunctional benefits of forests (Visseren-Hamakers et al. 2012, 591). Other scholars caution that “the rush to link forest-related problems to carbon markets may preclude the development of other effective forest strategies, and/or cause policy makers to neglect key forested regions with lesser carbon market potential” (Levin, McDermott and Cashore 2008, 540). What can be done to ensure the effectiveness of REDD+ and how can this effectiveness be measured? How can the multiple objectives and benefits of REDD+ be reconciled and balanced? What is the relationship between REDD+ and other options for forest governance and management?
5.4 KEY ISSUES FOR DISCUSSION
F O R E S T S I N A C H A N G I N G C L I M A T E 61
5.5 REFERENCES
Angelsen, Arild. 2009. “Introduction.” In Realising REDD+. National Strategy and Policy Options. Edited by Arild Angelsen, 1-9. Bogor Barat, Indonesia: CIFOR.
Angelsen, Arild and Desmond McNeill. 2012. “The Evolution of REDD+.” In Analysing REDD+: Challenges and Choices. Edited by Arild Angelsen et al., 31-49. Bogor Barat, Indonesia: CIFOR.
Angelsen, Arild et al. 2008. “What is the Right Scale for REDD?” In Moving Ahead with REDD: Issues, Options and Implications. Edited by Arild Angelsen, 31-40. Bogor Barat, Indonesia: CIFOR.
Cabello, Joanna and Tamra Gilbertson. 2012. “A Colonial Mechanism to Enclose Lands: A Critical Review of Two
Ebeling, Johannes. “Risks and Criticisms of Forestry-based Climate Change Mitigation and Carbon Trading.” In Climate Change and Forests: Emerging Policy and Market Opportunities. Edited by Charlotte Streck et al., 43-58. London, UK: Chatham House.
Ferraro, Paul J. and R. David Simpson. 2008. “The Cost-Effectiveness of Conservation Payments.” 78:3 Land Economics 339-353.
FONAFIFO, CONAFOR and Ministry of Environment. 2012. “Lessons Learned for REDD+ from PES and Conservation Incentive Programs: Examples from Costa Rica, Ecuador and
php?publicationID=3171.
Friends of the Earth International. 2010. “REDD: The Realities
Governments of Papua New Guinea & Costa Rica. 2008. “Reducing Emissions from Deforestation in Developing Countries: Approaches to Stimulate Action,” Eleventh Conference of the Parties to the UNFCCC: Agenda
misc01.pdf.
Hall, Anthony. 2012. Forests and Climate Change. The Social Dimensions of REDD+ in Latin America. Cheltenham, UK: Edward Elgar.
Hardcastle, Patrick et al. 2012. “Discussion of Effectiveness of Multilateral REDD+ Initiatives.” IDL Group.
Humphreys, David. 2008. “The Politics of ‘Avoided Deforestation’: Historical Context and Contemporary Issues.” 10:3 International Forestry Review 433-442.
Levin, Kelly, Constance McDermott and Benjamin Cashore. 2008. “The Climate Regime as Global Forest Governance: Can Reduced Emissions from Deforestation and Forest Degradation (REDD) Initiatives Pass a ‘Dual Effectiveness’ Test?” 10:3 International Forestry Review 538-549.
Logan-Hines, Eliot et al. 2012. “REDD+ Policy Options: Including Forests in an International Climate Agreement.” In Managing Forest Carbon in a Changing Climate. Edited by Mark S. Ashton et al., 357-376. London, UK: Springer.
McDermott, Constance L., Kelly Levin and Benjamin Cashore. 2011. “Building the Forest-Climate Bandwagon: REDD+ and the Logic of Problem Amelioration.” 11:3 Global Environmental Politics 85-103.
Okereke, Chukwumerije and Kate Dooley. 2010. “Principles of Justice in Proposals and Policy Approaches to Avoided Deforestation: Towards a Post-Kyoto Climate Agreement.” 20:1 Global Environmental Change 82-95.
Olander, Lydia P., Christopher S. Galik and Gabrielle A. Kissinger. 2012. “Operationalizing REDD+: Scope of Reduced Emissions from Deforestation and Forest Degradation.” 4:6 Current Opinion in Environmental Sustainability 661-669.
Pearson, Timothy R.H. et al. 2010. “Methodological Barriers to the Development of REDD+ Carbon Markets.” In Pathways for Implementing REDD+: Experiences from Carbon Markets and Communities. Edited by Zhu et al., 41-55. Roskilde : UNEP Riso Centre.
Pedroni, Lucio, Manuel Estrada Porrua & Mariano Colini Cenamo. 2010. “The ‘Nested Approach’ to REDD+: How Could it Be Implemented?” In Pathways for Implementing REDD+. Experiences from Carbon Markets and Communities. Edited by Xianli Zhu et al., 89-109. Nairobi, Kenya: UNEP.
Peskett, Leo and Maria Brockhaus. 2009. “When REDD+ Goes National: A Review of Realities, Opportunities, and Challenges.” In Realising REDD+: National Strategy and Policy Options. Edited by Arild Angelsen, 25-40. Bogor, Indonesia: CIFOR.
Portela, Rosimeiry, Kelly J. Wendland & Laura Ledwith Pennypacker. 2008. “The Idea of Market-Based Mechanisms for Forest Conservation and Climate Change.” In Climate Change and Forests: Emerging Policy and Market Opportunities. Edited by Charlotte Streck et al., 11-29. London, UK: Chatham House.
Schlamadinger, Bernhard, et al. 2007. “A Synopsis of Land Use, Land-Use Change and Forestry (LULUCF) under the Kyoto Protocol and Marrakech Accords.” 10:4 Environmental Science & Policy 271-282.
Scholz, Sebastian and Martina Jung. 2008. “Forestry Projects under the Clean Development Mechanism and Joint Implementation: Rules and Regulations.” In Climate Change and Forests: Emerging Policy and Market Opportunities. Edited by Streck et al., 71-85. London, UK: Chatham House.
Somorin, Olufunso et al. 2012. “The Congo Basin forests in a changing climate: Policy discourses on adaptation and mitigation (REDD+).” 22:1 Global Environmental Change 288.
Stern, Nicholas. 2006. Stern Review on the Economics of Climate Change. Cambridge, UK: Cambridge University Press.
Streck, Charlotte. 2010. “Financing REDD+ and the Role of Carbon Markets.” In Pathways for Implementing REDD+: Experiences from Carbon Markets and Communities. Edited by Zhu et al., 59-69. Roskilde: UNEP Riso Centre.
Streck, Charlotte and John Costenbader. 2012. “Standards for Results-Based REDD+ Finance: Overview and Design Parameters.” Washington, DC: Climate Focus.
Streck, Charlotte et al. 2008. “Climate Change and Forestry: An Introduction.” In Climate Change and Forests: Emerging Policy and Market Opportunities. Edited by Streck et al., 3-10. London, UK: Chatham House.
UNEP RISØ Centre. 2012. “CDM Projects Grouped in Types.”
F O R E S T S I N A C H A N G I N G C L I M A T E62
UNFCCC (United Nations Framework Convention on Climate Change). 1992. 1771 U.N.T.S. 107, entered into force 21 March 1994.
UNFCCC COP. 2006. “Report of the Conference of the Parties on its eleventh session, held at Montreal from 28 November to 10 December 2005. Part One: Proceedings,” 30 March
Deforestation in Developing Countries: Approaches to Stimulate Action, in in Report of the Conference of the Parties on its thirteenth session, Addendum, Part Two: Action taken by the Conference of the Parties at its
of the Conference of the Parties on its fifteenth session Addendum, Part Two: Action taken by the Conference of
of the Work of the Ad Hoc Working Group on Long-term Cooperative Action under the Convention. In Report of the Conference of the Parties on its sixteenth session, Addendum, Part Two: Action taken by the Conference of
Action: Outcome of the work of the Ad Hoc Working Group on Long-term Cooperative Action under the Convention. In Report of the Conference of the Parties on its Sixteenth Session, Addendum, Part Two: Action taken by the
providing information on how safeguards are addressed
and respected and modalities relating to forest reference emission levels and forest reference levels as referred to in
on its Sixteenth Session, Addendum, Part Two: Action taken
the Parties on its eighteenth session, held in Doha from 26 November to 8 December 2012.
finance to progress the full implementation of the activities
unedited decision).
reporting and verifying (advance unedited decision).
the technical assessment of submissions from Parties on
reference levels (advance unedited decision).
Visseren-Hamakers, Ingrid et al.. 2012. “Will REDD+ Work ? The Need for Interdisciplinary Research to Address Key Challenges.” 4 Current Opinion in Environmental Sustainability 1-7.
Wertz-Kanounnikoff, Sheila and Arild Angelsen. 2009. “Global and National REDD+ Architecture Linking Institutions and Actions.” In Realising REDD+: National Strategy and Policy Options. Edited by Arild Angelsen, 13-24. Bogor, Indonesia: CIFOR.
Wunder, Sven. 2008. “Payments for Environmental Services and the Poor: Concepts and Preliminary Evidence.” 13 Environment and Development Economics 279-297.
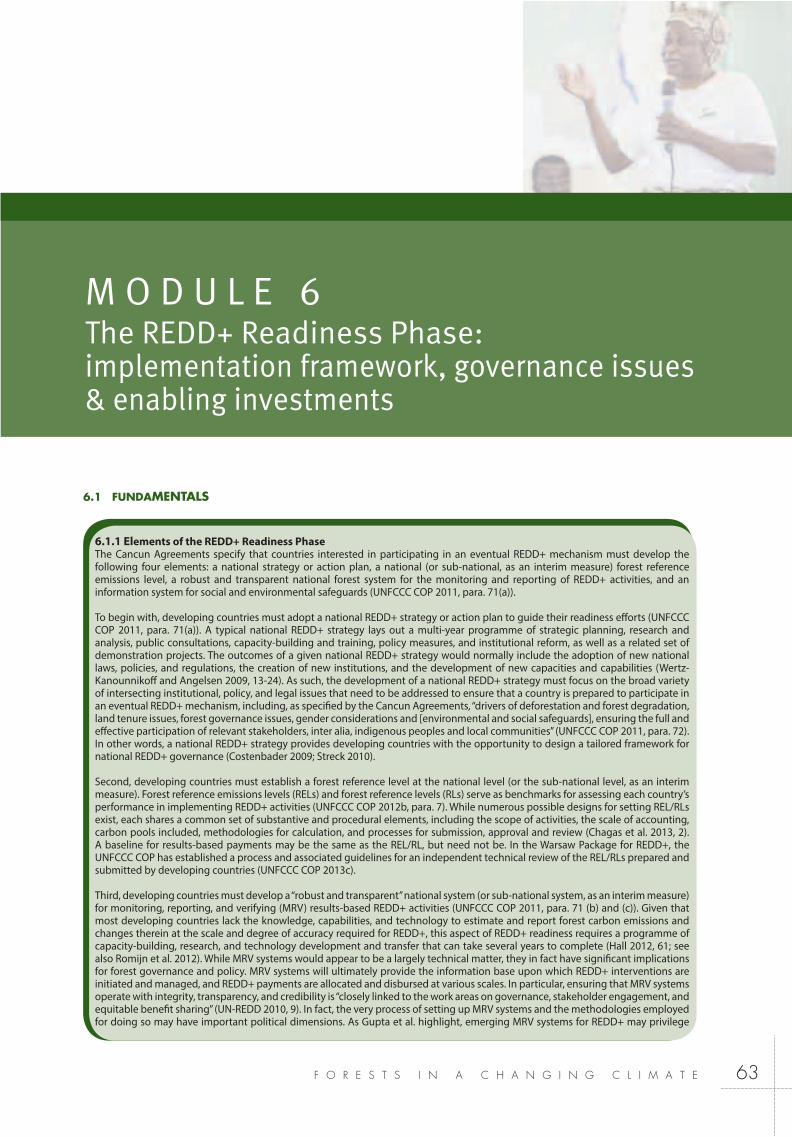
F O R E S T S I N A C H A N G I N G C L I M A T E 63
6.1 FUNDAMENTALS
M O D U L E 6The REDD+ Readiness Phase:implementation framework, governance issues & enabling investments
6.1.1 Elements of the REDD+ Readiness PhaseThe Cancun Agreements specify that countries interested in participating in an eventual REDD+ mechanism must develop the following four elements: a national strategy or action plan, a national (or sub-national, as an interim measure) forest reference emissions level, a robust and transparent national forest system for the monitoring and reporting of REDD+ activities, and an information system for social and environmental safeguards (UNFCCC COP 2011, para. 71(a)).
To begin with, developing countries must adopt a national REDD+ strategy or action plan to guide their readiness efforts (UNFCCC COP 2011, para. 71(a)). A typical national REDD+ strategy lays out a multi-year programme of strategic planning, research and analysis, public consultations, capacity-building and training, policy measures, and institutional reform, as well as a related set of demonstration projects. The outcomes of a given national REDD+ strategy would normally include the adoption of new national laws, policies, and regulations, the creation of new institutions, and the development of new capacities and capabilities (Wertz-Kanounnikoff and Angelsen 2009, 13-24). As such, the development of a national REDD+ strategy must focus on the broad variety of intersecting institutional, policy, and legal issues that need to be addressed to ensure that a country is prepared to participate in an eventual REDD+ mechanism, including, as specified by the Cancun Agreements, “drivers of deforestation and forest degradation, land tenure issues, forest governance issues, gender considerations and [environmental and social safeguards], ensuring the full and effective participation of relevant stakeholders, inter alia, indigenous peoples and local communities” (UNFCCC COP 2011, para. 72). In other words, a national REDD+ strategy provides developing countries with the opportunity to design a tailored framework for national REDD+ governance (Costenbader 2009; Streck 2010).
Second, developing countries must establish a forest reference level at the national level (or the sub-national level, as an interim measure). Forest reference emissions levels (RELs) and forest reference levels (RLs) serve as benchmarks for assessing each country’s performance in implementing REDD+ activities (UNFCCC COP 2012b, para. 7). While numerous possible designs for setting REL/RLs exist, each shares a common set of substantive and procedural elements, including the scope of activities, the scale of accounting, carbon pools included, methodologies for calculation, and processes for submission, approval and review (Chagas et al. 2013, 2). A baseline for results-based payments may be the same as the REL/RL, but need not be. In the Warsaw Package for REDD+, the UNFCCC COP has established a process and associated guidelines for an independent technical review of the REL/RLs prepared and submitted by developing countries (UNFCCC COP 2013c).
Third, developing countries must develop a “robust and transparent” national system (or sub-national system, as an interim measure) for monitoring, reporting, and verifying (MRV) results-based REDD+ activities (UNFCCC COP 2011, para. 71 (b) and (c)). Given that most developing countries lack the knowledge, capabilities, and technology to estimate and report forest carbon emissions and changes therein at the scale and degree of accuracy required for REDD+, this aspect of REDD+ readiness requires a programme of capacity-building, research, and technology development and transfer that can take several years to complete (Hall 2012, 61; see also Romijn et al. 2012). While MRV systems would appear to be a largely technical matter, they in fact have significant implications for forest governance and policy. MRV systems will ultimately provide the information base upon which REDD+ interventions are initiated and managed, and REDD+ payments are allocated and disbursed at various scales. In particular, ensuring that MRV systems operate with integrity, transparency, and credibility is “closely linked to the work areas on governance, stakeholder engagement, and equitable benefit sharing” (UN-REDD 2010, 9). In fact, the very process of setting up MRV systems and the methodologies employed for doing so may have important political dimensions. As Gupta et al. highlight, emerging MRV systems for REDD+ may privilege

F O R E S T S I N A C H A N G I N G C L I M A T E64
6.1.2 Implementation Framework, Governance Issues & Enabling Investments
The starting point of any framework for REDD+ governance concerns the selection of a payment system specifying the modalities through which international payments from a REDD+ mechanism would be channeled and distributed at the domestic level. In general, such a system must strive to ensure that payments from REDD+ are redirected in a manner that is both effective (leading to
emissions reductions) as well as equitable (compensating indigenous peoples and local communities for their positive contributions and alleviating poverty) (Hall 2012, 64-68). Indeed, equitable payment systems can actually increase effectiveness and efficiency, resulting in improved sustainability of the REDD+ mechanism (UN-REDD Programme 2001, 5).
Broadly speaking, there are four model payment systems (Hall 2012, 58-61; Vatn and Angelsen 2009, 67-73).
Anne-Marie Tiani, senior scientist at CIFOR conducting workshop, Lukulela, Democratic Republic of Congo, on Social benefits – cultural services, indigenous rights, poverty alleviation and participatory governance – cornerstones of REDD+.
Olli
vier
Gira
rd/C
IFO
R
certain actors, forms of knowledge, and sets of values and objectives (2012). Some approaches to MRV “may serve to marginalize local actors, obscure local differences, and/or promote carbon over other forest values,” while others “can be used to mobilise counter-expertise and activate agency in diverse ways, both of global scientific elites and local actors” (Gupta et al. 2012, 730). MRV is discussed in greater detail in Module 7.
Fourth, developing countries must develop an information system for communicating the way that environmental and social safeguards identified in the Cancun Agreements are “being addressed and respected” in REDD+ activities (UNFCCC COP 2011, para. 71(d)). In the Durban Platform, the UNFCCC COP further specifies that for all REDD+ activities these systems must be implemented at the national level “regardless of the source or type of financing” (2012a, para. 63) and through a country-driven approach that ultimately provides “transparent and consistent information that is accessible by all relevant stakeholders and updated on a regular basis.” (2012a, para. 2). In the Warsaw Package for REDD+, the UNFCCC COP establishes that developing countries have to provide periodical summaries of this information to the UNFCCC COP whether through national communications or some other channel and on a web platform, on a voluntary basis (UNFCCC COP 2013a). Most importantly, developing countries seeking to obtain and receive results-based payments for REDD+ activities are obliged to “provide the most recent summary of information on how all of the safeguards […] have been addressed and respected before they can receive results-based payments.” (UNFCCC COP 2013b, para. 4). Safeguards are addressed in greater detail in Module 9.

F O R E S T S I N A C H A N G I N G C L I M A T E 65
First, payments could be channelled to a government’s general budget. In this case, the government would then be expected to redirect funds to sectors and communities in order to achieve emissions reductions and distribute benefits generated therefrom. Second, payments could be channelled through an independent national fund managed by both governmental and non-governmental representatives, and undertaking its own REDD+ activities or funding REDD+ activities pursued by other actors. Third, payments could be made to a national fund under the direct control and administration of the government and could thereby support governmental as well as non-governmental REDD+ activities. Finally, payments could flow directly to sub-national projects in a PES system or within the context of conditional aid funding arrangements.
A related issue concerns the way in which benefits from REDD+ should be accessed and distributed within a country to compensate forest users for opportunity costs, support sustainable livelihoods or alleviate rural poverty (Luttrell et al. 2012, 129-151). Those who undertake forest management, including indigenous peoples and forest-dependent communities, will need clear incentives for adopting REDD+ activities (Lofts 2012, 1). To this end, the design of an equitable, transparent and efficient benefit distribution system (BDS) will be key. While BDS design will likely require local tailoring, particularly with respect to local opportunity costs and benefit preferences (Costenbader 2011, 4), certain considerations will need to be taken into account across the board. These considerations include, inter alia, the dynamic nature of opportunity costs; the need for consultation with rightsholders and stakeholders, including indigenous peoples and forest-dependent communities, regarding payment design (e.g. timing of payments, whether payments will be made to individuals or communities, and whether they will be cash or in-kind); power, gender, and generational dynamics within communities that may affect the equity of benefit distribution; concerns about elite capture; and issues of land tenure (discussed in greater detail below) (Costenbader 2011, 44-48).
Whereas benefit sharing is a necessary feature of any PES system, it remains an open question in other payment systems and could be achieved through the pursuit of particular programmes and projects incorporating PES, participatory forest management (PFM), community-based forest management (CBFM), forest concession revenue sharing, or integrated conservation and development projects (ICDP) (Costenbader 2011; Lindhjem et al. 2010).
Another set of issues that must be addressed as part of a framework for national REDD+ governance relates to land, forest, and carbon rights and tenure.10 In a system
10 The FAO defines land tenure as “the relationship, whether legally or customarily defined, among people, as individuals or groups, with respect to land. (For convenience, “land” is used here to include other natural resources such as water and trees.) Land tenure is an institution, i.e., rules invented by societies to regulate behaviour. Rules of tenure define how property rights to land are to be allocated within societies. They define
in which REDD+ activities are undertaken and credited at the project level, the clarification, creation or allocation of property rights over the carbon contained in forests is essential. The existence of such private carbon rights makes it possible to convert reductions in carbon emissions or increases in carbon stocks achieved through REDD+ activities into credits that can be traded on global carbon markets (Portela 2008, 25). Conversely, a lack of clarity over the ownership of carbon rights under national law creates significant uncertainty over the financial value, if any, that can be attributed to emissions reductions generated through a particular REDD+ project (Streck 2009, 157-158). While a system that excludes private transactions and favours broader policy interventions may not require the establishment of a legal title over carbon, it will nonetheless be necessary to clarify issues relating to forest rights and tenure for mitigation activities to take place (Streck 2009, 151). This includes the gendered dimensions of property rights and tenure security. Indeed, to the extent that the domestic implementation of REDD+ entails changes to land and forest use and governance, it requires consideration of the land, forest tenure, and access rights of all relevant stakeholders, including groups who do not necessarily have formal land rights, such as women, indigenous peoples and forest-dependent communities. As Sunderlin, Larson and Cronkleton explain:
The importance of tenure for REDD+ is obvious. REDD+ is essentially a broad set of policies to prevent or slow deforestation and degradation, and increase forest carbon stocks. A subset of these policies allocates rewards to carbon rights holders who achieve REDD+ objectives, either as measured directly by changes in forest carbon stocks or by proxies for those changes. But who are the legitimate carbon rights holders? In most developing countries, the answer to this question is not always clear – forest tenure is contested, rights overlap and are not secure. Tenure must be clarified, not only to create incentives for those managing the forests and to properly assign benefits, but also to protect people whose rights could be usurped if REDD+ leads to a rush of command-and-control measures to protect forests, or if REDD+ leads to a resource race when the value of forests increases (2009, 141).
how access is granted to rights to use, control, and transfer land, as well as associated responsibilities and restraints. In simple terms, land tenure systems determine who can use what resources for how long, and under what conditions” (FAO 2002, 7). Land tenure may in fact involve a variety of different types of rights, including: use rights (e.g. right to use land for grazing, growing subsistence crops, gathering minor forestry products, etc.);control rights (ie. rights to make decisions about how the land should be used); andtransfer rights (ie. the right to sell or mortgage the land, to convey the land to others through intra-community reallocations, to reallocate use and control rights, etc.) (FAO 2002, 9-10)

F O R E S T S I N A C H A N G I N G C L I M A T E66
Defining Free, Prior and Informed Consent
Free Free refers to a consent given voluntarily and absent of “coercion, intimidation or manipu lation.” Free refers to a process that is self-directed by the community from whom consent is being sought, unencumbered by coercion, expectations or timelines that are externally imposed:
Stakeholders determine process, timeline and decision-making structure; Information is transparently and objectively offered at stakeholders’ request; Process is free from coercion, bias, conditions, bribery or rewards; Meetings and decisions take place at locations and times and in languages and formats determined by the stakeholders; andAll community members are free to participate regardless of gender, age or standing.
Prior Prior means “consent is sought sufficiently in advance of any authorization or commence ment of activities.”40 Prior refers to a period of time in advance of an activity or process when consent should be sought, as well as the period between when consent is sought and when consent is given or withheld. Prior means at the “early stages of a development or investment plan, not only when the need arises to obtain approval from the community.”41
Prior implies that time is provided to understand, access, and analyze information on the proposed activity. The amount of time required will depend on the decision-making processes of the rights-holders; Information must be provided before activities can be initiated, at the beginning or initiation of an activity, process or phase of implementation, including conceptual ization, design, proposal, information, execution, and following evaluation; and The decision-making timeline established by the rights-holders must be respected, as it reflects the time needed to understand, analyze, and evaluate the activities under consideration in accordance with their own customs.
Informed Informed refers mainly to the nature of the engagement and type of information that should be provided prior to seeking consent and also as part of the ongoing consent process. Information should:
Be accessible, clear, consistent, accurate, constant, and transparent; Be delivered in appropriate language and culturally appropriate format (including radio, video, graphics, documentaries, photos, oral presentations); Be objective, covering both the positive and negative potential of REDD+ activities and consequences of giving or withholding consent; Be complete, covering the spectrum of potential social, financial, political, cultural, environmental impacts, including scientific information with access to original sources in appropriate language; Be delivered in a manner that strengthens and does not erode indigenous or local cultures; Be delivered by culturally appropriate personnel, in culturally appropriate locations, and include capacity building of indigenous or local trainers; Be delivered with sufficient time to be understood and verified; Reach the most remote, rural communities, women and the marginalized; and Be provided on an ongoing and continuous basis throughout the FPIC process.
Consent Consent refers to the collective decision made by the rights-holders and reached through the customary decision-making processes of the affected peoples or communities. Consent must be sought and granted or withheld according to the unique formal or informal political-administrative dynamic of each community.42
Consent is:
A freely given decision that may be a “Yes” or a “No,” including the option to reconsider if the proposed activities change or if new information relevant to the proposed activities emerges; A collective decision determined by the affected peoples (e.g. consensus, majority, etc.) in accordance with their own customs and traditions; The expression of rights (to self-determination, lands, resources and territories, culture); and Given or withheld in phases, over specific periods of time for distinct stages or phases of REDD+. It is not a one-off process.
Source: UN-REDD 2013, 18-20.
The sensitivity of benefit-sharing and of land rights and tenure reform underscore the importance of a third component of any REDD+ governance framework – the need for processes that ensure the full and effective participation of relevant stakeholders, including marginalized groups, such as the poor, women and indigenous peoples, in order to avoid exacerbating inequalities. Given the economic, social, and environmental importance of forests in developing
countries and the transformative potential of REDD+, REDD+ readiness activities have important multi-actor and multi-scale dimensions that require both horizontal and vertical forms of coordination (Forsyth 2009). As Forsyth explains, the need for effective forms of multi-actor governance is especially important when there are competing ideas and interests concerning forest and land use. In his view, REDD+ “can succeed if stakeholders share
F O R E S T S I N A C H A N G I N G C L I M A T E 67
a common understanding of appropriate forest and land use, a shared and trusted way of negotiating agreements about REDD+, and if local users derive co-benefits” (2009, 122). Yet, as Peskett and Brockhaus point out, setting up consultation and engagement processes for REDD+ is a challenging endeavour in most countries, in light of the poor performance of existing democratic processes and the history of mistrust that exists between government officials and local communities (2009, 40-41). To this end, REDD+ activities must also respect indigenous peoples and forest-dependent communities’ rights to full and effective participation in REDD+, including the right of indigenous peoples to free, prior and informed consent (FPIC). While there is no international consensus on a single definition of FPIC (UN-REDD+ 2013, 10), the constitutive elements of free, prior and informed consent may be understood as follows:
In addition to land tenure, land use planning must also be addressed in the context of REDD+. As a scarce resource, land is subject to competing uses that must be managed and planned for, in order for REDD+ to be effective. For example, given that the agricultural sector is the most important driver of deforestation and forest degradation globally, successful REDD+ strategies will also require interventions in that sector (Graham and Vignola 2011, i-ii). Therefore, REDD+ strategies at the national level will need to be harmonized in order to account for different land-use pressures. Indeed, in order to lead to reductions in deforestation and avoid the risk of leakage, REDD+ activities must be situated within a broader policy framework that ensures a certain level of coherence and coordination with other sectors including agriculture, industry, infrastructure planning, and community development as part of a country’s broader low-carbon development, forest governance or poverty reduction efforts (Angelsen 2009, 127).
Finally, a framework for national REDD+ governance must provide the conditions for establishing and maintaining a favourable institutional and policy environment for REDD+ activities. An enabling environment for REDD+ requires institutional mechanisms for addressing the various drivers of deforestation and developing policies that support, rather than hinder, the effectiveness of REDD+ activities. Another key prerequisite for REDD+ is the strengthening of forestry and other institutions, especially in terms of combating corruption and ensuring the integrity of flows of finance and information. Given the prevalence of corruption and poor governance in the forestry sector in developing countries, the challenges associated with institution-building and their potential implications for transforming patterns of resource management are considerable (Tacconi, Downs and Larmour 2009). REDD+ activities are particularly susceptible to corruption due to the remoteness of many forest carbon areas, the fact that forest carbon is an intangible commodity, the large influxes of funding associated with REDD+ activities,
and the highly technical nature of carbon accounting and monitoring (Transparency International 2012, 34). A favourable institutional and policy environment for REDD+ is also important for the establishment of a conducive business environment, as REDD+ investors will find security in transparent and accountable systems.
6.1.3 REDD+ Demonstration ProjectsThe UNFCCC COP has encouraged the establishment of domestic REDD+ demonstration activities as “a step towards the development of national approaches, reference levels and estimates” (2008, para. 7). It has specified that such activities should be undertaken with the approval of the host country, follow guidelines, and assess and report results and overall effectiveness. In addition, independent expert review of the results is also encouraged. (UNFCCC COP 2008, paras. 1, 3, 9-11). The purpose of REDD+ demonstration activities is not necessarily to reduce forestry-related emissions in the short-term, but rather to learn how to do so in the long-term on a broad scale (Sills et al. 2009, 267-269). As of 2012, over 340 REDD+ demonstration projects were being pursued in 52 countries throughout the developing world (CIFOR).
While many REDD+ demonstration activities focus on technical and methodological issues, such as the development of MRV systems, other activities seek to implement and assess project-level interventions for reducing forest carbon emissions, such as participatory forest management or reduced impact logging schemes. Even the latter set of activities tends to consist of experimental, learning-by-doing exercises. For example, in a sample of REDD+ demonstration activities studied by Sunderlin and Sills, most projects had not reached the stage of providing payments on the basis of results achieved in emissions reductions, but remained instead at an initial, pre-REDD+ stage of preparations and investments (Sunderlin and Sills 2012). A number of reasons explain this experimental character of REDD+ demonstration projects. For one thing, there is simply too much policy and market uncertainty in terms of how REDD+ might work, whether nationally or internationally, for project developers to fully commit to, and implement, a specific REDD+ payment scheme. For another, some of the same technical, financial, and social challenges and complexities that beguile policy-makers working on REDD+ readiness activities also stand in the way of the rapid operationalization of REDD+ demonstration activities (Sunderlin and Sills 2012, 184-185).
A particular issue of concern is the growing disconnect between REDD+ activities undertaken at different scales. This disconnect has arisen, in part, from a lack of coordination between national readiness efforts and local demonstration activities within a country, continuing uncertainty about applicable methodologies and approaches, and donor preference for early results on the ground. As Seymour and Angelsen argue, on-going enthusiasm for demonstration activities should not distract policy-makers from the more challenging task of

F O R E S T S I N A C H A N G I N G C L I M A T E68
going beyond piece-meal initiatives to induce broad and transformative changes in forest, economic, and land-use policies and governance (2012, 333):
[…] we cannot assume that the aggregate effect of projects will somehow be enough to catalyse transformation at the national level. Many of the national reforms that are needed are qualitatively different from what can be achieved in a pilot project. Without more attention to fundamental policy and institutional reforms, countries could begin to equate REDD+ implementation with pilot projects, a concept that would be hard to shake loose (2012, 297).
As such, a key challenge for the REDD+ readiness phase is ensuring that any lessons that emerge from REDD+ demonstration activities are communicated to policy-makers and are reflected in on-going policy processes at various scales.
6.2 INITIATIVES, TOOLS & METHODOLOGIES
A number of initiatives, tools, and methodologies have been developed to assist developing countries participating in the REDD+ readiness phase.
UN-REDD ProgrammeThe UN-REDD programme was established by the United Nations Development Programme (UNDP), the United Nations Environment Programme (UNEP), and the Food and Agriculture Organization (FAO) in 2008. The UN-REDD Programme currently has 50 partner countries, of which 18 partner countries have approved national programmes. The UN-REDD Programme also maintains an active global programme to support national actions and develop common methodologies and tools for operationalizing REDD+ (UN-REDD Programme). The UN-REDD Programme supports nationally-led REDD+ processes and promotes the informed and meaningful involvement of all stakeholders, including indigenous peoples and other forest-dependent communities, in national and international REDD+ implementation. As of 2012, 118 million US dollars had been committed to the UN-REDD programme, of which over 59 million US dollars had been allocated to support the national programmes of pilot countries (Williams and Davis 2012, 3).
World Bank’s Forest Carbon Partnership FacilityThe World Bank’s Forest Carbon Partnership Facility (FCPF) was also established in 2008. The FCPF includes a Readiness Mechanism that provides funding through the Readiness Fund to support capacity-building and preparedness for REDD+ activities, as well as a Carbon
performance-based REDD+ demonstration activities. The Readiness Mechanism has eleven donor countries and 37 beneficiary countries at varying stages of national REDD+ readiness (FCPF). The FCPF and UN-REDD Programme now have a harmonized standard template for national programmes – the Readiness Preparation Proposal (RPP) – that comes with a host of conditions, addresses standard policy and governance issues, and is subject to review and monitoring. As of 2012, more than 230 million US dollars had been pledged to the FPCF and 75 million US dollars had been allocated to countries for implementation of their RPPs (Williams and Davis 2012, 3).
IDLO Legal preparedness for REDD+ Reference ToolThe Legal Preparedness for REDD+ Reference Tool, developed by the International Development Law Organization (IDLO), was designed “to identify concrete legal and institutional instruments that may be conducive to fulfilling the requirements of the REDD+ activities, guidance and safeguards found in the Cancun Agreements” (IDLO 2011, 5). Rather than prescribing precise details for preparedness, such as indicators for data collection and assessment which will be highly contextual and tailored on a country by country basis, the Reference Tool instead sets out a variety of generic legal and institutional options
The Democratic Republic of Congo has the worlds’ second largest area of tropical rainforest after the Amazon. The Entandrophragma utile, is the largest tree species in the Democratic Republic of Congo and currently on the IUCN Red List as vulnerable; here located near Masako, Kisangani.
Olli
vier
Gira
rd/C
IFO
R

F O R E S T S I N A C H A N G I N G C L I M A T E 69
available to policy makers in planning and implementing REDD+ activities (IDLO 2011, 5). These options provide a foundation for countries to undertake gap analyses of their current laws and institutions in order to gauge their REDD+ readiness and identify options in cases where REDD+ requirements are not yet fulfilled. The generic legal and policy options included in the Reference Tool have been drawn from the documented recommendations of a range of sources, but the primary source is the Cancun Agreements themselves.
Guidelines on Stakeholder Engagement for REDD+ Readiness with a Focus on the Participation of Indigenous Peoples and other Forest-Dependent CommunitiesDesigned to support effective stakeholder engagement in the context of REDD+ readiness for the Forest Carbon Partnership Facility and the UN-REDD Programme, these guidelines include relevant policies on indigenous peoples and other forest-dependent communities; principles and guidance for effective stakeholder engagement; and practical guidance on planning and implementing effective consultations.
UN-REDD Guidelines on Free, Prior and Informed ConsentThese guidelines set out the normative, policy and operational framework for UN-REDD Programme partner countries to seek FPIC from indigenous peoples. The associated Legal Companion is a companion document which outlines existing international law and emerging State practice affirming that indigenous peoples have the right to effective participation in the decisions, policies
and initiatives that affect them and that FPIC is a legal norm that imposes duties and obligations on the States. The guidelines also set out obligations of good faith consultation with other forest-dependent communities, defining the circumstances in which the situation of certain forest-dependent communities may rise to the threshold requiring States to secure FPIC if an activity will affect the communities’ rights and interests.
6.3 CASE STUDIES
A brief comparison of the REDD+ readiness efforts of the Democratic Republic of Congo (DRC) and Brazil provides a useful illustration of the varying and extensive implications of the REDD+ readiness efforts in different countries.
REDD+ Readiness Efforts in the DRCThe central challenge for implementing REDD+ in a fragile state like the DRC relates to the need to develop institutions, governance frameworks, and technical capabilities for measuring changes in forest carbon, managing international flows of funding, consulting local communities and respecting their rights, and delivering on results-based commitments to abate carbon emissions. The DRC has the world’s second largest area of tropical rainforest after the Amazon. It also has one of the highest rates of deforestation, and the livelihoods of about 40 million people in the country depend directly on forests – including for energy, subsistence farming, and timber for their homes (WWF 2012, 10). Given the many other issues with which it is confronted, including high levels of extreme poverty and an on-going armed conflict, there is little doubt that the DRC government would have
Charcoal ready for transport in Lukolela to cities far away such as Kinshasa. 40 million people dependent on forests in the Democratic Republic of Congo.
Olli
vier
Gira
rd/C
IFO
R

F O R E S T S I N A C H A N G I N G C L I M A T E70
6.4 KEY ISSUES FOR DISCUSSION
Learning from REDD+ Demonstration ProjectsBeyond assisting the development of technical knowledge and capacity, demonstration activities may also generate learning that can inform the policy and governance aspects of the REDD+ readiness phase, providing policy-makers with information about the costs, feasibility, and effectiveness of various project-level interventions (Jagger et al. 2009), as well as information on “critical institutional and legal reforms that will be needed to implement REDD+ at the local level” (Seymour and Angelsen 2012, 297). These lessons are not simply valuable within the national context, but may also be diffused widely to inform the efforts of other countries. The fact that most REDD+ demonstration activities are carried out through partnerships involving a wide range of domestic and international actors also enhances opportunities for transnational learning (Sills et al. 2009, 276-277). Nevertheless, a number of factors may limit the potential of REDD+ demonstration activities to generate and disseminate lessons of value for REDD+ policy-making, including concerns about the quality and reliability of the assessment approaches and methods that have been adopted by the first generation of REDD+ demonstration projects (Jagger et al. 2009). A related issue is that many REDD+ demonstration projects are, in fact, “existing projects or approaches that have been rebranded as ‘REDD+’ to attract new finance” (Seymour and Angelsen 2012, 297). What might be the best ways of maximizing the lessons learned from REDD+ demonstration projects?
Political Nature and Implications of REDD+ ReadinessAs discussed in Section 6.1.2 (above), an enabling governance environment is seen as a prerequisite for REDD+ readiness. In turn, the governance of the emerging REDD+ regime is embedded within larger governance systems (Corbera and Schroeder 2011, 91). However, some scholars have suggested that “REDD+, and the processes through which its parameters are being determined,” is itself “a form of governance, a means of aligning a diverse set of stakeholders around agreed-upon objects to be governed, tools of governance, and forms of environmental, economic and social knowledge” (Thompson, Baruah and Carr 2011, 102). In your opinion, what types of understanding and forms of knowledge might be favoured or sidelined by the REDD readiness process? How can REDD+ readiness processes be designed to be inclusive, participatory, and country-driven, in line with the objectives of the UN-REDD programme?
little interest or capacity for participating in the REDD+ readiness phase without significant external funding and assistance (Pongui and Kenfack 2012). In fact, the DRC’s full National Programme (Readiness Plan) was approved by the UN-REDD Programme Policy Board in March 2013, and the country has begun moving from strategic planning to activities such as completing key studies, testing REDD+ pilot projects, training of personnel, sharing knowledge at a regional level, completing in-country consultation processes and launching the country’s first university curriculum on REDD+.
REDD+ Readiness Efforts in BrazilIn contrast with the DRC, an emerging economy like Brazil already possesses many of the capabilities and assets required for implementing REDD+ at the national level. For example, Brazil is one of the most advanced countries in the world in terms of its capacity to monitor its forest resources (May Millikan and Gebara 2011, 13). Its REDD+
readiness activities have focused on the task of developing tailored policies and programmes to reduce the economic pressures that support existing patterns of deforestation, particularly the conversion of forests for Brazil’s powerful and prosperous agro-business and ranching sectors, as well as creating enabling frameworks and incentives to enhance the ability of local communities to engage in sustainable forest management practices. Unlike most other countries engaging in REDD+ readiness, Brazil’s REDD+ programming is largely driven by domestic actors, with relatively less involvement from international actors (May, Millikan and Gebara 2011). Nevertheless, significant challenges to Brazil’s readiness for REDD+ remain, including weak enforcement of legislation regarding forest protection (May, Millikan and Gebara 2011, 20), a lack of secure tenure of indigenous peoples and forest-dependent communities (31), and the need to strengthen governance in the Amazon region to combat problems such as elite capture and a lack of transparency (26).

F O R E S T S I N A C H A N G I N G C L I M A T E 71
6.5 REFERENCES
Angelsen, Arild. 2009. “Policy Options to Reduce Deforestation.” In Realising REDD+ National Strategy and Policy Options. Edited by Arild Angelsen, 125-138. Bogor, Indonesia: CIFOR.
Angelsen, Arild and Desmond McNeill. 2012. “The Evolution of REDD+.” In Analysing REDD+: Challenges and Choices. Edited by Arild Angelsen et al., 31-49. Bogor Barat, Indonesia: CIFOR.
Chagas, Thiago, John Costenbader, Charlotte Streck and Stephanie Roe. 2013. Reference Levels: Concepts, Functions, and Application in REDD+ and Forest Carbon Standards.
CIFOR, “Global Database of REDD+ and Other Forest Carbon
Corbera, Esteve and Heike Schroeder. 2011. “Governing and Implementing REDD+.”14:2 Environmental Science & Policy 89-99.
Costenbader, John (ed.). 2009. Legal Frameworks for REDD: Design and Implementation at the National Level . Bonn, Germany: IUCN Environmental Policy and Law Paper No. 77.
Costenbader, John. 2011. “REDD+ Benefit Sharing: A Comparison of Three National Policy Approaches.” UN-REDD+ and World Bank FCPF.
FAO. 2002. “Land Tenure and Rural Development.” Rome, Italy: FAO.
FAO and Profor. 2011. Framework for Assessing and Monitoring Forest Governance.
Forest Carbon Partnership Facility (FCPF) and UN-REDD. 2012. “Guidelines on Stakeholder Engagement in REDD+ Readiness with a Focus on the Participation of Indigenous
Forsyth, Tim. 2009. “Multilevel, Multiactor Governance in REDD+: Participation, Integration and Coordination.” In Realising REDD+: National Strategy and Policy Options. Edited by Arild Angelsen, 113-122. Bogor, Indonesia: CIFOR.
Graham, Kristy and Raffaele Vignola. 2011. “REDD+ and Agriculture: A Cross-Sectoral Approach to REDD+ and
Gupta, Aarti et al. 2012. “In Pursuit of Carbon Accountability: The Politics of REDD+ Measuring, Reporting and Verification Systems.” 4 Current Opinion in Environmental Sustainability 726-731.
Hall, Anthony. 2012. Forests and Climate Change. The Social Dimensions of REDD+ in Latin America. Cheltenham, UK: Edward Elgar.
Herold, Martin et al. 2012. “A Stepwise Framework for Developing REDD+ Reference Levels.” In Analysing REDD+: Challenges and Choices. Edited by Arild Angelsen, 279-299. Bogor, Indonesia: CIFOR.
IDLO (International Development Law Organization). 2011. “Legal Preparedness for REDD+ in Vietnam: Country Study.” Rome, Italy: IDLO.
Jagger, Pamela et al. 2009. “Learning while Doing: Evaluating Impacts of REDD+ Projects.” In Realising REDD+: National Strategy and Policy Options. Edited by Arild Angelsen, 281-292. Bogor, Indonesia: CIFOR.
Lindhjem, Henrik et al. 2010. “Experiences with Benefit Sharing: Issues and Options for REDD-Plus.” Oslo, Norway: Econ Pöyry.
Lofts, Katherine. 2012. “Distributing the Benefits of REDD+: The Case of Viet Nam.” Climate & Development Knowledge Network.
Luttrell, Cecilia, et al. 2012. “Who Should Benefit and Why? Discourses on REDD+ Benefit Sharing.” In Analysing REDD+: Challenges and Choices. Edited by Arild Angelsen, 129-152. Bogor, Indonesia: CIFOR.
May, Peter H., Brent Millikan and Maria Fernanda Gebara. 2011. The Context of REDD+ in Brazil: Drivers, Agents and Institutions. Occasional Paper 55. Bogor, Indonesia: CIFOR.
McDermott, Constance L. et al. 2012. “Operationalizing Social Safeguards in REDD+ +: Actors, Interests and Ideas.” 21 Environmental Science and Policy 63-72.
Peskett, Leo and Maria Brockhaus. 2009. “When REDD+ Goes National: A Review of Realities, Opportunities, and Challenges.” In Realising REDD+: National Strategy and Policy Options. Edited by Arild Angelsen, 25-40. Bogor, Indonesia: CIFOR.
Pongui, Brice Séverin and Chrislain Eric Kenfack. 2011. Adaptation et atténuation en République du Congo: Acteurs et processus politiques. Occasional Paper 99. Bogor, Indonesia: CIFOR.
Portela, Rosimeiry, Kelly J. Wendland & Laura Ledwith Pennypacker. 2008. “The Idea of Market-Based Mechanisms for Forest Conservation and Climate Change.” In Climate Change and Forests: Emerging Policy and Market Opportunities. Edited by Charlotte Streck et al., 11-29. London, UK: Chatham House.
RECOFTC. 2011. “Free, Prior and Informed Consent in REDD+: Principles and Approaches for Policy and Project Development.” Bangkok, Thailand: RECOFTC and GIZ.
Romijn, Erika et al. 2012. “Assessing Capacities of Non-Annex I Countries for National Forest Monitoring in the Context of REDD+.” 19-20 Environmental Science & Policy 33-48.
Seymour, Frances and Arild Angelsen. 2012. “Summary and Conclusions: REDD+ without Regrets.” In Analysing REDD+: Challenges and Choices. Edited by Arild Angelsen, 317-334. Bogor, Indonesia: CIFOR.
Sills, Erin et al. 2009. “The Evolving Landscape of REDD+ Projects.” In Realising REDD+: National Strategy and Policy Options. Edited by Arild Angelsen, 265-279. Bogor, Indonesia: CIFOR.
Streck, Charlotte. 2009. “Rights and REDD+: Legal and Regulatory Considerations.” In Realising REDD+: National Strategy and Policy Options. Edited by Arik Angelsen, 151-162. Bogor, Indonesia: CIFOR.
Streck, Charlotte. 2010. “Reducing Emissions from Deforestation and Forest Degradation: National Implementation of REDD+

F O R E S T S I N A C H A N G I N G C L I M A T E72
Schemes – An Editorial Comment.” 3-4 Climatic Change 389-394.
Sunderlin, William D. and Erin O. Sills. 2012. “REDD+ Projects as a Hybrid of Old and New Forest Conservation Approaches.” In Analysing REDD+: Challenges and Choices. Edited by Arild Angelsen, 177-191. Bogor, Indonesia: CIFOR.
Sunderlin, William D., Anne M. Larson and Peter Cronkleton. 2009. “Forest Tenure Rights and REDD+: From Inertia to Policy Solutions.” In Realising REDD+: National Strategy and Policy Options. Edited by Arild Angelsen, 139-149. Bogor, Indonesia: CIFOR.
Tacconi, Luca, Fiona Downs & Peter Larmour. 2009. “Anti-Corruption Policies in the Forest Sector and REDD+.” In Realising REDD+: National Strategy and Policy Options. Edited by Angelsen, 163-174. Bogor, Indonesia: CIFOR.
Thompson, Mary C., Manali Baruah and Edward R. Carr. 2011. “Seeing REDD+ as a Project of Environmental Governance.” 14:2 Environmental Science and Policy 100-110.
Transparency International. 2012. Keeping REDD+ Clean: A Step-By-Step Guide to Preventing Corruption. Berlin, Germany: Transparency International.
emissions from deforestation in developing countries: approaches to stimulate action. In Report of the Conference of the Parties on its thirteenth session, Addendum, Part
of the Work of the Ad Hoc Working Group on Long-term Cooperative Action under the Convention. In Report of the Conference of the Parties on its sixteenth session, Addendum, Part Two: Action taken by the Conference of
Action: Outcome of the work of the Ad Hoc Working Group on Long-term Cooperative Action under the Convention. In Report of the Conference of the Parties on its Sixteenth Session, Addendum, Part Two: Action taken by the
providing information on how safeguards are addressed and
respect and modalities relating to forest reference emissions levels and forest reference levels as referred to in decision
Sixteenth Session, Addendum, Part Two: Action taken by the
presentations of the summary of information on how all the
being addressed and respected (advanced unedited version).
finance to progress the full implementation of the activities
unedited version).
the technical assessment of submissions from Parties on
reference levels (advance unedited decision).
UN-REDD Programme. 2010. The UN-REDD+ Programme Strategy 2010-2015. FAO, UNDP & UNEP.
UN-REDD Programme. 2011. The Business Case for Mainstreaming Gender in REDD+. Geneva, Switzerland: UN-REDD Programme.
UN-REDD Programme. 2013. Guidelines on Free, Prior and Informed Consent. Geneva, Switzerland: UN-REDD Programme.
Vatn, Arild and Arild Angelsen. 2009. “Options for a National REDD+ Architecture.” In Realising REDD+: National Strategy and Policy Options. Edited by Arild Angelsen, 57-74. Bogor, Indonesia: CIFOR.
Wertz-Kanounnikoff, Sheila and Arild Angelsen. 2009. “Global and National REDD+ Architecture Linking Institutions and Actions.” In Realising REDD+: National Strategy and Policy Options. Edited by Arild Angelsen, 13-24. Bogor, Indonesia: CIFOR.
Williams, Lauren and Crystal Davis. 2012. “Getting Ready with Forest Governance: A Review of the Forest Carbon Partnership Facility Readiness Preparation Proposals and the UN-REDD National Progamme Documents.” World Resources Institute Working Paper, Version 1.9.

F O R E S T S I N A C H A N G I N G C L I M A T E 73
M O D U L E 7Systems for measurement, reporting and verification of forests
7.1 FUNDAMENTALS
In 2001, at the seventh Conference of the Parties (COP) of the United Nations Framework Convention on Climate Change (UNFCCC) in Marrakech, policy makers decided to exclude avoided deforestation as a project-based offset mechanism in developing countries for a number of reasons; amongst these the difficulties in measuring, reporting and verifying (MRV) emissions reductions. In addition to REDD+ being a national mechanism rather than project-based, important progress has been made in technology, and assessment protocols to allay concerns expressed during the negotiations. Several research and development groups have been working on demonstration projects and have made important advances in the application of MRV systems (Angelsen 2008).
Despite the progress achieved in MRV, a recent study conducted by Romijn (2012), shows that few countries have the capacity needed for measuring and monitoring forests at a national level; placing many countries a long way from participating in an international REDD+ mechanism. REDD+ is designed to compensate countries based on results therefore transparent, comparable, and accurate MRV systems are needed in place before the implementation of REDD+.
7.2 INITIATIVES, TOOLS & METHODOLOGIES
7.2.1 Information on Tropical Forest Ecosystems
Setting reference levels for green house gas (GHG) emissions is among the most challenging issues in implementing REDD+ projects in developing countries. Agreements reached in Durban and Warsaw may be crucial in overcoming the complex barriers faced by countries determining their reference levels (UNFCCC COP 2011, UNFCCC COP 2013). These decisions identify a series of modalities that increase in complexity and accuracy as countries develop better data on forest carbon stocks. The simplest method in the first step of the approach is to use internationally available forest area data so that all developing nations can begin implementing REDD+, without the need of complex reference levels (Holzknecht 2012).
Emissions reduction schemes under the UNFCCC should lead to a positive net effect on the global carbon cycle. In the field of Land Use, Land Use Change and Forestry (LULUCF), this requires the establishment of an appropriate reference level scenario, which describes the future emission pathway without any climate actions or in the Business as Usual (BAU) scenario. These reference levels are fundamental in REDD+ performance and consequently essential for delivering payments on reduced deforestation or emissions reduction targets.
A remaining challenge for the implementation of a REDD+ mechanism is to define a methodology to set reference levels upon which emission reductions will be measured. There is no fixed agreement among experts about how to set a reference level (Santilli et al. 2005). Reference level estimations take into account historic and actual deforestation rates to provide a hypothetic estimation

F O R E S T S I N A C H A N G I N G C L I M A T E74
Monitoring Reporting and Verification (MRV) – Detailed reference levels and gathering baseline information data are essential for the long-term credibility of REDD+. Prosper Sabongo, a PhD student measures the circumference of a Funtunia Africana) tree near Masako Village in the Democratic Republic of Congo.
Olli
vier
Gira
rd/C
IFO
R
of emissions under a BAU scenario. Consequently, the estimated deforestation rate under a BAU scenario will be the benchmark for measuring emissions reductions as a result of REDD+ interventions.
National reference levels must be harmonized with reference levels from subnational activities using a combination of bottom-up and top-down approaches. This harmonization of reference levels across scales is a challenging task. One approach to understand the historic context of deforestation in a country could be to use the forest transition (FT) theory. This concept describes a sequence in which a country or region initiates with high forest cover and low deforestation rates (HFLD), and with
time forest cover declines and reaches a minimum before it slowly increases and eventually stabilizes. The challenge in setting a reference level would consist of assessing the current position of a country or region within the FT curve, and the prediction of deforestation rates based on the theory (Angelsen 2009).
While there has been significant progress on the technical aspects of carbon accounting, many REDD+ countries lack access to good data; technical infrastructure; and capacity to carry consistent, transparent data analysis of their forests. REDD+ MRV systems also require forest inventory institutions for ground-based measurements, control and external verification (Angelsen 2008). Limited knowledge of carbon stocks contained in alternative forest types and forest uses through out REDD+ countries also remains as a constraint.
Capacity in REDD+ MRV is not only the availability of technical equipment or satellite imagery, but also, and more importantly, it is ‘know-how’ on carrying out a successful and efficient MRV system. This refers to the expertise in data cleaning, processing and analysis, which is crucial to carry out an adequate MRV process (Angelsen 2009). A recent study by Romijn et al. (2012) used four assessment categories to identify the capacity gap of MRV in REDD+ countries. These include 1) national engagement of a country in the REDD+ processes; 2) existing monitoring capacities for monitoring of forest cover and carbon stock changes; 3) challenges that countries face in the REDD+ process; and 4) remote sensing technical challenges.Figure 7.1. Forest Transition Model Curve
Source: Bronson et al. 2009
HFLD High rateof forest
loss
Low rate of forestloss or net gain
Time
Fore
st c
over
100%

F O R E S T S I N A C H A N G I N G C L I M A T E 75
According to Romijn (2012), the majority of countries lack capacity to implement an accurate national monitoring system to measure REDD+ implementation using the IPCC guidelines for national GHG inventories. Furthermore, only 4 out of the 99 non-Annex I11 countries currently have capacities considered to be very good for both monitoring forest area change and forest inventories. (Figure 2)
Countries that face larger capacity are those that i) have limited experience in estimating and reporting national GHG emissions; ii) have weak existing capabilities to continuously measure forest and changes in forest carbon stocks; iii) face specific challenges which may not be relevant in all countries (e.g., satellite data may be limited due to lack of receiving stations, persistent cloud cover, etc.) (Romijn et al. 2012).
7.2.2 MRV systems and performance based incentive mechanisms
REDD+ needs credible MRV systems in place before it can deliver payments for emissions reductions. Unreliable MRV systems may create payments for emissions reductions that never occured, which would destroy credibility and jeopardize the legitimacy of a REDD+ mechanism (Angelsen 2012).
Performance measurements are important for both accountability and for promoting effectiveness inside a REDD+ mechanism. Performance indicators fulfill two different purposes: i) monitoring and measuring the effects of REDD+ policies to evaluate the effectiveness of the program and ii) evaluating the results as a basis for financial rewards and progress to further phases. Performance will need to be measured against agreed benchmarks or indicators (Angelsen 2012).
The first purpose of indicators for policy design will require metrics that assesses progress in piloting and implementing REDD+ at national levels. These will be metrics for phases 1 and 2 (see Module 5) (Angelsen 2012). For example, these
11
indicators or benchmarks could include ‘MRV systems in place’, more detailed ‘reference levels created’, or any other components needed before delivery of REDD+ payments.
The second purpose of performance indicators in REDD+ is to evaluate results on payments for emissions reductions. This will require a performance metric, as well as an agreed benchmark – most likely reference level for when crediting can occur. In phase 3, when REDD+ payments are actually done on a results basis, performance metrics may be outcome indicators (e.g., changes in gross deforestation rate) or most likely impact indicators (e.g., changes in carbon emissions). Globally, there are few agreed indicators of REDD+ performance, except that they should be country driven, and ultimately in phase 3, they should measure changes in GHG emissions and removals (Angelsen 2012).
7.2.3 Components of modern MRV systemsBoth, remote sensing technologies and on the ground measurements play a key role in National Forest Monitoring Systems (NFMS). MRV systems measure changes throughout all forested area, and are done with consistent methodologies at repeated intervals. Monitoring and verification can be done through field inventories and make use of very high-resolution satellite images that can result in very accurate measures (GOFC-GOLD, 2010) Effective monitoring of deforestation and degradation will require the use of both remote sensing technology and on-the-ground verification.
Under the UNFCCC, countries are advised to take into consideration the Good Practice Guidelines (IPCC, 2003) or the Guidelines for National GHG Inventories (IPCC 2006) when developing the MRV function of NFMS for REDD+. The approach consists in combining human activities (called ‘activity data’) with coefficients that quantify emissions or removals per unit activity (called ‘emission factors’) (UN-REDD+ Programme 2012).
Figure 7.2. REDD+ MRV Capacity GapSource: Romjin et al. 2012

F O R E S T S I N A C H A N G I N G C L I M A T E76
Emission Estimate = Activity Data X Emission FactorActivity Data (AD), according to the IPCC’s Good Practice Guidance for LULUCF is the magnitude of human activity resulting in emissions or removals during a given period of time. In the LULUCF sector, data on land area, management systems, and fertilizer use are examples of AD (IPCC, 2003). The IPCC proposes three approaches (IPCC, 2003, 2006) in generating AD when referring to land identification. These are not hierarchical or mutually exclusive (IPCC, 2003).
Approach 1: Basic land-use data. Represents land use area totals within a defined spatial unit, such as a country, province or municipality. Only net changes in land use area are tracked within the boundaries of the spatial location. Consequently, the geographical location of each land use change is not known, and the exact changes that occur between land uses cannot be ascertained.
Approach 2: Survey of land use and land use change. Provides an assessment of both the gross and net losses or gains of the surface area for the categories of specific land uses and allows the determination of areas where these changes take place. However, changes are tracked without spatially explicit data (i.e. the location of specific land uses and land-use conversions are not known).
Approach 3: Geographically explicit land use data. Shows land use data with spatially explicit observations of land use categories and land use conversions, often through
‘wall-to-wall’ mapping.
Emissions factors (EF) are defined either as the average emissions rate of a given GHG for a given source, relative to units of activity, or the average carbon stock increase, in the case of net removals. (UN REDD Programme 2012) According to the IPCC guidelines there are three methodological tiers for estimating EF with increasing levels of data requirements, analytical complexity and accuracy (IPCC, 2003).
Tier 1: Coarse default data based on globally available forest information. (e.g., African tropical rainforest, no difference between countries) There are large uncertainties with method simplifying assumptions and default values of these parameters used.
Tier 2: Uses region or country-specific forest data. (e.g., collected within the national boundaries) This is a more accurate approach and has fewer uncertainties in the estimation of emissions reductions.
Tier 3: Uses detailed specific-site forest data. This approach creates actual inventories with repeated measures on permanent plots to directly measure changes in forest biomass. It also uses well-parameterized models in combination with plot data to give accurate estimations of carbon stocks changes.
7.2.4 Community and participatory monitoring of forests
Participatory monitoring may be important in scaling up forest inventories at national levels. REDD+ countries have to conduct a great amount of forest inventories if they are to report emissions reductions to the UNFCCC at the level of accuracy that the IPCC has proposed (maximum 10% error at the 90% confidence level) (Angelsen 2009). Within REDD+, participatory monitoring could be a relatively cost-effective way to obtain ground level data, also known as Tier 3 data. A REDD+ mechanism will most likely use Tier 2 or 3 data.
Many countries as part of their NFMS could likely adopt participatory monitoring, within a community forestry context. Forest areas within the range of rural settlements could implement monitoring programs that profoundly involve communities in REDD+. Participatory monitoring could lower MRV costs, as monitoring forests with communities comes at much lower cost than monitoring with professional surveys and relatively high accuracy (Angelsen 2009). Using community based monitoring (CBM), the K:TGAL project found high accuracies in biomass measurements, with a variation of more than 7% and mostly less than 5% from those surveys done by independent experts. Also, costs were found to be 30-70% lower than using professional surveys in the first years of monitoring when CBM is most expensive due to the cost of training (Skutsch 2010).
In some countries, rural settlements have already been trained to map forest carbon stocks. For example, Cambodia’s first REDD+ project in the Oddar Meanchey province has involved local communities to collect data throughout MRV process of the project. People have been trained to monitor and measure carbon stocks, which later were verified through third parties (TGC 2011).
Data from community inventories could be used to assess biomass change over time. They could also support independent validation by correlating individual inventories with satellite imagery. Community management may also eliminate the need for extensive field visits, further lowering transaction costs. Additionally, community inventories may highlight the importance of community management in providing carbon services, and thereby legitimize community claims to share financial benefits of forest conservation. Consequently, communities will also have a stronger negotiating position about the relative value of forests versus other land uses. (Angelsen 2008) Communities can play an essential role in monitoring forest degradation, as slow changes in carbon stock and vegetation loss are difficult to monitor with remote sensing. Direct measurements made by the communities to measure open forest fires, sub-canopy fires, selective logging, shifting cultivation, and any other activity related to forest degradation can not only strengthen forest inventories and monitoring activities, but can also help

F O R E S T S I N A C H A N G I N G C L I M A T E 77
Source: GOFC-GOLD (2010
establish local ownership of the process (Murdiyarso et al., 2008).
Typically, emissions from degradation range in between 1–2 tons of carbon (3–7 tonnes CO2) per hectare per year. Remote-sensing methods cannot pick up such small changes, still less over the short time frames of carbon accounting periods (1–2 years, and in any case not more than 5 years) (Angelsen 2009).
Several models for linking community inventories to national REDD+ programs may exist. For example, communities receiving carbon PES could be responsible for biomass inventories. Payments would be based on results, and emissions reductions payments would recoup communities’ costs of creating the inventories. Communities could also upload results of their inventories directly into national electronic databases. As in all carbon-reduction schemes, some form of verification such as random spot checks using very high-resolution remote-sensing techniques or on-the-ground third party verification could be used before delivering payments (Angelsen 2008).
7.2.5 The role of technology for efficient MRV systems
Remote sensing is the only realistic method for monitoring national-level deforestation (DeFries et al. 2006). Monitoring the changes in forest cover is essential to estimate emissions or emissions reductions in REDD+. Since the early 1990s, changes in forest cover have been monitored from space by sensors on board aircraft
and satellites. Multiple methods, satellite imagery and technology exist for monitoring forests at national scales.
Mid-resolution (e.g., Landsat) data has been the primary tool used for deforestation monitoring. Data around 1990, 2000, 2005 and 2010 has been used to assess historical deforestation rates. NASA launched its first Landsat satellite on July 23, 1972 and subsequently every 2-3 years earth observing satellites have been launched. Landsat 8 was launched in February 2013, and is now the workhorse of the system. Almost complete global imagery from these Landsat satellites is available at low- to no-cost for the early 1990s, early 2000s and 2005. (GOFC-GOLD, 2010)
‘Landsat-type’ remote sensing data with 30 m resolution with 1 to 5 ha Minimum Mapping Unit (MMU) is recommended to map and monitor forest cover. Until year 2003, Landsat, given its low cost and unrestricted license use, has been a widely used for mid-resolution (10-50 m) data analysis. Although other types of sensors and technology like Lidar are appropriate and may become increasingly popular in MRV systems (GOFC-GOLD, 2010).
Lidar (Light Detection and Ranging, or also known as LIDAR, Laser Imaging Detection and Ranging) is an optical remote sensing technology that can measure the distance to targets by illuminating the target with laser light and analyzing the backscattered light. Laser pulses can penetrate through multi-layered canopy providing necessary information to calculate biomass in deforested or even degraded forests, which are challenging to monitor using other remote sensing imagery (Gautman 2010).
Table 7.1 Technologies for forest monitoring
Sensor & resolution Examples of current sensors
Minimum mapping unit (change)
Cost Utility for monitoring
Coarse (250–1000 m)
SPOT-VGT (1998-)Terra-MODIS (2000-)Envisat-MERIS (2004-)
~ 100 ha~ 10–20 ha
Low or free
Consistent pan-tropical annual monitoring to identify large clearings and locate “hotspots” for further analysis with mid resolution
Medium (10–60 m)
Landsat TM orETM+, Terra-ASTER IRS AWiFs or LISS IIICBERS HRCCDDMCSPOT HRV
0.5–5 ha
Landsat & CBERS are free;For others:<$0.001/km2 for historical data$0.02/km2 to $0.5/km2 for recent data
Primary tool to map deforestation and estimate area change
Fine <=5 m RapidEye constellation <=0.2 ha $1.00/km2
Primary tool to map deforestation, degradation and validation of results from courser resolution analysis

F O R E S T S I N A C H A N G I N G C L I M A T E78
The two most common approaches in monitoring deforestation are wall-to-wall mapping and sampling. Wall-to-wall mapping is when an entire country or forest area is monitored, a common approach in Brazil, Guyana, Mexico and India. Sampling takes forest cover samples at regular intervals (e.g., every 10km) or at determined proxy variables – for example deforestation hotspots. This approach reduces the costs of data and analysis, and is especially suitable when deforestation is concentrated in discreet areas (Angelsen 2009). A sampling approach may be extended to wall-to-wall coverage in a subsequent period if necessary, as well; or a wall-to-wall mapping approach may be followed by a sampling approach if considered necessary (e.g., cost reduction).
One way to reduce costs in a monitoring system is by implementing a stepwise approach. Coarse resolution data is analyzed to identify locations with high rates of land use change (e.g., deforestation hotspots), and subsequently a more costly medium-fine resolution data (e.g., Landsat) may be used to conduct a detailed analysis of these hotspots (Angelsen 2008). This approach reduces the need to analyze the entire forested area within a country while reducing costs and obtaining high accuracy.
Accuracies of 80-95% may be achievable with medium-resolution imagery (e.g. Landsat) to discriminate between forests and non-forests (Angelsen 2008). This can be assessed through more costly fine resolution aircraft or satellite imaging, or through on-the-ground observations. Aerial photography also presents a good tool for verification, although fine-resolution imagery remains expensive. Another source of free viewable data can be the fine-resolution imagery from Google Earth, although it is not possible to determine whom the data was collected by.
However monitoring forest degradation with remote sensing data is more challenging than mapping deforestation. Forest degradation is caused by a variety of factors, at different scales, making it more complex to define, monitor, report and verify. While monitoring deforested areas can rely on remote sensing technology e.g. Lansat (30m) resolution imager, supported by ground measurements for verification, monitoring forest degradation is more challenging, and relies largely on ground measurements that can be complemented by remote sensing, requiring 5 m resolution imagery or better (Angelsen 2008; Guyana Interim Measures Report 2011).
Degraded forests have a different variety of gaps with different levels of disturbances, some disturbances may be underneath the canopy, making the areas of degradation hard to detect with remote sensing. Repeated monitoring is needed to ensure all forest changes are accounted for and attributable to a particular time period as the ‘visibility’ of forest degradation may change rapidly.
Annual mapping may be required to measure degradation as signatures of degradation like logging and forest fires change quickly. If not measured on a constant basis, imagery may lead to un-real estimation of forest emissions, for example, old degraded forests with less carbon stocks can be misclassified as intact forest as the canopy closes. Therefore, annual detection and mapping of areas with canopy damage may be essential to monitor forest degradation even with high-resolution multispectral imagery such as Landsat (GOFC-GOLD, 2010).
Mapping forest degradation varies from imagery interpretation to highly sophisticated automated algorithms with on-the-ground verification (GOFC-GOLD, 2010). Lidar technology may become increasingly popular in monitoring forest degradation, as it may provide valuable data of forest biomass which regular satellite imagery may not (e.g., in degraded forests with closed canopy). Through ‘multiple returns’ Lidar technology is able to capture the biomass underneath the forest canopy.
Technology increasingly plays a crucial role in MRV systems. Countries will have to develop infrastructure and know-how to be able to carry out efficient and credible MRV systems. MRV knowledge-sharing among REDD+ countries will also play an important role in accelerating
Figure 7.3. Visualization of Lidar TechnologySource: Illustration of LiDAR waveform vs. discrete recording characteristics, provided by Juan Carlos Fernandez Diaz, PhD, Senior Researcher, University of Houston, National Sci-ence Foundation’s National Center for Airborne Laser Mapping, Houston, TX. Originally published in Imaging Notes Spring 2011.
Footprint
Time
Intensity
Return waveform
Pulse width
Crown return
Understory return
Ground return
Beam divergence
Outgoing laser pulse
Disrete records
F O R E S T S I N A C H A N G I N G C L I M A T E 79
the process and addressing gaps that many countries still have in implementing such mechanism. A credible and transparent MRV system will be essential throughout the implementation of REDD+.
7.3 CASE STUDIES
Case 1. K:TGAL research with Community Based Forest ManagementKyoto: Think Global Act Local (K:TGAL) was a research and capacity building program financed by the Netherlands Development Cooperation. This program investigated the potential of Community Based Forest Management (CBFM) in REDD+; it took place in 30 sites in eight countries in Africa, Asia and Latin America, over periods of 3–5 years (Angelsen 2009).
K:TGAL found that local people with as little as 4 –7 years of primary education who were already involved in CBFM could easily be trained to carry out forest inventories using standard methods such as those recommended by the Intergovernmental Panel on Climate Change (IPCC) in its Good Practice Guidance (Angelsen 2009).
K:TGAL’s methodology, which sampled all aboveground biomass (trees, shrub and herb layers, and litter), found
that the difference in estimates of biomass made by the community in 2008 and those made by independent experts who carried out control surveys were never more than 7%, and was mostly less than 5% (Angelsen 2009).
Case 2: Monitoring Deforestation in the Brazilian Amazon Forest Brazil’s forest monitoring system developed by the National Institute for Space Research (INPE) is recognized as the best system for tracking and monitoring deforestation. The monitoring mechanism developed by INPE monitors deforestation on the Amazon forest on a yearly basis to track total land use change as well as deforestation on a real-time basis.
PRODES (Project to Monitor the Brazilian Amazons) measures Brazil’s annual deforestation using Landsat-type imagery. Brazil’s annual deforestation is calculated every year in August. While DETER (Real-time Detection of Deforestation) detects and alerts of deforestation happening at the moment, MODIS imagery is used for DETER alerts of deforestation on biweekly basis. The imagery used for DETER is of lower resolution than the Landsat imagery, but its technology can detect clearings 25 Ha or more. (Butler, 2011)
7.4 KEY QUESTIONS FOR DISCUSSION
Technology transfer around MRVAngelson (2008) notes that there is a lack of capacity amongst certain countries to implement MRV. On the technical side, this is often due to the lack of availability of technical equipment or satellite imagery, which results in the lack of access to good data and poor technical infrastructure. However, there is also a lack of human resources with the analytical capacity to conduct consistent and transparent data analysis of domestic forests, which is crucial to any MRV process (Angelsen 2009). What are the most efficient ways to transfer technology and know-how amongst countries with small gaps in MRV to countries with large gaps in MRV?
Community-based management systemsCommunity-based management (CBM) systems are low cost alternatives to monitoring using independent consultants. CBM can be achieved using local people without a lot of education. In the K:TGAL case study, local people with only 4 – 7 years of primary education were trained to carry out forest inventories (Angelson 2009). They used methods congruent with IPPC recommended guidance and found that their biomass estimates were comparable to those by independent experts, with mostly less than a 5% variation from expert results (Angelsen 2009). What are the best ways of inducing CBM systems and incentives in monitoring of forest carbon stock?
Tradeoffs in data collectionWhen considering the information that needs to be gathered for MRV of REDD+, there are tradeoffs between the detail of data that can be collected and the relative cost of that data. While it is possible to create detailed databases using both hi-res satellite-based and on-the-ground data through extensive investment, it is important to consider the level of benefits in line with the volume of investment. Similarly, there is a tradeoff between robustness of data (creating a national-level picture with coarser resolution) versus the accuracy of the data (investing in more detailed and site-specific data) (Angelsen 2008). How should countries manage these tradeoffs? Where will the balance between robustness and accuracy in regards national reference levels and MRV be found in REDD+? How much is REDD+ willing to sacrifice in accuracy for cost reduction in MRV?
F O R E S T S I N A C H A N G I N G C L I M A T E80
7.5 REFERENCES
Angelsen, A., Brockhaus, M., Sunderlin, W.D. and Verchot, L.V. (eds) 2012 Analysing REDD+: Challenges and choices. CIFOR, Bogor, Indonesia.
Angelsen, A. with Brockhaus, M., Kanninen, M., Sills, E., Sunderlin, W. D. and Wertz-Kanounnikoff, S. (eds) 2009 Realising REDD+: National strategy and policy options. CIFOR, Bogor, Indonesia.
Angelsen, A. (ed.) 2008 Moving ahead with REDD: Issues, options and implications.
CIFOR, Bogor, Indonesia.
Butler, R. February 2011. Monitoring deforestation: an interview with Gilberto Camara, head of Brazil’s space agency INPE. Mongabay. March 2013. From:
interview.html
Blom B, Sunderland T, Murdiyarso D. Getting REDD+ to work locally: lessons learned from integrated conservation and development projects, Environmental Science & Policy, Volume 13, Issue 2, April 2010, Pages 164-172. From:
S1462901110000043)
DeFries, R., Hansen, A., Newton, A. C. and Hansen, M. C. 2005 Increasing isolation of protected areas in tropical forests over the past twenty years.
Fry B.P, Community forest monitoring in REDD+: the ‘M’ in MRV?, Environmental Science & Policy, Volume 14, Issue
Gautam B.R., Tokola T., Hamalainen J., Gunia M., Peuhkurinen J, Parviainen H, Leppanen V, Kauranne T., Havia J., Norjamaki I., Sah B. P. 2010. Integration of airborne LiDAR, satellite imagery, and field measurements using a two-phase sampling method for forest biomass estimation in tropical forests. Paper presented at International Symposium on “Benefiting from Earth Observation”, Kathmandu, Nepal
GOFC-GOLD, 2010, A sourcebook of methods and procedures for monitoring and reporting anthropogenic greenhouse gas emissions and removals caused by deforestation, gains and losses of carbon stocks in forests remaining forests, and forestation. GOFC-GOLD Report version COP16-1, (GOFC-GOLD Project Office, Natural Resources Canada, Alberta, Canada)
Griscom B, Shoch D, Stanley B, Cortez R, Virgilio N. Sensitivity of amounts and distribution of tropical forest carbon credits depending on baseline rules, Environmental Science & Policy, Volume 12, Issue 7, November 2009, Pages 897-911.
S1462901109001002)
Guyana Forestry Commission, Guyana REDD+ Monitoring Reporting and Verification System (MRVS), Interim Measures
Herold, M. 2009 An assessment of national forest monitoring capabilities in tropical non-Annex I countries: recommendations for capacity building. Report for the Prince’s Rainforests Project and the Government of Norway. Friedrich-Schiller-Universität Jena and Global Observation of Forest and Land Cover Dynamics Land Cover Project Office, Jena, Germany.
Holzknecht K, Aurora L., Nov 2012. Reference emissions levels decision helps forested nations step closer to REDD+. CIFOR.
UZUbEBz3IoQ.
IPCC. 2003. Good Practice Guidance for Land Use, Land-Use Change and Forestry. Institute for Global Environmental Strategies. Japan.
IPCC, 2006. Guidelines for National Greenhouse Gas Inventories – Volume 4 – Agriculture, Forestry and other Land Use. Institute for Global Environmental Strategies, Japan
Murdiyarso, D., M. Skutsch, M. Guariguata, M. Kanninen, C. Luttrell, P. Verweij, O. Stella. 2008. Measuring and monitoring forest degradation for REDD: implications of country circumstances. CIFOR Info brief. No. 16.
Romijn E, Herold M, Kooistra L, Murdiyarso D, Verchot L. 2012. Assessing capacities of non-Annex I countries for national forest monitoring in the context of REDD+, Environmental Science & Policy, Volumes 19–20, May–June 2012, Pages 33-
Santilli, M., Moutinho, P., Schwartzman, S., Nepstad, D., Curran, L. and Nobre, C. 2005 Tropical deforestation and the Kyoto Protocol. Climatic Change 71(3): 267-276.
Skutsch, M (ed) 2010. Community forest monitoring for the carbon market. Earthscan, London
Terra Global Capital (TGC). 2011. Reduce Emissions from Deforestation and Degradation in Community Forests Oddar Meanchey, Cambodia: Verified Carbon Standard (VCS) Project Design Document (PDD).
Outcome of the Work of the Ad Hoc Working Group on Long-term Cooperative Action under the Convention. In Report of the Conference of the Parties on its sixteenth session, Addendum, Part Two: Action taken by the
and verifying (advance unedited decision).
UN-REDD Programme. 2012. National Forest Monitoring Systems: Monitoring and Measurement, Reporting and Verification (M & MRV) in the context of REDD+ + Activities.

F O R E S T S I N A C H A N G I N G C L I M A T E 81
8.1 FUNDAMENTALS
M O D U L E 8Performance based incentives for reducing deforestation and forest degradation
In addition to forest products for which there are well-functioning markets such as timber, forests provide numerous ecosystem services such as climate stabilization, reduction of soil erosion, biodiversity, and carbon sequestration benefits. When the entirety of the benefits generated by ecosystems do not benefit the individuals or communities in charge of managing the forests (i.e. generate positive externalities), these services are likely to be under-provided. The consequent level and quality of forest cover is thus less than what is optimal for society as a whole. In recent decades, several countries have implemented programs that seek to incentivize individuals and communities in charge of forests to take these ecosystem services into account when determining forest cover, through payments for ecosystem services (PES) and conservation incentives programs.
“A PES scheme, simply stated, is a voluntary, conditional agreement between at least one ‘seller’ and one ‘buyer’ over a well-defined environmental service – or a land use presumed to produce that service” (Wunder 2005). Conservation incentives programs are analogous to PES programs in that the payments are conditional on pre-agreed behavior or outcomes, although they are not necessarily conditional on the provision of ecosystem services (FONAFIFO 2012). For instance, a program which seeks to provide ecosystem services such as carbon sequestration and water provision but makes payments conditional on forest cover instead of on the level of ecosystem services provided (which is likely to be a more complex measurement) is a conservation incentive program.
In recent years, several developing countries have introduced a variety of such programs, including those in China, Costa Rica, Ecuador, Mexico, and Nicaragua. PES programs have many comparable principles and objectives to the REDD+ framework. They seek to align the incentives of the decision-makers regarding a natural resource and that of society as a whole, thereby ensuring that the optimal level of the resource, and therefore of ecosystem services, are achieved and maintained. Analogously, REDD+ seeks to ensure that actors of deforestation consider the carbon benefits of forests in their decision.12 This module discusses the characteristics of these programs that are most relevant to REDD+, and how the experiences with these programs have the potential to inform design and implementation capabilities for REDD+.
One of the most clear similarities between the REDD+ framework and PES programs is the conditionality of the payment on certain pre-agreed criteria being met e.g. a certain level of forest cover being maintained in PES programs, analogous to a certain level of forest carbon emissions reductions achieved in REDD+. This is in contrast to official development assistance (ODA) or other development funding, which is usually not conditional on the fulfillment of any criteria. Accordingly, these agreements require additional institutions to verify the results of the agreements, ensure the implementation of conditionality, including pre-implementation socio-legal frameworks as well as the post-implementation monitoring, verification, and reporting (MRV) mechanisms, which are more stringent than most non-conditional development assistance funding.
Notable aspects of PES and conservation incentive programs that may have lessons for the REDD+ framework comprise a) the preliminary groundwork and government commitment, b) the nature of effective contracts and c) monitoring, reporting and verification (MRV) processes. These can facilitate REDD+ readiness and the framing and implementation of REDD+
12 These benefits do not usually extend to the actors causing illegal logging.
F O R E S T S I N A C H A N G I N G C L I M A T E82
by highlighting which methods are most likely to be successful based on prior experience with PES and conservation incentives programs. Furthermore, in countries where such programs have been implemented, institutions established for their implementation can be used for REDD+ activities to some extent, such as local infrastructure to facilitate enrollment and MRV mechanisms.
Despite these similarities, however, REDD+ presents unique challenges not faced by many PES programs. One such fundamental challenge is ensuring that the REDD+ activities fulfill the additionality criterion i.e. ensure that forest carbon is higher than what it would have been relative to the status quo. This criterion is not always a stated objective of national conservation incentive programs (FONAFIFO 2012), but is a crucial aspect of REDD+.
Measuring the effectiveness of environmental programs is crucial to determining the relevance of these programs for conservation in a particular setting, as well as identifying effective mechanisms and areas for future improvements. There is a wide literature on the measurement of the effectiveness of PES and conservation incentives programs, and the results vary not only from program to program (Wunder et al. 2008), but in some cases, within the same program (Arriagada et al. 2012). Evaluating the performance of these programs presents several methodological challenges, such as the fact that participating individuals and communities may differ along certain unobserved characteristics relative to non-participants, which if true, would bias the results. Furthermore, characteristics of the programs, such as the source of financing, may affect efficacy along certain dimensions. Using case study evidence from several countries, Wunder et al. (2008) find that user-financed programs were more suitable to local conditions, better-targeted, more willing to enforce the conditionality of program payments, and had better monitoring. Section 8.4.2 discusses these issues of program evaluation and the environmental impacts of PES programs using Costa Rica’s conservation incentive program as a case study.
Another fundamental aspect of evaluating the impact of PES and conservation incentives programs is the socio-economic and equity impacts of these programs. Recent studies have found that while poverty may not be a barrier to participation in PES programs (Pagiola et al 2007 for Nicaragua, Uchida et al 2007 for China), extreme poverty may be a constraint, and the primary restriction to participation may be transaction costs ( Pagiola et al 2007 for Nicaragua and Pagiola et al. 2010 for Colombia). Uchida et al 2007 analyze the impacts of the Sloping Lands Conversion Program (SLCP) in China, and find that relatively poor households are not only able to participate in the program, they are economically better off relative to non-participant households as a result of the program. De Koning et al. (2011) analyze the impact of the Socio Bosque in Ecuador, and find that the spatial targeting mechanisms used for site selection, which balance deforestation risk, potential for ecosystem service provision, and levels of poverty, to be an effective illustration of how PES programs can target and achieve several objectives.
The final outcomes of PES programs as well as REDD+ will be determined by the interactions of policies and socio-economic drivers. The environmental and cost effectiveness as well as equity implications of PES programs are affected by the environmental, socio-economic, and political context, as well as their evolution over time (Jack et al. 2008). Thus, the design of REDD+ and the context in which it is implemented can be expected to influence the final outcomes and sustainability of REDD+ agreements in the implementing countries.
8.2 TOOLS, INITIATIVES AND METHODOLOGIES
8.2.1 Preliminary Institutional Framework
8.2.1.1 Clarification of Property RightsIn order to design and finance an optimal contract with participating individuals and communities, it is vital to identify ownership and clarify property rights. This is not only with regard to ownership of the forest, but also whether the owners of the carbon rights are the same, and if not, what contracts are admissible. For instance, in Ecuador, while ecosystem services, including on private land, are owned by the government, conservation incentive programs have been implementable by simply requiring certain behavior from landlords that results in a certain level of ecosystem services (FONAFIFO 2012). Property rights for different aspects of forest products may be distinct (for instance, communities being given access to harvesting non-timber forest products in forest reserves). Furthermore, a vital dimension to the clarification of property rights regarding forests is gender. While women participate heavily in the procurement of forest products
such as firewood collection, formal membership as well as active participation of women in community forestry groups (CFGs) is disproportionately low (Agarwal 2001).
Furthermore, as PES and conservation incentives programs have shown, while establishing formal property rights mechanisms such as the large-scale land titling program in Ecuador or Mexico’s El Programa de Certificación de Derechos Ejidales y Titulación de Solares is likely to be a good long-term solution, it is a time-consuming and expensive endeavor that cannot be relied on in the short-run (FONAFIFO 2012). In several Sub-Saharan countries, less than 1% of the country is covered by the land titling and cadastral system, and in most of the developing world, countries currently have less than 30% coverage (Augustinus and Deininger 2005). In the interim, initiatives such as those in the Costa Rican PES program that recognize proof of rights of possession for 10 years or more provide cost-effective solutions to the challenge of identifying the parties providing the ecosystem service. Several countries in Africa are pioneering initiatives that have similar flexible characteristics, such as Mozambique’s recognition of

F O R E S T S I N A C H A N G I N G C L I M A T E 83
Chr
iste
r Fre
derik
sson
/GET
TY IM
AG
ES
occupancy rights as equivalent to registered land rights, or Uganda’s recognition of customary occupation rights without requiring, albeit with the option of acquiring, formal documentation (Augustinus and Deininger 2005).
8.2.1.2 Supporting Technical ExpertiseThere are certain institutional pre-requisites such as ground-level capacity that individuals and communities entering into the agreements can rely on to navigate the procedural complexities. An illustration of this is the regente forestrals, or technical specialists, who assist landowners in Costa Rica in the application process for the PES programs, and receive no payment if the application is rejected without reason. Furthermore, their payment may be conditional on the receipt of future payments, which highlights a possible method to operationalize technical expertise without upfront costs (FONAFIFO 2012).
8.2.2 Nature of ContractsThe nature of well-designed contracts encompasses characteristics such as the choice of reference levels, duration of the contract, scope of implementation, benefits transfer details such as the identification of beneficiaries and means of transfer, and post-agreement issues such as the grievance redress mechanisms in place.
The duration of the contract should be long enough to ensure that the owner of the resource considers conservation as an economically competitive land use, and yet extremely long contracts may not be feasible to
implement, particularly when property rights are not well-documented. Currently, Mexico and Costa-Rica use five-year contracts though Mexico has additional incentives for signing fifteen year contracts, and Costa-Rica is considering implementing the same duration. Ecuador currently has twenty-year contracts (FONAFIFO 2012). The optimal duration for REDD+ should draw lessons on the appropriate duration in a context given alternate land-use pressures, the volatility of changes in surrounding sectors, and level of clarification regarding property rights, since these would determine the pressures to convert forest land to alternate uses. One possibility is to sign long-term contracts with the option of re-negotiation at certain times based on pre-agreed criteria (such as inflation or commodity prices), although this also increases the risk of contract termination and potential changes in forest land which will lead to a loss of carbon credits for the host country. For REDD+, the optimal duration of the contract would need to balance the tradeoff between feasibility of maintaining the long-term provisions of the contract and the permanence stipulated by REDD+. Periodic re-contracting may enhance the workability of long-term contracts, thereby facilitating the permanence requirement.
Benefits transfer is one of the most important and complex aspects of implementing PES and conservation incentive programs. The fundamental aspects of benefits transfer include the identification of beneficiaries, determination of the level and form (cash or kind) of payments, and the mechanisms via which the transfer take place. Usually,
Costa Rica has a well-developed Green Economy. Payment for Environmental Services (here in the form of tourism - can encourage long-term sustainability objectives. Manuel Antonia National Park, in Costa Rica.

F O R E S T S I N A C H A N G I N G C L I M A T E84
areas that are experiencing high rates of environmental damage or increased vulnerability are chosen to be included in these programs – for instance, China’s Sloping Lands Conversion Program (SLCP) target the Yangtze and Yellow River basins where the rates of soil erosion and flooding risks were high. However, areas where a mix of ecosystem services are provided optimally can reduce program costs and increase program efficacy – for instance, forests with a variety of native species of different canopy heights provide greater biodiversity benefits. Section 8.4.3 discusses some recent developments in technical capabilities that have the potential to inform site selection based on the availability of several ecosystem services, we well as some examples of programs that use spatial targeting for achieving multiple objectives.
The inclusion of individuals and communities whose economic activities are tightly linked to forest cover is often a crucial factor determining the success of the programs. Chhatre and Agrawal (2009) use data from 80 forest commons in 10 countries in Asia, Latin America and Africa, and find that forest size and greater local-level autonomy in forest governance is positively associated with carbon storage and livelihood benefits. A related aspect of the identification of beneficiaries is the determination of whether payments would be made to all individuals in an entire community or selected individuals, when lands owned by communities are enrolled. The former may lead to non-complying individuals benefiting as well, which would hamper the long-run sustainability of the program.
The determination of the exact form of the payment – for instance, whether the payments are a flat payment per unit of land that do not vary across enrolled plots, or a heterogeneous contract that accounts for the varying ability of enrolled plots to provide ecosystem services is a crucial aspect of benefits transfer. While the former is simple and requires lower transaction costs, the latter is likely to be the optimal mechanism for REDD+, since the ability of different forests to sequester carbon will vary widely, as will the associated opportunity costs and socio-economic and institutional contexts.
The level of payments in several of the current programs is estimated to be higher than the opportunity costs of enrolled land (Uchida et al 2005, FONAFIFO 2012), which may be the reason for high participation and compliance. If government objectives with regard to these programs include other socio-economic objectives such as poverty alleviation, then payments higher than the opportunity costs of enrolled land will facilitate these objectives, such as in the case of the Socio Bosque program in Ecauador (de Koning et al. 2011). In addition, heterogeneous drivers of deforestation and forest degradation imply that the level of payments necessary will vary across regions. To illustrate this heterogeneity, Table 8.1 indicates the various pressures on forest land in Mexico, reproduced from Alix-Garcia et al. (2005).
Furthermore, routing payments through pre-existing institutions may provide a cost-effective mechanism to achieve the transfer, while also facilitating complementary policy goals. For instance, in Ecuador’s PES program, Socio Bosque, the payments are made through a rural development bank, which also allows the participating households to use the payments as loan guarantees in absence of collateral (FONAFIFO 2012).
8.2.3 Monitoring, Reporting and Verification (MRV)
The third fundamental aspect of these programs is the monitoring, reporting and verification (MRV) mechanisms. In current PES and conservation incentives programs, site visits, remote sensing or a combination of the two are used to verify that the terms of the contract are upheld. The applicability of MRV techniques used for these programs towards facilitating REDD+ MRV mechanisms will vary. Furthermore, it may present additional monitoring challenges such as measuring forest degradation, which, as Module 3 discussed, is more challenging than measuring deforestation.
It would be cost-effective to synergize multi-purpose institutions that have been established for PES and conservation incentives programs with REDD+ activities. For instance, regente forestrals in Costa Rica assist in the pre-implementation enrollment activities such as completing enrollment documentation while also conducting post-enrollment monitoring and verification site visits (FONAFIFO 2012). In conservation incentives programs, since the payments are usually conditional on proxies for ecosystem service provision such as forest cover, payments are made even if the proxy over-predicts the provision of the ecosystem services in question. This may be similar to the arrangement in REDD+ agreements, or the host country government may bear the risk of the level of planned forest cover not generating the pre-agreed level of carbon credits.
Table 8.1: Sources of Pressure on Forests in Participating Communities in Mexico’s PES program
Source Percentage of Communities Reporting the Source
Agriculture 25
Pasture 65
Domestic Use 85
Firewood extraction 85
Incursion of cattle from outside communities
15
Pests and forest fires 50
Source: Table 9, Alix-Garcia et al. (2005)

F O R E S T S I N A C H A N G I N G C L I M A T E 85
One of the largest PES programmes in terms of scope and scale introduced in 1998, by the Chinese government is the Sloping Lands Conversion Programme (SLCP), with the objective of converting steeply sloped cropland in the Yangtze and Yellow River basins to grasslands and forests, such as this steeply eroded slope in Tianjin County, Guangxi Zhuang.
Nic
k H
ogar
th/C
IFO
R
2013
Bla
ckbr
idge
AG
.rar
8.3 CASE STUDIES
8.3.1 Cost Effectiveness and Sustainability of PES Programs: Evidence from the Sloping Lands Conversion Program (SLCP), China
China introduced the SLCP or Grain for Green Program in 1998, with the objective of converting steeply sloped cropland in the Yangtze and Yellow River basins to grasslands and forests (Lie et al. 2005). The program is one of the largest PES programs in terms of scope and scale –between 1999 and 2001, while extent of land area enrolled was only 15% of the Conservation Reservation Program (CRP) in the United States, annual budgetary outlays for conservation payments were about 70% of the CRP (Uchida et al 2005). Farmers owning the targeted plots were given a combination of free grain, cash, and in the first year of land conversion, free seedlings. The duration of subsidy varied by the choice of alternate land use, with the least subsidy to grasslands (2 years), followed by economic forests using fruit trees (5 years), and the maximum to natural forests (8 years) (Liu et al. 2005).
Uchida et al (2005) analyze the cost-effectiveness and sustainability of the SLCP programs, using survey evidence from 144 participating households from 16 randomly selected villages in two regions. The authors use the success of the program in enrolling highly sloping plots (as a proxy for potential to mitigate soil erosion) and those with a lower opportunity cost (plots whose pre-program yields were relatively low) as indicators for cost-effectiveness. They find that while the program was largely able to
target steeply sloping cropland as was the original aim, other considerations such as those facilitating monitoring (e.g. proximity to roads) also played an important role in plot selection by the local governments. The level of cost-effectiveness was heterogeneous across provinces – while overall, more than 80% of the chosen plots were steeply sloped (as defined by slopes of 15 degrees or more), in Dafang County of Guizhou Province, 98% of enrolled plots fulfilled this criterion. Furthermore, an analysis of the success in enrolling plots with low opportunity costs reveals that nearly 40% of the plots in the study had pre-program yields that were lower than the compensations of grain provided under the SLCP, which indicates that the owners of those plots were being over-compensated. This may not be a concern if one of the objectives of the government was poverty alleviation or wealth transfer. Again, there is a large heterogeneity in the success of enrolling plots with lower opportunity costs, underscoring the importance of the efficacy of local institutions in achieving cost-effective implementation.
The authors also study the potential sustainability of the program as defined by the frequency of households who responded that they would consider shifting the enrolled plots back into cropping when the program ended. They find that while the level of compensation payments have in many cases exceeded pre-program yields on enrolled plots, macro-economic and agronomic conditions in different provinces determined whether a large number of farmers responded that they would continue with the program activities once the program ended or shift the land back into cropping.
Satellite image of the Yellow River, using 5m RapidEye. High resolution satellite imagery is proving vital for the monitoring component of MRV

F O R E S T S I N A C H A N G I N G C L I M A T E86
These results underscore the importance of forward thinking and flexible conservation incentives as well as the effectiveness of local institutions in determining the cost-effectiveness, targeting efficiency and long-term sustainability of PES and conservation incentives programs.
8.3.2 Environmental Effectiveness of PES Programs: Evidence from Costa Rica
Costa Rica introduced its conservation incentive program, Programa de Pagos por Servicios Ambientales (PSA) in the late 1990s, with the first contracts being signed in 1997 (Arriagada et al. 2012). The program paid private landowners to increase their land area under forest cover, with the objective being to enhance the provisions of associated ecosystem services. While earlier work (Sierra and Russman 2006, Pfaff et al. 2008, Robalino et al. 2008) found that the program had little or no impact in increasing total forest cover, more recent work by Arriagada et al. (2012) finds that the program increased forest cover in regions where targeting was considered relatively effective, on average by about 11% to 17% of the mean area under PSA contract over between 1997 and 2005. The earlier studies used similar methodologies to Arriagada et al. (2012) in that they used regression methods such as ordinary least squares (OLS) (use by Sierra and Russman 2006 and Robalino et al. 2008) and matching methods (used by Pfaff et al. 2008) that attempted to account for the selection bias between participants and non-participants. Arriagada et al. (2012) examine farm-level data that is able to account for within-farm spillovers, and account for unobservable differences between participants and non-participants that may otherwise bias results. They consider the impacts in the in Sarapiquı´ region where the non-governmental organisation Foundation for the Development of the Central Volcanic Range (FUNDECOR) had provided effective intermediation. By analyzing the impacts in the region where expected impacts would be higher than in the country as a whole, the authors aimed to examine whether the PSA had been effective at all. They find that given effective targeting and effectual local institutions to facilitate capable intermediation, conservation incentive programs can be effective policy mechanisms to achieve long-run increases in environmental quality.
These studies indicate a) the challenges in rigorous measurement of program impacts for PES and conservation incentive programs, b) the essentiality of collecting detailed environmental and socio-economic to facilitate program evaluation, and c) the importance of establishing consistent best-practices to allow comparisons of programs spatially, temporally, as well as across programs. These evaluation challenges are likely to arise for REDD+ as well, and progress along these dimensions will likely facilitate the assessment of REDD+ progress in the short, medium and long term.
8.4 KEY ISSUES FOR DISCUSSION
8.4.1 Effective Implementation of PES programs in Fragile States
The discussion above has underscored the importance of a sound and flexible institutional framework to implement
PES and conservation incentive programs. Institutional mechanisms at any of the key stages – identification of program areas and beneficiaries, contracting, transferring payments and monitoring- must be well-established for the participating households and communities to implement actual changes, as well as for the program to be sustainable in the long-run.
The two underlying assumptions within PES and conservation incentive programs, as well as REDD+ framework, is that the state institutions are not only stable enough to establish and implement these relatively long-term contracts, they are also effective enough to enforce any defaulting behavior on either side. This indicates the challenges in contracting with states that cannot ensure effective enforcement, including fragile states, or those undergoing a temporary institutional crisis13. Some of these issues may be potentially mitigated by altering the scope of implementation or the nature of the contracts in these states, by allowing REDD+ to include mechanisms that facilitate investment in capacity and institutions (Karsenty and Ongolo 2012), for instance mechanisms that act as precursors to engender conducive environments to sustaining long-term forest agreements. In fragile states, these capacity investments may be relatively larger, have a broader scope, and be necessary over a longer term than in the usual phases of REDD+ readiness. They may also be accompanied by a higher degree of uncertainty. However, consistency of investments as well as a longer-term commitment to these states would be vital to establish a
and would facilitate their participation in REDD+.
8.4.2 Optimal Contracting Mechanisms in Various Contexts
As discussed in section 8.2.2, there are numerous characteristics of the contract beginning from identification of the beneficiaries and deciding the level of payments to implementation of the agreements, as well as post-agreement monitoring that determine the performance of the programs. For instance, to ensure cost-effectiveness of the program through better targeting and to incentivize the most suitable individuals (i.e. those for whom the contract is likely to provide enough incentives for compliance) to select into these agreements, auctions can be held to encourage individuals to reveal the opportunity costs of forest land (Jack 2013).
Benefits transfer and the structure of payments are key issues for the contact design in REDD+. In case forests are managed by communities, paying each member of the community may encourage free-riding, while paying only certain individuals may not achieve the level of group consensus necessary for conservation. Furthermore,
13 Fragile states can be defined as states that “lack of political will and/or capacity to provide the basic functions needed for poverty reduction, development and to safeguard the security and human rights of their populations” (OECD/DAC 2007).
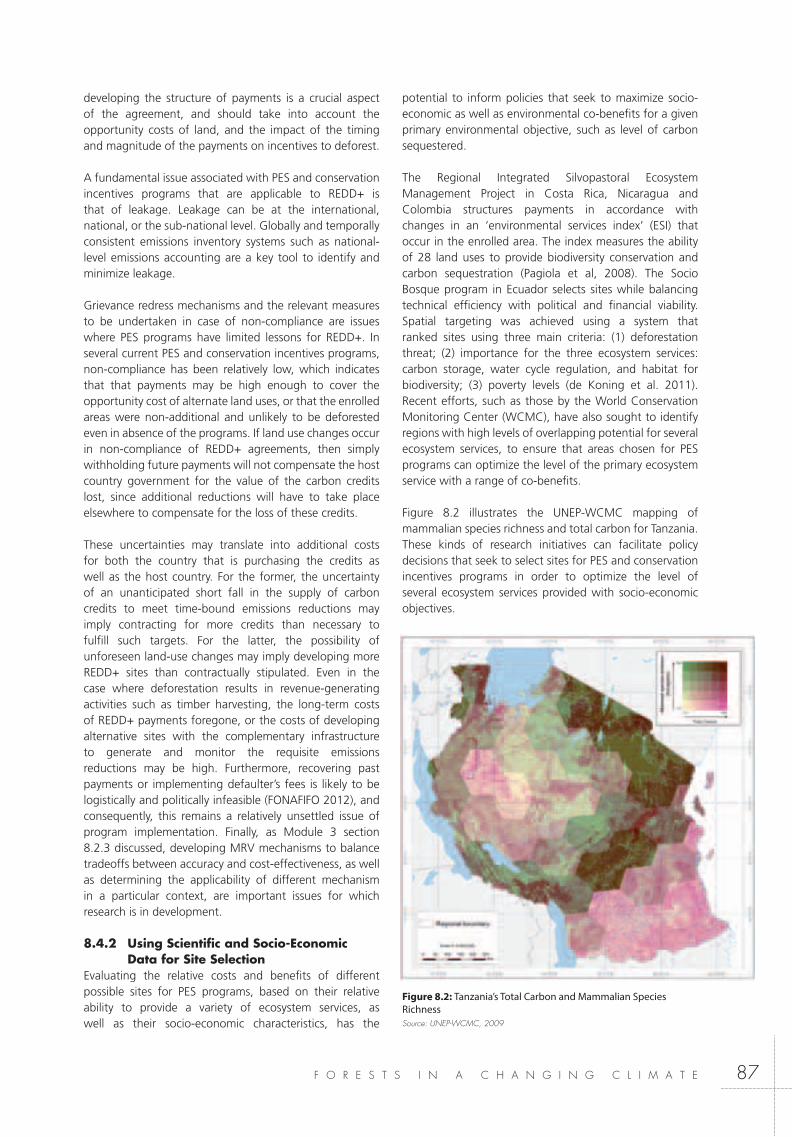
F O R E S T S I N A C H A N G I N G C L I M A T E 87
developing the structure of payments is a crucial aspect of the agreement, and should take into account the opportunity costs of land, and the impact of the timing and magnitude of the payments on incentives to deforest.
A fundamental issue associated with PES and conservation incentives programs that are applicable to REDD+ is that of leakage. Leakage can be at the international, national, or the sub-national level. Globally and temporally consistent emissions inventory systems such as national-level emissions accounting are a key tool to identify and minimize leakage.
Grievance redress mechanisms and the relevant measures to be undertaken in case of non-compliance are issues where PES programs have limited lessons for REDD+. In several current PES and conservation incentives programs, non-compliance has been relatively low, which indicates that that payments may be high enough to cover the opportunity cost of alternate land uses, or that the enrolled areas were non-additional and unlikely to be deforested even in absence of the programs. If land use changes occur in non-compliance of REDD+ agreements, then simply withholding future payments will not compensate the host country government for the value of the carbon credits lost, since additional reductions will have to take place elsewhere to compensate for the loss of these credits.
These uncertainties may translate into additional costs for both the country that is purchasing the credits as well as the host country. For the former, the uncertainty of an unanticipated short fall in the supply of carbon credits to meet time-bound emissions reductions may imply contracting for more credits than necessary to fulfill such targets. For the latter, the possibility of unforeseen land-use changes may imply developing more REDD+ sites than contractually stipulated. Even in the case where deforestation results in revenue-generating activities such as timber harvesting, the long-term costs of REDD+ payments foregone, or the costs of developing alternative sites with the complementary infrastructure to generate and monitor the requisite emissions reductions may be high. Furthermore, recovering past payments or implementing defaulter’s fees is likely to be logistically and politically infeasible (FONAFIFO 2012), and consequently, this remains a relatively unsettled issue of program implementation. Finally, as Module 3 section 8.2.3 discussed, developing MRV mechanisms to balance tradeoffs between accuracy and cost-effectiveness, as well as determining the applicability of different mechanism in a particular context, are important issues for which research is in development.
8.4.2 Using Scientific and Socio-Economic Data for Site Selection
Evaluating the relative costs and benefits of different possible sites for PES programs, based on their relative ability to provide a variety of ecosystem services, as well as their socio-economic characteristics, has the
potential to inform policies that seek to maximize socio-economic as well as environmental co-benefits for a given primary environmental objective, such as level of carbon sequestered.
The Regional Integrated Silvopastoral Ecosystem Management Project in Costa Rica, Nicaragua and Colombia structures payments in accordance with changes in an ‘environmental services index’ (ESI) that occur in the enrolled area. The index measures the ability of 28 land uses to provide biodiversity conservation and carbon sequestration (Pagiola et al, 2008). The Socio Bosque program in Ecuador selects sites while balancing technical efficiency with political and financial viability. Spatial targeting was achieved using a system that ranked sites using three main criteria: (1) deforestation threat; (2) importance for the three ecosystem services: carbon storage, water cycle regulation, and habitat for biodiversity; (3) poverty levels (de Koning et al. 2011). Recent efforts, such as those by the World Conservation Monitoring Center (WCMC), have also sought to identify regions with high levels of overlapping potential for several ecosystem services, to ensure that areas chosen for PES programs can optimize the level of the primary ecosystem service with a range of co-benefits.
Figure 8.2 illustrates the UNEP-WCMC mapping of mammalian species richness and total carbon for Tanzania. These kinds of research initiatives can facilitate policy decisions that seek to select sites for PES and conservation incentives programs in order to optimize the level of several ecosystem services provided with socio-economic objectives.
Figure 8.2: Tanzania’s Total Carbon and Mammalian Species Richness Source: UNEP-WCMC, 2009
F O R E S T S I N A C H A N G I N G C L I M A T E88
8.5. REFERENCES
Agarwal, Bina. “Participatory exclusions, community forestry, and gender: An analysis for South Asia and a conceptual framework.” World development 29.10 (2001): 1623-1648.
Alix-Garcia, Jennifer, et al. “An assessment of Mexico’s payment for environmental services program.” Unpublished paper prepared for FAO by UC Berkeley and the Centre for Research and Teaching of Economics, Mexico (2005).Angelsen, Arild, Maria Brockhaus, William D. Sunderlin, and Louis V. Verchot, eds. Analysing REDD+: Challenges and choices. CIFOR, 2012.
Arriagada, Rodrigo A., Paul J. Ferraro, Erin O. Sills, Subhrendu K. Pattanayak, and Silvia Cordero-Sancho. “Do payments for environmental services affect forest cover? A farm-level evaluation from Costa Rica.” Land Economics 88, no. 2 (2012): 382-399.
Augustinus, Clarissa, and Klaus Deininger. “Innovations. in. Land. Tenure,. Reform. and. Administration in Africa.” Land Rights for African Development (2005): 14.
Chhatre, Ashwini, and Arun Agrawal. “Trade-offs and synergies between carbon storage and livelihood benefits from forest commons.” Proceedings of the National Academy of Sciences 106, no. 42 (2009): 17667-17670.
de Koning, Free, Marcela Aguinaga, Manuel Bravo, Marco Chiu, Max Lascano, Tannya Lozada, and Luis Suarez. “Bridging the gap between forest conservation and poverty alleviation: the Ecuadorian Socio Bosque program.” Environmental Science & Policy 14, no. 5 (2011): 531-542.
FONAFIFO, CONAFOR. “Ministry of Environment (2012) Lessons learned for REDD+ from PES and conservation incentive programs.” Examples from Costa Rica, Mexico, and Ecuador.
Jack, B. Kelsey, Carolyn Kousky, and Katharine RE Sims. “Designing payments for ecosystem services: Lessons from previous experience with incentive-based mechanisms.” Proceedings of the National Academy of Sciences 105, no. 28 (2008): 9465-9470.
Jack, B. Kelsey. (2013) “Private information and the allocation of land use subsidies in Malawi” American Economic Journal: Applied, forthcoming.
Karsenty, Alain, and Symphorien Ongolo. “Can “fragile states” decide to reduce their deforestation? The inappropriate use of the theory of incentives with respect to the REDD+ mechanism.” Forest Policy and Economics 18 (2012): 38-45.
Leader, Nicholas, and Peter Colenso. “Aid instruments in fragile states.” DFID, London (2005).
Liu, Jianguo, Shuxin Li, Zhiyun Ouyang, Christine Tam, and Xiaodong Chen. “Ecological and socioeconomic effects of China’s policies for ecosystem services.” Proceedings of the National Academy of Sciences 105, no. 28 (2008): 9477-9482.
Miles, L., K. Kabalimu, B. Bahane, C. Ravilious, E. Dunning, M. Bertzky, V. Kapos, and B. Dickson. “Carbon, biodiversity and ecosystem services: Exploring co-benefits. Tanzania.” (2009).
OECD, 2007. Fragile States: Policy Commitment and Principles for Good International Engagement in Fragile States and
Pagiola, Stefano, Ana R. Rios, and Agustin Arcenas. “Can the poor participate in payments for environmental services? Lessons from the Silvopastoral Project in Nicaragua.” Environment and Development Economics 13, no. 3 (2008): 299.
Pagiola, Stefano, Ana R. Rios, and Agustin Arcenas. “Poor household participation in payments for environmental services: Lessons from the Silvopastoral Project in Quindío, Colombia.” Environmental and Resource Economics 47, no. 3 (2010): 371-394.
Pfaff, Alexander, Juan Andres Robalino, and G. Arturo Sanchez-Azofeifa. “Payments for environmental services: empirical analysis for Costa Rica.” Terry Sanford Institute of Public Policy, Duke University, Durham, NC, USA (2008).
Ribot, Jesse, and Anne M. Larson. “Reducing REDD+ risks: affirmative policy on an uneven playing field.” International Journal of the Commons (2012).
Robalino, Juan, Alexander Pfaff, G. Arturo Sanchez-Azofefia, Francisco Alpizar, Carlos León, and Carlos Manuel Rodriguez. Deforestation impacts of environmental services payments: Costa Rica’s PSA program 2000–2005. No. dp-08-24-efd. 2008.
Roberts, Michael J., and Shawn Bucholtz. “Slippage in the Conservation Reserve Program or spurious correlation? A comment.” American Journal of Agricultural Economics 87, no. 1 (2005): 244-250.
Sierra, Rodrigo, and Eric Russman. “On the efficiency of environmental service payments: A forest conservation assessment in the Osa Peninsula, Costa Rica.” Ecological Economics 59, no. 1 (2006): 131-141.
Uchida, Emi, Jintao Xu, and Scott Rozelle. “Grain for green: cost-effectiveness and sustainability of China’s conservation set-aside program.” Land Economics 81, no. 2 (2005): 247-264.
Wu, JunJie. “Slippage effects of the conservation reserve program.” American Journal of Agricultural Economics 82, no. 4 (2000): 979-992.
Wunder, Sven. Payments for environmental services: some nuts and bolts. No. 42. Bogor: CIFOR, 2005.
Wunder, Sven, Stefanie Engel, and Stefano Pagiola. “Taking stock: A comparative analysis of payments for environmental services programs in developed and developing countries.” Ecological Economics 65, no. 4 (2008): 834-852.

F O R E S T S I N A C H A N G I N G C L I M A T E 89
9.1 FUNDAMENTALS
M O D U L E 9Social and environmental safeguards
9.1.1 Social and Environmental Risks and Opportunities offered by REDD+Ongoing negotiations and preparations for a global REDD+ mechanism have focused on the notion that, in addition to reducing GHG emissions, such a mechanism should also engage with other important objectives at the intersection of environment and development. In particular, discussions have considered the potential of REDD+ to go beyond a single-intervention approach focused on carbon sequestration to durably transform forest governance and the sectors that drive deforestation (such as agriculture and mining) (Levin, McDermott and Cashore 2008); encompass other important ecosystem services and biodiversity (Hall 2012, 29); or provide economic opportunities for impoverished communities that live in or near forests (Hall 2012, 162-172). Nevertheless, while REDD+ offers a number of potential social and environmental co-benefits, it also poses related risks. To this end, legal, policy, and governance issues relating to the rights of Indigenous peoples and forest-dependent communities, as well as biodiversity and the integrity of ecosystems, have attracted significant attention amongst practitioners, stakeholders, and experts seeking to manage these risks (Sikor et al. 2010; Savaresi 2012; Lyster 2011; Phelps, Friess and Webb 2011).
The social risks and opportunities are manifold. For example, REDD+ has the potential to protect and promote the rights of indigenous peoples and forest-dependent communities – frequently threatened by large-scale commercial logging or forest conversion practices - by conserving forests and addressing the external drivers of deforestation (Larson et al. 2010, 5-6). The equitable distribution of REDD+ funding to communities, and their integration into community forest monitoring schemes, may also support gender equality and sustainable livelihoods (Peskett and Brodnig 2011; Danielsen et al. 2011), and REDD+ readiness efforts have the potential to lead to the recognition, clarification, or enforcement of the land and tenure rights of women, indigenous peoples and forest-dependent communities (Hatcher 2009; Seymour 2009; Rodrigues De Aquino, Aasrud and Guimarães 2011; Larson et al. 2013, Awono, 2013). But despite the potential for positive outcomes, there is also concern that the domestic implementation of REDD+ may in fact undermine the rights of these communities. For example, funding provided through REDD+ may in fact lead governments and corporations to “passively ignore or actively deny the land and resource rights of indigenous, traditional and/or poor forest users in order to position themselves to claim compensation for forest stewardship in their stead” (Seymour 2009, 219). Similarly, if large-scale reforms supported through the REDD+ readiness phase abrogate or fail to recognize the customary or statutory tenure, use, and property rights of local communities, these communities may be prevented from accessing the benefits of REDD+ funding (Lyster 2011). The combination of financial incentives introduced through REDD+, ineffective governance systems, and lack of rule of law in some developing countries may also create opportunities for corruption, graft, and elite capture (Doherty and Schroeder 2011, 81; Cotula and Mayers 2009, 9; see also Module 6, Section 6.1.2), or may help perpetuate neo-patrimonial and authoritarian patterns of control more generally (Phelps, Webb and Agrawal 2010). Finally, food security is also of particular concern to many poor communities in the context of REDD+, as protecting and expanding forested areas may reduce the area available for agriculture (REDD-net 2011, 2). On the other hand, synergies between REDD+ and food production exist, as forests ultimately provide ecosystem services that can contribute to crop yields (REDD-net 2011, 1).
REDD+ also entails risks and opportunities for the environment, and for biodiversity in particular. Because forests in the developing world contain much of the Earth’s terrestrial and freshwater biota, REDD+ holds enormous potential for the conservation of species and ecosystems threatened by deforestation and forest degradation (Gardner et al. 2012, 62). But as Phelps, Friess and Webb note, “evidence suggests that a REDD+ mechanism will not automatically yield significant,

F O R E S T S I N A C H A N G I N G C L I M A T E90
9.1.2 REDD+ Safeguards in the UNFCCCGiven the range of potential risks and co-benefits associated with REDD+, in addition to the pursuit of climate-related objectives, the Cancun Agreements thus provide that REDD+ activities should:
[…](d) Be consistent with the objective of environmental in-
tegrity and take into account the multiple functions of forests and other ecosystems;
(e) Be undertaken in accordance with national development priorities, objectives and circumstances and capabilities and should respect sovereignty;
(f) Be consistent with Parties’ national sustainable devel-opment needs and goals;
(g) Be implemented in the context of sustainable devel-opment and reducing poverty, while responding to climate change;
(h) Be consistent with the adaptation needs of the country;
[…](k) Promote sustainable management of forests (UNFCCC
COP 2011a, para. 1).
While this disparate set of environmental and social considerations has not been elevated into new priority objectives for REDD+, the role and importance of “non-
carbon benefits” continue to be debated within the UNFCCC negotiations. Moreover, the UNFCCC COP has adopted a series of safeguards for REDD+ activities, which are intended to prevent harm caused by REDD+ activities as well as enhance their multiple social and environmental benefits. The concepts of safeguards can be “broadly understood as policies and measures that aim to address both direct and indirect impacts to communities and ecosystems, by identifying, analyzing, and ultimately working to manage risks and opportunities” (Murphy 2011, 1).
As provided by the Cancun Agreements, in addition to meeting a manifold set of objectives, REDD+ activities must therefore “promote and support” the following safeguards:
(a) Actions complement or are consistent with the objectives of national forest programmes and relevant international conventions and agreements;
(b) Transparent and effective national forest governance structures, taking into account national legislation and sovereignty;
(c) Respect for the knowledge and rights of indigenous peoples and members of local communities, by taking into account relevant international obligations, national circumstances and laws, and noting that the United Na-tions General Assembly has adopted the United Nations Declaration on the Rights of Indigenous Peoples;
Safeguards and Multiple Benefits – are promoted through REDD+ activities to to avoid harm; and to ensure that key social, environmental and economic objectives can be met. A farmer with local fruit on the way to Tumba-Lediima Reserve in the Democratic Republic of CongoIn China a migrant bamboo farmer preparing bamboo shoots for fermentation.
Mar
co S
imol
a/C
IFO
R
Gira
rd O
llivi
er/C
IFO
R
geographically-distributed biodiversity co-benefits”, and in some cases, REDD+ may actually lead to biodiversity loss, “for example if REDD+ policies displace deforestation pressures into other forests (leakage), or if REDD+ redirects funds away from other conservation objectives” (2011, 54; see also: Miles and Kapos 2008). It is also true that biodiversity and carbon priorities do not always overlap, as areas with high biodiversity value do not necessarily have high carbon values (Phelps, Friess and Webb 2011, 54). The conversion of natural forests to plantations or other land uses having low biodiversity value is another risk (Moss and Nussbaum 2011, 2). It is thus important to be cognizant of carbon-biodiversity trade-offs that might arise in REDD+ planning and implementation.

F O R E S T S I N A C H A N G I N G C L I M A T E 91
(d) The full and effective participation of relevant stakehold-ers, in particular, indigenous peoples and local commu-nities, […];
(e) Actions are consistent with the conservation of natural forests and biological diversity, ensuring that actions […] are not used for the conversion of natural forests, but are instead used to incentivize the protection and conservation of natural forests and their ecosystem services, and to enhance other social and environmental benefits;
(f) Actions to address the risks of reversals; (g) Actions to reduce displacement of emissions (UNFCCC
COP 2011a, para. 2).
In addition, REDD+ activities should respect gender consid-erations (UNFCCC 2011b, 72).
Countries may look to a number of multilateral environmental agreements and human rights instruments in order to define and understand the requirements of these safeguards, including the UN Declaration on the Rights of Indigenous Peoples, the Convention on the Elimination of All Forms of Racial Discrimination, the Convention on Biological Diversity, the UN Convention to Combat Desertification, the International Tropical Timber Agreement, the Ramsar Convention, the International Covenant on Civil and Political Rights, the International Covenant on Economic, Social and Cultural Rights, the Convention on the Elimination of All Forms of Discrimination against Women, ILO Convention No. 169, African Charter on Human and Peoples Rights, and the Universal Declaration of Human Rights. A number of safeguard policies, approaches and initiatives (including the World Bank Operational Standards, the FCPF’s Strategic Environmental and Social Assessment, the UN-REDD+ Social and Environmental Principles and Criteria, various Forest Certification Schemes, and the REDD+ Social & Environmental Standards) also provide guidance for addressing social and environmental safeguards in the design and operation of REDD+ activities. These guiding frameworks – which are described in greater detail in Section 9.2 below – have different forms and objectives for use in different contexts, and range “from high-intensity models involving quality standards and indicators to lower intense ‘do no harm’ models that require assessment against a list of criteria” (Murphy 2011, 6). The UNFCCC COP has also requested that participating developing countries set up systems for providing information on the way that environmental and social safeguards are “being addressed and respected” in REDD+ activities (UNFCCC COP 2011b, para. 71(d)). This information should be provided periodically in national communications by developing country Parties and, on a voluntary basis, through communication channels agreed by the COP such on a web platform (UNFCCC COP 2013a). Parties also agreed that safeguard information systems (SIS) should “build upon existing systems, as appropriate” (UNFCCC COP 2011c), apply to all REDD+ activities “regardless of the source or type of financing”
(UNFCCC COP 2012, para. 63) and be developed through a country-driven approach that ultimately provides “transparent and consistent information that is accessible by all relevant stakeholders and updated on a regular basis.” (UNFCCC COP 2012, para. 2). Most recently, in the Warsaw Package for REDD+, the UNFCCC COP also established that developing countries seeking to obtain and receive results-based payments for REDD+ activities are obliged to “provide the most recent summary of information on how all of the safeguards […] have been addressed and respected before they can receive results-based payments.” (UNFCCC COP 2013b, para. 4).
At this stage however, exactly how the provision of information on these safeguards will be standardized, publicized or verified in a future REDD+ mechanism remains to be seen (McDermott et al. 2012, 64). In addition to the UNFCCC’s guidance in this area, a plethora of multilateral and non-governmental REDD+ initiatives have also emerged to provide additional and more specific guidance on reporting and complying with social and environmental safeguards. Depending on how they are operationalized at the domestic level, safeguards and related reporting systems may hold critically important implications for forest policy and governance, community rights, livelihoods, and empowerment, and gender considerations in developing countries (Jagger et al. 2012).
9.2 INITIATIVES, TOOLS & METHODOLOGIES
The multilateral and non-governmental initiatives that support REDD+ readiness efforts around the world include safeguard initiatives that build upon or are similar to the REDD+ safeguards agreed to within the UNFCCC.
Participatory Governance Assessments for REDD+This UN-REDD Programme initiative aims to provide a framework for a participatory process at the country level to conduct governance assessments for information sharing on how safeguards are promoted, addressed and respected in a systematic manner. The programme will also pilot Participatory Governance Assessments (PGAs) for REDD+, building on the UNDP Oslo Governance Centre’s approach to governance assessment. PGAs can serve as a policy tool for countries preparing for REDD+ by helping to identify governance challenges and provide responses to overcome these challenges.
World Bank Operational StandardsThe World Bank has established safeguard policies that apply to any REDD+ pilot projects that it supports or finances through its Forest Carbon Partnership Facility (FCPF) (for a more complete discussion of the FCPF, see module 6). This includes specific policies on Involuntary
BP 4.10) that incorporate human rights standards and considerations, as well as policies on Environmental
were primarily developed in the context of project-based

F O R E S T S I N A C H A N G I N G C L I M A T E92
lending, rather than strategic planning processes such as the REDD+ readiness process, the FCPF has adopted the use of Strategic Environmental and Social Assessments (SESA) to ensure that the REDD+ readiness activities that it supports comply with its safeguard policies (Moss and Nussbaum 2011, 6-9). The SESA process “allows for the incorporation of environmental and social concerns into national REDD-plus strategy process and ensures that the FCPF readiness activities comply with World Bank Policies during the strategic planning phase, considering that these strategic activities could have potentially far reaching impacts” (Moss and Nussbaum 2011, 7).
Table 9.1 UN-REDD Programme tools, guidelines and methodologies for REDD+ safeguards information systems
Source: Leo Peskett & Kimberly Todd, “Putting REDD+ Safeguards and Safeguard Information Systems Into Practice,” (UN-REDD+ Policy Brief, Issue no 3), p. 8.
UN-REDD Programme Social and Environmental Principles and Criteria and Other ToolsThe UN-REDD Programme has been developing Social and Environmental Principles and Criteria (SEPC), which it describes as an effort to reflect its “responsibility to apply a human rights based approach, uphold UN conventions, treaties and declarations, and to apply the UN agencies’ policies and procedures” (2010, 2). The SEPC are intended to: (1) address the social and environmental issues in UN-REDD National Programmes and other UN-REDD Programme funded activities; and (2) support countries in developing national approaches to REDD Programme

F O R E S T S I N A C H A N G I N G C L I M A T E 93
safeguards in line with the UNFCCC (UN-REDD Programme 2012b). The framework is made up of principles and associated criteria. The principles are “overarching, fundamental, active statements about the achievement of a desired outcome”, while the criteria are “the conditions that need to be met by UN-REDD Programme funded activities to contribute to the achievement of the principle” (UN-REDD Programme 2012b). The principles cover democratic governance (Principle 1), stakeholder rights (Principle 2), sustainable livelihoods (Principle 3), low-carbon, climate-resilient sustainable development policy (Principle 4), the protection of natural forests (Principle 5), the multiple functions of forests (Principle 6), and the protection of non-forest ecosystem services and biodiversity (Principle 7). Supporting guidelines include the joint UN-REDD Programme and FCPF Guidelines on Stakeholder Engagement in REDD+ Readiness with a Focus on the Participation of Indigenous Peoples and Other Forest-Dependent Communities; the UN-REDD Programme Guidelines on Free, Prior and Informed Consent. Additional UN-REDD Programme tools, guidelines and methodologies are included in the figure 9.1 below.
Forest Certification Schemes and Offset StandardsNumerous non-state forest certification schemes and offset standards have been developed and are being applied to certify emissions reductions achieved through particular REDD+ projects and activities. These include the Climate, Community and Biodiversity Alliance’s Climate, Community and Biodiversity (CCB) Standards, CarbonFix Standard (CFS), Forest Stewardship Council (FSC), Global Conservation Standard (GCS), ISO 14064:2006, Plan Vivo Standard, Programme for Endorsement of Forest Certification (PEFC), SOCIALCARBON Standard and the Voluntary Carbon Standard (VCS). For an in depth review of how these standards apply to REDD+ projects, see Merger, Dutschke and Verchot 2011.
The Climate, Community and Biodiversity Alliance (CCBA) is a partnership of international NGOs and advising institutions. Their CCB Standards evaluate land-based carbon mitigation projects, including REDD+ activities, from the early stages of development through implementation, and were designed “to foster the development and marketing of projects that deliver credible and significant climate, community and biodiversity benefits in an integrated, sustainable manner” (CCBA 2008, 6). They are already being used within specific forest conservation and management projects receiving or seeking funding from public and private sources. The standards involve a two-step process: validation, which demonstrates good project design to generate climate, community and biodiversity benefits, and verification – the independent endorsement of the quality of project implementation and the delivery of multiple benefits. REDD+ Social & Environmental StandardsAnother significant initiative is the REDD+ Social & Environmental Standards, which have been developed through a series of multi-stakeholder workshops held in Denmark, Nepal, Tanzania, Ecuador and Liberia, and facilitated by the CCBA and CARE International. The REDD+ SES are intended “to provide a mechanism for country-led, multi-stakeholder assessment of REDD+ program design, implementation and outcomes to enable countries to show how internationally- and nationally-defined safeguards are being addressed and respected” (REDD+ SES 2013). The REDD+ SES can be used by governments, NGOs, financing agencies and other stakeholders in order to generate social and biodiversity co-benefits, and to support the design and implementation of REDD+ programs that respect the rights of indigenous peoples and local communities (REDD+ SES 2012, 3). The REDD+ SES also provide a framework for monitoring and reporting how such safeguards are being addressed and respected throughout REDD+ implementation (REDD+ SES 2013).
Baskets ready for export, woven by women working in one of the small-scale community projects enabled by Kasigau Corridor REDD+ Project, in South-eastern Kenya.
Lore
Def
ranq
F O R E S T S I N A C H A N G I N G C L I M A T E94
9.3 CASE STUDIES
Stakeholder Engagement in the Development of Safeguards in the DRCThe UN-REDD Programme has noted the Democratic Republic of Congo’s participatory approach to developing social and environmental (SE) standards for REDD+ as an example of best practice in stakeholder engagement (UN-REDD Programme 2012a). In developing the SE standards, civil society led consultations in six provinces in order to obtain feedback from different actors, including local communities. In addition, young nationals, foreign graduates, and civil society representatives were recruited to visit hundreds of households in three REDD+ pilot projects, collecting data “to inform the development of the indicators for the standards which were adapted to local realities” (UN-REDD Programme 2012a, 1). A workshop was also organized, bringing together key stakeholders and international experts to produce recommendations for principles, criteria and indicators relating to the national SE standards. In addition to these activities, the DRC created a multi-stakeholder monitoring committee for social and environmental risks and co-benefits to supervise the design of REDD+ standards (UN-REDD Programme 2012a, 2). Currently in progress, a second phase involves the conceptualization and development of the country’s safeguard information system (SIS), as well as the completion of a Strategic Environmental and Social Assessment (SESA). A third phase to pilot the country’s SIS is planned for 2013-2015 (Peskett and Todd 2013, 3).
Demonstrating the Multiple Benefits of REDD+ in Kenya’s Kasigau CorridorThe Kasigau Corridor Project demonstrates the potential of REDD+ projects to produce multiple benefits for the areas in which they operate, and is the first project to be issued Voluntary Emissions Reductions (VERs) under both the Verified Carbon Standard (VCS) and the Climate Community and Biodiversity Standard (CCB). The Corridor protects 200,000 hectares of dryland forest between Kenya’s Tsavo West and Tsavo East National Parks, previously under serious threat from slash and burn agriculture. Thanks to the establishment of a REDD+ project, the highly biodiverse area now provides protected habitat for over 50 species of large mammals, over 300 species of birds, and important populations of endangered species (Code REDD). In addition to protecting the area’s biodiversity, the revenues generated from the sale of the project’s carbon offsets are directly benefitting local people, with revenues split equally between landowners, Wildlife Works, and the community. The community decides independently how to spend its share, based on the social issues it has prioritized (for example, water or education), while Wildlife Works uses its portion of the revenue to develop local, environmentally-friendly employment opportunities (FOEN & CCC 2012, 15). To date, these opportunities have included eco-tourism, “bio-enterprises” (such as soap and aloe production), eco-charcoal production, and an “eco-factory” to manufacture organic, carbon-neutral clothing (FOEN & CCC 2012, 15). The project has also created employment for community forest rangers (FOEN & CCC 2012, 15).
9.4 KEY ISSUES FOR DISCUSSION
The Effectiveness of SafeguardsGiven the fact that existing multilateral and non-governmental safeguards initiatives lack formal coercive mechanisms to ensure that REDD+ projects and programmes are in compliance with their requirements, some have questioned the ability of such initiatives to affect the social and environmental performance of REDD+ on the ground. Many scholars express little confidence in the effectiveness of voluntary REDD+ safeguard initiatives, emphasizing the importance of developing formal institutions and processes, whether within the UNFCCC or established U.N. human rights organizations and bodies (Savaresi 2012, 112-113; Schwarte 2010; Kelly 2010), as well as the need to strengthen institutional capacity and improve governance systems in developing countries (Larson and Petkova 2011; Knox et al. 2011). At the same time, aid and market mechanisms requiring the implementation of safeguards and associated reporting systems as a condition of payment may play an important role in ensuring their effectiveness (McDermott et al. 2012), and some of the existing scholarship on forest certification programmes suggests that a lack of formal enforcement powers is not necessarily synonymous with a lack of influence and authority (Bernstein and Cashore 2007). Do you think market mechanisms are sufficient to ensure the effectiveness of safeguards, or are more formal institutions and processes required?
Ensuring additional social and environmental benefits from REDD+As discussed above, REDD+ has the potential to create multiple benefits in a number of areas, including adaptation, biodiversity conservation, the protection of ecosystem services, and the provision of community and economic benefits (Lee et al. 2011, 4). However, the abundance of standards regarding multiple benefits that might apply to countries’ efforts to operationalise the Cancun safeguards runs the risk of “procedurally overload[ing] Parties’ efforts to meet their international commitments” (Swan and McNally 2011, 37). For example, some have pointed to a degree of incongruence between the safeguards adopted by the FCPF and the SEPC developed by the UN-REDD Programme, which have the potential to create a situation in which “the same activities in the same countries may be subjected to different standards, depending on which institution is providing the funding” (Savaresi 2012, 112; see also: Swan and McNally 2011, 37). To remedy this situation, coordinated international action may be necessary to ensure the effectiveness and maximization of co-benefits (Savaresi 2012, 113). As Savaresi notes, the UNFCCC may look for best practices in this regard for instance the Nagoya Protocol to the Convention on Biological Diversity, which “sets out obligations that build upon the vast body of human rights law concerning public participation and prior informed consent” (2012, 113). It should also be noted that UN-REDD Programme and FCPF do have some shared guidance on Stakeholder Engagement, which addresses some social safeguards (FCPF & UN-REDD Programme 2012). What other potential synergies between existing social and environmental standards or guidance might a future REDD+ regime draw on with respect to safeguards? What are some of the other pros and cons of coordinated action when considering standards and guidance to ensure multiple benefits from REDD+ activities?

F O R E S T S I N A C H A N G I N G C L I M A T E 95
9.5 REFERENCES
Awono, Abdon et al. 2013. “Tenure and participation in local REDD+ projects: Insights from southern Cameroon” Environmental Science & Policy 1-11.
Barnes, Grenville and Sheryl Quail. 2011. “Land Tenure Challenges in Managing Carbon Property Rights to Mitigate Climate Change.” 11:2 Land Tenure Journal 81-103.
Bernstein, Steven and Benjamin Cashore. 2007. “Can Non-State Global Governance Be Legitimate? An Analytical Framework.” 1 Regulation & Governance 347-371.
CCBA. 2008. “Climate, Community and Biodiversity Project Design Standards.” 2nd Edition. CCBA: Arlington, Virginia.
Corbera, Esteve et al. 2011. “Rights to Land, Forests and Carbon in REDD+: Insights from Mexico, Brazil and Costa Rica.” 2 Forests 301-342.
Cotula, Lorenzo and James Mayers. 2009. Tenure in REDD: Starting-Point or Afterthought? London, UK: IIED.
Danielsen, Finn et al. 2011. “At the Heart of REDD+: A Role for Local People in Monitoring Forests?” 4:2 Conservation Letters 158-167.
Doherty, Emma and Heike Schroeder. 2011. “Forest Tenure and Multi-level Governance in Avoiding Deforestation under REDD+.” 11:4 Global Environmental Politics 66-88.
FAO, UNEP and UNDP. 2008. “UN Collaborative Programme on Reducing Emissions from Deforestation and Forest Degradation in Developing Countries.”
Federal Office for the Environment (FOEN), Switzerland & Climate Change Commission (CCC), Philippines. 2012. “Best Practices in Governance and Biodiversity Safeguards for REDD-Plus: Valuing National and Field-Based Experiences
Manila: Federal Office for the Environment, Switzerland & Climate Change Commission, Philippines.
Forest Carbon Partnership Facility (FCPF) and UN-REDD. 2012. “Guidelines on Stakeholder Engagement in REDD+ Readiness with a Focus on the Participation of Indigenous
Gomera, Maxwell, Liz Rihoy and Fred Nelson. 2010. “A Changing Climate for Community Resource Governance: Threats and Opportunities from Climate Change and the Emerging Carbon Market.” In Community Rights, Conservation and Contested Land: The Politics of National Resource Governance in Africa. Edited by Fred Nelson, 293-309. London, UK: Earthscan.
Hatcher, Jeffrey. 2009. “Securing Tenure Rights and Reducing Emissions from Deforestation and Degradation (REDD): Costs and Lessons Learned.” Social Development Paper no. 120. Washington, DC: World Bank.
Hall, Anthony. 2012. Forests and Climate Change: The Social Dimensions of REDD+ in Latin America. Cheltenham, UK; Northampton, USA: Edward Elgar.
Jagger, Pamela et al. 2012. “REDD+ Safeguards in National Policy Discourse and Pilot Projects.” In Analysing REDD+: Challenges and Choices. Edited by Arild Angelsen, 301-316. Bogor, Indonesia: CIFOR.
Kelly, David J. 2010. “The Case for Social Safeguards in a Post-2012 Agreement on REDD.” 6:1 Law, Environment and Development Journal 61-81.
Knox, Anna et al. 2011. “Land Tenure and Payment for Environmental Services: Challenges and Opportunities for REDD+.” 11:2 Land Tenure Journal 17-55.
Larson, Anne M. and Elena Petkova. 2011. “An Introduction to Forest Governance, People and REDD+ in Latin America: Obstacles and Opportunities.” 2:1 Forests 86-111.
Larson, Anne M. et al. 2010. “Rights to Forests and Carbon under REDD+ Initiatives in Latin America.” CIFOR Info Brief no. 33. Bogor, Indonesia: CIFOR.
Larson, Anne M et al. 2013. “Land tenure and REDD+: The good, the bad and the ugly” 23:3 Global Environmental Change 678-689.
Lee, Donna et al. 2011. “Maximizing the Co-Benefits of REDD+ Actions.” Discussion paper for a Regional Expert Workshop supported by the German International Climate Initiative, September 27-29 2011, Subic, Philippines.
Lemaitre, Sophie. 2011. “Indigenous Peoples’ Land Rights and REDD+: A Case Study.” RECIEL 20(2).
Levin, Kelly, Constance McDermott and Benjamin Cashore. 2008. “The Climate Regime as Global Forest Governance: Can Reduced Emissions from Deforestation and Forest Degradation (REDD) Initiatives Pass a ‘Dual Effectiveness’ Test?” 10:3 International Forestry Review 538-549.
Lyster, Rosemary. 2011. “REDD+, Transparency, Participation and Resource Rights: The Role of Law.” 14:2 Environmental Science & Policy 118-126.
McDermott, Constance L. et al. 2012. “Operationalizing Social Safeguards in REDD+: Actors, Interests and Ideas.” 21 Environmental Science and Policy 63-72.
Merger, Eduard, Michael Dutschke and Louis Verchot. 2011. “Options for REDD+ Voluntary Certification to Ensure Net GHG Benefits, Poverty Alleviation, Sustainable Management of Forests and Biodiversity Conservation.” 2 Forests 550.
Miles, Lera and Valerie Kapos. 2008. “Reducing Greenhouse Gas Emissions from Deforestation and Forest Degradation: Global Land-Use Implications.” 320:5882 Science 1454-1455.
Moss, Nicholas and Ruth Nussbaum. 2011. “A Review of Three REDD+ Safeguard Initiatives.” FCPF & UN-REDD.
Murphy, Deborah. 2011. “Safeguards and Multiple Benefits in a REDD+ Mechanism.” Winnipeg, Canada: International
Peskett, Leo and Gernot Brodnig. 2011. Carbon Rights in REDD+. Washington, DC: World Bank and REDD-NET.
Peskett, Leo and Kimberly Todd. 2013. “Putting REDD+ Safeguards and Safeguard Information Systems into Practice.” UN-REDD Programme Policy Brief.

F O R E S T S I N A C H A N G I N G C L I M A T E96
Phelps, Jacob, Edward L. Webb and Arun Agrawal. 2010. “Does REDD+ Threaten to Recentralize Forest Governance?” 328:5976 Science 312-313.
Phelps, J., D.A. Friess and E.L. Webb. 2011. “Win-Win REDD+ Approaches Belie Carbon-Biodiversity Trade-Offs.” 154 Biological Conservation 53-60.
REDD-net. 2011. “Synergies and Trade-Offs between REDD+ and Food Security: Insights from the Trees for Global Benefits
REDD+ SES (REDD+ Social & Environmental Standards). 2012.
-----. 2013. “Role of the Standards.” Accessed 9 February 2013.
ent&view=article&id=91&Itemid=136
Ribot, Jesse C. and Anne M. Larson. 2011. “Affirmative Policy on an Uneven Policy Field: Implications for REDD.” In Forests and People: Property, Governance, and Human Rights. Edited by Thomas Sikor and Johannes Stahl, 67-84. London, UK: Earthscan.
Rodrigues de Aquino, André, André Aasrud & Leticia Guimarães. 2011. “Can Forest Carbon Finance Influence Land Tenure Security in Project Areas? Preliminary Lessons from Projects in Niger and Kenya.” 8 Advances in Agroforestry 231-246.
Savaresi, Annalisa. 2012. “The Human Rights Dimension of REDD.” 21:2 Review of European Community and International Environmental Law 102-113.
Schwarte, Christoph. 2010. “Social Safeguards in REDD: A Review of Possible Mechanisms to Protect the Rights and Interests of Indigenous and Forest-Dependent Communities in a Future System for REDD.” 6:1 McGill Journal of Sustainable Development Law & Policy 57-80.
Seymour, Frances. 2009. “Forests, Climate Change and Human Rights: Managing Risks and Trade-Offs.” In Human Rights and Climate Change. Edited by Stephen Humphreys, 207-237. Cambridge, UK: Cambridge University Press.
Seymour, Frances and Arild Angelsen. 2012. “Summary and Conclusions: REDD+ without Regrets.” In Analysing REDD+: Challenges and Choices. Edited by Arild Angelsen, 317-334. Bogor, Indonesia: CIFOR.
Sikor, Thomas et al. 2010. “REDD-Plus, Forest People’s Rights and Nested Climate Governance.” 20:3 Global Environmental Change 423-425.
Swan, Steve and Richard McNally. 2011. “High-Biodiversity REDD+: Operationalising Safeguards and Delivering Environmental Co-Benefits.” SNV – The Netherlands Development Organisation.
Safeguards for Policy Approaches and Positive Incentives on Issues Relating to Reducing Emissions from Deforestation and Forest Degradation in Developing Countries; and the Role of Conservation, Sustainable Management of Forests and Enhancement of Forest Carbon Stocks in Developing Countries. In Report of the Conference of the Parties on its sixteenth session, Addendum, Part Two: Action taken by the
Outcome of the Work of the Ad Hoc Working Group on Long-term Cooperative Action under the Convention. In Report of the Conference of the Parties on its sixteenth session, Addendum, Part Two: Action taken by the
providing information on how safeguards are addressed & respected & modalities relating to forest reference emissions
CP.16
Action: Outcome of the work of the Ad Hoc Working Group on Long-term Cooperative Action under the Convention. In Report of the Conference of the Parties on its Sixteenth Session, Addendum, Part Two: Action taken by the
reporting and verifying (advance unedited decision).
finance to progress the full implementation of the activities
unedited decision).
UN-REDD Programme. 2010. “Update on Social and Environmental Principles.” 5th Policy Board Meeting.
UN-REDD Programme. 2011. Participatory Governance Assessments for REDD+. Planning Document: 2011-
-----. 2012a. “Including Stakeholders in the Development of Social and Environmental Standards for REDD+ in the Democratic Republic of Congo (DRC).” Geneva, Switzerland: UN-REDD Programme Secretariat.
-----. 2012b. “UN-REDD Programme Social and Environmental Principles and Criteria.” UN-REDD Programme Eighth Policy
World Bank Operational Manual. Operational Policies and Bank

F O R E S T S I N A C H A N G I N G C L I M A T E 97
M O D U L E 10The cost of REDD+: concepts, methods and approaches
10.1 FUNDAMENTALS
There is growing consensus that REDD+ could be vital in meeting GHG reduction targets as it may offer significant amounts14 of low-cost, time-effective emissions reductions (Eliasch 2008; Stern 2006). Reducing emissions from deforestation itself comes at a cost, and protecting forest also implies foregone revenues from timber, crops and livestock. In the context of REDD+, countries have agreed to “collectively slow and reverse forest cover and carbon loss”, and to do this “ in the context of the provision of adequate and predictable support to developing country Parties” (UNFCCC COP 2011; UNFCCC COP 2013). Within countries, those that suffer direct economic loss by not engaging in land use change will be compensated for the direct economic loss (Angelsen et al. 2012). Each country will also have the option of implementing REDD+ through diverse interventions, including PES schemes, incentive-based conservation arrangements, creation of marketable products (see module 11), and command-and control type policies.
10.2 TOOLS, INITIATIVES AND METHODOLOGIES
10.2.1 Identifying the costs of REDD+ costsREDD+ costs can be grouped into three general categories opportunity cost, implementation costs, and transaction costs.14
The forgone benefits that deforestation would have generated to livelihoods. It may be defined as the net income per hectare per year or net present value15 (NPV) sacrificed as a result of REDD+; by not converting land to agriculture or logging as usual. Hence the economic revenues sacrificed from not continuing with ‘business as usual’. Likewise, avoiding degradation
14 Forestry, as defined by the IPCC, produces around 17 per cent of global emissions, making it the third largest source of greenhouse gas emissions. In the tropics, it is estimated the current annual emissions from deforestation are comparable to the total annual CO2 emissions of the US or China. (Eliasch 2008)
15 Net Present Value: Compares the value of a dollar today to the value of that same dollar in the future.
by foregoing fuel-wood collection and grazing of animals or by using selective logging, means foregoing benefits.
the opportunity costs of managing forestland in a more sustainable way is likely to be the largest single cost component of any REDD+ scheme, assuming it is paid (Olsen et al. 2009; Stern 2007).
The magnitude of opportunity costs of the forestland gives a fair estimate of the pressures for deforestation in certain area (Pagiola et al. 2009). The opportunity cost of forestland is high when it has potential for lucrative agriculture like Palm Oil, and low or even negative when it only has potential for marginal activities like pastures for low intensity cattle ranching. REDD+ is more likely to reduce deforestation in marginal sites with low potential for lucrative agriculture. Nevertheless, low opportunity costs does not necessarily imply that REDD+ activities will be low cost, as REDD+ activities often take place in areas where there are the greatest challenges in forest policy, administration and monitoring (Eliasch 2008).
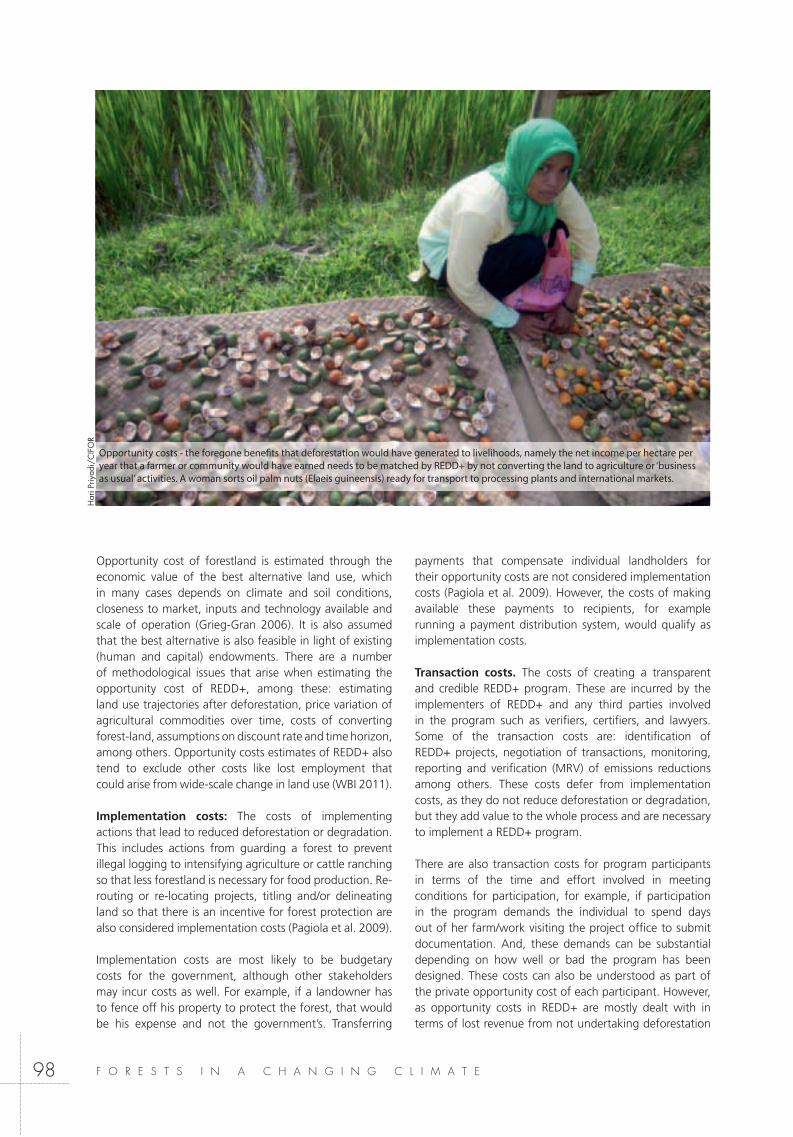
F O R E S T S I N A C H A N G I N G C L I M A T E98
Opportunity cost of forestland is estimated through the economic value of the best alternative land use, which in many cases depends on climate and soil conditions, closeness to market, inputs and technology available and scale of operation (Grieg-Gran 2006). It is also assumed that the best alternative is also feasible in light of existing (human and capital) endowments. There are a number of methodological issues that arise when estimating the opportunity cost of REDD+, among these: estimating land use trajectories after deforestation, price variation of agricultural commodities over time, costs of converting forest-land, assumptions on discount rate and time horizon, among others. Opportunity costs estimates of REDD+ also tend to exclude other costs like lost employment that could arise from wide-scale change in land use (WBI 2011).
Implementation costs: The costs of implementing actions that lead to reduced deforestation or degradation. This includes actions from guarding a forest to prevent illegal logging to intensifying agriculture or cattle ranching so that less forestland is necessary for food production. Re-
land so that there is an incentive for forest protection are also considered implementation costs (Pagiola et al. 2009).
Implementation costs are most likely to be budgetary costs for the government, although other stakeholders may incur costs as well. For example, if a landowner has to fence off his property to protect the forest, that would be his expense and not the government’s. Transferring
payments that compensate individual landholders for their opportunity costs are not considered implementation costs (Pagiola et al. 2009). However, the costs of making available these payments to recipients, for example running a payment distribution system, would qualify as implementation costs.
Transaction costs. The costs of creating a transparent and credible REDD+ program. These are incurred by the implementers of REDD+ and any third parties involved in the program such as verifiers, certifiers, and lawyers. Some of the transaction costs are: identification of REDD+ projects, negotiation of transactions, monitoring, reporting and verification (MRV) of emissions reductions among others. These costs defer from implementation costs, as they do not reduce deforestation or degradation, but they add value to the whole process and are necessary to implement a REDD+ program.
There are also transaction costs for program participants in terms of the time and effort involved in meeting conditions for participation, for example, if participation in the program demands the individual to spend days
documentation. And, these demands can be substantial depending on how well or bad the program has been designed. These costs can also be understood as part of the private opportunity cost of each participant. However, as opportunity costs in REDD+ are mostly dealt with in terms of lost revenue from not undertaking deforestation
Har
i Priy
adi/
CIF
OR
Opportunity costs - the foregone benefits that deforestation would have generated to livelihoods, namely the net income per hectare per year that a farmer or community would have earned needs to be matched by REDD+ by not converting the land to agriculture or ‘business as usual’ activities. A woman sorts oil palm nuts (Elaeis guineensis) ready for transport to processing plants and international markets.

F O R E S T S I N A C H A N G I N G C L I M A T E 99
or degradation activities it may be more convenient to include these costs as part of the transaction cost that individuals should incur to be part of the program.
Transaction costs have been considered to be more of a fixed than variable cost. (Pagiola et al. 2009). There are
2e and will depend on how successfully a country or program reduces deforestation. A REDD+ program that delivers high volumes of emissions reductions will most likely have lower transaction cost per tCO2e.
Little information is known on the magnitude of transaction and implementation costs of REDD+. While Antinori and others (2007) found the average transaction
tCO2e, others like Boucher (2008) and Grieg-Gran (2006) respectively estimated transaction and implementation
2 (or 20 percent) and 5 to 20 percent of the opportunity costs.
10.2.2 Estimating the costs of REDD+
Most cost estimates of REDD+ follow a ‘bottom-up’
2e is estimated using detailed information on particular alternative land uses and carbon density of the forestland. (WBI 2011) Although costs of REDD+ can also be estimated using ‘top-down’ models, these models take into account commodity market interactions considering market feedbacks of demand and supply (Angelsen 2008). Feedbacks in REDD+ occur when reductions in deforestation lower timber harvests and available land for agriculture, consequently lowering growth in supply of agricultural land to produce commodities and timber, which will raise their prices, thereby raising the incentives to deforest. These feedbacks raise the costs of implementing a REDD+ program. (Angelsen, 2008)
Estimates on opportunity cost for REDD+ can be divided into three distinct groups:
(bottom-up): This model uses a single
approach essentially ignores carbon density variation from region to region but makes it possible to use data from many more regions. This method was carried out Grieg-Gran 2006 and later used by the Stern Review (Boucher, 2008).
(top-down): Based on economic models, they simulate the dynamics of the world’s economy to estimate supply of REDD+ services. These models recognize that the cost of reducing emissions depends on the depth of the reductions. Instead of using point estimates of costs, they provide curves, which are convex, acknowledging the fact that cost of emissions reductions will start out low and increase with the amount of reduction. (Boucher, 2008)
(bottom-up): Based on local-empirical models of detailed surveys in a
the particular region studied, and the division of per-area opportunity cost by carbon density gives the opportunity costs on a per ton on basis. (Pagiola, 2009; Boucher, 2008)
When generating national-level analysis of REDD+ opportunity costs, the Regional Empirical models are recommended in the absence of national models. Opportunity cost estimates will be based on local information and will easily fit within frameworks developed by the IPCC for land use change and national inventories of greenhouse gases (UN-REDD Programme 2011). Reviews of empirical work suggests that the costs of REDD+ range from US$2-10 per ton CO2e, including implementation and transaction costs (Olsen et al. 2009).
Figure 10.1. The Opportunity cost of REDDSource: WB; Boucher 2008
t/CO
2e
Area-based Global modelsRegional empirical
$18$16
$14$12
$10$8
$6$4
$2
$0

F O R E S T S I N A C H A N G I N G C L I M A T E100
Example 1: Estimating the opportunity cost of REDD+ with an Empirical Model To calculate the opportunity cost of REDD+ in a regional empirical model both the opportunity cost and the carbon density of the forestland are needed. Also, deforestation reference levels are necessary if estimating the cost of REDD+ in a non-planned16 deforestation scenario. If no regulation were limiting deforestation the income received by the ‘landowner’ for protecting forestland has to be equal or greater than the income received from the alternative best use of the forestland.
In this example, Pagiola (2006) assumes that avoiding the loss of 1 ha of forestland prevents 250tC from being emitted, but the alternative land use has a stock of 20tC, so the net emissions avoided by protecting 1 ha of forestland is 230 tC. Assuming that the landowner foregoes an income of $30/yr by conserving his forestland and not turning it into pastures, although conserving the forestland provides $10/yr from other products, the net opportunity cost of that forestland in this case is $20/yr. Because land must be maintained under forest for a long time, his annual opportunity cost must be converted to present value terms. Using a 30-year time horizon and a 10 percent discount rate, the total opportunity cost would be $209/ha for this time period. To convert the opportunity cost to $/tC, the opportunity cost must be divided by net emissions, in this case $209/230tC, to obtain $0.91/tC or, equivalently, $0.25/tCO2e.17 Assuming the landowner does not bare any of the transaction or implementation costs, there is no leakage, and the forestland is protected in a ‘planned deforestation’ landscape, the landowner would at least need to receive $0.91/tC or its equivalent $20/ha.
However, many REDD+ programs may be implemented in unplanned deforestation scenarios, in which case the reference level is necessary to estimate REDD+ in a carbon basis. In unplanned deforestation, REDD+ will only receive carbon credits if it reduces deforestation below the reference levels.
Global models yield higher opportunity costs for REDD+18 as they take into consideration that the cost of emissions reductions depend on the depth of the reductions. While area-based and regional empirical models do not consider rising prices of emissions reduction with depth of reduction.
10.2.3 Components necessary for implementation of REDD+
The cost to reduce emissions from deforestation is considered a small fraction of the possible cost of inaction.
16 Planned vs. un-planned deforestation: Planned deforestation assumes with certainty that a particular area will be deforested while un-planned deforestation assumes deforestation will occur at the reference levels.
17 One ton of carbon equivalent to 3.67 tons of C0218 The ‘Global models’ and the ‘Area-based’ correspond to a 46 percent
reduction in global deforestation; while the regional empirical models vary and in general is not known. The bases of the opportunity cost estimates are as follows: for ‘Regional empirical’ 29 studies; ‘Area-based’ and ‘Global models’ three studies. (Boucher 2008)
The global cost of climate change caused by deforestation could reach $1 trillion a year by 2100 (Eliasch 2008). Halving deforestation by 2030 could reach anywhere from USD 17 - 33 billion per annum (Eliasch 2008) or even lower according to Stern (2007) and Grieg-Gran (2006) which estimate the cost at about $5-10 billion per year. Curbing deforestation, therefore, could offer one of the most cost-effective and fastest means of mitigating GHG emissions (Stern 2007).
Since the foundations of REDD+ were laid in COP 13, plenty of progress has been made in developing capacity to implement such a mechanism. Since then many tropical forest countries are moving forward with REDD+ readiness some have initiated demonstration projects and other larger-scale activity (PwC 2011). The new VCS Jurisdictional and Nested REDD+ (JNR) approach is guiding governments and larger scale development of REDD+ programs, as well as establishing a clear pathway for existing and new projects to be integrated (or ‘nested’) within broader jurisdictional programs that could deliver compliance grade emissions reductions (VCS 2013). Countries like Costa Rica and Chile have entered into agreements with the Verified Carbon Standard to develop nesting strategies for previous conservation efforts as well as to deliver REDD+ within jurisdictional levels.
Creating infrastructure and building capacity for REDD+ will take time and investment. Developing MRV systems, clarifying land tenure and strengthening institutional capacities for law enforcement are among the actions that countries will need to fulfill before being able to deliver REDD+ credits. One study estimates the costs of capacity building for 40 forest nations over a five-year period to be as much as $4 billion (Hoare et al. 2008). While Stern (2007) suggests that capacity building to halve deforestation from 2005-2030 may increase the cost from $12m to $93m per annum.
A number of studies have estimated the cost to the global economy of reducing emissions from deforestation. Stern (2007) estimates the opportunity cost of forest protection in the 8 countries responsible for 70 per cent of emissions from land use change could be around $5 -10 billion per
2e. However, there will most likely also be rising opportunity costs in terms of national GDP as countries forego added value from related activities, including processing agricultural and timber products. Halving emissions from deforestation between 2005 and 2030, corresponding to a reduction in emissions of 1.7 to 2.5 billion tons of carbon dioxide equivalent (tCO2e), would require US$17 to 28 billion per year, with payments
2e (Kindermann et al. 2008). Preliminary results from UN-REDD Programme projects appear to confirm these values as the “floor”, if REDD+ were to have a chance to influence rural development paths. These estimates were derived using three global models assessing the opportunity costs of reducing deforestation (Pagiola et al. 2009). Conservative assessments show that $5 billion

F O R E S T S I N A C H A N G I N G C L I M A T E 101
Figure 10.2. Marginal Abatement Curve
Aerial view of the Amazon Rainforest, near - Manaus, Amazonia, Brazil
Nei
l Pal
mer
/CIA
T/C
IFO
R
of annual funding could reduce deforestation emissions in the year 2020 by over 20 percent, and $20 billion per year could reduce deforestation by 50 percent. (Boucher 2008)
10.2.4 Costs curves of REDD+ interventions
Costs associated with the reduction of greenhouse gas (GHG) emissions from REDD+ are shown graphically through the marginal abatement cost (MAC) curve. The REDD+ marginal abatement curve demonstrates the incremental cost of avoiding one extra emissions of CO2e through forestland conservation. The curve implies that there is no single cost-value, but that alternative levels of emissions reductions are associated with different costs. For example, while some emissions from avoiding deforestation can be done inexpensively, others will be more costly.
The MAC curves slope upwards, showing that for small emissions reductions, costs can be kept low. For example, protecting the lands with the lowest opportunity cost may be done at a low cost and once those low opportunity cost forestlands are protected, the marginal costs of emission reductions will rise as emission reductions will then need to be done by protecting forestland with a higher opportunity cost. Hence, as more abatement is done the more expensive it becomes. For example, cost estimates of reducing deforestation more than double in moving from 94% to 100% protection of the Brazilian Amazon forest,
because of the high agriculture potential of 6% of the lands (Nepstad et al. 2007).
Both the public and private sector have interests in REDD+ cost curves as they reveal the cost of reducing emissions across an array of forestland. According to the graph (see
first approach REDD+ in smallholder agriculture land
Pric
e ($
/tCO
2)
Abatement (MtCO2/year)
MAC
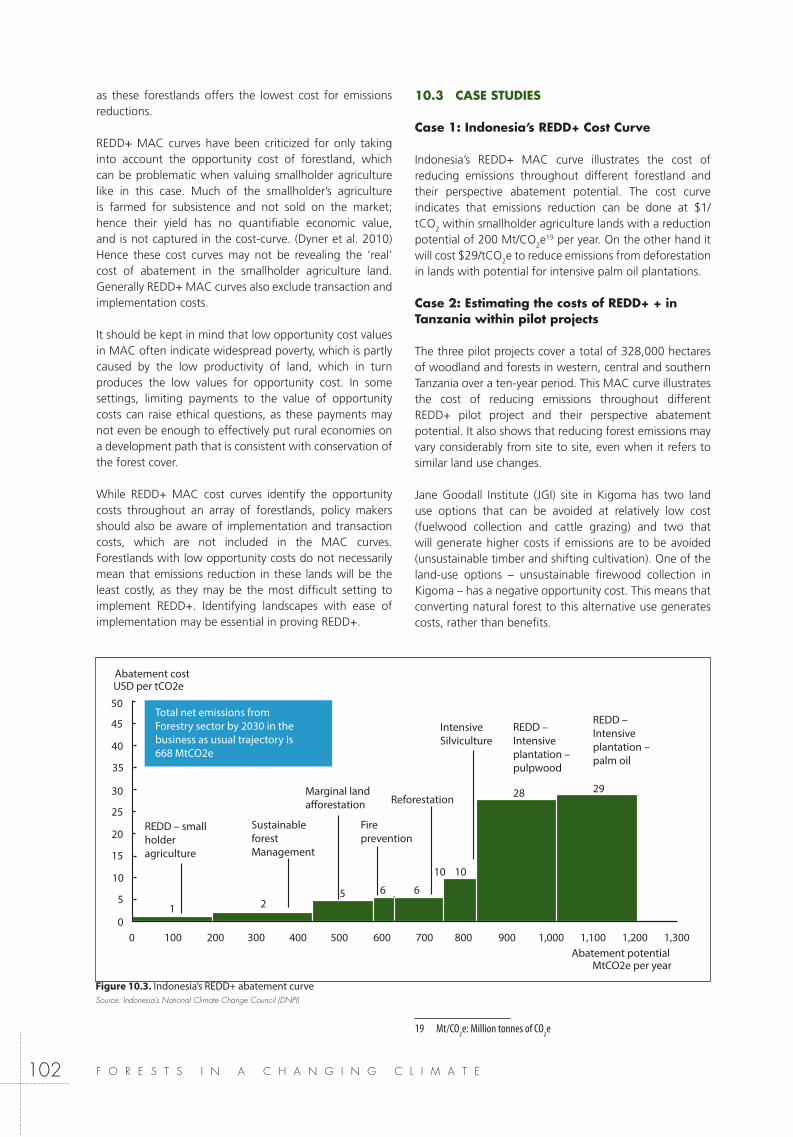
F O R E S T S I N A C H A N G I N G C L I M A T E102
as these forestlands offers the lowest cost for emissions reductions.
REDD+ MAC curves have been criticized for only taking into account the opportunity cost of forestland, which can be problematic when valuing smallholder agriculture like in this case. Much of the smallholder’s agriculture is farmed for subsistence and not sold on the market; hence their yield has no quantifiable economic value, and is not captured in the cost-curve. (Dyner et al. 2010) Hence these cost curves may not be revealing the ‘real’ cost of abatement in the smallholder agriculture land. Generally REDD+ MAC curves also exclude transaction and implementation costs.
It should be kept in mind that low opportunity cost values in MAC often indicate widespread poverty, which is partly caused by the low productivity of land, which in turn produces the low values for opportunity cost. In some settings, limiting payments to the value of opportunity costs can raise ethical questions, as these payments may not even be enough to effectively put rural economies on a development path that is consistent with conservation of the forest cover.
While REDD+ MAC cost curves identify the opportunity costs throughout an array of forestlands, policy makers should also be aware of implementation and transaction costs, which are not included in the MAC curves. Forestlands with low opportunity costs do not necessarily mean that emissions reduction in these lands will be the least costly, as they may be the most difficult setting to implement REDD+. Identifying landscapes with ease of implementation may be essential in proving REDD+.
10.3 CASE STUDIES
Case 1: Indonesia’s REDD+ Cost Curve
Indonesia’s REDD+ MAC curve illustrates the cost of reducing emissions throughout different forestland and their perspective abatement potential. The cost curve
tCO2 within smallholder agriculture lands with a reduction
2e19 per year. On the other hand it
2e to reduce emissions from deforestation in lands with potential for intensive palm oil plantations.
Case 2: Estimating the costs of REDD+ + in Tanzania within pilot projects
The three pilot projects cover a total of 328,000 hectares of woodland and forests in western, central and southern Tanzania over a ten-year period. This MAC curve illustrates the cost of reducing emissions throughout different REDD+ pilot project and their perspective abatement potential. It also shows that reducing forest emissions may vary considerably from site to site, even when it refers to similar land use changes.
Jane Goodall Institute (JGI) site in Kigoma has two land use options that can be avoided at relatively low cost (fuelwood collection and cattle grazing) and two that will generate higher costs if emissions are to be avoided (unsustainable timber and shifting cultivation). One of the land-use options – unsustainable firewood collection in Kigoma – has a negative opportunity cost. This means that converting natural forest to this alternative use generates costs, rather than benefits.
19 Mt/CO2e: Million tonnes of CO2e
Figure 10.3. Indonesia’s REDD+ abatement curveSource: Indonesia’s National Climate Change Council (DNPI)
50REDD –Intensiveplantation –palm oil
REDD –Intensiveplantation –pulpwood
IntensiveSilviculture
Marginal landafforestation Reforestation
Fireprevention
REDD – smallholder agriculture
Abatement potential
Abatement costUSD per tCO2e
MtCO2e per year
SustainableforestManagement
Total net emissions fromForestry sector by 2030 in thebusiness as usual trajectory is 668 MtCO2e
200 300 400 500 600 700 800 900 1,000 1,100 1,200 1,30010000
5
10
15
20
25
30
35
40
45
1 25 6 6
10 10
28 29
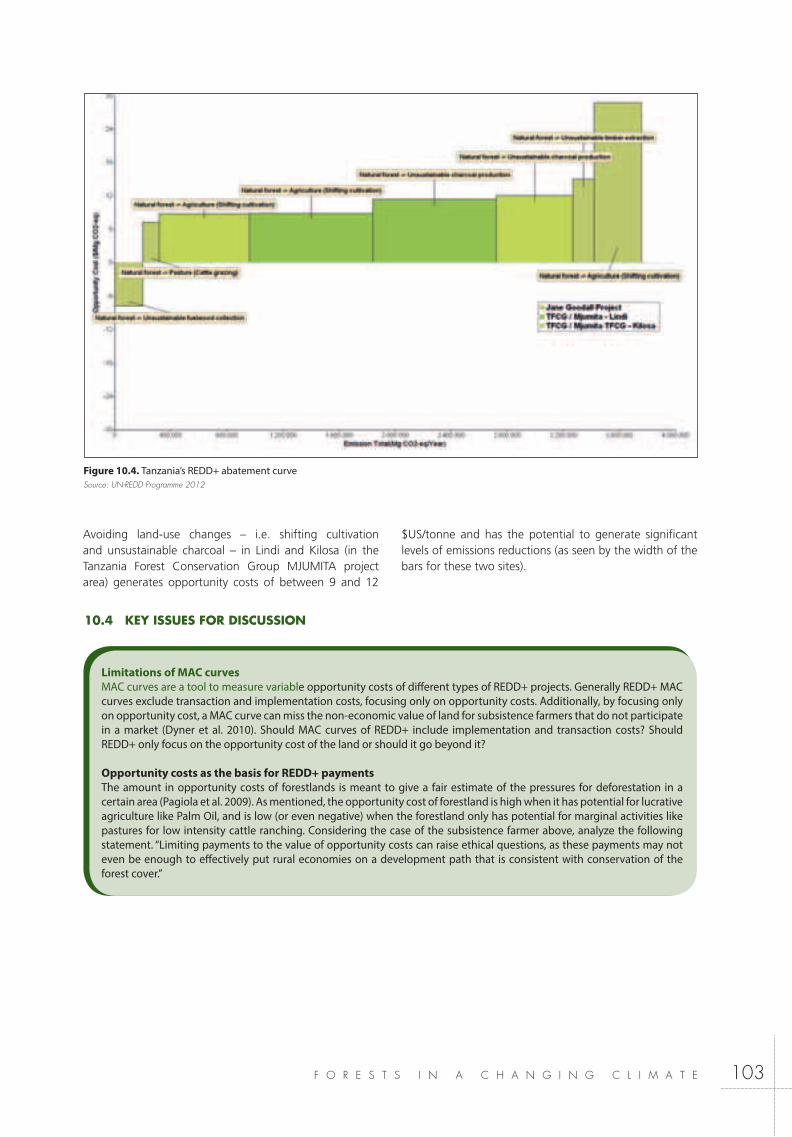
F O R E S T S I N A C H A N G I N G C L I M A T E 103
10.4 KEY ISSUES FOR DISCUSSION
Figure 10.4. Tanzania’s REDD+ abatement curveSource: UN-REDD Programme 2012
Limitations of MAC curvesMAC curves are a tool to measure variable opportunity costs of different types of REDD+ projects. Generally REDD+ MAC curves exclude transaction and implementation costs, focusing only on opportunity costs. Additionally, by focusing only on opportunity cost, a MAC curve can miss the non-economic value of land for subsistence farmers that do not participate in a market (Dyner et al. 2010). Should MAC curves of REDD+ include implementation and transaction costs? Should REDD+ only focus on the opportunity cost of the land or should it go beyond it?
Opportunity costs as the basis for REDD+ paymentsThe amount in opportunity costs of forestlands is meant to give a fair estimate of the pressures for deforestation in a certain area (Pagiola et al. 2009). As mentioned, the opportunity cost of forestland is high when it has potential for lucrative agriculture like Palm Oil, and is low (or even negative) when the forestland only has potential for marginal activities like pastures for low intensity cattle ranching. Considering the case of the subsistence farmer above, analyze the following statement. “Limiting payments to the value of opportunity costs can raise ethical questions, as these payments may not even be enough to effectively put rural economies on a development path that is consistent with conservation of the forest cover.”
Avoiding land-use changes – i.e. shifting cultivation and unsustainable charcoal – in Lindi and Kilosa (in the Tanzania Forest Conservation Group MJUMITA project area) generates opportunity costs of between 9 and 12
levels of emissions reductions (as seen by the width of the bars for these two sites).
F O R E S T S I N A C H A N G I N G C L I M A T E104
10.5 REFERENCES
Angelsen, A. (ed.) 2008 Moving ahead with REDD: Issues, options and implications. CIFOR, Bogor, Indonesia.
Angelsen, A., Brockhaus, M., Sunderlin, W.D. and Verchot, L.V. (eds) 2012 Analysing REDD+: Challenges and choices. CIFOR, Bogor, Indonesia.
Antinori, C., and J. Sathaye. 2007. Assessing transaction costs of project-based greenhouse gas emissions trading. Berkeley, CA: Lawrence Berkeley National Laboratory.
Boucher, D.H. 2008a. Estimating the cost and potential of reducing emissions from deforestation. UCS Tropical Forests and Climate Briefing No. 1. Washington, DC: Union of Concerned Scientists.
Boucher, D.H. 2008b. Filling the REDD+ basket: Complementary financing approaches. UCS Tropical Forests and Climate Briefing No. 3. Washington, DC: Union of Concerned Scientists.
Eliasch, J. 2008. Climate change: Financing global forests (the Eliasch Review). London: Office of Climate Change, Government of the United Kingdom.
Review of the economics of climate change. London: International Institute for Environment and Development.
Hoare, A., Legge, T., Nussbaum, R., and Saunders, J. 2008. Estimating the cost of building capacity in rainforest nations to allow them to participate in a global REDD+ mechanism. Report produced for the Eliasch Review by Chatham House and ProForest with input from Overseas Development Institute and EcoSecurities
Indonesia’s National Climate Change Council (DNPI). (2010) “Indonesia’s green house gas abatement curve”. August 2010
Nepstad, D., Soares-Filho, B., Merry, F., Moutinho, P., Rodrigues, H.O., Bowman, S., Schwartzman, S., Almeida, O. and Rivero, S. 2007. The costs and benefits of reducing carbon emissions from deforestation and forest degradation in the Brazilian Amazon. Woods Hole Research Centre, Falmouth, MA, USA.
Kindermann, G., M. Obersteiner, E. Rametsteiner, and I. McCallum. 2006. Predicting the deforestation trend under different carbon prices. Laxenburg, Austria: International Institute for Applied Systems Analysis (IIASA).
Kindermann, G., M. Obersteiner, B. Sohngen, J. Sathaye, K. Andrasko, E. Rametsteiner, B. Schlamadinger, S. Wunder, and R. Beach. 2008. Global cost estimates of reducing carbon emissions through avoided deforestation. Proceedings of the National Academy of Sciences 105:10302-10307.
Olsen, N. and J. Bishop (2009). The Financial Costs of REDD: Evidence from Brazil and Indonesia. Gland, Switzerland: IUCN. 64pp.
Pagiola, S. and Bosquet, B. 2009. Estimating the costs of REDD+ at the country level. Version 1.0 – 24 February 2009. Forest Carbon Partnership Facility, World Bank.
Stern, N. 2006. The economics of climate change (the Stern Review). Cambridge, UK: Cambridge University Press.
World Bank Institute. 2011. Estimating the opportunity costs of REDD+ – A training manual v.1.3
Outcome of the Work of the Ad Hoc Working Group on Long-term Cooperative Action under the Convention. In Report of the Conference of the Parties on its sixteenth session, Addendum, Part Two: Action taken by the
finance to progress the full implementation of the activities
unedited decision).
UN-REDD Programme. 2012. Estimating the costs of REDD+ in Tanzania
White, D., Feb 2013. Estimating the Opportunity Costs of REDD+, A Training Manual. World Bank Inistitute . From:

F O R E S T S I N A C H A N G I N G C L I M A T E 105
11.1 FUNDAMENTALS
M O D U L E 11Funding for REDD+
Public donor funding channeled through multilateral institutions or bilateral partnerships is the main source of international climate finance for REDD+. Commitments from donor countries for REDD+ pledged during the 2010 - 2012 period totaled $4.5 billion (PwC 2011), with supporting capacity building or demonstration projects. This is far less than the $40 billion needed yearly to halve deforestation by 2030 (UNEP 2011). Private finance is expected to be a significant part of REDD+, although little of it has been raised to date.
11.2 INITIATIVES, TOOLS & METHODOLOGIES
11.2.1 International sources for climate finance Public donor funding is the main source of international climate finance for REDD+ (REDD+ Partnership 2012). For the most part, these funds are being deployed in capacity building, and in strengthening legislation to sustain, implement and deliver credible REDD+. MRV, tenure and governance of the forest carbon stock have also become a priority of public funding towards REDD+ (Nakhooda et al. 2011).
Norway is currently REDD+’s largest donor, seen by many as a leader in the development and implementation of REDD+ (PwC 2011). The Norwegian International Climate and Forest Initiative (NICFI) is Norway’s main REDD+ fund, currently the biggest development fund for REDD+. This fund contributes to several multilateral and bilateral initiatives including the UN-REDD Programme, the Brazilian Amazon Fund, Congo Basin Forest Fund, Forest Investment Program, and the Forest Carbon Partnership Facility. By November 2012, this fund had pledged $1.6 billion to REDD+ and disbursed $283 million (NICIF 2013).
Other major donors include Australia, UK, USA and Germany.
Table 11.1 Main sources of funding for REDD
Phase Activities Principal sources of funding
I REDD+ readiness, capacity building and planning
Public funds largely channeled through multilateral funds and bilateral agreements
II Strengthening policy reforms and demonstration projects
Public funds through bilateral agreements and some multilaterals, and some private finance, often with public support
III Deployment at scale and pay for results
Public funds through bilateral agreements and, potentially, the Green Climate Fund; private investment & carbon markets increasing over time
Source: PwC 2011
The vast majority of REDD+ funding was pledged during the years 2010-2012 (REDD+ Partnership 2012), although this may change with time as donor and domestic funds are committed over time.
Seven major bilateral and multilateral funding initiatives were recently created to support REDD+ (Nakhooda et al. 2011). Most of the funds delivered in REDD+ have been

F O R E S T S I N A C H A N G I N G C L I M A T E106
towards readiness (phase I), as countries are still building capacity and planning how they will engage in such a mechanism.
ltilateral Funds
Focused on readiness (Phases 1 and 2)
is the United Nations collaborative initiative on (REDD) in developing countries targeting phases 1 and 2. It is a multi-donor fund with the intention of helping reduce global emissions from deforestation and forest degradation in countries with significant arrays of tropical forest developing countries
by supporting national governments to i) prepare and ii) implement national REDD-plus strategies (Nakhooda et al. 2011). It was established in 2008 by three UN Agencies: UNEP, UNDP and FAO. To date the fund supports efforts in 50 partner countries from Africa, Asia-Pacific and Latin America. By July 2012, total funding for these two streams of support to countries totaled US$117.6 million (UN REDD+ 2013).
part of the Forest Carbon Partnership Facility (FCPF), a World Bank pilot program that prepares REDD+ countries by adopting national strategies to develop reference levels, design MRV systems, and set REDD+ national management arrangements and proper safeguards. By February 2013, 15 public donors had committed $230 million, each having provided at least US$5 million (FCPF 2013).
(FIP) is a fund of the World Bank within the framework of the Climate Investment Funds (CIF). It became operational in 2009, with the objective of directing finance to reduce deforestation and degradation as well as to promote sustainable forest management in a small number of pilot countries. Among these are Brazil, Burkina Faso, Democratic Republic of Congo, Ghana, Indonesia, Laos, Mexico and Peru. The total amount pledged to the fund as of February 2013 was $578 million (FIP 2013)
(CBFF) is managed by the African Development Bank and aims to promote sustainable forest management, livelihood and economic development, and capacity building for REDD+ activities in the Congo Basin Region. In November 2012, the CBFF had pledged a total of $50 million and had disbursed a total of $21 million. (Climate Funds Update 2013)
Focused on payment upon results (Phase 3*)
s part of the Forest Carbon Partnership Facility (FCPF), a World Bank pilot program that provides payments for verified emissions reductions in countries
Figure 11.2. Distribution of REDD+ financing over timeSource: REDD+ Partnership 2012
Figure 11.1. Amounts pledged and/or deposited by main donors in $USD millionsSource: Replicated from Climate Finance Update 2013 – CSV download
Domestic Outgoing
Mill
ions
of U
SD
2006 2007 2008 2009 2010 2011 2012 2013 2014 2015 2016 2017
1,500
1,000
500
0
Norway
Australia
UK
USA
Germany
European Comission
Japan
Others
289
191
137138
82 31
295
3069

F O R E S T S I N A C H A N G I N G C L I M A T E 107
that have made considerable progress towards REDD+ readiness. About five REDD+ Country Participants will have qualified for the Carbon Fund based on a progress assessment by the FCPF Participants Committee. By February 2013 a total of US$205 million had been committed or pledged to The Carbon Fund by ten public and private contributors, each having provided at least US$5 million (FCPF 2013).
is managed by the Brazilian Development Bank and helps prevent, monitor and combat deforestation, as well as to promote sustainable use of forests in the Amazon Biome. (Nakhooda et al. 2011) This fund is currently REDD’s biggest fund with over $1 billion pledged, and with Norway as the biggest donor. By February 2013 the fund has approved almost $205 million in funding and disbursed $56 million (Climate Funds Update 2013).
(ICCTF) was created in 2009 by the Indonesian government. REDD+ is an important component of the ICCTF. As of November 2011, however, only $1.25 million has been approved for a single forestry project to enhance carbon sequestration and mitigation of greenhouse gas emissions (Nakhooda et al. 2011).
avoided deforestation although they may pay for some ‘readiness’ according to context.
Bilateral FundsBilateral funding through partnerships with forest nations is likely to play an increased role in REDD+ support. Partnerships often allow funds to flow more rapidly to partner governments’ programs and projects. Partnerships could accelerate the implementation of REDD+ by focusing on results-based funding and strategic priorities. These partnerships could also provide greater flexibility around the milestones and performance targets making them more dynamic than multilateral agreements (PWC 2011).
International Forest Carbon Initiative (IFCI) is Australia’s bilateral fund for REDD. The program helps Indonesia and Papua New Guinea to build their REDD+ readiness. The fund directly supports MRV programs, demonstrational REDD+ payment mechanisms, and sustainable market-based approaches towards REDD+. Australia has pledged to the fund USD $278 million (Australian Government 2013) and has approved the disbursement of USD $158 million (Climate Funds Updates 2013).
International Forest Climate Initiative (IFCI) is Germany’s fund, which has been directed through bilateral channels to national trust funds in Brazil, Guyana and Indonesia on a payment for performance basis in the implementation of REDD+ programs. Germany is one of the only countries to commit long-term finance for the implementation of REDD+ programs. Between 2008 and 2011, Germany
has approved and disbursed $103 million for 29 REDD+ projects (Nakhooda et al. 2011).
11.2.2 The complexities of carbon creditsA REDD+ carbon credit represents the reduction of one tonne of Carbon Dioxide equivalent (CO
2e) obtained through the avoidance of emissions from the reduction of deforestation, degradation or enhancement of carbon stocks of forestland in developing countries. Reducing deforestation and forest degradation helps mitigate global warming since forests store a large amount of carbon in their biomass20 and also facilitate the bio-sequestration of atmospheric CO2. Reducing deforestation has been recognized as cost- and time-effective way to combat climate change at relevant scale (Stern 2007).
In order to receive REDD+ credits the country, programme or project must verify that emissions reductions from
by forestland enhancement are additional. In other words,
are done with the intention of producing emissions reductions. REDD+ activities must prove that the lowered emissions is not the business as usual (BAU) scenario and that carbon finance would be required for the activity to be commercially viable.
Emissions reductions from REDD+ = actual emissions (or net change in sequestration) – reference level (BAU scenario), (Murray et al. 2009) Calculating emissions reductions from REDD+ is extremely complex, thus the difficulty of delivering certified REDD+ credits. Some of the main challenges in creating REDD+ credits are:
happened without carbon incentives (aka additionality); -
tion (aka leakage);
or baseline);
through time (aka permanence);
(aka measurement);
carbon (aka carbon rights); and
through time (aka MRV).
At the moment most of REDD+ efforts have been in building capacity around these issues, as they have to be addressed before a REDD+ mechanism can deliver emission reductions.
20 A recent study of conducted by NASA indicates that tropical forest contain over 247 billion tons of carbon. (Buis et al. 2011)

F O R E S T S I N A C H A N G I N G C L I M A T E108
Some of the challenges in detail are:
Refers to displacement of deforestation or degradation elsewhere. For example, protection of forestlands in one place may lead to deforestation in another place. Concerns about leakage have led to the call for a more comprehensive scale of coverage of the accounting system, either on the national or regional level. Leakage is one of the greatest challenges REDD+ faces as an emissions reduction mechanism, and is one of the main reasons why it was not included as part of the Clean Development Mechanism (CDM) inside the Kyoto Protocol.
(or base line): Represents the level of emissions that would occur in the ‘business as usual’ (BAU) scenario. It is a hypothetical scenario of what the deforestation would be in a particular area without the new policy intervention, in this case the implementation of a REDD+ program. Historic deforestation rates are used to project future emissions from deforestation or degradation for the BAU scenario. For example, a projected reference level of 2% means that the annual deforestation rate of a particular area is estimated to be 2% yearly; hence if deforestation rates are reduced below 2% annually emissions reduction could be obtained.
Permanence: Refers to the propensity of reduced emissions to be ‘permanent’. This means that the REDD+ area must remain forested or un-degraded for the duration of the emissions reduction agreement. VCS has established a standard duration of 30 years for REDD+ projects.
Refers to the calculation of both the carbon stock of forestland and the alternative uses of land to find the net difference in carbon. This process is extremely complex. In some cases it remains uncertain what the end use of deforested or degraded land will be adding another level of complexity. Also methodologies differ on estimate of carbon as some only measure carbon in the above biomass ground while others take into account above and below ground biomass and others take into account carbon in the soils. For example, peat soils in Indonesia have gained lots of importance inside the REDD+ context.
Refers to the result of defining who ‘owns’ the rights to carbon has become an issue in the implementation of REDD+. Many forestlands are in ‘indigenous territories’ where tenure is not clear, making it particularly difficult. Also, uncertainties exist concerning carbon rights between national and regional governments. There must be a consensus in who has the right to the carbon before a country can receive REDD+ + benefits for emissions reductions.
Refers to the monitoring, reporting and verification of emission or emissions reductions through time. Through MRV, program countries will determine their emissions or emissions reductions of LULUCF. The process of monitoring emissions or emissions reductions over time is somewhat challenging as this varies according to site and situation. For example – monitoring forest degradation becomes more challenging than monitoring deforestation in many
Leakage – refers to displacement of deforestation elsewhere. A timber camp in the Lapu area of Sarawak, Borneo, Malaysia
Mat
tius
Klum
/GET
TY IM
AG
ES
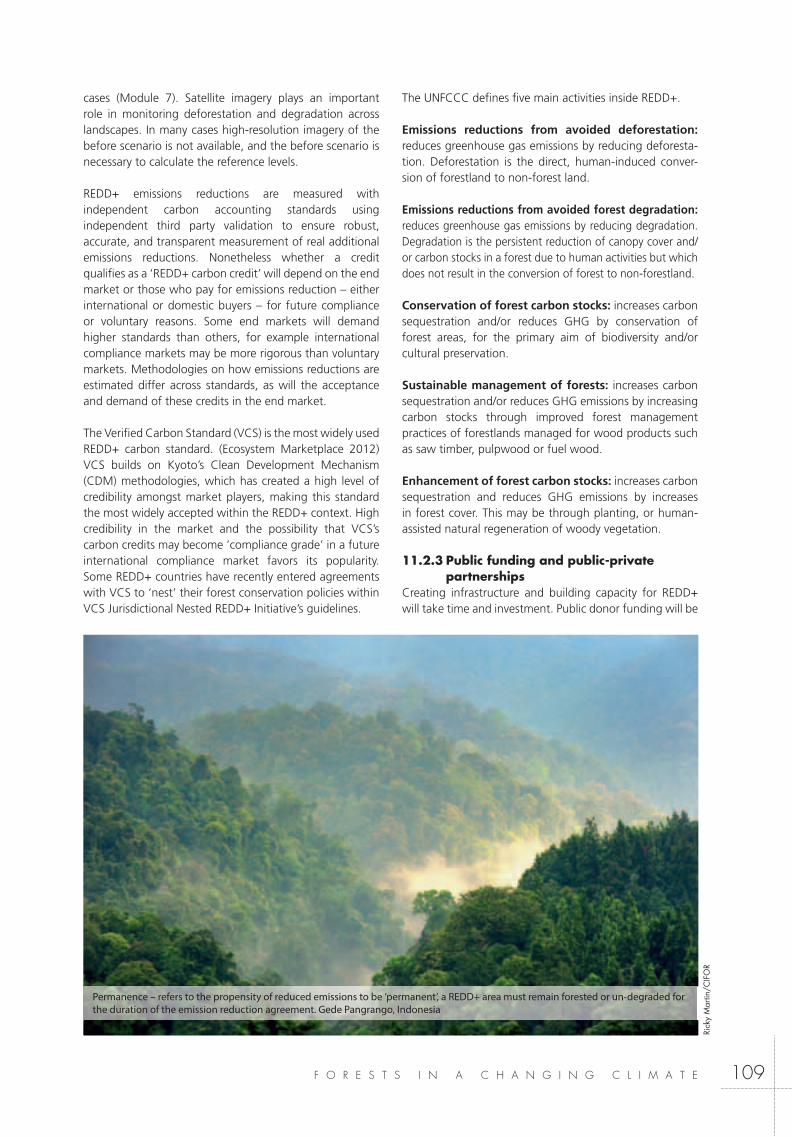
F O R E S T S I N A C H A N G I N G C L I M A T E 109
cases (Module 7). Satellite imagery plays an important role in monitoring deforestation and degradation across landscapes. In many cases high-resolution imagery of the before scenario is not available, and the before scenario is necessary to calculate the reference levels.
REDD+ emissions reductions are measured with independent carbon accounting standards using independent third party validation to ensure robust, accurate, and transparent measurement of real additional emissions reductions. Nonetheless whether a credit qualifies as a ‘REDD+ carbon credit’ will depend on the end market or those who pay for emissions reduction – either international or domestic buyers – for future compliance or voluntary reasons. Some end markets will demand higher standards than others, for example international compliance markets may be more rigorous than voluntary markets. Methodologies on how emissions reductions are estimated differ across standards, as will the acceptance and demand of these credits in the end market.
The Verified Carbon Standard (VCS) is the most widely used REDD+ carbon standard. (Ecosystem Marketplace 2012) VCS builds on Kyoto’s Clean Development Mechanism (CDM) methodologies, which has created a high level of credibility amongst market players, making this standard the most widely accepted within the REDD+ context. High credibility in the market and the possibility that VCS’s carbon credits may become ‘compliance grade’ in a future international compliance market favors its popularity. Some REDD+ countries have recently entered agreements with VCS to ‘nest’ their forest conservation policies within VCS Jurisdictional Nested REDD+ Initiative’s guidelines.
The UNFCCC defines five main activities inside REDD+.
reduces greenhouse gas emissions by reducing deforesta-tion. Deforestation is the direct, human-induced conver-sion of forestland to non-forest land.
reduces greenhouse gas emissions by reducing degradation.
or carbon stocks in a forest due to human activities but which does not result in the conversion of forest to non-forestland.
increases carbon
cultural preservation.
increases carbon
carbon stocks through improved forest management practices of forestlands managed for wood products such as saw timber, pulpwood or fuel wood.
increases carbon sequestration and reduces GHG emissions by increases in forest cover. This may be through planting, or human-assisted natural regeneration of woody vegetation.
11.2.3 Public funding and public-private partnerships
Creating infrastructure and building capacity for REDD+ will take time and investment. Public donor funding will be
Permanence – refers to the propensity of reduced emissions to be ’permanent’, a REDD+ area must remain forested or un-degraded for the duration of the emission reduction agreement. Gede Pangrango, Indonesia
Rick
y M
artin
/CIF
OR
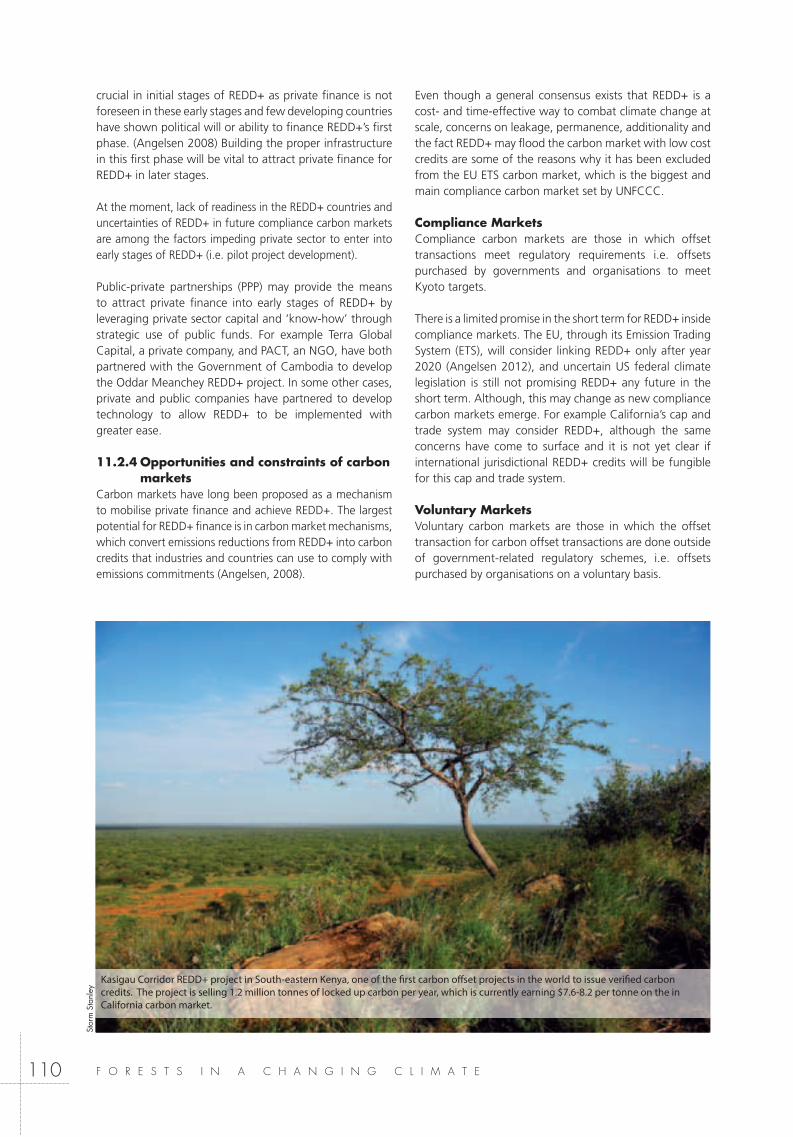
F O R E S T S I N A C H A N G I N G C L I M A T E110
crucial in initial stages of REDD+ as private finance is not foreseen in these early stages and few developing countries have shown political will or ability to finance REDD+’s first phase. (Angelsen 2008) Building the proper infrastructure in this first phase will be vital to attract private finance for REDD+ in later stages.
At the moment, lack of readiness in the REDD+ countries and uncertainties of REDD+ in future compliance carbon markets are among the factors impeding private sector to enter into early stages of REDD+ (i.e. pilot project development).
Public-private partnerships (PPP) may provide the means to attract private finance into early stages of REDD+ by leveraging private sector capital and ‘know-how’ through strategic use of public funds. For example Terra Global Capital, a private company, and PACT, an NGO, have both partnered with the Government of Cambodia to develop the Oddar Meanchey REDD+ project. In some other cases, private and public companies have partnered to develop technology to allow REDD+ to be implemented with greater ease.
11.2.4 Opportunities and constraints of carbon markets
Carbon markets have long been proposed as a mechanism to mobilise private finance and achieve REDD+. The largest potential for REDD+ finance is in carbon market mechanisms, which convert emissions reductions from REDD+ into carbon credits that industries and countries can use to comply with emissions commitments (Angelsen, 2008).
Even though a general consensus exists that REDD+ is a cost- and time-effective way to combat climate change at scale, concerns on leakage, permanence, additionality and the fact REDD+ may flood the carbon market with low cost credits are some of the reasons why it has been excluded from the EU ETS carbon market, which is the biggest and main compliance carbon market set by UNFCCC.
Compliance MarketsCompliance carbon markets are those in which offset transactions meet regulatory requirements i.e. offsets purchased by governments and organisations to meet Kyoto targets.
There is a limited promise in the short term for REDD+ inside compliance markets. The EU, through its Emission Trading System (ETS), will consider linking REDD+ only after year 2020 (Angelsen 2012), and uncertain US federal climate legislation is still not promising REDD+ any future in the short term. Although, this may change as new compliance carbon markets emerge. For example California’s cap and trade system may consider REDD+, although the same concerns have come to surface and it is not yet clear if international jurisdictional REDD+ credits will be fungible for this cap and trade system.
Voluntary MarketsVoluntary carbon markets are those in which the offset transaction for carbon offset transactions are done outside of government-related regulatory schemes, i.e. offsets purchased by organisations on a voluntary basis.
Kasigau Corridor REDD+ project in South-eastern Kenya, one of the first carbon offset projects in the world to issue verified carbon credits. The project is selling 1.2 million tonnes of locked up carbon per year, which is currently earning $7.6-8.2 per tonne on the in California carbon market.
Stor
m S
tanl
ey

F O R E S T S I N A C H A N G I N G C L I M A T E 111
REDD+ credits today are traded inside the voluntary carbon markets (VCM). They have become an appealing type of carbon credit inside the VCM as they are associated with other co-benefits that forest protection brings. Inside the VCM, co-benefit standards have gained popularity. For example, the Climate Community and Biodiversity (CCB) standard that guarantees the improvement of wellbeing of local communities and biodiversity has become widely used in REDD+. These emissions reductions are linked with co-benefit standards and ‘guarantee’ that the credits are going beyond carbon, giving REDD+ credits distinction inside the VCM.
In 2011, the VCM transacted 7.4 MtCO2e of REDD+ credits for a total value of $87 million. (Ecosystem Marketplace & Bloomberg New Energy Finance 2012). REDD+ credits have held the highest value per credit transacted in the VCM with an average price per tonne of $8.5 in 2011 (Ecosystem Marketplace & Bloomberg New Energy Finance 2012). REDD+ credits were third in volume transacted inside the
Despite the small size of the VCM, REDD+ is still playing an important role in stimulating pilot projects and getting
some private finance into early stages of development. These projects are becoming crucial as they are testing the grounds of such a mechanism.
11.2.5 Funding mechanisms and funding sources
Domestic public finance for forestry usually comes from taxes and royalties, from activities both within and outside the sector. Such funds are reinvested in the sector through a variety of mechanisms, including subsidies, soft loans and non-monetary incentives (World Bank 2008). In the last decade, civil society, conservation organizations, financial institutions and business leaders have brought new ideas, innovation, partnerships and commitment to sustainable conservation, which can unlock the needed public financing to overcome inactivity in forest and biodiversity conservation. New approaches for forest conservation focus on positive environmental externalities often in the payments for ecosystem services to marketing of biodiversity-friendly products, incentive-based conservation contracts, co-management with communities and civil society, among others. (World Bank 2012)
Latin America and the Caribbean is the region that has invested by far the most domestic capital into forest
Table 11.2 EU-ETS and Voluntary Carbon Market in 2011
Volume (Mt Co2) Percentage Value ($USD millions) Percentage
EU-ETS 7,853 98.9% $147,848.00 99.6%
Voluntary Carbon Market 87 1.1% $569.00 0.4%
Total 7,940 100% $148,417.00 100%
Source: World Bank, State of carbon market 2012
Figure 11.3.Source: Ecosystem Marketplace & Bloomberg New Energy Finance 2012
Wind
Affor/refor
REDD/avoided conversion
Landfill methane
Biomass/biochar
Clean cookstoves
Forest management
Large hydro
ODS (US-based)
Fuel switching
Run-of-river hydro
Livestock methane
Wastewater methane
Coal mine methatne
Solar, 1%
Energy efficiency, 1%
EOR, 1%
N2O, 1%
Geologic seq., 1%
Fugitive emissions, 1%
Other, 1%
6%
30%10%
9%
7%
7%
4%4% 4% 3%
3%3%
2%2%
2%
4%

F O R E S T S I N A C H A N G I N G C L I M A T E112
conservation and protection (REDD+ Partnership 2012, World Bank 2012).
Latin America and the Caribbean leads other developing regions in safeguarding biodiversity resources, with 20 percent of its land area in protected areas compared to 13 percent of other developing regions of the world. Over the past 20 years, Latin America and the Caribbean have expanded coverage of protected areas, while setting financial mechanisms to support them. (World Bank 2012)In addition to regulatory and institutional infrastructure for protected areas, governments have worked on establishing sustainable financing sources. This has included the approval of government budgets and the establishment of conservation trust funds (CTFs) as private institutions entrusted with long-term endowments for conservation programs. These entities have delivered on protecting the capital entrusted to them and have grown to become incubators of a variety of conservation programs beyond the boundaries of protected areas (World Bank 2012).
CTFs in REDD+ countries have helped supplement government funding for protected areas. The type of expenditures supported by CTFs has varied among countries, and many of them have evolved to support special projects that are more difficult for the government to fund.
In addition to protected areas, other tools for resource mobilization and management, which complement government funding in conservation, are:
Payments for ecosystem services (PES) target a variety of ecosystem services including carbon sequestration, water shed protection, landscape beauty and protection of biodiversity, among others. REDD+ is an example of a PES scheme based on carbon sequestration.
differentiates products or services compatible with biodiversity, for example,
certified timber and non-forest products, ecotourism, licenses for photography or other recreational activities.
such as administration contracts, services concessions, co-management with community and civil society among others. There are a variety of models and participation programs where governments share the responsibility of operating in conservation schemes under defined conditions.
in policies and sector programs by incorporating special measures and program. These include biodiversity-sensitive land use regulations and planning; impact assessment and mitigation; compensation for large infrastructure and extractive industries, among others.
11.3 CASE STUDIES
Case 1: First performance-based payment in REDD+ In 2012, Costa Rica became the first country to receive approval for performance-based payments through the Carbon Fund of the FCPF. Costa Rica has been implementing a Payment for Ecosystem Service (PES) program analogous to REDD+ for over 10 years. Costa Rica is proposing emissions reductions close to 29.5 million tons of carbon dioxide (MtCO2) by the year 2020. Approximately half of these emissions (12.6 MtCO2) would be offered to the Carbon Fund (Ecosystem market place), which would require an estimated financing of $63 million assuming a price of $5 per ton of CO2 (Bosquet 2012).
Costa Rica’s proposal to the Carbon Fund uses a mosaic approach on 341,000 ha of mainly privately owned land. Two-thirds of the targeted area is degraded land that the country aims to restore with reforestation, secondary growth and agroforestry, and one-third is old growth forest that will be protected from deforestation. According to Saenz (2012) Costa Rica’s REDD+ strategy directs that the
Figure 11.4. Source: REDD+ Partnership 2012
Domestic OutgoingM
illio
ns o
f USD
Oceania Africa Asia Latin America and the Caribean
4k
3k
2k
1k
0k

F O R E S T S I N A C H A N G I N G C L I M A T E 113
credits generated will be produced under VCS standards (Castillo 2013).
Case 2: Jurisdictional VCS in Acre, BrazilThe state of Acre in Brazil is applying to the VCS jurisdictional and Nested REDD+ (JNR) to generate compliance-grade credits. Verified Carbon Standard Association and Acre are working to advance the Acre REDD+ program using JNR requirements to provide best-practice framework to account for emissions and removals achieved across jurisdiction. This will allow Acre to produce emissions reductions that meet multiple markets and also serve as a model to build confidence in other nested accounting frameworks (International Emission Trading Association 2013).
Case 3: Public-private partnership in Carbon DevelopmentThe Oddar Meanchey REDD+ Project in Cambodia is the first VCS REDD+ Project in which the host-country government – in this case the Forestry Administration – is the Project Proponent. To develop the project, the Forestry Administration (FA) has partnered with the NGO PACT and Terra Global Capital (TGC), a private, US-based carbon development and finance firm.
The project has relied on a combination of public funding and private investment to carry out all of the carbon development and project implementation work required to issue credits In developing the project, TGC has built the commercial capacity of the FA and developed a number of linkages with the private sector to build the enabling environment for investment and funding from the private sector in the project. TGC has also secured their investment in the project with a political risk insurance contract from the Overseas Private Investment Corporation (OPIC), the first ever political risk insurance for REDD. The capacity and risk reducing measures taken by the project partners are critically important to creating the public-private linkages necessary for the project to reduce deforestation and improve community livelihoods (Terra Global Capital 2013).
Case 4: Conservation Fund in Mexico Mexican Fund for Conservation of Nature (Fondo Mexicano para la Conservación de la Naturaleza, FMCN), created in 1998, has been applying resources to innovative and strategic projects implemented by local groups and civil society organizations. It has increased the coverage of its protected area system, by fourth fold since 1998, having reached a total 21 million hectares under protection by 2010 (World Bank 2012).
11. 4 KEY ISSUES FOR DISCUSSION
Compliance carbon marketsIn compliance carbon markets, offset transactions are designed to meet specific regulatory requirements (i.e. within the targets of an international agreement). There are some opportunities, but overall, in the short term, there is not much promise for REDD+ to operate inside compliance markets (Angelsen 2012). What is REDD’s future without compliance carbon markets?
Local governments and public-private partnershipsPublic-private partnerships (PPPs) have the potential to attract private investment in the early stages of REDD+ through private sector capital as well as strategic use of public funds. They also can create strategic partnerships that produce new tools for REDD, such as improved technologies. What are the best ways for local governments to promote PPP’s in REDD+ development?
The establishment of CTFsIn order to establish sustainable financing sources, many governments have established conservation trust funds (CTFs) as private institutions that manage long-term endowments for conservation programs. In REDD+ countries specifically, CRFs have been able to supplement government funding for protected areas. What are ways in which founder countries could promote the creation of CTFs in domestic countries to accelerate REDD+ development?

F O R E S T S I N A C H A N G I N G C L I M A T E114
11. 5 REFERENCES
Amazon Fund. Last updated 2012. Climate Fund Update. Feb
fund.
Astrium. Dec 2010. Astrium and the French Development Agency (Agence Française de Développement) sign an agreement to provide satellite imagery to protect forests in
agency-agence-francaise-de-developpement.html
Australia International Forest Carbon Initiative. Last updated
forest-carbon-initiative.aspx).
Angelsen, A. (ed.) 2008 Moving ahead with REDD: Issues, options and implications. CIFOR, Bogor, Indonesia.
Angelsen, A., Brockhaus, M., Sunderlin, W.D. and Verchot, L.V. (eds) 2012 Analysing REDD+: Challenges and choices. CIFOR, Bogor, Indonesia.
Bosquet, B. October 2012. Costa Rica scripts a new chapter in forest carbon finace. World Bank Blogs. February 2013.
scripts-new-chapter-forest-carbon-finance).
Buis, A., Cole, S. (May 2011) New NASA Map Reveals Tropical Forest Carbon Storage. NASA new & features.
Castillo, S. Jan 2013. How Costa Rica and Chile are Leveraging Independent Carbon Standards to Get Ready for REDD.
Climate Funds Update. Last Updated Nov 2012. Who is pledging and depositing in REDD+ funds. May 2013. From: REDD+ - “download in CSV format”
Congo Basin Forest Fund. Last updated Nov 2012. Climate Fund
Eliasch, J. 2008. Climate change: Financing global forests (the Eliasch Review). London: Office of Climate Change, Government of the United Kingdom.
International Emission Trading Association. 2013. Comments to REDD+ offsets working groups (ROW) Draft Recommendations
Pricewaterhouse Coopers. 2011. Funding for Forests: UK government support for REDD.
Meridian Institute. 2009. Reducing Emissions from Deforestation and Forest Degradation (REDD): An Options Assessment Report, Prepared for the Government of Norway
Murray, B., Olander, L., Kanak, D. 2009. Foreign a path for high-quality Compliance REDD+ Credits. North Carolina, USA, Nicholas institute for environmental policy solutions
Nakhooda, S., Caravani, A. 2011. Climate Finance Fundamental. Overseas Development Institute and Liane Schalatek, Heinrich Böll Stiftung North Americas
Norway’s International Climate and Forest Initiative. Last update
climate-and-forest-initiative
Ecosystem Market Place. 2012. Leveraging the landscapes, state of forest carbon markets 2012. DC, USA.
Ecosystem Market Place & Bloomberg New Energy Finance. 2012. Developing Dimension: State of the voluntary carbon markets 2012.
REDD+ Partnership (2012). The Voluntary REDD+ Database. Managed by FAO, Rome, Italy and UNEP World Conservation Monitoring Centre, Cambridge, UK. Downloaded 21 May 2013.
Stern, N. 2006. The economics of climate change (the Stern Review). Cambridge, UK: Cambridge University Press.
Terra Global Capital. 2013. Personal interview conducted to Mark Lambert, Principal of Pipeline and Origination in Terra Global Capital.
World Bank. 2008. Climate Investment Funds: Mapping of existing and emerging sources of forest financing. Washington, D.C.
World Bank’s – Carbon Finance Unit. 2012. State and Trends of the Carbon Market Report 2012. Cologne Germany
World Bank . 2012. Expanding Financing for Biodiversity Conservation EXPERIENCES FROM LATIN AMERICA AND THE CARIBBEAN. Washington DC
United Nations Environment Programme. 2011. Forests in a Green Economy, A Synthesis
UN-REDD Programme. Last updated July 2012. About the UN-

F O R E S T S I N A C H A N G I N G C L I M A T E 115
12.1 FUNDAMENTALS
M O D U L E 12Beyond REDD+, the green economy transition
The Cancun Agreements, adopted by the COP to the UNFCCC in 2010, acknowledged “that addressing climate change requires a paradigm shift towards building a low-carbon society that offers substantial opportunities and ensures continued high growth and sustainable development, based on innovative technologies and more sustainable production, consumption and lifestyles, while ensuring a just transition of the workforce that creates decent work and quality jobs” (UNFCCC COP 2011, para. 10). In this context, a green economy can be defined as low-carbon, resource efficient, and socially inclusive where growth is driven by investments that reduce carbon emissions and pollution, enhance energy and resource efficiency, prevent loss of biodiversity, and avoid damage of ecosystem services (2011b). As such, a green economy must be resilient and adaptable to social, economic, and environmental changes, while at the same time supporting people whose livelihoods are dependent upon sustainable management of ecosystems and biodiversity.
The greening of the forest sector and other related sectors depend on forest reforms; on the generation of green jobs; and on green investments that engage both public and private sectors that can benefit the livelihoods of the poorest. For example, UNEP’s Green Economy Initiative (2011) has estimated that an annual investment of USD40 billion in reforestation and payments to landowners could raise value added in the forest industry by 20%, increase carbon storage by 28%, and halve global deforestation by 2030, compared to business as usual scenarios.
REDD+ sits within a broad landscape of sustainable initiatives that support improved management of forests and are driving economic development towards green transition paradigms. The integration of multiple benefits of forests to these initiatives represents a unique opportunity to thrust changes to greener and more inclusive economies centered on natural capital investment strategies that can result in improved human wellbeing, social equity, and positive impacts on reducing environmental and ecological risks (Sukhdev et al., 2011). This module reviews how REDD+ and other mechanisms related to the forest sector can blend into the green economy transition, while at the same time attain for poverty alleviation.
12.1.1 Shaping a green development pathway
Performance based management as an opportunity for developmentPerformance based management (PBM) refers to programs that operate on the basis of demonstrated commitments. REDD+ mechanisms and others, like PES and certification, work that way and can significantly reduce forest and land-based emissions through performance-based
payments (UN-REDD+ Programme, 2010). Additionally, the incorporation of multiple benefits of forests and social safeguards (see modules 2 and 9 of this sourcebook for REDD+ examples) can help realize economic and social development.
Because forest PBM is mainly built on the existence of indicators that can show a causal relation between the reference levels and the current state of forests’

F O R E S T S I N A C H A N G I N G C L I M A T E116
conservation, assessments are necessary to demonstrate shifts towards a green economy. Some of the indicators that have been proposed include: 1) the rate of substitution of carbon-intensive products with forest products; 2) the changes of markets for forest ecosystem services; 3) investments in sustainable forest enterprise and production, especially those that integrate bundles of ecosystem services and comprise sustainability; 4) the changing ownership of forest land and the inclusion of forest stakeholder groups; 5) forest governance improvements; and 6) the sustainability of forest management, including different scales and in terms of environmental, social, and economic sustainability (2011a).
Availability of data and accurate reference levels are essential to have reliable indicators (see module 7 of this sourcebook). When devising MRV standards, secure property rights, legitimation of the process, and transparent governance are necessary for national and international scrutiny to take place efficiently and to engage society effectively. In the case of REDD+, precisely because many partner countries have difficulties covering these three points, restructuring institutions, political reforms, and recognition of human rights can result in positive outcomes, transforming sustainable development challenges into windows of opportunity for a more efficient, effective, and equitable development (Fig. 12.1).
To reach a green economy and social development through performance-based mechanisms, operational systems and capacity building to leverage additional investment flows need to be in place (2010b). This stands under the premise that effectiveness, efficiency, and equity ought to be reached if incentives are directly linked to the needs and aspirations of local people and if a balanced decision-making process is followed considering both bottom-up and top-down participation (Angelsen 2009). To continue the discussion, the following two sections review some of the initiatives to enhance forest investments and generate green jobs and discuss their potential spillover effect on the transition towards a green, equitable economy.
Figure 12.1. REDD+ as a driver for sustainable development. Source: UN-REDD, 2011.
Bundles of ecosystem services consider environmental, social and economic sustainability
Rick
y M
artin
/CIF
OR
REDD &Performance BasedManagement
More efficient,effective, equitablesustainable development
Property rights reforms
Legitimizationreforms
Transparent governance andanti-corruption
reforms
Women’s empowerment andgender equity
Participation of forestdependent communities and
indigenous peoples

F O R E S T S I N A C H A N G I N G C L I M A T E 117
Forest investments Historically, forest investments were conceived as large-scale incentive systems providing financing for the sustainable use of forest resources, specifically for commercial timber species. Current thinking and practice, the concept has evolved and forest investments have broadened to cover carbon and other ecosystem services, and to support people whose livelihoods depend on forests. The idea behind forest investments is to spend money cleverly – by enhancing forests conservation and incrementing vegetation cover, and thus carbon storage - while at the same time aiming for sustainability. Although forest investments have been primarily established by developed countries there are many international-driven forest direct incentives emerging to aid developing countries as well as national initiatives within REDD+ partner countries. This way, geographic distribution of investment opportunities is slowly migrating to Africa, Asia, and Latin America.
Table 12.1 reviews the most relevant forest investments within a REDD+ context and also explores some regional and nation-driven initiatives. Joint actions among FIP, FCPF, and UN-REDD Programme support REDD+ partnerships. To effectively address equity issues, FIP has created the FIP Dedicated Grant Mechanism for Indigenous Peoples and Local Communities which provides grants to local communities and supports their participation in REDD+ projects, with a budget of approximately $550,000 (2010a). A comparable $8 million initiative, called Community Based REDD+ (CBR+) has been developed jointly between the UN-REDD Programme and the Global Environment Facility Small Grants Programme. CBR+ provides resources and capacity to indigenous peoples
and local communities, empowering them to engage in REDD+ via the provision of small grants. Nation-driven initiatives have been established in countries like Brazil, Peru, Mozambique, and Indonesia.
Investing in carbon markets offers a great opportunity to increase financial competitiveness, which can be of great interest to the private sector for a variety of reasons. First, carbon credits represent a new way of profit from the usual timber and non-timber forest products. Second, mitigation investments can be an opportunity for risk management by integrating the forestry sector and diversify investors’ portfolios. Third, investing in the forestry sector can facilitate financial institutions’ compliance to meet emission reduction targets. Fourth, investments on the forestry sector can result in social and environmental benefits if a corporate social responsibility approach is taken. Fifth, forestry investments can lead to a broader sense of sustainability by having positive impacts on biodiversity and ecosystem services not originally accounted for in the project. However, these opportunities don’t stand alone and are exposed to several risks that need to be taken into consideration. Forest-carbon market risks include political risk, involving international policy, eligibility, and government implementation risks; market risks, that involve a low price for carbon credits and carbon market-specific regulatory risks; as well as more general business risks that encompass natural hazardous events, country-specific risks, and social risks (UNEP, 2011a).
If forest investment schemes are eventually integrated into international, regional, national, and provincial markets, conserving the world’s forests and focusing on forest
Table 12.1. Existing investments to trigger green economy within the forestry sector.
Investment Secretariat Organization/ Country Support Pledge
(US$ million) Observations
Forest Investment Program (FIP)
Targeted program of Strategic Climate Fund part of World Bank and MDBs
8 pilot developing countries and 6 contributor countries
578 Financing modalities for public and private sector through grants, concessional loans, and guarantees.
Forest Carbon Partnership Facility (FCPF)
Carbon Fund of World Bank
37 REDD+ countries, 10 donor participants, 5 carbon fund participants
435 Readiness and carbon finance mechanism to build readiness for REDD+ (18 national R-PP so far) and pilot performance-based payments.
Tectona Forest of Zambézia Project
Mozambique 19,540 ha covering four districts
100 Almost ¾ of the investment is for planting new forests, 20 million for supply chain investments, and 10 million for infrastructure.
Fondebosque Peru CSR and environmental investments
60 Forest concessions for extraction, training and technical assistance, forest economic competitiveness, PES schemes, and young people’s involvement.
Tropical Asia Forest Fund (TAFF)
New Forests (headquarters in Australia)
Private investment fund with focus on Malaysia, Indonesia, and Vietnam
76 Plantation forestry assets aiming to provide sustainability, governance practices, and risk management programs

F O R E S T S I N A C H A N G I N G C L I M A T E118
investment could generate large and valuable carbon and other ecosystem services assets. Investment interventions can serve not only as an enhancer to trigger economic spillovers in developing countries, but also to generate jobs, reduce poverty, and encourage further forest carbon investments. The implementation of efficient forest investments in developing countries will rely on effective social reforms that incorporate procedures with transparent accountability; securing of land-tenure and ownership of forest carbon asset rights; recognition of human rights of landowners; appropriate valuation of environmental services on which institutions will be investing; developing clear investment regulations to insure forests stay under the management of the landowners; and deciding on how REDD+ profits and benefits will be shared among different stakeholders (UNEP, 2011a).
Generation of green jobsGreen jobs can be defined as work in agricultural, manufacturing, research and development, administrative, and service activities that contribute substantially to preserving or restoring environmental quality (2008) that promote poverty reduction, increase economic independence, reduce inequity, improve food security, and reduce vulnerabilities (Acey and Culhane 2013). Interventions on the forest sector open a big window of opportunity to generate green jobs – comprising a vast array of profiles, skills, and educational backgrounds (UNEP et al., 2008) and can contribute to poverty reduction and improvement of living standards in developing countries (2008). Forests are important for the livelihoods of over
one billion people and represent direct employment or livelihood opportunities for almost half a billion people (2012f). Hence, greening this sector and effectively tackling the problems of deforestation and forest degradation will depend on efficient, effective, and equitable policy instruments including regulations and law enforcement, creation and strengthening of protected areas, restoration projects, agroforestry initiatives, sustainable forest management (SFM), implementation of certification schemes, payment for environmental services (PES), and REDD+ schemes.
The number of green jobs can be assessed by knowing the share of the forestry sector that meets appropriate criteria; thus, greening this sector and generating green jobs can be analyzed from the perspective of impacts resulting from different policy instruments (see table 12.1). Protected areas and forest conservation, for instance, could create 2 to 3 million full-time equivalent (FTE) jobs (2012f). Some of these opportunities include demarcating boundaries and maintenance of protected areas, administrative jobs, employment derived from forest recreational activities, as well as environmental education (Nair and Rutt 2009).
SFM provides longer-term green job opportunities for rural economies (2008). Nair and Rutt (2009) argue that
forest management 500-1,000 jobs could be generated in developing countries; however, they argue if indigenous forest management is considered the numbers can go up to potentially 1-2 million jobs. SFM activities could include
Henderson Waves Bridge, Singapore – Green Economy transition and generation of green jobs
Eddy
Sen
g/G
ETTY
IMA
GES

F O R E S T S I N A C H A N G I N G C L I M A T E 119
not only extractive forest activities but also recovery of secondary-vegetation forests, very closely linked to restoration projects.
Restoration projects as well as afforestation and desertification control activities also represent job opportunities that can be derived from plantations as well as conventional forest-based industries, increasing by a 20% employment rates, from 25 to 30 million (2012f). Reclamation of degraded or desertified lands to develop sustainable forest activities “offer the greatest scope for job creation” (Nair and Rutt 2009). Urban forestry could also contribute to a small but very significant amount of jobs, ranging between 100 thousand and half a million (2012f). Activities related to urban forestry include gardening, design and implementation of green roofs, and parks management, among others that improve urban living conditions, increase green areas, and most importantly, mitigate local climate change effects in urban spaces.
Impacts of agroforestry on employment rates is considered to be one of the most cost-effective activities, while having the potential to reduce social conflicts and maximizing land use – by increasing productivity (2012f). By combining agricultural and forestry technologies these productive and sustainable systems can help millions of people escape poverty, ensure food security for forest-dependent people, and prevent forest degradation (2013a). Potentially, half a million to 750 thousand jobs can be generated from this instrument (Nair and Rutt 2009).
Forest certification schemes such as the Forest Stewardship Council (FSC) work as incentive driven approach mechanisms that have a great potential to aid the forest sector by combining land conservation with forest management (Hernández et al. 18-22 February 2008). These schemes are inherently sustainable because of their requirements for decent working conditions and because they provide assurance mechanisms to the provider and the purchaser that products are sustainably managed (Rametsteiner and Simula 2003). The main criticism of certification systems is that they benefit large producers because small-scale and community producers usually lack the technical knowledge and finance to comply with the standards. However, if advised correctly and capacity-building is done, certification schemes have the potential to promote equity by incorporating local people, improving their working conditions and occupational safety, potentially enhancing social cohesion (2012f) and supporting gender equality (Lewark et al., 2011). The number of jobs created from these schemes will vary depending on the kind of certification scheme and the accounting systems in place.
There is no doubt that the forest sector can generate a myriad of job opportunities for people in both developed and developing countries. However, shortcoming and challenges must be internalized to have efficient and effective outcomes. Some of the weaknesses that the forest sector faces are: 1) currently the creation of green-jobs is advancing too slowly, contributing marginally to
Mixed landscape forestry and rice paddies
Cha
rlie
Pye-
Smith
/CIF
OR

F O R E S T S I N A C H A N G I N G C L I M A T E120
the reduction of unemployment and underemployment; 2) the creation of good-quality and decent jobs is difficult in a context of informality and inequality in the global economy; and, 3) the prevalence of unsustainable business practices remains more profitable and are fully supported by most developing countries (2008). Regarding equity and enforcement of social safeguards, some of the issues to reckon include low quality of forestry jobs – excessive working hours, unclear or informal contracts, low wages, permanence, and hazardous working conditions-, the skills and technical preparation required to practice certain activities, recognition of gender equity, as well as social dialogue and participation between employers and local people.
12.2 INITIATIVES, TOOLS & METHODOLOGIES
Prospective scenario analysis and simulations that support REDD+ and the transition to a green economy include the use of different initiatives, software tools, and methodologies that measure and value natural capital.
Initiatives to integrate natural capital accounting into development planningThe following paragraphs briefly describe some of the most important initiatives being implemented worldwide to integrate natural capital accounting into policy decision-making processes. These accounting initiatives will help countries go beyond a single GDP measurement by integrating environmental services and biodiversity into national accounts, address today’s challenges, and transition into a green economy (2012d).
The Economics of Ecosystems and Biodiversity (TEEB) is an initiative focused on drawing attention to the economic benefits of biodiversity, with the objective of highlighting the growing costs of biodiversity loss and ecosystem degradation to society. TEEB uses a tiered approach that helps decision-makers recognize values of ecosystems, landscapes, species, and ecosystem services; demonstrate the value through diverse valuation techniques; and capture the value through the introduction of mechanisms that incorporate the values of ecosystems into decision-making processes (Kumar 2010).
The United Nations’ System of Environmental-Economic Accounting (SEEA) is a response to Agenda 21 to have a systematic assessment to monitor the transition to sustainable development through integrated environmental and economic accounts. SEEA provides an integrated accounting and statistical framework approach as well as indicators that respond directly to the demand of policy-making (2013d). SEEA’s land and ecosystems subsystem provides a description of the structure and scope of ecosystem accounting to understand and contribute to the integration of information into decision-making processes and system of national accounts (2013a).
To support SEEA implementation and help countries move towards a natural capital accounting, the World Bank initiated a global partnership called Wealth Accounting and the Valuation of Ecosystem Services (WAVES). WAVES aims to use internationally recognized methods and follow a five-step implementation process in each of the partner countries by building political will, building institutional ownership, assessing policy entry points, designing a work plan, and mainstreaming information generated to inform policy debates among diverse stakeholders. So far there are five WAVES partner countries – Botswana, Colombia, Costa Rica, Madagascar, and the Philippines - that are now starting to implement their work plans(2013c).
The Inclusive Wealth Report (IWR), an initiative of the International Human Dimensions Programme on Global Environmental Change, was developed under the idea that GDP and HDI are not sufficient to reflect the state of natural resources or ecological conditions and do not indicate whether national policies are sustainable. The main objective of the IWR is to provide governments and the development community with quantitative information and analysis that present a long-term perspective on human wellbeing and measures of sustainability. IWR features an index that measures the wealth of nations by looking into an inclusive wealth index that incorporates values of manufactured, human, and natural capital. IWR 2012 focuses on natural capital for a group of 20 countries (2012b).
Tools to map and value natural capitalThe Integrated Valuation of Environmental Services and Tradeoffs (InVEST) is a modeling suite developed by the Natural Capital Project to quantify, map, and value benefits of goods and services from nature that are essential for human livelihoods. InVEST is designed to identify suitable solutions for natural resource and landscape management and effectively support better green economy policy decision-making. InVEST identifies groups of stakeholders through consultations that include discussions and questions concerned on how a service is delivered on a landscape today and how it might be affected by future scenarios. Scenarios for terrestrial ecosystems typically include maps showing potential future land uses and land cover. Based on consultations, this toolset estimates the amount and value of environmental services currently provided by a landscape compared to future scenarios. Maps are then produced and results are given in either biophysical or economic terms. Models for terrestrial and freshwater systems measure and value biodiversity, through habitat quality and rarity; carbon storage and sequestration; reservoir hydropower production; water purification; sediment retention through avoided dredging and water quality regulation; managed timber production; and crop pollination models. This toolset was designed for governments, non-profits, and corporations to manage natural resources and assess trade-offs among potential

F O R E S T S I N A C H A N G I N G C L I M A T E 121
This area near Gunung Lumut where clear-cutting has occurred most likely for oil palm production, East Kalimantan, Indonesia
Mos
es C
easa
r/C
IFO
R
uses. For example, government agencies have the opportunity to determine how to do land management; conservation organizations can use InVEST to assess how biodiversity might be better protected at the same time human livelihoods are improved; and corporations can make use of this toolkit to have more efficient and sustainable investments related to the supply chains of interest. The success of this toolset will depend upon the availability of data in the region or country where the models want to be run and the capacity building of people that use the software (Tallis et al. 2013).
Artificial Intelligence for Ecosystem Services (ARIES) is a web-based modeling platform that helps to assist rapid ecosystem service assessment and valuation through existing ecological models to simulate ecosystem service flows. ARIES links beneficiaries and ecosystem services. In summary, the methodology consists on interviewing local stakeholders to develop models that map the potential provision of ecosystem services, their users, and biophysical features at the same time it quantifies each ecosystem service demand. Because ARIES sees the landscape as a place where ecosystem services are distributed unequally but predictably, users can explore different scenarios to understand the trade-offs of different decisions. One of the main advantages of ARIES is that it accounts for uncertainty by deriving the relationship between variables and applying results to data-scarce conditions. ARIES was originally developed around case studies, designed to
model multiple ecosystem services across diverse ecological and socio-economical settings. Case studies involve a varied set of academic, research, and international institutions in four countries – Dominican Republic, Madagascar, Mexico, and the United States - concerned on improving the understanding of how ecological benefits flow from ecosystems to people to serve as a bridge between science and policy-making (2013b).
In the context of REDD+ and the transition to a greener economy, both InVEST and ARIES are very helpful to integrate multiple benefits of forests, assess bundles of ecosystem services, and incorporate different social variables and considerations into present and future conservation and natural resource use scenarios.
Integrating Ecosystem Services into Development Planning: a stepwise method for practitionersThe guide on Integrating Ecosystem Services into Development Planning (IES) was designed to assist development planners on how to recognize the links between nature and development, considering the trade-offs related to development plans, and including opportunities and risks related to ecosystem services in development strategies. It makes use of a 6-step approach to demonstrate how development plans depend and impact ecosystem services; to generate information to reduce negative impacts development plans might have on ecosystem services; and to provide concrete policies
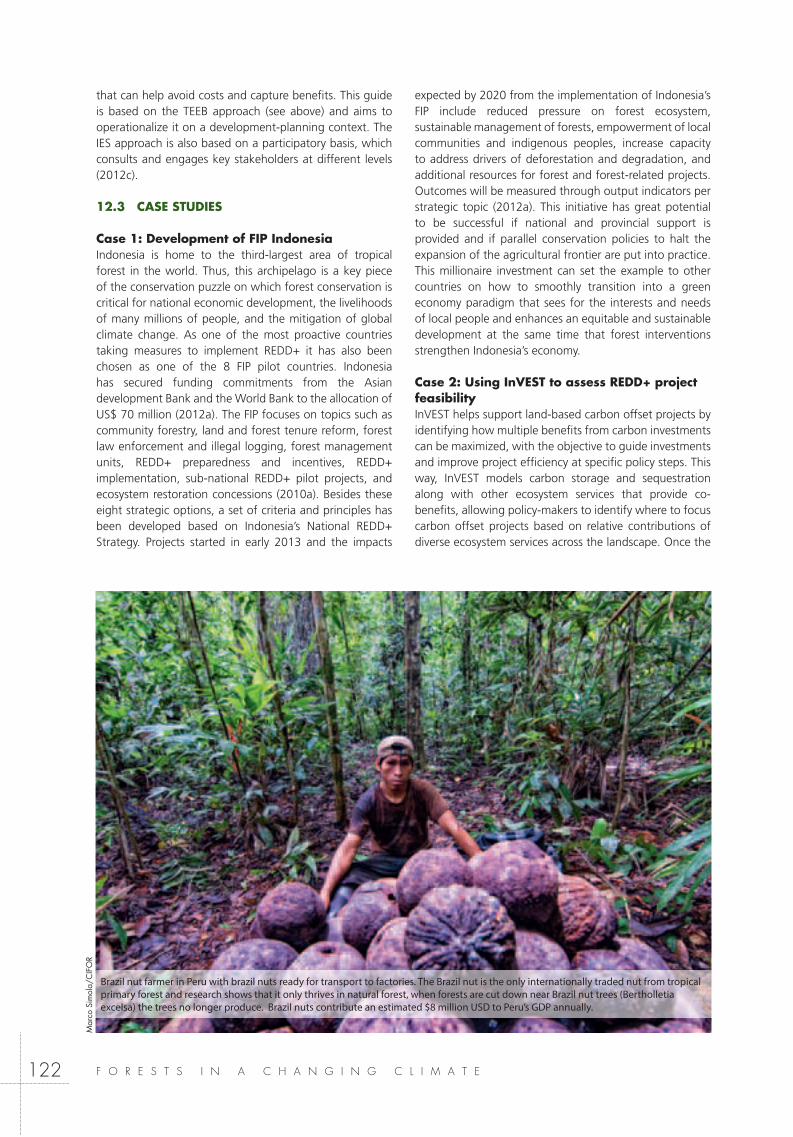
F O R E S T S I N A C H A N G I N G C L I M A T E122
that can help avoid costs and capture benefits. This guide is based on the TEEB approach (see above) and aims to operationalize it on a development-planning context. The IES approach is also based on a participatory basis, which consults and engages key stakeholders at different levels (2012c).
12.3 CASE STUDIES
Case 1: Development of FIP IndonesiaIndonesia is home to the third-largest area of tropical forest in the world. Thus, this archipelago is a key piece of the conservation puzzle on which forest conservation is critical for national economic development, the livelihoods of many millions of people, and the mitigation of global climate change. As one of the most proactive countries taking measures to implement REDD+ it has also been chosen as one of the 8 FIP pilot countries. Indonesia has secured funding commitments from the Asian development Bank and the World Bank to the allocation of US$ 70 million (2012a). The FIP focuses on topics such as community forestry, land and forest tenure reform, forest law enforcement and illegal logging, forest management units, REDD+ preparedness and incentives, REDD+ implementation, sub-national REDD+ pilot projects, and ecosystem restoration concessions (2010a). Besides these eight strategic options, a set of criteria and principles has been developed based on Indonesia’s National REDD+ Strategy. Projects started in early 2013 and the impacts
expected by 2020 from the implementation of Indonesia’s FIP include reduced pressure on forest ecosystem, sustainable management of forests, empowerment of local communities and indigenous peoples, increase capacity to address drivers of deforestation and degradation, and additional resources for forest and forest-related projects. Outcomes will be measured through output indicators per strategic topic (2012a). This initiative has great potential to be successful if national and provincial support is provided and if parallel conservation policies to halt the expansion of the agricultural frontier are put into practice. This millionaire investment can set the example to other countries on how to smoothly transition into a green economy paradigm that sees for the interests and needs of local people and enhances an equitable and sustainable development at the same time that forest interventions strengthen Indonesia’s economy.
Case 2: Using InVEST to assess REDD+ project feasibilityInVEST helps support land-based carbon offset projects by identifying how multiple benefits from carbon investments can be maximized, with the objective to guide investments and improve project efficiency at specific policy steps. This way, InVEST models carbon storage and sequestration along with other ecosystem services that provide co-benefits, allowing policy-makers to identify where to focus carbon offset projects based on relative contributions of diverse ecosystem services across the landscape. Once the
Brazil nut farmer in Peru with brazil nuts ready for transport to factories. The Brazil nut is the only internationally traded nut from tropical primary forest and research shows that it only thrives in natural forest, when forests are cut down near Brazil nut trees (Bertholletia excelsa) the trees no longer produce. Brazil nuts contribute an estimated $8 million USD to Peru’s GDP annually.
Mar
co S
imol
a/C
IFO
R

F O R E S T S I N A C H A N G I N G C L I M A T E 123
biophysical part is completed, valuation techniques can be used to estimate economic values (2010c). In order to use InVEST for forest carbon policies or mechanisms similar to REDD+, a tip sheet has been developed to guide policy makers into assessing the feasibility of implementing this kind of projects. Recommendations include: calculating current forest carbon storage with the most recent available data; developing business as usual and REDD+ scenarios to estimate losses or gains of forest carbon; creating a timeframe of at least 30 years and incorporating
climate change impacts on the scenarios; considering the expected price per ton of CO2 emissions to replace the current value for carbon models where markets might exist; identify land use and land cover units to ensure that loss and gains in carbon are clearly reflected; and acknowledge the limitations of the modeling tool to provide opportunities to implement REDD+ projects. Some points to consider are that InVEST carbon models do not account for uncertainty and that the actual value of forest carbon might be lower because the models use linear growth rates (2012e).
12.4 KEY ISSUES FOR DISCUSSION
Country-specific economic scenariosThere are still many challenges to face in order to transition into a green economy, most of them conditional on each country’s support to undergo such changes and face multiple risks. Natural resource extraction faces multiple interests that might pose serious challenges on sustainability. In many cases, sustainable development and green economy is considered as a halt for developing countries that want to progress instead of being interpreted as an opportunity to build synergies between economic growth and environmental stewardship (Ocampo 2010). Given this risk, each country must undertake a green economy that best fits its interests and needs in order to avoid the “one size fits all” approach. Risks of not having specific implementation per country might lead to failures and a general sense of disapproval for well-meant initiatives. How can economic paradigms be adapted to country-specific scenarios? What are the advantages and disadvantages of doing so?
Resource scarcityTime is catching up and climate change is proving that resource scarcity might be another big challenge to face while transitioning towards a green economy. Resource scarcity would most likely affect poor people and ratchet up inequality between those who have access and can pay for the natural resource and those that are deprived and have bigger costs. How can resource scarcity be addressed in a green economy context. A green economy is based on market access and to correctly function it must aim for initiatives and trade systems that follow sustainability principles.
Governance reformsReforms to governance systems will be crucial if sustainable development outcomes are to be attained. Not only is corruption a major concern, but reforms will also need to be implemented around tenure, transparent governance and participatory processes. Using those mentioned in the module as a starting point, what key issues should governance systems consider in order to achieve sustainable development?

F O R E S T S I N A C H A N G I N G C L I M A T E124
12.5 REFERENCES
Acey, C. S., & Culhane, T. H. (2013). Green jobs, livelihoods, and the post-carbon economy in African cities. Local Environment: The International Journal of Justice and Sustaianbility.
Angelsen, A. (2009). Realising REDD+: National strategy and policy options. Bogor, Indonesia: CIFOR.
ARIES. (2013). ARIES: ARtificial Intelligence for Ecosystem Services. Retrieved May 30, 2013, from Introduction to
Climate Investment Funds. (2010). Meeting of the FIP Sub-Committee. Terms of Reference for the development of a dedicated grant mechanism for indigenous peoples and local communities. Manila, Philippines.
Climate Investment Funds. (2010a). Report of FIP Expert Group: Recommendations for Pilots Under the FIP. Manila, Philippines.
GIZ. (2012). Integrating Ecosystem Services into Development Planning: a stepwise approach for practitioners based on the TEEB approach. ESchborn.
Hernández, S. A., Brown, C., Miles, L., & Kapos, V. (18-22 February 2008). Forest certification: how do Latin American standards address biodiversity? In S. o. Siversity, Mainstreaming Biodiversity Issues into Forestry and Agriculture, Abstracts of Poster Presentations at the 13th Meeting of the Subsidiary Body on Scientific, Technical and Technological Advice of the Convention on Biological Diversity (Vol. Technical Series 34, pp. 136-138). Rome, Italy.
ILO. (2012). Working towards sustainable development: opportunities for decent work and social inclusion in a green economy. Geneva.
InVEST. (2010, January). Using InVEST to Establish Land-based carbon offsets. Natural Capital Project, 5.
InVEST. (2012). The Natural Capital Project. Retrieved May 31st, 2013, from InVEST Tips Sheet: Using InVEST to assess the
Kumar, P. (2010). Key Messages and Linkages with National and Local Policies. In TEEB, & P. Kumar (Ed.), The Economics of Ecosystems and Biodiversity Ecological and Economic Foundations. London and Washington: Earthscan.
Lewark, S., George, L., & Karmann, M. (2011). Study of gender equality in community based ofrest certification programmes in Nepal. International Forestry Review, 13(2), 195-204.
Nair, C., & Rutt, R. (2009). Creating forestry jobs to boost the economy and build a green future. Unasylva 233, 60, 3-10.
Ocampo, J. (2010). The transition to a green economy: benefits, challenges, and risks from a sustainable development
perspective Summary of Background Papers. UN-DESA, UNEP, and UNCTAD, Second Preparatory Committee Meeting for UNCSD.
Rametsteiner, E., & Simula, M. (2003). Forest certification -an instrument to promote sustainable forest management? Journal of Environmental Management, 67, 87-98.
Republic of Indonesia. (2012, March). Forest Investment Program: Indonesia forest investment plan. Jakarta.
SEEA. (2013). Measurement Framework in Support of Sustainable Development and Green Economy Policy. SEEA Briefing Note.
SEEA. (2013a). SEEA Experimental Ecosystem Accounting Briefing Note. SEEA Briefing Note.
Sukhdev, P., R. Prabhu, P. Kumar, A. Bassi, W. Patwa-Shah, T. Enters, G. Labbate, J. Greenwalt. (2011). REDD+ and a Green Economy: Opportunities for a manually supportive relationship. UN-REDD Programme. Policy Brief 1.
Tallis, H., Ricketts, T., Guerry, A., Wood, S., Sharp, R., Nelson, E., et al. (2013). InVEST 2.5.3 User’s Guide. The Natural Capital Project. Stanford: The Natural Capital Project.
UNEP. (2011). Towards a Green Economy: Pathways to Sustainable Development and Poverty Reduction.
UNEP. (2011a). REDDy Set Grow, A briefing for financial institutions, Part 1. Opportunities and roles for financial institutions in forest carbon markets. Geneva, Switzerland: United Nations Environment Programme, Financial Initiative.
UNEP, ILO, IOE, ITUC. (2008). Green Jobs: Towards Decent Work in a Sustainable, Low Carbon World. Nairobi.
Outcome of the Work of the Ad Hoc Working Group on Long-term Cooperative Action under the Convention. In Report of the Conference of the Parties on its sixteenth session, Addendum, Part Two: Action taken by the
United Nations. (2013, February 5). Agroforestry crucial to ensure food security of millions, says UN agency. Retrieved
UN-REDD Programme. (2010). The UN-REDD Programme Strategy 2011-2015. Geneva, Switzerland.
UNU-IHDP and UNEP. (2012). Inclusive Wealth Report 2012. Measuring progress towards sustainability. Cambridge: Cambridge University Press.
WAVES. (2012). Moving Beyond GDP. Washington D.C.: World Bank.
WAVES. (2013). The Global Partnership on Wealth Accounting and the Valuation of Ecosystem Services: Annual Report. Washington D.C.: World Bank.
E/50
0/jo
/14-
0086
8

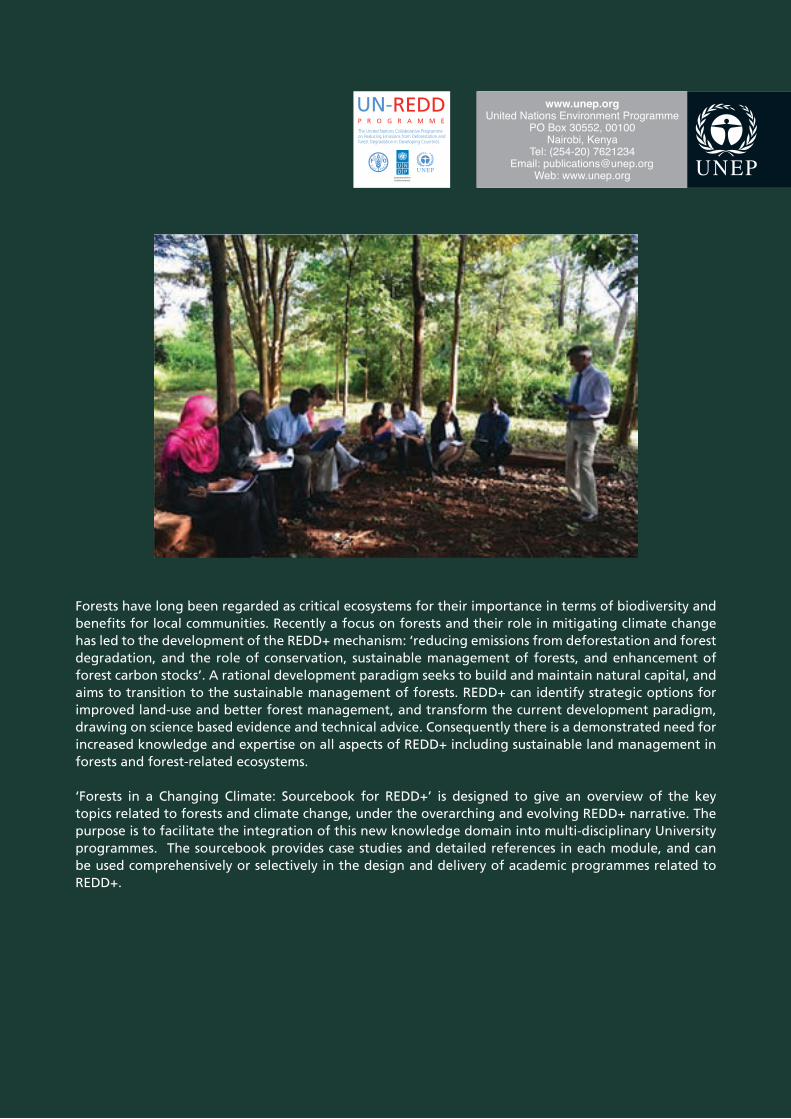
Forests in a Changing Climate:A Sourcebook for Integrating REDD+
into Academic Programmes
UN-REDDP R O G R A M M E
The United Nations Collaborative Programmeon Reducing Emissions from Deforestation andforest Degradation in Developing Countries.
Empowered lives.Resilient nations.
Forests have long been regarded as critical ecosystems for their importance in terms of biodiversity and benefits for local communities. Recently a focus on forests and their role in mitigating climate change has led to the development of the REDD+ mechanism: ‘reducing emissions from deforestation and forest degradation, and the role of conservation, sustainable management of forests, and enhancement of forest carbon stocks’. A rational development paradigm seeks to build and maintain natural capital, and aims to transition to the sustainable management of forests. REDD+ can identify strategic options for improved land-use and better forest management, and transform the current development paradigm, drawing on science based evidence and technical advice. Consequently there is a demonstrated need for increased knowledge and expertise on all aspects of REDD+ including sustainable land management in forests and forest-related ecosystems.
‘Forests in a Changing Climate: Sourcebook for REDD+’ is designed to give an overview of the key topics related to forests and climate change, under the overarching and evolving REDD+ narrative. The purpose is to facilitate the integration of this new knowledge domain into multi-disciplinary University programmes. The sourcebook provides case studies and detailed references in each module, and can be used comprehensively or selectively in the design and delivery of academic programmes related to REDD+.