Foreign Experience and CEO Compensation
58
1 Foreign Experience and CEO Compensation Martin Conyon a,b Lars Helge Haß c Skrålan Vergauwe c Zhifang Zhang d,* * Corresponding author a Bentley University, Massachusetts, MA 02452, USA b Senior Fellow, the Wharton School, University of Pennsylvania, Philadelphia, PA 19104, USA c Lancaster University Management School, Lancaster University, Lancaster, LA1 4YX, United Kingdom d Essex Business School, University of Essex, Colchester, CO4 3SQ, United Kingdom Email addresses: [email protected] (M.J. Conyon), [email protected] (L.H. Haß), [email protected] (S. Vergauwe), [email protected] (Z. Zhang).
Transcript of Foreign Experience and CEO Compensation
1
Foreign Experience and CEO Compensation
Martin Conyona,b Lars Helge Haßc Skrålan Vergauwec Zhifang Zhangd,*
* Corresponding author
a Bentley University, Massachusetts, MA 02452, USA
b Senior Fellow, the Wharton School, University of Pennsylvania, Philadelphia, PA 19104,
USA
c Lancaster University Management School, Lancaster University, Lancaster, LA1 4YX,
United Kingdom
d Essex Business School, University of Essex, Colchester, CO4 3SQ, United Kingdom
Email addresses: [email protected] (M.J. Conyon), [email protected] (L.H.
Haß), [email protected] (S. Vergauwe), [email protected] (Z. Zhang).
2
Foreign Experience and CEO Compensation
Abstract: This paper investigates the relationship between a CEO’s foreign experience and
CEO compensation. Our analysis is based on the constituent firms of the UK FTSE 350 index
from 1999 to 2015. We find that foreign CEOs and national CEOs with foreign working
experience receive significantly higher levels of total compensation compared to similar UK
CEOs without such characteristics. The results are robust to the endogenous CEO selection
using propensity score matching methods, as well as other modelling approaches. Our results
show that pay premiums are attributable to the specialized foreign expertise and foreign
networks of CEOs, which stem from foreign experience rather than broader general
managerial skills.
Highlights:
• We study the effect of CEO foreign experience on CEO total compensation.
• CEO foreign experience is associated with higher CEO total compensation.
• The impact is attributable to specialized foreign expertise and foreign networks of
CEOs.
Keywords: Foreign experience, corporate governance, executive compensation, international
business
JEL Classification: G3, G34, F23
3
1. Introduction
The globalization process is having a profound effect on product and labor markets,
and increasingly on CEO labor markets (Carpenter, Sanders, and Gregersen, 2000; Osawa
and Wong, 2015). Previous research overwhelmingly focuses on how CEO foreign
experience affects organizational behavior and outcomes (such as firm profitability). Little
attention has been paid to how CEOs themselves benefit from enhanced foreign experience.
CEOs with foreign experience are potentially highly valuable to the firm. One hypothesis is
that CEOs with international experience possess valuable foreign knowledge and access to
networks that increase the firm’s competitive advantage in the global market (e.g.,
Athanassiou and Nigh, 2005; Blomstermo et al., 2004; Useem 1984; Piaskowska and
Trojanowski, 2014; Sambharya, 1996). The corollary is that the CEOs’ own market value
increases as well. However, critics of this claim assert that it is the CEOs’ general managerial
ability that is more important than foreign experience, and that international complexity can
be managed through regional managers or local consultants (Carpenter, Sanders, and
Gregersen, 2000). The tension between these competing perspectives, therefore, warrants an
empirical investigation into the private returns to CEO from their foreign experience
exposure. Specifically, this paper addresses the central research question: Do CEOs earn a
compensation premium from foreign experience. Specifically, we test whether foreign CEOs
or CEOs with significant foreign managerial experience have higher pay compared to
similarly situated domestic CEOs.
Our paper blends two important streams of research in the extant literature. First, one
stream connects CEO characteristics, and especially foreign experience, to organizational
behavior and outcomes. One claim is that more foreign experience enhances firm
performance. Largely, this stream neglects the potential private benefits to the CEOs
4
themselves focusing instead on the returns to the enterprise (Cumming et al., 2017; Estélyi
and Nisar, 2016; Nielsen and Nielsen, 2013; Piaskowska and Trojanowski, 2014). Second,
there is a large stream of literature looking at the determinants of CEO compensation
(Brockman, Lee, and Salas, 2016; Bryan, Nash, and Patel, 2015 Burns, Jindra, and Minnick,
2017). The research on international CEO pay focuses on comparing executive compensation
across countries, but overlooks the potential influence of CEOs’ prior experience in foreign
countries on own CEO pay (Conyon et al., 2013; Conyon, Peck, and Sadler, 2009; Fernandes
et al., 2013). By focusing precisely on the private returns to CEO foreign experience, this
paper fills an important gap in the extant literature.
The theoretical motivation of the paper is motivated by and combines upper echelons
(Hambrick and Mason, 1984) and resource dependence theory (Salancik and Pfeffer, 1978).
It is hypothesized that firms that hire seasoned international CEOs are inclined to engage in
foreign markets, and that CEOs with foreign experience provide their firms with a
competitive advantage by providing them with both social capital (i.e. foreign networks) and
human capital (i.e. foreign knowledge). Foreign experience is valuable as it is both non-
substitutable and non-inimitable (Barney, 1991; Carpenter, Sanders and Gregersen, 2001;
Daily, Certo, and Dalton, 2000; Sambharya, 1996; Sullivan, 1994). The trend for
globalization also suggests that demand for CEOs with foreign experience will continue to
increase, placing upward pressure on CEOs’ compensation. Firms seeking to hire CEOs with
such foreign experience are therefore willing to offer a compensation premium. Firms’ levels
of internationalization may also affect CEOs’ total compensation, because CEOs’ foreign
experience might be more important and better realized in firms with higher levels of
international dependence. Therefore, it is likely that CEOs’ foreign experience will be
positively associated with total CEO compensation, and that the effect of CEOs’ foreign
experience will be stronger as firms’ level of internationalization increases.
5
The UK is an ideal research context for our study. First, UK firms have a higher
proportion of foreign CEOs (around 17 per cent), with more diverse nationalities than other
countries,1 providing ample sample variation to test the hypotheses. Second, the level of
mandated executive compensation disclosure is higher in the UK than in other European
countries. It is comparable to the high disclosure standards pertaining to the US market
(Vander Bauwhede and Willekens, 2008). Therefore, the UK provides the necessary high-
quality CEO compensation data. Third, in terms of global orientation, the UK holds the top
position among all European Union countries for both out-bound acquirers and in-bound
target markets, second only to the US worldwide (Allen and Overy, 2015). The sample of
firms we investigate, therefore, provides sufficient firm and time-series observations, as well
as maximizes the potential implications of the study. Last but not the least, our research
design focuses on a single country in order to avoid the correlated omitted variable problems
of multi-country studies, involving legal, regulatory, political, cultural and economic factors.
Our study focuses only on CEOs. This is because CEOs provide the most visible
signals to shareholders, and they differ significantly from other top managers on a number of
dimensions, including corporate influences, domestic influences and self-concepts (Daily,
Certo, and Dalton, 2000; Norburn, 1989). There is also an implicit assumption that power and
key decision-making authority are concentrated in the hands of CEOs (Herrmann and Datta,
2002). Our research design is therefore consistent with these prior studies.
1 For example, 0.4 per cent of directors are of foreign nationality in China between 1999 and 2009 (Giannetti,
Liao, and Yu, 2015), whereas 8.3 per cent of directors are from outside Nordic countries in 2008 (Oxelheim et
al., 2013). In comparison, the average proportions of foreign CEOs in the US, France and Germany for the same
sample period from 2003 to 2011, calculated from BoardEx data, are two per cent, six per cent and 10 per cent
respectively. In addition, foreign CEOs in China are manually identified for this study, based on data from
CSMAR, revealing an average of 0.5 per cent.
6
To test our research hypotheses, we construct a sample of large UK firms. These are
the constituents of the FTSE350 index between 1999 and 2015. The final sample consists of
489 unique firms, 1,078 unique CEOs and 4,727 firm years. We obtain data from three main
data sources: BoardEx, Datastream, and Thomson’s SDC Platinum. In terms of our variables
of interest, we focus on three different types to capture the CEO foreign experience: foreign
nationality, international education and foreign working experience.
This study produces new and significant findings in the areas of corporate finance and
international business. First, it documents that foreign CEOs earn significantly higher total
compensation than domestic CEOs. The magnitude of this effect is large and significant.
Estimates suggest an average foreign CEO pay premium of about 16 per cent (t=5.024,
p=0.000) after controlling for other firm-level and corporate governance factors. The findings
also show that national CEOs with foreign work experience earn significantly higher total
compensation than other domestic CEOs. Again, the magnitude of the effect is both large and
significant. The estimates suggest an average pay premium of about 10 per cent (t=4.620,
p=0.000) after controlling for other economic and governance factors. However, there is no
evidence that national CEOs with foreign education (as distinct from foreign work experience)
earn significantly different pay from other CEOs. The broad findings of this study are
consistent with the presumption that foreign CEOs possess detailed knowledge of the region
from which they originate (i.e. human capital) and that national CEOs with foreign working
experience possess useful networks of local contacts, personal networks with managers in
foreign firms and internal advice networks (i.e. social capital). Neither of these can easily be
obtained through foreign education alone.
Second, the study documents partial evidence that the relationship between CEOs’
foreign experience and total compensation differs when a firm’s level of internationalization
varies, as measured by its percentage of foreign sales. This provides important information
7
about the mechanism for foreign CEOs’ pay premiums. Previous studies suggest that firms
with higher degrees of international exposure may find the CEOs’ foreign knowledge and
networks particularly valuable (Daily, Certo and Dalton, 2000; Roth, 1995). Although our
results for CEO foreign working experience is consistent with this line of argument, our
results for CEO foreign nationality suggest that it is important for firms in different degree of
internationalization.
Third, we find that CEOs’ foreign experience has a positive impact on firms’ levels of
internationalization, and that firms are more likely to expand into regions where the CEOs
obtained their foreign experience. In addition, CEOs with foreign working experience
moderate the negative impact of cultural differences between acquirer and target countries
during foreign acquisitions. The results suggest that foreign pay premiums are partly
attributable to CEOs’ specialist foreign expertise, rather than broader general managerial
skills.
The main empirical results are robust to alternative estimation methods. The initial
results are isolated using panel data methods, controlling for firm and corporate governance
characteristics. However, recognizing that the selection of international CEOs may be
endogenous, propensity score-matching methods are used to ensure that firms hiring
international CEOs are statistically similar to firms hiring domestic CEOs. The propensity
score-matching algorithm provides a contemporary approach to address such endogeneity
challenges. The results reveal that the average treatment effect of foreign experience is
approximately 10 per cent and is statistically significant, with a t-statistic of 2.79. In addition,
the main results are robust to the use of lead-lag regressions, the negative binominal
regressions and the quadratic regressions. Overall, empirical analysis of the UK data
unambiguously points to pay premiums for CEOs’ foreign-experience.
8
Therefore, this study makes several important empirical contributions to a growing
literature on the impact and relevance of CEO characteristics. First, while prior international
business literature focuses on the value of CEOs’ foreign experience from the firms’
perspective, our research advances scholarly knowledge by showing the significant value of
foreign experience from the CEOs’ perspective. The study sheds light on the economic value
of foreign experience to a CEO, as measured by a CEO’s compensation premium. Second,
the study contributes to the debate on whether generalized or specialized CEO skills are more
valuable to a CEO. While previous studies indicate that general skills are more important, the
results of this study suggest that the pay premium depends on CEOs’ foreign experience that
generates specific foreign expertise and networks. Third, this study is believed to be the first
to provide detailed analysis of different channels through which foreign experience can be
obtained: education, working experience or nationality.
The remainder of this paper is organized as follows. Section 2 provides an overview
of relevant theories and presents the hypotheses; Section 3 describes the sample,
methodology and variables; Section 4 presents the empirical results; and Section 5
summarizes and concludes.
2. Literature and hypothesis development
2.1. Foreign experience and CEO compensation
Research on top managers has increased dramatically since Bertrand and Schoar’s
(2003) influential econometric study showed that top managers have a statistically significant
effect on corporate behavior. However, the business and management literature has long
recognized the importance of top managers in value creation. In a pioneering study, Dearborn
and Simon (1958) concluded that managers with different functional backgrounds vary in
9
their attitudes, knowledge and perspectives, leading to different strategic decisions. Building
on Dearborn and Simon (1958)’s study, Hambrick and Mason (1984) developed upper
echelons theory (UE), which states that organizational outcomes can to an extent be predicted
by the top management team’s background characteristics. Decision-making in organizations
is complicated by uncertainty, ambiguity and competing goals. Top managers will use their
cognitive bases and values to filter the information, interpret the situation and make strategic
decisions. UE theory relies on previous research and posits that demographic characteristics
(age, education, functional background, personality and other experience) serve to filter and
interpret that information.
Although not specified in Mason and Hambrick (1984), international experience is
expected to influence managers’ abilities and perceptions in making decisions in a similar
way. Prior research has confirmed the advantages to the firm of managers with international
experience. Using US Fortune 500 firms, Carpenter, Sanders, and Gregersen (2001) and
Daily, Certo, and Dalton (2000) show that firms with international CEOs have better
financial performance. In terms of strategic decisions, Herrmann and Datta (2005) show that
managers with international experience perceive lower risks associated with foreign
expansion than managers from different backgrounds with different levels of experience, and
are therefore more likely to engage in foreign direct investments. These results are confirmed
by Nielsen and Nielsen (2011) and Piaskowska and Trojanowski (2014).
While it is well-established that foreign experience has benefits to the firm, it is
unclear what the benefits to the CEO are. This study combines UE with resource dependence
theory (RDT). RDT asserts that organizations are comprised of bundles of unique resources
that are the key to organizational success. These resources and how a firm relies on them will
ultimately affect firms’ behavior and strategy (Salancik and Pfeffer, 1978). CEOs’ foreign
experience is valuable as it is both non-substitutable and inimitable (Carpenter, Sanders, and
10
Gregersen, 2001; Daily, Certo, and Dalton, 2000): it is non-substitutable as it provides CEOs
with skills that are not easily substituted through other channels (Sambharya, 1996; Sullivan,
1994) and is inimitable as it is a function of unique historical conditions (Barney, 1991).
These factors create competitive advantage for firms in the right organizational context and
increase CEOs’ market value. Moreover, in an era of globalization, as firms start to target
fast-growing foreign markets and aim to develop market share abroad, more firms are in need
of top managers with foreign experience (Lublin, 1996). Compared with the demand, the
supply of CEO candidates with foreign experience is lacking. RDT therefore suggests that
firms should offer higher rewards in order to recruit and retain talented CEOs (Coff, 1997) as
their foreign experience are valuable for firm performance as indicated by UE.
On the one hand, the previous literature suggests that valuable network capital
increases executives’ bargaining power in the labor market, and that this is reflected in
executive compensation (Brown et al., 2012; Engelberg, Gao, and Parsons, 2013;
Geletkanycz, Boyd, and Finkelstein, 2001). In terms of human capital, international
experience develops global mindsets in top managers, enabling them to engage in global
operations (Piaskowska and Trojanowski, 2014; Sambharya, 1996). In particular, foreign
CEOs have detailed knowledge of the region from which they originate, including economic
and market factors as well as institutions such as culture and norms (Nielsen and Nielsen,
2010).
On the other hand, critics of the above view point out that knowledge of the firm and
the industry, together with general expertise in a specific area, may be more important than
foreign experience. They argue that firms with ‘domestic’ CEOs with no foreign experience
may also be successful, as international complexity can be managed through region managers,
expatriates, locals or consultants (Carpenter, Sanders, and Gregersen, 2000). Moreover, prior
literature has found little empirical support for human capital factors explaining variation in
11
executive compensation (Leonard, 1990). In order to answer the empirical question of
whether CEOs with foreign experience receive higher pay, the following hypothesis is
posited:
H1. There is a positive association between total CEO compensation and CEO foreign
experience.
2.2. The moderating effect of firm internationalization
In the context of international strategic decisions, top managers with international
experience are vital in connecting firms to international markets, as they possess valuable
social and human capital. In terms of social capital, international experience enables
managers to build useful networks of local contacts (Blomstermo et al., 2004), personal
networks with managers in foreign firms (Useem, 1984), and internal advice networks
(Athanassiou and Nigh, 2005).
In addition to CEO foreign experience, the firm’s level of internationalization may
also affect CEO total compensation levels for several reasons. First, the CEO’s ability to
manage international complexity may be better realized and more critical to firms with
increasing international commitments (Ghoshal and Bartlett, 1990; Sanders and Carpenter,
1998). Moreover, as the level of firm internationalization increases, information-processing
demands and the task complexity of a CEO increases (Carpenter and Sanders, 2004; Conyon
et al., 2013). From an upper echelons perspective CEOs’ international experience may be
more important for firms with higher levels of international exposure as interpretation and
filtering of information to make decisions will be more challenging. Consequently, if foreign
experience is more important and can contribute more in such instances, CEOs with such
skills should receive a compensation premium over CEOs without such experience.
12
Second, the value of the CEO’s foreign experience increases as firms strengthen their
global strategic positioning and increase CEO’s discretion and bargaining power (Carpenter
and Fredrickson, 2001). Greater managerial discretion may lead to higher levels of CEO pay
(Finkelstein and Boyd, 1998). This line of reasoning suggests that the degree of firm
internationalization acts an important moderating factor in the relation between CEO
compensation and CEO foreign experience. Accordingly, we hypothesize that:
H2. The higher the level of firm internationalisation, the stronger (i.e. more positive) the
effect of CEOs’ foreign experience on total CEO compensation.
2.3. Foreign experience and firms’ international expansion
The rationale for Hypotheses 1 and 2 is the expectation that CEOs’ foreign experience
is valuable to the firm. From an upper echelons perspective, firms with CEOs who have
foreign experience are more likely to engage in foreign markets. Foreign experience among
top managers has been associated with lower psychological distance in doing business
overseas, in the form of appreciating differences in language, culture, business practices and
legislation (Melin, 1992), greater awareness of international opportunities (Black, 1997),
better ability to deal with the uncertainty associated with international opportunities
(Carpenter, Pollock, and Leary, 2003; Sambharya, 1996), and greater confidence in foreign
environments (Tung and Miller, 1990).
From a resource dependence perspective, CEOs with foreign experience provide
unique and vital resources to connect firms with international markets. Foreign experience
develops CEOs’ international networks, which in turn provide critical resources enabling
firms to compete in the global environment (Daily, Certo, and Dalton, 2000; Roth, 1995).
CEOs with foreign experience also have better knowledge of foreign local markets as well as
relevant stakeholders (e.g. suppliers, customers, employers), leading to better identification of
13
attractive investments. Furthermore, hiring an international CEO signals a firm’s willingness
to explore foreign markets, increasing its credibility among investors and stakeholders
(Schmid and Dauth, 2014).
All of the above factors are likely to result in CEOs with foreign experience
expanding their firms into foreign markets (Erramilli, 1991) and performing better in
acquisitions. Accordingly, it is hypothesized that:
H3a. CEOs’ foreign experience is positively associated with firms’ foreign expansion.
H3b. CEOs’ foreign experience is positively associated with firms’ foreign acquisition
performance.
3. Sample and Methodology
3.1. Data sources and sample
We use data from four separate sources. CEO compensation data, corporate
governance variables and CEO characteristics are obtained from BoardEx; missing CEO
nationality is manually filled based on FAME; firm-level data, including firm revenues, stock
returns and accounting data are derived from Datastream; data on foreign acquisitions are
obtained from Thomson’s SDC Platinum; and cultural distance index data are obtained from
Hofstede’s cultural dimensions.
14
The sample for this study consists of all firms in the UK’s FTSE 350 index between
1999 and 2015.2 We include only firms that are located in the UK. After excluding firms with
missing financial, stock market, corporate governance and CEO demographic background
information, the final sample consists of 489 unique firms, 1,070 unique CEOs and 4,727
firm years. The final sample contains 193 unique foreign CEOs and 793 firm years with
foreign CEOs, representing approximately 17 per cent of the original sample.
3.2. Methodology
First, to test our hypotheses, the following panel data regression model is estimated:
𝑦𝑖𝑡 = 𝛼 + 𝛽 ∗ 𝐹𝑜𝑟𝑒𝑖𝑔𝑛𝐸𝑥𝑝𝑒𝑟𝑖𝑒𝑛𝑐𝑒𝑖𝑡 +∑𝛾 ∗ 𝐶𝑜𝑛𝑡𝑟𝑜𝑙𝑉𝑎𝑟𝑖𝑎𝑏𝑙𝑒𝑠𝑖𝑡 +∑𝐼𝑛𝑑𝑢𝑠𝑡𝑟𝑦𝑘 +∑𝑌𝑒𝑎𝑟𝑡 + 𝜀𝑖𝑡
The dependent variable yit is CEO total compensation for Hypotheses 1 and 2, and
level of internationalization and acquisition performance for Hypothesis 3.
ForeignExperienceit captures three different types of foreign experience: nationality,
education and working experience. ControlVariablesit contains a set of firm-level control
variables. Definitions of the main variables are presented in Appendix A and explained in
Section 3.3. In addition, a set of industry dummies is included to capture inter-industry
differences, and a set of year dummies is included to control for macro-economic shocks.
It is difficult to identify statistically the causal effect of foreign experience on CEO
compensation. An ideal experimental design would require the random assignment of firms
into treatment and control groups, which is rare in general and impossible in this context
2 The constituent list of FTSE 350 firms is downloaded from Datastream for the beginning of each year
(January).
15
(Oxelheim et al., 2013). The OLS estimation proposed here assumes that the presence of an
international CEO is exogenous. However, it is likely to be endogenous, and depends on both
the firm’s demand for this attribute and the willingness of the candidate to join the firm
(Estélyi and Nisar, 2016; Masulis, Wang, and Xie, 2012). More specifically, executives with
foreign experience may be attracted to multinational firms because of their international skill
sets. Alternatively, firms seeking to expand internationally may hire these international CEOs.
The endogeneity of CEO selection is documented in the previous literature.
Magnusson and Boggs (2006) show that CEO selection decisions are influenced by both
CEOs’ international experience and firms’ levels of internationalization. Focusing on foreign
executive appointments, Greve, Biemann, and Ruigrok (2015) find that such appointments
are associated with individual experiential characteristics, the prior performance of the firm
and the firm’s overall level of internationalization. Therefore, a general concern in the
literature is that firms that employ international CEOs may be different from firms that do not,
for predictable and observable reasons. If these are correlated with the presence of
international CEOs, estimates derived from the OLS estimator will be biased and inconsistent.
In other words, in comparing two different firms, the coefficient of foreign experience
estimated by OLS will be overstated, as it captures the effect of other covariates in addition to
whether the CEO has foreign experience.
This study employs a propensity score-matching design to deal with the endogeneity
concern. This is a valid way to mitigate endogeneity if matching between CEOs and firms
may be based on predictable/observable characteristics (Angrist and Pischke, 2008;
16
Armstrong, Ittner, and Larcker, 2012; Rosenbaum and Rubin, 1983). 3 The purpose of
propensity score matching is to find a set of firms employing domestic CEOs that is as
statistically alike as possible to a set of firms employing international CEOs, using a
matching algorithm with observable features (Heckman, Ichimura, and Todd, 1998; Imbens,
2000). This then enables the average treatment effect of the treated international CEO group
(i.e. ATT) to be determined. In other words, after matching, differences in total compensation
could be attributed to whether or not the CEO have foreign experience, rather than to
differences in the other covariates.
3.3. Dependent variables
To test Hypotheses 1 and 2 we require a measure of CEO total compensation. This is
sum of salary, bonus, the value of stock options granted during the fiscal year, and the value
of restricted stock or other equity granted during the fiscal year. The data are measured at
annual intervals using data drawn from BoardEx. Table 1 shows that the average CEO in the
sample earned approximately £1,818,000. The median value is significantly lower, at around
£1,090,000, indicating that the distribution of CEO total compensation is skewed. Therefore,
the natural logarithm is used in the empirical analyses.
3 In principle, the panel nature of the data would have allowed the inclusion of firm-level fixed effects, but we
chose not to do so. Instead, the analysis relied on OLS and propensity score matching. Because the focus is on
the CEO rather than the firm, the main variables of interest have low within-firm variation. Also, the other right-
hand-side variables in the regression model are time-invariant. As a result, including firm-level fixed effects
would have absorbed much of the variation under investigation. Therefore, a firm-level fixed effects estimator is
not used. An alternative technique to deal with potentially endogenous right-hand-side variables is to use
instrumental variables. However, it is unclear ex ante what the correct identification restriction is that would
determine the selection of international CEOs but not total compensation. Therefore, appropriate instruments are
hard to find. The strategy adopted in this study is to address the potential endogenous selection of foreign CEOs
using propensity score matching methods.
17
To test Hypotheses 3a and 3b, we capture foreign expansion by the level of
internationalization with two measures: the percentage of foreign sales and the likelihood of
foreign acquisitions.4 We capture firm’s foreign performance by acquisition performance
with short-term cumulative abnormal returns around the acquisition announcement date.5 We
employ two event windows (-1, +1) and (-5, +1). The three-day window (-1, +1) has been
commonly used in merger and acquisition literature and we also include a longer event
window (-5, +1) to take into account the possibility of information leakage before the official
deal announcement (Aybar and Ficici, 2009; Schmid and Dauth, 2014).
{Insert Table 1 about here}
3.4. Independent variables
Our central explanatory variables are CEO foreign experience. Previous studies use
different measures to capture top managers’ international experience; and the insights from
such studies inform out analyses. Early research relied on the number of years of
international assignments (Carpenter and Fredrickson, 2001; Daily, Certo, and Dalton, 2000;
Sullivan, 1994). As top managers’ internationalization is a multi-dimensional phenomenon, a
more comprehensive measure is required to fully capture top managers’ international
exposure (Lee and Park, 2006). Black (1997) uses nationality of the top management team as
4 As sales data in Datastream contain limitations, we follow Dastidar (2009) approach to obtain our final data
with adjustments tailored for our study (see detail in Appendix C).
5 Calculation details are available upon request.
18
a proxy for international orientation. Herrmann and Datta (2005) calculate the percentage of
individuals in the top management team with international work experience. In addition, with
a concern that any indicator only covers a certain aspect of managers’ international
experience (Nielsen, 2010), some studies produce a composite index by combining several
types of international experience (Lee and Park, 2008; Oxelheim et al., 2013; Schmid and
Dauth, 2014). However, the effects of each type are then overlooked.
This study seeks to fill this void by analyzing three distinct types of CEO foreign
experience: foreign nationality, international education and foreign working experience.
These are captured by Foreign CEO, National CEO with foreign education and National
CEO with foreign working experience. Since foreign CEOs are likely to have foreign
education and foreign working experience, only national CEOs’ foreign education and
working experience are considered in order to isolate their impact from that of foreign CEOs.
By not combining several types into a single index, as in the previous literature, this study
provides detailed analysis of the impact of each type. Appendix B presents the country
distribution of foreign CEOs’ nationality in this study. The largest number of non-UK CEOs
is from the US, followed by Ireland, Australia and France. As shown in Table 1, around 17
per cent of CEOs in the sample are of foreign nationality, 13 per cent have foreign education,
and 38 per cent have foreign working experience.
3.5. Control variables
In addition to the main explanatory right-hand side variables, a set of firm-specific
economic and corporate governance control variables are also used. Previous studies find that
these variables have a potentially important effect on CEO compensation (Carpenter, Sanders,
and Gregersen, 2001; Murphy, 1999).
19
With regards to firm-specific economic controls, the size of the firm is proxied by the
logarithm of sales. The positive correlation between CEO compensation and firm size is one
of the most robust findings in the CEO pay literature (Murphy, 1999). We also control for the
firms’ level of internationalization, which is proxied by the firm’s percentage of foreign sales.
To avoid confounding the impact of international diversification and industrial diversification,
the number of industry segments is also included (Carpenter, Sanders, and Gregersen, 2001;
Dastidar, 2009; Giannetti, Liao, and Yu, 2015). All three of these control variables account
for the degree of organizational complexity, arising from firm scale and globalization.
Agency theory, too, predicts that CEO compensation is determined by firm performance,
signaling CEO effort (Murphy, 1999; Holmstrom, 1979). Firm performance is proxied by
returns on assets and stock returns, capturing accounting-based and market-based
performance. Firm growth opportunity is proxied by the market-to-book ratio. Firm risk is
proxied by stock volatility and leverage. Stock volatility is the standard deviation of
annualized monthly stock re-turns over the calendar year, and leverage is computed as total
debt over total assets. The measurement of these is consistent with prior studies (Core,
Holthausen and Larcker, 1999).
In terms of corporate governance controls, board characteristics are captured by the
natural logarithm of board size, the natural logarithm of compensation committee size, CEO–
chair duality and non-executive ratio. CEOs’ skills and experience are proxied by the
logarithms of CEO age and tenure. In addition, the study controlled for the effect of
internationalization of the board (Carpenter, Geletkanycz, and Sanders, 2004; Certo et al.,
2006; Finkelstein et al., 2009). Boards’ nationality diversity is proxied by the Blau index of
diversity (Blau, 1977). As shown in Table 1, firm-level characteristics and corporate
governance variables are consistent with other studies based on UK data (Conyon, Peck, and
Sadler, 2009; Gerakos, Piotroski, and Srinivasan, 2013).
20
In examining acquisition performance, following the previous literature (Aybar and
Ficici, 2009), our study also controls for common acquisition deal-specific characteristics.
These include relative size, prior cross-border acquisition experience, publicly-listed target,
acquirer and target firms being in the same industry, cash/stock payments only, tender offers
and stakes held prior to acquisition. In addition, a cultural distance index (CDI)6 is included
to measure cultural differences between target and acquiring countries, as well as interactions
between difference types of CEO foreign experience and CDI. Higher value of cultural
distance means higher cultural distance between target and acquiring countries.
4. Empirical Results
Before conducting the multivariate regression analysis, we first compute Pearson
correlation coefficients between the independent variables to ensure the validity of the
regression results. Table 2 shows the resulting correlation matrix, which indicates no severe
multicollinearity problems. We also compute the variance inflation factors (VIFs) of
independent variables for each regression and show the highest VIF at the bottom of
regression tables. All values are below a recommended threshold value of ten (Hair et al.,
2009), confirming multicollinearity is not a major problem in our analyses.
{Insert Table 2 about here}
6 The cultural distance index is computed based on methods used in Aybar and Ficici (2009), and we extend
their method by including all six dimensions (they used four) as the data covers large number of countries since
2011.
21
4.1. Foreign experience and CEO compensation
Table 3 shows the results of the analyses testing Hypotheses 1 and 2 based on the
OLS estimator (with robust standard errors).7 Column 1 includes the variables of interest
(Hypothesis 1). Except for national CEO with foreign education, the coefficients for both
foreign CEO and national CEO with foreign working experience are positively correlated
with total compensation. The economic magnitudes of these two CEO foreign experience
coefficients are also significant. CEOs with foreign nationality and national CEOs with
foreign working experience received higher total compensation, by approximately 35 per cent
(t=9.205, p=0.000) and 17 per cent (t=6.159, p=0.000) respectively. This may be explained
by variations in the quantity and quality of value provided by different types of foreign
experience.
Foreign CEOs provide valuable human capital to the firm as they have detailed
knowledge of the region from which they originate, including economic and market factors as
well as institutions such as culture and norms. On the other hand, national CEOs with foreign
working experience provide firms with valuable social capital, as they have useful networks
of local contacts, personal networks with managers in foreign firms and internal advice
networks. Neither of these can be easily obtained through foreign education.
Column 2 of Table 3 includes common controls predicting total compensation. While
the coefficients for foreign CEO and national CEO with foreign working experience remain
7 Year and industry dummies are included but are not reported for ease of exposition. We also experimented
with including other CEO characteristics such as gender and the log of CEO network size. The main results are
robust to including these factors. Results available on request.
22
significant, their economic magnitudes decrease to 16 per cent (t=5.024, p=0.000) and 10 per
cent (t=4.620, p=0.000) respectively. The impact of foreign experience is still substantial,
increasing total pay by around a third. These results are consistent with Hypothesis 1. The
coefficients for the control variables are consistent with previous studies based on UK data
(Conyon, Peck, and Sadler, 2009; Kabir and Minhat, 2014). We recognize that firms might
need to provide higher compensation to attract willing candidates to move from home and
work in a foreign country. However, unlike foreign CEOs, national CEOs who have foreign
working experience or education probably live domestically and do not require the extra
incentive to move abroad when being appointed. Our results show that not only foreign CEOs,
but also CEOs with foreign working experience receive higher compensation, indicating that
the result found is not due to labor mobility.
Column 3 includes interactions between the three types of CEO foreign experience
and the percentage of foreign sales, enabling analysis of the moderating effect of levels of
internationalization on the relationship between CEO foreign experience and total
compensation (Hypothesis 2). In terms of foreign CEOs, while the coefficient remains
significant (𝛽=0.148, t=2.298, p=0.022), its interaction with the percentage of foreign sales is
insignificant (t=0.500, p=0.617). On the other hand, while the coefficient for national CEOs
with foreign working experience becomes insignificant (t=1.398, p=0.162), the coefficient for
the interaction with the percentage of foreign sales is positive and significant (𝛽=0.140,
t=2.372, p=0.018). In general, we find partial evidence towards Hypothesis 2 that firms with
higher levels of internationalization might be willing to pay more to recruit and retain CEOs
with foreign experience. It is possible that firms hire CEOs from a specific region because
they have intention to expand into that region. However, we believe firms hire an
international CEO, not only for their knowledge of a specific region, but also for the global
mind-set that a CEO develops through prior foreign experience, which might provide long
23
term benefits to the firm (Gupta and Govindarajan 2002; Levy et al., 2007; Sambharya, 1996;
Piaskowska and Trojanowski, 2012). In particular, Foreign experience among top managers
has been associated with lower psychological distance in doing business overseas, in the form
of appreciating differences in language, culture, business practices and legislation (Melin,
1992), greater awareness of international opportunities (Black, 1997), better ability to deal
with the uncertainty associated with international opportunities (Carpenter et al., 2003;
Sambharya, 1996), and greater confidence in foreign environments (Tung and Miller, 1990).
{Insert Table 3 about here}
To better understand the effects of foreign experience on CEO compensation, two
further analyses are performed. First, each of the foreign experience variables is examined in
greater depth in Table 4. The highest VIF presented in each column indicates that there is not
a serious multi-collinearity problem among each sub-set of foreign experiences variables. In
Column 1, Foreign CEOs are split between foreign CEOs without UK experience, foreign
CEOs with UK education and foreign CEOs with UK working experience. Results reveal that
foreign CEOs without any UK experience and foreign CEOs with UK working experience
are responsible for the main impact of foreign CEOs. A foreign CEO with UK working
experience also has a statistically significant impact on total compensation, indicating that
UK working experience is also valuable for a foreign CEO. In Column 2, national CEOs with
foreign education are then split between those with foreign MBA education and foreign non-
MBA education. Neither of these are significant, which is inconsistent with our expectation
that foreign MBA provides a vital channel for CEOs to gain social capital (e.g. international
networks), which will be rewarded in compensation contracts. In Column 3, national CEOs
24
with foreign working experience are split between those with foreign board experience and
foreign non-board experience. Both foreign board and non-board experience contribute to the
impact of national CEOs with foreign working experience, suggesting that firms appreciate
not only the skills and reputation of CEOs who have foreign board working experience, but
also the networks that CEOs gain from foreign non-board experience. The results also
suggest that firms value both CEOs’ human capital, and their social capital stemming from
foreign experience.
{Insert Table 4 about here}
Second, the potential ‘US CEO’ effect is considered in Table 5. Gerakos, Piotroski,
and Srinivasan (2013) find that greater market interaction with the US market by non-US
firms is associated with greater use of US-style pay as a reduction in the US-UK pay gap. To
examine whether US-related CEOs drive the main effect of foreign CEOs, we split all three
types of foreign experience into US experience and non-US foreign experience. Similar as
Table 4, Column 1 shows the results of the split of foreign nationality. The results reveal that
the coefficients of both US CEOs and non-US foreign CEOs are statistically and
economically significant, indicating that foreign CEO effect matters in addition to the US
CEO effect. In Column 2, we split the foreign education and find marginal positive effect in
CEO with US education while no effect in CEO with non-US foreign education. In Column 3,
we split the foreign working experience. Similar to foreign nationality, we find that national
CEO with non-US foreign working experience has significant effect on CEO total
compensation in addition to the US foreign working experience. In general, the results
25
suggest that the foreign experience effect does not reflect US effect solely and that non-US
foreign experience have incremental effect on the US experience.
In summary, the empirical results largely confirm Hypothesis 1 and 2. The findings
reveal that the presence of both foreign CEOs and national CEOs with foreign working
experience is positively correlated with total compensation. However, we only find partial
evidence that levels of firm internationalization have a moderating effect on this relation.
{Insert Table 5 about here}
4.2. Endogeneity
A primary concern is that the presence of an international CEO may be endogenous.
As described earlier, this study primarily employs a propensity score-matched pair research
design to help resolve selection bias. The propensity score matching method proceeds in two
steps. The first step is to predict the selection decision of international CEOs, by estimating a
probit model of the binary outcome that equals one if the firm hires an international CEO,
with observable firm characteristics as explanatory variables.8 Table 6 shows the results of
two probit models (one with economic covariates only, and the other with economic and
governance covariates). All explanatory variables are lagged by one year, while controlling
for industry and year.
8 We find that firm characteristics have different effects on firms’ choice of CEOs with different types of
foreign experience. To investigate a set of universal factors, a composite international experience indicator is
employed that equals one if the CEO has any type of foreign experience.
26
The results in Table 6 show that firms that hired an international CEO differ
systematically from those that did not, indicating that the selection of international CEOs is
strongly endogenous with firm-level characteristics. The results shown in Column 1, which
includes only economic covariates, suggest that more internationalized firms are more likely
to hire international CEOs, consistent with Magnusson and Boggs’ (2006) and Miletkov,
Poulsen, and Wintoki’s (2016). Also, the results indicate that larger and more industrially
diversified firms that perform less well and have higher risk are more likely to select
international CEOs. The results in Column 2, which includes both economic and governance
covariates, show that governance covariates also influence the choice of international CEOs.
Board diversity, board size, the independent director ratio are positively correlated with the
presence of international CEOs, while the coefficients for the size of compensation
committee and CEO tenure are negative.
{Insert Table 6 about here}
Consistent with the previous literature (Greve, Biemann, and Ruigrok, 2015;
Magnusson and Boggs, 2006), the findings of this study suggest that appointments of
international CEOs are influenced by firm size, the quality of corporate governance, firms’
levels of internationalization, prior performance, and the experiential characteristics of CEO
candidates. The predicted probability (i.e. the propensity score) of the presence of
27
international CEOs, shown in Column 2 of Table 6, forms the basis of the matching
procedure.
In the second step, we match firms using a nearest neighbor algorithm with caliper
0.01, with no replacement and we restrict the observations to be on the common support.9
Table 7 presents the average treatment effect of international experience on the total
compensation.10 After matching based on firm economic and governance characteristics, we
find that the difference of the mean log compensation between the treated group and control
group decreases from 0.26 to 0.10 which is around one third of reduction, indicating that the
impact of CEO foreign experience is overstated before the matching (i.e. with OLS). Even so,
the economic impact is still significant. Moreover, we find that the difference after the
matching is statistically significant with t-statistics at 2.79, indicating that compensation
premium on CEO foreign experience still exists after controlling for selection effects.11
In addition to the propensity score matching, following Ozkan (2011) and Hartzell
and Starks (2003), we use lagged explanatory variables (i.e. lead-lag regression) to alleviate
the concern of endogeneity with regards to reverse causality. Results in Table 8 Panel A
suggest that our main results are not sensitive to the lead-lag regression models.
9 Appendix D provides assessment of the efficacy of our matching by examining the covariate balance
between the matched pairs.
10 We find that 2,793 out of 3,898 observations are in common support, indicating sufficient observations for
us to make valid inferences. We achieve much more observations (3,880) in common support if we require
replacement. However, as the observations are not independent when matched with replacement, we prefer not
to use replacement (Peel and Makepeace, 2012). The results are not sensitive with or without replacement.
11 It is worth noting that while OLS regressions provides an average estimate of pay premium for the whole
sample (ATE), matched treatment premiums (ATT) are restricted and can only be generalized to the common
support (Peel and Makepeace, 2012; Tucker, 2010).
28
In summary, compensation premiums for CEO foreign experience remain statistically
and economically significant after applying propensity score matching and lead-lag
regression approach.
{Insert Table 7 about here}
4.3. Alternative modelling approaches
Two alternative approaches are considered to confirm the robustness of our results.
First, while we take the natural logarithm of CEO total compensation to address the skewed
distribution issue and apply it in our OLS regressions, previous studies suggest negative
binominal and Poisson models as alternative approaches (Cameron and Trivedi, 1998).12 The
advantage of negative binominal and Poisson models compare to OLS is that they will not
provide negative predicted values for CEO total compensation (Manner, 2010). As both
negative binomial and the Poisson models are designed for dependent variables that are non-
negative discrete integers, we convert total compensation into count data. The resulting count
variable of total compensation has a median of 2, mean of 3.04 and variance of 17.46. As the
variance is greater than the mean (i.e. over-dispersion), a negative binominal regression is
more appropriate rather than Poisson regression. The results are shown in Table 8 Panel B.
The findings show that our main results are robust to the negative binominal models.
12 We thank the referee for suggesting this approach.
29
Second, based on methods explained in Haans et al. (2016), the length of foreign
working experience and its square13 are used for examining potential quadratic relationship
between CEO foreign experience and total compensation. We expect an inverted U-shaped
pattern, that CEOs with moderate level of foreign experience might receive higher
compensation than other CEOs with too much or too little foreign experience. The mean and
median years of CEO foreign working experience is 15.04 and 13, respectively. In Table 8
Panel C, we include both the length of foreign working experience and its square term. Both
Column 1 and Column 2 show no evidence of a quadratic relation as the coefficient for the
square term is insignificant. In other words, it is unlikely that a CEO will find a negative
impact on compensation for having too much foreign experience.
{Insert Table 8 about here}
4.4. Foreign experience and firms’ international expansion
Table 9 shows the results of analyses testing Hypotheses 3a and 3b. The first analysis
tests whether CEO foreign experience affected firms’ levels of internationalization (Panel
A).14 Similar patterns of results are found with two different measures (the percentage of
foreign sales and the likelihood of foreign acquisitions). In general, the coefficients for both
13 Length of foreign working experience captures the number of years a CEO has spent in working for foreign
companies not located in the UK.
14 Consistent with the M&A literature, to investigate acquisitions, a reduced sample (acquisition sample) is
used, consisting of 2,176 100-per-cent stake acquisitions completed by UK firms from 1999 to 2015. Following
Moeller and Schlingemann (2005), acquisitions are only considered where the bidder ended up owning 100 per
cent of the target firm’s assets or an entire subsidiary and the transaction value exceeds one million dollars.
30
foreign CEOs and national CEOs with foreign working experience are positively associated
with higher levels of internationalization. This shows that CEOs with foreign experience are
associated with the firm’s capacity to expand globally.15 The geographic connection between
CEO foreign experience and firms’ expansion strategy is considered in Column 3 and 6, by
including the interactions between different types of foreign experience and an indicator (i.e.
Same region) that equals one if the CEO has foreign experience in the same region of the
foreign sales or acquisitions. The coefficients for all three interactions are positive and
significant, indicating that firms’ internationalization and the foreign experience of CEOs are
geographically connected. These results are consistent with Hypothesis 3a and provide strong
evidence that CEOs’ foreign experience in a specific region increases firms’ investment
opportunities in that region.
An event study (Table 9 Panel B) is conducted to investigate whether CEOs’ foreign
experience affected firms’ acquisition performance, but this provides no evidence of
correlation between CEOs’ foreign experience and short-term performance.16 However, a
negative coefficient for the CDI indicates that the higher the cultural distance between target
and acquirer country, the lower the short-term performance. The coefficient for the
interaction between national CEOs with foreign working experience and CDI is positive and
significant (Column 3: 𝛽=0.004, t=2.057, p=0.039; Column 6: 𝛽=0.005, t=1.855, p=0.064).
15 Since some firms have no foreign sales, the model is also examined using Tobit regressions left-censored at
zero, with similar results. In addition, to account for the possibility of reverse causality, the actual percentage of
foreign sales is replaced with changes in the percentage of foreign sales, and the results still hold.
16 In further robustness tests, a variety of different event windows are also used, including windows dates from
(-3, +3), (-5, +5), (10, +10), and (-10, +5). We find that the main qualitative results highlighted in the text
remain intact.
31
This suggests that CEOs with foreign working experience buffer the negative impact of CDI
on short-term acquisition performance, ameliorating the ‘liability of foreignness’.
We also conducted an analysis to examine whether the CEO’s foreign experience
affects the firm’s overall performance, captured by returns on assets and stock returns (results
not tabulated).17 We were unable to isolate a consistent statistical relation between these
measures of firm performance and CEO foreign experience. This suggests that CEOs with
foreign experience are not necessarily ‘better’ or ‘more valuable’ than their counterparts with
less foreign experience. We interpret this as meaning that the CEO pay premium observed for
CEOs with foreign experience is not simply because they possess better general managerial
skills that are valuable to the firm.
In summary, the results suggest that CEOs with specialist foreign knowledge may be
the best match for firms where such knowledge is an important component of the CEO skills
set. The results also suggest that the pay premium for CEOs with foreign experience is
attributable to the value of their foreign expertise rather than their general managerial skills.
{Insert Table 9 about here}
5. Conclusions
This study investigates the relationship between measures of a CEO’s foreign
experience and their total compensation. The process of globalization is increasing the
17 Regression results are available upon request.
32
demand for scarce internationally-seasoned CEOs, and such forces are likely to increase the
price of CEO talent. This idea is tested using data from a sample of large UK firms between
1999 and 2015.
Our research provides compelling empirical evidence that CEO pay is higher with the
more foreign experience has amassed compared to domestic-only experience. This is the
main empirical finding of our study. An array of diagnostic tests are performed to ensure the
general robustness of the main findings. Specifically, the observed foreign CEO pay premium
is robust to controlling for firm-specific and corporate governance characteristics, as well as
the endogenous determination of international CEO status. The results also suggest that pay
premiums for international CEOs are attributable to the value of their foreign expertise and
foreign networks, stemming from foreign experience, rather than their general managerial
skills.
This study has significant and potentially far ranging implications for other scholars,
as well as for practicing managers. Given the substantial private returns of foreign experience
to CEOs, as well as to their firms, this study highlights the potential importance of investing
in foreign experience as a crucial part of the accumulation of human and social capital. In
addition, firms might find it beneficial to invest in their executives’ international experience
as a mechanism to generate important future competitive advantage, and executives might be
encouraged to undertake such opportunities for career development. Our empirical results
suggest a positive-sum game, whereby both firms and CEOs gain form international
experience. Moreover, in showing that CEOs’ foreign experience influences their corporate
strategy decisions, this study highlights the importance of fit and complementarity between
executive experience and the firm. The CEO selection process might be optimized to better
match with corporate strategy, thereby gaining competitive advantage, especially in the
global market. Last, but not least, by documenting that CEO foreign experience affects
33
acquisition performance, this study provides practical trading strategies for investors,
especially around announcements of foreign acquisitions.
As with all studies, our research has a range of limitations that might form the basis
for future research. A single study cannot hope to address fully all issues in a research
domain, but our research has suggested some important future avenues for investigation. First,
our study is based on a set of large UK firms. Although these are major enterprises,
accounting for an overwhelming share of capitalization on UK equity markets, it raises the
question of whether the results are generalizable to other types of UK firms not include in the
sample (e.g. small firms and/or private firms). Also, although we believe our results are
reasonably generalizable to other highly developed capital markets that share similar features
as UK, we encourage future studies to confirm our results in other context and are
generalizable to the rest of the world. Second, due to data limitations, it is not possible to
examine alternative proxies of firms’ foreign activities, such as foreign production,
geographic dispersion and cross-listings. These are, of course, other important features of the
firm’s corporate decision making. Whilst we have examined highly salient features of
strategic decision making (returns to owners, corporate acquisitions) the list of all strategic
decisions was not exhausted. Future studies might also explore other aspects in which
international CEOs might help create value for firms, such as access to international capital,
and the choice of capital structure in terms of the amount of equity or leveraged debt in the
firm.
In addition, this paper provides some contribution to upper echelons theory (UE) by
documenting empirical evidence on the following two aspects. First, Hambrick (2007)
provides an updated view of UE and argues future research could incorporate research on
compensation and UE theory and study the interaction. Second, Hambrick (2007)

34
acknowledges that UE theory has mainly been tested on US firms and it is unknown if the
theory holds in other environments.
In conclusion, this study provides a better understanding of how CEOs’ foreign
experience determines their compensation contracts, and should act as a spur to further
research in the field of CEO compensation and international management.
35
Acknowledgements
We would like to thank Igor Filatotchev, Greg Bell, Annette Poulsen, Sujata Banerjee,
Sinziana Dorobantu, Sohnke Bartram, Denis Schweizer, David Mauer, Gaberiel Beneito,
Ugur Lel, Steve Thompson, Shantanu Banerjee, Lerong He, Wayne Landsman, Beatriz
Garcia Osma, and participants at the Journal of Corporate Finance Paper Development
Conference. In addition, we thank participants at the EAA 32nd Doctoral Colloquium and the
ESRC-NWDTC workshops 2015 (at The University of Manchester) and 2014 (at Lancaster
University) for helpful comments. Research assistance was provided by Daisy Zhu.
36
References
1. Allen & Overy (2015). M&A Index, Q3 2015. London: Allen & Overy.
2. Angrist, J. D., & Pischke, J.-S. (2008). Mostly Harmless Econometrics: An
Empiricist’s Companion. Princeton, NJ: Princeton University Press.
3. Antia, M., Lin, J. B., & Pantzalis, C. (2007). Cultural distance and valuation of
multinational corporations. Journal of Multinational Financial Management, 17(5),
365-383.
4. Armstrong, C. S., Ittner, C. D., & Larcker, D. F. (2012). Corporate governance,
compensation consultants, and CEO pay levels. Review of Accounting Studies, 17(2),
322-351.
5. Athanassiou, N., & Nigh, D. (2005). The impact of US company internationalization
on top management team advice networks: A tacit knowledge perspective. In I.
Nonaka (ed.), Knowledge Management: Critical Perspectives on Business and
Management, Vol. 3. Oxford: Taylor & Francis, pp. 79-94.
6. Aybar, B., & Ficici, A. (2009). Cross-border acquisitions and firm value: An analysis
of emerging-market multinationals. Journal of International Business Studies, 40(8),
1317-1338.
7. Barney, J. (1991). Firm resources and sustained competitive advantage. Journal of
Management, 17(1), 99-120.
8. Beber, A., & Fabbri, D. (2012). Who times the foreign exchange market? Corporate
speculation and CEO characteristics. Journal of Corporate Finance, 18(5), 1065-1087.
9. Berger, P. G., & Ofek, E. (1995). Diversification's effect on firm value. Journal of
Financial Economics, 37(1), 39-65.
10. Bertrand, M., & Schoar, A. (2003). Managing with style: The effect of managers on
firm policies. The Quarterly Journal of Economics, 118(4), 1169-1208.
11. Black, S. S. (1997). Top management team characteristics: A study of their impact on
the magnitude on international operations and international performance. Doctoral
dissertation, Columbia University, New York, NY.
12. Blau, P. M. (1977). A Macrosociological Theory of Social Structure1.American
Journal of Sociology, 83(1), 26-54.
13. Blomstermo, A., Eriksson, K., Lindstrand, A., & Sharma, D. D. (2004). The perceived
usefulness of network experiential knowledge in the internationalizing firm. Journal
of International Management, 10(3), 355-373.
14. Brookhart, M. A., Schneeweiss, S., Rothman, K. J., Glynn, R. J., Avorn, J., &
Stürmer, T. (2006). Variable selection for propensity score models. American Journal
of Epidemiology, 163(12), 1149-1156.
15. Brockman, P., Lee, H. S. G., & Salas, J. M. (2016). Determinants of CEO
compensation: Generalist–specialist versus insider–outsider attributes. Journal of
Corporate Finance, 39, 53-77.
37
16. Brown, R., Gao, N., Lee, E., & Stathopoulos, K. (2012). What are friends for? CEO
networks, pay and corporate governance. In S. Boubaker, B. D. Nguyen, & D. K.
Nguyen (eds), Corporate Governance. Berlin, Germany: Springer, pp. 287-307.
17. Bryan, S., Nash, R., & Patel, A. (2015). The effect of cultural distance on contracting
decisions: The case of executive compensation. Journal of Corporate Finance, 33,
180-195.
18. Butler, A. W., & Gurun, U. G. (2012). Educational networks, mutual fund voting
patterns, and CEO compensation. The Review of Financial Studies, 25(8), 2533-2562.
19. Burns, N., Jindra, J., & Minnick, K. (2017). Sales of Private Firms and the Role of
CEO Compensation. Journal of Corporate Finance, 43, 444-463.
20. Caliendo, M. (2006). Microeconometric Evaluation of Labour Market Policies.
Berlin, Germany: Springer Science & Business Media.
21. Caliendo, M., & Kopeinig, S. (2008). Some practical guidance for the implementation
of propensity score matching. Journal of Economic Surveys, 22(1), 31-72.
22. Cameron, C. A., & Trivedi, P. K. (1998). Regression Analysis of Count Data.
Cambridge: Cambridge University Press.
23. Carpenter, M. A., & Fredrickson, J. W. (2001). Top management teams, global
strategic posture, and the moderating role of uncertainty. Academy of Management
journal, 44(3), 533-545.
24. Carpenter, M. A., Geletkanycz, M. A., & Sanders, W. G. (2004). Upper echelons
research revisited: Antecedents, elements, and consequences of top management team
composition. Journal of Management, 30(6), 749-778.
25. Carpenter, M. A., Pollock, T. G., & Leary, M. M. (2003). Testing a model of reasoned
risk‐taking: Governance, the experience of principals and agents, and global strategy
in high‐technology IPO firms. Strategic Management Journal, 24(9), 803-820
26. Carpenter, M. A., Sanders, W., & Gregersen, H. B. (2000). International assignment
experience at the top can make a bottom-line difference. Human Resource
Management, 39(2-3), 277-285.
27. Carpenter, M. A., Sanders, W. G., & Gregersen, H. B. (2001). Bundling human
capital with organizational context: The impact of international assignment
experience on multinational firm performance and CEO pay. Academy of
Management Journal, 44(3), 493-511.
28. Certo, S. T., Lester, R. H., Dalton, C. M., & Dalton, D. R. (2006). Top management
teams, strategy and financial performance: A meta‐analytic examination. Journal of
Management Studies, 43(4), 813-839.
29. Coff, R. W. (1997). Human assets and management dilemmas: Coping with hazards
on the road to resource-based theory. Academy of Management Review, 22(2), 374-
402.
30. Conyon, M. J., Peck, S. I., & Sadler, G. V. (2009). Compensation consultants and
executive pay: Evidence from the United States and the United Kingdom. The
Academy of Management Perspectives, 23(1), 43-55.
38
31. Conyon, M. J., Peck, S. I., & Sadler, G. V. (2011). New perspectives on the
governance of executive compensation: an examination of the role and effect of
compensation consultants. Journal of Management & Governance, 15(1), 29-58.
32. Conyon, M. J., Fernandes, N., Ferreira, M. A., Matos, P., & Murphy, K. J. (2013).
The executive compensation controversy: A transatlantic analysis. In T. Boeri, C.
Lucifora, & K. J. Murphy (eds), Productivity, Profit and Pay. Oxford: Oxford
University Press, pp. 9-115.
33. Core, J.E., Holthausen, R.W. and Larcker, D.F., 1999. Corporate governance, chief
executive officer compensation, and firm performance. Journal of Financial
Economics, 51(3), 371-406.
34. Cumming, D., Filatotchev, I., Knill, A., Reeb, D. M., & Senbet, L. (2017). Law,
finance, and the international mobility of corporate governance. Journal of
International Business Studies, 1-25.
35. Daily, C. M., Certo, S. T., & Dalton, D. R. (2000). International experience in the
executive suite: the path to prosperity?. Strategic Management Journal, 21(4), 515-
523.
36. Dastidar, P. (2009). International corporate diversification and performance: Does
firm self-selection matter. Journal of International Business Studies, 40(1), 71-85.
37. Dearborn, D. C., & Simon, H. A. (1958). Selective perception: A note on the
departmental identifications of executives. Sociometry, 21(2), 140-144.
38. El-Khatib, R., Fogel, K., & Jandik, T. (2015). CEO network centrality and merger
performance. Journal of Financial Economics, 116(2), 349-382.
39. Engelberg, J., Gao, P., & Parsons, C. A. (2013). The price of a CEO's
rolodex. Review of Financial Studies, 26(1), 79-114.
40. Erramilli, M. K. (1991). The experience factor in foreign market entry behavior of
service firms. Journal of International Business Studies, 22(3), 479-501.
41. Estélyi, K. S., & Nisar, T. M. (2016). Diverse boards: Why do firms get foreign
nationals on their boards?. Journal of Corporate Finance, 39, 174-192.
42. Fernandes, N., Ferreira, M. A., Matos, P., & Murphy, K. J. (2013). Are US CEOs paid
more? New international evidence. Review of Financial Studies, 26(2), 323-367.
43. Ferri, F., & Maber, D. A. (2013). Say on pay votes and CEO compensation: Evidence
from the UK. Review of Finance, 17(2), 527-563.
44. Finkelstein, S., & Boyd, B. K. (1998). How much does the CEO matter? The role of
managerial discretion in the setting of CEO compensation. Academy of Management
journal, 41(2), 179-199.
45. Finkelstein, S., Hambrick, D. C., & Cannella, A. A. (2009). Strategic Leadership:
Theory and Research on Executives, Top Management Teams, and Boards. Oxford:
Oxford University Press.
46. Geletkanycz, M. A., Boyd, B. K., & Finkelstein, S. (2001). The strategic value of
CEO external directorate networks: Implications for CEO compensation. Strategic
Management Journal, 22(9), 889-898.
39
47. Gerakos, J. J., Piotroski, J. D., & Srinivasan, S. (2013). Which US market interactions
affect CEO pay? Evidence from UK companies. Management Science, 59(11), 2413-
2434.
48. Ghoshal, S., & Bartlett, C. A. (1990). The multinational corporation as an
interorganizational network. Academy of Management Review, 15(4), 603-626.
49. Giannetti, M., Liao, G., & Yu, X. (2015). The brain gain of corporate boards:
evidence from China. The Journal of Finance, 70(4), 1629-1682.
50. Gupta, A. K., & Govindarajan, V. (2002). Cultivating a global mindset. The Academy
of Management Executive, 16(1), 116-126.
51. Greve, P., Biemann, T., & Ruigrok, W. (2015). Foreign executive appointments: A
multilevel examination. Journal of World Business, 50(4), 674-686.
52. Haans, R. F., Pieters, C., & He, Z. L. (2016). Thinking about U: Theorizing and
testing U‐and inverted U‐shaped relationships in strategy research. Strategic
Management Journal, 37(7), 1177-1195.
53. Hair, J. F., Black, W. C., Babin, B. J., & Anderson, R. E. (2009). Multivariate Data
Analysis 7th edn. Upper Saddle River, NJ: Pearson Prentice Hall.
54. Hambrick, D. C., & Mason, P. A. (1984). Upper echelons: The organization as a
reflection of its top managers. Academy of Management Review, 9(2), 193-206.
55. Hambrick, D. C. (2007). Upper echelons theory: An update. Academy of
Management Review, 32(2), 334-343.
56. Hartzell, J. C., & Starks, L. T. (2003). Institutional investors and executive
compensation. The Journal of Finance, 58(6), 2351-2374.
57. Heckman, J. J., Ichimura, H., & Todd, P. (1998). Matching as an econometric
evaluation estimator. The Review of Economic Studies, 65(2), 261-294.
58. Herrmann, P., & Datta, D. K. (2002). CEO successor characteristics and the choice of
foreign market entry mode: An empirical study. Journal of International Business
Studies, 33(3), 551-569.
59. Herrmann, P., & Datta, D. K. (2005). Relationships between top management team
characteristics and international diversification: an empirical investigation*. British
Journal of Management, 16(1), 69-78.
60. Hölmstrom, B. (1979). Moral hazard and observability. The Bell Journal of
Economics, 74-91.
61. Imbens, G. W. (2000). The role of the propensity score in estimating dose-response
functions. Biometrika, 87(3), 706-710.
62. Kabir, R., & Minhat, M. (2014). Compensation consultants and CEO pay. Research in
International Business and Finance, 32, 172-189.
63. Lee, H. U., & Park, J. H. (2006). Top team diversity, internationalization and the
mediating effect of international alliances*. British Journal of Management, 17(3),
195-213.
64. Lee, H. U., & Park, J. H. (2008). The influence of top management team international
exposure on international alliance formation. Journal of Management Studies, 45(5),
961-981.
40
65. Leonard, J. S. (1990). Executive Pay and Firm Performance. Industrial and Labor
Relations Review, 43, 13S-29S.
66. Levy, O., Beechler, S., Taylor, S., & Boyacigiller, N. A. (2007). What we talk about
when we talk about ‘global mindset’: Managerial cognition in multinational
corporations. Journal of International Business Studies, 38(2), 231-258.
67. Lins, K., & Servaes, H. (1999). International evidence on the value of corporate
diversification. The Journal of Finance, 54(6), 2215-2239.
68. Lockett, A., & Thompson, S. (2001). The resource-based view and economics.
Journal of Management, 27(6), 723-754.
69. Lublin, J. (1996). An overseas stint can be a ticket to the top. Wall Street Journal, 29
January.
70. Magnusson, P., & Boggs, D. J. (2006). International experience and CEO selection:
An empirical study. Journal of International Management, 12(1), 107-125.
71. Manner, M. H. (2010). The impact of CEO characteristics on corporate social
performance. Journal of Business Ethics, 93, 53-72.
72. Masulis, R. W., Wang, C., & Xie, F. (2012). Globalizing the boardroom—The effects
of foreign directors on corporate governance and firm performance. Journal of
Accounting and Economics, 53(3), 527-554.
73. Melin, L. (1992). Internationalization as a strategy process. Strategic Management
Journal, 13(S2), 99-118.
74. Miletkov, M., Poulsen, A., & Wintoki, M. B. (2016). Foreign independent directors
and the quality of legal institutions. Journal of International Business Studies, 1-26.
75. Moeller, S. B., & Schlingemann, F. P. (2005). Global diversification and bidder gains:
A comparison between cross-border and domestic acquisitions. Journal of Banking &
Finance, 29(3), 533-564.
76. Murphy, K. J. (1999). Executive compensation. Handbook of Labor Economics, 3,
2485-2563.
77. Nielsen, A. P. S. (2010). Top management team internationalization and firm
performance. Management International Review, 50(2), 185-206.
78. Nielsen, S., & Nielsen, B. B. (2010). Why do firms employ foreigners on their top
management team? An exploration of strategic fit, human capital and attraction-
selection-attrition perspectives. International Journal of Cross Cultural
Management, 10(2), 195-209.
79. Nielsen, B. B., & Nielsen, S. (2011). The role of top management team international
orientation in international strategic decision-making: The choice of foreign entry
mode. Journal of World Business, 46(2), 185-193.
80. Nielsen, B. B., & Nielsen, S. (2013). Top management team nationality diversity and
firm performance: A multilevel study. Strategic Management Journal, 34(3), 373-382.
81. Norburn, D. (1989). The chief executive: A breed apart. Strategic Management
Journal, 10(1), 1-15.
82. Osawa, J., & Wong, G. (2015). International experience strengthens new alibaba
chief’s hand. Wall Street Journal, 10 May.
41
83. Oxelheim, L., Gregorič, A., Randøy, T., & Thomsen, S. (2013). On the
internationalization of corporate boards: The case of Nordic firms. Journal of
International Business Studies, 44(3), 173-194.
84. Ozkan, N. (2011). CEO compensation and firm performance: An empirical
investigation of UK panel data. European Financial Management, 17(2), 260-285.
85. Peel, M. J., & Makepeace, G. H. (2012). Differential audit quality, propensity score
matching and Rosenbaum Bounds for confounding variables. Journal of Business
Finance & Accounting, 39(5‐6), 606-648.
86. Pfeffer, J., & Salancik, G. R. (1978). The External Control of Organizations: A
Resource Dependence Perspective. New York, NY: Harper and Row.
87. Piaskowska, D., & Trojanowski, G. (2014). Twice as smart? The importance of
managers’ formative-years’ international experience for their international orientation
and foreign acquisition decisions. British Journal of Management, 25(1), 40-57.
88. Rajgopal, S., Taylor, D., & Venkatachalam, M. (2012). Frictions in the CEO labor
market: The role of talent agents in CEO compensation. Contemporary Accounting
Research, 29(1), 119-151.
89. Rosenbaum, P. R., & Rubin, D. B. (1983). The central role of the propensity score in
observational studies for causal effects. Biometrika, 70(1), 41-55.
90. Roth, K. (1995). Managing international interdependence: CEO characteristics in a
resource-based framework. Academy of Management Journal, 38(1), 200-231.
91. Sambharya, R. B. (1996). Foreign experience of top management teams and
international diversification strategies of US multinational corporations. Strategic
Management Journal, 17(9), 739-746.
92. Sanders, W. G., & Carpenter, M. A. (1998). Internationalization and firm governance:
The roles of CEO compensation, top team composition, and board structure. Academy
of Management Journal, 41(2), 158-178.
93. Schmid, S., & Dauth, T. (2014). Does internationalization make a difference? Stock
market reaction to announcements of international top executive
appointments. Journal of World Business, 49(1), 63-77.
94. Stahl, G. K., & Tung, R. L. (2015). Towards a more balanced treatment of culture in
international business studies: The need for positive cross-cultural
scholarship. Journal of International Business Studies, 46(4), 391-414.
95. Sullivan, D. (1994). Measuring the degree of internationalization of a firm. Journal of
International Business Studies, 25(2), 325-342.
96. Tucker, J. W. (2010). Selection bias and econometric remedies in accounting and
finance research. Journal of Accounting Literature, 29, 31-57.
97. Tung, R. L., & Miller, E. L. (1990). Managing in the twenty-first century: The need
for global orientation. MIR: Management International Review, 30(1), 5-18.
98. Useem, M. (1984). The Inner Circle: Large Corporations and the Rise of Business
Political Activity in the US and UK. New York, NY: Oxford University Press.
99. Vander Bauwhede, H., & Willekens, M. (2008). Disclosure on corporate governance
in the European Union. Corporate Governance: An International Review, 16(2), 101-
115.
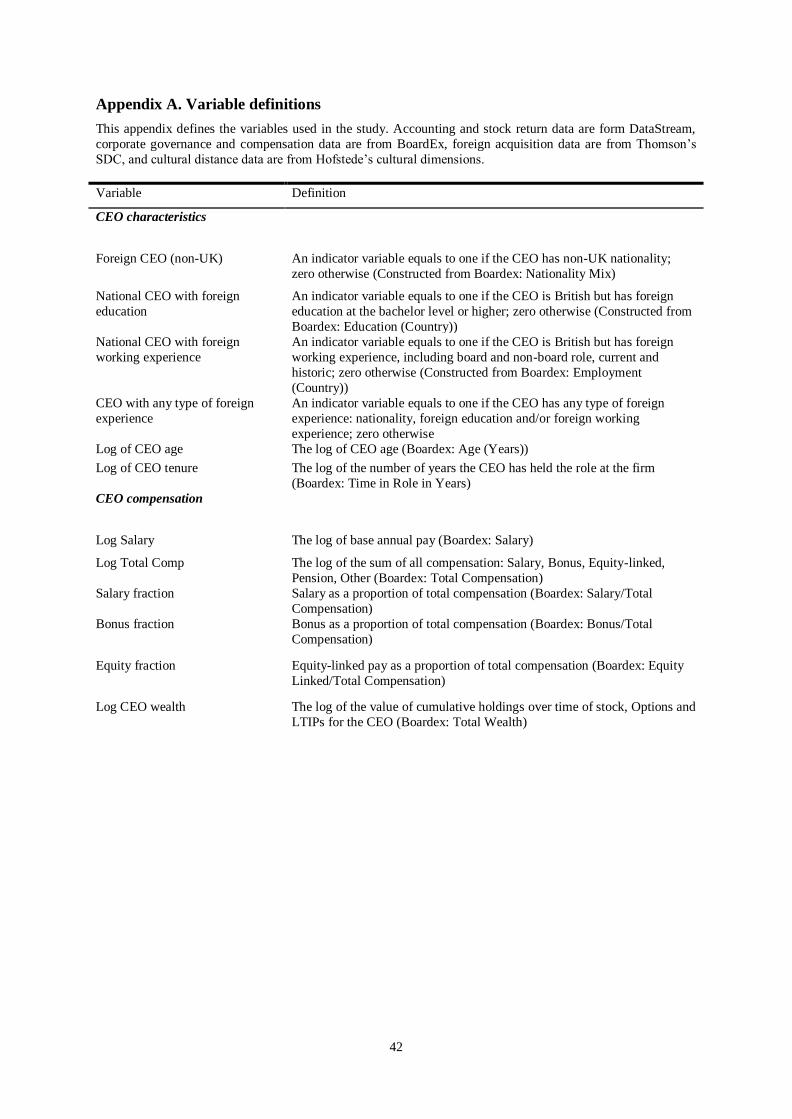
42
Appendix A. Variable definitions
This appendix defines the variables used in the study. Accounting and stock return data are form DataStream,
corporate governance and compensation data are from BoardEx, foreign acquisition data are from Thomson’s
SDC, and cultural distance data are from Hofstede’s cultural dimensions.
Variable Definition
CEO characteristics
Foreign CEO (non-UK) An indicator variable equals to one if the CEO has non-UK nationality;
zero otherwise (Constructed from Boardex: Nationality Mix)
National CEO with foreign
education
An indicator variable equals to one if the CEO is British but has foreign
education at the bachelor level or higher; zero otherwise (Constructed from
Boardex: Education (Country))
National CEO with foreign
working experience
An indicator variable equals to one if the CEO is British but has foreign
working experience, including board and non-board role, current and
historic; zero otherwise (Constructed from Boardex: Employment
(Country))
CEO with any type of foreign
experience
An indicator variable equals to one if the CEO has any type of foreign
experience: nationality, foreign education and/or foreign working
experience; zero otherwise
Log of CEO age The log of CEO age (Boardex: Age (Years))
Log of CEO tenure The log of the number of years the CEO has held the role at the firm
(Boardex: Time in Role in Years)
CEO compensation
Log Salary The log of base annual pay (Boardex: Salary)
Log Total Comp The log of the sum of all compensation: Salary, Bonus, Equity-linked,
Pension, Other (Boardex: Total Compensation)
Salary fraction Salary as a proportion of total compensation (Boardex: Salary/Total
Compensation)
Bonus fraction Bonus as a proportion of total compensation (Boardex: Bonus/Total
Compensation)
Equity fraction Equity-linked pay as a proportion of total compensation (Boardex: Equity
Linked/Total Compensation)
Log CEO wealth The log of the value of cumulative holdings over time of stock, Options and
LTIPs for the CEO (Boardex: Total Wealth)
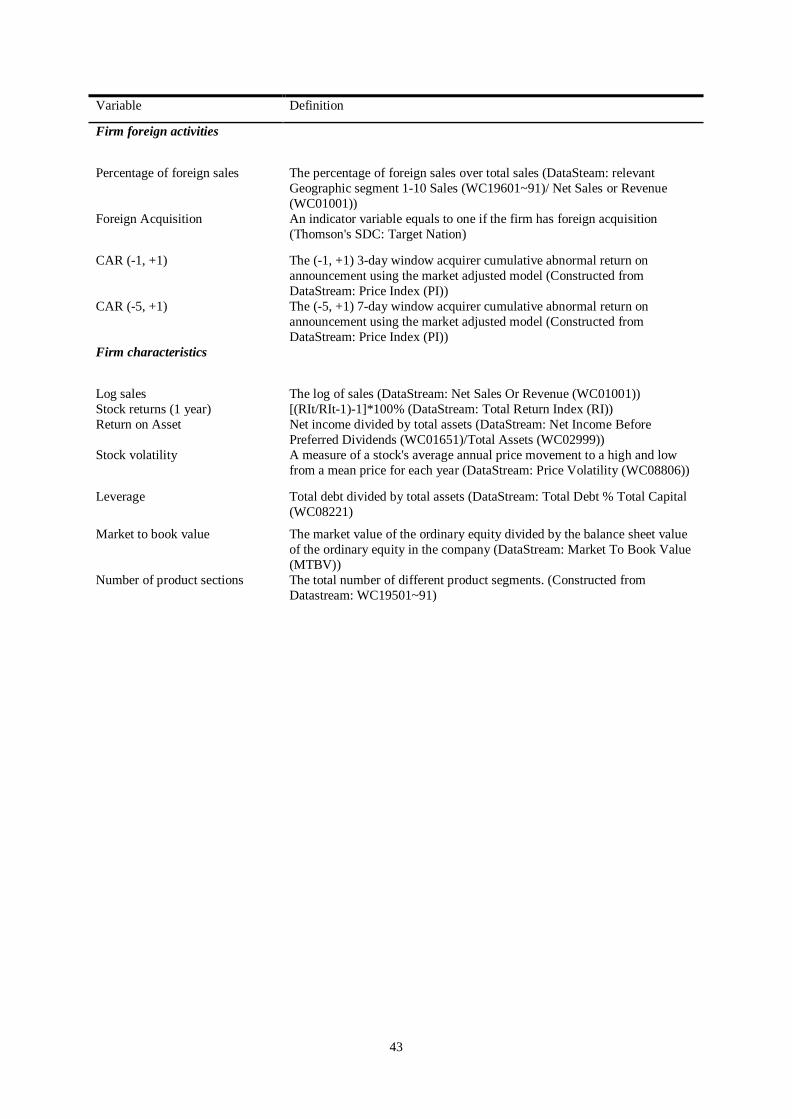
43
Variable Definition
Firm foreign activities
Percentage of foreign sales The percentage of foreign sales over total sales (DataSteam: relevant
Geographic segment 1-10 Sales (WC19601~91)/ Net Sales or Revenue
(WC01001))
Foreign Acquisition An indicator variable equals to one if the firm has foreign acquisition
(Thomson's SDC: Target Nation)
CAR (-1, +1) The (-1, +1) 3-day window acquirer cumulative abnormal return on
announcement using the market adjusted model (Constructed from
DataStream: Price Index (PI))
CAR (-5, +1) The (-5, +1) 7-day window acquirer cumulative abnormal return on
announcement using the market adjusted model (Constructed from
DataStream: Price Index (PI))
Firm characteristics
Log sales The log of sales (DataStream: Net Sales Or Revenue (WC01001))
Stock returns (1 year) [(RIt/RIt-1)-1]*100% (DataStream: Total Return Index (RI))
Return on Asset Net income divided by total assets (DataStream: Net Income Before
Preferred Dividends (WC01651)/Total Assets (WC02999))
Stock volatility A measure of a stock's average annual price movement to a high and low
from a mean price for each year (DataStream: Price Volatility (WC08806))
Leverage Total debt divided by total assets (DataStream: Total Debt % Total Capital
(WC08221)
Market to book value The market value of the ordinary equity divided by the balance sheet value
of the ordinary equity in the company (DataStream: Market To Book Value
(MTBV))
Number of product sections The total number of different product segments. (Constructed from
Datastream: WC19501~91)
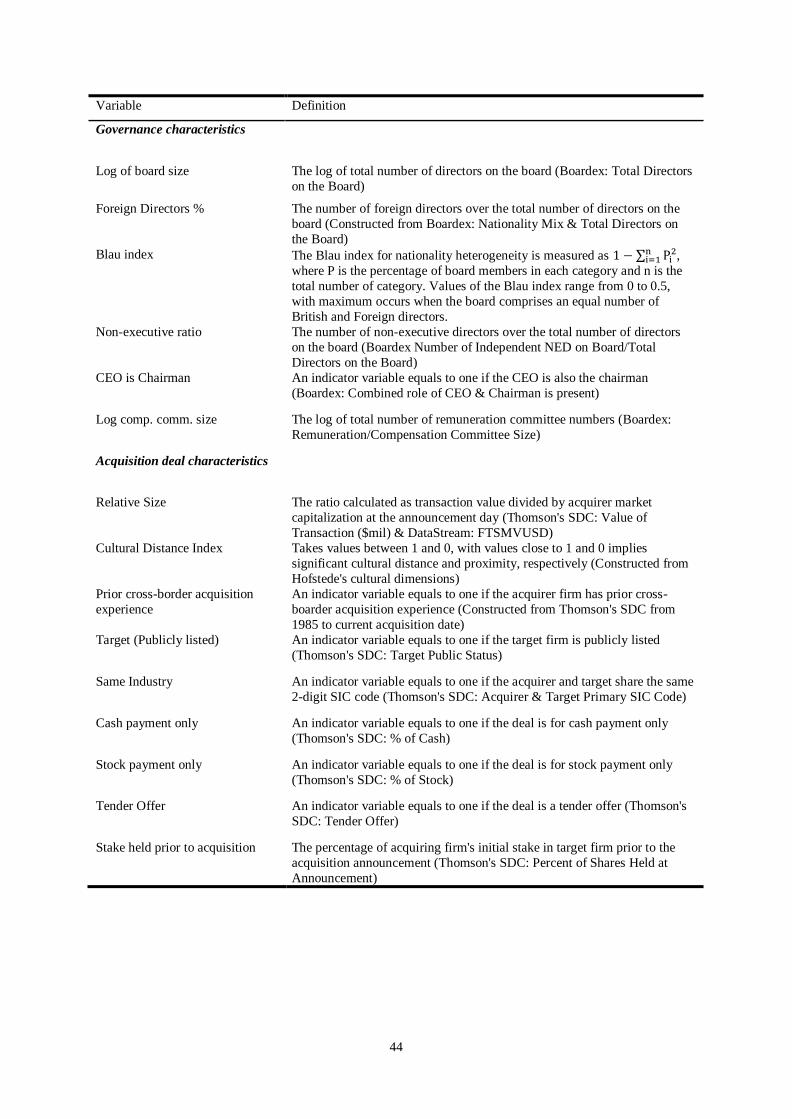
44
Variable Definition
Governance characteristics
Log of board size The log of total number of directors on the board (Boardex: Total Directors
on the Board)
Foreign Directors % The number of foreign directors over the total number of directors on the
board (Constructed from Boardex: Nationality Mix & Total Directors on
the Board)
Blau index The Blau index for nationality heterogeneity is measured as 1 − ∑ Pi2n
i=1 ,
where P is the percentage of board members in each category and n is the
total number of category. Values of the Blau index range from 0 to 0.5,
with maximum occurs when the board comprises an equal number of
British and Foreign directors.
Non-executive ratio The number of non-executive directors over the total number of directors
on the board (Boardex Number of Independent NED on Board/Total
Directors on the Board)
CEO is Chairman An indicator variable equals to one if the CEO is also the chairman
(Boardex: Combined role of CEO & Chairman is present)
Log comp. comm. size The log of total number of remuneration committee numbers (Boardex:
Remuneration/Compensation Committee Size)
Acquisition deal characteristics
Relative Size The ratio calculated as transaction value divided by acquirer market
capitalization at the announcement day (Thomson's SDC: Value of
Transaction ($mil) & DataStream: FTSMVUSD)
Cultural Distance Index Takes values between 1 and 0, with values close to 1 and 0 implies
significant cultural distance and proximity, respectively (Constructed from
Hofstede's cultural dimensions)
Prior cross-border acquisition
experience
An indicator variable equals to one if the acquirer firm has prior cross-
boarder acquisition experience (Constructed from Thomson's SDC from
1985 to current acquisition date)
Target (Publicly listed) An indicator variable equals to one if the target firm is publicly listed
(Thomson's SDC: Target Public Status)
Same Industry An indicator variable equals to one if the acquirer and target share the same
2-digit SIC code (Thomson's SDC: Acquirer & Target Primary SIC Code)
Cash payment only An indicator variable equals to one if the deal is for cash payment only
(Thomson's SDC: % of Cash)
Stock payment only An indicator variable equals to one if the deal is for stock payment only
(Thomson's SDC: % of Stock)
Tender Offer An indicator variable equals to one if the deal is a tender offer (Thomson's
SDC: Tender Offer)
Stake held prior to acquisition The percentage of acquiring firm's initial stake in target firm prior to the
acquisition announcement (Thomson's SDC: Percent of Shares Held at
Announcement)
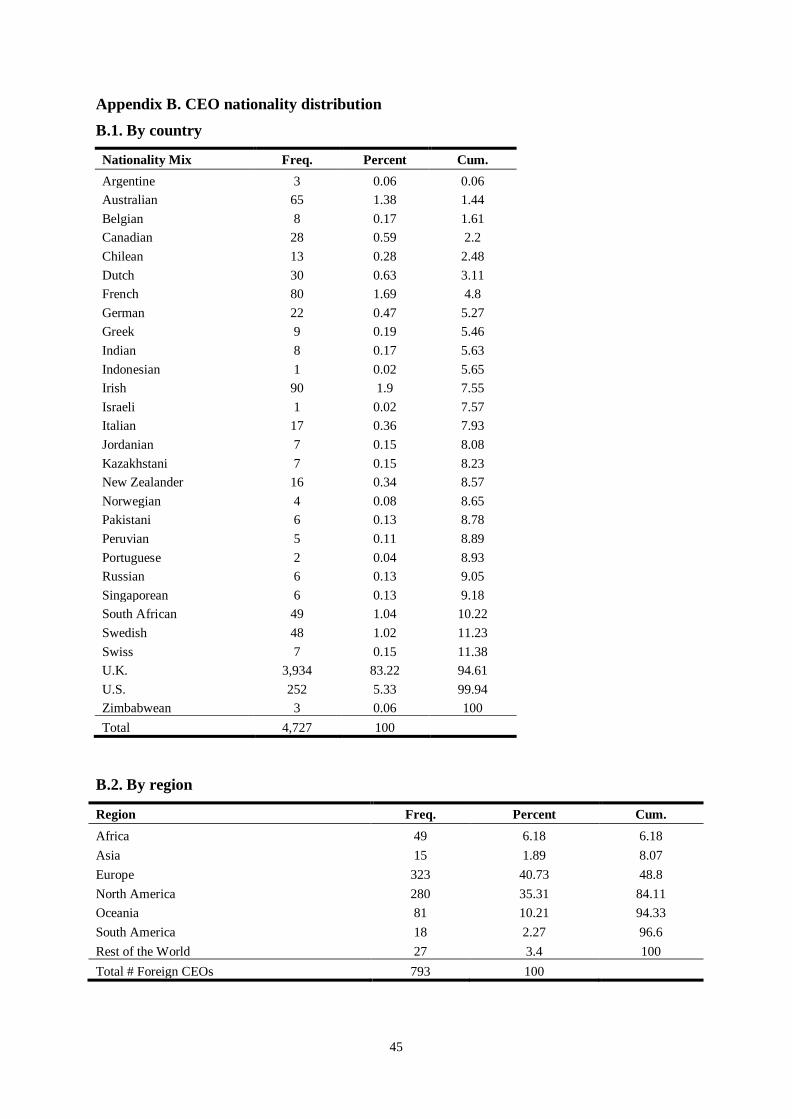
45
Appendix B. CEO nationality distribution
B.1. By country
Nationality Mix Freq. Percent Cum.
Argentine 3 0.06 0.06
Australian 65 1.38 1.44
Belgian 8 0.17 1.61
Canadian 28 0.59 2.2
Chilean 13 0.28 2.48
Dutch 30 0.63 3.11
French 80 1.69 4.8
German 22 0.47 5.27
Greek 9 0.19 5.46
Indian 8 0.17 5.63
Indonesian 1 0.02 5.65
Irish 90 1.9 7.55
Israeli 1 0.02 7.57
Italian 17 0.36 7.93
Jordanian 7 0.15 8.08
Kazakhstani 7 0.15 8.23
New Zealander 16 0.34 8.57
Norwegian 4 0.08 8.65
Pakistani 6 0.13 8.78
Peruvian 5 0.11 8.89
Portuguese 2 0.04 8.93
Russian 6 0.13 9.05
Singaporean 6 0.13 9.18
South African 49 1.04 10.22
Swedish 48 1.02 11.23
Swiss 7 0.15 11.38
U.K. 3,934 83.22 94.61
U.S. 252 5.33 99.94
Zimbabwean 3 0.06 100
Total 4,727 100
B.2. By region
Region Freq. Percent Cum.
Africa 49 6.18 6.18
Asia 15 1.89 8.07
Europe 323 40.73 48.8
North America 280 35.31 84.11
Oceania 81 10.21 94.33
South America 18 2.27 96.6
Rest of the World 27 3.4 100
Total # Foreign CEOs 793 100
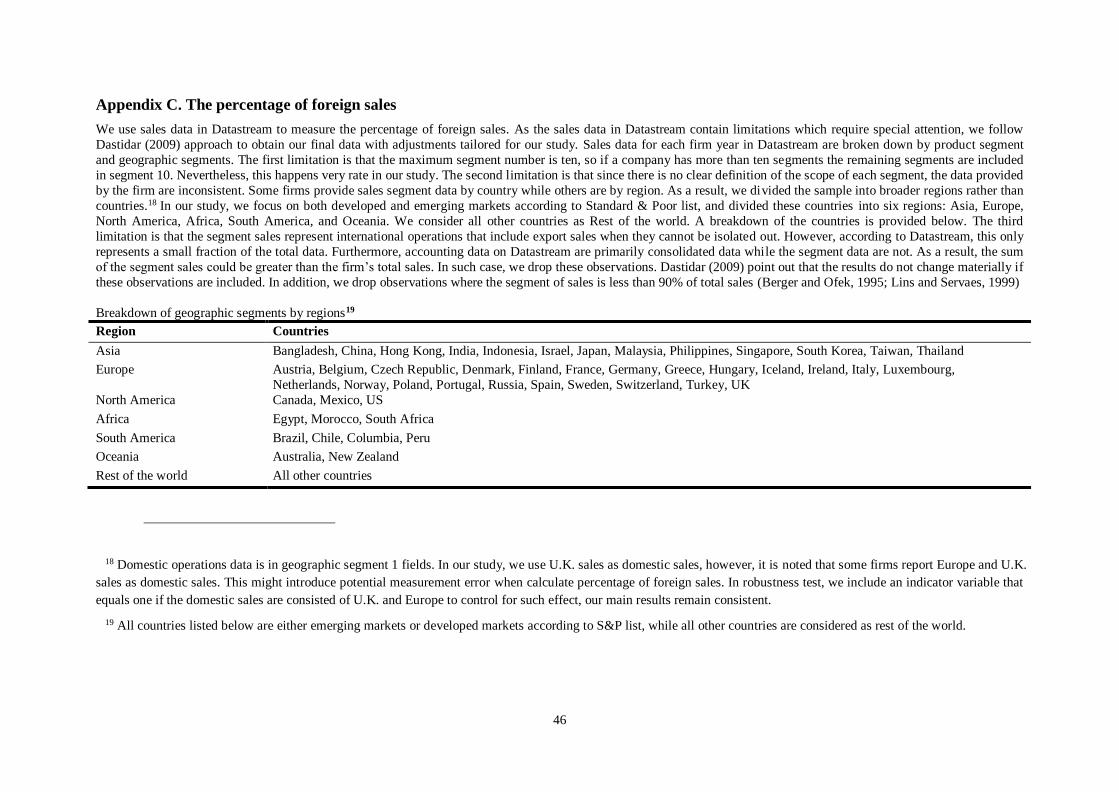
46
Appendix C. The percentage of foreign sales
We use sales data in Datastream to measure the percentage of foreign sales. As the sales data in Datastream contain limitations which require special attention, we follow
Dastidar (2009) approach to obtain our final data with adjustments tailored for our study. Sales data for each firm year in Datastream are broken down by product segment
and geographic segments. The first limitation is that the maximum segment number is ten, so if a company has more than ten segments the remaining segments are included
in segment 10. Nevertheless, this happens very rate in our study. The second limitation is that since there is no clear definition of the scope of each segment, the data provided
by the firm are inconsistent. Some firms provide sales segment data by country while others are by region. As a result, we divided the sample into broader regions rather than
countries.18 In our study, we focus on both developed and emerging markets according to Standard & Poor list, and divided these countries into six regions: Asia, Europe,
North America, Africa, South America, and Oceania. We consider all other countries as Rest of the world. A breakdown of the countries is provided below. The third
limitation is that the segment sales represent international operations that include export sales when they cannot be isolated out. However, according to Datastream, this only
represents a small fraction of the total data. Furthermore, accounting data on Datastream are primarily consolidated data while the segment data are not. As a result, the sum
of the segment sales could be greater than the firm’s total sales. In such case, we drop these observations. Dastidar (2009) point out that the results do not change materially if
these observations are included. In addition, we drop observations where the segment of sales is less than 90% of total sales (Berger and Ofek, 1995; Lins and Servaes, 1999)
Breakdown of geographic segments by regions19
Region Countries
Asia Bangladesh, China, Hong Kong, India, Indonesia, Israel, Japan, Malaysia, Philippines, Singapore, South Korea, Taiwan, Thailand
Europe Austria, Belgium, Czech Republic, Denmark, Finland, France, Germany, Greece, Hungary, Iceland, Ireland, Italy, Luxembourg,
Netherlands, Norway, Poland, Portugal, Russia, Spain, Sweden, Switzerland, Turkey, UK
North America Canada, Mexico, US
Africa Egypt, Morocco, South Africa
South America Brazil, Chile, Columbia, Peru
Oceania Australia, New Zealand
Rest of the world All other countries
18 Domestic operations data is in geographic segment 1 fields. In our study, we use U.K. sales as domestic sales, however, it is noted that some firms report Europe and U.K.
sales as domestic sales. This might introduce potential measurement error when calculate percentage of foreign sales. In robustness test, we include an indicator variable that
equals one if the domestic sales are consisted of U.K. and Europe to control for such effect, our main results remain consistent.
19 All countries listed below are either emerging markets or developed markets according to S&P list, while all other countries are considered as rest of the world.
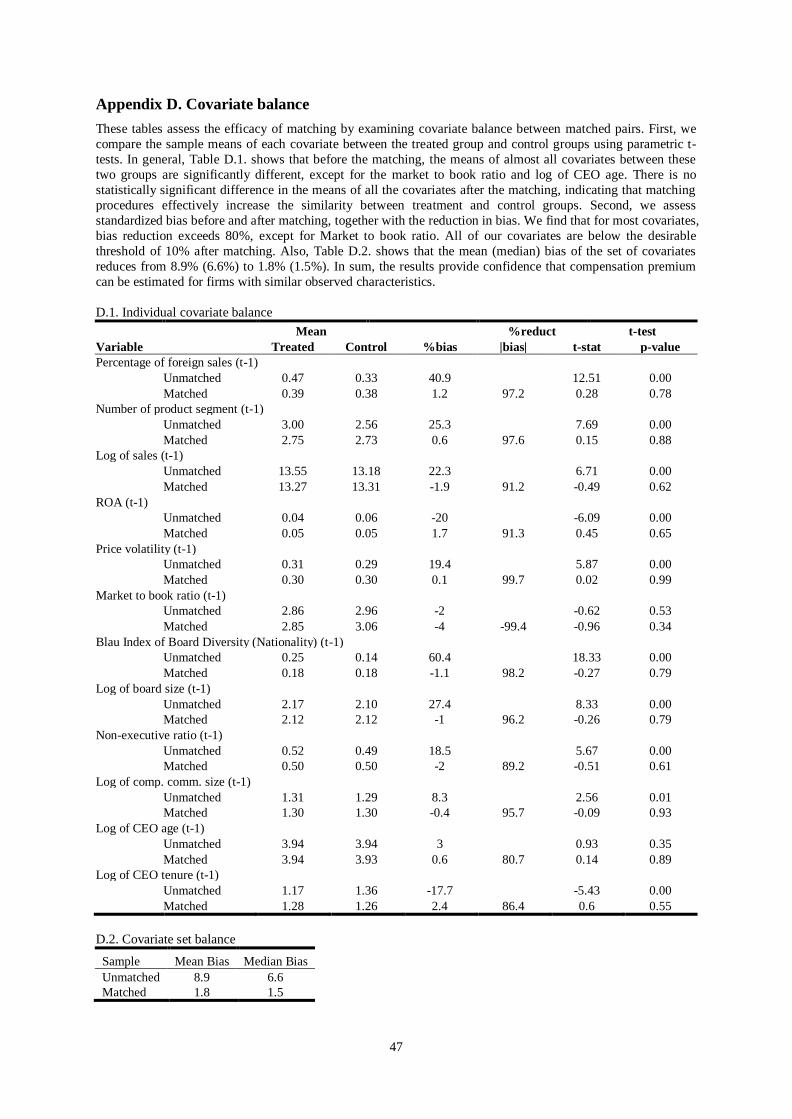
47
Appendix D. Covariate balance
These tables assess the efficacy of matching by examining covariate balance between matched pairs. First, we
compare the sample means of each covariate between the treated group and control groups using parametric t-
tests. In general, Table D.1. shows that before the matching, the means of almost all covariates between these
two groups are significantly different, except for the market to book ratio and log of CEO age. There is no
statistically significant difference in the means of all the covariates after the matching, indicating that matching
procedures effectively increase the similarity between treatment and control groups. Second, we assess
standardized bias before and after matching, together with the reduction in bias. We find that for most covariates,
bias reduction exceeds 80%, except for Market to book ratio. All of our covariates are below the desirable
threshold of 10% after matching. Also, Table D.2. shows that the mean (median) bias of the set of covariates
reduces from 8.9% (6.6%) to 1.8% (1.5%). In sum, the results provide confidence that compensation premium
can be estimated for firms with similar observed characteristics.
D.1. Individual covariate balance
Mean
%reduct t-test
Variable Treated Control %bias |bias| t-stat p-value
Percentage of foreign sales (t-1)
Unmatched 0.47 0.33 40.9
12.51 0.00
Matched 0.39 0.38 1.2 97.2 0.28 0.78
Number of product segment (t-1)
Unmatched 3.00 2.56 25.3
7.69 0.00
Matched 2.75 2.73 0.6 97.6 0.15 0.88
Log of sales (t-1)
Unmatched 13.55 13.18 22.3
6.71 0.00
Matched 13.27 13.31 -1.9 91.2 -0.49 0.62
ROA (t-1)
Unmatched 0.04 0.06 -20
-6.09 0.00
Matched 0.05 0.05 1.7 91.3 0.45 0.65
Price volatility (t-1)
Unmatched 0.31 0.29 19.4
5.87 0.00
Matched 0.30 0.30 0.1 99.7 0.02 0.99
Market to book ratio (t-1)
Unmatched 2.86 2.96 -2
-0.62 0.53
Matched 2.85 3.06 -4 -99.4 -0.96 0.34
Blau Index of Board Diversity (Nationality) (t-1)
Unmatched 0.25 0.14 60.4
18.33 0.00
Matched 0.18 0.18 -1.1 98.2 -0.27 0.79
Log of board size (t-1)
Unmatched 2.17 2.10 27.4
8.33 0.00
Matched 2.12 2.12 -1 96.2 -0.26 0.79
Non-executive ratio (t-1)
Unmatched 0.52 0.49 18.5
5.67 0.00
Matched 0.50 0.50 -2 89.2 -0.51 0.61
Log of comp. comm. size (t-1)
Unmatched 1.31 1.29 8.3
2.56 0.01
Matched 1.30 1.30 -0.4 95.7 -0.09 0.93
Log of CEO age (t-1)
Unmatched 3.94 3.94 3
0.93 0.35
Matched 3.94 3.93 0.6 80.7 0.14 0.89
Log of CEO tenure (t-1)
Unmatched 1.17 1.36 -17.7
-5.43 0.00
Matched 1.28 1.26 2.4 86.4 0.6 0.55
D.2. Covariate set balance
Sample Mean Bias Median Bias
Unmatched 8.9 6.6
Matched 1.8 1.5
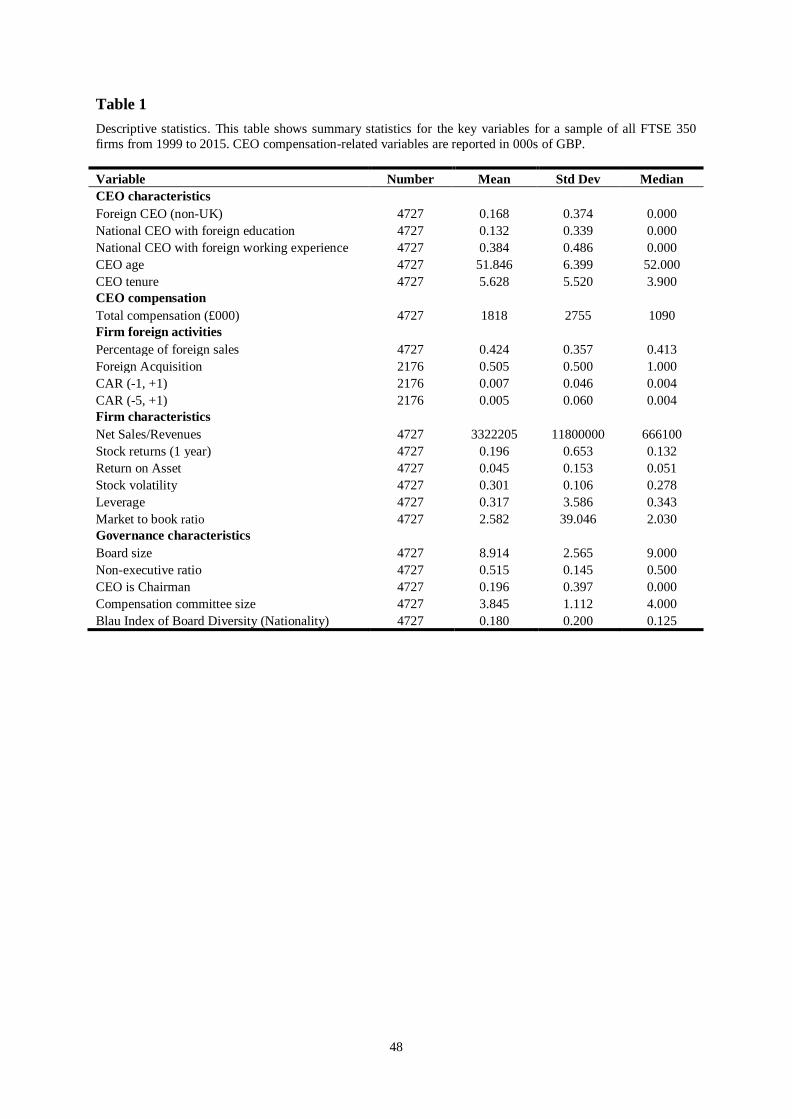
48
Table 1
Descriptive statistics. This table shows summary statistics for the key variables for a sample of all FTSE 350
firms from 1999 to 2015. CEO compensation-related variables are reported in 000s of GBP.
Variable Number Mean Std Dev Median
CEO characteristics
Foreign CEO (non-UK) 4727 0.168 0.374 0.000
National CEO with foreign education 4727 0.132 0.339 0.000
National CEO with foreign working experience 4727 0.384 0.486 0.000
CEO age 4727 51.846 6.399 52.000
CEO tenure 4727 5.628 5.520 3.900
CEO compensation
Total compensation (£000) 4727 1818 2755 1090
Firm foreign activities
Percentage of foreign sales 4727 0.424 0.357 0.413
Foreign Acquisition 2176 0.505 0.500 1.000
CAR (-1, +1) 2176 0.007 0.046 0.004
CAR (-5, +1) 2176 0.005 0.060 0.004
Firm characteristics
Net Sales/Revenues 4727 3322205 11800000 666100
Stock returns (1 year) 4727 0.196 0.653 0.132
Return on Asset 4727 0.045 0.153 0.051
Stock volatility 4727 0.301 0.106 0.278
Leverage 4727 0.317 3.586 0.343
Market to book ratio 4727 2.582 39.046 2.030
Governance characteristics
Board size 4727 8.914 2.565 9.000
Non-executive ratio 4727 0.515 0.145 0.500
CEO is Chairman 4727 0.196 0.397 0.000
Compensation committee size 4727 3.845 1.112 4.000
Blau Index of Board Diversity (Nationality) 4727 0.180 0.200 0.125
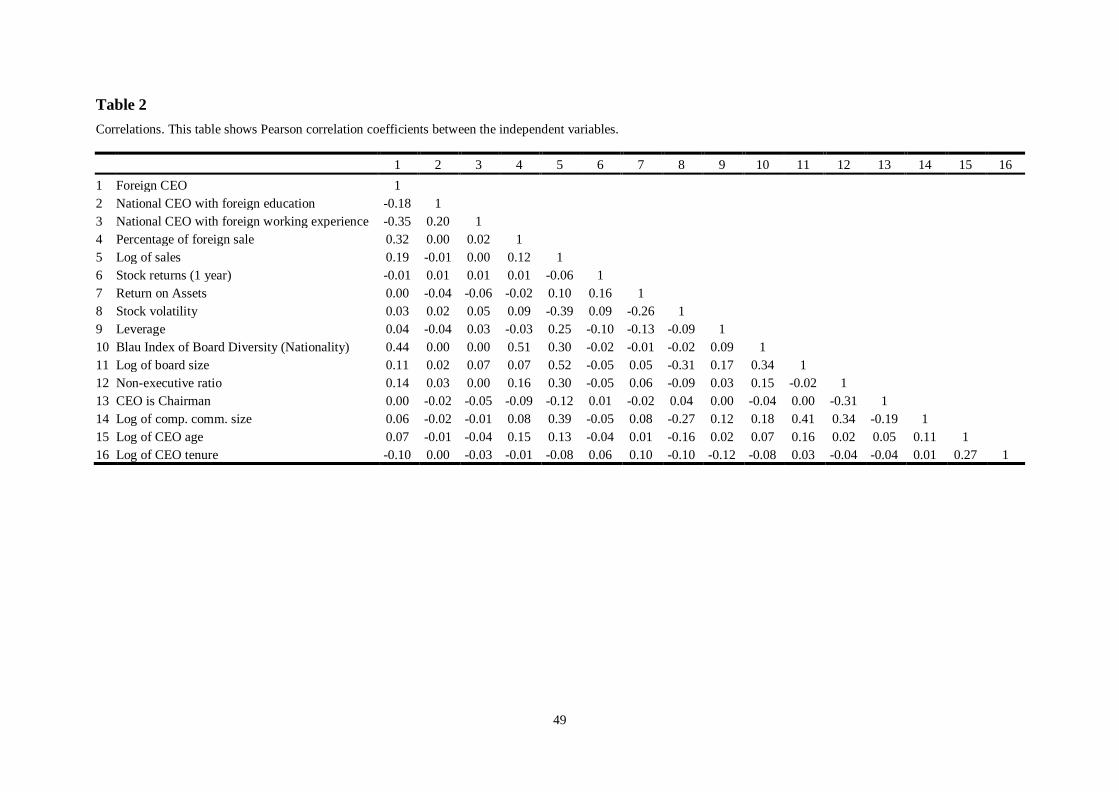
49
Table 2
Correlations. This table shows Pearson correlation coefficients between the independent variables.
1 2 3 4 5 6 7 8 9 10 11 12 13 14 15 16
1 Foreign CEO 1
2 National CEO with foreign education -0.18 1
3 National CEO with foreign working experience -0.35 0.20 1
4 Percentage of foreign sale 0.32 0.00 0.02 1
5 Log of sales 0.19 -0.01 0.00 0.12 1
6 Stock returns (1 year) -0.01 0.01 0.01 0.01 -0.06 1
7 Return on Assets 0.00 -0.04 -0.06 -0.02 0.10 0.16 1
8 Stock volatility 0.03 0.02 0.05 0.09 -0.39 0.09 -0.26 1
9 Leverage 0.04 -0.04 0.03 -0.03 0.25 -0.10 -0.13 -0.09 1
10 Blau Index of Board Diversity (Nationality) 0.44 0.00 0.00 0.51 0.30 -0.02 -0.01 -0.02 0.09 1
11 Log of board size 0.11 0.02 0.07 0.07 0.52 -0.05 0.05 -0.31 0.17 0.34 1
12 Non-executive ratio 0.14 0.03 0.00 0.16 0.30 -0.05 0.06 -0.09 0.03 0.15 -0.02 1
13 CEO is Chairman 0.00 -0.02 -0.05 -0.09 -0.12 0.01 -0.02 0.04 0.00 -0.04 0.00 -0.31 1
14 Log of comp. comm. size 0.06 -0.02 -0.01 0.08 0.39 -0.05 0.08 -0.27 0.12 0.18 0.41 0.34 -0.19 1
15 Log of CEO age 0.07 -0.01 -0.04 0.15 0.13 -0.04 0.01 -0.16 0.02 0.07 0.16 0.02 0.05 0.11 1
16 Log of CEO tenure -0.10 0.00 -0.03 -0.01 -0.08 0.06 0.10 -0.10 -0.12 -0.08 0.03 -0.04 -0.04 0.01 0.27 1
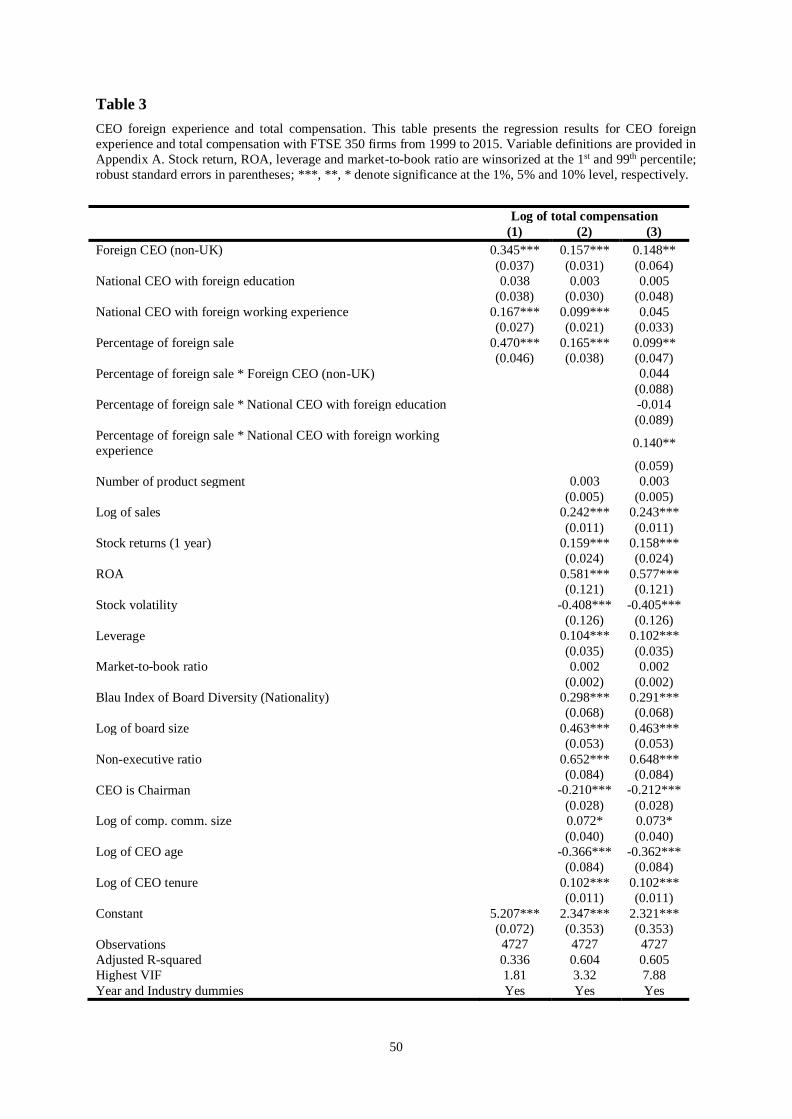
50
Table 3
CEO foreign experience and total compensation. This table presents the regression results for CEO foreign
experience and total compensation with FTSE 350 firms from 1999 to 2015. Variable definitions are provided in
Appendix A. Stock return, ROA, leverage and market-to-book ratio are winsorized at the 1st and 99th percentile;
robust standard errors in parentheses; ***, **, * denote significance at the 1%, 5% and 10% level, respectively.
Log of total compensation
(1) (2) (3)
Foreign CEO (non-UK) 0.345*** 0.157*** 0.148**
(0.037) (0.031) (0.064)
National CEO with foreign education 0.038 0.003 0.005
(0.038) (0.030) (0.048)
National CEO with foreign working experience 0.167*** 0.099*** 0.045
(0.027) (0.021) (0.033)
Percentage of foreign sale 0.470*** 0.165*** 0.099**
(0.046) (0.038) (0.047)
Percentage of foreign sale * Foreign CEO (non-UK)
0.044
(0.088)
Percentage of foreign sale * National CEO with foreign education
-0.014
(0.089)
Percentage of foreign sale * National CEO with foreign working
experience 0.140**
(0.059)
Number of product segment
0.003 0.003
(0.005) (0.005)
Log of sales
0.242*** 0.243***
(0.011) (0.011)
Stock returns (1 year)
0.159*** 0.158***
(0.024) (0.024)
ROA
0.581*** 0.577***
(0.121) (0.121)
Stock volatility
-0.408*** -0.405***
(0.126) (0.126)
Leverage
0.104*** 0.102***
(0.035) (0.035)
Market-to-book ratio
0.002 0.002
(0.002) (0.002)
Blau Index of Board Diversity (Nationality)
0.298*** 0.291***
(0.068) (0.068)
Log of board size
0.463*** 0.463***
(0.053) (0.053)
Non-executive ratio
0.652*** 0.648***
(0.084) (0.084)
CEO is Chairman
-0.210*** -0.212***
(0.028) (0.028)
Log of comp. comm. size
0.072* 0.073*
(0.040) (0.040)
Log of CEO age
-0.366*** -0.362***
(0.084) (0.084)
Log of CEO tenure
0.102*** 0.102***
(0.011) (0.011)
Constant 5.207*** 2.347*** 2.321***
(0.072) (0.353) (0.353)
Observations 4727 4727 4727
Adjusted R-squared 0.336 0.604 0.605
Highest VIF 1.81 3.32 7.88
Year and Industry dummies Yes Yes Yes
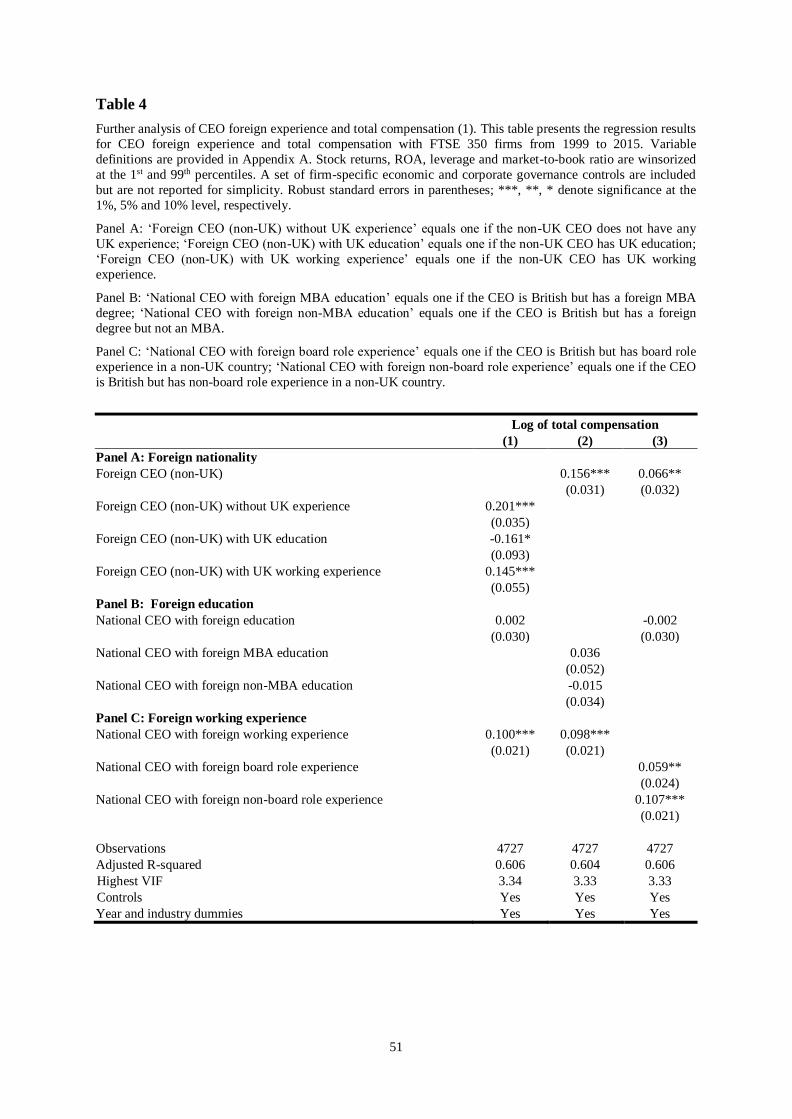
51
Table 4
Further analysis of CEO foreign experience and total compensation (1). This table presents the regression results
for CEO foreign experience and total compensation with FTSE 350 firms from 1999 to 2015. Variable
definitions are provided in Appendix A. Stock returns, ROA, leverage and market-to-book ratio are winsorized
at the 1st and 99th percentiles. A set of firm-specific economic and corporate governance controls are included
but are not reported for simplicity. Robust standard errors in parentheses; ***, **, * denote significance at the
1%, 5% and 10% level, respectively.
Panel A: ‘Foreign CEO (non-UK) without UK experience’ equals one if the non-UK CEO does not have any
UK experience; ‘Foreign CEO (non-UK) with UK education’ equals one if the non-UK CEO has UK education;
‘Foreign CEO (non-UK) with UK working experience’ equals one if the non-UK CEO has UK working
experience.
Panel B: ‘National CEO with foreign MBA education’ equals one if the CEO is British but has a foreign MBA
degree; ‘National CEO with foreign non-MBA education’ equals one if the CEO is British but has a foreign
degree but not an MBA.
Panel C: ‘National CEO with foreign board role experience’ equals one if the CEO is British but has board role
experience in a non-UK country; ‘National CEO with foreign non-board role experience’ equals one if the CEO
is British but has non-board role experience in a non-UK country.
Log of total compensation
(1) (2) (3)
Panel A: Foreign nationality
Foreign CEO (non-UK)
0.156*** 0.066**
(0.031) (0.032)
Foreign CEO (non-UK) without UK experience 0.201***
(0.035)
Foreign CEO (non-UK) with UK education -0.161*
(0.093)
Foreign CEO (non-UK) with UK working experience 0.145***
(0.055)
Panel B: Foreign education
National CEO with foreign education 0.002
-0.002
(0.030)
(0.030)
National CEO with foreign MBA education
0.036
(0.052)
National CEO with foreign non-MBA education
-0.015
(0.034)
Panel C: Foreign working experience
National CEO with foreign working experience 0.100*** 0.098***
(0.021) (0.021)
National CEO with foreign board role experience
0.059**
(0.024)
National CEO with foreign non-board role experience
0.107***
(0.021)
Observations 4727 4727 4727
Adjusted R-squared 0.606 0.604 0.606
Highest VIF 3.34 3.33 3.33
Controls Yes Yes Yes
Year and industry dummies Yes Yes Yes
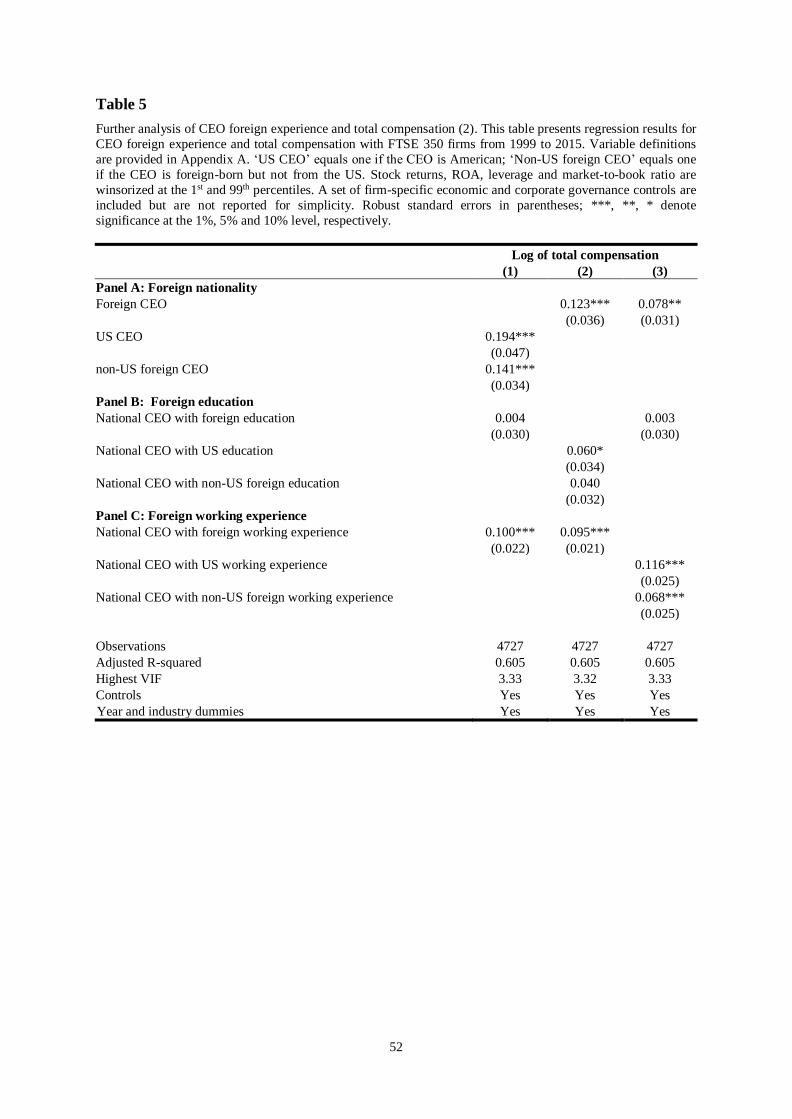
52
Table 5
Further analysis of CEO foreign experience and total compensation (2). This table presents regression results for
CEO foreign experience and total compensation with FTSE 350 firms from 1999 to 2015. Variable definitions
are provided in Appendix A. ‘US CEO’ equals one if the CEO is American; ‘Non-US foreign CEO’ equals one
if the CEO is foreign-born but not from the US. Stock returns, ROA, leverage and market-to-book ratio are
winsorized at the 1st and 99th percentiles. A set of firm-specific economic and corporate governance controls are
included but are not reported for simplicity. Robust standard errors in parentheses; ***, **, * denote
significance at the 1%, 5% and 10% level, respectively.
Log of total compensation
(1) (2) (3)
Panel A: Foreign nationality
Foreign CEO
0.123*** 0.078**
(0.036) (0.031)
US CEO 0.194***
(0.047)
non-US foreign CEO 0.141***
(0.034)
Panel B: Foreign education
National CEO with foreign education 0.004
0.003
(0.030) (0.030)
National CEO with US education
0.060*
(0.034)
National CEO with non-US foreign education
0.040
(0.032)
Panel C: Foreign working experience
National CEO with foreign working experience 0.100*** 0.095***
(0.022) (0.021)
National CEO with US working experience
0.116***
(0.025)
National CEO with non-US foreign working experience
0.068***
(0.025)
Observations 4727 4727 4727
Adjusted R-squared 0.605 0.605 0.605
Highest VIF 3.33 3.32 3.33
Controls Yes Yes Yes
Year and industry dummies Yes Yes Yes
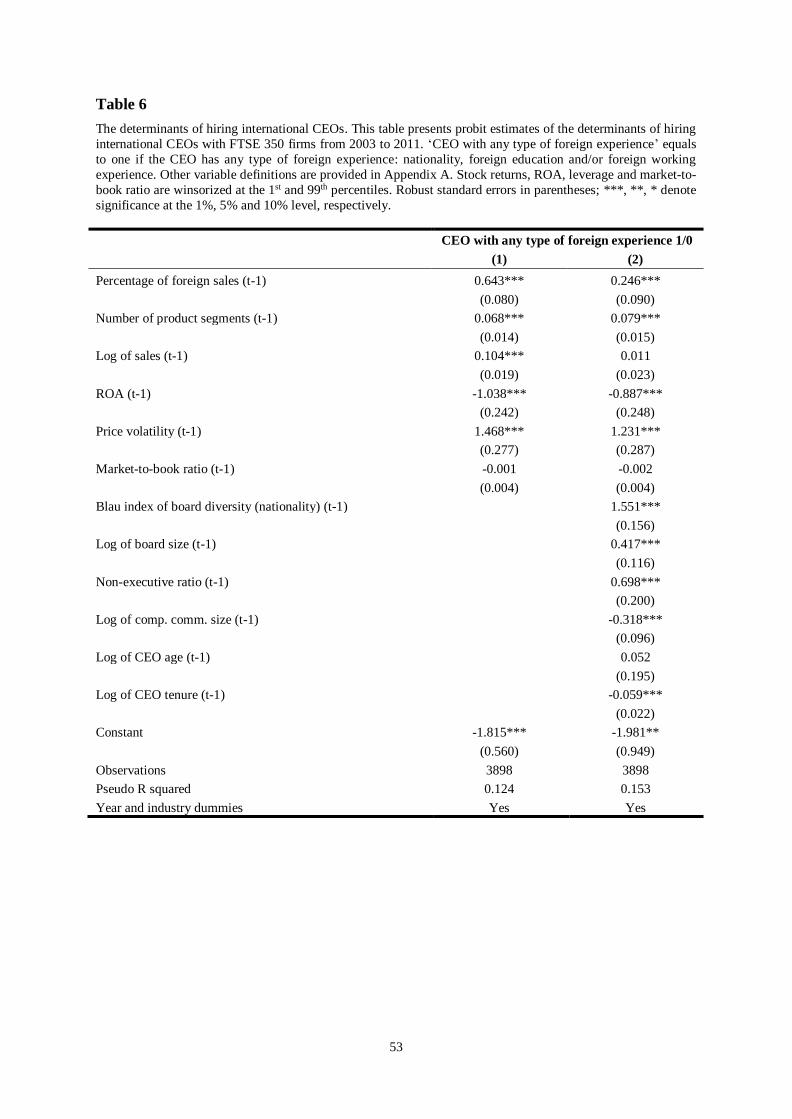
53
Table 6
The determinants of hiring international CEOs. This table presents probit estimates of the determinants of hiring
international CEOs with FTSE 350 firms from 2003 to 2011. ‘CEO with any type of foreign experience’ equals
to one if the CEO has any type of foreign experience: nationality, foreign education and/or foreign working
experience. Other variable definitions are provided in Appendix A. Stock returns, ROA, leverage and market-to-
book ratio are winsorized at the 1st and 99th percentiles. Robust standard errors in parentheses; ***, **, * denote
significance at the 1%, 5% and 10% level, respectively.
CEO with any type of foreign experience 1/0
(1) (2)
Percentage of foreign sales (t-1) 0.643*** 0.246***
(0.080) (0.090)
Number of product segments (t-1) 0.068*** 0.079***
(0.014) (0.015)
Log of sales (t-1) 0.104*** 0.011
(0.019) (0.023)
ROA (t-1) -1.038*** -0.887***
(0.242) (0.248)
Price volatility (t-1) 1.468*** 1.231***
(0.277) (0.287)
Market-to-book ratio (t-1) -0.001 -0.002
(0.004) (0.004)
Blau index of board diversity (nationality) (t-1)
1.551***
(0.156)
Log of board size (t-1)
0.417***
(0.116)
Non-executive ratio (t-1)
0.698***
(0.200)
Log of comp. comm. size (t-1)
-0.318***
(0.096)
Log of CEO age (t-1) 0.052
(0.195)
Log of CEO tenure (t-1)
-0.059***
(0.022)
Constant -1.815*** -1.981**
(0.560) (0.949)
Observations 3898 3898
Pseudo R squared 0.124 0.153
Year and industry dummies Yes Yes
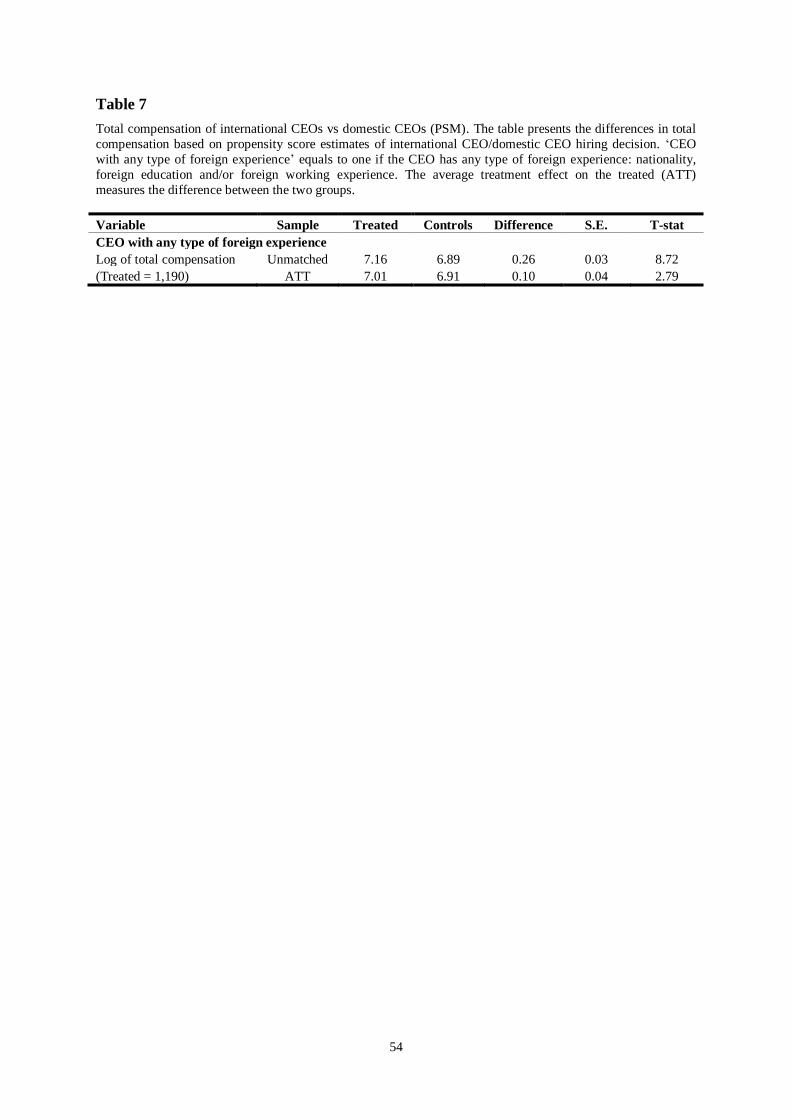
54
Table 7
Total compensation of international CEOs vs domestic CEOs (PSM). The table presents the differences in total
compensation based on propensity score estimates of international CEO/domestic CEO hiring decision. ‘CEO
with any type of foreign experience’ equals to one if the CEO has any type of foreign experience: nationality,
foreign education and/or foreign working experience. The average treatment effect on the treated (ATT)
measures the difference between the two groups.
Variable Sample Treated Controls Difference S.E. T-stat
CEO with any type of foreign experience
Log of total compensation Unmatched 7.16 6.89 0.26 0.03 8.72
(Treated = 1,190) ATT 7.01 6.91 0.10 0.04 2.79
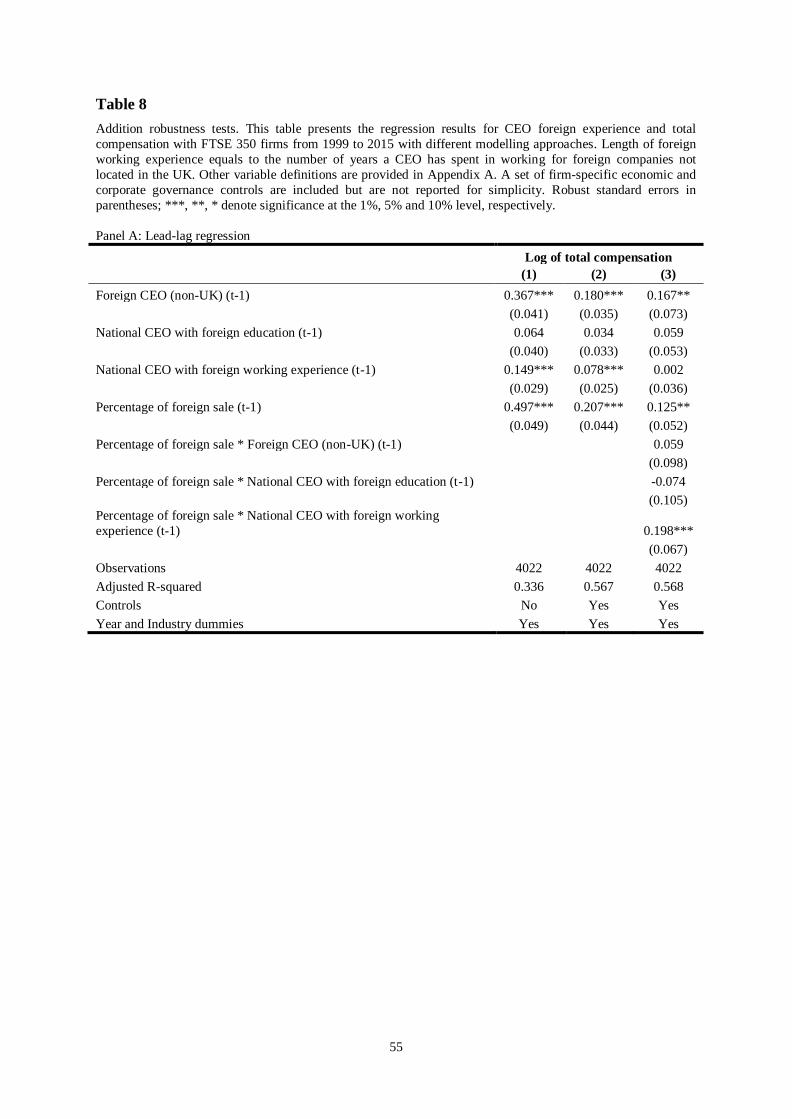
55
Table 8
Addition robustness tests. This table presents the regression results for CEO foreign experience and total
compensation with FTSE 350 firms from 1999 to 2015 with different modelling approaches. Length of foreign
working experience equals to the number of years a CEO has spent in working for foreign companies not
located in the UK. Other variable definitions are provided in Appendix A. A set of firm-specific economic and
corporate governance controls are included but are not reported for simplicity. Robust standard errors in
parentheses; ***, **, * denote significance at the 1%, 5% and 10% level, respectively.
Panel A: Lead-lag regression
Log of total compensation
(1) (2) (3)
Foreign CEO (non-UK) (t-1) 0.367*** 0.180*** 0.167**
(0.041) (0.035) (0.073)
National CEO with foreign education (t-1) 0.064 0.034 0.059
(0.040) (0.033) (0.053)
National CEO with foreign working experience (t-1) 0.149*** 0.078*** 0.002
(0.029) (0.025) (0.036)
Percentage of foreign sale (t-1) 0.497*** 0.207*** 0.125**
(0.049) (0.044) (0.052)
Percentage of foreign sale * Foreign CEO (non-UK) (t-1)
0.059
(0.098)
Percentage of foreign sale * National CEO with foreign education (t-1)
-0.074
(0.105)
Percentage of foreign sale * National CEO with foreign working
experience (t-1)
0.198***
(0.067)
Observations 4022 4022 4022
Adjusted R-squared 0.336 0.567 0.568
Controls No Yes Yes
Year and Industry dummies Yes Yes Yes
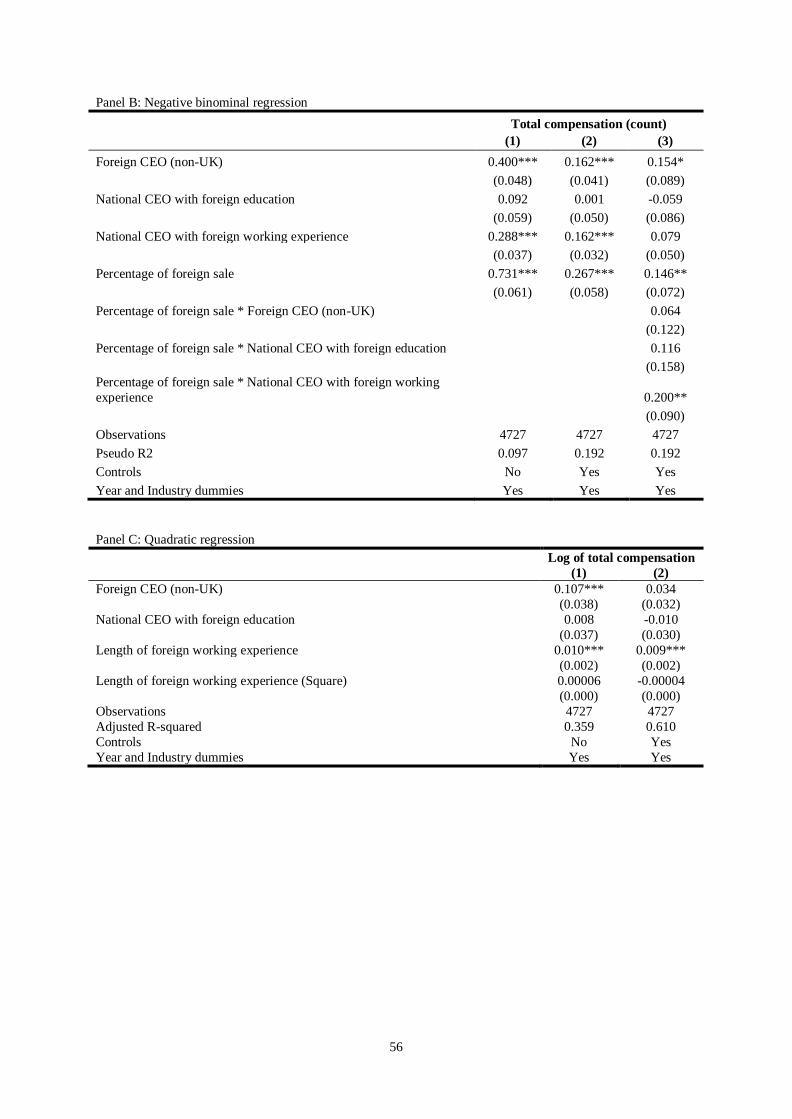
56
Panel B: Negative binominal regression
Total compensation (count)
(1) (2) (3)
Foreign CEO (non-UK) 0.400*** 0.162*** 0.154*
(0.048) (0.041) (0.089)
National CEO with foreign education 0.092 0.001 -0.059
(0.059) (0.050) (0.086)
National CEO with foreign working experience 0.288*** 0.162*** 0.079
(0.037) (0.032) (0.050)
Percentage of foreign sale 0.731*** 0.267*** 0.146**
(0.061) (0.058) (0.072)
Percentage of foreign sale * Foreign CEO (non-UK)
0.064
(0.122)
Percentage of foreign sale * National CEO with foreign education
0.116
(0.158)
Percentage of foreign sale * National CEO with foreign working
experience
0.200**
(0.090)
Observations 4727 4727 4727
Pseudo R2 0.097 0.192 0.192
Controls No Yes Yes
Year and Industry dummies Yes Yes Yes
Panel C: Quadratic regression
Log of total compensation
(1) (2)
Foreign CEO (non-UK) 0.107*** 0.034
(0.038) (0.032)
National CEO with foreign education 0.008 -0.010
(0.037) (0.030)
Length of foreign working experience 0.010*** 0.009***
(0.002) (0.002)
Length of foreign working experience (Square) 0.00006 -0.00004
(0.000) (0.000)
Observations 4727 4727
Adjusted R-squared 0.359 0.610
Controls No Yes
Year and Industry dummies Yes Yes
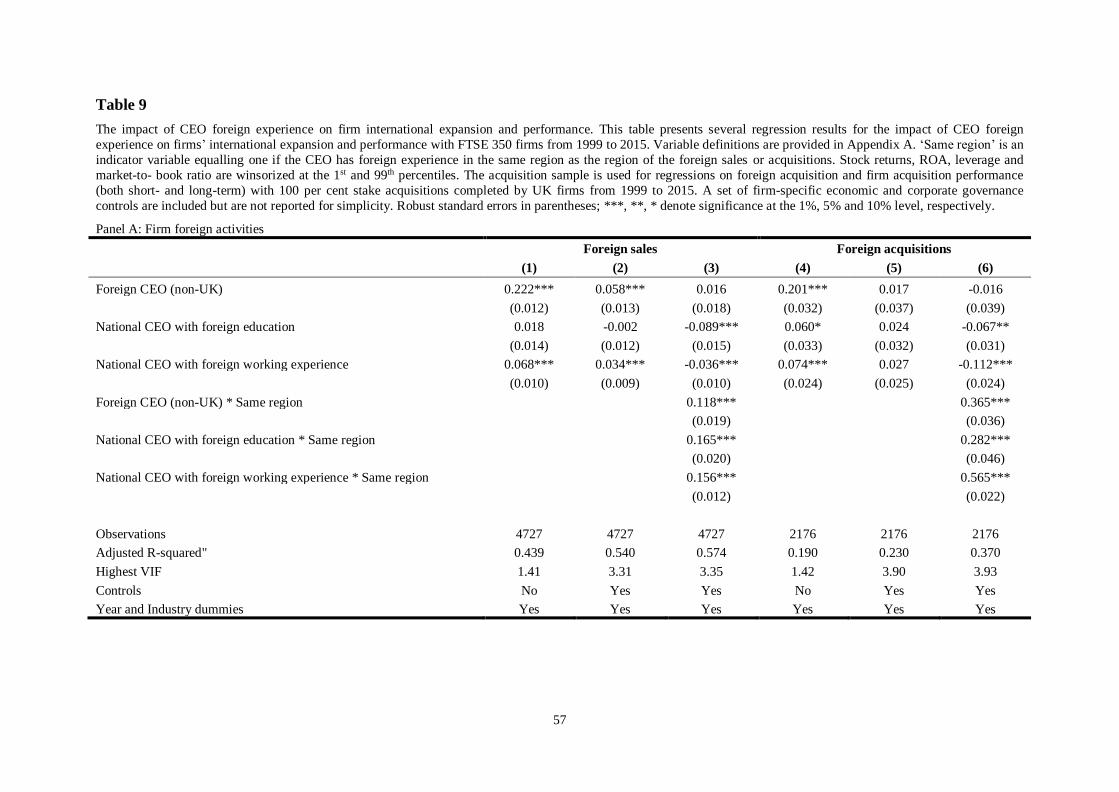
57
Table 9
The impact of CEO foreign experience on firm international expansion and performance. This table presents several regression results for the impact of CEO foreign
experience on firms’ international expansion and performance with FTSE 350 firms from 1999 to 2015. Variable definitions are provided in Appendix A. ‘Same region’ is an
indicator variable equalling one if the CEO has foreign experience in the same region as the region of the foreign sales or acquisitions. Stock returns, ROA, leverage and
market-to- book ratio are winsorized at the 1st and 99th percentiles. The acquisition sample is used for regressions on foreign acquisition and firm acquisition performance
(both short- and long-term) with 100 per cent stake acquisitions completed by UK firms from 1999 to 2015. A set of firm-specific economic and corporate governance
controls are included but are not reported for simplicity. Robust standard errors in parentheses; ***, **, * denote significance at the 1%, 5% and 10% level, respectively.
Panel A: Firm foreign activities
Foreign sales Foreign acquisitions
(1) (2) (3) (4) (5) (6)
Foreign CEO (non-UK) 0.222*** 0.058*** 0.016 0.201*** 0.017 -0.016
(0.012) (0.013) (0.018) (0.032) (0.037) (0.039)
National CEO with foreign education 0.018 -0.002 -0.089*** 0.060* 0.024 -0.067**
(0.014) (0.012) (0.015) (0.033) (0.032) (0.031)
National CEO with foreign working experience 0.068*** 0.034*** -0.036*** 0.074*** 0.027 -0.112***
(0.010) (0.009) (0.010) (0.024) (0.025) (0.024)
Foreign CEO (non-UK) * Same region
0.118***
0.365***
(0.019)
(0.036)
National CEO with foreign education * Same region
0.165***
0.282***
(0.020)
(0.046)
National CEO with foreign working experience * Same region
0.156***
0.565***
(0.012)
(0.022)
Observations 4727 4727 4727 2176 2176 2176
Adjusted R-squared" 0.439 0.540 0.574 0.190 0.230 0.370
Highest VIF 1.41 3.31 3.35 1.42 3.90 3.93
Controls No Yes Yes No Yes Yes
Year and Industry dummies Yes Yes Yes Yes Yes Yes
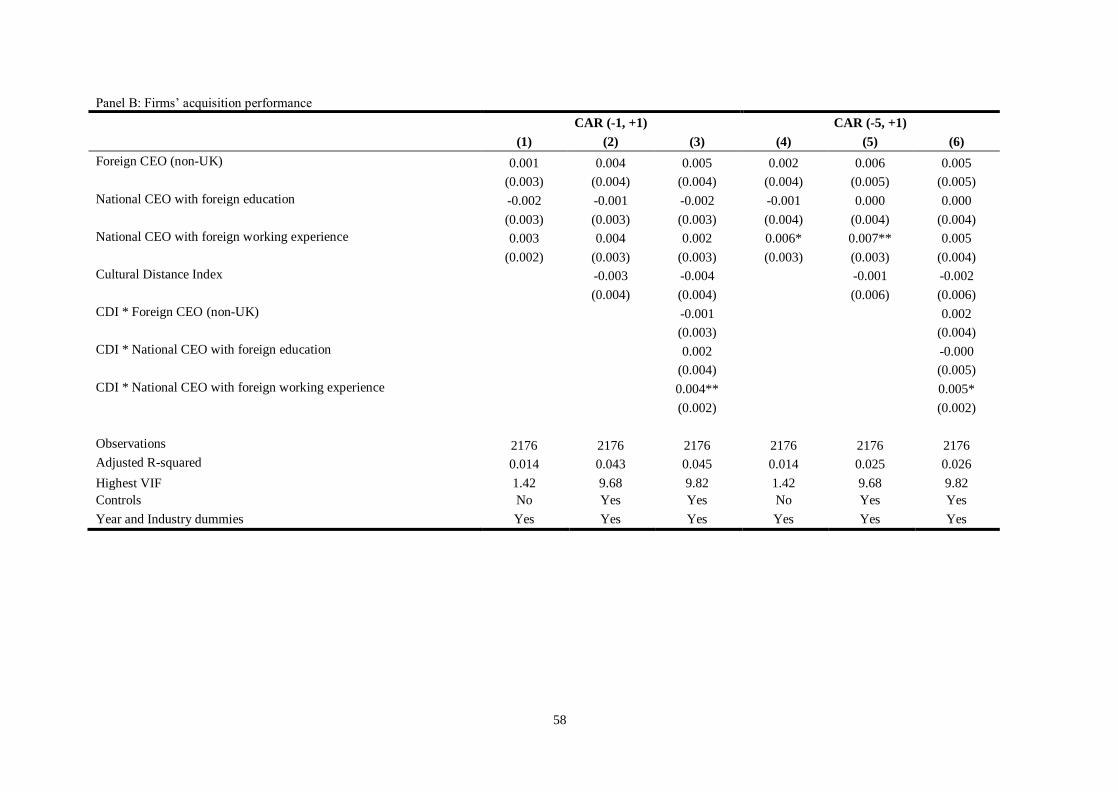
58
Panel B: Firms’ acquisition performance
CAR (-1, +1) CAR (-5, +1)
(1) (2) (3) (4) (5) (6)
Foreign CEO (non-UK) 0.001 0.004 0.005 0.002 0.006 0.005
(0.003) (0.004) (0.004) (0.004) (0.005) (0.005)
National CEO with foreign education -0.002 -0.001 -0.002 -0.001 0.000 0.000
(0.003) (0.003) (0.003) (0.004) (0.004) (0.004)
National CEO with foreign working experience 0.003 0.004 0.002 0.006* 0.007** 0.005
(0.002) (0.003) (0.003) (0.003) (0.003) (0.004)
Cultural Distance Index
-0.003 -0.004
-0.001 -0.002
(0.004) (0.004)
(0.006) (0.006)
CDI * Foreign CEO (non-UK)
-0.001
0.002
(0.003)
(0.004)
CDI * National CEO with foreign education
0.002
-0.000
(0.004)
(0.005)
CDI * National CEO with foreign working experience
0.004**
0.005*
(0.002)
(0.002)
Observations 2176 2176 2176 2176 2176 2176
Adjusted R-squared 0.014 0.043 0.045 0.014 0.025 0.026
Highest VIF 1.42 9.68 9.82 1.42 9.68 9.82
Controls No Yes Yes No Yes Yes
Year and Industry dummies Yes Yes Yes Yes Yes Yes