Does equity-based CEO compensation really increase...
30
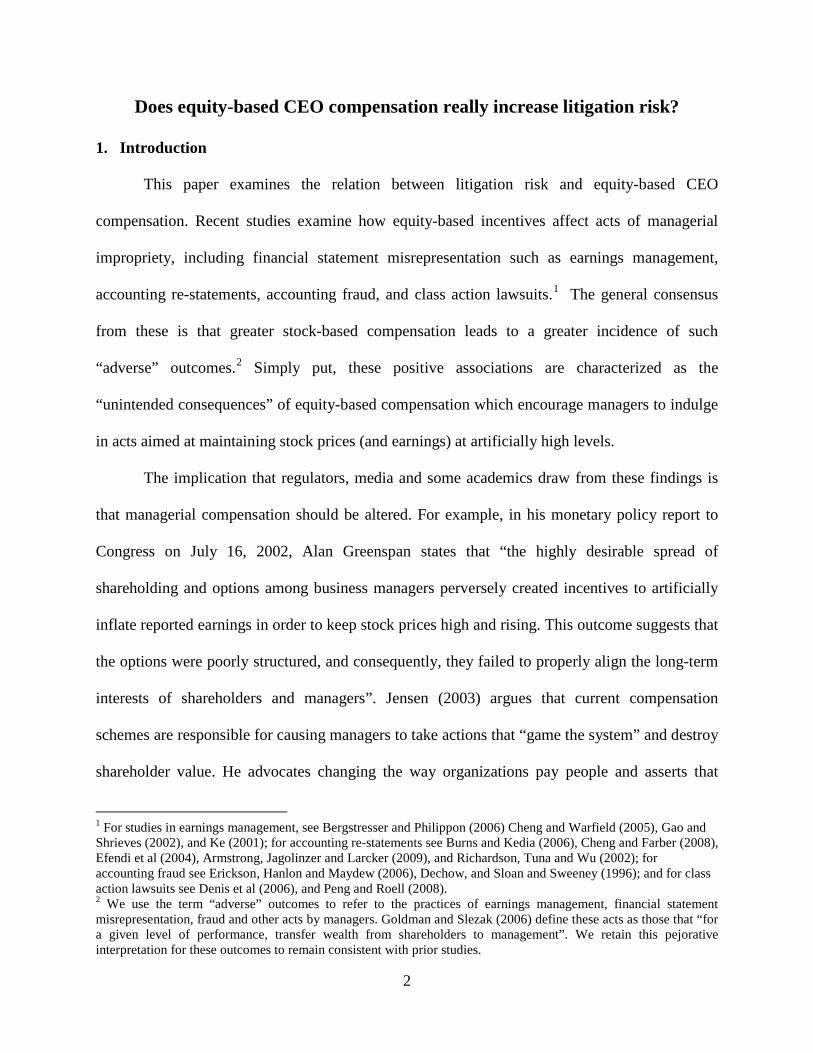
Does equity-based CEO compensation really increase litigation risk? Sudarshan Jayaraman and Todd Milbourn § Draft Date: July 24, 2009 Preliminary draft – please do not quote without permission Abstract Recent studies interpret a positive association between equity-based managerial incentives and the probability of a lawsuit (such as for financial statement misrepresentation and fraud) as evidence that equity-based compensation leads to managerial impropriety. However, these associations do not consider the simultaneous relation between equity-based compensation and litigation risk. Consistent with recent theoretical models that predict that firms will grant more equity-based compensation when the probability of detection of misrepresentation is high, we find that firms that operate in ex ante high litigation risk environments grant more equity-based compensation to their CEOs. Controlling for the effect of litigation risk on equity-based compensation, we find no evidence that higher equity-based compensation causally affects the probability of a lawsuit. Further, while sued firms exercise more options in the year before the lawsuit, these exercises as a percentage of annual option grants are not significantly different from those of firms that are not sued. Stock options may cause all sorts of bad behaviors, and are often blamed for such, but here our results do not support a causal link between equity-based incentives and the probability of a lawsuit. § Olin Business School, Washington University in St. Louis, Campus Box 1133, One Brookings Drive, St. Louis, MO 63130. Contact author: [email protected] . We appreciate helpful comments from Chad Larson. We thank Lauren Barth for research assistance. Any remaining errors are our own.
-
Upload
duongquynh -
Category
Documents
-
view
217 -
download
1
Transcript of Does equity-based CEO compensation really increase...
Does equity-based CEO compensation really increase litigation risk
Sudarshan Jayaraman and Todd Milbournsect
Draft Date July 24 2009
Preliminary draft ndash please do not quote without permission
Abstract Recent studies interpret a positive association between equity-based managerial incentives and the probability of a lawsuit (such as for financial statement misrepresentation and fraud) as evidence that equity-based compensation leads to managerial impropriety However these associations do not consider the simultaneous relation between equity-based compensation and litigation risk Consistent with recent theoretical models that predict that firms will grant more equity-based compensation when the probability of detection of misrepresentation is high we find that firms that operate in ex ante high litigation risk environments grant more equity-based compensation to their CEOs Controlling for the effect of litigation risk on equity-based compensation we find no evidence that higher equity-based compensation causally affects the probability of a lawsuit Further while sued firms exercise more options in the year before the lawsuit these exercises as a percentage of annual option grants are not significantly different from those of firms that are not sued Stock options may cause all sorts of bad behaviors and are often blamed for such but here our results do not support a causal link between equity-based incentives and the probability of a lawsuit
sect Olin Business School Washington University in St Louis Campus Box 1133 One Brookings Drive St Louis MO 63130 Contact author milbournwustledu We appreciate helpful comments from Chad Larson We thank Lauren Barth for research assistance Any remaining errors are our own
2
Does equity-based CEO compensation really increase litigation risk
1 Introduction
This paper examines the relation between litigation risk and equity-based CEO
compensation Recent studies examine how equity-based incentives affect acts of managerial
impropriety including financial statement misrepresentation such as earnings management
accounting re-statements accounting fraud and class action lawsuits1 The general consensus
from these is that greater stock-based compensation leads to a greater incidence of such
ldquoadverserdquo outcomes2
The implication that regulators media and some academics draw from these findings is
that managerial compensation should be altered For example in his monetary policy report to
Congress on July 16 2002 Alan Greenspan states that ldquothe highly desirable spread of
shareholding and options among business managers perversely created incentives to artificially
inflate reported earnings in order to keep stock prices high and rising This outcome suggests that
the options were poorly structured and consequently they failed to properly align the long-term
interests of shareholders and managersrdquo Jensen (2003) argues that current compensation
schemes are responsible for causing managers to take actions that ldquogame the systemrdquo and destroy
shareholder value He advocates changing the way organizations pay people and asserts that
Simply put these positive associations are characterized as the
ldquounintended consequencesrdquo of equity-based compensation which encourage managers to indulge
in acts aimed at maintaining stock prices (and earnings) at artificially high levels
1 For studies in earnings management see Bergstresser and Philippon (2006) Cheng and Warfield (2005) Gao and Shrieves (2002) and Ke (2001) for accounting re-statements see Burns and Kedia (2006) Cheng and Farber (2008) Efendi et al (2004) Armstrong Jagolinzer and Larcker (2009) and Richardson Tuna and Wu (2002) for accounting fraud see Erickson Hanlon and Maydew (2006) Dechow and Sloan and Sweeney (1996) and for class action lawsuits see Denis et al (2006) and Peng and Roell (2008) 2 We use the term ldquoadverserdquo outcomes to refer to the practices of earnings management financial statement misrepresentation fraud and other acts by managers Goldman and Slezak (2006) define these acts as those that ldquofor a given level of performance transfer wealth from shareholders to managementrdquo We retain this pejorative interpretation for these outcomes to remain consistent with prior studies
3
wersquod be better off using linear compensation contracts Coffee (2005) identifies stock options as
the best explanation for the rise in accounting scandals in the late 1990s and early 2000s stating
that ldquohellipabsent special controls more options means more fraudrdquo
However there are others who express skepticism at these interpretations In particular
Bushman and Smith (2001) discuss the effect of observed incentive contracts on earnings
management behavior and note that ldquothis research begs the question of why these contracts exist
in the first place Are the observed contracts at these firms not optimal After all any incentives
for earnings management could be mitigated by offering flat wage contractshellip An economic
answer to these questions must fully consider the equilibrium from which the empirical
observations are drawnrdquo In response to this charge there are some recent theoretical models that
examine the equilibrium relation between equity-based incentives and information manipulation
We lean on these theories as we take up this charge empirically
Goldman and Slezak (2006) explore the relation between equity-based compensation and
information manipulation and point out that the existing models do not consider how the
potential for manipulation might affect equilibrium contracts They present a model where the
manager exerts effort but can also indulge in misrepresentation Shareholders determine the
optimal level of stock-based compensation by trading off the benefits of higher effort with the
costs of greater manipulation In equilibrium stock-based compensation is higher for firms
where the probability of detection is higher3
3 Other related theories are Peng and Roell (2008) Crocker and Slemrod (2007) and Laux and Laux (2009) While these studies also model how the ability of managers to influence the stock price through misrepresentation affects equity-based incentives they do not examine how these incentives vary with the probability of detection
The intuition is that the high probability of
detection reduces managerrsquos incentives to indulge in information manipulation thereby reducing
4
the costs of equity-based compensation4 As firms with high (ex-ante) litigation risk have a
greater probability of detection firms with high litigation risk will offer more equity-based
compensation to their managers Thus one has to control for the effect of litigation risk on
equity-based compensation while examining the causal impact of equity-based compensation on
the probability of a lawsuit As features of compensation contracts are endogenously determined
using them as exogenous variables results in an endogeneity bias that can lead to incorrect
inferences5
We examine the empirical relation between equity-based compensation and litigation risk
in a simultaneous equations framework where equity-based incentives are affected by litigation
risk and vice-versa
6
4 This is akin to Fischer and Verrecchia (2000) who find that the extent of managerial bias in reporting is decreasing in the costs of bias which in turn increases the information content of earnings
To guide us in the selection of appropriate instruments (see Larcker and
Rusticus (2005)) we turn to the voluntary disclosure literature where a similar debate exists
between voluntary disclosures and litigation risk Skinner (1994) shows that the risk of litigation
forces managers of firms with earnings disappointments to preempt the bad news voluntarily
through earnings forecasts The implication is that voluntary disclosures reduce litigation risk
Francis et al (1994) compare the disclosure frequency of firms that were sued versus comparable
firms that were not and find that the sued firms had a higher frequency of disclosure than their
counterparts They conclude that voluntary disclosures increase litigation risk However Field
Lowry and Shu (2005) argue that litigation risk and voluntary disclosures are determined
5 Erickson et al (2006) also attempt to cope with endogeneity in their study of equity incentives and accounting fraud Since the nature of endogeneity in their study is of correlated omitted variable type they address it by including additional control variables However as the endogeneity in our study stems from the simultaneous relation between litigation risk and CEO compensation we employ a system of equations approach instead 6 As we explain in detail below our choice of litigation amongst the ldquoadverserdquo outcomes is partly driven by the voluntary disclosure literature which has carefully modeled the relation between litigation risk and management forecasts using a similar simultaneous equations framework We believe however that our inferences can be generalized to other outcomes such as restatements and fraud For example Hennes Leone and Miller (2008) find that most restatements due to intentional misstatements are followed by a class-action lawsuit Further the industries with the highest proportion of fraud in Erickson et al (2006) belong to the high litigation risk industries
5
endogenously Using a two-stage least squares model they find that controlling for the impact of
litigation risk on disclosure frequency (ie the tendency of firms with higher litigation risk to
voluntary disclose more frequently) there is some evidence that disclosure dissuades rather than
triggers a lawsuit They term the former effect as the ldquopreemption effectrdquo and the latter effect as
the ldquodeterrence effectrdquo
We follow the methodology in Field et al (2005) to examine the relation between equity-
based compensation and litigation risk First we estimate the level of equity-based pay as a
function of litigation risk and other determinants Following prior studies we use high litigation
risk industries as the instrument to capture ex-ante high litigation risk7 Consistent with Goldman
and Slezak (2006) we find that firms that operate in high litigation risk industries offer more
equity-based compensation to their CEOs Our estimates suggest that litigation risk increases
total equity-based compensation by 32 and the proportion of equity-based pay to total pay by
15 We then use the predicted value of equity-based compensation from this regression to
examine whether equity-based incentives lead to a higher probability of a lawsuit Contrary to
the myopia story our results do not provide any evidence that equity-based compensation
causally increases the probability of a lawsuit8
Next we examine the relation between class-action lawsuits and stock option exercises
Beneish (1999) and Bergstresser and Philippon (2006) find that both managerial stock option
exercises and stock sales are high during periods of misrepresentation Given that firms with
Overall our results suggest that controlling for
the endogenous relation between litigation risk and equity-based compensation there is no
evidence that more equity-based compensation causally affects the probability of a lawsuit
7 The classification of high litigation risk industries is based on lawsuits that pre-date our sample See Francis et al (1994) Shu (2000) Johnson et al (2001) Field et al (2005) Rogers and Stocken (2005) 8 To ensure comparability with prior studies we estimate a simple probit model and find that the probability of a lawsuit is positively associated with the extent of equity-based compensation Results are similar using a logit model
6
high litigation risk are on average granted more options every year we examine whether higher
diversification demands (eg Ofek and Yermack (2000) Jin and Kothari (2008)) explain the
high levels of stock option exercises by firms that are sued and find confirmatory evidence In
particular although the ratio of stock option exercises to firm value is higher for sued firms than
for non-sued firms (consistent with Bergstresser and Philippon (2006) and Beneish (1999)) the
ratio of stock option exercises to annual stock option grants is not significantly different between
the two groups of firms Overall the results do not provide any evidence that sued firms exercise
an unusually large amount of stock options during periods of misrepresentation
There are three main contributions in our work First consistent with recent theoretical
models we uncover evidence that firms with high (ex-ante) litigation risk offer their CEOs more
equity-based compensation Second and contrary to existing findings we find no evidence that
high equity-based incentives causally affect the probability of a lawsuit once one accounts for
the endogeneity between litigation and equity-based compensation Third the higher levels of
stock option exercises in sued firms is seemingly explained by their higher diversification
demand as these firms are granted more stock options every year During the period of
misrepresentation there does not appear to be an unusually large amount of option exercises
The study most closely related to ours is Armstrong et al (2009) They use a propensity
score matched pair design for a broader sample of firms and find no evidence that financial
misrepresentation is related to equity-based incentives Our results complement their evidence by
suggesting that explicitly modeling the simultaneous relation between equity-based incentives
and litigation risk also provides no evidence of a causal effect of managerial incentives on the
probability of a lawsuit even in the absence of propensity score matching Going beyond their
work we confirm that equity-based compensation is positively and significantly associated with
7
the probability of a lawsuit in a simple probit model Lastly we provide evidence that higher
stock option exercises in sued firms appears to be driven by greater diversification demands
generated by the higher level of annual option grants rather than from managerial misbehavior
The rest of the paper proceeds as follows Section 2 presents our motivation followed by
the testable hypothesis that we take to the data Section 3 lays out the research design while
Section 4 presents the main results Section 5 further explores stock option exercises during
periods of misrepresentation Robustness tests are in Section 6 and section 7 concludes
2 Motivation
In this section we briefly discuss prior studies that examine the relation between equity-
based CEO compensation and outcomes that are generally considered ldquoadverserdquo We then
present our motivation and lay out our hypotheses
21 Equity-based incentives and adverse outcomes
Prior studies on the unintended consequences of equity-based incentives can be
categorized into two groups based on the outcome variables being examined viz financial
statement representation and class-action lawsuits Financial statement misrepresentation can
take one of three forms ndash earnings management accounting restatements and fraud (see Ball
(2009)) Bergstresser and Philippon (2006) find that firms where CEOsrsquo compensation is more
closely tied to the stock price use more discretionary accruals They also find that CEOs exercise
more options and sell more shares during this period Similarly Cheng and Warfield (2005) find
that managers with high equity incentives are more likely to report earnings that meet or just beat
analysts forecasts and less likely to report large positive earnings surprises They interpret these
results to indicate that equity incentives lead to incentives for earnings management Ke (2001)
8
also finds that the probability of reporting a small increase in earnings is increasing in CEO
equity-based compensation incentives
Burns and Kedia (2006) Efendi et al (2007) Johnson Ryan and Tian (2009) and Harris
and Bromiley (2007) find that the likelihood of a misstated financial statement is positively
associated with CEO equity-based incentives Beneish (1999) finds that managers of restatement
firms are more likely to sell their own stock during periods in which the earnings management is
taking place Cheng and Farber (2008) examine changes in CEO compensation after accounting-
restatements and find that firms reduce the extent of equity-based compensation awarded to their
CEOs in the two years after accounting re-statements On the other hand Erickson et al (2006)
and Armstrong et al (2009) find no association between equity-based incentives and the
likelihood to commit fraud Erickson et al (2006) also find no evidence that managers of these
firms sell more stock or exercise more options during the alleged fraud period
The other set of studies (eg Peng and Roell (2008) Denis Hanouna and Sarin (2006))
examine the relation between managerial equity-based incentives and class action lawsuits
uncovering that the probability of a lawsuit is higher in firms with more stock options The
interpretation is that equity-based incentives cause managers to take actions that result in
lawsuits As most restatements due to intentional misstatements are followed by a fraud-related
class-action lawsuit (eg Hennes Leone and Miller (2008)) the inferences from the two sets of
studies are complementary
22 The effect of litigation risk on equity-based incentives
Dating back to Jensen and Meckling (1976) a voluminous literature has examined the
effect of equity-based incentives in aligning the interests of managers with those of shareholders
The role of equity-based incentives in classic models (eg Holmstrom (1979)) is to induce the
9
manager to exert effort by tying his wealth to the stock price Recent theoretical studies (eg
Goldman and Slezak (2006) Peng and Roell (2008) Crocker and Slemrod (2007) and Laux and
Laux (2009)) allow the manager to exert two types of effort ndash one that increases the stock price
by increasing future cash flows and the other that increases the stock price by manipulating
information Shareholders in these models trade off the benefits of equity-based incentives
(greater effort) with the costs (more manipulation)9
H1 Firms with high litigation risk grant more equity-based compensation to their CEOs
Goldman and Slezak (2006) examine how
equity-based compensation varies with the probability that misrepresentation is detected and find
that firms where misrepresentation is more likely to be detected offer more equity-based
compensation to their CEOs This is because a high (ex-ante) probability of detection dissuades
manipulation thus reducing the costs of equity-based incentives As firms with high litigation
risk are those where the probability of detection is higher their model predicts that firms with
high litigation risk will provide more equity-based compensation to their managers Thus our
first hypothesis is as follows
We will lay out our additional hypotheses later in the paper
3 Research design
In this section we first describe the empirical proxies and follow with a description of
our two samples We then motivate our control variables and present our regression
specifications
9 Peng and Roell (2008) present a model where the manager can manipulate the stock price but there is uncertainty about the degree of manipulation Their model predicts that the elasticity of pay to the stock price is higher in the presence of uncertainty Crocker and Slemrod (2007) presents a model that combines hidden action (agentrsquos effort cannot be observed) and hidden information (agent reports earnings after observing true earnings which shareholders cannot observe) They find that the equilibrium compensation contract cannot both maximize effort and minimize misrepresentation In Laux and Laux (2009) the greater incentive for earnings management brought about by equity-based incentives is mitigated by higher monitoring by the board However these models do not examine how the compensation contract varies with the probability of detection
10
31 Litigation risk (LIT)
We use membership in certain industries as our measure of high (ex-ante) litigation risk
Prior studies have identified firms that operate in the bio-technology (SIC code 2833-2836 and
8731-8734) computing (SIC codes 3570-3577 and 7370-7374) electronics (SIC codes 3600-
3674) and retailing (SIC codes 5200-5961) industries to be more prone to higher litigation risk
than other firms (eg Francis et al (1994) Shu (2000) Johnson et al (2001) Field et al (2005)
Rogers and Stocken (2005)) We define litigation risk (LIT) as an indicator variable taking the
value of one if a firm belongs to these industries The classification of these industries is based
on data that pre-date our sample
32 CEO compensation
We define total annual compensation (TOTALCOMP) as the sum of salary bonus
restricted stock grants option grants and all other annual compensation We examine two
components of total compensation ndash the cash-based component (CASHBASED) defined as the
sum of salary and bonus and equity-based compensation (EQUITYBASED) defined as the sum
of Black-Scholes value options grants and restricted stock grants We also examine the ratio of
equity-based compensation to total compensation (EQUITYRATIO)
33 Sample
331 Main sample
Our empirical tests are based on two samples The first sample is used to examine the
effect of litigation risk on equity-based compensation As litigation risk is based on industry
classification the sample is based on all firms with compensation data on ExecuComp
accounting data on Compustat and stock price data on CRSP The final sample comprises of
20646 firm-year observations for 2646 unique firms between the years 1992 and 2006
11
Descriptive statistics are presented in Panel A of Table 1 The annual total compensation
for the CEO for the sample is around $41 million of which $12 million is from salary and
bonus and $21 million is from stock option grants and restricted stock grants These statistics
compare closely with those found in other studies (eg Jayaraman and Milbourn (2009) Garvey
and Milbourn (2003)) Equity-based compensation is 36 of the CEOrsquos annual compensation
The mean value of LIT is 028 which implies that 28 of the sample consists of firms with high
litigation risk The median firm in the sample has existed on Compustat for 20 years and has
annual sales of around $11 billion
332 Lawsuit sample
The second sample is used to explore the effect of equity-based compensation on the
probability of a lawsuit Our sample of class-action lawsuits is from the Stanford Securities Class
Action Clearinghouse and covers lawsuits filed during the period 1996 to 200710 These data
have been used by other studies such as Field et al (2005) Rogers and Stocken (2005) Denis et
al (2006) and Peng and Roell (2008) To ensure better matching with the ExecuComp sample
we hand-collect the firm-identifier (GVKEY) for the lawsuit sample11 The final sample
comprises 474 lawsuits between the years 1996 and 2007 To avoid any look-ahead bias the
independent variables in the prediction models are based on year t-1 relative to the year of the
lawsuit which is denoted as year t To form the control sample we follow Field et al and
randomly select one observation from the same year as the lawsuit firm from our first overall
sample12
10
Our final sample comprises of 948 firm-year observations
httpsecuritiesstanfordedu 11 Our results are robust to using the ticker symbol to match 12 We do not match by industry as our litigation risk indicator is an industry level variable Further in our robustness tests in Section 6 we follow the alternate matching techniques in Erickson et al (2006) and find similar results
12
Descriptive statistics for the lawsuit firms are presented in Panel B of Table 1 The total
compensation for sued firms is $687 million of which 46 is equity-based These numbers are
much higher than the overall sample of Panel A However it is important not to draw any causal
inferences about the role of equity-based compensation from these data as the need to control for
the effect of litigation risk on equity-based compensation is our fundamental starting point The
sued firms appear to have higher growth opportunities (MB is 296 versus 207 RampD is 009
versus 004) are larger better performing and more volatile (RETVOL is 014 compared to 012)
than the overall sample However care has to be exercised while interpreting these differences as
they have not been tested for statistical difference
The preliminary evidence suggests that sued firms differ from the overall sample in
various characteristics most relevant of which is the extent of equity-based compensation In the
next section we examine whether causal inferences can be drawn regarding the effect of equity-
based compensation on the probability of being sued
4 Empirical Results
41 Univariate evidence
Panel C of Table 1 splits the overall sample based on high litigation risk industries
(LIT=1) and others (LIT=0) and compares components of annual compensation between these
two groups Figures in bold indicate that the means (or medians) are significantly different
between the two groups The descriptive statistics provide some evidence that total compensation
is higher for managers of firms that operate in high litigation risk industries (mean compensation
is $442 million) compared with those in other industries (mean=$397 million) However the
median total pay is not any different between the two groups
13
In terms of the individual components of pay there is strong evidence that firms in high
litigation industries offer more equity-based compensation to their CEO (mean of $278 million
and median of $083 million) compared to those in non-high litigation risk industries (mean =
$187 million and median = $054 million) These differences are significant for both means and
medians Finally the ratio of equity-based compensation to total compensation is also
significantly higher for the high litigation risk group There is evidence that firms in high
litigation risk industries differ from those in non-high litigation risk industries along several
dimensions which have been previously shown to influence compensation characteristics For
example firms in high litigation risk industries have higher growth opportunities (mean MB of
277 compared to 180) invest more in RampD have more volatile environments (median
RETVOL is 013 compared to 009) have more cash on hand and are younger
As correlations do not control for differences in these innate characteristics between firms
and over time they should be interpreted cautiously Nevertheless an association between LIT
and EQUITYRATIO in univariate correlations suggests a first-order effect of high litigation risk
on CEO equity-based compensation
42 Multivariate regressions
In this section we discuss variables related to equity-based compensation used in prior
studies and incorporate them in a multivariate regression to ascertain whether the explanatory
power of LIT with respect to EQUITYRATIO is incremental to that of these characteristics
421 Firm level determinants
As prior studies find that the investment opportunity set affects stock-based
compensation (eg Clinch (1991) Smith and Watts (1992) Gaver and Gaver (1993) and Baber
et al (1996)) we follow Ittner et al (2003) and include four variables to capture the investment
14
opportunity set ndash the market-to-book ratio (MB) the ratio of research and development expenses
to sales (RampD) the ratio of advertising expenses to sales (ADVT) and the log of firm age defined
as the number of years the firm exists on Compustat (LN_AGE) Consistent with prior studies
we expect a positive coefficient on MB RampD and ADVT and a negative coefficient on LN_AGE
As is standard we control for firm size using the log of total sales (SALES) As prior studies
present conflicting arguments for the relation between firm size and equity-based compensation
we merely include it as a control without making a directional prediction Following Ittner et al
we use leverage (LEV) to capture monitoring by debt holders and expect a negative relation with
EQUITYRATIO
We use both accounting (ROA) and stock price (RET) based measures to capture prior
performance RET represents the prior yearrsquos annual stock return We also include stock return
volatility (RETVOL) to capture features of the operating environment Studies such as
Prendergast (2000 2002) argue that firms rely more on stock-based incentives in riskier
environments where it is more difficult to monitor the managerrsquos actions On the other hand
studies such as Demsetz and Lehn (1985) Lambert and Larcker (1987) Aggarwal and Samwick
(1999) and Garvey and Milbourn (2003) argue that greater stock return volatility captures more
noise in the output measure and firms should therefore reduce stock-based incentives (see also
Jayaraman and Milbourn (2009)) We therefore do not make a directional prediction for
RETVOL As studies argue that cash-constrained firms rely more on stock-based compensation
(eg Yermack (1995) Core and Guay (1999 2001)) we include the ratio of cash on hand to
total assets (CASH) and free cash flows (FCF) defined as cash flow from operations less capital
expenditures scaled by total assets to capture the incentive to conserve cash
15
Following Petersen (2009) we estimate the regressions with year indicators and standard
errors clustered at the firm level The year indicators control for common shocks which could
cause cross-sectional correlation in the errors The firm-level clustering of standard errors
corrects for the possibility of serial correlation attributable to unobserved firm effects
422 Effect of litigation risk on equity-based compensation
The empirical specifications we employ are
0 0 0 0 0 0
0 0 0 0 0
9
0 0 1
amp
_
i t i t i t i t i t i t
i t i t i t i t i t
i t i t J i tJ
CASHBASED LIT MB R D ADVT SALESLEV RET RETVOL ROA CASH
FCF LN AGE YEAR IND
α α α α α α
α α α α α
α α ε=
= + + + + +
+ + + + +
+ + + + +sum sum
(1)
0 0 0 0 0 0
0 0 0 0 0
9
0 0 1
amp
_
i t i t i t i t i t i t
i t i t i t i t i t
i t i t J i tJ
EQUITYBASED LIT MB R D ADVT SALESLEV RET RETVOL ROA CASH
FCF LN AGE YEAR IND
α α α α α α
α α α α α
α α ε=
= + + + + +
+ + + + +
+ + + + +sum sum
(2)
0 0 0 0 0 0
0 0 0 0 0
9
0 0 1
amp
_
i t i t i t i t i t i t
i t i t i t i t i t
i t i t J i tJ
EQUITYRATIO LIT MB R D ADVT SALESLEV RET RETVOL ROA CASH
FCF LN AGE YEAR IND
α α α α α α
α α α α α
α α ε=
= + + + + +
+ + + + +
+ + + + +sum sum
(3)
where CASHBASED EQUITYBASED and EQUITYRATIO are cash-based compensation
equity-based compensation and the ratio of equity-based compensation to total compensation
respectively
Table 2 presents results of the above multivariate regressions The coefficient of LIT is
negative and insignificant (t-statistic is -128) in Model 1 suggesting that litigation risk does not
affect cash-based compensation of CEOs The coefficients of LIT are positive and significant (t-
stats are 496 and 473 respectively) in Models 2 and 3 suggesting that the level of equity-based
compensation as well as the proportion of equity-based compensation to total compensation are
16
higher for firms with higher litigation risk The coefficients (60485 and 005) suggest that
litigation risk increases total equity-based compensation by 32 and the proportion of equity-
based compensation to total compensation by 15 respectively relative to the overall mean
423 Effect of equity-based compensation on litigation risk
In this section we first examine the relation between the probability of a lawsuit and
equity-based compensation in a simple probit model We then model the simultaneous relation
between lawsuit probability and equity-based compensation as follows
1 1 1 1 Equity based compensation Litigation risk Xγ β ε= + + (4)
2 2 2 2 = Litigation risk Equity based compensation Xγ β ε+ + (5)
As Field et al (2005) point out it is incorrect to substitute ex-post occurrence of litigation
to capture litigation risk in eq (4) This is because the occurrence of litigation is not exogenous
and depends on the compensation contract For example firms that choose to offer less equity-
based compensation to their CEOs have a low error term ( 1ε ) Similarly these firms also have a
higher probability of litigation as their CEOs are less aligned with shareholders which means 2ε
will be high This potential correlation between 1ε and 2ε causes ordinary probit to be biased
We therefore treat (4) and (5) as simultaneous equations To ensure that equations (4) and (5) are
appropriately identified we need a variable in 1X that is not in 2X and vice-versa
Following Field et al (2005) we use the industry litigation risk indicator (LIT) as the
instrument in equation (4) As annual options are granted based on the previously outstanding
level of stock options to ensure an optimal level of alignment we use the sum of outstanding
options as of the previous year end (OSOPTIONS) as the instrument to identify equation (5)13
13 This is analogous to Field et al (2005) who use past disclosure as the instrument for current period disclosure
We estimate the simultaneous regression framework in two stages In the first stage we regress
17
the proportion of equity-based compensation (EQUITYRATIO) on the two instruments (LIT and
OSOPTIONS) and all the other independent variables We then use the predicted value from this
first stage (EQUITYPREDICT) regression in the second-stage probit model where the dependent
variable is whether or not the firm was sued (LAW=1)
Table 3 presents results of the above regressions with the first set of columns presenting
the probit results Consistent with prior studies the coefficient of EQUITYRATIO is positive
(049) and significant (t-statistic = 325) This suggests that firms that have been sued are
associated with more equity-based compensation that those that are not However as the next set
of results show it is problematic to draw any causal inference from these associations The next
set of columns present the first stage of the two-stage framework The specification is similar to
that used in table 2 except that the instrument for equation (5) viz OSOPTIONS has been
included The last set of columns presents the results of the second-stage where the independent
variable of interest is the predicted value of equity-based compensation from the first stage
(EQUITYPREDICT) The coefficient of endogenously determined equity-based compensation is
not significantly related to the probability of a lawsuit (t-stat = -080) which is inconsistent with
the myopia story This is one of the two main results of the study
5 Managerial stock option exercises during misrepresentation period
Prior studies find that managers of firms that are accused of misrepresentation exercise
more options during the misrepresentation period than other firms (eg Bergstresser and
Philippon (2006) and Beneish (1999)) Studies such as Ofek and Yermack (2000) show that
executives sell almost all shares that they regularly exercise which is consistent with managers
diversifying away their firm-specific risk Given that sued firms (alternatively firms with higher
18
litigation risk) are granted more options annually we explore whether the higher options
exercises by sued firms is consistent with the higher demand for diversification
We first confirm that sued firms exercise more options (as a percent of market value)
than their non-sued counterparts in the year before the lawsuit We define OPTEXER as the value
of stock options exercised by the CEO scaled by market value of equity and examine differences
in OPTEXER between ndash (i) high litigation risk and low litigation risk firms and (ii) sued and not
sued firms We define OPTEXERRATIO as the ratio of the value of options exercised during the
year scaled by the value of total options granted during the year
Panel A of Table 4 presents the univariate comparisons The firms with high litigation
risk exercise options worth 012 of firm value versus 007 by firms with low litigation risk
These differences are statistically significant at the 1 level Similarly managers of sued firms
exercise more options (013 of firm value) in the year before lawsuit relative to all other firms
(008) which are also significantly different from one another at less than the 1 level This
evidence is consistent with Bergstresser and Philippon (2006) and Beneish (1999)) However
when we compare differences in OPTEXERRATIO the differences are no longer significant
between the sued firms and not sued firms Thus the value of options exercised during the year
as a percentage of total options granted is not higher for sued firms relative to not-sued firms
These inferences are confirmed by the multivariate evidence where the coefficient of LAW
(which denotes sued versus not-sued firms) is significant when OPTEXER is the dependent
variable but is insignificant when the dependent variable is OPTEXERRATIO Overall these
results suggest that options exercises by managers of sued firms are not unusually high during
the period of misrepresentation This is the second main result of the paper
19
6 Robustness tests
In this section we perform two robustness tests to verify the sensitivity of our inferences
Specifically we ensure that our results are not driven by new economy firms or alternative
sample matching techniques
61 New economy firms
Using survey data Ittner Lambert and Larcker (2003) highlight that new-economy firms
rely more on stock-based compensation than old economy firms Murphy (2003) extends and
confirms the Ittner et al result to all ExecuComp firms Murphyrsquos (2003) classification of new-
economy firms overlaps with that of the high litigation risk industries We examine whether our
results merely re-state the new economy firms result in these papers To do so we first include
an indicator to capture new economy firms as used in Murphy (2003) as an additional
independent variable We find that the coefficient of LIT remains positive and significant
Second in the probit regression with LAW as the dependent variable we include the new
economy indicator to examine whether new economy firms are more likely to be sued We find
no evidence to this effect We therefore conclude that the relation between litigation risk and
equity-based compensation is not due to the new economy firms finding of Ittner et al (2003)
62 Alternate control samples
We also examine whether our results are robust to alternate control samples Following
Erickson et al (2006) we use two alternate control samples First we randomly select two firms
from the main sample for each sued firm and second we use all firms that were never sued
Additionally as the proportion of high litigation firms to all firms is 28 we randomly select
three firms for each sued firm in order to simulate this mix The results for these alternate
controls are presented in Table 5 The coefficient of EQUITYRATIO is positive and significant in
20
all samples in the simple probit model while the coefficient of EQUITYPREDICT is generally
negative and significant in the two-stage least squares models Thus our inferences appear to be
robust to alternate control samples used in prior studies
7 Conclusion
We re-examine the relation between equity-based compensation and litigation risk in a
simultaneous equations framework Consistent with theoretical models that predict that firms
will grant more equity-based incentives when the probability of detection of misrepresentation is
high we find that firms with high (ex-ante) litigation risk grant more equity-based incentives to
their managers More importantly once one controls for the effect of litigation risk on equity-
based compensation the evidence does not support the inference from prior studies that higher
equity-based compensation causes a higher probability of a class-action lawsuit
Further while managers of sued firms exercise more options during the period of
misrepresentation these options as a ratio of annual options grants are more significantly
different from those of not-sued firms This evidence suggests that the greater option exercises
by sued firms are due to their greater diversification demand and not due to managers acting
strategically during these periods Overall while stock options may be guilty of causing some
managerial misbehavior our results cast doubt over the ldquounintended consequencesrdquo in the
shareholder litigation realm of managerial equity-based incentives
21
References
Aggarwal R Samwick A 1999 The other side of the trade-off The impact of risk on executive compensation Journal of Political Economy Vol 107 pp 65ndash105 Armstrong C S AD Jagolinzer and DF Larcker 2009 Chief Executive Officer Equity Incentives and Accounting Irregularities Working paper University of Pennsylvania Baber W R S N Janakiraman and S H Kang Investment Opportunities and the Structure of
Executive Compensation Journal of Accounting amp Economics 21 no 3 (1996) 297-318
Ball R Market and PoliticalRegulatory Perspectives on the Recent Accounting Scandals
Journal of Accounting Research 47 no 2 (2009) 277-323 Beneish M D Incentives and Penalties Related to Earnings Overstatements That Violate
Gaap Accounting Review 74 no 4 (1999) 425-57 Bergstresser D and T Philippon Ceo Incentives and Earnings Management Journal of
Financial Economics 80 no 3 (2006) 511-29 Burns N and S Kedia The Impact of Performance-Based Compensation on Misreporting
Journal of Financial Economics 79 no 1 (2006) 35-67 Bushman R M and A J Smith Financial Accounting Information and Corporate
Governance Journal of Accounting amp Economics 32 no 1-3 (2001) 237-333 Core John and W Guay 2002 The other side of the trade-off The impact of risk on executive compensation a Revised Comment Working paper University of Pennsylvania Cheng Q and D B Farber Earnings Restatements Changes in Ceo Compensation and Firm
Performance Accounting Review 83 no 5 (2008) 1217-50 Cheng Q and T A Warfield Equity Incentives and Earnings Management Accounting
Review 80 no 2 (2005) 441-76 Crocker K J and J Slemrod The Economics of Earnings Manipulation and Managerial
Compensation Rand Journal of Economics 38 no 3 (2007) 698-713 Demsetz Harold and Kenneth Lehn 1985The structure of corporate ownership Causes and consequences Journal of Political Economy 93 1155-1177 Denis D J P Hanouna and A Sarin Is There a Dark Side to Incentive Compensation
Journal of Corporate Finance 12 no 3 (2006) 467-88
22
Efendi J A Srivastava and E P Swanson Why Do Corporate Managers Misstate Financial Statements The Role of Option Compensation and Other Factors Journal of Financial Economics 85 no 3 (2007) 667-708
Erickson M M Hanlon and E L Maydew Is There a Link between Executive Equity
Incentives and Accounting Fraud Journal of Accounting Research 44 no 1 (2006) 113-43
Field L M Lowry and S Shu Does Disclosure Deter or Trigger Litigation Journal of
Accounting amp Economics 39 no 3 (2005) 487-507 Fischer P E and R E Verrecchia Reporting Bias Accounting Review 75 no 2 (2000) 229-
45 Garvey G and T Milbourn 2003 Incentive compensation when executives can hedge the market evidence of relative performance evaluation in the cross-section Journal of Finance 58 pp 1557ndash1582 Gaver J J and K M Gaver Additional Evidence on the Association between the Investment
Opportunity Set and Corporate Financing Dividend and Compensation Policies Journal of Accounting amp Economics 16 no 1-3 (1993) 125-60
Goldman E and S L Slezak An Equilibrium Model of Incentive Contracts in the Presence of
Information Manipulation Journal of Financial Economics 80 no 3 (2006) 603-26 Harris J and P Bromiley Incentives to Cheat The Influence of Executive Compensation and
Firm Performance on Financial Misrepresentation Organization Science 18 no 3 (2007) 350-67
Ittner C D R A Lambert and D F Larcker The Structure and Performance Consequences
of Equity Grants to Employees of New Economy Firms Journal of Accounting amp Economics 34 no 1-3 (2003) 89-127
Jayaraman S and T Milbourn 2009 The Role of Stock Liquidity and Stock Return Volatility in
Executive Compensation Risk Versus Information Working paper Washington University in St Louis
Jin L 2002 CEO compensation diversification and incentives Journal of Financial Economics 66 pp 29ndash63 Johnson M F R Kasznik and K K Nelson The Impact of Securities Litigation Reform on
the Disclosure of Forward-Looking Information by High Technology Firms Journal of Accounting Research 39 no 2 (2001) 297-327
Johnson S A H E Ryan and Y S Tian Managerial Incentives and Corporate Fraud The
Sources of Incentives Matter Review of Finance 13 no 1 (2009) 115-45
23
Ke Bin 2001 Why Do CEOs of Publicly Traded Firms Prefer Reporting Small Increases in Earnings and Long Duration of Consecutive Earnings Increases Working paper Penn State University Lambert R A and D F Larcker An Analysis of the Use of Accounting and Market Measures
of Performance in Executive-Compensation Contracts Journal of Accounting Research 25 (1987) 85-129
Milbourn TT 2003 CEO reputation and stock-based compensation Journal of Financial Economics 68 pp 233ndash262 Murphy K J Stock-Based Pay in New Economy Firms Journal of Accounting amp Economics
34 no 1-3 (2003) 129-47 Ofek E and D Yermack 2000 Taking Stock Equity-Based Compensation and the Evolution
of Managerial Ownership Journal of Finance 55 no 3 1367-84 Peng L and A Roell Executive Pay and Shareholder Litigation Review of Finance 12 no 1
(2008) 141-84 mdashmdashmdash Manipulation and Equity-Based Compensation American Economic Review 98 no 2
(2008) 285-90 Petersen M A Estimating Standard Errors in Finance Panel Data Sets Comparing
Approaches Review of Financial Studies 22 no 1 (2009) 435-80 Prendergast C ldquoWhat Trade-off of Risk and Incentivesrdquo American Economic Review Papers and Proceedings 90 (May 2000) 421ndash25 Prendergast C ldquoThe tenuous trade-off between risk and incentivesrdquo Journal of Political Economy 110 (2002) 1071ndash102 Richardson Scott A Tuna A Irem and Wu 2002 Predicting Earnings Management The Case of Earnings Restatements Working paper Barclays Global Rogers J L and P C Stocken Credibility of Management Forecasts Accounting Review 80
no 4 (2005) 1233-60 Shu S Z Auditor Resignations Clientele Effects and Legal Liability Journal of Accounting amp Economics 29 no 2 (2000) 173-205 Skinner D J 1994 Why Firms Voluntarily Disclose Bad-News Journal of Accounting
Research 32 no 1 38-60 Smith C W and R L Watts 1992 The Investment Opportunity Set and Corporate Financing
Dividend and Compensation Policies Journal of Financial Economics 32 no 3 263-92
24
Table 1 Descriptive statistics The sample comprises of 20646 firm-year observations and covers the period from 1992 to 2006 TOTALCOMP indicates total annual compensation defined as the sum of salary bonus restricted stock grants option grants and all other annual compensation CASHBASED denotes cash-based compensation defined as the sum of salary and bonus EQUITYBASED is equity-based compensation defined as the sum of restricted stock grants and options grants EQUITYRATIO is the ratio of equity-based compensation to total compensation LIT denotes high litigation risk industries (SIC codes 2833-2836 3570-3577 3600-3674 5200-5961 7370-7374 and 8731-8734) MB represents the market-to-book ratio defined as the market value of total assets divided by the book value of total assets RampD indicates the ratio of research and development expenses to total sales ADVT is the amount of advertising expenses per dollar of sales Missing values of RampD and ADVT have been set to zero SALES denotes the log value of total sales LEV measures leverage which is defined as total debt divided by total assets RET is the stock return for the prior year RETVOL is the standard deviation of daily returns measured over the year ROA denotes profitability and is defined as earnings before extraordinary items scaled by total assets CASH is the amount of cash and cash equivalents per dollar of assets FCF denotes free cash flows measured as cash flow from operations less capital expenditures divided by total assets AGE captures firm age defined as the difference between current year and the first year that the firm existed on Compustat OSOPTIONS is the outstanding value of stock options scaled by market value as of the beginning of the year Panel A Overall sample
Variables Obs Mean Median Std dev Min Max
TOTALCOMP 20646 409958 207898 571125 18680 3533708
CASHBASED 20646 124957 89535 118192 3692 750000
EQUITYBASED 20646 212636 60255 420267 000 2687867
EQUITYRATIO 20646 036 036 030 000 100
LIT 20646 028 000 045 000 100
MB 20646 207 155 151 080 966
RampD 20646 004 000 012 000 091
ADVT 20646 001 000 002 000 014
SALES 20646 713 705 155 323 1089
LEV 20646 023 022 018 000 079
RET 20646 021 012 057 -076 295
RETVOL 20646 012 010 007 003 038
ROA 20646 004 005 010 -048 024
CASH 20646 013 006 017 000 075
FCF 20646 003 003 009 -032 027
AGE 20646 2445 2000 1589 300 5500
OSOPTIONS 20646 0005 0001 0012 000 0082
25
Panel B Lawsuit sample
Variables Obs Mean Median Std dev Min Max
TOTALCOMP 474 686658 379243 851381 18680 3533708
CASHBASED 474 149472 97346 154368 3692 750000
EQUITYBASED 474 410967 160206 650040 000 2687867
EQUITYRATIO 474 046 056 033 000 100
LIT 474 043 000 050 000 100
MB 474 296 204 237 080 966
RampD 474 009 000 018 000 091
ADVT 474 001 000 003 000 014
SALES 474 740 742 182 323 1089
LEV 474 021 019 019 000 079
RET 474 036 021 074 -076 295
RETVOL 474 014 012 008 003 038
ROA 474 003 005 013 -048 024
CASH 474 019 010 021 000 075
FCF 474 002 003 011 -032 027
AGE 474 2129 1400 1664 300 5500
OSOPTIONS 474 0006 0002 0011 000 0082
26
Panel C Differences between high litigation (LIT=1) and low litigation (LIT=0) industries
LIT=1 (N=5810)
LIT=0 (N=14836)
Variables Mean Median Mean Median
Compensation
TOTALCOMP 441984 210635 397416 206976
CASHBASED 107412 75195 131829 94624
EQUITYBASED 278359 82878 186898 54253
EQUITYRATIO 043 048 033 032
Firm characteristics
MB 277 207 180 142
RampD 011 005 002 000
ADVT 001 000 001 000
SALES 677 665 727 719
LEV 015 011 026 025
RET 027 012 019 012
RETVOL 015 013 010 009
ROA 003 006 004 004
CASH 024 018 009 004
FCF 003 004 003 003
AGE 1805 1300 2695 2600
OSOPTIONS 0007 0002 0005 0001
27
Table 2 Relation between litigation risk and equity-based compensation The sample comprises of 20646 firm-year observations and covers the period from 1992 to 2006 CASHBASED denotes cash-based compensation defined as the sum of salary and bonus EQUITYBASED is equity-based compensation defined as the sum of restricted stock grants and options grants EQUITYRATIO is the ratio of equity-based compensation to total compensation LIT denotes high litigation risk industries (SIC codes 2833-2836 3570-3577 3600-3674 5200-5961 7370-7374 and 8731-8734) MB represents the market-to-book ratio defined as the market value of total assets divided by the book value of total assets RampD indicates the ratio of research and development expenses to total sales ADVT is the amount of advertising expenses per dollar of sales Missing values of RampD and ADVT have been set to zero SALES denotes the log value of total sales LEV measures leverage which is defined as total debt divided by total assets RET is the stock return for the prior year RETVOL is the standard deviation of daily returns measured over the year ROA denotes profitability and is defined as earnings before extraordinary items scaled by total assets CASH is the amount of cash and cash equivalents per dollar of assets FCF denotes free cash flows measured as cash flow from operations less capital expenditures divided by total assets AGE captures firm age defined as the difference between current year and the first year that the firm existed on Compustat OSOPTIONS is the outstanding value of stock options scaled by market value as of the beginning of the year All regressions include year effects 1 digit SIC industry indicators and robust standard errors clustered at the firm level
Sign CASHBASED (1)
EQUITYBASED (2)
EQUITYRATIO (3)
Coeff t-stat Coeff t-stat Coeff t-stat
Intercept -287502 -1444 -970425 -1926 -008 -192
LIT + -4249 -128 60485 496 005 473
MB + -1255 -121 48750 899 002 497
RampD + 62552 495 230061 467 034 880
ADVT + 316682 520 581331 268 -013 -087
SALES 44267 2796 119226 2415 005 1787
LEV ndash 42434 365 63686 201 001 045
RET 9656 643 13026 191 000 -010
RETVOL -6886 -037 341846 496 028 535
ROA 46636 351 -22896 -046 014 378
CASH ndash 68320 434 152088 388 004 156
FCF ndash -15714 -126 -10156 -023 -007 -195
LN_AGE ndash 2050 104 -35090 -502 -004 -736
Adj R-sq 039 024 020
Obs 20646 20646 20646
28
Table 3 Effect of equity-based compensation on the probability of a lawsuit EQUITYRATIO is the ratio of equity-based compensation to total compensation EQUITYPREDICT is the predicted value of EQUITYRATIO from the first stage probit model LIT denotes high litigation risk industries MB represents the market-to-book ratio defined as the market value of total assets divided by the book value of total assets RampD indicates the ratio of research and development expenses to total sales ADVT is the amount of advertising expenses per dollar of sales Missing values of RampD and ADVT have been set to zero SALES denotes the log value of total sales LEV measures leverage which is defined as total debt divided by total assets RET is the stock return for the prior year RETVOL is the standard deviation of daily returns measured over the year ROA denotes profitability and is defined as earnings before extraordinary items scaled by total assets CASH is the amount of cash and cash equivalents per dollar of assets FCF denotes free cash flows measured as cash flow from operations less capital expenditures divided by total assets LN_AGE is the log of firm age OSOPTIONS is the outstanding value of stock options scaled by market value as of the beginning of the year The probit regressions contain 2 digit SIC industry indicators
Sign
Regular probit Simultaneous equation
Pr (LAW=1)
Dep variable = EQUITYRATIO
First stage
Second stage
Pr (LAW=1)
Coeff z-stat Coeff t-stat Coeff z-stat
Intercept -947 -1216 -009 -220 -920 -922
EQUITYRATIO 049 325
EQUITYPREDICT -036 -080
LIT 005 482 044 231
MB 012 298 002 522 012 307
RampD 010 019 033 856 023 040
ADVT 530 247 -014 -094 400 187
SALES 033 794 005 1823 037 774
LEV 025 074 002 080 026 078
RET 002 026 000 -086 003 034
RETVOL 240 278 028 541 273 287
ROA -032 -043 012 320 -026 -034
CASH 102 249 004 148 087 211
FCF -183 -267 -007 -182 -186 -271
LN_AGE -015 -203 -004 -700 -017 -218
OSOPTIONS 137 594
Adj R-sq 021 021 020
Obs 924 20362 924
29
Table 4 Option exercises Panel A Univariate evidence Entire sample Lawsuit sample
LIT=1 (1)
LIT=0 (2)
t-test (1) ndash (2)
LAW=1 (3)
LAW=0 (4)
t-test (3) ndash (4)
OPTEXER 00012 (N=5810)
00007 (N=14836)
1101 00013 (N=485)
00008 (N=14780)
337
OPTEXERRATIO 08510 (N=4188)
07174 (N=10728)
369 08957 (N=355)
07496 (N=10552)
124
Panel B Multivariate evidence
Sign OPTEXER OPTEXERRATIO
Coeff t-stat Coeff t-stat
Intercept 00015 527 1997 282
LAW + 00003 197 0059 050
MB + 00000 077 0123 528
SALES -00001 -668 -0013 -074
LEV ndash 00001 037 -0303 -216
RET 00005 946 0321 748
RETVOL 00018 294 -1407 -344
ROA 00017 434 1070 474
LN_AGE ndash -00001 -310 -0036 -108
Adj R-sq 007 006
Obs 15265 10907
30
Table 5 Alternate control samples EQUITYRATIO is the ratio of equity-based compensation to total compensation LIT denotes high litigation risk industries MB represents the market-to-book ratio RampD indicates the ratio of research and development expenses to total sales ADVT is the amount of advertising expenses per dollar of sales SALES denotes the log value of total sales LEV measures leverage RET is the stock return for the prior year RETVOL is the standard deviation of daily returns measured over the year ROA denotes profitability CASH is the amount of cash and cash equivalents per dollar of assets FCF denotes free cash flows AGE captures firm age defined as the difference between current year and the first year that the firm existed on Compustat 2 firms 3 firms All ExecuComp Regular probit 2SLS-2nd stage Regular probit 2SLS-2nd stage Regular probit 2SLS-2nd stage Coeff z-stat Coeff z-stat Coeff z-stat Coeff z-stat Coeff z-stat Coeff z-stat Intercept -851 -951 -841 -928 -804 -898 -796 -872 -884 -1685 -895 -1260
EQUITYRATIO 032 248 028 234 024 305
EQUITYPREDICT -032 -083 -035 -099 031 108
LIT 052 306 054 349 036 354
MB 017 523 018 517 010 369 011 385 011 676 011 621
RampD 074 170 068 144 110 248 108 232 054 222 030 111
ADVT 269 156 233 137 224 152 195 132 128 140 107 116
SALES 032 900 034 867 033 981 035 956 028 1280 027 1076
LEV 031 110 033 119 021 080 028 111 023 143 027 161
RET 008 105 008 099 -001 -020 -002 -031 -001 -034 -001 -035
RETVOL 272 380 304 387 194 315 225 336 266 689 250 596
ROA -011 -020 -002 -004 -006 -010 014 025 -019 -058 -022 -070
CASH 011 035 -002 -007 035 119 017 058 034 188 024 129
FCF -148 -259 -145 -252 -158 -301 -170 -324 -108 -330 -109 -336
LN_AGE -024 -386 -025 -401 -026 -448 -027 -467 -012 -333 -010 -283 Adj R-sq 021 021 019 020 015 015 Obs 1374 1374 1826 1826 14535 14535
9
manager to exert effort by tying his wealth to the stock price Recent theoretical studies (eg
Goldman and Slezak (2006) Peng and Roell (2008) Crocker and Slemrod (2007) and Laux and
Laux (2009)) allow the manager to exert two types of effort ndash one that increases the stock price
by increasing future cash flows and the other that increases the stock price by manipulating
information Shareholders in these models trade off the benefits of equity-based incentives
(greater effort) with the costs (more manipulation)9
H1 Firms with high litigation risk grant more equity-based compensation to their CEOs
Goldman and Slezak (2006) examine how
equity-based compensation varies with the probability that misrepresentation is detected and find
that firms where misrepresentation is more likely to be detected offer more equity-based
compensation to their CEOs This is because a high (ex-ante) probability of detection dissuades
manipulation thus reducing the costs of equity-based incentives As firms with high litigation
risk are those where the probability of detection is higher their model predicts that firms with
high litigation risk will provide more equity-based compensation to their managers Thus our
first hypothesis is as follows
We will lay out our additional hypotheses later in the paper
3 Research design
In this section we first describe the empirical proxies and follow with a description of
our two samples We then motivate our control variables and present our regression
specifications
9 Peng and Roell (2008) present a model where the manager can manipulate the stock price but there is uncertainty about the degree of manipulation Their model predicts that the elasticity of pay to the stock price is higher in the presence of uncertainty Crocker and Slemrod (2007) presents a model that combines hidden action (agentrsquos effort cannot be observed) and hidden information (agent reports earnings after observing true earnings which shareholders cannot observe) They find that the equilibrium compensation contract cannot both maximize effort and minimize misrepresentation In Laux and Laux (2009) the greater incentive for earnings management brought about by equity-based incentives is mitigated by higher monitoring by the board However these models do not examine how the compensation contract varies with the probability of detection
10
31 Litigation risk (LIT)
We use membership in certain industries as our measure of high (ex-ante) litigation risk
Prior studies have identified firms that operate in the bio-technology (SIC code 2833-2836 and
8731-8734) computing (SIC codes 3570-3577 and 7370-7374) electronics (SIC codes 3600-
3674) and retailing (SIC codes 5200-5961) industries to be more prone to higher litigation risk
than other firms (eg Francis et al (1994) Shu (2000) Johnson et al (2001) Field et al (2005)
Rogers and Stocken (2005)) We define litigation risk (LIT) as an indicator variable taking the
value of one if a firm belongs to these industries The classification of these industries is based
on data that pre-date our sample
32 CEO compensation
We define total annual compensation (TOTALCOMP) as the sum of salary bonus
restricted stock grants option grants and all other annual compensation We examine two
components of total compensation ndash the cash-based component (CASHBASED) defined as the
sum of salary and bonus and equity-based compensation (EQUITYBASED) defined as the sum
of Black-Scholes value options grants and restricted stock grants We also examine the ratio of
equity-based compensation to total compensation (EQUITYRATIO)
33 Sample
331 Main sample
Our empirical tests are based on two samples The first sample is used to examine the
effect of litigation risk on equity-based compensation As litigation risk is based on industry
classification the sample is based on all firms with compensation data on ExecuComp
accounting data on Compustat and stock price data on CRSP The final sample comprises of
20646 firm-year observations for 2646 unique firms between the years 1992 and 2006
11
Descriptive statistics are presented in Panel A of Table 1 The annual total compensation
for the CEO for the sample is around $41 million of which $12 million is from salary and
bonus and $21 million is from stock option grants and restricted stock grants These statistics
compare closely with those found in other studies (eg Jayaraman and Milbourn (2009) Garvey
and Milbourn (2003)) Equity-based compensation is 36 of the CEOrsquos annual compensation
The mean value of LIT is 028 which implies that 28 of the sample consists of firms with high
litigation risk The median firm in the sample has existed on Compustat for 20 years and has
annual sales of around $11 billion
332 Lawsuit sample
The second sample is used to explore the effect of equity-based compensation on the
probability of a lawsuit Our sample of class-action lawsuits is from the Stanford Securities Class
Action Clearinghouse and covers lawsuits filed during the period 1996 to 200710 These data
have been used by other studies such as Field et al (2005) Rogers and Stocken (2005) Denis et
al (2006) and Peng and Roell (2008) To ensure better matching with the ExecuComp sample
we hand-collect the firm-identifier (GVKEY) for the lawsuit sample11 The final sample
comprises 474 lawsuits between the years 1996 and 2007 To avoid any look-ahead bias the
independent variables in the prediction models are based on year t-1 relative to the year of the
lawsuit which is denoted as year t To form the control sample we follow Field et al and
randomly select one observation from the same year as the lawsuit firm from our first overall
sample12
10
Our final sample comprises of 948 firm-year observations
httpsecuritiesstanfordedu 11 Our results are robust to using the ticker symbol to match 12 We do not match by industry as our litigation risk indicator is an industry level variable Further in our robustness tests in Section 6 we follow the alternate matching techniques in Erickson et al (2006) and find similar results
12
Descriptive statistics for the lawsuit firms are presented in Panel B of Table 1 The total
compensation for sued firms is $687 million of which 46 is equity-based These numbers are
much higher than the overall sample of Panel A However it is important not to draw any causal
inferences about the role of equity-based compensation from these data as the need to control for
the effect of litigation risk on equity-based compensation is our fundamental starting point The
sued firms appear to have higher growth opportunities (MB is 296 versus 207 RampD is 009
versus 004) are larger better performing and more volatile (RETVOL is 014 compared to 012)
than the overall sample However care has to be exercised while interpreting these differences as
they have not been tested for statistical difference
The preliminary evidence suggests that sued firms differ from the overall sample in
various characteristics most relevant of which is the extent of equity-based compensation In the
next section we examine whether causal inferences can be drawn regarding the effect of equity-
based compensation on the probability of being sued
4 Empirical Results
41 Univariate evidence
Panel C of Table 1 splits the overall sample based on high litigation risk industries
(LIT=1) and others (LIT=0) and compares components of annual compensation between these
two groups Figures in bold indicate that the means (or medians) are significantly different
between the two groups The descriptive statistics provide some evidence that total compensation
is higher for managers of firms that operate in high litigation risk industries (mean compensation
is $442 million) compared with those in other industries (mean=$397 million) However the
median total pay is not any different between the two groups
13
In terms of the individual components of pay there is strong evidence that firms in high
litigation industries offer more equity-based compensation to their CEO (mean of $278 million
and median of $083 million) compared to those in non-high litigation risk industries (mean =
$187 million and median = $054 million) These differences are significant for both means and
medians Finally the ratio of equity-based compensation to total compensation is also
significantly higher for the high litigation risk group There is evidence that firms in high
litigation risk industries differ from those in non-high litigation risk industries along several
dimensions which have been previously shown to influence compensation characteristics For
example firms in high litigation risk industries have higher growth opportunities (mean MB of
277 compared to 180) invest more in RampD have more volatile environments (median
RETVOL is 013 compared to 009) have more cash on hand and are younger
As correlations do not control for differences in these innate characteristics between firms
and over time they should be interpreted cautiously Nevertheless an association between LIT
and EQUITYRATIO in univariate correlations suggests a first-order effect of high litigation risk
on CEO equity-based compensation
42 Multivariate regressions
In this section we discuss variables related to equity-based compensation used in prior
studies and incorporate them in a multivariate regression to ascertain whether the explanatory
power of LIT with respect to EQUITYRATIO is incremental to that of these characteristics
421 Firm level determinants
As prior studies find that the investment opportunity set affects stock-based
compensation (eg Clinch (1991) Smith and Watts (1992) Gaver and Gaver (1993) and Baber
et al (1996)) we follow Ittner et al (2003) and include four variables to capture the investment
14
opportunity set ndash the market-to-book ratio (MB) the ratio of research and development expenses
to sales (RampD) the ratio of advertising expenses to sales (ADVT) and the log of firm age defined
as the number of years the firm exists on Compustat (LN_AGE) Consistent with prior studies
we expect a positive coefficient on MB RampD and ADVT and a negative coefficient on LN_AGE
As is standard we control for firm size using the log of total sales (SALES) As prior studies
present conflicting arguments for the relation between firm size and equity-based compensation
we merely include it as a control without making a directional prediction Following Ittner et al
we use leverage (LEV) to capture monitoring by debt holders and expect a negative relation with
EQUITYRATIO
We use both accounting (ROA) and stock price (RET) based measures to capture prior
performance RET represents the prior yearrsquos annual stock return We also include stock return
volatility (RETVOL) to capture features of the operating environment Studies such as
Prendergast (2000 2002) argue that firms rely more on stock-based incentives in riskier
environments where it is more difficult to monitor the managerrsquos actions On the other hand
studies such as Demsetz and Lehn (1985) Lambert and Larcker (1987) Aggarwal and Samwick
(1999) and Garvey and Milbourn (2003) argue that greater stock return volatility captures more
noise in the output measure and firms should therefore reduce stock-based incentives (see also
Jayaraman and Milbourn (2009)) We therefore do not make a directional prediction for
RETVOL As studies argue that cash-constrained firms rely more on stock-based compensation
(eg Yermack (1995) Core and Guay (1999 2001)) we include the ratio of cash on hand to
total assets (CASH) and free cash flows (FCF) defined as cash flow from operations less capital
expenditures scaled by total assets to capture the incentive to conserve cash
15
Following Petersen (2009) we estimate the regressions with year indicators and standard
errors clustered at the firm level The year indicators control for common shocks which could
cause cross-sectional correlation in the errors The firm-level clustering of standard errors
corrects for the possibility of serial correlation attributable to unobserved firm effects
422 Effect of litigation risk on equity-based compensation
The empirical specifications we employ are
0 0 0 0 0 0
0 0 0 0 0
9
0 0 1
amp
_
i t i t i t i t i t i t
i t i t i t i t i t
i t i t J i tJ
CASHBASED LIT MB R D ADVT SALESLEV RET RETVOL ROA CASH
FCF LN AGE YEAR IND
α α α α α α
α α α α α
α α ε=
= + + + + +
+ + + + +
+ + + + +sum sum
(1)
0 0 0 0 0 0
0 0 0 0 0
9
0 0 1
amp
_
i t i t i t i t i t i t
i t i t i t i t i t
i t i t J i tJ
EQUITYBASED LIT MB R D ADVT SALESLEV RET RETVOL ROA CASH
FCF LN AGE YEAR IND
α α α α α α
α α α α α
α α ε=
= + + + + +
+ + + + +
+ + + + +sum sum
(2)
0 0 0 0 0 0
0 0 0 0 0
9
0 0 1
amp
_
i t i t i t i t i t i t
i t i t i t i t i t
i t i t J i tJ
EQUITYRATIO LIT MB R D ADVT SALESLEV RET RETVOL ROA CASH
FCF LN AGE YEAR IND
α α α α α α
α α α α α
α α ε=
= + + + + +
+ + + + +
+ + + + +sum sum
(3)
where CASHBASED EQUITYBASED and EQUITYRATIO are cash-based compensation
equity-based compensation and the ratio of equity-based compensation to total compensation
respectively
Table 2 presents results of the above multivariate regressions The coefficient of LIT is
negative and insignificant (t-statistic is -128) in Model 1 suggesting that litigation risk does not
affect cash-based compensation of CEOs The coefficients of LIT are positive and significant (t-
stats are 496 and 473 respectively) in Models 2 and 3 suggesting that the level of equity-based
compensation as well as the proportion of equity-based compensation to total compensation are
16
higher for firms with higher litigation risk The coefficients (60485 and 005) suggest that
litigation risk increases total equity-based compensation by 32 and the proportion of equity-
based compensation to total compensation by 15 respectively relative to the overall mean
423 Effect of equity-based compensation on litigation risk
In this section we first examine the relation between the probability of a lawsuit and
equity-based compensation in a simple probit model We then model the simultaneous relation
between lawsuit probability and equity-based compensation as follows
1 1 1 1 Equity based compensation Litigation risk Xγ β ε= + + (4)
2 2 2 2 = Litigation risk Equity based compensation Xγ β ε+ + (5)
As Field et al (2005) point out it is incorrect to substitute ex-post occurrence of litigation
to capture litigation risk in eq (4) This is because the occurrence of litigation is not exogenous
and depends on the compensation contract For example firms that choose to offer less equity-
based compensation to their CEOs have a low error term ( 1ε ) Similarly these firms also have a
higher probability of litigation as their CEOs are less aligned with shareholders which means 2ε
will be high This potential correlation between 1ε and 2ε causes ordinary probit to be biased
We therefore treat (4) and (5) as simultaneous equations To ensure that equations (4) and (5) are
appropriately identified we need a variable in 1X that is not in 2X and vice-versa
Following Field et al (2005) we use the industry litigation risk indicator (LIT) as the
instrument in equation (4) As annual options are granted based on the previously outstanding
level of stock options to ensure an optimal level of alignment we use the sum of outstanding
options as of the previous year end (OSOPTIONS) as the instrument to identify equation (5)13
13 This is analogous to Field et al (2005) who use past disclosure as the instrument for current period disclosure
We estimate the simultaneous regression framework in two stages In the first stage we regress
17
the proportion of equity-based compensation (EQUITYRATIO) on the two instruments (LIT and
OSOPTIONS) and all the other independent variables We then use the predicted value from this
first stage (EQUITYPREDICT) regression in the second-stage probit model where the dependent
variable is whether or not the firm was sued (LAW=1)
Table 3 presents results of the above regressions with the first set of columns presenting
the probit results Consistent with prior studies the coefficient of EQUITYRATIO is positive
(049) and significant (t-statistic = 325) This suggests that firms that have been sued are
associated with more equity-based compensation that those that are not However as the next set
of results show it is problematic to draw any causal inference from these associations The next
set of columns present the first stage of the two-stage framework The specification is similar to
that used in table 2 except that the instrument for equation (5) viz OSOPTIONS has been
included The last set of columns presents the results of the second-stage where the independent
variable of interest is the predicted value of equity-based compensation from the first stage
(EQUITYPREDICT) The coefficient of endogenously determined equity-based compensation is
not significantly related to the probability of a lawsuit (t-stat = -080) which is inconsistent with
the myopia story This is one of the two main results of the study
5 Managerial stock option exercises during misrepresentation period
Prior studies find that managers of firms that are accused of misrepresentation exercise
more options during the misrepresentation period than other firms (eg Bergstresser and
Philippon (2006) and Beneish (1999)) Studies such as Ofek and Yermack (2000) show that
executives sell almost all shares that they regularly exercise which is consistent with managers
diversifying away their firm-specific risk Given that sued firms (alternatively firms with higher
18
litigation risk) are granted more options annually we explore whether the higher options
exercises by sued firms is consistent with the higher demand for diversification
We first confirm that sued firms exercise more options (as a percent of market value)
than their non-sued counterparts in the year before the lawsuit We define OPTEXER as the value
of stock options exercised by the CEO scaled by market value of equity and examine differences
in OPTEXER between ndash (i) high litigation risk and low litigation risk firms and (ii) sued and not
sued firms We define OPTEXERRATIO as the ratio of the value of options exercised during the
year scaled by the value of total options granted during the year
Panel A of Table 4 presents the univariate comparisons The firms with high litigation
risk exercise options worth 012 of firm value versus 007 by firms with low litigation risk
These differences are statistically significant at the 1 level Similarly managers of sued firms
exercise more options (013 of firm value) in the year before lawsuit relative to all other firms
(008) which are also significantly different from one another at less than the 1 level This
evidence is consistent with Bergstresser and Philippon (2006) and Beneish (1999)) However
when we compare differences in OPTEXERRATIO the differences are no longer significant
between the sued firms and not sued firms Thus the value of options exercised during the year
as a percentage of total options granted is not higher for sued firms relative to not-sued firms
These inferences are confirmed by the multivariate evidence where the coefficient of LAW
(which denotes sued versus not-sued firms) is significant when OPTEXER is the dependent
variable but is insignificant when the dependent variable is OPTEXERRATIO Overall these
results suggest that options exercises by managers of sued firms are not unusually high during
the period of misrepresentation This is the second main result of the paper
19
6 Robustness tests
In this section we perform two robustness tests to verify the sensitivity of our inferences
Specifically we ensure that our results are not driven by new economy firms or alternative
sample matching techniques
61 New economy firms
Using survey data Ittner Lambert and Larcker (2003) highlight that new-economy firms
rely more on stock-based compensation than old economy firms Murphy (2003) extends and
confirms the Ittner et al result to all ExecuComp firms Murphyrsquos (2003) classification of new-
economy firms overlaps with that of the high litigation risk industries We examine whether our
results merely re-state the new economy firms result in these papers To do so we first include
an indicator to capture new economy firms as used in Murphy (2003) as an additional
independent variable We find that the coefficient of LIT remains positive and significant
Second in the probit regression with LAW as the dependent variable we include the new
economy indicator to examine whether new economy firms are more likely to be sued We find
no evidence to this effect We therefore conclude that the relation between litigation risk and
equity-based compensation is not due to the new economy firms finding of Ittner et al (2003)
62 Alternate control samples
We also examine whether our results are robust to alternate control samples Following
Erickson et al (2006) we use two alternate control samples First we randomly select two firms
from the main sample for each sued firm and second we use all firms that were never sued
Additionally as the proportion of high litigation firms to all firms is 28 we randomly select
three firms for each sued firm in order to simulate this mix The results for these alternate
controls are presented in Table 5 The coefficient of EQUITYRATIO is positive and significant in
20
all samples in the simple probit model while the coefficient of EQUITYPREDICT is generally
negative and significant in the two-stage least squares models Thus our inferences appear to be
robust to alternate control samples used in prior studies
7 Conclusion
We re-examine the relation between equity-based compensation and litigation risk in a
simultaneous equations framework Consistent with theoretical models that predict that firms
will grant more equity-based incentives when the probability of detection of misrepresentation is
high we find that firms with high (ex-ante) litigation risk grant more equity-based incentives to
their managers More importantly once one controls for the effect of litigation risk on equity-
based compensation the evidence does not support the inference from prior studies that higher
equity-based compensation causes a higher probability of a class-action lawsuit
Further while managers of sued firms exercise more options during the period of
misrepresentation these options as a ratio of annual options grants are more significantly
different from those of not-sued firms This evidence suggests that the greater option exercises
by sued firms are due to their greater diversification demand and not due to managers acting
strategically during these periods Overall while stock options may be guilty of causing some
managerial misbehavior our results cast doubt over the ldquounintended consequencesrdquo in the
shareholder litigation realm of managerial equity-based incentives
21
References
Aggarwal R Samwick A 1999 The other side of the trade-off The impact of risk on executive compensation Journal of Political Economy Vol 107 pp 65ndash105 Armstrong C S AD Jagolinzer and DF Larcker 2009 Chief Executive Officer Equity Incentives and Accounting Irregularities Working paper University of Pennsylvania Baber W R S N Janakiraman and S H Kang Investment Opportunities and the Structure of
Executive Compensation Journal of Accounting amp Economics 21 no 3 (1996) 297-318
Ball R Market and PoliticalRegulatory Perspectives on the Recent Accounting Scandals
Journal of Accounting Research 47 no 2 (2009) 277-323 Beneish M D Incentives and Penalties Related to Earnings Overstatements That Violate
Gaap Accounting Review 74 no 4 (1999) 425-57 Bergstresser D and T Philippon Ceo Incentives and Earnings Management Journal of
Financial Economics 80 no 3 (2006) 511-29 Burns N and S Kedia The Impact of Performance-Based Compensation on Misreporting
Journal of Financial Economics 79 no 1 (2006) 35-67 Bushman R M and A J Smith Financial Accounting Information and Corporate
Governance Journal of Accounting amp Economics 32 no 1-3 (2001) 237-333 Core John and W Guay 2002 The other side of the trade-off The impact of risk on executive compensation a Revised Comment Working paper University of Pennsylvania Cheng Q and D B Farber Earnings Restatements Changes in Ceo Compensation and Firm
Performance Accounting Review 83 no 5 (2008) 1217-50 Cheng Q and T A Warfield Equity Incentives and Earnings Management Accounting
Review 80 no 2 (2005) 441-76 Crocker K J and J Slemrod The Economics of Earnings Manipulation and Managerial
Compensation Rand Journal of Economics 38 no 3 (2007) 698-713 Demsetz Harold and Kenneth Lehn 1985The structure of corporate ownership Causes and consequences Journal of Political Economy 93 1155-1177 Denis D J P Hanouna and A Sarin Is There a Dark Side to Incentive Compensation
Journal of Corporate Finance 12 no 3 (2006) 467-88
22
Efendi J A Srivastava and E P Swanson Why Do Corporate Managers Misstate Financial Statements The Role of Option Compensation and Other Factors Journal of Financial Economics 85 no 3 (2007) 667-708
Erickson M M Hanlon and E L Maydew Is There a Link between Executive Equity
Incentives and Accounting Fraud Journal of Accounting Research 44 no 1 (2006) 113-43
Field L M Lowry and S Shu Does Disclosure Deter or Trigger Litigation Journal of
Accounting amp Economics 39 no 3 (2005) 487-507 Fischer P E and R E Verrecchia Reporting Bias Accounting Review 75 no 2 (2000) 229-
45 Garvey G and T Milbourn 2003 Incentive compensation when executives can hedge the market evidence of relative performance evaluation in the cross-section Journal of Finance 58 pp 1557ndash1582 Gaver J J and K M Gaver Additional Evidence on the Association between the Investment
Opportunity Set and Corporate Financing Dividend and Compensation Policies Journal of Accounting amp Economics 16 no 1-3 (1993) 125-60
Goldman E and S L Slezak An Equilibrium Model of Incentive Contracts in the Presence of
Information Manipulation Journal of Financial Economics 80 no 3 (2006) 603-26 Harris J and P Bromiley Incentives to Cheat The Influence of Executive Compensation and
Firm Performance on Financial Misrepresentation Organization Science 18 no 3 (2007) 350-67
Ittner C D R A Lambert and D F Larcker The Structure and Performance Consequences
of Equity Grants to Employees of New Economy Firms Journal of Accounting amp Economics 34 no 1-3 (2003) 89-127
Jayaraman S and T Milbourn 2009 The Role of Stock Liquidity and Stock Return Volatility in
Executive Compensation Risk Versus Information Working paper Washington University in St Louis
Jin L 2002 CEO compensation diversification and incentives Journal of Financial Economics 66 pp 29ndash63 Johnson M F R Kasznik and K K Nelson The Impact of Securities Litigation Reform on
the Disclosure of Forward-Looking Information by High Technology Firms Journal of Accounting Research 39 no 2 (2001) 297-327
Johnson S A H E Ryan and Y S Tian Managerial Incentives and Corporate Fraud The
Sources of Incentives Matter Review of Finance 13 no 1 (2009) 115-45
23
Ke Bin 2001 Why Do CEOs of Publicly Traded Firms Prefer Reporting Small Increases in Earnings and Long Duration of Consecutive Earnings Increases Working paper Penn State University Lambert R A and D F Larcker An Analysis of the Use of Accounting and Market Measures
of Performance in Executive-Compensation Contracts Journal of Accounting Research 25 (1987) 85-129
Milbourn TT 2003 CEO reputation and stock-based compensation Journal of Financial Economics 68 pp 233ndash262 Murphy K J Stock-Based Pay in New Economy Firms Journal of Accounting amp Economics
34 no 1-3 (2003) 129-47 Ofek E and D Yermack 2000 Taking Stock Equity-Based Compensation and the Evolution
of Managerial Ownership Journal of Finance 55 no 3 1367-84 Peng L and A Roell Executive Pay and Shareholder Litigation Review of Finance 12 no 1
(2008) 141-84 mdashmdashmdash Manipulation and Equity-Based Compensation American Economic Review 98 no 2
(2008) 285-90 Petersen M A Estimating Standard Errors in Finance Panel Data Sets Comparing
Approaches Review of Financial Studies 22 no 1 (2009) 435-80 Prendergast C ldquoWhat Trade-off of Risk and Incentivesrdquo American Economic Review Papers and Proceedings 90 (May 2000) 421ndash25 Prendergast C ldquoThe tenuous trade-off between risk and incentivesrdquo Journal of Political Economy 110 (2002) 1071ndash102 Richardson Scott A Tuna A Irem and Wu 2002 Predicting Earnings Management The Case of Earnings Restatements Working paper Barclays Global Rogers J L and P C Stocken Credibility of Management Forecasts Accounting Review 80
no 4 (2005) 1233-60 Shu S Z Auditor Resignations Clientele Effects and Legal Liability Journal of Accounting amp Economics 29 no 2 (2000) 173-205 Skinner D J 1994 Why Firms Voluntarily Disclose Bad-News Journal of Accounting
Research 32 no 1 38-60 Smith C W and R L Watts 1992 The Investment Opportunity Set and Corporate Financing
Dividend and Compensation Policies Journal of Financial Economics 32 no 3 263-92
24
Table 1 Descriptive statistics The sample comprises of 20646 firm-year observations and covers the period from 1992 to 2006 TOTALCOMP indicates total annual compensation defined as the sum of salary bonus restricted stock grants option grants and all other annual compensation CASHBASED denotes cash-based compensation defined as the sum of salary and bonus EQUITYBASED is equity-based compensation defined as the sum of restricted stock grants and options grants EQUITYRATIO is the ratio of equity-based compensation to total compensation LIT denotes high litigation risk industries (SIC codes 2833-2836 3570-3577 3600-3674 5200-5961 7370-7374 and 8731-8734) MB represents the market-to-book ratio defined as the market value of total assets divided by the book value of total assets RampD indicates the ratio of research and development expenses to total sales ADVT is the amount of advertising expenses per dollar of sales Missing values of RampD and ADVT have been set to zero SALES denotes the log value of total sales LEV measures leverage which is defined as total debt divided by total assets RET is the stock return for the prior year RETVOL is the standard deviation of daily returns measured over the year ROA denotes profitability and is defined as earnings before extraordinary items scaled by total assets CASH is the amount of cash and cash equivalents per dollar of assets FCF denotes free cash flows measured as cash flow from operations less capital expenditures divided by total assets AGE captures firm age defined as the difference between current year and the first year that the firm existed on Compustat OSOPTIONS is the outstanding value of stock options scaled by market value as of the beginning of the year Panel A Overall sample
Variables Obs Mean Median Std dev Min Max
TOTALCOMP 20646 409958 207898 571125 18680 3533708
CASHBASED 20646 124957 89535 118192 3692 750000
EQUITYBASED 20646 212636 60255 420267 000 2687867
EQUITYRATIO 20646 036 036 030 000 100
LIT 20646 028 000 045 000 100
MB 20646 207 155 151 080 966
RampD 20646 004 000 012 000 091
ADVT 20646 001 000 002 000 014
SALES 20646 713 705 155 323 1089
LEV 20646 023 022 018 000 079
RET 20646 021 012 057 -076 295
RETVOL 20646 012 010 007 003 038
ROA 20646 004 005 010 -048 024
CASH 20646 013 006 017 000 075
FCF 20646 003 003 009 -032 027
AGE 20646 2445 2000 1589 300 5500
OSOPTIONS 20646 0005 0001 0012 000 0082
25
Panel B Lawsuit sample
Variables Obs Mean Median Std dev Min Max
TOTALCOMP 474 686658 379243 851381 18680 3533708
CASHBASED 474 149472 97346 154368 3692 750000
EQUITYBASED 474 410967 160206 650040 000 2687867
EQUITYRATIO 474 046 056 033 000 100
LIT 474 043 000 050 000 100
MB 474 296 204 237 080 966
RampD 474 009 000 018 000 091
ADVT 474 001 000 003 000 014
SALES 474 740 742 182 323 1089
LEV 474 021 019 019 000 079
RET 474 036 021 074 -076 295
RETVOL 474 014 012 008 003 038
ROA 474 003 005 013 -048 024
CASH 474 019 010 021 000 075
FCF 474 002 003 011 -032 027
AGE 474 2129 1400 1664 300 5500
OSOPTIONS 474 0006 0002 0011 000 0082
26
Panel C Differences between high litigation (LIT=1) and low litigation (LIT=0) industries
LIT=1 (N=5810)
LIT=0 (N=14836)
Variables Mean Median Mean Median
Compensation
TOTALCOMP 441984 210635 397416 206976
CASHBASED 107412 75195 131829 94624
EQUITYBASED 278359 82878 186898 54253
EQUITYRATIO 043 048 033 032
Firm characteristics
MB 277 207 180 142
RampD 011 005 002 000
ADVT 001 000 001 000
SALES 677 665 727 719
LEV 015 011 026 025
RET 027 012 019 012
RETVOL 015 013 010 009
ROA 003 006 004 004
CASH 024 018 009 004
FCF 003 004 003 003
AGE 1805 1300 2695 2600
OSOPTIONS 0007 0002 0005 0001
27
Table 2 Relation between litigation risk and equity-based compensation The sample comprises of 20646 firm-year observations and covers the period from 1992 to 2006 CASHBASED denotes cash-based compensation defined as the sum of salary and bonus EQUITYBASED is equity-based compensation defined as the sum of restricted stock grants and options grants EQUITYRATIO is the ratio of equity-based compensation to total compensation LIT denotes high litigation risk industries (SIC codes 2833-2836 3570-3577 3600-3674 5200-5961 7370-7374 and 8731-8734) MB represents the market-to-book ratio defined as the market value of total assets divided by the book value of total assets RampD indicates the ratio of research and development expenses to total sales ADVT is the amount of advertising expenses per dollar of sales Missing values of RampD and ADVT have been set to zero SALES denotes the log value of total sales LEV measures leverage which is defined as total debt divided by total assets RET is the stock return for the prior year RETVOL is the standard deviation of daily returns measured over the year ROA denotes profitability and is defined as earnings before extraordinary items scaled by total assets CASH is the amount of cash and cash equivalents per dollar of assets FCF denotes free cash flows measured as cash flow from operations less capital expenditures divided by total assets AGE captures firm age defined as the difference between current year and the first year that the firm existed on Compustat OSOPTIONS is the outstanding value of stock options scaled by market value as of the beginning of the year All regressions include year effects 1 digit SIC industry indicators and robust standard errors clustered at the firm level
Sign CASHBASED (1)
EQUITYBASED (2)
EQUITYRATIO (3)
Coeff t-stat Coeff t-stat Coeff t-stat
Intercept -287502 -1444 -970425 -1926 -008 -192
LIT + -4249 -128 60485 496 005 473
MB + -1255 -121 48750 899 002 497
RampD + 62552 495 230061 467 034 880
ADVT + 316682 520 581331 268 -013 -087
SALES 44267 2796 119226 2415 005 1787
LEV ndash 42434 365 63686 201 001 045
RET 9656 643 13026 191 000 -010
RETVOL -6886 -037 341846 496 028 535
ROA 46636 351 -22896 -046 014 378
CASH ndash 68320 434 152088 388 004 156
FCF ndash -15714 -126 -10156 -023 -007 -195
LN_AGE ndash 2050 104 -35090 -502 -004 -736
Adj R-sq 039 024 020
Obs 20646 20646 20646
28
Table 3 Effect of equity-based compensation on the probability of a lawsuit EQUITYRATIO is the ratio of equity-based compensation to total compensation EQUITYPREDICT is the predicted value of EQUITYRATIO from the first stage probit model LIT denotes high litigation risk industries MB represents the market-to-book ratio defined as the market value of total assets divided by the book value of total assets RampD indicates the ratio of research and development expenses to total sales ADVT is the amount of advertising expenses per dollar of sales Missing values of RampD and ADVT have been set to zero SALES denotes the log value of total sales LEV measures leverage which is defined as total debt divided by total assets RET is the stock return for the prior year RETVOL is the standard deviation of daily returns measured over the year ROA denotes profitability and is defined as earnings before extraordinary items scaled by total assets CASH is the amount of cash and cash equivalents per dollar of assets FCF denotes free cash flows measured as cash flow from operations less capital expenditures divided by total assets LN_AGE is the log of firm age OSOPTIONS is the outstanding value of stock options scaled by market value as of the beginning of the year The probit regressions contain 2 digit SIC industry indicators
Sign
Regular probit Simultaneous equation
Pr (LAW=1)
Dep variable = EQUITYRATIO
First stage
Second stage
Pr (LAW=1)
Coeff z-stat Coeff t-stat Coeff z-stat
Intercept -947 -1216 -009 -220 -920 -922
EQUITYRATIO 049 325
EQUITYPREDICT -036 -080
LIT 005 482 044 231
MB 012 298 002 522 012 307
RampD 010 019 033 856 023 040
ADVT 530 247 -014 -094 400 187
SALES 033 794 005 1823 037 774
LEV 025 074 002 080 026 078
RET 002 026 000 -086 003 034
RETVOL 240 278 028 541 273 287
ROA -032 -043 012 320 -026 -034
CASH 102 249 004 148 087 211
FCF -183 -267 -007 -182 -186 -271
LN_AGE -015 -203 -004 -700 -017 -218
OSOPTIONS 137 594
Adj R-sq 021 021 020
Obs 924 20362 924
29
Table 4 Option exercises Panel A Univariate evidence Entire sample Lawsuit sample
LIT=1 (1)
LIT=0 (2)
t-test (1) ndash (2)
LAW=1 (3)
LAW=0 (4)
t-test (3) ndash (4)
OPTEXER 00012 (N=5810)
00007 (N=14836)
1101 00013 (N=485)
00008 (N=14780)
337
OPTEXERRATIO 08510 (N=4188)
07174 (N=10728)
369 08957 (N=355)
07496 (N=10552)
124
Panel B Multivariate evidence
Sign OPTEXER OPTEXERRATIO
Coeff t-stat Coeff t-stat
Intercept 00015 527 1997 282
LAW + 00003 197 0059 050
MB + 00000 077 0123 528
SALES -00001 -668 -0013 -074
LEV ndash 00001 037 -0303 -216
RET 00005 946 0321 748
RETVOL 00018 294 -1407 -344
ROA 00017 434 1070 474
LN_AGE ndash -00001 -310 -0036 -108
Adj R-sq 007 006
Obs 15265 10907
30
Table 5 Alternate control samples EQUITYRATIO is the ratio of equity-based compensation to total compensation LIT denotes high litigation risk industries MB represents the market-to-book ratio RampD indicates the ratio of research and development expenses to total sales ADVT is the amount of advertising expenses per dollar of sales SALES denotes the log value of total sales LEV measures leverage RET is the stock return for the prior year RETVOL is the standard deviation of daily returns measured over the year ROA denotes profitability CASH is the amount of cash and cash equivalents per dollar of assets FCF denotes free cash flows AGE captures firm age defined as the difference between current year and the first year that the firm existed on Compustat 2 firms 3 firms All ExecuComp Regular probit 2SLS-2nd stage Regular probit 2SLS-2nd stage Regular probit 2SLS-2nd stage Coeff z-stat Coeff z-stat Coeff z-stat Coeff z-stat Coeff z-stat Coeff z-stat Intercept -851 -951 -841 -928 -804 -898 -796 -872 -884 -1685 -895 -1260
EQUITYRATIO 032 248 028 234 024 305
EQUITYPREDICT -032 -083 -035 -099 031 108
LIT 052 306 054 349 036 354
MB 017 523 018 517 010 369 011 385 011 676 011 621
RampD 074 170 068 144 110 248 108 232 054 222 030 111
ADVT 269 156 233 137 224 152 195 132 128 140 107 116
SALES 032 900 034 867 033 981 035 956 028 1280 027 1076
LEV 031 110 033 119 021 080 028 111 023 143 027 161
RET 008 105 008 099 -001 -020 -002 -031 -001 -034 -001 -035
RETVOL 272 380 304 387 194 315 225 336 266 689 250 596
ROA -011 -020 -002 -004 -006 -010 014 025 -019 -058 -022 -070
CASH 011 035 -002 -007 035 119 017 058 034 188 024 129
FCF -148 -259 -145 -252 -158 -301 -170 -324 -108 -330 -109 -336
LN_AGE -024 -386 -025 -401 -026 -448 -027 -467 -012 -333 -010 -283 Adj R-sq 021 021 019 020 015 015 Obs 1374 1374 1826 1826 14535 14535

10
31 Litigation risk (LIT)
We use membership in certain industries as our measure of high (ex-ante) litigation risk
Prior studies have identified firms that operate in the bio-technology (SIC code 2833-2836 and
8731-8734) computing (SIC codes 3570-3577 and 7370-7374) electronics (SIC codes 3600-
3674) and retailing (SIC codes 5200-5961) industries to be more prone to higher litigation risk
than other firms (eg Francis et al (1994) Shu (2000) Johnson et al (2001) Field et al (2005)
Rogers and Stocken (2005)) We define litigation risk (LIT) as an indicator variable taking the
value of one if a firm belongs to these industries The classification of these industries is based
on data that pre-date our sample
32 CEO compensation
We define total annual compensation (TOTALCOMP) as the sum of salary bonus
restricted stock grants option grants and all other annual compensation We examine two
components of total compensation ndash the cash-based component (CASHBASED) defined as the
sum of salary and bonus and equity-based compensation (EQUITYBASED) defined as the sum
of Black-Scholes value options grants and restricted stock grants We also examine the ratio of
equity-based compensation to total compensation (EQUITYRATIO)
33 Sample
331 Main sample
Our empirical tests are based on two samples The first sample is used to examine the
effect of litigation risk on equity-based compensation As litigation risk is based on industry
classification the sample is based on all firms with compensation data on ExecuComp
accounting data on Compustat and stock price data on CRSP The final sample comprises of
20646 firm-year observations for 2646 unique firms between the years 1992 and 2006
11
Descriptive statistics are presented in Panel A of Table 1 The annual total compensation
for the CEO for the sample is around $41 million of which $12 million is from salary and
bonus and $21 million is from stock option grants and restricted stock grants These statistics
compare closely with those found in other studies (eg Jayaraman and Milbourn (2009) Garvey
and Milbourn (2003)) Equity-based compensation is 36 of the CEOrsquos annual compensation
The mean value of LIT is 028 which implies that 28 of the sample consists of firms with high
litigation risk The median firm in the sample has existed on Compustat for 20 years and has
annual sales of around $11 billion
332 Lawsuit sample
The second sample is used to explore the effect of equity-based compensation on the
probability of a lawsuit Our sample of class-action lawsuits is from the Stanford Securities Class
Action Clearinghouse and covers lawsuits filed during the period 1996 to 200710 These data
have been used by other studies such as Field et al (2005) Rogers and Stocken (2005) Denis et
al (2006) and Peng and Roell (2008) To ensure better matching with the ExecuComp sample
we hand-collect the firm-identifier (GVKEY) for the lawsuit sample11 The final sample
comprises 474 lawsuits between the years 1996 and 2007 To avoid any look-ahead bias the
independent variables in the prediction models are based on year t-1 relative to the year of the
lawsuit which is denoted as year t To form the control sample we follow Field et al and
randomly select one observation from the same year as the lawsuit firm from our first overall
sample12
10
Our final sample comprises of 948 firm-year observations
httpsecuritiesstanfordedu 11 Our results are robust to using the ticker symbol to match 12 We do not match by industry as our litigation risk indicator is an industry level variable Further in our robustness tests in Section 6 we follow the alternate matching techniques in Erickson et al (2006) and find similar results
12
Descriptive statistics for the lawsuit firms are presented in Panel B of Table 1 The total
compensation for sued firms is $687 million of which 46 is equity-based These numbers are
much higher than the overall sample of Panel A However it is important not to draw any causal
inferences about the role of equity-based compensation from these data as the need to control for
the effect of litigation risk on equity-based compensation is our fundamental starting point The
sued firms appear to have higher growth opportunities (MB is 296 versus 207 RampD is 009
versus 004) are larger better performing and more volatile (RETVOL is 014 compared to 012)
than the overall sample However care has to be exercised while interpreting these differences as
they have not been tested for statistical difference
The preliminary evidence suggests that sued firms differ from the overall sample in
various characteristics most relevant of which is the extent of equity-based compensation In the
next section we examine whether causal inferences can be drawn regarding the effect of equity-
based compensation on the probability of being sued
4 Empirical Results
41 Univariate evidence
Panel C of Table 1 splits the overall sample based on high litigation risk industries
(LIT=1) and others (LIT=0) and compares components of annual compensation between these
two groups Figures in bold indicate that the means (or medians) are significantly different
between the two groups The descriptive statistics provide some evidence that total compensation
is higher for managers of firms that operate in high litigation risk industries (mean compensation
is $442 million) compared with those in other industries (mean=$397 million) However the
median total pay is not any different between the two groups
13
In terms of the individual components of pay there is strong evidence that firms in high
litigation industries offer more equity-based compensation to their CEO (mean of $278 million
and median of $083 million) compared to those in non-high litigation risk industries (mean =
$187 million and median = $054 million) These differences are significant for both means and
medians Finally the ratio of equity-based compensation to total compensation is also
significantly higher for the high litigation risk group There is evidence that firms in high
litigation risk industries differ from those in non-high litigation risk industries along several
dimensions which have been previously shown to influence compensation characteristics For
example firms in high litigation risk industries have higher growth opportunities (mean MB of
277 compared to 180) invest more in RampD have more volatile environments (median
RETVOL is 013 compared to 009) have more cash on hand and are younger
As correlations do not control for differences in these innate characteristics between firms
and over time they should be interpreted cautiously Nevertheless an association between LIT
and EQUITYRATIO in univariate correlations suggests a first-order effect of high litigation risk
on CEO equity-based compensation
42 Multivariate regressions
In this section we discuss variables related to equity-based compensation used in prior
studies and incorporate them in a multivariate regression to ascertain whether the explanatory
power of LIT with respect to EQUITYRATIO is incremental to that of these characteristics
421 Firm level determinants
As prior studies find that the investment opportunity set affects stock-based
compensation (eg Clinch (1991) Smith and Watts (1992) Gaver and Gaver (1993) and Baber
et al (1996)) we follow Ittner et al (2003) and include four variables to capture the investment
14
opportunity set ndash the market-to-book ratio (MB) the ratio of research and development expenses
to sales (RampD) the ratio of advertising expenses to sales (ADVT) and the log of firm age defined
as the number of years the firm exists on Compustat (LN_AGE) Consistent with prior studies
we expect a positive coefficient on MB RampD and ADVT and a negative coefficient on LN_AGE
As is standard we control for firm size using the log of total sales (SALES) As prior studies
present conflicting arguments for the relation between firm size and equity-based compensation
we merely include it as a control without making a directional prediction Following Ittner et al
we use leverage (LEV) to capture monitoring by debt holders and expect a negative relation with
EQUITYRATIO
We use both accounting (ROA) and stock price (RET) based measures to capture prior
performance RET represents the prior yearrsquos annual stock return We also include stock return
volatility (RETVOL) to capture features of the operating environment Studies such as
Prendergast (2000 2002) argue that firms rely more on stock-based incentives in riskier
environments where it is more difficult to monitor the managerrsquos actions On the other hand
studies such as Demsetz and Lehn (1985) Lambert and Larcker (1987) Aggarwal and Samwick
(1999) and Garvey and Milbourn (2003) argue that greater stock return volatility captures more
noise in the output measure and firms should therefore reduce stock-based incentives (see also
Jayaraman and Milbourn (2009)) We therefore do not make a directional prediction for
RETVOL As studies argue that cash-constrained firms rely more on stock-based compensation
(eg Yermack (1995) Core and Guay (1999 2001)) we include the ratio of cash on hand to
total assets (CASH) and free cash flows (FCF) defined as cash flow from operations less capital
expenditures scaled by total assets to capture the incentive to conserve cash
15
Following Petersen (2009) we estimate the regressions with year indicators and standard
errors clustered at the firm level The year indicators control for common shocks which could
cause cross-sectional correlation in the errors The firm-level clustering of standard errors
corrects for the possibility of serial correlation attributable to unobserved firm effects
422 Effect of litigation risk on equity-based compensation
The empirical specifications we employ are
0 0 0 0 0 0
0 0 0 0 0
9
0 0 1
amp
_
i t i t i t i t i t i t
i t i t i t i t i t
i t i t J i tJ
CASHBASED LIT MB R D ADVT SALESLEV RET RETVOL ROA CASH
FCF LN AGE YEAR IND
α α α α α α
α α α α α
α α ε=
= + + + + +
+ + + + +
+ + + + +sum sum
(1)
0 0 0 0 0 0
0 0 0 0 0
9
0 0 1
amp
_
i t i t i t i t i t i t
i t i t i t i t i t
i t i t J i tJ
EQUITYBASED LIT MB R D ADVT SALESLEV RET RETVOL ROA CASH
FCF LN AGE YEAR IND
α α α α α α
α α α α α
α α ε=
= + + + + +
+ + + + +
+ + + + +sum sum
(2)
0 0 0 0 0 0
0 0 0 0 0
9
0 0 1
amp
_
i t i t i t i t i t i t
i t i t i t i t i t
i t i t J i tJ
EQUITYRATIO LIT MB R D ADVT SALESLEV RET RETVOL ROA CASH
FCF LN AGE YEAR IND
α α α α α α
α α α α α
α α ε=
= + + + + +
+ + + + +
+ + + + +sum sum
(3)
where CASHBASED EQUITYBASED and EQUITYRATIO are cash-based compensation
equity-based compensation and the ratio of equity-based compensation to total compensation
respectively
Table 2 presents results of the above multivariate regressions The coefficient of LIT is
negative and insignificant (t-statistic is -128) in Model 1 suggesting that litigation risk does not
affect cash-based compensation of CEOs The coefficients of LIT are positive and significant (t-
stats are 496 and 473 respectively) in Models 2 and 3 suggesting that the level of equity-based
compensation as well as the proportion of equity-based compensation to total compensation are
16
higher for firms with higher litigation risk The coefficients (60485 and 005) suggest that
litigation risk increases total equity-based compensation by 32 and the proportion of equity-
based compensation to total compensation by 15 respectively relative to the overall mean
423 Effect of equity-based compensation on litigation risk
In this section we first examine the relation between the probability of a lawsuit and
equity-based compensation in a simple probit model We then model the simultaneous relation
between lawsuit probability and equity-based compensation as follows
1 1 1 1 Equity based compensation Litigation risk Xγ β ε= + + (4)
2 2 2 2 = Litigation risk Equity based compensation Xγ β ε+ + (5)
As Field et al (2005) point out it is incorrect to substitute ex-post occurrence of litigation
to capture litigation risk in eq (4) This is because the occurrence of litigation is not exogenous
and depends on the compensation contract For example firms that choose to offer less equity-
based compensation to their CEOs have a low error term ( 1ε ) Similarly these firms also have a
higher probability of litigation as their CEOs are less aligned with shareholders which means 2ε
will be high This potential correlation between 1ε and 2ε causes ordinary probit to be biased
We therefore treat (4) and (5) as simultaneous equations To ensure that equations (4) and (5) are
appropriately identified we need a variable in 1X that is not in 2X and vice-versa
Following Field et al (2005) we use the industry litigation risk indicator (LIT) as the
instrument in equation (4) As annual options are granted based on the previously outstanding
level of stock options to ensure an optimal level of alignment we use the sum of outstanding
options as of the previous year end (OSOPTIONS) as the instrument to identify equation (5)13
13 This is analogous to Field et al (2005) who use past disclosure as the instrument for current period disclosure
We estimate the simultaneous regression framework in two stages In the first stage we regress
17
the proportion of equity-based compensation (EQUITYRATIO) on the two instruments (LIT and
OSOPTIONS) and all the other independent variables We then use the predicted value from this
first stage (EQUITYPREDICT) regression in the second-stage probit model where the dependent
variable is whether or not the firm was sued (LAW=1)
Table 3 presents results of the above regressions with the first set of columns presenting
the probit results Consistent with prior studies the coefficient of EQUITYRATIO is positive
(049) and significant (t-statistic = 325) This suggests that firms that have been sued are
associated with more equity-based compensation that those that are not However as the next set
of results show it is problematic to draw any causal inference from these associations The next
set of columns present the first stage of the two-stage framework The specification is similar to
that used in table 2 except that the instrument for equation (5) viz OSOPTIONS has been
included The last set of columns presents the results of the second-stage where the independent
variable of interest is the predicted value of equity-based compensation from the first stage
(EQUITYPREDICT) The coefficient of endogenously determined equity-based compensation is
not significantly related to the probability of a lawsuit (t-stat = -080) which is inconsistent with
the myopia story This is one of the two main results of the study
5 Managerial stock option exercises during misrepresentation period
Prior studies find that managers of firms that are accused of misrepresentation exercise
more options during the misrepresentation period than other firms (eg Bergstresser and
Philippon (2006) and Beneish (1999)) Studies such as Ofek and Yermack (2000) show that
executives sell almost all shares that they regularly exercise which is consistent with managers
diversifying away their firm-specific risk Given that sued firms (alternatively firms with higher
18
litigation risk) are granted more options annually we explore whether the higher options
exercises by sued firms is consistent with the higher demand for diversification
We first confirm that sued firms exercise more options (as a percent of market value)
than their non-sued counterparts in the year before the lawsuit We define OPTEXER as the value
of stock options exercised by the CEO scaled by market value of equity and examine differences
in OPTEXER between ndash (i) high litigation risk and low litigation risk firms and (ii) sued and not
sued firms We define OPTEXERRATIO as the ratio of the value of options exercised during the
year scaled by the value of total options granted during the year
Panel A of Table 4 presents the univariate comparisons The firms with high litigation
risk exercise options worth 012 of firm value versus 007 by firms with low litigation risk
These differences are statistically significant at the 1 level Similarly managers of sued firms
exercise more options (013 of firm value) in the year before lawsuit relative to all other firms
(008) which are also significantly different from one another at less than the 1 level This
evidence is consistent with Bergstresser and Philippon (2006) and Beneish (1999)) However
when we compare differences in OPTEXERRATIO the differences are no longer significant
between the sued firms and not sued firms Thus the value of options exercised during the year
as a percentage of total options granted is not higher for sued firms relative to not-sued firms
These inferences are confirmed by the multivariate evidence where the coefficient of LAW
(which denotes sued versus not-sued firms) is significant when OPTEXER is the dependent
variable but is insignificant when the dependent variable is OPTEXERRATIO Overall these
results suggest that options exercises by managers of sued firms are not unusually high during
the period of misrepresentation This is the second main result of the paper
19
6 Robustness tests
In this section we perform two robustness tests to verify the sensitivity of our inferences
Specifically we ensure that our results are not driven by new economy firms or alternative
sample matching techniques
61 New economy firms
Using survey data Ittner Lambert and Larcker (2003) highlight that new-economy firms
rely more on stock-based compensation than old economy firms Murphy (2003) extends and
confirms the Ittner et al result to all ExecuComp firms Murphyrsquos (2003) classification of new-
economy firms overlaps with that of the high litigation risk industries We examine whether our
results merely re-state the new economy firms result in these papers To do so we first include
an indicator to capture new economy firms as used in Murphy (2003) as an additional
independent variable We find that the coefficient of LIT remains positive and significant
Second in the probit regression with LAW as the dependent variable we include the new
economy indicator to examine whether new economy firms are more likely to be sued We find
no evidence to this effect We therefore conclude that the relation between litigation risk and
equity-based compensation is not due to the new economy firms finding of Ittner et al (2003)
62 Alternate control samples
We also examine whether our results are robust to alternate control samples Following
Erickson et al (2006) we use two alternate control samples First we randomly select two firms
from the main sample for each sued firm and second we use all firms that were never sued
Additionally as the proportion of high litigation firms to all firms is 28 we randomly select
three firms for each sued firm in order to simulate this mix The results for these alternate
controls are presented in Table 5 The coefficient of EQUITYRATIO is positive and significant in
20
all samples in the simple probit model while the coefficient of EQUITYPREDICT is generally
negative and significant in the two-stage least squares models Thus our inferences appear to be
robust to alternate control samples used in prior studies
7 Conclusion
We re-examine the relation between equity-based compensation and litigation risk in a
simultaneous equations framework Consistent with theoretical models that predict that firms
will grant more equity-based incentives when the probability of detection of misrepresentation is
high we find that firms with high (ex-ante) litigation risk grant more equity-based incentives to
their managers More importantly once one controls for the effect of litigation risk on equity-
based compensation the evidence does not support the inference from prior studies that higher
equity-based compensation causes a higher probability of a class-action lawsuit
Further while managers of sued firms exercise more options during the period of
misrepresentation these options as a ratio of annual options grants are more significantly
different from those of not-sued firms This evidence suggests that the greater option exercises
by sued firms are due to their greater diversification demand and not due to managers acting
strategically during these periods Overall while stock options may be guilty of causing some
managerial misbehavior our results cast doubt over the ldquounintended consequencesrdquo in the
shareholder litigation realm of managerial equity-based incentives
21
References
Aggarwal R Samwick A 1999 The other side of the trade-off The impact of risk on executive compensation Journal of Political Economy Vol 107 pp 65ndash105 Armstrong C S AD Jagolinzer and DF Larcker 2009 Chief Executive Officer Equity Incentives and Accounting Irregularities Working paper University of Pennsylvania Baber W R S N Janakiraman and S H Kang Investment Opportunities and the Structure of
Executive Compensation Journal of Accounting amp Economics 21 no 3 (1996) 297-318
Ball R Market and PoliticalRegulatory Perspectives on the Recent Accounting Scandals
Journal of Accounting Research 47 no 2 (2009) 277-323 Beneish M D Incentives and Penalties Related to Earnings Overstatements That Violate
Gaap Accounting Review 74 no 4 (1999) 425-57 Bergstresser D and T Philippon Ceo Incentives and Earnings Management Journal of
Financial Economics 80 no 3 (2006) 511-29 Burns N and S Kedia The Impact of Performance-Based Compensation on Misreporting
Journal of Financial Economics 79 no 1 (2006) 35-67 Bushman R M and A J Smith Financial Accounting Information and Corporate
Governance Journal of Accounting amp Economics 32 no 1-3 (2001) 237-333 Core John and W Guay 2002 The other side of the trade-off The impact of risk on executive compensation a Revised Comment Working paper University of Pennsylvania Cheng Q and D B Farber Earnings Restatements Changes in Ceo Compensation and Firm
Performance Accounting Review 83 no 5 (2008) 1217-50 Cheng Q and T A Warfield Equity Incentives and Earnings Management Accounting
Review 80 no 2 (2005) 441-76 Crocker K J and J Slemrod The Economics of Earnings Manipulation and Managerial
Compensation Rand Journal of Economics 38 no 3 (2007) 698-713 Demsetz Harold and Kenneth Lehn 1985The structure of corporate ownership Causes and consequences Journal of Political Economy 93 1155-1177 Denis D J P Hanouna and A Sarin Is There a Dark Side to Incentive Compensation
Journal of Corporate Finance 12 no 3 (2006) 467-88
22
Efendi J A Srivastava and E P Swanson Why Do Corporate Managers Misstate Financial Statements The Role of Option Compensation and Other Factors Journal of Financial Economics 85 no 3 (2007) 667-708
Erickson M M Hanlon and E L Maydew Is There a Link between Executive Equity
Incentives and Accounting Fraud Journal of Accounting Research 44 no 1 (2006) 113-43
Field L M Lowry and S Shu Does Disclosure Deter or Trigger Litigation Journal of
Accounting amp Economics 39 no 3 (2005) 487-507 Fischer P E and R E Verrecchia Reporting Bias Accounting Review 75 no 2 (2000) 229-
45 Garvey G and T Milbourn 2003 Incentive compensation when executives can hedge the market evidence of relative performance evaluation in the cross-section Journal of Finance 58 pp 1557ndash1582 Gaver J J and K M Gaver Additional Evidence on the Association between the Investment
Opportunity Set and Corporate Financing Dividend and Compensation Policies Journal of Accounting amp Economics 16 no 1-3 (1993) 125-60
Goldman E and S L Slezak An Equilibrium Model of Incentive Contracts in the Presence of
Information Manipulation Journal of Financial Economics 80 no 3 (2006) 603-26 Harris J and P Bromiley Incentives to Cheat The Influence of Executive Compensation and
Firm Performance on Financial Misrepresentation Organization Science 18 no 3 (2007) 350-67
Ittner C D R A Lambert and D F Larcker The Structure and Performance Consequences
of Equity Grants to Employees of New Economy Firms Journal of Accounting amp Economics 34 no 1-3 (2003) 89-127
Jayaraman S and T Milbourn 2009 The Role of Stock Liquidity and Stock Return Volatility in
Executive Compensation Risk Versus Information Working paper Washington University in St Louis
Jin L 2002 CEO compensation diversification and incentives Journal of Financial Economics 66 pp 29ndash63 Johnson M F R Kasznik and K K Nelson The Impact of Securities Litigation Reform on
the Disclosure of Forward-Looking Information by High Technology Firms Journal of Accounting Research 39 no 2 (2001) 297-327
Johnson S A H E Ryan and Y S Tian Managerial Incentives and Corporate Fraud The
Sources of Incentives Matter Review of Finance 13 no 1 (2009) 115-45
23
Ke Bin 2001 Why Do CEOs of Publicly Traded Firms Prefer Reporting Small Increases in Earnings and Long Duration of Consecutive Earnings Increases Working paper Penn State University Lambert R A and D F Larcker An Analysis of the Use of Accounting and Market Measures
of Performance in Executive-Compensation Contracts Journal of Accounting Research 25 (1987) 85-129
Milbourn TT 2003 CEO reputation and stock-based compensation Journal of Financial Economics 68 pp 233ndash262 Murphy K J Stock-Based Pay in New Economy Firms Journal of Accounting amp Economics
34 no 1-3 (2003) 129-47 Ofek E and D Yermack 2000 Taking Stock Equity-Based Compensation and the Evolution
of Managerial Ownership Journal of Finance 55 no 3 1367-84 Peng L and A Roell Executive Pay and Shareholder Litigation Review of Finance 12 no 1
(2008) 141-84 mdashmdashmdash Manipulation and Equity-Based Compensation American Economic Review 98 no 2
(2008) 285-90 Petersen M A Estimating Standard Errors in Finance Panel Data Sets Comparing
Approaches Review of Financial Studies 22 no 1 (2009) 435-80 Prendergast C ldquoWhat Trade-off of Risk and Incentivesrdquo American Economic Review Papers and Proceedings 90 (May 2000) 421ndash25 Prendergast C ldquoThe tenuous trade-off between risk and incentivesrdquo Journal of Political Economy 110 (2002) 1071ndash102 Richardson Scott A Tuna A Irem and Wu 2002 Predicting Earnings Management The Case of Earnings Restatements Working paper Barclays Global Rogers J L and P C Stocken Credibility of Management Forecasts Accounting Review 80
no 4 (2005) 1233-60 Shu S Z Auditor Resignations Clientele Effects and Legal Liability Journal of Accounting amp Economics 29 no 2 (2000) 173-205 Skinner D J 1994 Why Firms Voluntarily Disclose Bad-News Journal of Accounting
Research 32 no 1 38-60 Smith C W and R L Watts 1992 The Investment Opportunity Set and Corporate Financing
Dividend and Compensation Policies Journal of Financial Economics 32 no 3 263-92
24
Table 1 Descriptive statistics The sample comprises of 20646 firm-year observations and covers the period from 1992 to 2006 TOTALCOMP indicates total annual compensation defined as the sum of salary bonus restricted stock grants option grants and all other annual compensation CASHBASED denotes cash-based compensation defined as the sum of salary and bonus EQUITYBASED is equity-based compensation defined as the sum of restricted stock grants and options grants EQUITYRATIO is the ratio of equity-based compensation to total compensation LIT denotes high litigation risk industries (SIC codes 2833-2836 3570-3577 3600-3674 5200-5961 7370-7374 and 8731-8734) MB represents the market-to-book ratio defined as the market value of total assets divided by the book value of total assets RampD indicates the ratio of research and development expenses to total sales ADVT is the amount of advertising expenses per dollar of sales Missing values of RampD and ADVT have been set to zero SALES denotes the log value of total sales LEV measures leverage which is defined as total debt divided by total assets RET is the stock return for the prior year RETVOL is the standard deviation of daily returns measured over the year ROA denotes profitability and is defined as earnings before extraordinary items scaled by total assets CASH is the amount of cash and cash equivalents per dollar of assets FCF denotes free cash flows measured as cash flow from operations less capital expenditures divided by total assets AGE captures firm age defined as the difference between current year and the first year that the firm existed on Compustat OSOPTIONS is the outstanding value of stock options scaled by market value as of the beginning of the year Panel A Overall sample
Variables Obs Mean Median Std dev Min Max
TOTALCOMP 20646 409958 207898 571125 18680 3533708
CASHBASED 20646 124957 89535 118192 3692 750000
EQUITYBASED 20646 212636 60255 420267 000 2687867
EQUITYRATIO 20646 036 036 030 000 100
LIT 20646 028 000 045 000 100
MB 20646 207 155 151 080 966
RampD 20646 004 000 012 000 091
ADVT 20646 001 000 002 000 014
SALES 20646 713 705 155 323 1089
LEV 20646 023 022 018 000 079
RET 20646 021 012 057 -076 295
RETVOL 20646 012 010 007 003 038
ROA 20646 004 005 010 -048 024
CASH 20646 013 006 017 000 075
FCF 20646 003 003 009 -032 027
AGE 20646 2445 2000 1589 300 5500
OSOPTIONS 20646 0005 0001 0012 000 0082
25
Panel B Lawsuit sample
Variables Obs Mean Median Std dev Min Max
TOTALCOMP 474 686658 379243 851381 18680 3533708
CASHBASED 474 149472 97346 154368 3692 750000
EQUITYBASED 474 410967 160206 650040 000 2687867
EQUITYRATIO 474 046 056 033 000 100
LIT 474 043 000 050 000 100
MB 474 296 204 237 080 966
RampD 474 009 000 018 000 091
ADVT 474 001 000 003 000 014
SALES 474 740 742 182 323 1089
LEV 474 021 019 019 000 079
RET 474 036 021 074 -076 295
RETVOL 474 014 012 008 003 038
ROA 474 003 005 013 -048 024
CASH 474 019 010 021 000 075
FCF 474 002 003 011 -032 027
AGE 474 2129 1400 1664 300 5500
OSOPTIONS 474 0006 0002 0011 000 0082
26
Panel C Differences between high litigation (LIT=1) and low litigation (LIT=0) industries
LIT=1 (N=5810)
LIT=0 (N=14836)
Variables Mean Median Mean Median
Compensation
TOTALCOMP 441984 210635 397416 206976
CASHBASED 107412 75195 131829 94624
EQUITYBASED 278359 82878 186898 54253
EQUITYRATIO 043 048 033 032
Firm characteristics
MB 277 207 180 142
RampD 011 005 002 000
ADVT 001 000 001 000
SALES 677 665 727 719
LEV 015 011 026 025
RET 027 012 019 012
RETVOL 015 013 010 009
ROA 003 006 004 004
CASH 024 018 009 004
FCF 003 004 003 003
AGE 1805 1300 2695 2600
OSOPTIONS 0007 0002 0005 0001
27
Table 2 Relation between litigation risk and equity-based compensation The sample comprises of 20646 firm-year observations and covers the period from 1992 to 2006 CASHBASED denotes cash-based compensation defined as the sum of salary and bonus EQUITYBASED is equity-based compensation defined as the sum of restricted stock grants and options grants EQUITYRATIO is the ratio of equity-based compensation to total compensation LIT denotes high litigation risk industries (SIC codes 2833-2836 3570-3577 3600-3674 5200-5961 7370-7374 and 8731-8734) MB represents the market-to-book ratio defined as the market value of total assets divided by the book value of total assets RampD indicates the ratio of research and development expenses to total sales ADVT is the amount of advertising expenses per dollar of sales Missing values of RampD and ADVT have been set to zero SALES denotes the log value of total sales LEV measures leverage which is defined as total debt divided by total assets RET is the stock return for the prior year RETVOL is the standard deviation of daily returns measured over the year ROA denotes profitability and is defined as earnings before extraordinary items scaled by total assets CASH is the amount of cash and cash equivalents per dollar of assets FCF denotes free cash flows measured as cash flow from operations less capital expenditures divided by total assets AGE captures firm age defined as the difference between current year and the first year that the firm existed on Compustat OSOPTIONS is the outstanding value of stock options scaled by market value as of the beginning of the year All regressions include year effects 1 digit SIC industry indicators and robust standard errors clustered at the firm level
Sign CASHBASED (1)
EQUITYBASED (2)
EQUITYRATIO (3)
Coeff t-stat Coeff t-stat Coeff t-stat
Intercept -287502 -1444 -970425 -1926 -008 -192
LIT + -4249 -128 60485 496 005 473
MB + -1255 -121 48750 899 002 497
RampD + 62552 495 230061 467 034 880
ADVT + 316682 520 581331 268 -013 -087
SALES 44267 2796 119226 2415 005 1787
LEV ndash 42434 365 63686 201 001 045
RET 9656 643 13026 191 000 -010
RETVOL -6886 -037 341846 496 028 535
ROA 46636 351 -22896 -046 014 378
CASH ndash 68320 434 152088 388 004 156
FCF ndash -15714 -126 -10156 -023 -007 -195
LN_AGE ndash 2050 104 -35090 -502 -004 -736
Adj R-sq 039 024 020
Obs 20646 20646 20646
28
Table 3 Effect of equity-based compensation on the probability of a lawsuit EQUITYRATIO is the ratio of equity-based compensation to total compensation EQUITYPREDICT is the predicted value of EQUITYRATIO from the first stage probit model LIT denotes high litigation risk industries MB represents the market-to-book ratio defined as the market value of total assets divided by the book value of total assets RampD indicates the ratio of research and development expenses to total sales ADVT is the amount of advertising expenses per dollar of sales Missing values of RampD and ADVT have been set to zero SALES denotes the log value of total sales LEV measures leverage which is defined as total debt divided by total assets RET is the stock return for the prior year RETVOL is the standard deviation of daily returns measured over the year ROA denotes profitability and is defined as earnings before extraordinary items scaled by total assets CASH is the amount of cash and cash equivalents per dollar of assets FCF denotes free cash flows measured as cash flow from operations less capital expenditures divided by total assets LN_AGE is the log of firm age OSOPTIONS is the outstanding value of stock options scaled by market value as of the beginning of the year The probit regressions contain 2 digit SIC industry indicators
Sign
Regular probit Simultaneous equation
Pr (LAW=1)
Dep variable = EQUITYRATIO
First stage
Second stage
Pr (LAW=1)
Coeff z-stat Coeff t-stat Coeff z-stat
Intercept -947 -1216 -009 -220 -920 -922
EQUITYRATIO 049 325
EQUITYPREDICT -036 -080
LIT 005 482 044 231
MB 012 298 002 522 012 307
RampD 010 019 033 856 023 040
ADVT 530 247 -014 -094 400 187
SALES 033 794 005 1823 037 774
LEV 025 074 002 080 026 078
RET 002 026 000 -086 003 034
RETVOL 240 278 028 541 273 287
ROA -032 -043 012 320 -026 -034
CASH 102 249 004 148 087 211
FCF -183 -267 -007 -182 -186 -271
LN_AGE -015 -203 -004 -700 -017 -218
OSOPTIONS 137 594
Adj R-sq 021 021 020
Obs 924 20362 924
29
Table 4 Option exercises Panel A Univariate evidence Entire sample Lawsuit sample
LIT=1 (1)
LIT=0 (2)
t-test (1) ndash (2)
LAW=1 (3)
LAW=0 (4)
t-test (3) ndash (4)
OPTEXER 00012 (N=5810)
00007 (N=14836)
1101 00013 (N=485)
00008 (N=14780)
337
OPTEXERRATIO 08510 (N=4188)
07174 (N=10728)
369 08957 (N=355)
07496 (N=10552)
124
Panel B Multivariate evidence
Sign OPTEXER OPTEXERRATIO
Coeff t-stat Coeff t-stat
Intercept 00015 527 1997 282
LAW + 00003 197 0059 050
MB + 00000 077 0123 528
SALES -00001 -668 -0013 -074
LEV ndash 00001 037 -0303 -216
RET 00005 946 0321 748
RETVOL 00018 294 -1407 -344
ROA 00017 434 1070 474
LN_AGE ndash -00001 -310 -0036 -108
Adj R-sq 007 006
Obs 15265 10907
30
Table 5 Alternate control samples EQUITYRATIO is the ratio of equity-based compensation to total compensation LIT denotes high litigation risk industries MB represents the market-to-book ratio RampD indicates the ratio of research and development expenses to total sales ADVT is the amount of advertising expenses per dollar of sales SALES denotes the log value of total sales LEV measures leverage RET is the stock return for the prior year RETVOL is the standard deviation of daily returns measured over the year ROA denotes profitability CASH is the amount of cash and cash equivalents per dollar of assets FCF denotes free cash flows AGE captures firm age defined as the difference between current year and the first year that the firm existed on Compustat 2 firms 3 firms All ExecuComp Regular probit 2SLS-2nd stage Regular probit 2SLS-2nd stage Regular probit 2SLS-2nd stage Coeff z-stat Coeff z-stat Coeff z-stat Coeff z-stat Coeff z-stat Coeff z-stat Intercept -851 -951 -841 -928 -804 -898 -796 -872 -884 -1685 -895 -1260
EQUITYRATIO 032 248 028 234 024 305
EQUITYPREDICT -032 -083 -035 -099 031 108
LIT 052 306 054 349 036 354
MB 017 523 018 517 010 369 011 385 011 676 011 621
RampD 074 170 068 144 110 248 108 232 054 222 030 111
ADVT 269 156 233 137 224 152 195 132 128 140 107 116
SALES 032 900 034 867 033 981 035 956 028 1280 027 1076
LEV 031 110 033 119 021 080 028 111 023 143 027 161
RET 008 105 008 099 -001 -020 -002 -031 -001 -034 -001 -035
RETVOL 272 380 304 387 194 315 225 336 266 689 250 596
ROA -011 -020 -002 -004 -006 -010 014 025 -019 -058 -022 -070
CASH 011 035 -002 -007 035 119 017 058 034 188 024 129
FCF -148 -259 -145 -252 -158 -301 -170 -324 -108 -330 -109 -336
LN_AGE -024 -386 -025 -401 -026 -448 -027 -467 -012 -333 -010 -283 Adj R-sq 021 021 019 020 015 015 Obs 1374 1374 1826 1826 14535 14535
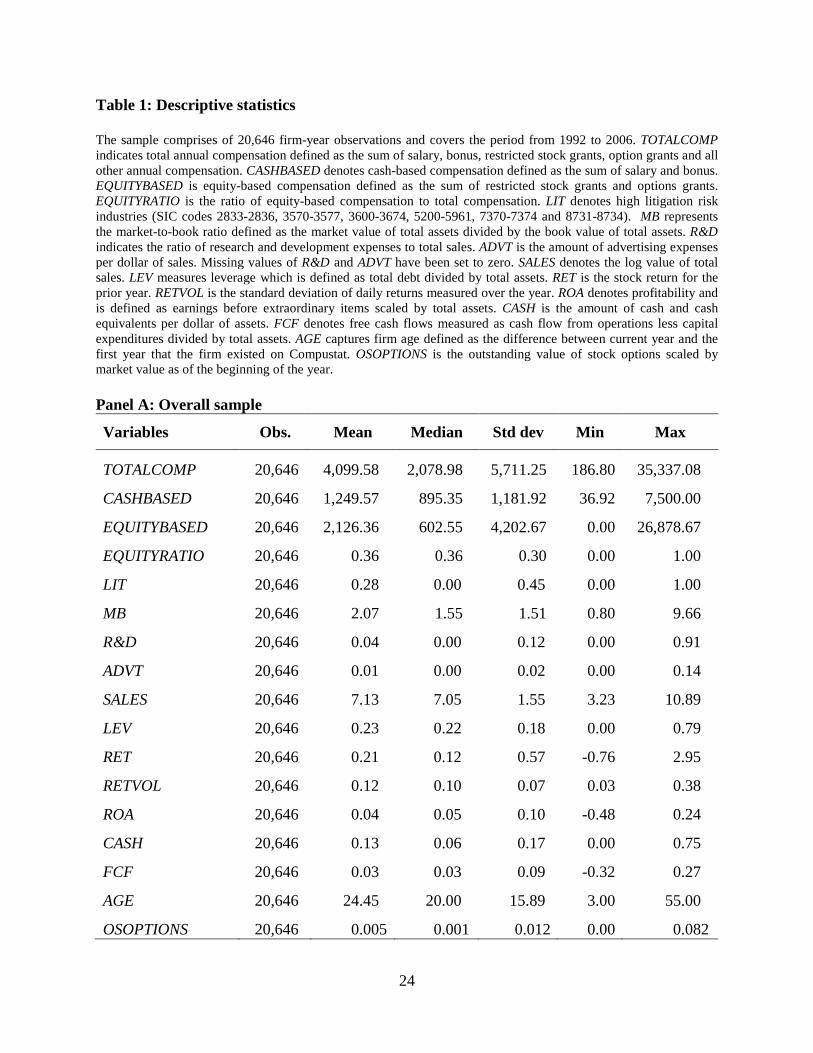
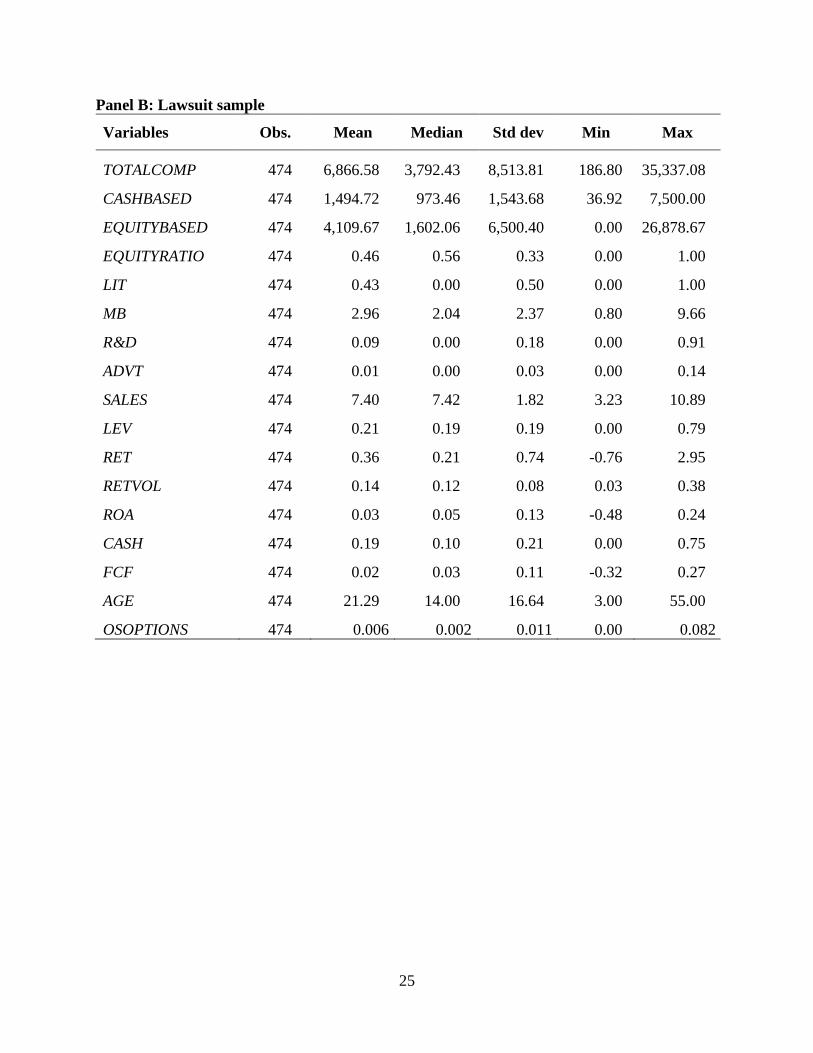
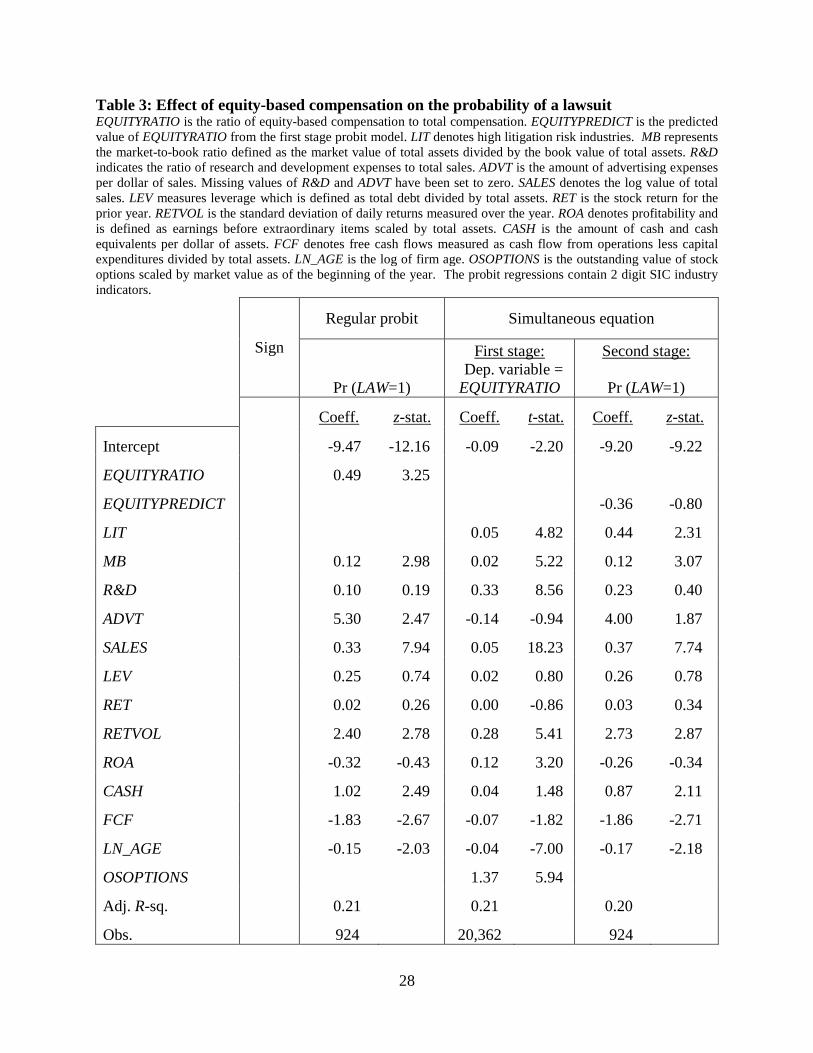
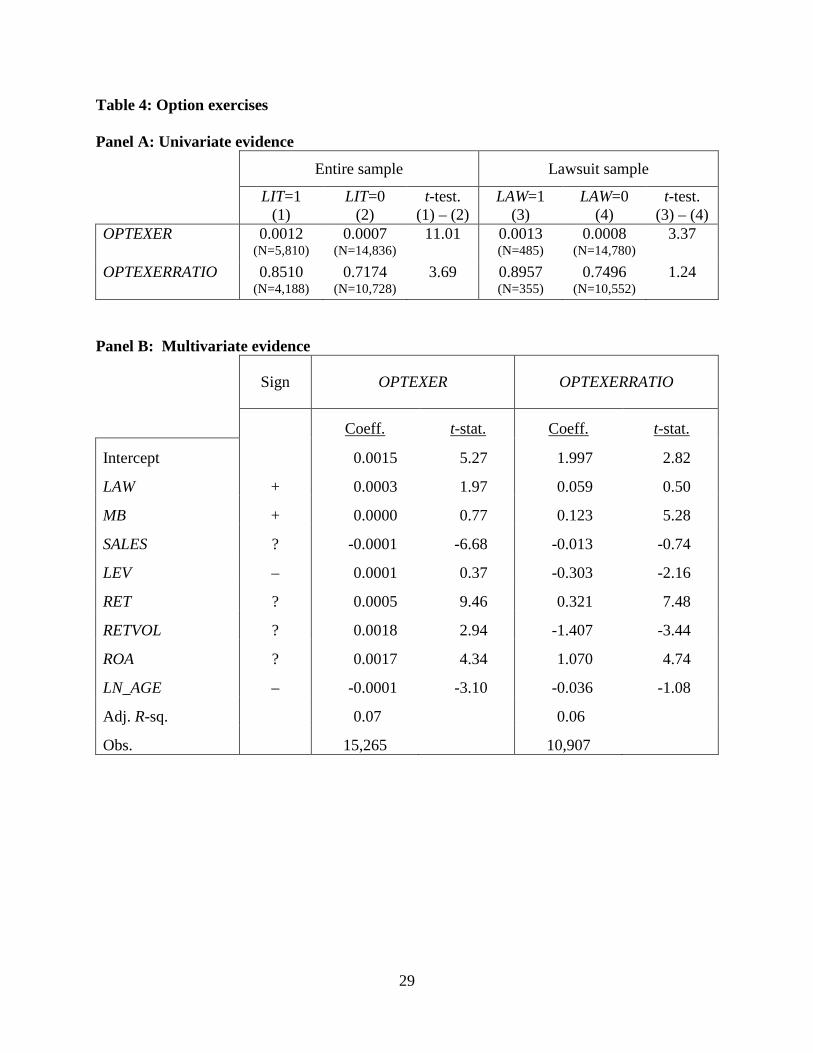
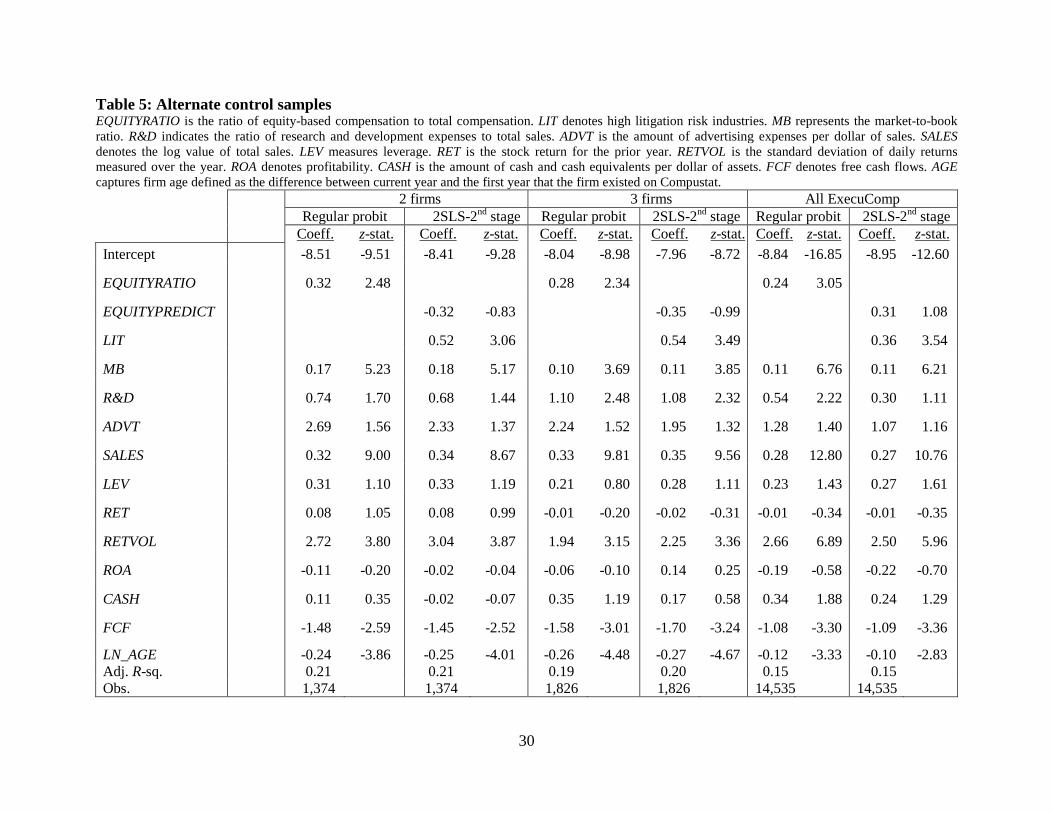