How is Machine Learning Useful for Macroeconomic Forecasting?
Upload
nguyenmienCategory
view
215download
0
DPRIETI Discussion Paper Series 17-E-068
Forecasting Firm Performance with Machine Learning:Evidence from Japanese firm-level data
MIYAKAWA DaisukeHitotsubashi University
MIYAUCHI YuheiMIT
Christian PEREZCarnegie Mellon University
The Research Institute of Economy, Trade and Industryhttp://www.rieti.go.jp/en/

RIETI Discussion Paper Series 17-E-068
May 2017
Forecasting Firm Performance with Machine Learning: Evidence from Japanese firm-level data*
MIYAKAWA Daisuke
Hitotsubashi University
MIYAUCHI Yuhei
MIT
Christian PEREZ
Carnegie Mellon University
Abstract The goal of this paper is to forecast future firm performance with machine learning techniques. Using data on
over one million Japanese firms with supply-chain linkage information provided by a credit reporting agency, we
show high performance in the prediction of exit, sales growth, and profit growth. In particular, our constructed
proxies far outperform the credit score assigned by the credit reporting agency based on a detailed survey and
interviews of firms. Against such baseline score, our models are able to ex-ante identify 16% of exiting firms
(baseline: 11%), 25% of firms experiencing growth in sales (baseline: 8%), and 22% of firms exhibiting positive
profit growth (baseline: 13%). The proof of concept of this paper provides practical usage of machine learning
methods in firm performance prediction.
Keywords: Machine learning, Big data, Prediction, Firm exit, Firm growth
JEL classification: G31; L25
RIETI Discussion Papers Series aims at widely disseminating research results in the form of professional
papers, thereby stimulating lively discussion. The views expressed in the papers are solely those of the
author(s), and neither represent those of the organization to which the author(s) belong(s) nor the Research
Institute of Economy, Trade and Industry.
*Miyakawa: Graduate School of International Corporate Strategy, Hitotsubashi University, [email protected]; Miyauchi:Department of Economics, MIT, [email protected]; Perez: School of Computer Science, Carnegie Mellon University,[email protected]. This research is conducted as a part of the Research Institute of Economy, Trade and Industry (RIETI)research project (Study on Corporate Finance and Firm Dynamics). We thank Hiroshi Ohashi, Miho Takizawa, Iichiro Uesugi,Kosuke Uetake, Yasutora Watanabe, Makoto Yano, and the seminar participants at RIETI for helpful suggestions. We also thankKatsuhiro Komatsu for his excellent research assistant work. Miyakawa gratefully acknowledges financial supports from the Grant-in-Aid for Scientific Research No. 16K03736 JSPS and the grant-in-aid from Zengin Foundation for Studies on Economics andFinance. Miyauchi acknowledges the Nakajima Foundation for the financial support for their Ph.D scholarship.
1
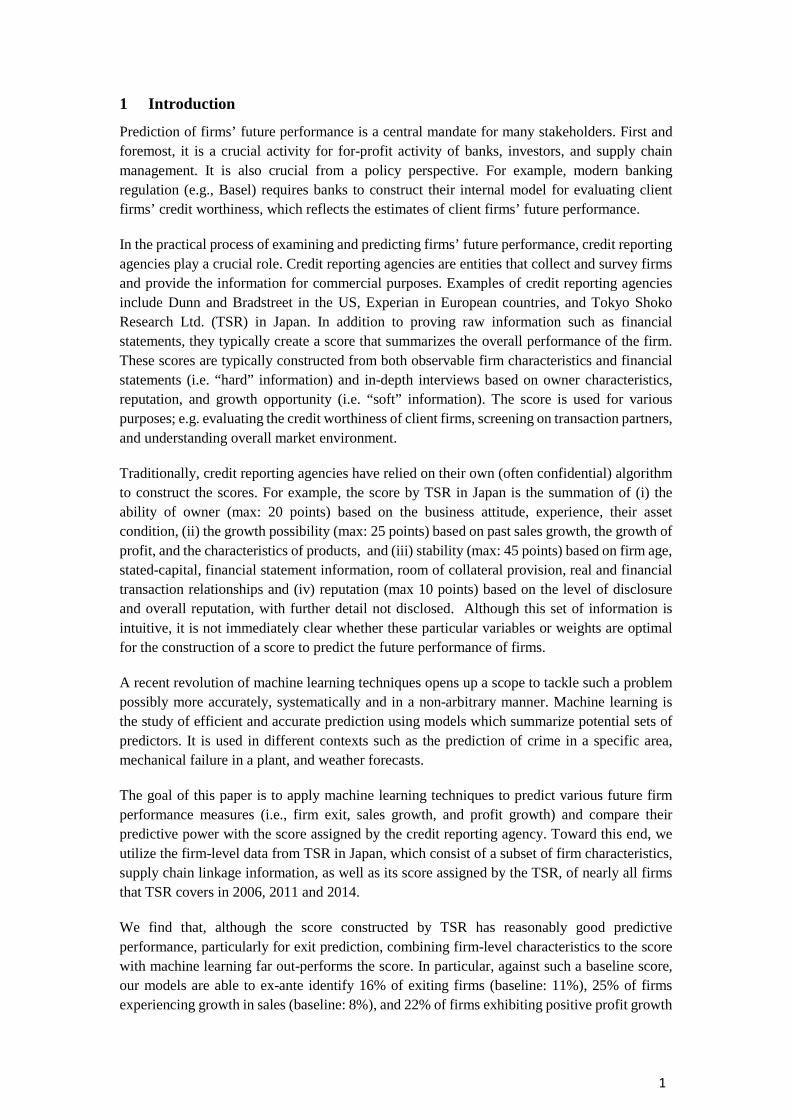
1 Introduction
Prediction of firms’ future performance is a central mandate for many stakeholders. First and foremost, it is a crucial activity for for-profit activity of banks, investors, and supply chain management. It is also crucial from a policy perspective. For example, modern banking regulation (e.g., Basel) requires banks to construct their internal model for evaluating client firms’ credit worthiness, which reflects the estimates of client firms’ future performance.
In the practical process of examining and predicting firms’ future performance, credit reporting agencies play a crucial role. Credit reporting agencies are entities that collect and survey firms and provide the information for commercial purposes. Examples of credit reporting agencies include Dunn and Bradstreet in the US, Experian in European countries, and Tokyo Shoko Research Ltd. (TSR) in Japan. In addition to proving raw information such as financial statements, they typically create a score that summarizes the overall performance of the firm. These scores are typically constructed from both observable firm characteristics and financial statements (i.e. “hard” information) and in-depth interviews based on owner characteristics, reputation, and growth opportunity (i.e. “soft” information). The score is used for various purposes; e.g. evaluating the credit worthiness of client firms, screening on transaction partners, and understanding overall market environment.
Traditionally, credit reporting agencies have relied on their own (often confidential) algorithm to construct the scores. For example, the score by TSR in Japan is the summation of (i) the ability of owner (max: 20 points) based on the business attitude, experience, their asset condition, (ii) the growth possibility (max: 25 points) based on past sales growth, the growth of profit, and the characteristics of products, and (iii) stability (max: 45 points) based on firm age, stated-capital, financial statement information, room of collateral provision, real and financial transaction relationships and (iv) reputation (max 10 points) based on the level of disclosure and overall reputation, with further detail not disclosed. Although this set of information is intuitive, it is not immediately clear whether these particular variables or weights are optimal for the construction of a score to predict the future performance of firms.
A recent revolution of machine learning techniques opens up a scope to tackle such a problem possibly more accurately, systematically and in a non-arbitrary manner. Machine learning is the study of efficient and accurate prediction using models which summarize potential sets of predictors. It is used in different contexts such as the prediction of crime in a specific area, mechanical failure in a plant, and weather forecasts.
The goal of this paper is to apply machine learning techniques to predict various future firm performance measures (i.e., firm exit, sales growth, and profit growth) and compare their predictive power with the score assigned by the credit reporting agency. Toward this end, we utilize the firm-level data from TSR in Japan, which consist of a subset of firm characteristics, supply chain linkage information, as well as its score assigned by the TSR, of nearly all firms that TSR covers in 2006, 2011 and 2014.
We find that, although the score constructed by TSR has reasonably good predictive performance, particularly for exit prediction, combining firm-level characteristics to the score with machine learning far out-performs the score. In particular, against such a baseline score, our models are able to ex-ante identify 16% of exiting firms (baseline: 11%), 25% of firms experiencing growth in sales (baseline: 8%), and 22% of firms exhibiting positive profit growth

2
(baseline: 13%). These results suggest the usefulness of machine learning methods in firm performance prediction.
The rest of the paper proceeds as follows. Section 2 describes the data we use for our analysis. Section 3 explains the empirical methodology and Section 4 presents and discusses the results. Section 5 concludes.
2 Background and Data
2.1 Tokyo Shoko Research
Throughout the paper, we use the datasets provided by TSR (Tokyo Shoko Research Ltd.), one of the largest credit reporting agencies in Japan. TSR is a private company operating in the areas of credit research, publishing, and database distribution. The central product TSR provides is the unsolicited-basis company report accounting for the performance of each targeted firm, which they sell to a variety of clients including banks, security firms, non-financial enterprises, and governmental organizations.
A typical report consists of more than ten pages and includes firms’ basic characteristics and financial statement information. The clients of TSR purchase the reports for various reasons; e.g. evaluating the credit worthiness of client firms, screening on transaction partners, and understanding the overall market environment.
Among the items reported in the company report, a proxy computed by TSR to summarize the performance of firms, which we call as “fscore”, is provided. We will describe this score in detail in the following section.
2.2 Data
In this section, we will go over the data we use in the present study. All data is obtained from TSR through the support of Research Institute of Economy, Trade and Industry (RIETI), which is a governmental research institute affiliated with Japanese Ministry of Economy, Trade and Industry.
2.2.1 Overview
Our main data source is a panel of Japanese firm data accounting for firms’ basic performance information (e.g., sales, number of employees, stated capital, and profit) as well as basic characteristics including company owner characteristics, precise geographic location, firm age, etc., for 2006, 2011, and 2014. For some variables (e.g. sales, profit, dividend), the data records the information in the preceding year. The data records around 800,000 firms in 2006 and reaches nearly 1,700,000 firms in 2014.
In addition to the firm-level characteristics, the dataset also includes linked firm-firm pair-level data accounting for firms’ supply chain network. As discussed in, for example, Acemoglu et al. (2015), which suggests firm-level shocks are transmitted through a network of interconnections in the economy, it is reasonable to presume that this supply chain network information has predictive power.
2.2.2 Firm Performance Indicators
We consider three firm performance indicators to be predicted: firm exit, sales growth, and profit growth. Each outcome variable is defined for two time intervals; from 2006 to 2011, and

3
2011 to 2014. We use information from 2006 to predict outcomes defined for 2006 to 2011, and information from 2011 to predict outcomes for 2011 to 2014.
Firm Exit
We define firm exit in any subsequent panel periods if firms exited the market for the following four reasons reported by TSR: bankruptcies, closure, dissolution, and suspension.
Sales Growth
To characterize firms which exhibit high sales growth relative to other firms in the same industry, we prepare a dummy variable that takes 1 if the sales growth in the subsequent panel periods exceeds the average plus one standard deviation within the same 2-digit industry.
Profit Growth
We prepare a dummy variable that takes 1 if the profit growth in the subsequent panel periods exceeds the average plus one standard deviation within the same 2-digit industry. In this analysis, we restrict our data to firms which realize positive profits.
2.2.3 Predictors
We use four categories of predictors to predict the firm performance measures described in the previous subsection: (1) the score constructed by TSR (fscore), (2) firms’ own characteristics, (3) geography and industry-related variables, and (4) supply-chain network related variables. Here we overview the variables categorized in each group below. The Appendix 1 describes the full list of variables.
(1) Solvency Score
The score (fscore) takes values between 0 and 100. The number is computed as the sum of the four sub-scores accounting for (i) the ability of owner (max: 20 points) based on the business attitude, experience, their asset condition, and so on, (ii) the growth possibility (max: 25 points) based on past sales growth, the growth of profit, the characteristics of products, and so on, (iii) stability (max: 45 points) based on firm age, stated-capital, financial statement information, room of collateral provision, real and financial transaction relationships, and so on, and (iv) reputation (max 10 points) based on the level of disclosure and overall reputation. We only have access to the fscore, but not the decomposition of each component. The variable should reflect some of the predictors we use in this analysis, but not necessarily all since we do not have the full information that TSR obtains (e.g. detailed financial statements and “soft” information from the interviews).
TSR guidelines provide the following categorization of fscore ranges: a. caution required (scores 29 and under), b. medium caution required (scores between 30 and 49), c. little caution required (scores between 50 and 64), d. no specific concern (scores between 65 and 79), and e. no concern at all for scores 80 and above. We should note that while the categorization exists, the score is highly concentrated around 50 (as shown in Table 1). This implies that there could be large room for the score to be improved for the purpose of accurate prediction of firm performance.

4
(2) Own-Firm Characteristics
As predictors accounting for firms’ own characteristics, we use the information stored in financial statements and firms’ attributes. The former consists of firm size measured by their sales and its change, their profit (loss or not) and its change, the number of employees, their stated capital, and the status of dividend payment and its change. The latter consists of firm age, owner age, the number of establishments, and their listed status.
(3) Industry and Geographic Information
As predictors accounting for the industry and area which firms belong to, we set up the following two groups of variables. First, we construct the two variables measuring the average sales growth of firms located in the same city as the targeted (i.e., we compute a score for) firms as well as the average sales growth of firms belonging to the same industry classified in the 2-digit level. Second, we also employ dummy variables representing the 2-digit industry classification as well as dummy variables representing the large classification used in Japan Standard Industry Classification.
(4) Supply-Chain Linkage Information
As predictors accounting for the supply chain network, we construct the following two groups of variables. First, we compute widely used network metrics for each firm by using the supply chain network information. The metrics consist of degree centrality, eigenvector centrality, egonet eigenvalue, co-transaction, and the number of direct (i.e., customers and suppliers) and indirect (i.e., suppliers’ suppliers, suppliers’ customers, customers’ customers, and customers’ suppliers) transaction partners. Second, we construct a large number of variables accounting for the characteristics of transaction partners. To summarize this information, we employ an average, maximum, minimum and the sum of various attributes associated with transaction partners. Note that while the network metrics cover both the direct and indirect transaction partners, the transaction partners’ characteristics only consider the direct transaction partners.
Regarding the extant studies using the same dataset as ours and focusing on the economic implication of supply chain network structure, Fu and Ogura (2017) reports that the sensitivity of lending rate with respect to the score is lower for the firms more closely connected to other firms. Their finding implies that position in the supply chain network represents additional information to firms’ own characteristics. Also, focusing on the economic implication of the exogenous change in transaction partners’ characteristics, Calvalho et al. (2016) finds that the damage due to a natural disaster to transaction partners causes a reduction in the sales of firms transacting with the damaged firms. Their finding implies that the characteristics of transaction partners contain information useful for the purpose of evaluating the performance of firms. These extant studies share a motivation to examine the economic implication of the information embedded in the supply chain network with the present study. Nonetheless, the largest difference between the present study and them lies in the fact that we aim at incorporating such information for predicting firm performance. Using a machine leaning method, which has not been extensively used in the economics literature, we explicitly compare the relative importance of those additional variables.
3 Method
We utilize state-of-the-art machine learning methods for developing our prediction model. Our particular problem of predicting relatively rare firm exit events (which occur with 7%

5
probability) falls in to the class of “imbalanced label prediction” tasks in computer science. Following the literature, we apply weighted random forest, a minority-class oversampling method.
3.1 Weighted Random Forest
Random forests models aggregate many individual decision tree models, each trained on a randomly selected sample from the training data. Particularly for predicting rare events, Chen et al. (2004) develop an extension of random forest, called weighted random forest. Intuitively, the method weighs data corresponding to minority event (e.g. exit) much more heavily than that corresponding to the majority event (e.g. non-exit).
3.2 Variable Selection
For the purpose of increasing the out-of-sample predictive performance of our models, we utilize Lasso variable selection for removing noisy variables not contributing to predictive performance. We select variables for each outcome variable.
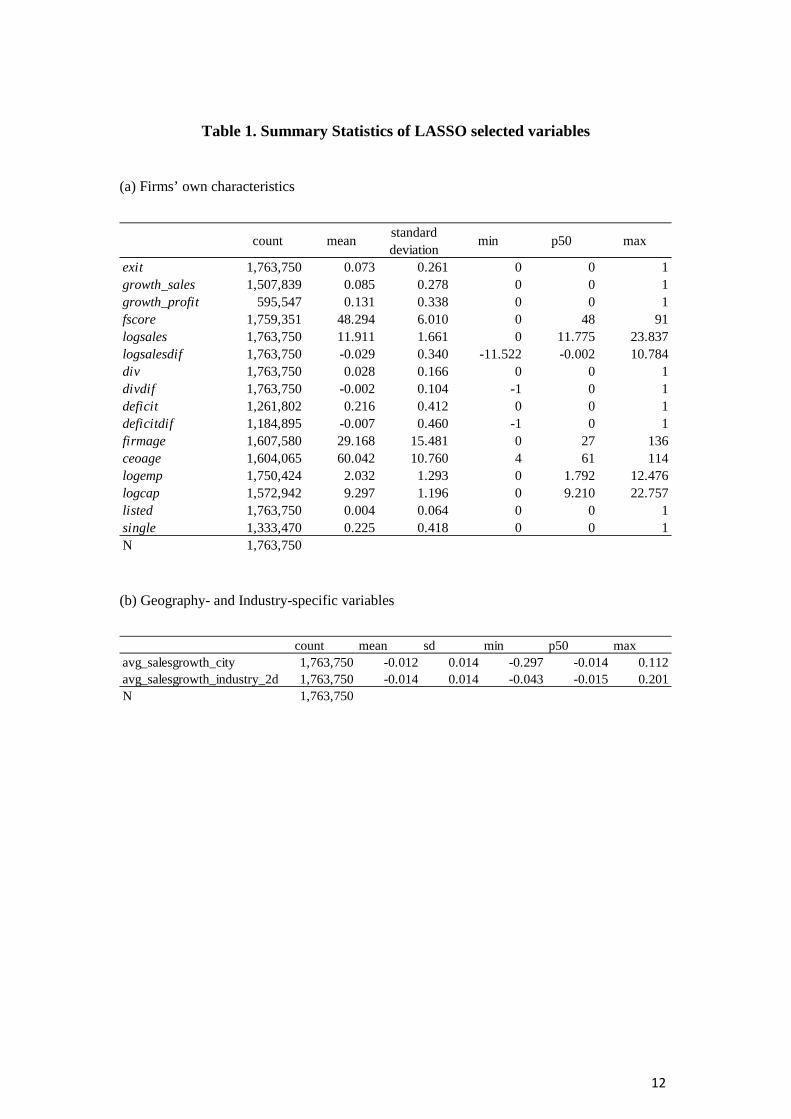
The Appendix 2 describes the list of variables selected through Lasso. The three panels of Table 1 show the summary statistics of all the selected variables in the three categories (i.e., firms’ own characteristics, geography- and industry-specific variables, and network variables).
3.3 Measuring Prediction Performance
In our baseline exercise, we train models with the realization of outcome variables from 2006 to 2011 using the information available at 2006, and conduct out-of-sample prediction of the realization of outcome variables from 2011 to 2014 using the information available at 2011.
We utilize the ROC curve to evaluate the predictive performance of the model. Our tasks of binary exit, growth, and profit growth classification require the setting of thresholds for which predicted probabilities surpassing this level will indicate a positive binary outcome. Given a fixed model, the ROC curve plots the true and false positive rates corresponding to the varying of this threshold value. Without any predictors (i.e. random guess), the curve should trace the 45-degree line, and curves closer to the top-left corner are desirable (maximize true positive rate and minimize false positive rate). With this motivation, it is conventional to also summarize the ROC curve by the area under the curve, called AUC.
In addition to evaluating performance over different threshold values to observe the trade-off between true and false positive rates, we find it useful to compare true positive rates fixing the threshold value corresponding to the realized proportion of events (i.e. exit, high sales growth and profit growth). This threshold choice provides a practical exposition of this model comparison.
4 Results
Figure 1 shows the four ROC curves in the case of exit prediction. We evaluate four models. The first model uses only fscore while the second model additionally contains firms’ own characteristics selected as predictors. The third model further includes the geography- and industry-specific variables selected as predictors. The fourth model includes all the selected variables including the ones in network variables. All ROC curves are based on the out-of-
6
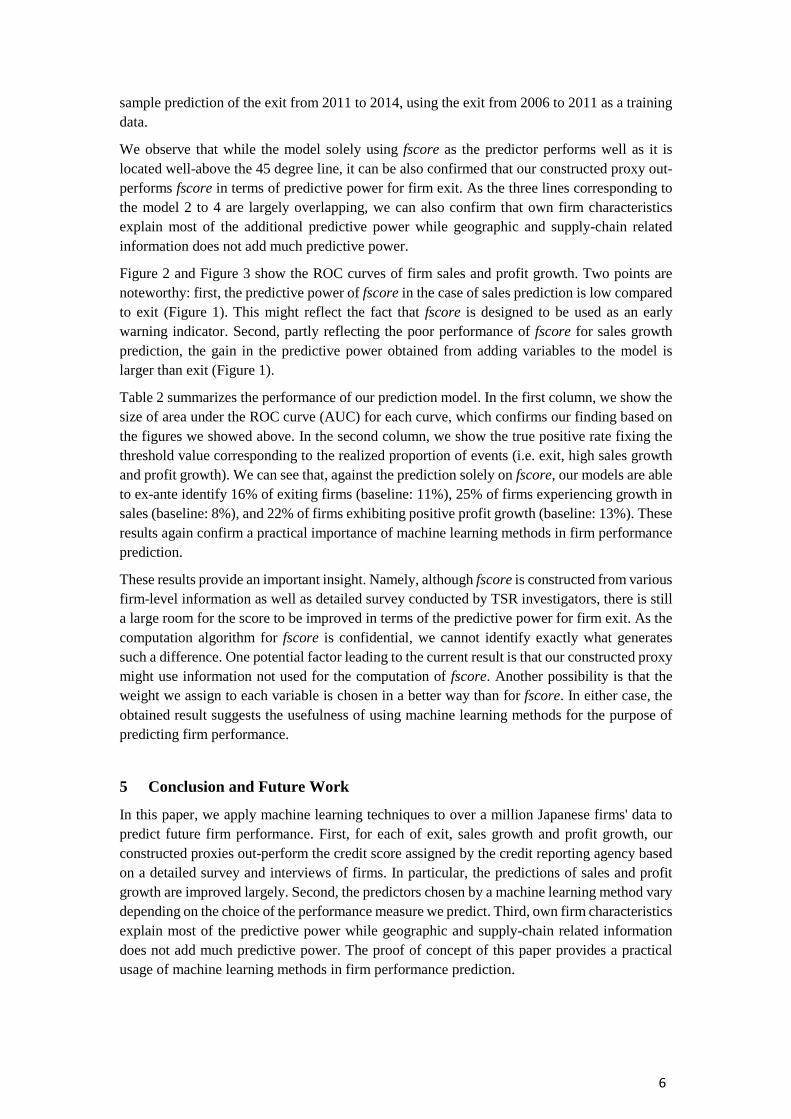
sample prediction of the exit from 2011 to 2014, using the exit from 2006 to 2011 as a training data.
We observe that while the model solely using fscore as the predictor performs well as it is located well-above the 45 degree line, it can be also confirmed that our constructed proxy out-performs fscore in terms of predictive power for firm exit. As the three lines corresponding to the model 2 to 4 are largely overlapping, we can also confirm that own firm characteristics explain most of the additional predictive power while geographic and supply-chain related information does not add much predictive power.
Figure 2 and Figure 3 show the ROC curves of firm sales and profit growth. Two points are noteworthy: first, the predictive power of fscore in the case of sales prediction is low compared to exit (Figure 1). This might reflect the fact that fscore is designed to be used as an early warning indicator. Second, partly reflecting the poor performance of fscore for sales growth prediction, the gain in the predictive power obtained from adding variables to the model is larger than exit (Figure 1).
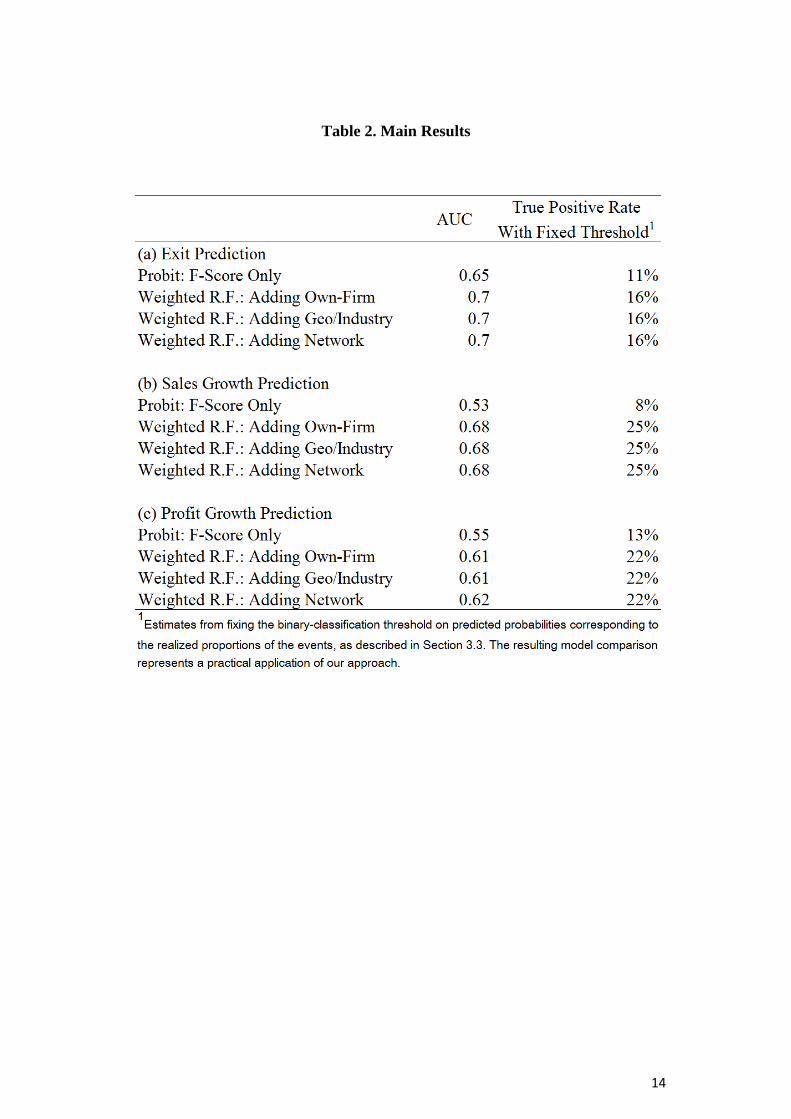
Table 2 summarizes the performance of our prediction model. In the first column, we show the size of area under the ROC curve (AUC) for each curve, which confirms our finding based on the figures we showed above. In the second column, we show the true positive rate fixing the threshold value corresponding to the realized proportion of events (i.e. exit, high sales growth and profit growth). We can see that, against the prediction solely on fscore, our models are able to ex-ante identify 16% of exiting firms (baseline: 11%), 25% of firms experiencing growth in sales (baseline: 8%), and 22% of firms exhibiting positive profit growth (baseline: 13%). These results again confirm a practical importance of machine learning methods in firm performance prediction.
These results provide an important insight. Namely, although fscore is constructed from various firm-level information as well as detailed survey conducted by TSR investigators, there is still a large room for the score to be improved in terms of the predictive power for firm exit. As the computation algorithm for fscore is confidential, we cannot identify exactly what generates such a difference. One potential factor leading to the current result is that our constructed proxy might use information not used for the computation of fscore. Another possibility is that the weight we assign to each variable is chosen in a better way than for fscore. In either case, the obtained result suggests the usefulness of using machine learning methods for the purpose of predicting firm performance.
5 Conclusion and Future Work
In this paper, we apply machine learning techniques to over a million Japanese firms' data to predict future firm performance. First, for each of exit, sales growth and profit growth, our constructed proxies out-perform the credit score assigned by the credit reporting agency based on a detailed survey and interviews of firms. In particular, the predictions of sales and profit growth are improved largely. Second, the predictors chosen by a machine learning method vary depending on the choice of the performance measure we predict. Third, own firm characteristics explain most of the predictive power while geographic and supply-chain related information does not add much predictive power. The proof of concept of this paper provides a practical usage of machine learning methods in firm performance prediction.

7
The analysis in the present study could be expanded toward various directions. First, we are planning to implement the “true” out-of-sample test using more recent firm performance data (e.g., exit after 2014). This additional analysis allows us to rigorously test our models by committing ourselves to only information currently available to us. Second, we can use more detailed network-related and accounting information to further improve our models. This is inspired by recent studies such as Acemoglu et al. (2015) which discuss the economic implications of geographical and supply chain network information.

8
References
Acemoglu, D., U. Akcigit, and W. Kerr. 2015. Networks and the Macroeconomy: An Empirical Exploration. Working paper.
Carvalho, V. M., M. Nirei, Y. U. Saito, A. Tahbaz-Salehi. 2016. Supply Chain Disruptions: Evidence from the Great East Japan Earthquake. Working paper.
Fu, J., and Y. Ogura. 2017. Product Network Connectivity and Information for Loan Pricing. RIETI Discussion Paper Series 17-E-028.
Chen C, Liaw A, Breiman L. 2004. Using Random Forest to Learn Imbalanced Data. Technical Report 666 Statistics Department of Univeristy of California at Berkley.

9
Figures and Tables
Figure 1. ROC curve for Exit Prediction

10
Figure 2. ROC curve for Sales Growth Prediction

11
Figure 3. ROC curve for Profit Growth Prediction
12
Table 1. Summary Statistics of LASSO selected variables
(a) Firms’ own characteristics
(b) Geography- and Industry-specific variables
count mean standarddeviation
min p50 max
exit 1,763,750 0.073 0.261 0 0 1growth_sales 1,507,839 0.085 0.278 0 0 1growth_profit 595,547 0.131 0.338 0 0 1fscore 1,759,351 48.294 6.010 0 48 91logsales 1,763,750 11.911 1.661 0 11.775 23.837logsalesdif 1,763,750 -0.029 0.340 -11.522 -0.002 10.784div 1,763,750 0.028 0.166 0 0 1divdif 1,763,750 -0.002 0.104 -1 0 1deficit 1,261,802 0.216 0.412 0 0 1deficitdif 1,184,895 -0.007 0.460 -1 0 1firmage 1,607,580 29.168 15.481 0 27 136ceoage 1,604,065 60.042 10.760 4 61 114logemp 1,750,424 2.032 1.293 0 1.792 12.476logcap 1,572,942 9.297 1.196 0 9.210 22.757listed 1,763,750 0.004 0.064 0 0 1single 1,333,470 0.225 0.418 0 0 1N 1,763,750
count mean sd min p50 maxavg_salesgrowth_city 1,763,750 -0.012 0.014 -0.297 -0.014 0.112avg_salesgrowth_industry_2d 1,763,750 -0.014 0.014 -0.043 -0.015 0.201N 1,763,750

13
(b) Geography- and Industry-specific variables
count mean sd min p50 maxnsup 1,419,014 5.288 31.644 1 3 7227ncus 1,294,124 5.944 32.285 1 3 10734nsup_supmean 1,366,741 138.142 412.791 1 22 7475nsup_cusmean 1,294,124 332.976 818.372 1 40.5 7926ncus_supmean 1,419,014 339.283 838.762 1 61 12057ncus_cusmean 1,209,472 145.222 434.513 1 16.5 12057logsalesdif_supmean 1,402,188 -0.013 0.211 -7.237 -0.010 10.341logsalesdif_cusmean 1,244,852 -0.021 0.232 -7.896 -0.014 10.341deficit_supmean 1,349,303 0.186 0.289 0 0 1deficit_cusmean 1,202,640 0.185 0.280 0 0 1deficit_supmin 1,349,303 0.071 0.257 0 0 1deficitdif_cusmean 1,189,406 -0.029 0.338 -1 0 1listed_supmin 1,419,014 0.037 0.190 0 0 1listed_cusmean 1,294,124 0.159 0.276 0 0 1div_cusmean 1,254,725 0.150 0.295 0 0 1logsalesdif_cusmax 1,244,852 0.173 0.446 -7.896 0.083 10.784logsalesdif_cusmin 1,244,852 -0.213 0.411 -10.973 -0.118 10.341logsalesdif_supmin 1,402,188 -0.172 0.356 -10.439 -0.095 10.341deficitdif_cusmax 1,189,406 0.246 0.519 -1 0 1div_supmax 1,414,127 0.271 0.445 0 0 1div_cusmax 1,254,725 0.261 0.439 0 0 1divdif_supmean 1,414,127 -0.018 0.144 -1 0 1divdif_supmin 1,414,127 -0.107 0.320 -1 0 1listed_cusmax 1,294,124 0.360 0.480 0 0 1listed_cusmin 1,294,124 0.056 0.229 0 0 1single_supmean 1,346,608 0.146 0.256 0 0 1N 1,728,428
14
Table 2. Main Results
15
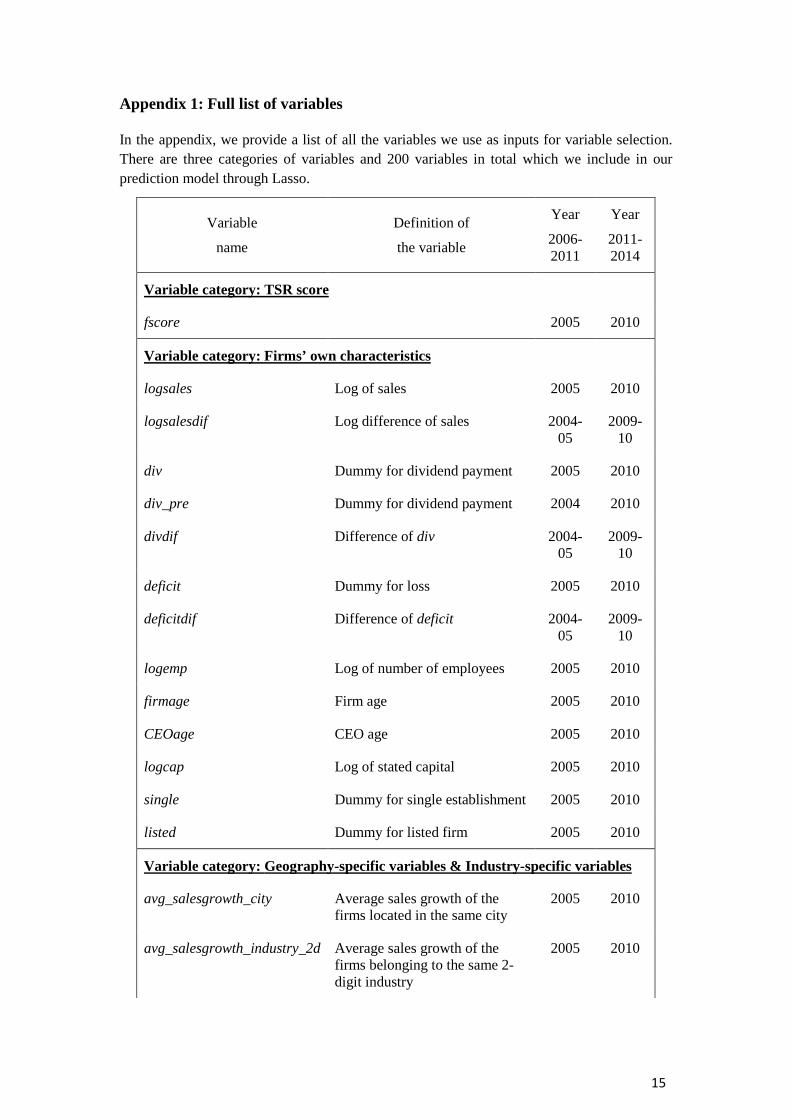
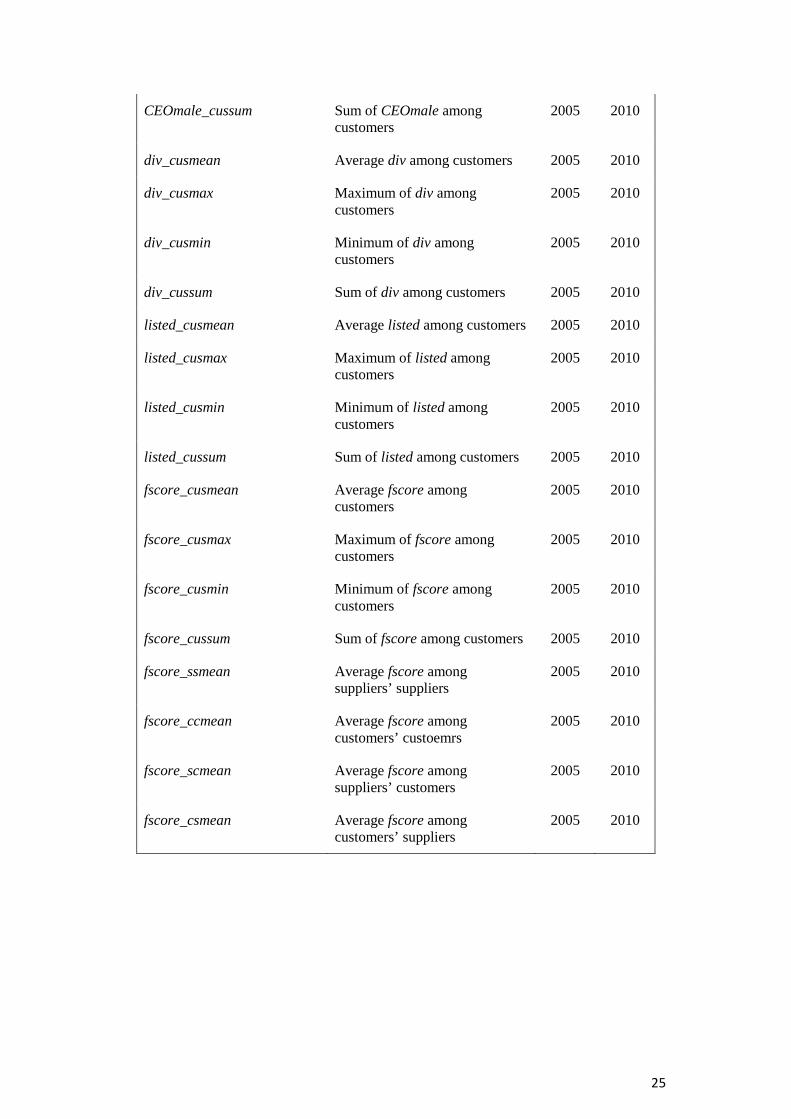
Appendix 1: Full list of variables
In the appendix, we provide a list of all the variables we use as inputs for variable selection. There are three categories of variables and 200 variables in total which we include in our prediction model through Lasso.
Variable
name
Definition of
the variable
Year
2006-2011
Year
2011-2014
Variable category: TSR score
fscore 2005 2010
Variable category: Firms’ own characteristics
logsales Log of sales 2005 2010
logsalesdif Log difference of sales 2004-05
2009-10
div Dummy for dividend payment 2005 2010
div_pre Dummy for dividend payment 2004 2010
divdif Difference of div 2004-05
2009-10
deficit Dummy for loss 2005 2010
deficitdif Difference of deficit 2004-05
2009-10
logemp Log of number of employees 2005 2010
firmage Firm age 2005 2010
CEOage CEO age 2005 2010
logcap Log of stated capital 2005 2010
single Dummy for single establishment 2005 2010
listed Dummy for listed firm 2005 2010
Variable category: Geography-specific variables & Industry-specific variables
avg_salesgrowth_city Average sales growth of the firms located in the same city
2005 2010
avg_salesgrowth_industry_2d Average sales growth of the firms belonging to the same 2-digit industry
2005 2010

16
ind_code_2d Dummy variable associated with 2-digit industry code
2005 2010
ind_code_L Dummy variable associated with a large classification used in Japan Standard Industry Classification
2005 2010
logsalesdif2 Log difference of sales 2004-05
2009-10
Variable category: Network characteristics associated with supply chain network & Transaction partners’ information
d_centrality Degree centrality 2005 2010
ev_centrality Eigen vector centrality 2005 2010
egonet_evalue Egonet eigenvalue 2005 2010
cotransaction Co-transaction 2005 2010
nsup Number of direct suppliers 2005 2010
ncus Number of direct customers 2005 2010
ncus_supmean Average number of suppliers’ customers
2005 2010
ncus_supmax Maximum number of suppliers’ customers
2005 2010
ncus_supmin Minimum number of suppliers’ customers
2005 2010
ncus_supsum Total number of suppliers’ customers
2005 2010
nsup_supmean Average number of suppliers’ suppliers
2005 2010
nsup_supmax Maximum number of suppliers’ suppliers
2005 2010
nsup_supmin Minimum number of suppliers’ suppliers
2005 2010
nsup_supsum Total number of suppliers’ suppliers
2005 2010
single_supmean Average of single over direct suppliers
2005 2010
single_supmax Maximum of single over direct suppliers
2005 2010

17
single_supmin Minimum of single over direct suppliers
2005 2010
single_supsum Sum of single over direct suppliers
2005 2010
logcap_supmean Average of logcap over direct suppliers
2005 2010
logcap_supmax Maximum of logcap over direct suppliers
2005 2010
logcap_supmin Minimum of logcap over direct suppliers
2005 2010
logcap_supsum Sum of logcap over direct suppliers
2005 2010
CEOage_supmean Average of CEOage over direct suppliers
2005 2010
CEOage_supmax Maximum of CEOage over direct suppliers
2005 2010
CEOage_supmin Minimum of CEOage over direct suppliers
2005 2010
CEOage_supsum Sum of CEOage over direct suppliers
2005 2010
logprofitdif_2_supmean Average log difference of profit among suppliers
2003-04
logprofitdif_2_supmax Maximum of log difference of profit among suppliers
2003-04
logprofitdif_2_supmin Minimum of log difference of profit among suppliers
2003-04
logprofitdif_2_supsum Sum of log difference of profit among suppliers
2003-04
logprofitdif_supmean Average log difference of profit among suppliers
2004-05
2009-10
logprofitdif_supmax Maximum of log difference of profit among suppliers
2004-05
2009-10
logprofitdif_supmin Minimum of log difference of profit among suppliers
2004-05
2009-10
logprofitdif_supsum Sum of log difference of profit among suppliers
2004-05
2009-10

18
deficitdif_pre_supmean Average of deficitdif among suppliers
2003-04
deficitdif_pre_supmax Maximum of deficitdif among suppliers
2003-04
deficitdif_pre_supmin Minnimum of deficitdif among suppliers
2003-04
deficitdif_pre_supsum Sum of deficitdif among suppliers
2003-04
deficitdif_supmean Average of deficitdif among suppliers
2004-05
2009-10
deficitdif_supmax Maximum of deficitdif among suppliers
2004-05
2009-10
deficitdif_supmin Minimum of deficitdif among suppliers
2004-05
2009-10
deficitdif_supsum Sum of deficitdif among suppliers
2004-05
2009-10
deficit_supmean Average of deficit among suppliers
2005 2010
deficit_supmax Maximum of deficit among suppliers
2005 2010
deficit_supmin Minimum of deficit among suppliers
2005 2010
deficit_supsum Sum of deficit among suppliers 2005 2010
logemp_supmean Average logemp among suppliers
2005 2010
logemp_supmax Maximum of logemp among suppliers
2005 2010
logemp_supmin Minimum of logemp among suppliers
2005 2010
logemp_supsum Sum of logemp among suppliers 2005 2010
divdif_pre_supmean Average divdif among suppliers 2003-04
divdif_pre_supmax Maximum of divdif among suppliers
2003-04
divdif_pre_supmin Minimum of divdif among suppliers
2003-04

19
divdif_pre_supsum Sum of divdif among suppliers 2003-04
divdif_supmean Average divdif among suppliers 2004-05
2009-10
divdif_supmax Maximum of divdif among suppliers
2004-05
2009-10
divdif_supmin Minimum of divdif among suppliers
2004-05
2009-10
divdif_supsum Sum of divdif among suppliers 2004-05
2009-10
logsalesdif_2_supmean Average of logsalesdif among suppliers
2003-04
logsalesdif_2_supmax Maximum of logsalesdif among suppliers
2003-04
logsalesdif_2_supmin Minimum of logsalesdif among suppliers
2003-04
logsalesdif_2_supsum Sum of logsalesdif among suppliers
2003-04
logsalesdif_supmean Average of logsalesdif among suppliers
2004-05
2009-10
logsalesdif_supmax Maximum of logsalesdif among suppliers
2004-05
2009-10
logsalesdif_supmin Minimum of logsalesdif among suppliers
2004-05
2009-10
logsalesdif_supsum Sum of logsalesdif among suppliers
2004-05
2009-10
logsales_supmean Average of logsales among suppliers
2005 2010
logsales_supmax Maximum of logsales among suppliers
2005 2010
logsales_supmin Minimum of logsales among suppliers
2005 2010
logsales_supsum Sum of logsales among suppliers
2005 2010
firmage_supmean Average firmage among suppliers
2005 2010

20
firmage_supmax Maximum of firmage among suppliers
2005 2010
firmage_supmin Minimum of firmage among suppliers
2005 2010
firmage_supsum Sum of firmage among suppliers 2005 2010
CEOmale_supmean Average CEOmale among suppliers
2005 2010
CEOmale_supmax Maximum of CEOmale among suppliers
2005 2010
CEOmale_supmin Minimum of CEOmale among suppliers
2005 2010
CEOmale_supsum Sum of CEOmale among suppliers
2005 2010
div_supmean Average div among suppliers 2005 2010
div_supmax Maximum of div among suppliers
2005 2010
div_supmin Minimum of div among suppliers
2005 2010
div_supsum Sum of div among suppliers 2005 2010
listed_supmean Average listed among suppliers 2005 2010
listed_supmax Maximum of listed among suppliers
2005 2010
listed_supmin Minimum of listed among suppliers
2005 2010
listed_supsum Sum of listed among suppliers 2005 2010
fscore_supmean Average fscore among suppliers 2005 2010
fscore_supmax Maximum of fscore among suppliers
2005 2010
fscore_supmin Minimum of fscore among suppliers
2005 2010
fscore_supsum Sum of fscore among suppliers 2005 2010
ncus_cusmean Average number of customer’ customers
2005 2010
ncus_cusmax Maximum number of customer’ customers
2005 2010

21
ncus_cusmin Minimum number of customer’ customers
2005 2010
ncus_cussum Total number of customer’ customers
2005 2010
nsup_cusmean Average number of customer’ suppliers
2005 2010
nsup_cusmax Maximum number of customer’ suppliers
2005 2010
nsup_cusmin Minimum number of customer’ suppliers
2005 2010
nsup_cussum Total number of customer’ suppliers
2005 2010
positive_growth_cusmean Average positive_growth among customers
2004-05
2009-10
positive_growth_cusmax Maximum positive_growth among customers
2004-05
2009-10
positive_growth_cusmin Minimum positive_growth among customers
2004-05
2009-10
positive_growth_cussum Sum of positive_growth among customers
2004-05
2009-10
single_cusmean Average of single over direct customers
2005 2010
single_cusmax Maximum of single over direct customers
2005 2010
single_cusmin Minimum of single over direct customers
2005 2010
single_cussum Sum of single over direct customers
2005 2010
logcap_cusmean Average of logcap over direct customers
2005 2010
logcap_cusmax Maximum of logcap over direct customers
2005 2010
logcap_cusmin Minimum of logcap over direct customers
2005 2010
logcap_cussum Sum of logcap over direct customers
2005 2010

22
CEOage_cusmean Average of CEOage over direct customers
2005 2010
CEOage_cusmax Maximum of CEOage over direct customers
2005 2010
CEOage_cusmin Minimum of CEOage over direct customers
2005 2010
CEOage_cussum Sum of CEOage over direct customers
2005 2010
logprofitdif_2_cusmean Average log difference of profit among customers
2003-04
2010
logprofitdif_2_cusmax Maximum of log difference of profit among customers
2003-04
2010
logprofitdif_2_cusmin Minimum of log difference of profit among customers
2003-04
2010
logprofitdif_2_cussum Sum of log difference of profit among customers
2003-04
2010
logprofitdif_cusmean Average log difference of profit among customers
2004-05
2009-10
logprofitdif_cusmax Maximum of log difference of profit among customers
2004-05
2009-10
logprofitdif_cusmin Minimum of log difference of profit among customers
2004-05
2009-10
logprofitdif_cussum Sum of log difference of profit among customers
2004-05
2009-10
deficitdif_pre_cusmean Average of deficitdif among customers
2003-04
deficitdif_pre_cusmax Maximum of deficitdif among customers
2003-04
deficitdif_pre_cusmin Minnimum of deficitdif among customers
2003-04
deficitdif_pre_cussum Sum of deficitdif among customers
2003-04
deficitdif_cusmean Average of deficitdif among customers
2004-05
2009-10
deficitdif_cusmax Maximum of deficitdif among customers
2004-05
2009-10

23
deficitdif_cusmin Minimum of deficitdif among customers
2004-05
2009-10
deficitdif_cussum Sum of deficitdif among customers
2004-05
2009-10
deficit_cusmean Average of deficit among customers
2005 2010
deficit_cusmax Maximum of deficit among customers
2005 2010
deficit_cusmin Minimum of deficit among customers
2005 2010
deficit_cussum Sum of deficit among customers 2005 2010
logemp_cusmean Average logemp among customers
2005 2010
logemp_cusmax Maximum of logemp among customers
2005 2010
logemp_cusmin Minimum of logemp among customers
2005 2010
logemp_cussum Sum of logemp among customers
2005 2010
divdif_pre_cusmean Average divdif among customers 2003-04
divdif_pre_cusmax Maximum of divdif among customers
2003-04
divdif_pre_cusmin Minimum of divdif among customers
2003-04
divdif_pre_cussum Sum of divdif among customers 2003-04
divdif_cusmean Average divdif among customers 2004-05
2009-10
divdif_cusmax Maximum of divdif among customers
2004-05
2009-10
divdif_cusmin Minimum of divdif among customers
2004-05
2009-10
divdif_cussum Sum of divdif among customers 2004-05
2009-10
logsalesdif_2_cusmean Average of logsalesdif among customers
2003-04

24
logsalesdif_2_cusmax Maximum of logsalesdif among customers
2003-04
logsalesdif_2_cusmin Minimum of logsalesdif among customers
2003-04
logsalesdif_2_cussum Sum of logsalesdif among customers
2003-04
logsalesdif_cusmean Average of logsalesdif among customers
2004-05
2009-10
logsalesdif_cusmax Maximum of logsalesdif among customers
2004-05
2009-10
logsalesdif_cusmin Minimum of logsalesdif among customers
2004-05
2009-10
logsalesdif_cussum Sum of logsalesdif among customers
2004-05
2009-10
logsales_cusmean Average of logsales among customers
2005 2010
logsales_cusmax Maximum of logsales among customers
2005 2010
logsales_cusmin Minimum of logsales among customers
2005 2010
logsales_cussum Sum of logsales among customers
2005 2010
firmage_cusmean Average firmage among customers
2005 2010
firmage_cusmax Maximum of firmage among customers
2005 2010
firmage_cusmin Minimum of firmage among customers
2005 2010
firmage_cussum Sum of firmage among customers
2005 2010
CEOmale_cusmean Average CEOmale among customers
2005 2010
CEOmale_cusmax Maximum of CEOmale among customers
2005 2010
CEOmale_cusmin Minimum of CEOmale among customers
2005 2010
25
CEOmale_cussum Sum of CEOmale among customers
2005 2010
div_cusmean Average div among customers 2005 2010
div_cusmax Maximum of div among customers
2005 2010
div_cusmin Minimum of div among customers
2005 2010
div_cussum Sum of div among customers 2005 2010
listed_cusmean Average listed among customers 2005 2010
listed_cusmax Maximum of listed among customers
2005 2010
listed_cusmin Minimum of listed among customers
2005 2010
listed_cussum Sum of listed among customers 2005 2010
fscore_cusmean Average fscore among customers
2005 2010
fscore_cusmax Maximum of fscore among customers
2005 2010
fscore_cusmin Minimum of fscore among customers
2005 2010
fscore_cussum Sum of fscore among customers 2005 2010
fscore_ssmean Average fscore among suppliers’ suppliers
2005 2010
fscore_ccmean Average fscore among customers’ custoemrs
2005 2010
fscore_scmean Average fscore among suppliers’ customers
2005 2010
fscore_csmean Average fscore among customers’ suppliers
2005 2010

26
Appendix 2: List of selected variables
In the appendix, we provide a list of the variables selected through Lasso.
Variable name
Variable category: Firms’ own characteristics for exit, sales growth, and profit growth
logsales, logsalesdif, div, divdif, deficit, difcitdif, firmage, CEOage, logemp, logcap, listed, single.
Variable category: Geography-specific variables & Industry-specific variables for exit, sales growth, and profit growth
avg_salesgrowth_city, avg_salesgrowth_industry_2d.
Variable category: Network characteristics associated with supply chain network & Transaction partners’ information for exit
nsup, ncus, nsup_supmean, nsup_cusmean, ncus_supmean, ncus_cusmean, logsalesdif_supmean, logsalesdif_cusmean.
Variable category: Network characteristics associated with supply chain network & Transaction partners’ information for sales growth
logsalesdif_supmean, deficit_supmean, deficit_cusmean, deficitdif_supmin, deficitdif_cusmean, listed_supmin, listed_cusmean, div_cusmean.
Variable category: Network characteristics associated with supply chain network & Transaction partners’ information for profit growth
deficit_supmean, deficit_cusmean, listed_supmin, and listed_cusmean, logsalesdif_cusmax, logsalesdif_cusmin, logsalesdif_supmin, deficitdif_cusmax, div_supmax, div_cusmax, divdif_supmean, divdif_supmin, listed_cusmax, listed_cusmin, single_supmean.