Ford Study Year One Update
16
Ford Study Year One Update
-
Upload
griffin-le -
Category
Documents
-
view
17 -
download
0
description
Ford Study Year One Update. ULSD (96000, #105681, Brian, Mason City). Soy B20 (96001, #105679, Steve, Des Moines). Tallow B20 (95999, #105680, Larry, Carroll). No significant differences exist between the baseline and test MPG for any of the three trucks. - PowerPoint PPT Presentation
Transcript of Ford Study Year One Update

Ford Study Year One Update


Efficiency (MPG) S. D. n
Baseline 19.65 0.42 8
Test only 19.41 0.81 43
Combined 19.45 0.76 51
ULSD (96000, #105681, Brian, Mason City)
Efficiency (MPG) S. D. n
Baseline 19.91 0.69 7
Test only 19.84 1.00 39
Combined 19.85 0.96 46
Efficiency (MPG) S. D. n
Baseline 20.36 1.72 6
Test only 19.52 0.71 42
Combined 19.63 0.91 48
Soy B20 (96001, #105679, Steve, Des Moines)
Tallow B20 (95999, #105680, Larry, Carroll)

• No significant differences exist between the baseline and test MPG for any of the three trucks.
• No significant differences exist for the composite data among all three trucks.
• No significant trends exist regarding fuel efficiency as a function of temperature or duration of study, with the possible exception of the ULSD truck where the slope of the trend-line for MPG vs time (in weeks) was significantly different than zero.

Engine load as a function of temperature.Engine load generally increases as the temperature increases. No major differences are evident among the three trucks.

Unit Load (%)
S. D. n
ULSD 55.48 5.63 51
Soy 51.76 5.09 47
Tallow 54.79 5.17 48
Unit Temp (°C)
S. D. n
ULSD 12.72 10.66 51
Soy 14.90 10.75 48
Tallow 12.88 10.18 48
Average Load Average Temperature
Overlapping standard deviations suggest no real differences among the three trucks.The data suggests a trend where temperature and load are negatively correlated.

Engine load as a function of fuel efficiency.No correlation appears to exist between engine load and fuel efficiency in any of the three trucks.

Unit Efficiency(MPG)*
S. D. n
ULSD 19.45 0.76 51
Soy 19.85 0.95 46
Tallow 19.62 0.91 48
Average Load Average Fuel Efficiency
Unit Load (%)
S. D. n
ULSD 55.48 5.63 51
Soy 51.76 5.09 47
Tallow 54.79 5.17 48
Overlapping standard deviations suggest no real differences among the three trucks.*Values represent combined baseline and test data.
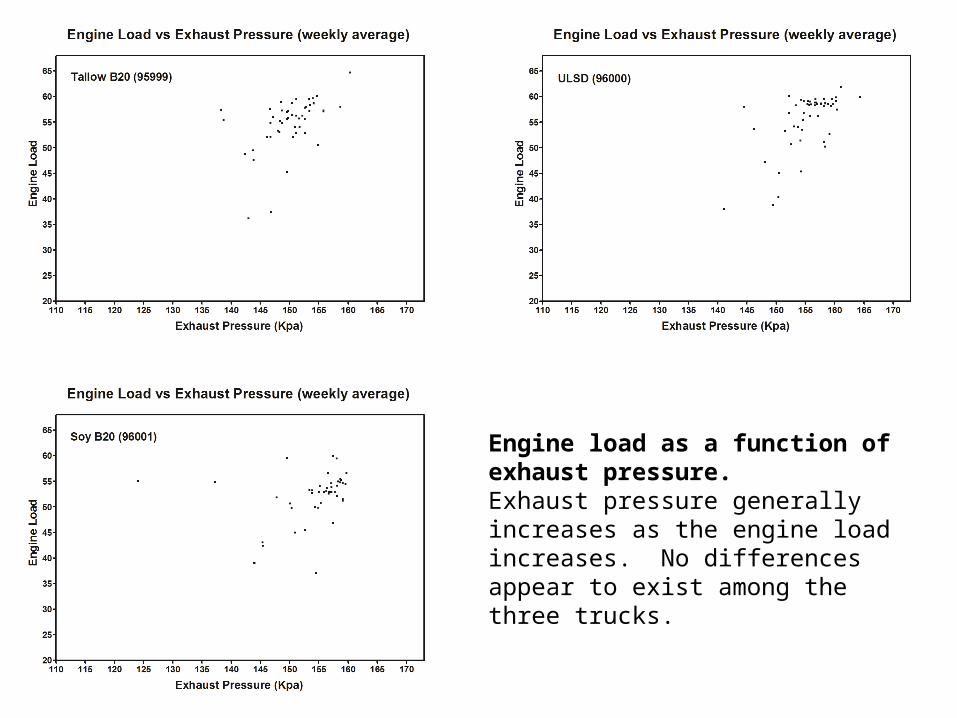
Engine load as a function of exhaust pressure.Exhaust pressure generally increases as the engine load increases. No differences appear to exist among the three trucks.

Unit Exhaust (kPa)
S. D. n
ULSD 155.4 4.35 51
Soy 153.9 6.64 47
Tallow 150.0 4.47 48
Average Load Average Exhaust Pressure
Unit Load (%)
S. D. n
ULSD 55.48 5.63 51
Soy 51.76 5.09 47
Tallow 54.79 5.17 48
Overlapping standard deviations suggest no real differences among the three trucks.The data suggest a trend where load and exhaust pressure are positively correlated.

Parameter Units Average S. D. n
% Biodiesel % 0.048 0.114 26
Ox. Stability Hr. 13.82* 1.76 13
Water/Sed. % Mass 0.012* 0.011 2
TAN Mg KOH/g 0.007 0.010 25
Cloud °C -14.22 2.61 27
ULSD Fuel Quality
*Average of tests with quantifiable results. 13 oxidation stability test results were greater than 16 hours.

Fuel Quality: B100 Stock for Soy BlendParameter Units Average S. D. n
% Biodiesel % 99.71 2.39 2
Ox. Stability Hr. 9.26 0.764 2
Water/Sed. % Mass < 0.005 -- 2
TAN Mg KOH/g 0.215 0.035 2
Cloud °C -1.0 0 2

Parameter Units Average S. D. n% Biodiesel % 19.08 0.95 4
Ox. Stability Hr. 11.77 5.98 4
Water/Sed. % Mass < 0.005 -- 4
TAN Mg KOH/g 0.050 0.016 4
Cloud °C -11.5 1.73 4
Cetane -- 45.1 -- 1
Fuel Quality: Soy B20 Supply Tank
Fuel Quality: Soy B20 External TankParameter Units Average S. D. n
% Biodiesel % 19.33 -- 1
Ox. Stability Hr. 5.75 -- 1
Water/Sed. % Mass < 0.005 -- 1
TAN Mg KOH/g 0.070 -- 1
Cloud °C -10.0 -- 1

Parameter Units Average S. D. n% Biodiesel % 1.36 -- 1
Ox. Stability Hr. 18 -- 1
Water/Sed. % Mass < 0.005 -- 1
TAN Mg KOH/g 0 -- 1
Cloud °C -14.0 -- 1
Fuel Quality: ULSD Stock for Tallow Blend
Fuel Quality: B100 Stock for Tallow BlendParameter Units Average S. D. n
% Biodiesel % 99.61 -- 1
Ox. Stability Hr. 4.2 -- 1
Water/Sed. % Mass < 0.005 -- 1
TAN Mg KOH/g 0.240 -- 1
Cloud °C 6.0 -- 1
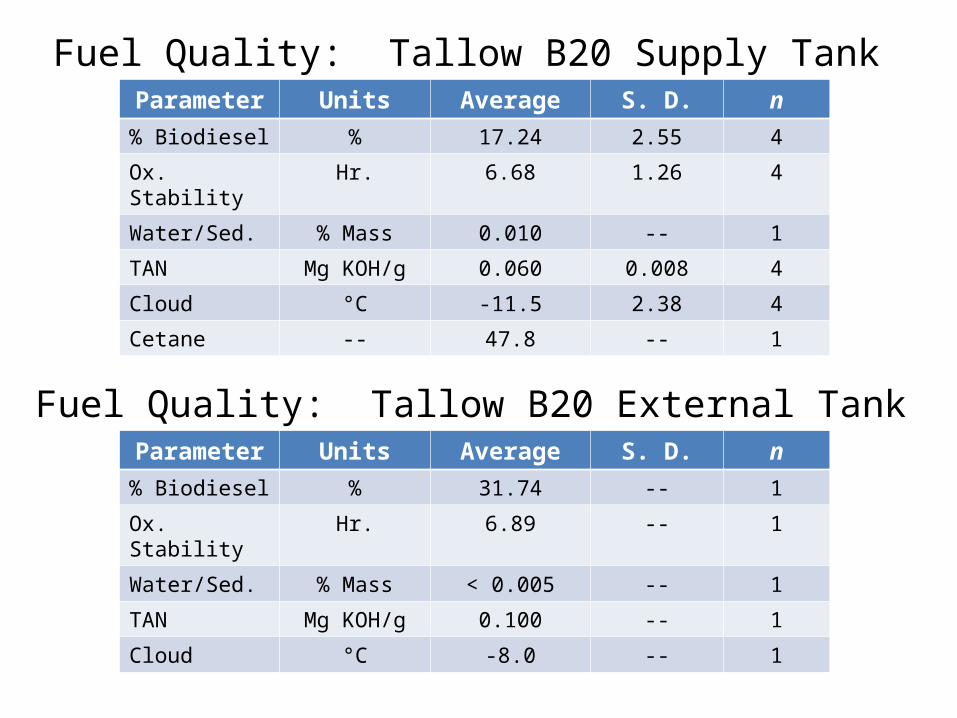
Parameter Units Average S. D. n% Biodiesel % 17.24 2.55 4
Ox. Stability Hr. 6.68 1.26 4
Water/Sed. % Mass 0.010 -- 1
TAN Mg KOH/g 0.060 0.008 4
Cloud °C -11.5 2.38 4
Cetane -- 47.8 -- 1
Fuel Quality: Tallow B20 Supply Tank
Fuel Quality: Tallow B20 External TankParameter Units Average S. D. n
% Biodiesel % 31.74 -- 1
Ox. Stability Hr. 6.89 -- 1
Water/Sed. % Mass < 0.005 -- 1
TAN Mg KOH/g 0.100 -- 1
Cloud °C -8.0 -- 1

• Conclusion: after one year, the performance of all three trucks is statistically identical.