For personal use only - ASX · Note 25 Parent Entity Information 44 Note 26 Other Accounting...
69
Pro Medicus Limited Annual Financial Report - 30 June 2018 1 Contents to Financial Report Directors’ Report 2 Auditor’s Independence Declaration 14 Statement of Comprehensive Income 15 Statement of Financial Position 16 Statement of Changes in Equity 17 Statement of Cash Flows 18 Notes to the Financial Statements 19 Note 1 Corporate Information 19 Note 2 Summary of Significant Accounting Policies 19 Note 3 Significant Accounting Judgements, Estimates and Assumptions 20 Note 4 Operating Segments 21 Note 5 Income and Expenses 23 Note 6 Income Tax 24 Note 7 Earnings per Share 26 Note 8 Dividends Paid and Proposed 27 Note 9 Cash and Cash Equivalents 27 Note 10 Trade and Other Receivables 28 Note 11 Inventory 29 Note 12 Plant and Equipment 29 Note 13 Intangible Assets 30 Note 14 Trade and Other Payables 33 Note 15 Provisions 33 Note 16 Contributed Equity and Reserves 34 Note 17 Share based Payments 35 Note 18 Commitments 38 Note 19 Events after the Balance Sheet Date 39 Note 20 Auditors’ Remuneration 39 Note 21 Key Management Personnel 39 Note 22 Related Party Disclosure 40 Note 23 Financial Risk Management Objectives and Policies 40 Note 24 Contingencies 43 Note 25 Parent Entity Information 44 Note 26 Other Accounting Policies 44 Directors’ Declaration 50 Independent Auditor’s Report 51 ASX Additional Information 58 Corporate Governance Statement 59 Corporate Information 68 For personal use only
Transcript of For personal use only - ASX · Note 25 Parent Entity Information 44 Note 26 Other Accounting...

Pro Medicus Limited
Annual Financial Report - 30 June 2018
1
Contents to Financial Report
Directors’ Report 2
Auditor’s Independence Declaration 14
Statement of Comprehensive Income 15
Statement of Financial Position 16
Statement of Changes in Equity 17
Statement of Cash Flows 18
Notes to the Financial Statements 19
Note 1 Corporate Information 19 Note 2 Summary of Significant Accounting Policies 19 Note 3 Significant Accounting Judgements, Estimates and Assumptions 20 Note 4 Operating Segments 21 Note 5 Income and Expenses 23 Note 6 Income Tax 24 Note 7 Earnings per Share 26 Note 8 Dividends Paid and Proposed 27 Note 9 Cash and Cash Equivalents 27 Note 10 Trade and Other Receivables 28 Note 11 Inventory 29 Note 12 Plant and Equipment 29 Note 13 Intangible Assets 30 Note 14 Trade and Other Payables 33 Note 15 Provisions 33 Note 16 Contributed Equity and Reserves 34 Note 17 Share based Payments 35 Note 18 Commitments 38 Note 19 Events after the Balance Sheet Date 39 Note 20 Auditors’ Remuneration 39 Note 21 Key Management Personnel 39 Note 22 Related Party Disclosure 40 Note 23 Financial Risk Management Objectives and Policies 40 Note 24 Contingencies 43 Note 25 Parent Entity Information 44 Note 26 Other Accounting Policies 44
Directors’ Declaration 50
Independent Auditor’s Report 51
ASX Additional Information 58
Corporate Governance Statement 59
Corporate Information 68
For
per
sona
l use
onl
y

Directors’ Report
2
Your Directors submit their report for the year ended 30 June 2018 in relation to Pro Medicus Limited (the “Company”) and its subsidiaries (the “Group”).
DIRECTORS
The names and details of the Company’s Directors in office during the financial year and until the date of this report are as follows:
Peter Terence Kempen AM
F.C.A, F.A.I.C.D
(Chairman)
Peter Kempen joined Pro Medicus Limited as a Director on 12 March 2008. He is Chairman of Australasian Leukaemia and Lymphoma Group. He is also a Director of the Yara Pilbara group of companies, a Trustee of the Barr Family Foundation and a member of the Council of St Hilda’s College, University of Melbourne.
Peter has previously been Chairman of Patties Food Limited, Chairman of Danks Holdings Limited, Chairman of Ivanhoe Grammar School and Managing Partner of Ernst & Young Corporate Finance Australia.
Peter is a Fellow of the Institute of Chartered Accountants in Australia and a Fellow of the Australian Institute of Company Directors. Peter was appointed a Member in the General Division of the Order of Australia (AM) in the 2018 Queen’s Birthday Honours.
Peter became Chairman in August 2010 before which he served as a Non-Executive Director of the Company.
Peter is also Chairman of the audit committee.
Dr Sam Aaron Hupert
M.B.B.S. (Managing Director and Chief Executive Officer)
Co-founder of Pro Medicus Limited in 1983, Sam Hupert is a Monash University Medical School graduate who commenced General Practice in 1980. Realising the significant potential for computers in medicine he left general practice in late 1984 to devote himself full time to managing the Group.
Sam served as CEO from the time he co-founded the company until October 2007 at which time he stepped down to become an executive director. Sam resumed full time CEO activities in October of 2010.
Anthony Barry Hall
B.Sc. (Hons), M.Sc.
(Executive Director and Technology Director)
Co-founder of Pro Medicus Limited in 1983, Anthony Hall has been principal architect and developer of the core software systems. His current focus is the transition to and development of the Company’s next generation RIS systems.
Anthony hold a Bachelor and Master’s degree in Science from La Trobe University.
Anthony James Glenning
B.CS, B.EE, M.EE (Non-Executive Director)
Anthony joined Pro Medicus Limited as a Director on 1 May 2016. He is Chairman of Cyrise Pty Ltd, an accelerator for early stage cyber security start-ups.
Anthony has previously been Investment Director of Starfish Ventures and was the founder and previously the CEO of Tonic Systems and a founding Non-Executive Director of Cameron Systems.
Anthony holds bachelor degrees in Computer Science and Electrical Engineering from University of Melbourne and holds a Master’s degree in Electrical Engineering from Stanford University California.
Anthony also serves on the audit committee.
Dr Leigh Farrell
PhD, B.Sc. (Hons), FAICD (Non-Executive Director)
Leigh joined Pro Medicus Limited as a Director on 8 September 2017. He is Senior Vice President, Commercial of Certara USA, Inc. and prior to his current position he was Chairman and COO of d3 Medicine LLC, which was acquired by Certara USA, Inc.
For
per
sona
l use
onl
y

Directors’ Report continued
3
(appointed 8 September 2017)
Leigh holds a PhD in Biochemistry and a Bachelor of Science (Honours) from Monash University.
Leigh also serves on the audit committee.
Roderick Lewis John Lyle
LL.B., B.Com, LL.M (Lond),
MBA (Melb) (Non-Executive Director)
(retired 14 November 2017)
Roderick joined Pro Medicus Limited as a Director in November 2010 and his services to the company over the past 7 years have been appreciated by staff, shareholders and Directors alike.
Roderick is the Senior Corporate Advisor in the Melbourne Office of Clayton Utz and is a former Managing Partner of that office. He joined the Board at a difficult time for the Company and played a critical role in establishing the foundations of its current success.
The Board wishes to thank Roderick for his efforts and wish him well for the future.
Company Secretary Clayton James Hatch
CPA
Clayton was appointed Company Secretary on 1 July 2009.
Clayton has strong experience in financial and management accounting having worked in a Finance role for several years. Clayton joined Pro Medicus in June 2008 and has progressed through the Company to his current position of Chief Financial Officer which he assumed on 1 July 2012.
Interests in the shares and options of the company
As at the date of this report, the interests of the Directors in the shares and options of the Company were:
Ordinary Shares
Options over Ordinary Shares
A. B. Hall 29,067,500 NIL
S. A. Hupert 29,107,660 NIL
P. T. Kempen 678,082 NIL
A. J. Glenning 4,000 NIL
L. Farrell 2,501 NIL
Earnings per share Cents
Basic earnings per share 12.35
Diluted earnings per share 12.22
Dividends
Ordinary Shares Cents $’000
Final dividends recommended:
Normal dividend plan 3.5 3,618
Dividends paid in the year:
Interim for the year 2.5 2,584
Final dividend for 2017 shown as recommended in the 2017 report:
Normal dividend plan 2.5 2,566
For
per
sona
l use
onl
y

Directors’ Report continued
4
OPERATING AND FINANCIAL REVIEW
Corporate Structure
Pro Medicus Limited is a company limited by shares that is incorporated and domiciled in Australia.
Nature of operations and principal activities
The principal activities of the Group during the year were the supply of healthcare imaging software and services to hospitals, diagnostic imaging groups and other health related entities in Australia, North America and Europe. These products and services include:
Radiology Information Systems (RIS)
Proprietary medical software for practice management (RIS); Training, installation and professional services; After sale support and service products; Promedicus.net secure email; and Integration products. Visage 7.0
Healthcare imaging software that provides radiologist and clinicians with advanced visualisation
capability for rapidly viewing 2-D, 3-D and 4-D medical images; PACS/Digital imaging software that is sold directly and to original equipment manufacturers (OEM); Training, installation and professional services; and Service and support products. The Group has continued development of both the RIS products and the Visage 7.0 product line throughout the period. The Group undertakes research and development (R&D) in Australia for its Practice Management (RIS) and promedicus.net products including R&D for Visage RIS, its new technology platform. The R&D for the Visage Imaging product set is carried out in Europe.
REVIEW AND RESULTS OF OPERATIONS
Investment Activities
Surplus funds which are held in several currencies are invested by the Group in a cash management account and term deposits to maximise the interest return.
Performance Indicators
Management and the Board monitor overall performance, from the strategic plan through to the performance of the Group against operating plans and financial budgets.
The Board, together with management, have identified key performance indicators (KPIs) that are used to monitor performance. Key management monitor these KPIs on a regular basis and Directors receive appropriately structured board reports for review prior to each monthly Board meeting allowing them to actively monitor the Group’s performance.
Dynamics of the Business
Australia
The Group’s Australian employees undertake research and development of Pro Medicus products (RIS) as well as sales and service/support functions. The Group’s Australian revenue was in line with the previous year (down 2.0%). The rollout of the Healthcare Imaging (Primary) contract announced in March 2017 commenced during the period. In May 2018, the company announced a major extension of its contract with I-MED, Australia’s largest radiology provider. Once fully implemented the extension to the contract is estimated to provide an additional $1.3m in revenue per annum. Promedicus.net, the company’s e-health offering, continued to hold its market position despite increasing competition.
North America
The North American team fulfil sales, marketing and professional services roles. Revenue from North America increased by 18.4% compared to the previous year. This was attributable to new sales to Yale New Haven Health and the sale of Visage Open Archive to Mercy Health, as well as an increase in transaction based revenue from sales of Visage technology as more contracts came on stream.
For
per
sona
l use
onl
y

Directors’ Report continued
5
Europe
The Group’s employees in its Berlin office undertake research and development of Visage Imaging products worldwide as well as sales, marketing and service/support functions for the Group's European operations. Revenue from our European operations increased by 33.2% from the previous year.
Financials
Reported profit after tax for the period was $12.74m an increase of 36.7% from the previous year.
Full year revenue of the Group increased from $31.62m to $36.02m, an increase of 13.9%. As the Group’s costs are relatively fixed, an increase in sales has a significant impact on profitability.
The key drivers of the profit increase were the significant increase in the performance of the North American and European operations, as well as unrealised foreign currency gains.
Underlying profit, which excludes currency movements was $12.57m an increase of 27.4% from the previous year.
Investments for Future Performance
The Company will continue to direct resources into the development of new products and is committed to the continued development of its Visage RIS and Visage 7.0 product sets.
It is anticipated that this strategy of ongoing development will continue to position Pro Medicus as a market leader and enable the Group to further leverage its expanded product portfolio and geographical spread.
The Group remains committed to providing staff with access to appropriate training and development programs, together with the resources to complete their duties.
The Directors express their gratitude for the efforts of the management team and all employees in achieving this year’s result.
REVIEW OF FINANCIAL CONDITION
Capital Structure
The Company has a sound capital structure with a strong financial position and is debt free.
Treasury Policy
The treasury function, co-ordinated within Pro Medicus Limited, is limited to maximising interest return on surplus funds and managing currency risk. The treasury function operates within policies set by the Board, which is responsible for ensuring that management’s actions are in line with Board policy.
With the increase in overseas operations there is an increased currency risk as a consequence of contracts written in and cash being held in foreign currencies. Whilst this is offset to a degree by having operations in North America and Europe, this change in risk profile has been noted by the Board and steps have been taken to manage this risk.
Cash from Operations
Net cash flows from operating activities for the current period was a positive $13.87m, with receipts from customers totalling $32.21m compared with payments of $13.39m to suppliers and employees. During the year the Company paid out a total of $5.2m in dividends, the net result being total cash assets of $25.24m; an increase of 10.8% from last year.
Liquidity and Funding
The Group is cash flow positive, has adequate cash reserves and has no overdraft facility. Sufficient funds are held to finance operations.
Risk Management
The Company takes a proactive approach to risk management. The Board is responsible for ensuring that risks, and also opportunities, are identified on a timely basis and that the Group’s objectives and activities are aligned with the risks and opportunities identified by the Board.
The Company believes that it is crucial for all Board members to participate in this process, as such the Board has not established separate committees for areas such as risk management, environmental issues, occupational health and safety or treasury.
The Board has a number of mechanisms in place to ensure that management’s objectives and activities are aligned with the risks identified by the Board. These include the following:
Board approval of strategic plans, which encompass the Company’s vision, mission and strategy statements, designed to meet stakeholder needs and manage business risk;
For
per
sona
l use
onl
y
Directors’ Report continued
6
Implementation of Board approved operating plans and budgets and Board monitoring of progress against these budgets, including the establishment and monitoring of KPIs;
Overseeing of appropriate backup procedures for important company data; and
Routine review by key executives of its established Quality Assurance program and corrective action recommendations stemming from it.
Corporate Governance
In recognising the need for the highest standards of corporate behaviour and accountability, the Directors of Pro Medicus Limited support and have adhered to the principles of good corporate governance. Please refer to the separate “Corporate Governance” section for more details of specific policies.
SIGNIFICANT CHANGES IN THE STATE OF AFFAIRS
Shareholders’ equity increased by 31.1% from $34.83m to $45.66m. This movement was largely the result of profit during the year, offset by dividends paid out during the year.
SIGNIFICANT EVENTS AFTER THE BALANCE DATE A Final Dividend of 3.5 cents per share has been declared post 30 June 2018. Please refer to Note 8 of the financial statements.
LIKELY DEVELOPMENTS AND EXPECTED RESULTS
The Directors anticipate that the 2019 financial year will see more opportunities crystallise for the company due to improved prospects in North America and the continued commercialisation and roll out of Visage RIS, the company’s new technology RIS platform.
Key components that are likely to affect the performance of the company are:
Increased revenue being generated from previously won transaction based contracts which are scheduled to come on stream in the 2019 financial year.
Continued strong interest in the Visage 7.0 suite of products in the North American market has resulted in a number of sales opportunities that the Company is actively pursuing.
The ability of the expanded Visage 7.0 product set to address key market segments such as large Health Systems and Hospitals in addition to the private radiology and teleradiology markets.
Market dynamics that favour the adoption of Visage 7.0 technology such as trend towards modular, best in breed solutions.
Increased revenue from Visage RIS, the company’s new technology RIS platform as the rollout of this new platform continues.
As a result, it is anticipated that the 2019 financial year will show a continuing improvement in operational results, however this is dependent upon many market factors over which the Directors have limited or no control.
ENVIRONMENTAL REGULATION AND PERFORMANCE
The Group has no identified risk with regard to environmental regulations currently in force. There have been no known breaches by the Group of any regulations.
SHARE OPTIONS Un-issued Shares
As at the date of this report, there were zero un-issued ordinary shares under options. Refer to Note 17 of the financial statements for further details of movement of options throughout the year.
Shares Issued as a Result of the Exercise of Options During the financial year, 25,000 share options were exercised by current employees to acquire fully paid ordinary shares in Pro Medicus Limited and no share options expired.
PERFORMANCE RIGHTS Un-issued Shares
As at the date of this report, there were 1,206,609 un-issued ordinary shares under performance rights. Refer to Note 17 of the financial statements for further details of the performance rights outstanding.
Rights holders do not have any right, by virtue of the right, to participate in any share issue of the Company.
Shares Issued as a Result of the Exercise of Performance Rights During the financial year, 280,000 performance rights were exercised by current employees and no performance rights expired. A further 403,500 performance rights were exercised by key management personnel in the current year to acquire fully paid ordinary shares in Pro Medicus Limited.
For
per
sona
l use
onl
y

Directors’ Report continued
7
INDEMNIFICATION AND INSURANCE OF DIRECTORS AND OFFICERS During the year, Pro Medicus Limited indemnified Clayton Utz and each one or more of the past, present or future partners of Clayton Utz (other than Mr. Lyle) against any liability (including a liability incurred by Clayton Utz to pay legal costs) arising out of Mr. Lyle's activities as a Director of Pro Medicus Limited. During or since the financial year, the Company has paid premiums in respect of a contract for Directors’ & Officers’/Company Re-Imbursement Liability insurance for directors, officers and Pro Medicus Limited for costs incurred in defending proceedings against them. Disclosure of the amount of insurance and the terms of this cover is prohibited by the insurance policy.
INDEMNIFICATION OF AUDITORS To the extent permitted by law, the Company has agreed to indemnify its auditors, Ernst & Young, as part of the terms of its audit engagement agreement against claims by third parties arising from the audit (for an unspecified amount). No payment has been made to indemnify Ernst & Young during or since the financial year.
REMUNERATION REPORT (audited) This remuneration report for the year ended 30 June 2018 outlines the remuneration arrangements of the Group in accordance with the requirements of the Corporations Act 2001 and its Regulations. This information has been audited as required by section 308(3C) of the Act.
The remuneration report details the remuneration arrangements for key management personnel (KMP) who are defined as those persons having authority and responsibility for planning, directing and controlling the major activities of the Company and the Group, directly or indirectly, including any director (whether executive or otherwise) of the Group.
For the purposes of this report, the term ‘executive’ includes the Chief Executive Officer (CEO), executive directors and other senior executives of the Group.
(i) Non – executive directors
Peter Terence Kempen Chairman
Roderick Lyle Director (non-executive) - retired 14 November 2017
Anthony Glenning Director (non-executive)
Leigh Farrell Director (non-executive) - appointed 8 September 2017
(ii) Executive directors
Dr Sam Aaron Hupert Managing Director and CEO Anthony Barry Hall Technology Director
(iii) Other Executives
Danny Tauber General Manager – Pro Medicus Limited
Malte Westerhoff Managing Director – Visage Imaging GmbH
Brad Levin General Manager – Visage Imaging Inc.
Sean Lambright Global Head of Sales – Visage Imaging Inc.
Remuneration Committee
Remuneration and nomination issues are handled at the full Board level. Due to the small number of Directors no committee has been established for this purpose.
Board members, as per groupings detailed below, are responsible for determining and reviewing compensation arrangements.
In order to maintain good corporate governance the Non-Executive Directors assume responsibility for determining and reviewing compensation arrangements for the Executive Directors of the Group. The Executive Directors in turn are responsible for determining and reviewing the compensation arrangements for the Non-Executive Directors. The CEO, in conjunction with the full Board reviews the terms of employment for all executives. The assessment considers the appropriateness of the nature and amount of remuneration of such executives on a periodic basis by reference to relevant employment market conditions with the overall objective of ensuring maximum stakeholder benefit from the retention of a high quality Board and executive team.
Remuneration Philosophy
The performance of the Group depends upon the quality of its Directors and Executives. To prosper, the Group must attract, motivate and retain highly skilled Directors and Executives.
For
per
sona
l use
onl
y
Directors’ Report continued
8
REMUNERATION REPORT (audited) (continued)
To this end, the Group provides competitive rewards to attract high calibre Executives.
Remuneration Structure
In accordance with best practice corporate governance, the structure of Non-Executive Director and Executive’s remuneration is separate and distinct.
Non-Executive Director Remuneration
Objective
The Board seeks to set aggregate remuneration at a level which provides the Company with the ability to attract and retain Directors of the highest calibre, whilst incurring a cost which is acceptable to shareholders.
Structure
The Constitution and the ASX Listing Rules specify that the aggregate remuneration of Non-Executive Directors shall be determined from time to time by a general meeting. An amount not exceeding the amount determined is then divided between the Directors as agreed. The latest determination was at the Annual General Meeting held on 4 November 2005 when shareholders approved an aggregate remuneration of $500,000 per year.
The amount of the aggregate remuneration sought to be approved by shareholders and the manner in which it is apportioned amongst Directors is reviewed annually. The Board considers fees paid to Non-Executive Directors of comparable companies when undertaking the annual review process.
Each Director receives a fee for being a Director of the Company. No additional fee is paid for time spent on Audit Committee business.
Non-Executive Directors have long been encouraged by the Board to hold shares in the Company (purchased by the Director on market). It is considered good governance for the Directors to have a stake in the Company on whose Board they sit.
The remuneration of Non-Executive Directors for the period ended 30 June 2018 is detailed in Table 1 of this report.
Executives (including Executive Directors remuneration)
Objective
The Group aims to reward Executives with a level and mix of remuneration commensurate with their position and responsibilities within the Group and so as to:
align the interests of Executives with those of shareholders;
ensure total remuneration is competitive by market standards.
Structure
Employment contracts have been entered into with all Executives of the Group. Details of these contracts are provided on page 10.
Remuneration consists predominately of fixed remuneration. Variable remuneration is provided occasionally at the Board’s discretion including both short term incentives (STI) and long term incentives (LTI).
The Company does not have a policy regarding Executives entering into contracts to hedge their exposure to share options granted as part of their remuneration package.
The Board engaged external consultants throughout the year to undertake a review of the remuneration of Executives.
Fixed Remuneration
Objective
The level of fixed remuneration is set so as to provide a base level of remuneration which is both appropriate to the position and is competitive in the market.
Fixed remuneration is reviewed annually and the process consists of a review of Group wide, business and individual performance, relevant comparative remuneration in the market and internal and, where appropriate, external advice on policies and practices. As noted above, the company conducting the review has access to external advice independent of management.
Executives, including Executive Directors are given the opportunity to receive their fixed (primary) remuneration in a variety of forms including cash and fringe benefits such as motor vehicles and expense payment plans. It is intended that the manner of payment chosen will be optimal for the recipient without creating undue cost for the Group.
For
per
sona
l use
onl
y

Directors’ Report continued
9
REMUNERATION REPORT (audited) (continued)
The fixed remuneration is detailed in Table 1 of this report. Variable Remuneration – Long Term Incentive (LTI)
Performance Rights
A long term incentive plan was established during 2011-12 whereby Senior Executives of the Group were offered performance rights over the ordinary shares of Pro Medicus Limited. The performance rights, issued for nil consideration, are offered over a 5 year period and vest 4 years after grant date on completion of service. This long term incentive plan includes performance hurdles related to profitability (EBIT – 75%) which is set on an annualised basis by the Board and individual performance (25%). These measures have been selected and set to align to Company performance and to reflect individual contribution to the Company.
The fair value of the equity-settled performance rights is estimated using a Black-Scholes model at grant date taking into account the terms and conditions upon which the performance rights were granted. For further details of valuation of options, models and assumptions used please refer to Note 17 of the financial statements.
The table below outlines the proportion of performance rights that were granted based on performance measures since the plan was established. No new grants were awarded during the year under this long term incentive plan.
2018 2017 2016 2015 2014
75% EBIT targets met N/A 125% 85% 25% 90% 25% Individual targets met N/A 83% 88% 92% 87%
A new long term incentive plan was established during 2016-17 whereby Senior Executives of the Group were offered performance rights over the ordinary shares of Pro Medicus Limited. The performance rights, issued for nil consideration, are offered over a 5 year period and vest 4 years after grant date on completion of service. This long term incentive plan includes performance hurdles related to profitability - Earnings per share (EPS) growth (60%) which is set on an annualised basis by the Board and Total shareholder returns (TSR) growth (40%). The Company’s TSR growth performance hurdle is measured relative to the ASX300 Index and assessed by the Board at the end of the performance period in accordance with the terms of the plan. These measures have been selected and set to align to Company performance and shareholder value.
The fair value of the equity-settled performance rights is estimated using Black Sholes and Monte Carlo Simulation Models at grant date taking into account the terms and conditions upon which the performance rights were granted. For further details of valuation of options, models and assumptions used please refer to Note 17 of the financial statements.
Variable Remuneration – Short Term Incentive (STI)
Short term incentives in the form of cash bonuses were paid to key staff based on a mix of Company based and personal performance targets.
STI bonus for 2018
For the 2018 financial year, the total amount of STI cash bonus either paid or accrued at year end was $594,813. The maximum STI cash bonus amount payable was $780,861.
Key Performance Indicators
Actual STI payments granted to key staff depended on the extent to which specific targets set at the time of employment were met. The targets consist of a number of Key Performance Indicators (KPIs) covering both financial (Sales Targets) and non-financial measures of performance, including client satisfaction, patent filings and employee satisfaction.
Shareholder Returns
The Directors are confident that the holdings of reserve cash is sufficient to underpin the development and expansion needs of the Company as the business looks to increase its penetration of existing markets.
For
per
sona
l use
onl
y
Directors’ Report continued
10
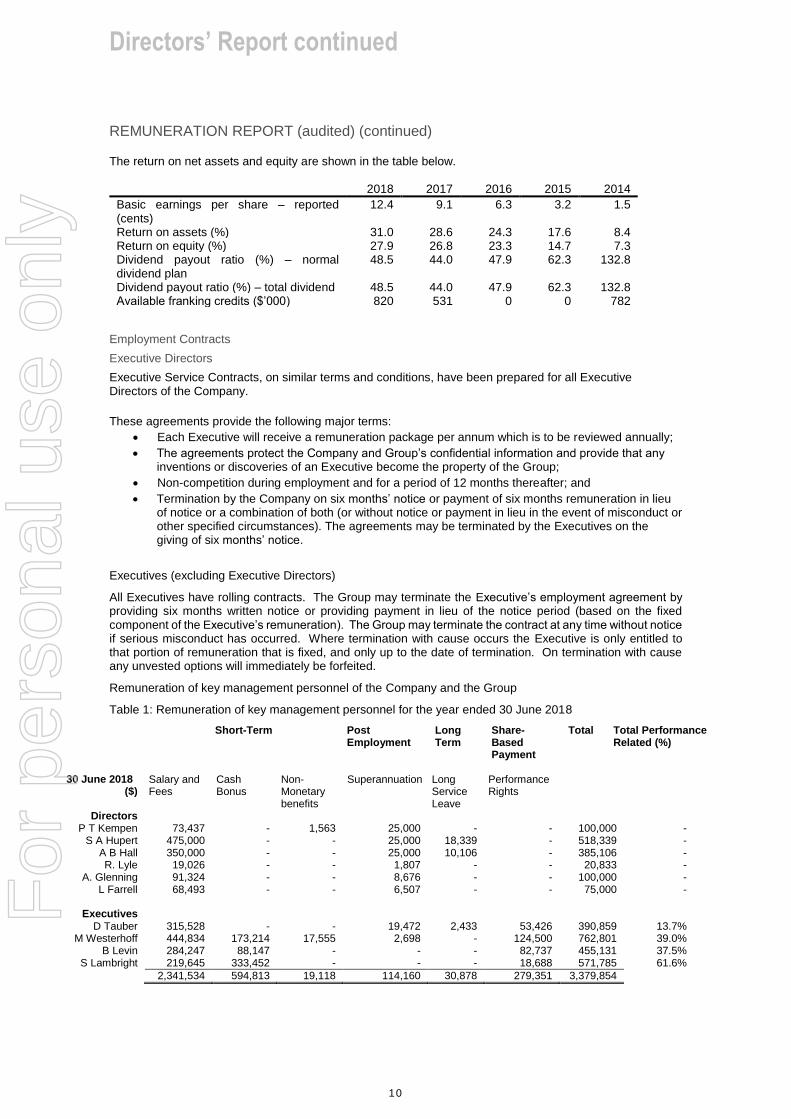
REMUNERATION REPORT (audited) (continued) The return on net assets and equity are shown in the table below.
2018 2017 2016 2015 2014
Basic earnings per share – reported (cents)
12.4 9.1 6.3 3.2 1.5
Return on assets (%) 31.0 28.6 24.3 17.6 8.4 Return on equity (%) 27.9 26.8 23.3 14.7 7.3 Dividend payout ratio (%) – normal dividend plan
48.5 44.0 47.9 62.3 132.8
Dividend payout ratio (%) – total dividend 48.5 44.0 47.9 62.3 132.8 Available franking credits ($’000) 820 531 0 0 782
Employment Contracts
Executive Directors
Executive Service Contracts, on similar terms and conditions, have been prepared for all Executive Directors of the Company.
These agreements provide the following major terms:
Each Executive will receive a remuneration package per annum which is to be reviewed annually;
The agreements protect the Company and Group’s confidential information and provide that any inventions or discoveries of an Executive become the property of the Group;
Non-competition during employment and for a period of 12 months thereafter; and
Termination by the Company on six months’ notice or payment of six months remuneration in lieu of notice or a combination of both (or without notice or payment in lieu in the event of misconduct or other specified circumstances). The agreements may be terminated by the Executives on the giving of six months’ notice.
Executives (excluding Executive Directors)
All Executives have rolling contracts. The Group may terminate the Executive’s employment agreement by providing six months written notice or providing payment in lieu of the notice period (based on the fixed component of the Executive’s remuneration). The Group may terminate the contract at any time without notice if serious misconduct has occurred. Where termination with cause occurs the Executive is only entitled to that portion of remuneration that is fixed, and only up to the date of termination. On termination with cause any unvested options will immediately be forfeited.
Remuneration of key management personnel of the Company and the Group
Table 1: Remuneration of key management personnel for the year ended 30 June 2018
Short-Term Post Employment
Long Term
Share-Based Payment
Total Total Performance Related (%)
30 June 2018
($) Salary and Fees
Cash Bonus
Non-Monetary benefits
Superannuation Long Service Leave
Performance Rights
Directors P T Kempen 73,437 - 1,563 25,000 - - 100,000 -
S A Hupert 475,000 - - 25,000 18,339 - 518,339 - A B Hall 350,000 - - 25,000 10,106 - 385,106 - R. Lyle 19,026 - - 1,807 - - 20,833 -
A. Glenning 91,324 - - 8,676 - - 100,000 - L Farrell 68,493 - - 6,507 - - 75,000 -
Executives
D Tauber 315,528 - - 19,472 2,433 53,426 390,859 13.7% M Westerhoff 444,834 173,214 17,555 2,698 - 124,500 762,801 39.0%
B Levin 284,247 88,147 - - - 82,737 455,131 37.5% S Lambright 219,645 333,452 - - - 18,688 571,785 61.6%
2,341,534 594,813 19,118 114,160 30,878 279,351 3,379,854
For
per
sona
l use
onl
y
Directors’ Report continued
11
REMUNERATION REPORT (audited) (continued)
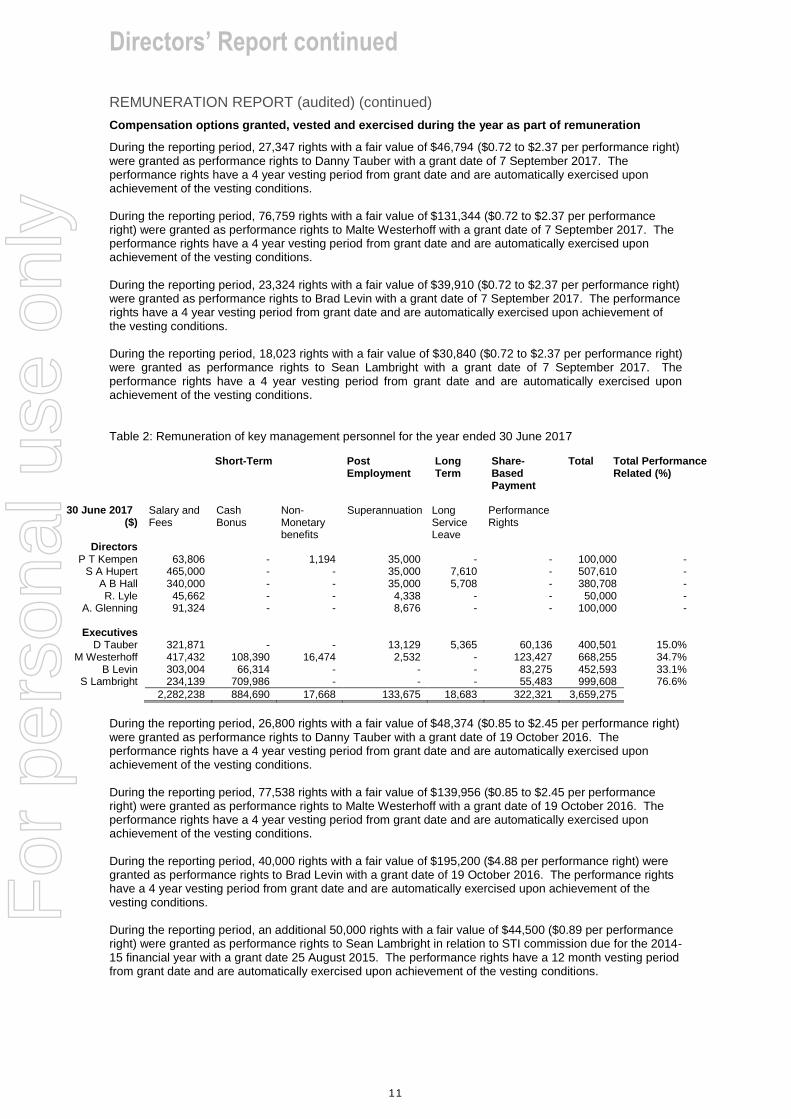
Compensation options granted, vested and exercised during the year as part of remuneration
During the reporting period, 27,347 rights with a fair value of $46,794 ($0.72 to $2.37 per performance right) were granted as performance rights to Danny Tauber with a grant date of 7 September 2017. The performance rights have a 4 year vesting period from grant date and are automatically exercised upon achievement of the vesting conditions. During the reporting period, 76,759 rights with a fair value of $131,344 ($0.72 to $2.37 per performance right) were granted as performance rights to Malte Westerhoff with a grant date of 7 September 2017. The performance rights have a 4 year vesting period from grant date and are automatically exercised upon achievement of the vesting conditions. During the reporting period, 23,324 rights with a fair value of $39,910 ($0.72 to $2.37 per performance right) were granted as performance rights to Brad Levin with a grant date of 7 September 2017. The performance rights have a 4 year vesting period from grant date and are automatically exercised upon achievement of the vesting conditions. During the reporting period, 18,023 rights with a fair value of $30,840 ($0.72 to $2.37 per performance right) were granted as performance rights to Sean Lambright with a grant date of 7 September 2017. The performance rights have a 4 year vesting period from grant date and are automatically exercised upon achievement of the vesting conditions. Table 2: Remuneration of key management personnel for the year ended 30 June 2017
Short-Term Post Employment
Long Term
Share-Based Payment
Total Total Performance Related (%)
30 June 2017
($) Salary and Fees
Cash Bonus
Non-Monetary benefits
Superannuation Long Service Leave
Performance Rights
Directors P T Kempen 63,806 - 1,194 35,000 - - 100,000 -
S A Hupert 465,000 - - 35,000 7,610 - 507,610 - A B Hall 340,000 - - 35,000 5,708 - 380,708 - R. Lyle 45,662 - - 4,338 - - 50,000 -
A. Glenning 91,324 - - 8,676 - - 100,000 -
Executives D Tauber 321,871 - - 13,129 5,365 60,136 400,501 15.0%
M Westerhoff 417,432 108,390 16,474 2,532 - 123,427 668,255 34.7% B Levin 303,004 66,314 - - - 83,275 452,593 33.1%
S Lambright 234,139 709,986 - - - 55,483 999,608 76.6%
2,282,238 884,690 17,668 133,675 18,683 322,321 3,659,275
During the reporting period, 26,800 rights with a fair value of $48,374 ($0.85 to $2.45 per performance right) were granted as performance rights to Danny Tauber with a grant date of 19 October 2016. The performance rights have a 4 year vesting period from grant date and are automatically exercised upon achievement of the vesting conditions. During the reporting period, 77,538 rights with a fair value of $139,956 ($0.85 to $2.45 per performance right) were granted as performance rights to Malte Westerhoff with a grant date of 19 October 2016. The performance rights have a 4 year vesting period from grant date and are automatically exercised upon achievement of the vesting conditions. During the reporting period, 40,000 rights with a fair value of $195,200 ($4.88 per performance right) were granted as performance rights to Brad Levin with a grant date of 19 October 2016. The performance rights have a 4 year vesting period from grant date and are automatically exercised upon achievement of the vesting conditions. During the reporting period, an additional 50,000 rights with a fair value of $44,500 ($0.89 per performance right) were granted as performance rights to Sean Lambright in relation to STI commission due for the 2014-15 financial year with a grant date 25 August 2015. The performance rights have a 12 month vesting period from grant date and are automatically exercised upon achievement of the vesting conditions.
For
per
sona
l use
onl
y

Directors’ Report continued
12
REMUNERATION REPORT (audited) (continued)
Table 3: Shareholdings of Key Management Personnel
Shares held in Pro Medicus Limited
(Number)
Balance at beginning of year
1 July 2017
On Exercise of Performance rights
On Exercise of Options
Net Change Other
Balance
30 June 2018
30 June 2018 Ordinary Ordinary Ordinary Ordinary Ordinary
Directors
P T Kempen 678,082 - - - 678,082
S A Hupert 30,107,660 - - (1,000,000)* 29,107,660
A B Hall 30,068,500 - - (1,001,000)** 29,067,500
R Lyle 340,000 - - - 340,000
A Glenning 4,000 - - - 4,000
L Farrell - - - 2,501*** 2,501
Executives
D Tauber 406,412 107,250 - (94,166)~ 419,496
M Westerhoff 59,825 185,000 - (123,645)~~ 121,180
B Levin 10,000 61,250 - (32,342)# 38,908
S Lambright 200,000 50,000 - (70,000)## 180,000
Total 61,874,479 403,500 - (2,318,652) 59,959,327
* Sam Hupert sold 1,000,000 shares throughout the year at the prevailing market share price. ** Anthony Hall sold 1,001,000 shares throughout the year at the prevailing market share price. *** Leigh Farrell purchased 2,501 shares throughout the year at the prevailing market share price. ~ Danny Tauber sold 94,166 shares throughout the year at the prevailing market share price. ~~ Malte Westerhoff sold 123,645 shares throughout the year at the prevailing market share price. # Brad Levin sold 32,342 shares throughout the year at the prevailing market share price. ## Sean Lambright sold 70,000 shares throughout the year at the prevailing market share price.
Table 4: Performance rights of Key Management Personnel
Balance at beginning of year
Granted as Remuneration
Performance rights Exercised
Balance at end of
year
30 June 2018
(Number)
1 July 2017 30 June 2018
Not vested Vested/
Exercisable
Total
Directors
P T Kempen - - - - - - -
S A Hupert - - - - - - -
A B Hall - - - - - - -
R Lyle - - - - - - -
A Glenning - - - - - - -
L Farrell - - - - - - -
Executives
D Tauber 213,550 27,347 (107,250) 133,647 133,647 - 133,647
M Westerhoff 419,039 76,759 (185,000) 310,798 310,798 - 310,798
B Levin 159,156 23,324 (61,250) 121,230 121,230 - 121,230
S Lambright 72,188 18,023 (50,000) 40,211 40,211 - 40,211
Total 863,933 145,453 (403,500) 605,886 605,886 - 605,886
Loans to Key Management Personnel
No loans are made to Key Management Personnel or staff.
Other transactions and balances with Key Management Personnel
Purchases
During the year lease payments of $169,476 (2017: $169,476) in respect of the Group’s operating premises at 450 Swan Street Richmond were paid to Champagne Properties Pty. Ltd., an entity controlled by S. Hupert and A. Hall. Commercial arrangements on an ‘arm’s length basis’ have been determined by an independent assessment of rental and lease terms.
For
per
sona
l use
onl
y

Directors’ Report continued
13
REMUNERATION REPORT (audited) (continued)
DIRECTORS’ MEETINGS The numbers of meetings of Directors (including meetings of committees of Directors) held during the year and the number of meetings attended by each Director were as follows:
Directors’ Meetings Eligible to attend Audit Committee Eligible to attend
Number of meetings held: 9 2
Number of meetings attended:
P. T. Kempen 9 9 2 2
R. Lyle 3 3 1 1
A. Glenning 9 9 2 2
L. Farrell 8 8 1 1
A. B. Hall 9 9 2 2
S. A. Hupert 9 9 2 2
Committee membership
As at 30 June 2018, the company had an Audit Committee comprising the 3 Non-Executive Directors and 2 Executive Directors.
ROUNDING The amounts contained in this report and in the financial report have been rounded to the nearest $1,000 (where rounding is applicable) under the option available to the Company under ASIC Corporations (Rounding in Financial/Directors Reports) instrument 2016/191. The Company is an entity to which the Class Order applies.
AUDITOR INDEPENDENCE AND NON-AUDIT SERVICES
The Directors received a declaration from the auditor of Pro Medicus Limited (refer page 14).
NON-AUDIT SERVICES
The following non-audit services were provided by the company’s auditor, Ernst & Young. The directors are satisfied that the provision of non-audit services is compatible with the general standard of independence for the auditors imposed by the Corporations Act. The nature and scope of the non-audit service provided means that auditor independence is not compromised.
Ernst & Young received the following amount for the provision of non-audit services:
Professional services rendered in respect to taxation matters $123,886
Signed in accordance with a resolution of the Directors.
P T Kempen
Director
Melbourne, 16 August 2018
For
per
sona
l use
onl
y

A member firm of Ernst & Young Global Limited Liability limited by a scheme approved under Professional Standards Legislation
Ernst & Young 8 Exhibition Street Melbourne VIC 3000 Australia GPO Box 67 Melbourne VIC 3001
Tel: +61 3 9288 8000 Fax: +61 3 8650 7777 ey.com/au
Auditor’s Independence Declaration to the Directors of Pro Medicus Limited
As lead auditor for the audit of Pro Medicus Limited for the financial year ended 30 June 2018, I declare to the best of my knowledge and belief, there have been:
a) no contraventions of the auditor independence requirements of the Corporations Act 2001 in relation to the audit; and
b) no contraventions of any applicable code of professional conduct in relation to the audit.
This declaration is in respect of Pro Medicus Limited and the entities it controlled during the financial year.
Ernst & Young
Paul Gower Partner 16 August 2018
For
per
sona
l use
onl
y
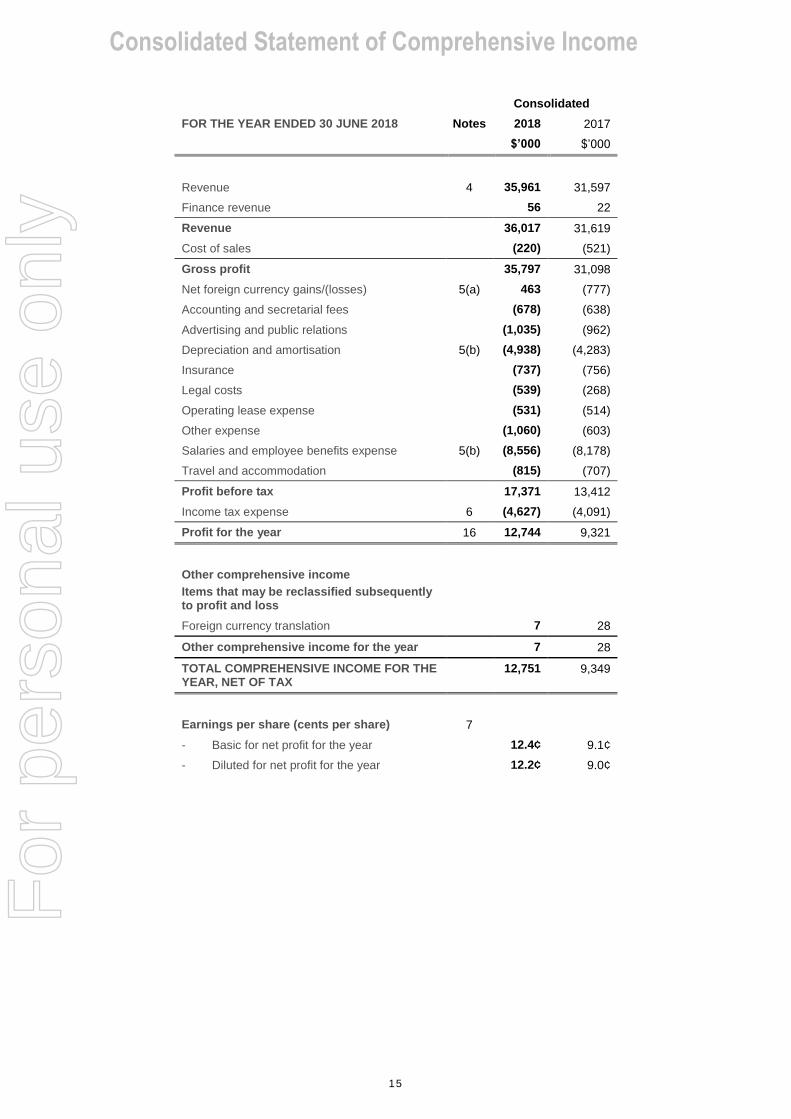
Consolidated Statement of Comprehensive Income
15
Consolidated
FOR THE YEAR ENDED 30 JUNE 2018 Notes 2018 2017
$’000 $’000
Revenue 4 35,961 31,597
Finance revenue 56 22
Revenue 36,017 31,619
Cost of sales (220) (521)
Gross profit 35,797 31,098
Net foreign currency gains/(losses) 5(a) 463 (777)
Accounting and secretarial fees (678) (638)
Advertising and public relations (1,035) (962)
Depreciation and amortisation 5(b) (4,938) (4,283)
Insurance (737) (756)
Legal costs (539) (268)
Operating lease expense (531) (514)
Other expense (1,060) (603)
Salaries and employee benefits expense 5(b) (8,556) (8,178)
Travel and accommodation (815) (707)
Profit before tax 17,371 13,412
Income tax expense 6 (4,627) (4,091)
Profit for the year 16 12,744 9,321
Other comprehensive income
Items that may be reclassified subsequently to profit and loss
Foreign currency translation 7 28
Other comprehensive income for the year 7 28
TOTAL COMPREHENSIVE INCOME FOR THE YEAR, NET OF TAX
12,751 9,349
Earnings per share (cents per share) 7
- Basic for net profit for the year 12.4¢ 9.1¢
- Diluted for net profit for the year 12.2¢ 9.0¢
For
per
sona
l use
onl
y

Consolidated Statement of Financial Position
16
Consolidated
AS AT 30 JUNE 2018 Notes 2018 2017
$’000 $’000
ASSETS
Current Assets
Cash and cash equivalents 9 25,238 22,775
Trade and other receivables 10 4,992 3,489
Accrued revenue 3,229 3,264
Inventories 11 54 54
Prepayments 707 598
Total Current Assets 34,220 30,180
Non-Current Assets
Deferred tax assets 6 2,494 1,023
Plant and equipment 12 352 283
Trade and other receivables 10 2,351 -
Intangible assets 13 16,854 15,478
Prepayments 36 242
Total Non-Current Assets 22,087 17,026
TOTAL ASSETS 56,307 47,206
LIABILITIES
Current Liabilities
Trade and other payables 14 2,991 3,458
Income tax payable 838 1,972
Other current financial liabilities 26 193 -
Provisions 15 1,838 1,822
Total Current Liabilities 5,860 7,252
Non-Current Liabilities
Deferred tax liabilities 6 4,689 5,045
Provisions 15 95 75
Total Non-Current Liabilities 4,784 5,120
TOTAL LIABILITIES 10,644 12,372
NET ASSETS 45,663 34,834
EQUITY
Contributed equity 16 1,962 1,937
Share buyback reserve (73) (73)
Share reserve 16 4,920 1,717
Foreign currency translation reserve 16 152 145
Retained earnings 16 38,702 31,108
TOTAL EQUITY 45,663 34,834 For
per
sona
l use
onl
y
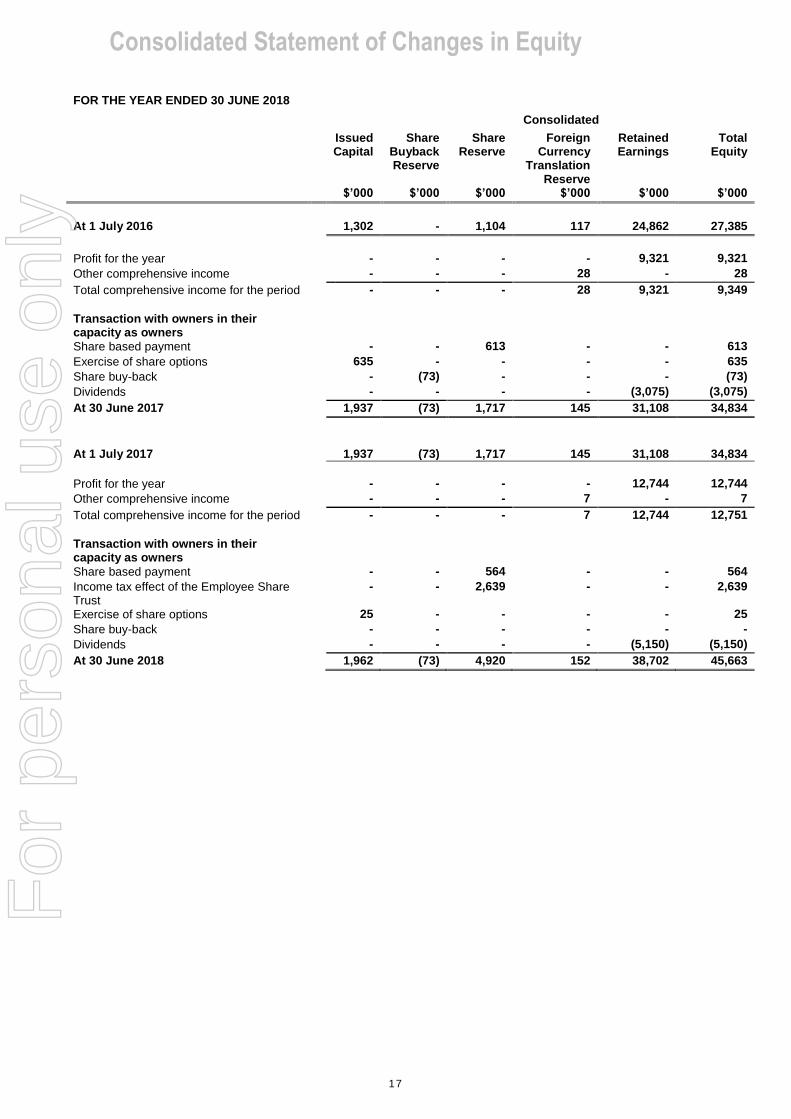
Consolidated Statement of Changes in Equity
17
FOR THE YEAR ENDED 30 JUNE 2018
Consolidated
Issued Capital
Share Buyback Reserve
Share Reserve
Foreign Currency
Translation Reserve
Retained Earnings
Total Equity
$’000 $’000 $’000 $’000 $’000 $’000
At 1 July 2016 1,302 - 1,104 117 24,862 27,385
Profit for the year - - - - 9,321 9,321
Other comprehensive income - - - 28 - 28
Total comprehensive income for the period - - - 28 9,321 9,349
Transaction with owners in their capacity as owners
Share based payment - - 613 - - 613
Exercise of share options 635 - - - - 635
Share buy-back - (73) - - - (73)
Dividends - - - - (3,075) (3,075)
At 30 June 2017 1,937 (73) 1,717 145 31,108 34,834
At 1 July 2017
1,937
(73)
1,717
145
31,108
34,834
Profit for the year - - - - 12,744 12,744
Other comprehensive income - - - 7 - 7
Total comprehensive income for the period - - - 7 12,744 12,751
Transaction with owners in their capacity as owners
Share based payment - - 564 - - 564
Income tax effect of the Employee Share Trust
- - 2,639 - - 2,639
Exercise of share options 25 - - - - 25
Share buy-back - - - - - -
Dividends - - - - (5,150) (5,150)
At 30 June 2018 1,962 (73) 4,920 152 38,702 45,663
For
per
sona
l use
onl
y
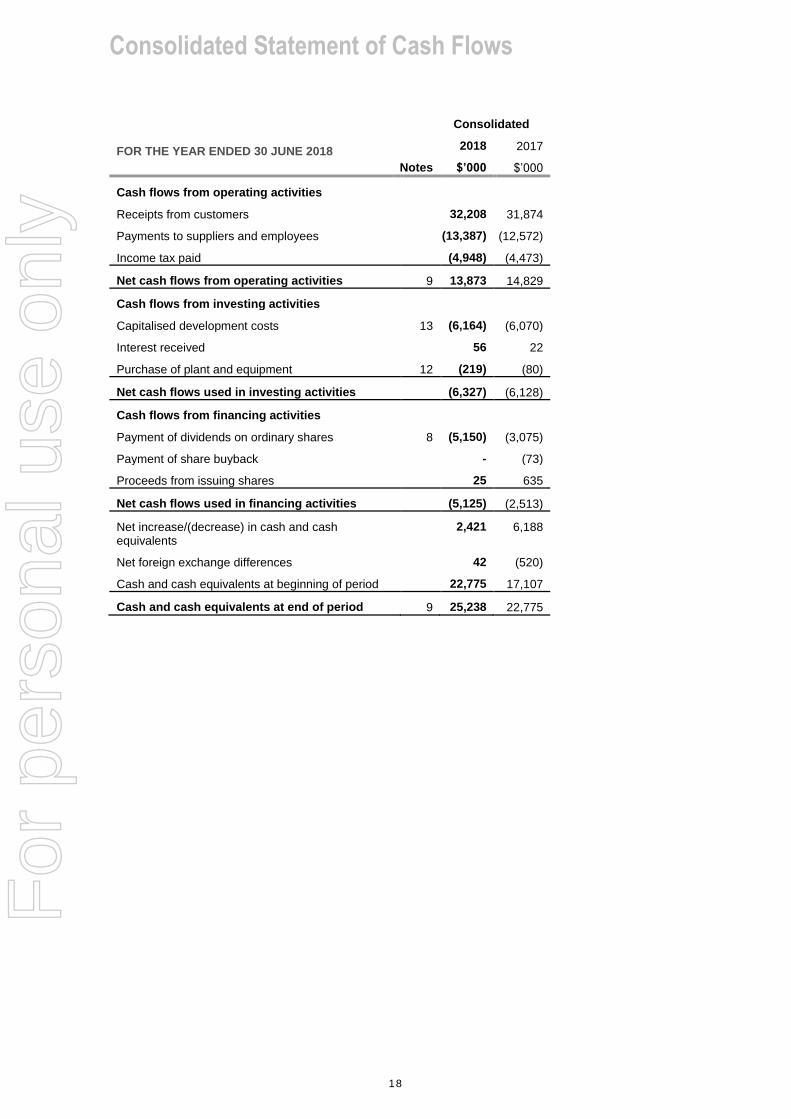
Consolidated Statement of Cash Flows
18
Consolidated
FOR THE YEAR ENDED 30 JUNE 2018 2018 2017
Notes $’000 $’000
Cash flows from operating activities
Receipts from customers 32,208 31,874
Payments to suppliers and employees (13,387) (12,572)
Income tax paid (4,948) (4,473)
Net cash flows from operating activities 9 13,873 14,829
Cash flows from investing activities
Capitalised development costs 13 (6,164) (6,070)
Interest received 56 22
Purchase of plant and equipment 12 (219) (80)
Net cash flows used in investing activities (6,327) (6,128)
Cash flows from financing activities
Payment of dividends on ordinary shares 8 (5,150) (3,075)
Payment of share buyback - (73)
Proceeds from issuing shares 25 635
Net cash flows used in financing activities (5,125) (2,513)
Net increase/(decrease) in cash and cash equivalents
2,421 6,188
Net foreign exchange differences 42 (520)
Cash and cash equivalents at beginning of period 22,775 17,107
Cash and cash equivalents at end of period 9 25,238 22,775
For
per
sona
l use
onl
y

Notes to the Financial Statements FOR THE YEAR ENDED 30 JUNE 2018
19
1. CORPORATE INFORMATION
The financial report of Pro Medicus Limited (the Company) for the year ended 30 June 2018 was authorised for issue in accordance with a resolution of Directors on 16 August 2018.
Pro Medicus Limited is a for profit company limited by shares incorporated in Australia whose shares are publicly traded on the Australian Securities Exchange.
The nature of the operations and principal activities of the Group are described in the Directors’ Report.
2. SUMMARY OF SIGNIFICANT ACCOUNTING POLICIES
(a) Basis of Preparation
The financial report is a general-purpose financial report, which has been prepared in accordance with the requirements of the Corporations Act 2001, Australian Accounting Standards and other authoritative pronouncements of the Australian Accounting Standards board. The financial report has also been prepared on a historical cost basis.
The financial report is presented in Australian dollars and all values are rounded to the nearest thousand dollars ($000) unless otherwise stated.
(b) Statement of compliance with IFRS
The financial report complies with Australian Accounting Standards and International Financial Reporting Standards (IFRS) as issued by the International Accounting Standards Board.
(c) Basis of consolidation
The consolidated financial statements comprise the financial statements of Pro Medicus Limited and its subsidiaries as at 30 June each year (the Group). Control is achieved when the Group is exposed, or has rights, to variable returns from its involvement with the investee and has the ability to affect those returns through its power over the investee. Specifically, the Group controls an investee if and only if the Group has:
Power over the investee (i.e. existing rights that give it the current ability to direct the relevant activities of the investee)
Exposure, or rights, to variable returns from its involvement with the investee, and
The ability to use its power over the investee to affect its returns.
When the Group has less than a majority of the voting or similar rights of an investee, the Group considers all relevant facts and circumstances in assessing whether it has power over an investee, including:
The contractual arrangement with the other vote holders of the investee
Rights arising from other contractual arrangements
The Group’s voting rights and potential voting rights The Group re-assesses whether or not it controls an investee if facts and circumstances indicate that there are changes to one or more of the three elements of control. Consolidation of a subsidiary begins when the Group obtains a control over the subsidiary and ceases when the Group loses control of the subsidiary. Assets, liabilities, income and expenses of a subsidiary acquired or disposed of during the year are included in the statement of comprehensive income from the date the Group gains control until the date the Group ceases to control the subsidiary. Profit or loss and each component of other comprehensive income (OCI) are attributed to the equity holders of the parent of the Group and to the non-controlling interests, even if this results in the non-controlling interests having a deficit balance. When necessary, adjustments are made to the financial statements of subsidiaries to bring their accounting policies into line with the Group’s accounting policies. All intra-group assets and liabilities, equity, income, expenses and cash flows relating to transactions between members of the Group are eliminated in full on consolidation.
A change in the ownership interest of a subsidiary, without a loss of control, is accounted for as an equity transaction. If the Group loses control over a subsidiary, it: - Derecognises the assets (including goodwill) and liabilities of the subsidiary. - Derecognises the carrying amount of any non-controlling interest. - Derecognises the cumulative translation differences, recorded in equity. - Recognises the fair value of the consideration received. - Recognises the fair value of any investment retained. - Recognises any surplus or deficit in profit or loss. - Reclassifies the parent's share of components previously recognised in OCI to profit or loss or retained earnings,
as appropriate, as would be required if the Group had directly disposed of the related assets or liabilities.
For
per
sona
l use
onl
y

Notes to the Financial Statements FOR THE YEAR ENDED 30 JUNE 2018
20
2. SUMMARY OF SIGNIFICANT ACCOUNTING POLICIES (cont’d)
Any contingent consideration to be transferred by the acquirer will be recognised at fair value at the acquisition date. Subsequent changes to the fair value of the contingent consideration which is deemed to be an asset or liability will be recognised in accordance with AASB 139 Financial Instruments: Recognition and Measurement either in profit or loss or in other comprehensive income. If the contingent consideration is classified as equity, it shall not be remeasured. 3. SIGNIFICANT ACCOUNTING JUDGEMENTS, ESTIMATES AND ASSUMPTIONS
The preparation of the financial statements requires management to make judgements, estimates and assumptions that affect the reported amounts in the financial statements. Management continually evaluates its judgements and estimates in relation to assets, liabilities, contingent liabilities, revenue and expenses. Management bases its judgements and estimates on historical experience and on other various factors it believes to be reasonable under the circumstances, the result of which form the basis of the carrying values of assets and liabilities that are not readily apparent from other sources. Actual results may differ from these estimates under different assumptions and conditions. Management has identified the following critical accounting policies for which significant judgements, estimates and assumptions are made. Actual results may differ from these estimates under different assumptions and conditions and may materially affect financial results or the financial position reported in future periods. Further details of the nature of these assumptions and conditions may be found in the relevant notes to the financial statements.
(i) Significant accounting judgements, estimates and assumptions
Capitalisation of development costs: Development costs are only capitalised by the Group when it can be demonstrated that the technical feasibility of completing the intangible asset is valid so that the asset will be available for use or sale. The capitalisation of development costs includes an overhead rate which has been estimated from total costs. The estimated development overheads rate has been calculated by dividing the development labour costs over total labour costs to give a percentage of development labour rate. The development labour rate is then applied against the total overheads of the company, to give an estimate of the amount of overheads that relates to development.
Impairment of non-financial assets: The Group assesses impairment of all assets at each reporting date by evaluating conditions specific to the Group and to the particular asset that may lead to impairment. If an impairment trigger exists the recoverable amount of the asset is determined. Management has tested certain assets for impairment in this financial period. Refer to Note 13 of the financial statements for significant assumptions applied in assessing for impairment on non-financial assets.
Taxation: The Group's accounting policy for taxation requires management's judgement as to the types of arrangements considered to be a tax on income in contrast to an operating cost. Judgement is also required in assessing whether deferred tax assets and certain deferred tax liabilities are recognised on the statement of financial position. Deferred tax assets, including those arising from un-recouped tax losses, capital losses and temporary differences, are recognised only where it is considered more likely than not that they will be recovered, which is dependent on the generation of sufficient future taxable profits. Deferred tax liabilities arising from temporary differences in investments, caused principally by retained earnings held in foreign tax jurisdictions, are recognised unless repatriation of retained earnings can be controlled and are not expected to occur in the foreseeable future. Assumptions about the generation of future taxable profits and repatriation of retained earnings depend on management's estimates of future cash flows. These depend on estimates of future sales volumes, operating costs, capital expenditure, dividends and other capital management transactions. Judgements are also required about the application of income tax legislation. These judgements and assumptions are subject to risk and uncertainty, hence there is a possibility that changes in circumstances will alter expectations, which may impact the amount of deferred tax assets and deferred tax liabilities recognised on the statement of financial position and the amount of other tax losses and temporary differences not yet recognised. In such circumstances, some or all of the carrying amounts of recognised deferred tax assets and liabilities may require adjustment, resulting in a corresponding credit or charge to the statement of comprehensive income. Deferred tax assets are recognised for deductible temporary differences as management considers that it is probable that future taxable profits will be available to utilise those temporary differences.
Income taxes: The group is subject to income taxes in Australia and jurisdictions where it has foreign operations. Significant judgement is required in determining the worldwide provision for income taxes. There are many transactions and calculations during the ordinary course of business for which the ultimate tax determination is uncertain. The group recognises liabilities for anticipated tax audit issues based on estimates of whether additional taxes will be due. Where the final tax outcome of these matters is different from the amounts that were initially recorded, such differences will impact the current and deferred tax provisions in the period in which such determination is made.
For
per
sona
l use
onl
y

Notes to the Financial Statements FOR THE YEAR ENDED 30 JUNE 2018
21
3. SIGNIFICANT ACCOUNTING JUDGEMENTS, ESTIMATES AND ASSUMPTIONS (cont’d)
Net investment in foreign operations: The Group maintains inter-company loans it assesses to represent a part of its net investment in its foreign operations. The judgements made in assessing these loans to represent net investments are on the basis the loans are neither planned nor likely to be settled within the foreseeable future, the loans do not include trade receivables or trade payable and the loans represent a return of funds from their investment in the respective subsidiaries.
Share-based payments: The Group measures the cost of equity-settled transactions with employees by reference to the fair value of equity instruments at the date at which they are granted. Estimating fair value for share-based payment transactions requires determination of the most appropriate valuation model, which is dependent on the terms and conditions of the grant. This estimate also requires determination of the most appropriate inputs to the valuation model including the expected life of the share option/performance rights, volatility and dividend yield and making assumptions about them. The assumptions and models used for estimating fair value of share-based payment transactions are disclosed in Note 17.
4. OPERATING SEGMENTS
The Group has identified its operating segments based on the internal reports that are reviewed and used by the executive management team (the chief operating decision makers) in assessing performance and in determining the allocation of resources. The operating segments are identified by management based on country of origin. Discrete financial information is reported to the executive management team on at least a monthly basis. Impairment is not monitored at segment level. Types of products and services
The Group produces integrated software applications for the health care industry. In addition, the Group provides services in the form of installation and support.
Accounting policies and inter-segment transactions
An operating segment is a component of an entity that engages in business activities from which it may earn revenues and incur expenses (including revenues and expenses relating to transactions with other components of the same entity), whose operating results are regularly reviewed by the entity's chief operating decision maker to make decisions about resources to be allocated to the segment and assess its performance and for which discrete financial information is available. This includes start-up operations which are yet to earn revenues. Management will also consider other factors in determining operating segments such as the existence of a line manager and the level of segment information presented to the Board of Directors. Operating segments have been identified based on the information provided to the chief operating decision makers – being the executive management team. The Group aggregates two or more operating segments when they have similar economic characteristics and the segments are similar in each of the following respects:
Nature of the products and services
Type or class of customer for the products and services
Nature of the regulatory environment Operating segments that meet the quantitative criteria as prescribed by AASB 8 are reported separately. However, an operating segment that does not meet the quantitative criteria is still reported separately where information about the segment would be useful to users of the financial statements. Information about other business activities and operating segments that are below the quantitative criteria are combined and disclosed in a separate category for “all other segments”. Inter-entity sales are recognised based on an internally set transfer price. The price aims to reflect what the business operation could achieve if they sold their output and services to external parties at arm’s length.
For
per
sona
l use
onl
y
Notes to the Financial Statements FOR THE YEAR ENDED 30 JUNE 2018
22
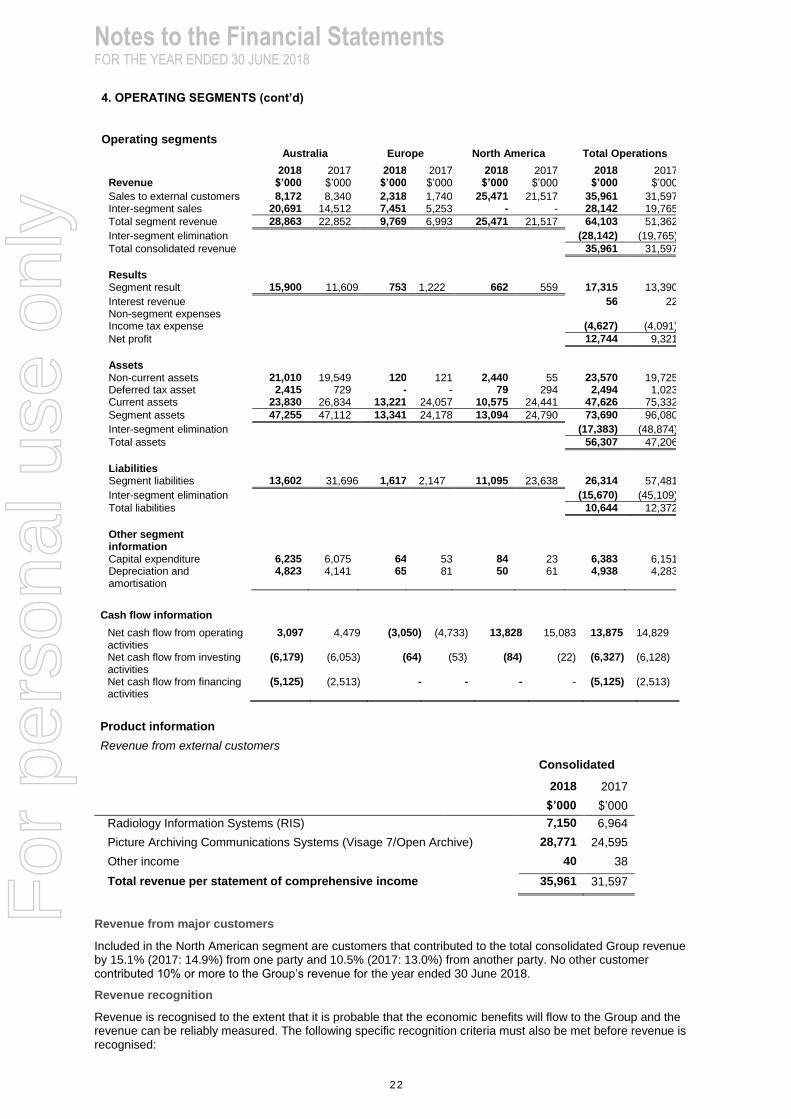
4. OPERATING SEGMENTS (cont’d)
Operating segments Australia Europe North America Total Operations
2018 2017 2018 2017 2018 2017 2018 2017 Revenue $’000 $’000 $’000 $’000 $’000 $’000 $’000 $’000
Sales to external customers 8,172 8,340 2,318 1,740 25,471 21,517 35,961 31,597 Inter-segment sales 20,691 14,512 7,451 5,253 - - 28,142 19,765
Total segment revenue 28,863 22,852 9,769 6,993 25,471 21,517 64,103 51,362
Inter-segment elimination (28,142) (19,765)
Total consolidated revenue 35,961 31,597
Results Segment result 15,900 11,609 753 1,222 662 559 17,315 13,390
Interest revenue 56 22 Non-segment expenses Income tax expense (4,627) (4,091)
Net profit 12,744 9,321
Assets Non-current assets 21,010 19,549 120 121 2,440 55 23,570 19,725 Deferred tax asset 2,415 729 - - 79 294 2,494 1,023 Current assets 23,830 26,834 13,221 24,057 10,575 24,441 47,626 75,332
Segment assets 47,255 47,112 13,341 24,178 13,094 24,790 73,690 96,080
Inter-segment elimination (17,383) (48,874)
Total assets 56,307 47,206
Liabilities Segment liabilities 13,602 31,696 1,617 2,147 11,095 23,638 26,314 57,481
Inter-segment elimination (15,670) (45,109)
Total liabilities 10,644 12,372
Other segment information
Capital expenditure 6,235 6,075 64 53 84 23 6,383 6,151 Depreciation and amortisation
4,823 4,141 65 81 50 61 4,938 4,283
Cash flow information
Net cash flow from operating activities
3,097 4,479 (3,050) (4,733) 13,828 15,083 13,875 14,829
Net cash flow from investing activities
(6,179) (6,053) (64) (53) (84) (22) (6,327) (6,128)
Net cash flow from financing activities
(5,125) (2,513) - - - - (5,125) (2,513)
Product information
Revenue from external customers
Consolidated
2018 2017
$’000 $’000
Radiology Information Systems (RIS) 7,150 6,964
Picture Archiving Communications Systems (Visage 7/Open Archive) 28,771 24,595
Other income 40 38
Total revenue per statement of comprehensive income 35,961 31,597
Revenue from major customers
Included in the North American segment are customers that contributed to the total consolidated Group revenue by 15.1% (2017: 14.9%) from one party and 10.5% (2017: 13.0%) from another party. No other customer contributed 10% or more to the Group’s revenue for the year ended 30 June 2018.
Revenue recognition
Revenue is recognised to the extent that it is probable that the economic benefits will flow to the Group and the revenue can be reliably measured. The following specific recognition criteria must also be met before revenue is recognised:
For
per
sona
l use
onl
y

Notes to the Financial Statements FOR THE YEAR ENDED 30 JUNE 2018
23
4. OPERATING SEGMENTS (cont’d)
Rendering of services
Revenue generated from pay-per-view contracts is recognised based on the number of image views undertaken by the customer, multiplied by the contracted view rate. Minimum exam counts are recognised in the year the customer is implemented and any subsequent year that image views do not exceed minimum agreed examinations.
Revenue from the installation and ongoing support of software applications and services is recognised by reference to the stage of completion of a contract or contracts in progress. Stage of completion is measured by completion of identifiable service segments as a percentage of the total services to be provided for each contract, which is determined by a quotation with the customer.
Service revenue is recognised over the term of the contract. Where revenue is received in advance, revenue is recognised in the period during which the service is provided.
Where the contract outcome cannot be reliably measured, revenue is recognised only to the extent that costs have been incurred.
Licences
Licence revenue is recognised when control of the right to be compensated for the license can be reliably measured. Licence revenue is recognised when ownership of the goods have passed to the buyer, which is usually after the software application has been installed and is ready for use by the buyer.
Interest
Revenue is recognised as the interest accrues (using the effective interest method, which is the rate that exactly discounts estimated future cash receipts through the expected life of the financial instrument) to the net carrying amount of the financial asset.
5. INCOME AND EXPENSES Notes Consolidated
2018 2017
$’000 $’000
(a) Net foreign currency gains/(losses)
Currency gains 3,959 3,377
Currency loss (3,303) (4,154)
Fair value loss on financial instruments – forward exchange contracts (193) -
Total net foreign currency gains/(losses) 463 (777)
(b) Expenses
Depreciation and amortisation
Motor vehicles 12 7 7
Office equipment 12 122 147
Furniture and fittings and property improvements 12 21 25
Capitalised development costs 13 4,788 4,103
Computer software 13 - 1
Total depreciation and amortisation expense 4,938 4,283
Salaries and employee benefits expense
Gross wages and salaries expense 11,990 11,559
Capitalised wages and salaries expense** (5,026) (4,965)
Long service leave provision expense 63 68
Share-based payment expense 564 613
Defined contribution plan expense 965 903
Total salaries and employee benefits expense 8,556 8,178
** The Group’s total Wages and Salaries incurred was $11,990,000 (2017:$11,559,000) of which $5,026,000 (2017:$4,965,000) of these costs have been capitalised.
For
per
sona
l use
onl
y
Notes to the Financial Statements FOR THE YEAR ENDED 30 JUNE 2018
24
6. INCOME TAX
Current tax assets and liabilities for the current and prior periods are measured at the amount expected to be recovered from or paid to the taxation authorities. The tax rates and tax laws used to compute the amount are those that are enacted or substantively enacted by the reporting date.
Deferred income tax is provided on all temporary differences at the reporting date between the tax bases of assets and liabilities and their carrying amounts for financial reporting purposes.
Deferred income tax liabilities are recognised for all taxable temporary differences, except:
where the deferred income tax liability arises from the initial recognition of an asset or liability in a transaction that is not a business combination and, at the time of the transaction, affects neither the accounting profit nor taxable profit or loss.
when the taxable temporary difference is associated with investments in subsidiaries, associates or interests in joint ventures, and the timing of the reversal of the temporary difference can be controlled and it is probable that the temporary difference will not reverse in the foreseeable future.
Deferred income tax assets are recognised for all deductible temporary differences, carry forward of unused tax assets and unused tax losses, to the extent that it is probable that taxable profit will be available against which the deductible temporary differences, and the carry-forward of unused tax assets and unused tax losses can be utilised, except:
where the deferred income tax asset relating to the deductible temporary difference arises from the initial recognition of an asset or liability in a transaction that is not a business combination and, at the time of the transaction, affects neither the accounting profit nor taxable profit or loss.
when the deductible temporary difference is associated with investments in subsidiaries, associates or interests in joint ventures, in which case a deferred tax asset is only recognised to the extent that it is probable that the temporary difference will reverse in the foreseeable future and taxable profit will be available against which the temporary difference can be utilised.
The carrying amount of deferred income tax assets is reviewed at each reporting date and reduced to the extent that it is no longer probable that sufficient taxable profit will be available to allow all or part of the deferred income tax asset to be utilised.
Unrecognised deferred income tax assets are reassessed at each reporting date and are recognised to the extent that it has become probable that future taxable profit will allow the deferred tax asset to be recovered.
Deferred income tax assets and liabilities are measured at the tax rates that are expected to apply to the year when the asset is realised or the liability is settled, based on the tax rates (and tax laws) that have been enacted or substantively enacted at the reporting date.
Income taxes relating to items recognised directly in equity are recognised in equity and not in the statement of comprehensive income.
Unrecognised temporary differences
At 30 June 2018, there are no temporary differences associated with the Group's investments in subsidiaries being recognised as the parent is able to control the timing of the reversal of any temporary differences and it is not probable any temporary difference will reverse in the foreseeable future.
Tax consolidation legislation
Pro Medicus Limited and its wholly-owned Australian controlled entities implemented the tax consolidation legislation as of 1 July 2009. Members of the tax consolidated group have entered into a tax funding agreement. The head entity, Pro Medicus Limited, and the controlled entities in the tax consolidated group continue to account for their own current and deferred tax amounts under the tax funding agreement. The Group applies the Group allocation approach to determining the appropriate amount of current taxes and deferred taxes to allocate to members of the tax consolidated group. An allocation of income tax liabilities between the entities of the tax consolidated group will be made should the head entity default on its tax payment obligations. No such amounts have been recognised in the financial statements on the basis that the possibility of default is remote. In addition to its own current and deferred tax amounts, Pro Medicus Limited also recognises the current tax liabilities (or assets) and the deferred tax assets arising from unused tax losses and unused tax credits assumed from controlled entities in the tax consolidated group.
For
per
sona
l use
onl
y

Notes to the Financial Statements FOR THE YEAR ENDED 30 JUNE 2018
25
6. INCOME TAX (cont’d)
Consolidated
2018 2017
$’000 $’000
The major components of income tax expense are:
Statement of Comprehensive Income
Current income tax
Current income tax charge 5,099 3,865
Prior year adjustment (1) (167)
Deferred income tax
Relating to origination and reversal of temporary differences
(471) 393
Income tax expense reported in the statement of comprehensive income
4,627 4,091
Statement of Changes of Equity
Current income tax
Impact of the Employee Share Trust – vested share based payments
(1,283) -
Deferred income tax
Relating to origination and reversal of temporary differences due to the Employee Share Trust – unvested share based payments
(1,356) -
Income tax benefit reported directly in the Statement of Changes in Equity
(2,639) -
A reconciliation between tax expense and the product of accounting profit before income tax multiplied by the Group’s applicable income tax rate is as follows:
Accounting profit before tax 17,371 13,412
At the applicable statutory income tax rate in each country
- Australia 4,786 3,489
- United States of America 186 190
- Germany 227 368
Prior year adjustment (1) (167)
Expenditure not allowable for income tax purposes 348 330
Benefit from vested share based payments (171) -
Expenditure deductable for income tax purposes (266) -
Benefit from research and development tax offset (585) (569)
Other 103 450
Income tax expense reported in the statement of comprehensive income
4,627 4,091
For
per
sona
l use
onl
y
Notes to the Financial Statements FOR THE YEAR ENDED 30 JUNE 2018
26
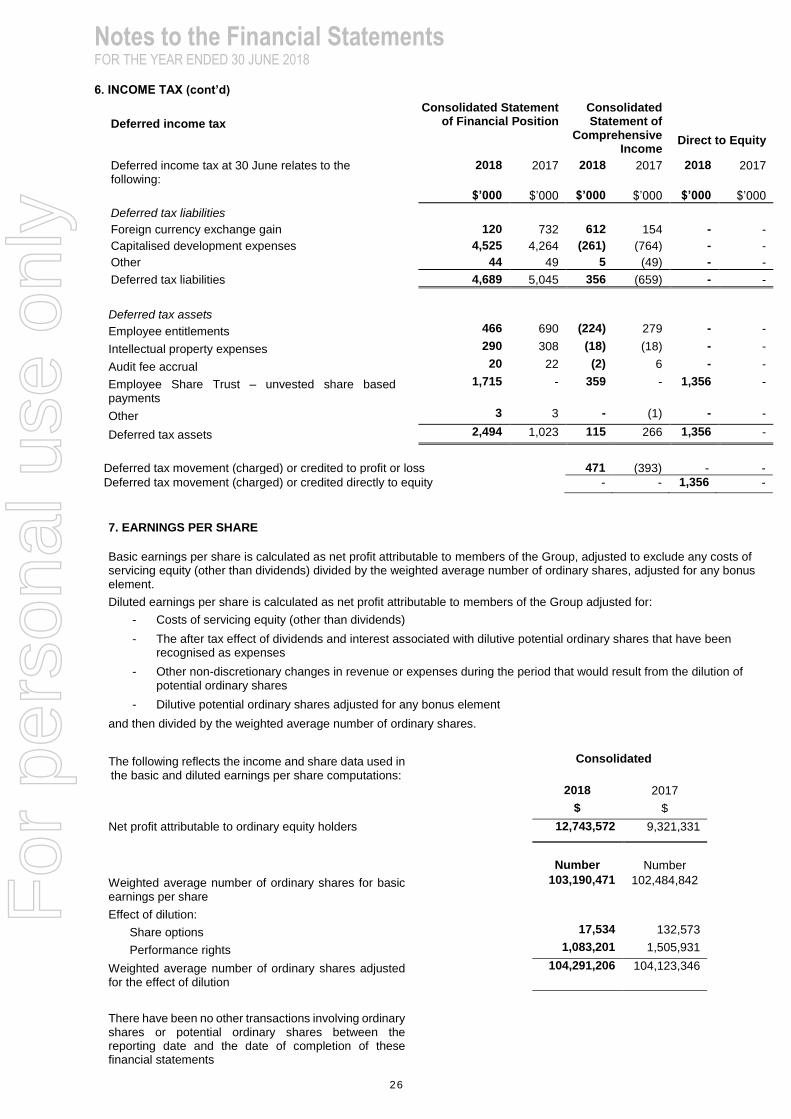
6. INCOME TAX (cont’d)
Deferred income tax
Consolidated Statement of Financial Position
Consolidated Statement of
Comprehensive Income
Direct to Equity
Deferred income tax at 30 June relates to the following:
2018 2017 2018 2017 2018 2017
$’000 $’000 $’000 $’000 $’000 $’000
Deferred tax liabilities
Foreign currency exchange gain 120 732 612 154 - -
Capitalised development expenses 4,525 4,264 (261) (764) - -
Other 44 49 5 (49) - -
Deferred tax liabilities 4,689 5,045 356 (659) - -
Deferred tax assets
Employee entitlements 466 690 (224) 279 - -
Intellectual property expenses 290 308 (18) (18) - -
Audit fee accrual 20 22 (2) 6 - -
Employee Share Trust – unvested share based payments
1,715 - 359 - 1,356 -
Other 3 3 - (1) - -
Deferred tax assets 2,494 1,023 115 266 1,356 -
Deferred tax movement (charged) or credited to profit or loss 471 (393) - -
Deferred tax movement (charged) or credited directly to equity - - 1,356 -
7. EARNINGS PER SHARE
Basic earnings per share is calculated as net profit attributable to members of the Group, adjusted to exclude any costs of servicing equity (other than dividends) divided by the weighted average number of ordinary shares, adjusted for any bonus element.
Diluted earnings per share is calculated as net profit attributable to members of the Group adjusted for:
- Costs of servicing equity (other than dividends)
- The after tax effect of dividends and interest associated with dilutive potential ordinary shares that have been recognised as expenses
- Other non-discretionary changes in revenue or expenses during the period that would result from the dilution of potential ordinary shares
- Dilutive potential ordinary shares adjusted for any bonus element
and then divided by the weighted average number of ordinary shares.
The following reflects the income and share data used in the basic and diluted earnings per share computations:
Consolidated
2018 2017
$ $
Net profit attributable to ordinary equity holders 12,743,572 9,321,331
Number
Number
Weighted average number of ordinary shares for basic earnings per share
103,190,471 102,484,842
Effect of dilution:
Share options 17,534 132,573
Performance rights 1,083,201 1,505,931
Weighted average number of ordinary shares adjusted for the effect of dilution
104,291,206 104,123,346
There have been no other transactions involving ordinary shares or potential ordinary shares between the reporting date and the date of completion of these financial statements
For
per
sona
l use
onl
y
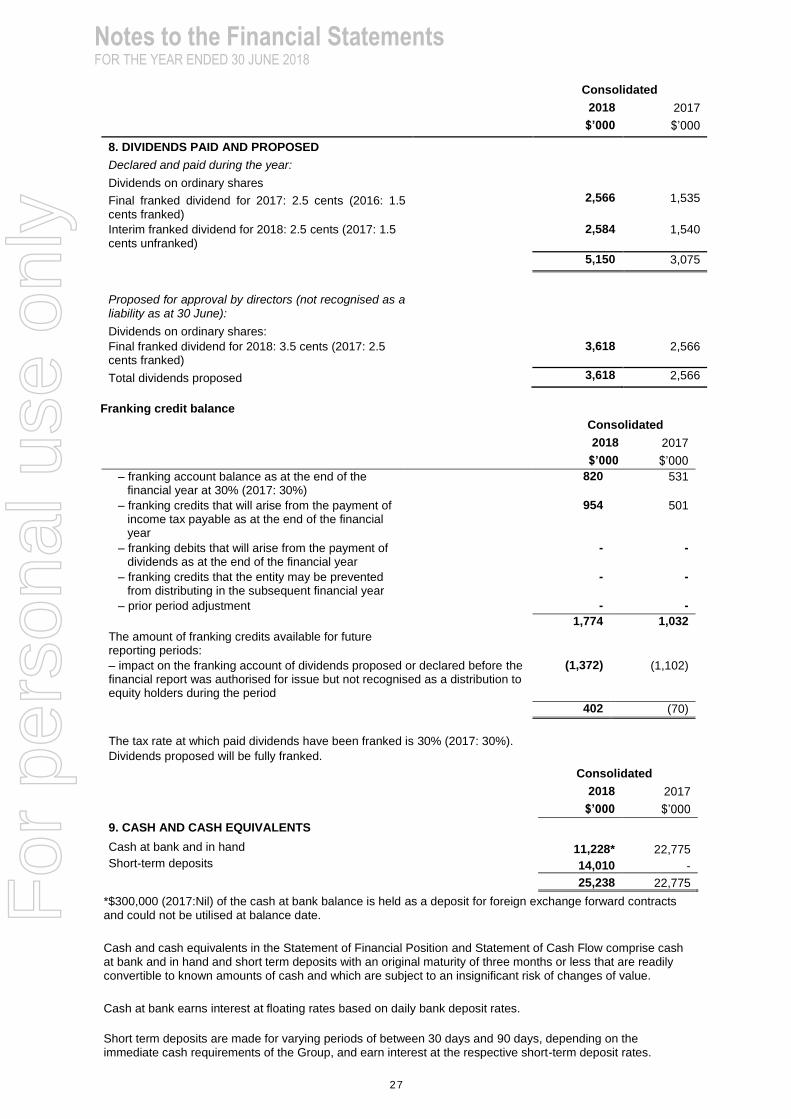
Notes to the Financial Statements FOR THE YEAR ENDED 30 JUNE 2018
27
Consolidated
2018 2017
$’000 $’000
8. DIVIDENDS PAID AND PROPOSED
Declared and paid during the year:
Dividends on ordinary shares
Final franked dividend for 2017: 2.5 cents (2016: 1.5 cents franked)
2,566 1,535
Interim franked dividend for 2018: 2.5 cents (2017: 1.5 cents unfranked)
2,584 1,540
5,150 3,075
Proposed for approval by directors (not recognised as a liability as at 30 June):
Dividends on ordinary shares:
Final franked dividend for 2018: 3.5 cents (2017: 2.5 cents franked)
3,618 2,566
Total dividends proposed 3,618 2,566
Franking credit balance
Consolidated
2018 2017
$’000 $’000
– franking account balance as at the end of the financial year at 30% (2017: 30%)
820 531
– franking credits that will arise from the payment of income tax payable as at the end of the financial year
954 501
– franking debits that will arise from the payment of dividends as at the end of the financial year
- -
– franking credits that the entity may be prevented from distributing in the subsequent financial year
- -
– prior period adjustment - -
1,774 1,032
The amount of franking credits available for future reporting periods:
– impact on the franking account of dividends proposed or declared before the financial report was authorised for issue but not recognised as a distribution to equity holders during the period
(1,372) (1,102)
402 (70)
The tax rate at which paid dividends have been franked is 30% (2017: 30%).
Dividends proposed will be fully franked.
Consolidated
2018 2017
$’000 $’000
9. CASH AND CASH EQUIVALENTS
Cash at bank and in hand 11,228* 22,775 Short-term deposits 14,010 -
25,238 22,775
*$300,000 (2017:Nil) of the cash at bank balance is held as a deposit for foreign exchange forward contracts and could not be utilised at balance date.
Cash and cash equivalents in the Statement of Financial Position and Statement of Cash Flow comprise cash at bank and in hand and short term deposits with an original maturity of three months or less that are readily convertible to known amounts of cash and which are subject to an insignificant risk of changes of value.
Cash at bank earns interest at floating rates based on daily bank deposit rates.
Short term deposits are made for varying periods of between 30 days and 90 days, depending on the immediate cash requirements of the Group, and earn interest at the respective short-term deposit rates.
For
per
sona
l use
onl
y

Notes to the Financial Statements FOR THE YEAR ENDED 30 JUNE 2018
28
9. CASH AND CASH EQUIVALENTS (cont’d)
The fair value of cash and cash equivalents is their carrying value. Consolidated 2018 2017 Reconciliation of net profit after tax to net cash flows from operations
$’000 $’000
Net profit 12,744 9,321 Adjustments for:
Depreciation of property, plant and equipment 150 179 Amortisation of intangible assets 4,788 4,104 Interest received classified in investing activities (56) (22)
Current income tax impact of vested share based payments recognised directly in equity
1,283 -
Fair value loss on financial instruments 193 -
Foreign currency (gain)/loss (656) 777
Share-based payment expense 564 613
Changes in assets and liabilities
(Increase)/decrease in trade and other receivables (3,854) 1,282 (Increase)/decrease in inventory - 32
(Increase)/decrease in deferred tax asset (115) (266) (Increase)/decrease in prepayments 97 (309) (Increase)/decrease in accrued revenue 35 (1,006) (Decrease)/increase in trade and other payables 154 235 (Decrease)/increase in income tax payable (1,134) (775) (Decrease)/increase in deferred tax liability (356) 659 (Decrease)/increase in employee entitlements 36 5
Net cash flow from operations 13,873 14,829
10. TRADE AND OTHER RECEIVABLES
Trade and intercompany receivables are recognised initially at fair value and subsequently measured at amortised cost less an allowance for any uncollectible amounts. A provision for impairment is made when there is objective evidence that the Group will not be able to collect the debts. Financial difficulty of the debtors is considered objective evidence by the Group. Bad debts are written off when identified.
Current Trade receivables 4,790 3,284 Provision for impairment - -
4,790 3,284
Other receivables 202 205
4,992 3,489
Non-current
Trade receivables 2,351 -
2,351 -
Fair value approximates carrying value due to the short term nature of receivables.
a) Allowance for impairment loss
Movements in the provision for impairment loss were as follows:
At 1 July - -
Charge to/(write back of) provision for the year - -
Utilised during the year - -
Foreign exchange translation - -
At 30 June - -
For
per
sona
l use
onl
y

Notes to the Financial Statements FOR THE YEAR ENDED 30 JUNE 2018
29
10. TRADE AND OTHER RECEIVABLES (CURRENT) (cont’d)
At June 30, the ageing analysis of trade receivables is as follows:
Total 0-30 days 31-60
days 61-90 days
+91 days +91 days
PDNI* PDNI* PDNI* CI**
2018 Consolidated 7,141 5,862 359 254 666 -
2017 Consolidated 3,284 1,978 290 712 304 -
* Past due not impaired (‘PDNI’) ** Considered Impaired (‘CI’) Payment terms on $3,499,656 (2017: $301,356) of trade receivables have been renegotiated. Of the $3,499,656, an amount of $2,351,000 is due after 12 months and the remainder within 12 months. The Company has been in direct contact with these debtors and is satisfied that payment will be received in full. 11. INVENTORY
Consolidated
2018 2017 $’000 $’000
Finished goods (at lower of cost and net realisable value)
54 54
Inventory write downs recognised as an expense during the year ended 30 June 2018 total nil (2017: nil) Inventories are valued at the lower of cost and net realisable value. The cost of finished goods represents the purchase cost. Net realisable value is the estimated selling price in the ordinary course of business, less estimated costs of completion and the estimated costs necessary to make the sale. 12. PLANT & EQUIPMENT
Plant and equipment is stated at cost less accumulated depreciation and any impairment in value.
Depreciation is calculated on a straight-line basis over the estimated useful life of the asset as follows:
2018 2017
Property Improvements 2 to 7 years 2 to 7 years
Motor Vehicles 4 to 5 years 4 to 5 years
Office Equipment 2 to 7 years 2 to 7 years
Furniture and Fittings 5 years 5 years
Research and Development Equipment 3 to 4 years 3 to 4 years
An item of plant and equipment is derecognised upon disposal or when no future economic benefits are expected to arise from the continued use of the asset.
Any gain or loss arising on de-recognition of the asset (calculated as the difference between the net disposal proceeds and the carrying amount of the item) is included in the statement of comprehensive income in the period the item is derecognised.
Impairment
The carrying values of plant and equipment are reviewed for impairment at each reporting date, with recoverable amount being estimated when events or changes in circumstances indicate that the carrying value may be impaired.
For an asset that does not generate largely independent cash inflows, the recoverable amount is determined for the cash generating unit to which the asset belongs.
If any such indication exists and where the carrying values exceed the estimated recoverable amount, the assets or cash-generating units are written down to their recoverable amount.
The recoverable amount of plant and equipment is the greater of fair value less costs to sell and value in use. In assessing value in use, the estimated future cash flows are discounted to their present value using a pre-tax discount rate that reflects current market assessments of the time value of money and the risks specific to the asset.
For
per
sona
l use
onl
y

Notes to the Financial Statements FOR THE YEAR ENDED 30 JUNE 2018
30
12. PLANT & EQUIPMENT (cont’d)
Property
Improvements
Motor
Vehicles
Office
Equipment
Furniture
& Fittings
Research &
Development
Equipment
Total
$’000 $’000 $’000 $’000 $’000 $’000
Year ended 30 June 2018
At 1 July 2017 net of accumulated
depreciation
17 34 196 36 - 283
Additions - - 211 - - 211
Disposals - - - - - -
Exchange differences - - 7 1 - 8
Depreciation charge for the year (3) (7) (122) (18) - (150)
At 30 June 2018 net of
accumulated depreciation
14 27 292 19 - 352
At 30 June 2018
Cost 333 488 2,480 409 209 3,919
Accumulated depreciation and
impairment
(319) (461) (2,188) (390) (209) (3,567)
Net carrying amount 14 27 292 19 - 352
Consolidated
Property
Improvements
Motor
Vehicles
Office
Equipment
Furniture
& Fittings
Research &
Development
Equipment
Total
$’000 $’000 $’000 $’000 $’000 $’000
Year ended 30 June 2017
At 1 July 2016 net of accumulated
depreciation
19 41 262 60 - 382
Additions - - 83 - - 83
Disposals - - - - - -
Exchange differences - - (2) (1) - (3)
Depreciation charge for the year (2) (7) (147) (23) - (179)
At 30 June 2017 net of
accumulated depreciation
17 34 196 36 - 283
At 30 June 2017
Cost 329 488 2,204 399 209 3,629
Accumulated depreciation and
impairment
(312) (454) (2,008) (363) (209) (3,346)
Net carrying amount 17 34 196 36 - 283
Consolidated
13. INTANGIBLE ASSETS
Intangible assets acquired separately are initially measured at cost. The cost of an intangible asset acquired in a business combination is its fair value as at date of acquisition. Following initial recognition, intangible assets with a finite life are carried at cost less any accumulated amortisation and any accumulated impairment losses.
Amortisation is calculated on a straight-line basis over the estimated useful life of the asset.
Intangible assets, excluding development costs, created within the business are not capitalised and expenditure is charged against profits in the period in which the expenditure is incurred.
Intangible assets are tested for impairment where an indicator of impairment exists, either individually or at the cash generating unit level. The recoverable amount is estimated and an impairment loss is recognised to the extent that the recoverable amount is lower than the carrying value.
The amortisation period and method is renewed at each financial year end and adjustments, where applicable, are made on a prospective basis.
Research and development costs
Research costs are expensed as incurred.
For
per
sona
l use
onl
y

Notes to the Financial Statements FOR THE YEAR ENDED 30 JUNE 2018
31
13. INTANGIBLE ASSETS (cont’d)
An intangible asset arising from development expenditure on an internal project is recognised only when the group can demonstrate the technical feasibility of completing the intangible asset so that it will be available for sale or use, its intention to complete and its ability to use or sell the asset, how the asset will generate future economic benefits, the availability of resources to complete the development and the ability to measure reliably the expenditure attributable to the intangible asset during its development. Following initial recognition of the development expenditure, the cost model is applied requiring the asset be carried at cost less any accumulated amortisation and accumulated impairment losses. Any expenditure so capitalised is amortised on a straight line basis over the period of expected benefit from the related project (5 years).
Development expenditure includes costs of materials and services and salaries and wages and other employee related costs arising from the generation of the intangible asset.
The carrying value of an intangible asset arising from development expenditure is tested for impairment annually when the asset is not yet available for use or more frequently when an indication of impairment arises during the reporting period.
Intellectual Property – Software
Three separately identifiable intangible assets, in the form of software intellectual property, have previously been identified in the business acquisition of Visage Imaging;
Visage PACS
Visage MagicWeb and
Amira
Following initial recognition, Intellectual property is measured at cost less any accumulated amortisation. A useful life of 5 years has been determined.
Software Licenses
The Group identified a separate intangible asset in the form of software licenses, in the business acquisition of Visage Imaging.
Following initial recognition, software licenses are measured at cost less any accumulated amortisation. A useful life of 4 years has been determined.
Customer List
The Group identified a separate intangible asset in the form of a customer list, in the business acquisition of Visage Imaging.
Following initial recognition, the customer list is measured at cost less any accumulated amortisation. A useful life of 4 years has been determined.
Intellectual
Property
i)
Development
Costs
ii)
Software
Licenses
iii)
Total
$’000 $’000 $’000 $’000
Year ended 30 June 2018
At 1 July 2017 net of accumulated
amortisation and impairment
- 15,477 1 15,478
Additions - internal development - 6,164 - 6,164
Disposals - - - -
Exchange differences - - - -
Amortisation charge for the year - (4,788) - (4,788)
At 30 June 2018 net of
accumulated amortisation and
impairment
- 16,853 1 16,854
At 30 June 2018
Cost 1,848 39,673 312 41,833
Accumulated amortisation and
impairment
(1,848) (22,820) (311) (24,979)
Net carrying amount - 16,853 1 16,854
Consolidated
For
per
sona
l use
onl
y

Notes to the Financial Statements FOR THE YEAR ENDED 30 JUNE 2018
32
13. INTANGIBLE ASSETS (cont’d)
Intellectual
Property
i)
Development
Costs
ii)
Software
Licenses
iii)
Total
Year ended 30 June 2017
At 1 July 2016 net of accumulated
amortisation and impairment
- 13,510 2 13,512
Additions - internal development - 6,070 - 6,070
Disposals - - - -
Exchange differences - - - -
Amortisation charge for the year - (4,103) (1) (4,104)
At 30 June 2017 net of
accumulated amortisation and
impairment
- 15,477 1 15,478
At 30 June 2017
Cost 1,848 38,725 294 40,867
Accumulated amortisation and
impairment
(1,848) (23,248) (293) (25,389)
Net carrying amount - 15,477 1 15,478
i) Intellectual property was acquired in 2009 through the Visage Imaging business combination and is carried at cost less accumulated amortisation. Three separately identifiable intangible assets, in the form of software intellectual property, have been identified in the business acquisition of Visage Imaging; Visage CS, Visage PACS and Amira. These intangible assets have been assessed as having a finite life and have been fully amortised using the straight line method over a period of 5 years, commencing February 2009. Amira was sold in July 2012. ii) Development costs have been capitalised. This intangible asset has been assessed as having a finite life and is amortised using the straight line method over a period of 5 years. As at 30 June 2018 the carrying values of capitalised development costs are Visage PACS ($11,579,921) RIS ($4,806,974) and Visage MagicWeb ($466,030), all sit within the Australian operating segment. The Group undertook an impairment assessment of the capitalised development costs at an individual product level as at 30 June 2018. The recoverable amount of development costs have been determined based on a value in use calculation using cash flow projections from financial budgets approved by the Board of Directors covering a five-year period. The projected cash flows were updated to reflect the change in forecast revenues and a post-tax discount rate of 17% (30 June 2017:17%) was applied. Cash flows beyond a 5 year period have been extrapolated using a 2.5% growth rate (30 June 2017: 2.5%). The Groups recoverable value was in excess of the carrying value using the value in use calculation and as such no impairment charges were recorded at 30 June 2018. Key assumptions used in value in use calculations
The calculation of value in use for development costs is most sensitive to the following assumptions: - Revenue forecasts - Discount rates - Growth rates used to extrapolate cash flows beyond the forecast period
Revenue forecasts – Revenue forecasts are based on current year consolidated budgets for each
geographical segment. Estimated growth rates are then used to forecast the following 4 years revenue for each product used in each geographical segment. Total forecast segment growth rates range from 0% to 36% (2017: 0% to 57%) across the 4 year period. Discount rates – The discount rate applied to the cash flow projections have been assessed to reflect the time value of money and the perceived risk profile of the industry in which each cash generating unit (CGU) operates. The post-tax discount rate applied was 17% (2017:17%). Growth rate estimates – rates are based on industry based customer price index (CPI) forecasts. The long term rate of 2.5% (2017: 2.5%) was used in the current assessment. Sensitivity to changes in assumptions
With regard to the assessment of value in use of development costs, the estimated recoverable amount is in excess of its carrying value for each product, however adverse changes in assumptions could result in an impairment loss. Management has considered the possible change in each of the key assumptions applied to the respective capitalised development costs recoverable amount assessments. A reasonably
For
per
sona
l use
onl
y

Notes to the Financial Statements FOR THE YEAR ENDED 30 JUNE 2018
33
13. INTANGIBLE ASSETS (cont’d)
possible adverse change in the revenue forecasts for the RIS product could have the potential to give rise to circumstances where the recoverable amount may be lower than the carrying amount. To illustrate the sensitivity of this assumption, if forecast revenues of the RIS product were to decrease materially, that is in the range of 10 – 15%, across the five year forecast period without the implementation of mitigation plans, cost reductions or restructure which management would look to do if such decreases were to arise, this could lead to a future impairment write-down of approximately $0.1 - $2.0 million. 14. TRADE AND OTHER PAYABLES
Trade payables and other payables are carried at amortised cost and represent liabilities for goods and services provided to the Group prior to the end of the financial year that are unpaid and arise when the Group becomes obliged to make future payments in respect of the purchase of these goods and services.
Consolidated
2018 2017
$’000 $’000
Current
Trade payables 565 446
Other payables and accruals 1,434 2,086
1,999 2,532
Deferred Income 992 926
2,991 3,458
(i) Trade payables are non-interest bearing and are normally settled on 30-day terms. (ii) Other payables, other than inter-company payables are non-interest bearing and have an average term of 30 days. Fair value approximates carrying value due to the short term nature of trade and other payables. 15. PROVISIONS
Provisions are recognised when the Group has a present obligation (legal or constructive) as a result of a past event, it is probable that an outflow of resources embodying economic benefits will be required to settle the obligation and a reliable estimate can be made of the amount of the obligation. Provisions are measured at the present value of management’s best estimate of the expenditure required to settle the present obligation at the reporting date. When the Group expects some or all of a provision to be reimbursed, for example under an insurance contract, the reimbursement is recognised as a separate asset but only when the reimbursement is virtually certain. The expense relating to any provision is presented in the statement of comprehensive income net of any reimbursement. Dividends payable are recognised when a legal or constructive obligation to pay the dividend arises, typically following approval of the dividend at a meeting of directors. Employee leave benefits
Provision is made for employee entitlement benefits accumulated as a result of employees rendering services up to the reporting date. (i) Annual leave and sick leave The liability for annual leave is recognised and measured as the present value of expected future payments to be made in respect of services provided by employees up to the reporting date, using the projected unit credit method. Consideration is given to expected future wage and salary levels, experience of employee departures, and periods of service. Expected future payments are discounted using market yields at the reporting date on high quality corporate bonds with terms to maturity and currencies that match, as closely as possible the estimated future cash outflows. Expenses for non-accumulating sick leave are recognised when the leave is taken and are measured at the rates paid. (ii) Long service leave The liability for long service leave is recognised and measured as the present value of expected future payments to be made in respect of services provided by employees up to the reporting date, using the projected unit credit method. Consideration is given to expected future wage and salary levels, experience of employee departures, and periods of service. Expected future payments are discounted using market yields at the reporting date on high quality corporate bonds with terms to maturity and currencies that match, as closely as possible the estimated future cash outflows.
For
per
sona
l use
onl
y
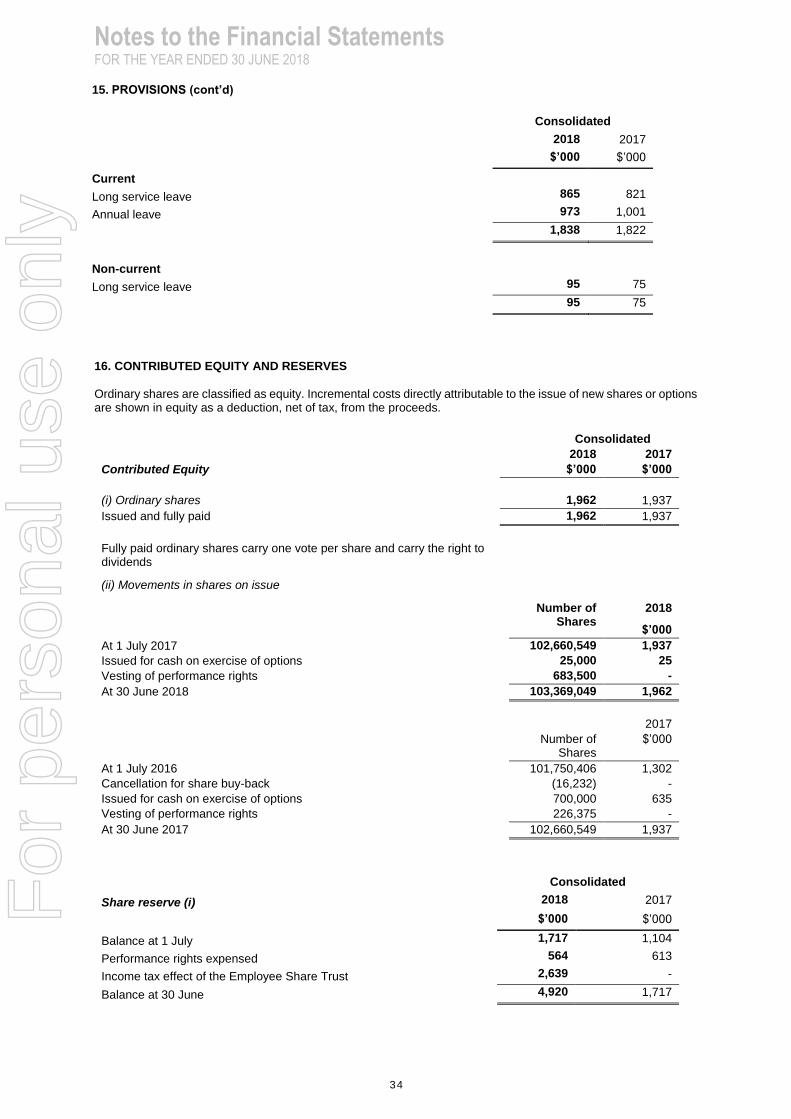
Notes to the Financial Statements FOR THE YEAR ENDED 30 JUNE 2018
34
15. PROVISIONS (cont’d)
Consolidated
2018 2017
$’000 $’000
Current
Long service leave 865 821
Annual leave 973 1,001
1,838 1,822
Non-current
Long service leave 95 75
95 75
16. CONTRIBUTED EQUITY AND RESERVES
Ordinary shares are classified as equity. Incremental costs directly attributable to the issue of new shares or options are shown in equity as a deduction, net of tax, from the proceeds.
Consolidated
2018 2017
Contributed Equity $’000 $’000
(i) Ordinary shares 1,962 1,937
Issued and fully paid 1,962 1,937
Fully paid ordinary shares carry one vote per share and carry the right to dividends
(ii) Movements in shares on issue
Number of Shares
2018
$’000
At 1 July 2017 102,660,549 1,937
Issued for cash on exercise of options 25,000 25
Vesting of performance rights 683,500 -
At 30 June 2018 103,369,049 1,962
2017
Number of Shares
$’000
At 1 July 2016 101,750,406 1,302
Cancellation for share buy-back (16,232) -
Issued for cash on exercise of options 700,000 635
Vesting of performance rights 226,375 -
At 30 June 2017 102,660,549 1,937
Consolidated
Share reserve (i) 2018 2017
$’000 $’000
Balance at 1 July 1,717 1,104
Performance rights expensed 564 613
Income tax effect of the Employee Share Trust 2,639 -
Balance at 30 June 4,920 1,717
For
per
sona
l use
onl
y

Notes to the Financial Statements FOR THE YEAR ENDED 30 JUNE 2018
35
(i) Share reserve
The share reserve is used to record the value of share based payments provided to employees, including KMP, as part of their remuneration. Refer to note 17 for further details of these plans. (ii) Foreign currency translation reserve
The foreign currency translation reserve is used to record exchange differences arising from the translation of the financial statements of foreign subsidiaries and for exchange differences arising from long term loan accounts resulting from net investment in subsidiaries. Capital Management
When managing capital, management's objective is to ensure the entity continues as a going concern as well as to maintain optimal returns to shareholders and benefits for other stakeholders. Management also aims to maintain a capital structure that ensures the lowest cost of capital available to the entity. Management review the capital structure to take advantage of favourable costs of capital or high returns on assets. As the market is constantly changing, management may change the amount of dividends to be paid to shareholders, return capital to shareholders, or issue new shares. During the year, the company paid dividends of $5,150,121 (2017: $3,074,568). 17. SHARE BASED PAYMENTS
(i) Equity settled transactions: The Group provides benefits to its employees (including KMP) in the form of share-based payments, whereby employees render services in exchange for shares or rights over shares (equity-settled transactions). There are currently two plans in place to provide these benefits: • The Employee Share Option Plan (ESOP), which provides benefits to directors, senior executives and other employees. • The Long Term Incentive Plan (LTIP), which provides benefits to senior executives and other employees.
The cost of these equity-settled transactions with employees (for awards granted after 7 November 2002 that were unvested at 1 January 2005) is measured by reference to the fair value of the equity instruments at the date at which they are granted. The fair value is determined using either a Black Scholes model or Monte Carlo simulation model.
In valuing equity-settled transactions, no account is taken of any vesting conditions, other than conditions linked to the price of the shares of Pro Medicus Limited (market conditions) if applicable. The cost of equity-settled transactions is recognised, together with a corresponding increase in equity, over the period in which the performance and/or service conditions are fulfilled (the vesting period), ending on the date on which the relevant employees become fully entitled to the award (the vesting date). At each subsequent reporting date until vesting, the cumulative charge to the statement of comprehensive income is the product of:
(i) The grant date fair value of the award; (ii) For options with non-market vesting conditions, the current best estimate of the number of awards that will vest, taking into account such factors as the likelihood of employee turnover during the vesting period and the likelihood of non-market performance conditions being met; and (iii) The expired portion of the vesting period.
16. CONTRIBUTED EQUITY AND RESERVES (cont’d)
Foreign currency translation reserve (ii)
Consolidated
2018 2017
$’000 $’000
Balance at 1 July 145 117
Foreign currency movement 7 28
Balance at 30 June 152 145
Retained earnings
Balance at 1 July 31,108 24,862
Net profit for the year 12,744 9,321
Dividends (5,150) (3,075)
Balance at 30 June 38,702 31,108
For
per
sona
l use
onl
y
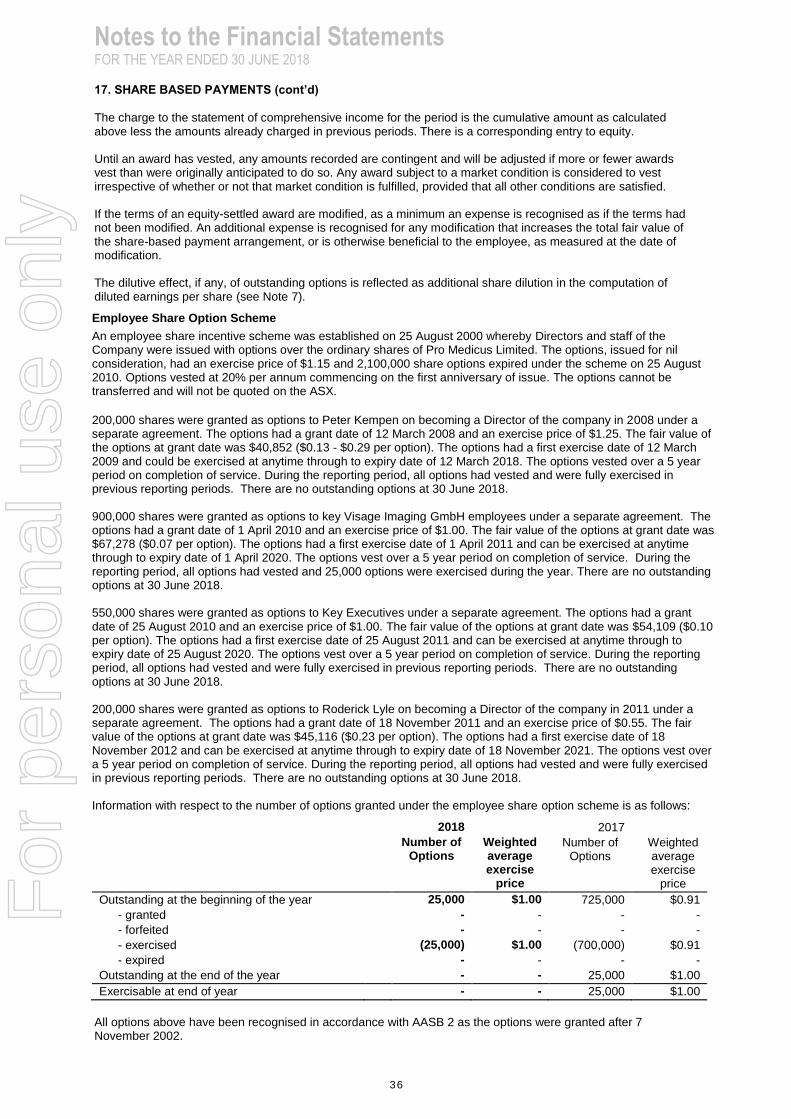
Notes to the Financial Statements FOR THE YEAR ENDED 30 JUNE 2018
36
17. SHARE BASED PAYMENTS (cont’d)
The charge to the statement of comprehensive income for the period is the cumulative amount as calculated above less the amounts already charged in previous periods. There is a corresponding entry to equity. Until an award has vested, any amounts recorded are contingent and will be adjusted if more or fewer awards vest than were originally anticipated to do so. Any award subject to a market condition is considered to vest irrespective of whether or not that market condition is fulfilled, provided that all other conditions are satisfied. If the terms of an equity-settled award are modified, as a minimum an expense is recognised as if the terms had not been modified. An additional expense is recognised for any modification that increases the total fair value of the share-based payment arrangement, or is otherwise beneficial to the employee, as measured at the date of modification. The dilutive effect, if any, of outstanding options is reflected as additional share dilution in the computation of diluted earnings per share (see Note 7).
Employee Share Option Scheme
An employee share incentive scheme was established on 25 August 2000 whereby Directors and staff of the Company were issued with options over the ordinary shares of Pro Medicus Limited. The options, issued for nil consideration, had an exercise price of $1.15 and 2,100,000 share options expired under the scheme on 25 August 2010. Options vested at 20% per annum commencing on the first anniversary of issue. The options cannot be transferred and will not be quoted on the ASX.
200,000 shares were granted as options to Peter Kempen on becoming a Director of the company in 2008 under a separate agreement. The options had a grant date of 12 March 2008 and an exercise price of $1.25. The fair value of the options at grant date was $40,852 ($0.13 - $0.29 per option). The options had a first exercise date of 12 March 2009 and could be exercised at anytime through to expiry date of 12 March 2018. The options vested over a 5 year period on completion of service. During the reporting period, all options had vested and were fully exercised in previous reporting periods. There are no outstanding options at 30 June 2018. 900,000 shares were granted as options to key Visage Imaging GmbH employees under a separate agreement. The options had a grant date of 1 April 2010 and an exercise price of $1.00. The fair value of the options at grant date was $67,278 ($0.07 per option). The options had a first exercise date of 1 April 2011 and can be exercised at anytime through to expiry date of 1 April 2020. The options vest over a 5 year period on completion of service. During the reporting period, all options had vested and 25,000 options were exercised during the year. There are no outstanding options at 30 June 2018. 550,000 shares were granted as options to Key Executives under a separate agreement. The options had a grant date of 25 August 2010 and an exercise price of $1.00. The fair value of the options at grant date was $54,109 ($0.10 per option). The options had a first exercise date of 25 August 2011 and can be exercised at anytime through to expiry date of 25 August 2020. The options vest over a 5 year period on completion of service. During the reporting period, all options had vested and were fully exercised in previous reporting periods. There are no outstanding options at 30 June 2018. 200,000 shares were granted as options to Roderick Lyle on becoming a Director of the company in 2011 under a separate agreement. The options had a grant date of 18 November 2011 and an exercise price of $0.55. The fair value of the options at grant date was $45,116 ($0.23 per option). The options had a first exercise date of 18 November 2012 and can be exercised at anytime through to expiry date of 18 November 2021. The options vest over a 5 year period on completion of service. During the reporting period, all options had vested and were fully exercised in previous reporting periods. There are no outstanding options at 30 June 2018. Information with respect to the number of options granted under the employee share option scheme is as follows:
2018 2017
Number of Options
Weighted average exercise
price
Number of Options
Weighted average exercise
price
Outstanding at the beginning of the year 25,000 $1.00 725,000 $0.91
- granted - - - -
- forfeited - - - -
- exercised (25,000) $1.00 (700,000) $0.91
- expired - - - -
Outstanding at the end of the year - - 25,000 $1.00
Exercisable at end of year - - 25,000 $1.00
All options above have been recognised in accordance with AASB 2 as the options were granted after 7 November 2002.
For
per
sona
l use
onl
y
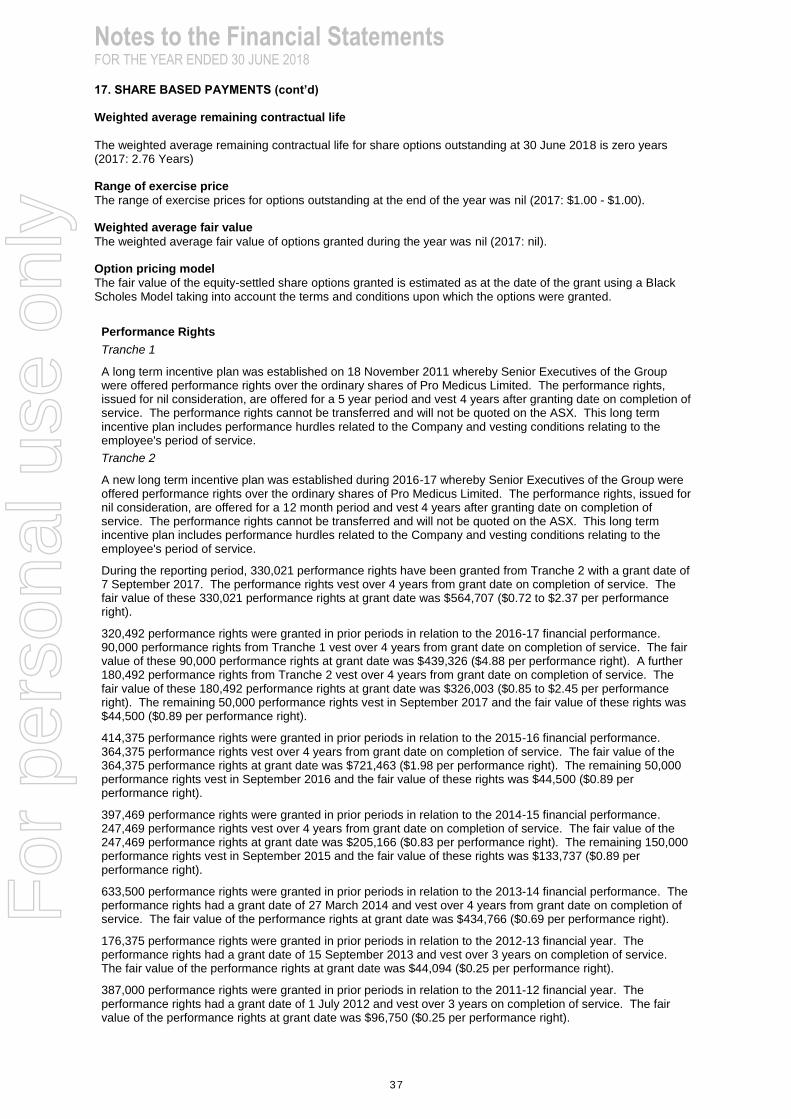
Notes to the Financial Statements FOR THE YEAR ENDED 30 JUNE 2018
37
17. SHARE BASED PAYMENTS (cont’d) Weighted average remaining contractual life
The weighted average remaining contractual life for share options outstanding at 30 June 2018 is zero years (2017: 2.76 Years) Range of exercise price
The range of exercise prices for options outstanding at the end of the year was nil (2017: $1.00 - $1.00). Weighted average fair value
The weighted average fair value of options granted during the year was nil (2017: nil). Option pricing model
The fair value of the equity-settled share options granted is estimated as at the date of the grant using a Black Scholes Model taking into account the terms and conditions upon which the options were granted.
Performance Rights
Tranche 1
A long term incentive plan was established on 18 November 2011 whereby Senior Executives of the Group were offered performance rights over the ordinary shares of Pro Medicus Limited. The performance rights, issued for nil consideration, are offered for a 5 year period and vest 4 years after granting date on completion of service. The performance rights cannot be transferred and will not be quoted on the ASX. This long term incentive plan includes performance hurdles related to the Company and vesting conditions relating to the employee's period of service.
Tranche 2
A new long term incentive plan was established during 2016-17 whereby Senior Executives of the Group were offered performance rights over the ordinary shares of Pro Medicus Limited. The performance rights, issued for nil consideration, are offered for a 12 month period and vest 4 years after granting date on completion of service. The performance rights cannot be transferred and will not be quoted on the ASX. This long term incentive plan includes performance hurdles related to the Company and vesting conditions relating to the employee's period of service.
During the reporting period, 330,021 performance rights have been granted from Tranche 2 with a grant date of 7 September 2017. The performance rights vest over 4 years from grant date on completion of service. The fair value of these 330,021 performance rights at grant date was $564,707 ($0.72 to $2.37 per performance right).
320,492 performance rights were granted in prior periods in relation to the 2016-17 financial performance. 90,000 performance rights from Tranche 1 vest over 4 years from grant date on completion of service. The fair value of these 90,000 performance rights at grant date was $439,326 ($4.88 per performance right). A further 180,492 performance rights from Tranche 2 vest over 4 years from grant date on completion of service. The fair value of these 180,492 performance rights at grant date was $326,003 ($0.85 to $2.45 per performance right). The remaining 50,000 performance rights vest in September 2017 and the fair value of these rights was $44,500 ($0.89 per performance right).
414,375 performance rights were granted in prior periods in relation to the 2015-16 financial performance. 364,375 performance rights vest over 4 years from grant date on completion of service. The fair value of the 364,375 performance rights at grant date was $721,463 ($1.98 per performance right). The remaining 50,000 performance rights vest in September 2016 and the fair value of these rights was $44,500 ($0.89 per performance right).
397,469 performance rights were granted in prior periods in relation to the 2014-15 financial performance. 247,469 performance rights vest over 4 years from grant date on completion of service. The fair value of the 247,469 performance rights at grant date was $205,166 ($0.83 per performance right). The remaining 150,000 performance rights vest in September 2015 and the fair value of these rights was $133,737 ($0.89 per performance right).
633,500 performance rights were granted in prior periods in relation to the 2013-14 financial performance. The performance rights had a grant date of 27 March 2014 and vest over 4 years from grant date on completion of service. The fair value of the performance rights at grant date was $434,766 ($0.69 per performance right).
176,375 performance rights were granted in prior periods in relation to the 2012-13 financial year. The performance rights had a grant date of 15 September 2013 and vest over 3 years on completion of service. The fair value of the performance rights at grant date was $44,094 ($0.25 per performance right).
387,000 performance rights were granted in prior periods in relation to the 2011-12 financial year. The performance rights had a grant date of 1 July 2012 and vest over 3 years on completion of service. The fair value of the performance rights at grant date was $96,750 ($0.25 per performance right).
For
per
sona
l use
onl
y

Notes to the Financial Statements FOR THE YEAR ENDED 30 JUNE 2018
38
17. SHARE BASED PAYMENTS (cont’d)
Information with respect to the number of performance rights granted under the long term incentive scheme is as follows:
2018 2017
Number of Performance
Rights
Number of Performance
Rights
Outstanding at the beginning of the year 1,565,836 1,471,719
- granted 330,021 320,492
- forfeited - -
- exercised (683,500) (226,375)
- expired (5,748) -
Outstanding at the end of the year 1,206,609 1,565,836
Exercisable at end of year - -
Weighted average remaining contractual life
The weighted average remaining contractual life for performance rights at 30 June 2018 is 2.6 years (2017: 1.8 Years) Performance rights pricing model (Tranche 1)
The fair value of the equity-settled performance rights granted for Tranche 1 is estimated as at the date of the grant using a Black Scholes Model taking into account the terms and conditions upon which the performance rights were granted.
The following table lists the inputs to the models used:
2018 2017 Dividend yield Nil 0.6% Expected volatility Nil 40% Risk-free interest rate Nil 3.30% Expected life of performance rights Nil 1-4 years Performance rights exercise price Nil $0.00 Fair value of performance rights at measurement date (per performance right)
Nil $0.89-$4.88
Performance rights pricing model (Tranche 2)
The fair value of the equity-settled performance rights granted for Tranche 2 is estimated as at the date of the grant using Black Sholes and Monte Carlo Simulation Models taking into account the terms and conditions upon which the performance rights were granted.
The following table lists the inputs to the models used:
2018 2017 Dividend yield 0.82% 0.6% Expected volatility 15.56% 40% Risk-free interest rate 3.30% 3.30% Expected life of performance rights 4 years 1-4 years Performance rights exercise price $0.00 $0.00 Fair value of performance rights at measurement date (per performance right)
$0.75-2.37 $0.85-$2.45
18. COMMITMENTS
Leases
The determination of whether an arrangement is or contains a lease is based on the substance of the arrangement and requires an assessment of whether the fulfilment of the arrangement is dependent on the use of a specific asset or assets and the arrangement conveys a right to use the asset.
Operating lease commitments – Group as lessee
Leases where the lessor retains substantially all the risks and benefits of ownership of the asset are classified as operating leases.
Operating lease payments are recognised as an expense in the statement of comprehensive income on a straight-line basis over the lease term.
For
per
sona
l use
onl
y

Notes to the Financial Statements FOR THE YEAR ENDED 30 JUNE 2018
39
18. COMMITMENTS (cont’d)
The US operations have entered into a commercial property lease for office premises from 1 December 2015 for a 5 year period. The German operations have entered into a commercial property lease for office premises and can give notice to vacate 6 months prior to 31 March each year, whereby they sign into another 12 months.
The German operations also have several motor vehicle leases which expire at various stages between September 2018 and September 2021
Consolidated
2018 2017
Future minimum rentals payable under non-cancellable operating lease as at 30 June are as follows:
$’000 $’000
– Within one year 380 350
– After one year and not more than five years 343 456
– After more than five years - -
723 806
21. KEY MANAGEMENT PERSONNEL (a) Compensation for key management personnel
Consolidated
2018 2017
Short-term employee benefits 2,955,465 3,184,596 Post-employment benefits 114,160 133,675 Other long-term benefits 30,878 18,683
Share-based payment 279,351 322,321
Total compensation 3,379,854 3,659,275
(b) Loans to Key Management Personnel
No loans are made to Key Management Personnel or staff.
(c) Other transactions and balances with Key Management Personnel
Purchases
During the year lease payments of $169,476 (2017: $169,476) in respect of the Group’s operating premises at 450 Swan Street, Richmond were paid to Champagne Properties Pty. Ltd., an entity controlled by S. Hupert and A. Hall. Commercial arrangements on an ‘arm’s length basis’ have been determined by an independent assessment of rental and lease terms. The current arrangement is on a month to month basis.
19. EVENTS AFTER THE BALANCE SHEET DATE
On 16 August 2018, the directors of Pro Medicus Limited declared a final dividend on ordinary shares in respect of the 2018 financial year. This dividend comprises a normal dividend of 3.5 cents per share. The total amount of the dividend is $3,617,917 which represents a franked dividend of a total of 3.5 cents per share. The dividend has not been provided for in the 30 June 2018 financial statements.
20. AUDITOR’S REMUNERATION Consolidated
2018 2017
Amounts received or due and receivable by Ernst & Young (Australia) for:
– an audit or review of the financial report of the Company and any other entity in the Group
197,757 169,895
– other services in relation to the Company or Group 96,133 55,590
Amounts received or due and receivable by related practices of Ernst & Young (Australia):
293,890 225,485
- audit of the financial report of Visage Imaging GmbH 87,411 59,143
– other services in relation to Visage Imaging GmbH 27,753 48,146
409,054 332,774
For
per
sona
l use
onl
y

Notes to the Financial Statements FOR THE YEAR ENDED 30 JUNE 2018
40
22. RELATED PARTY DISCLOSURE (a) Subsidiaries
The consolidated financial statements include the financial statements of Pro Medicus Limited and the subsidiaries listed in the following table.
% Equity interest Investment $’000 Name Country of
incorporation 2018 2017 2018 2017
Promed (USA) Pty Ltd Australia 100 100 - - PME IP Australia Pty Ltd Australia 100 100 - - Visage Imaging (Aust) Pty Ltd Australia 100 100 - - Visage Ventures Pty Ltd Australia 100 - - - PME Nominees Pty Ltd (ATF Employee Share Trust)
Australia 100 100 - -
Pro Medicus (USA) LLC United States 100 100 - - Visage Ventures Inc United States 100 - - - Visage Imaging Inc United States 100 100 2,389 2,389 Visage Imaging GmbH Germany 100 100 3,638 3,638
6,027 6,027
(b) Ultimate parent
Pro Medicus Limited is the ultimate Australian parent entity and the ultimate parent of the Group. (c) Key management personnel
Details relating to KMPs, including remuneration paid, are included in Note 21. (d) Transactions with related parties
The following table provides the total amount of transactions that were entered into with related parties for the relevant financial year.
Sales to related
parties $’000
Purchases from related parties
$’000
Other transactions with related parties $’000
Related party Consolidated Champagne Properties Pty Ltd – Rental lease
2018 - 169 -
Champagne Properties Pty Ltd – Rental lease
2017 - 169 -
Terms and conditions of transactions with related parties Sales to and purchases from related parties are made in arm’s length transactions both at normal market prices and on normal commercial terms. Outstanding balances at year end are unsecured, interest free and payable on demand. Entities within the Group that own the intellectual property earn a royalty between 30% - 97% from the sales made by other entities within the Group. Development costs undertaken by the German operations are reimbursed by the parent on commercial terms. 23. FINANCIAL RISK MANAGEMENT OBJECTIVES AND POLICIES
The Group’s principal financial instruments are cash and short-term deposits.
The main purpose of these financial instruments is to provide finance for the Group’s operations. The Group has various other financial assets and liabilities such as trade receivables and trade payables, which arise directly from its operations. The main risks arising from the Group’s financial instruments are foreign currency risk, interest risk and credit risk. The Board manages each of these risks as detailed below.
Foreign currency risk
(i) Functional and presentation currency
Both the functional and presentation currency of Pro Medicus Limited and its Australian subsidiaries are Australian dollars ($). The United States subsidiaries’ functional currency is United States Dollars. The subsidiary in Germany has a functional currency of Euro. Foreign subsidiaries are translated to presentation currency for consolidated reporting.
For
per
sona
l use
onl
y
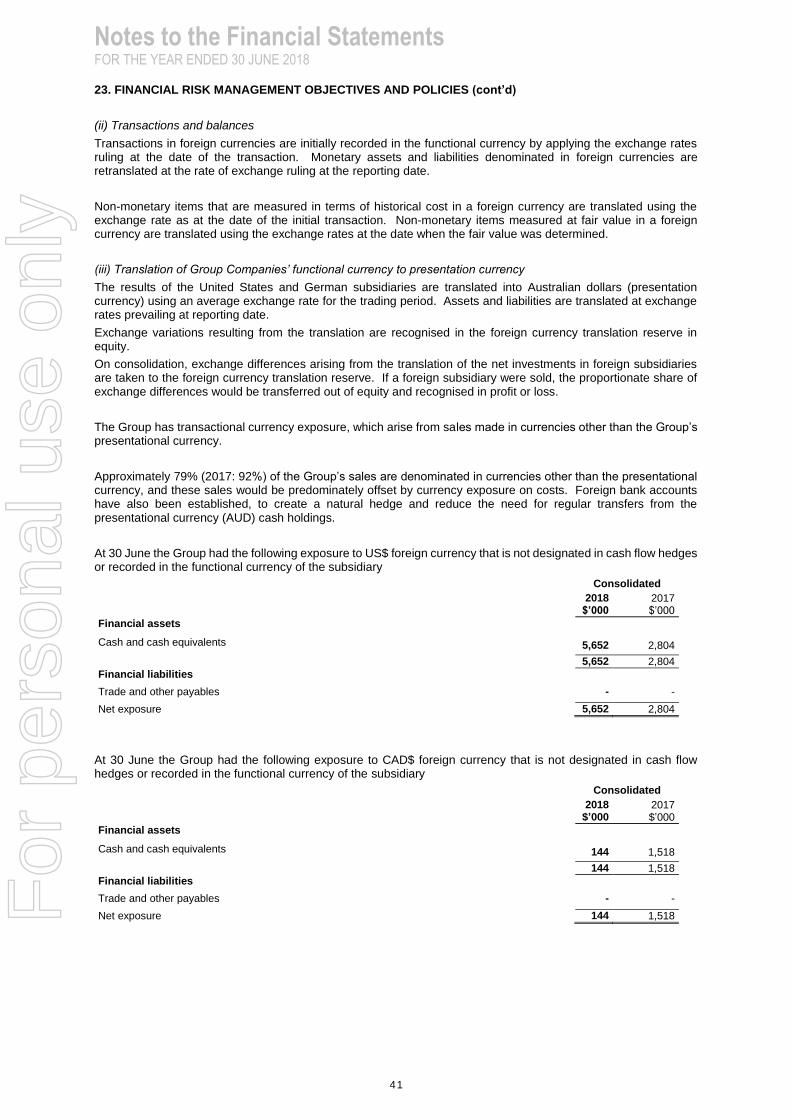
Notes to the Financial Statements FOR THE YEAR ENDED 30 JUNE 2018
41
23. FINANCIAL RISK MANAGEMENT OBJECTIVES AND POLICIES (cont’d)
(ii) Transactions and balances
Transactions in foreign currencies are initially recorded in the functional currency by applying the exchange rates ruling at the date of the transaction. Monetary assets and liabilities denominated in foreign currencies are retranslated at the rate of exchange ruling at the reporting date.
Non-monetary items that are measured in terms of historical cost in a foreign currency are translated using the exchange rate as at the date of the initial transaction. Non-monetary items measured at fair value in a foreign currency are translated using the exchange rates at the date when the fair value was determined.
(iii) Translation of Group Companies’ functional currency to presentation currency
The results of the United States and German subsidiaries are translated into Australian dollars (presentation currency) using an average exchange rate for the trading period. Assets and liabilities are translated at exchange rates prevailing at reporting date.
Exchange variations resulting from the translation are recognised in the foreign currency translation reserve in equity.
On consolidation, exchange differences arising from the translation of the net investments in foreign subsidiaries are taken to the foreign currency translation reserve. If a foreign subsidiary were sold, the proportionate share of exchange differences would be transferred out of equity and recognised in profit or loss.
The Group has transactional currency exposure, which arise from sales made in currencies other than the Group’s presentational currency.
Approximately 79% (2017: 92%) of the Group’s sales are denominated in currencies other than the presentational currency, and these sales would be predominately offset by currency exposure on costs. Foreign bank accounts have also been established, to create a natural hedge and reduce the need for regular transfers from the presentational currency (AUD) cash holdings.
At 30 June the Group had the following exposure to US$ foreign currency that is not designated in cash flow hedges or recorded in the functional currency of the subsidiary
Consolidated
2018 2017 $’000 $’000
Financial assets
Cash and cash equivalents 5,652 2,804
5,652 2,804
Financial liabilities
Trade and other payables - -
Net exposure 5,652 2,804
At 30 June the Group had the following exposure to CAD$ foreign currency that is not designated in cash flow hedges or recorded in the functional currency of the subsidiary
Consolidated
2018 2017 $’000 $’000
Financial assets
Cash and cash equivalents 144 1,518
144 1,518
Financial liabilities
Trade and other payables - -
Net exposure 144 1,518
For
per
sona
l use
onl
y

Notes to the Financial Statements FOR THE YEAR ENDED 30 JUNE 2018
42
23. FINANCIAL RISK MANAGEMENT OBJECTIVES AND POLICIES (cont’d)
At 30 June the Group had the following exposure to GBP₤ foreign currency that is not designated in cash flow hedges or recorded in the functional currency of the subsidiary
Consolidated
2018 2017 $’000 $’000
Financial assets Cash and cash equivalents 125 118
125 118
Financial liabilities
Trade and other payables - -
Net exposure 125 118
At 30 June the Group had the following exposure to EUR€ foreign currency that is not designated in cash flow hedges or recorded in the functional currency of the subsidiary
Consolidated
2018 2017 $’000 $’000
Financial assets Cash and cash equivalents 3 3
3 3
Financial liabilities
Trade and other payables - -
Net exposure 3 3
At 30 June, had the Australian Dollar moved, as illustrated in the table below, with all other variables held constant, post-tax profit and equity (excluding retained profits) would have been affected as follows:
Judgements of reasonably possible movements: Post tax profit
higher/(lower) Other comprehensive
income higher/(lower)
2018 2017 2018 2017 $’000 $’000 $’000 $’000
AUD/USD +10% (565) (280) (79) (69)
AUD/USD – 5% 283 140 40 34
AUD/CAD +10% (14) (152) - -
AUD/CAD – 5% 7 76 - -
AUD/GBP +10% (13) (12) - -
AUD/GBP – 5% 6 6 - -
AUD/EUR +10% - - (215) (152)
AUD/EUR – 5% - - 107 76
Management believe the reporting date risk exposures are representative of the risk exposure inherent in the financial instruments.
Credit risk
Credit risk arises from the financial instruments of the Group, which comprise cash and cash equivalents and trade and other receivables. The Group’s exposure to credit risk arises from potential defaults of the counter-party, with a maximum exposure equal to the carrying amount of the financial assets.
The Group trades only with recognised, credit worthy third parties.
It is the Group’s policy that all customers who wish to trade on credit terms are subject to credit assessment.
In addition, receivable balances are monitored on an ongoing basis with the result that the Group’s exposure to bad debts is not significant. As the Group trades predominantly within the Diagnostic Imaging market there is a concentration of credit risk. Given the underlying Government funding support for Radiology in Hospital settings and the Imaging Centre and
For
per
sona
l use
onl
y

Notes to the Financial Statements FOR THE YEAR ENDED 30 JUNE 2018
43
23. FINANCIAL RISK MANAGEMENT OBJECTIVES AND POLICIES (cont’d)
Diagnostic Imaging market, and the commercial successes achieved by the Group to date, credit risk is considered to be minimal.
Cash and cash equivalents are held with several financial institutions, with the majority held with the Westpac Banking Corporation and Wells Fargo Bank N.A., both AA rated banks.
Interest risk
The Group exposure to market interest rates relates primarily to the company’s cash and cash equivalents.
At reporting date, the Group had the following financial assets exposed to Australian Variable interest rate risk that are not designated in cash flow hedges:
Cash and Cash equivalents in the Group ($’000) $25,238 (2017: $22,775).
The Group’s policy is to place cash balances in either 30-90 day term deposits or commercial bills that earn higher interest rates.
At 30 June 2018, if interest rates had moved, as illustrated in the table below, with all other variables held constant, post-tax profit and equity (excluding retained profits) would have been affected as follows:
Consolidated
Judgements of reasonably possible movements: Post tax profit
higher/(lower)
Other comprehensive
income
higher/(lower)
2018 2017 2018 2017
$’000 $’000 $’000 $’000
+1% (100 basis points) 250 228 - -
– 0.5% (50 basis points) (125) (114) - -
Liquidity risk
The Group has minimal liquidity risk as it has cash reserves of $25.0m, with no borrowings.
These cash reserves are deemed to be adequate and the Board believes they will underpin the ongoing growth of the business.
The table below reflects all contractually fixed pay-offs for settlement and repayments resulting from recognised financial liabilities. Cash flows for financial liabilities without fixed amount of timing are based on the conditions existing at 30 June 2018.
The remaining contractual maturities of the Group’s financial liabilities are:
Consolidated 2018 2017 $’000 $’000
<30 days 1,157 752
31-60 days 149 816
61-90 days 227 161
Over 90 days 1,458 1,729
TOTAL 2,991 3,458
24. CONTINGENCIES Tax related contingencies Amended assessments from the Australian Taxation Office (ATO)
As a result of the ATO’s program of routine and regular tax audit, the Group anticipates that ATO audits may occur in the future. The Group is similarly subject to routine tax audits in certain overseas jurisdictions. The ultimate outcome of any future tax audits cannot be determined with an acceptable degree of reliability at this time. Nevertheless, the Group believes that it is making adequate provision for its taxation liabilities (including amounts shown as deferred and current tax liabilities) and is taking reasonable steps to address potentially contentious issues with the ATO. However, there may be an impact to the Group of any of the revenue authority investigations results in an adjustment that increases the Group’s taxation liabilities. Ongoing transactions – transfer pricing The Group has offshore operations in the United States and Germany (Note 22). As disclosed in Note 22, there are extra Group transactions, which include the Company and its US and German based subsidiaries Visage
For
per
sona
l use
onl
y
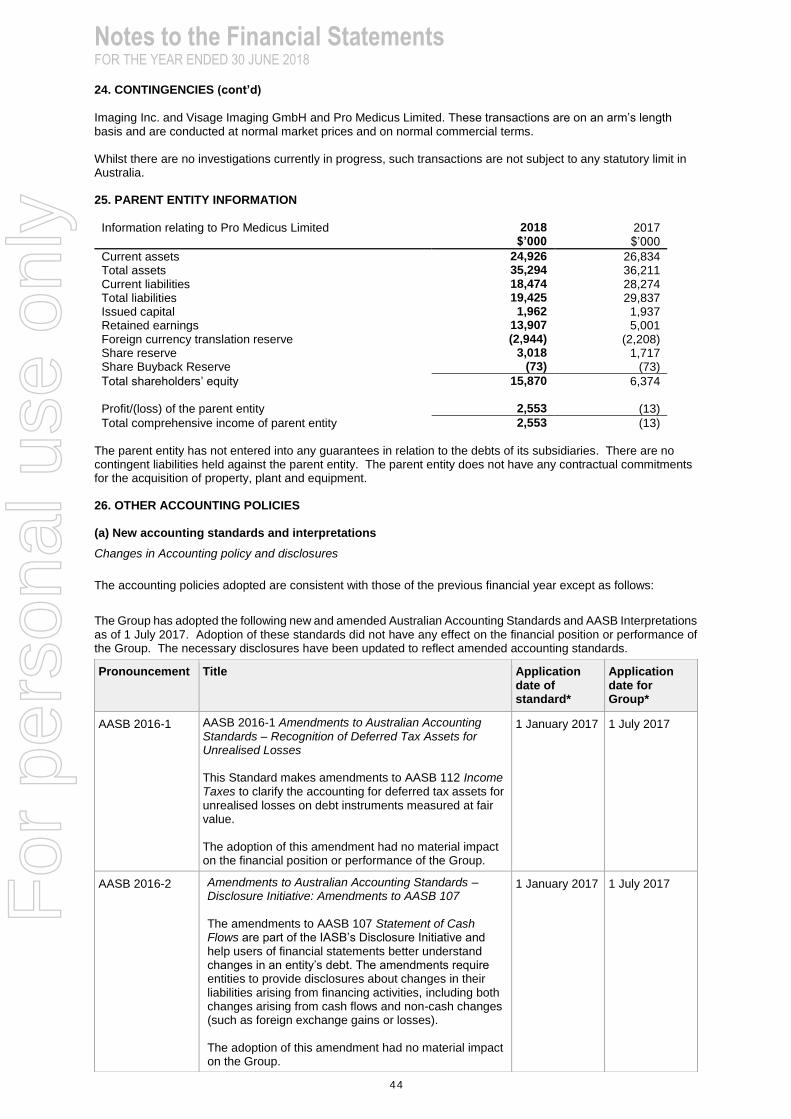
Notes to the Financial Statements FOR THE YEAR ENDED 30 JUNE 2018
44
24. CONTINGENCIES (cont’d)
Imaging Inc. and Visage Imaging GmbH and Pro Medicus Limited. These transactions are on an arm’s length basis and are conducted at normal market prices and on normal commercial terms. Whilst there are no investigations currently in progress, such transactions are not subject to any statutory limit in Australia. 25. PARENT ENTITY INFORMATION
Information relating to Pro Medicus Limited 2018
$’000 2017 $’000
Current assets 24,926 26,834 Total assets 35,294 36,211 Current liabilities 18,474 28,274 Total liabilities 19,425 29,837 Issued capital 1,962 1,937 Retained earnings 13,907 5,001 Foreign currency translation reserve (2,944) (2,208) Share reserve 3,018 1,717 Share Buyback Reserve (73) (73)
Total shareholders’ equity 15,870 6,374 Profit/(loss) of the parent entity 2,553 (13)
Total comprehensive income of parent entity 2,553 (13)
The parent entity has not entered into any guarantees in relation to the debts of its subsidiaries. There are no contingent liabilities held against the parent entity. The parent entity does not have any contractual commitments for the acquisition of property, plant and equipment. 26. OTHER ACCOUNTING POLICIES
(a) New accounting standards and interpretations
Changes in Accounting policy and disclosures
The accounting policies adopted are consistent with those of the previous financial year except as follows:
The Group has adopted the following new and amended Australian Accounting Standards and AASB Interpretations as of 1 July 2017. Adoption of these standards did not have any effect on the financial position or performance of the Group. The necessary disclosures have been updated to reflect amended accounting standards.
Pronouncement Title Application date of standard*
Application date for Group*
AASB 2016-1 AASB 2016-1 Amendments to Australian Accounting Standards – Recognition of Deferred Tax Assets for Unrealised Losses This Standard makes amendments to AASB 112 Income Taxes to clarify the accounting for deferred tax assets for unrealised losses on debt instruments measured at fair value. The adoption of this amendment had no material impact on the financial position or performance of the Group.
1 January 2017 1 July 2017
AASB 2016-2 Amendments to Australian Accounting Standards – Disclosure Initiative: Amendments to AASB 107 The amendments to AASB 107 Statement of Cash Flows are part of the IASB’s Disclosure Initiative and help users of financial statements better understand changes in an entity’s debt. The amendments require entities to provide disclosures about changes in their liabilities arising from financing activities, including both changes arising from cash flows and non-cash changes (such as foreign exchange gains or losses).
The adoption of this amendment had no material impact on the Group.
1 January 2017 1 July 2017 For
per
sona
l use
onl
y

Notes to the Financial Statements FOR THE YEAR ENDED 30 JUNE 2018
45
(b) Accounting Standards and Interpretation issued but not yet effective
Australian Accounting Standards and Interpretations that have recently been issued or amended but are not yet effective have not been adopted by the Group for the annual reporting period ending 30 June 2018. These are outlined in the table below.
Pronouncement Title Summary Application date of standard*
Impact on Group financial report
Application date for Group*
AASB 9 Financial Instruments
AASB 9 replaces AASB 139 Financial Instruments: Recognition and Measurement.
AASB 9 includes a single approach for the classification and measurement of financial assets, based on cash flow characteristics and the business model used for the management of the financial instruments. It introduces the expected credit loss model for impairment of financial assets which replaces the incurred loss model used in AASB 139. The standard also amends the rules on hedge accounting to align the accounting treatment with the risk management practices of the Group.
1 January 2018
The Group is currently assessing the impact of the application of the new standard. Based on an initial assessment, the Group does not anticipate a material impact to the financial position or performance of the Group
1 July 2018
AASB 15 Revenue from Contracts with Customers
AASB 15 replaces all existing revenue requirements in Australian Accounting Standards (AASB 111 Construction Contracts, AASB 118 Revenue, AASB Interpretation 13 Customer Loyalty Programmes, AASB Interpretation 15 Agreements for the Construction of Real Estate, AASB Interpretation 18 Transfers of Assets from Customers and AASB Interpretation 131 Revenue – Barter Transactions Involving Advertising Services) and applies to all revenue arising from contracts with customers, unless the contracts are in the
1 January 2018
The Group is currently finalising its assessment to determine the impact of adopting AASB 15. The assessment performed to date has identified key areas of the business that may have potential risk of impact and may require a
1 July 2018
Pronouncement Title Application date of standard*
Application date for Group*
AASB 2017-2 Amendments to Australian Accounting Standards – Further Annual Improvements 2014-2016 Cycle This Standard clarifies the scope of AASB 12 Disclosure of Interests in Other Entities by specifying that the disclosure requirements apply to an entity’s interests in other entities that are classified as held for sale or discontinued operations in accordance with AASB 5 Non-current Assets Held for Sale and Discontinued Operations. The adoption of this amendment had no material impact on the financial position or performance of the Group.
1 January 2017 1 July 2017
For
per
sona
l use
onl
y

Notes to the Financial Statements FOR THE YEAR ENDED 30 JUNE 2018
46
Pronouncement Title Summary Application date of standard*
Impact on Group financial report
Application date for Group*
scope of other standards, such as AASB 117 (or AASB 16 Leases, once applied).
The core principle of AASB 15
is that an entity recognises
revenue to depict the transfer
of promised goods or services
to customers in an amount
that reflects the consideration
to which an entity expects to
be entitled in exchange for
those goods or services. An
entity recognises revenue in
accordance with the core
principle by applying the
following steps:
► Step 1: Identify the contract(s) with a customer
► Step 2 : Identify the performance obligations in the contract
► Step 3: Determine the transaction price
► Step 4: Allocate the transaction price to the performance obligation in the contract
► Step 5: Recognise revenue when (or as) the entity satisfies a performance obligation
greater level of work effort to quantify the financial impact of AASB 15. This includes identifying changes to accounting policies, reporting requirements, business processes and associated internal controls with the objective of quantifying the expected first time adoption impacts as well as supporting ongoing compliance with the new accounting requirements
AASB 2016-5 Amendments to Australian Accounting Standards – Classification and Measurement of Share-based Payment Transactions
This Standard amends AASB
2 Share-based Payment,
clarifying how to account for
certain types of share-based
payment transactions. The
amendments provide
requirements on the
accounting for:
► The effects of vesting and
non-vesting conditions on
the measurement of
cash-settled share-based
payments
► Share-based payment
transactions with a net
settlement feature for
withholding tax obligations
► a modification to the terms
and conditions of a share-
based payment that
changes the classification
of the transaction from
cash-settled to equity-
settled
1 January 2018
The Group is currently assessing the impact of the application of the new standard. Based on an initial assessment, the Group does not anticipate a material impact to the financial position or performance of the Group.
1 July 2018
For
per
sona
l use
onl
y

Notes to the Financial Statements FOR THE YEAR ENDED 30 JUNE 2018
47
Pronouncement Title Summary Application date of standard*
Impact on Group financial report
Application date for Group*
AASB Interpretation 23
Uncertainty over Income Tax Treatments
The Interpretation clarifies the application of the recognition and measurement criteria in AASB 12 Income Taxes when there is uncertainty over income tax treatments. The Interpretation specifically addresses the following:
Whether an entity considers uncertain tax treatments separately.
The assumptions an entity makes about the examination of tax treatments by taxation authorities.
How an entity determines taxable profit (tax loss), tax bases, unused tax losses, unused tax credits and tax rates.
How an entity considers changes in facts and circumstances.
1 January 2019
The Group is currently assessing the impact of the application of the new interpretation
1 July 2019
AASB 16 Leases AASB 16 requires lessees to
account for all leases under a
single on- balance sheet
model in a similar way to
finance leases under AASB
117 Leases. The standard
includes two recognition
exemptions for lessees –
leases of ’low-value’ assets
(e.g., personal computers) and
short-term leases (i.e., leases
with a lease term of 12 months
or less). At the
commencement date of a
lease, a lessee will recognise a
liability to make lease
payments (i.e., the lease
liability) and an asset
representing the right to use
the underlying asset during the
lease term (i.e., the right-of-
use asset).
Lessees will be required to
separately recognise the
interest expense on the lease
liability and the depreciation
expense on the right-of-use
asset.
Lessees will be required to
remeasure the lease liability
upon the occurrence of certain
events (e.g., a change in the
lease term, a change in future
lease payments resulting from
1 January 2019
The Group is currently continuing to assess the impact of the change in standard which it expects to be material. The new standard is expected to result in an increase in assets and liabilities, change in the timing in which lease expenses are recognised, a classification shift in earnings categories from operating lease expense to depreciation and interest expense, and an increase in gearing levels.
1 July 2019
For
per
sona
l use
onl
y

Notes to the Financial Statements FOR THE YEAR ENDED 30 JUNE 2018
48
Pronouncement Title Summary Application date of standard*
Impact on Group financial report
Application date for Group*
a change in an index or rate
used to determine those
payments). The lessee will
generally recognise the amount
of the remeasurement of the
lease liability as an adjustment
to the right-of-use asset.
Lessor accounting is
substantially unchanged from
todays’ accounting under
AASB 117. Lessors will
continue to classify all lease
using the same classification
principle as in AASB 117 and
distinguish between two types
of leases: operating and
finance leases.
26. OTHER ACCOUNTING POLICIES (cont’d) (c) Derivative financial instruments and hedging
The Group uses derivative financial instruments (forward currency contracts) to hedge its risks associated with foreign currency. Such derivative financial instruments are initially recognised at fair value at the date on which a derivative contract is entered into and are subsequently remeasured to fair value at the reporting date. Derivatives are carried as assets when their fair value is positive and as liabilities when their fair value is negative. Any gains or losses arising from changes in the fair value of derivative are recorded directly in profit or loss for the year within net foreign currency gains/(losses). The Group does not apply hedge accounting. The foreign exchange forward contracts are entered into for periods consistent with foreign currency exposure of the underlying transactions, generally from three to six months. Set out below is a comparison of the carrying amounts and fair value of the Group’s financial instruments. 2018 2017
Carrying Amount
Fair Value
Carrying Amount
Fair Value
$’000 $’000 $’000 $’000
Financial liabilities Foreign exchange forward contracts (193) (193) - -
(193) (193) - -
(d) Investments and other financial assets
Investments and financial assets in the scope of AASB 139 Financial Instruments: Recognition and Measurement are categorised as either financial assets at fair value through profit or loss, loans and receivables, held-to-maturity investments, or available-for-sale financial assets. The classification depends on the purpose for which the investments were acquired or originated. Designation is re-evaluated at each reporting date, but there are restrictions on reclassifying to other categories. When financial assets are recognised initially, they are measured at fair value, plus, in the case of assets not at fair value through profit or loss, directly attributable transaction costs.
Recognition and derecognition
All regular way purchases and sales of financial assets are recognised on the trade date i.e., the date that the Group commits to purchase the asset. Regular way purchases or sales are purchases or sales of financial assets under contracts that require delivery of the assets within the period established generally by regulation or convention in the market place. Financial assets are derecognised when the right to receive cash flows from the financial assets has expired or when the entity transfers substantially all the risks and rewards of the financial assets. If the entity neither retains nor transfers substantially all of the risks and rewards, it derecognises the asset if it has transferred control of the assets.
For
per
sona
l use
onl
y

Notes to the Financial Statements FOR THE YEAR ENDED 30 JUNE 2018
49
26. OTHER ACCOUNTING POLICIES (cont’d) Subsequent measurement
(i) Financial assets at fair value through profit or loss
Financial assets classified as held for trading are included in the category “financial assets at fair value through profit or loss”. Financial assets are classified as held for trading if they are acquired for the purpose of selling in the near term with the intention of making a profit. Derivatives are also classified as held for trading unless they are designated as effective hedging instruments. Gains or losses on financial assets held for trading are recognised in profit or loss and the related assets are classified as current assets in the statement of financial position.
(ii) Loans and receivables
Loans and receivables including loan notes and loans to key management personnel are non-derivative financial assets with fixed or determinable payments that are not quoted in an active market. Such assets are carried at amortised cost using the effective interest rate method. Gains and losses are recognised in profit or loss when the loans and receivables are derecognised or impaired. These are included in current assets, except for those with maturities greater than 12 months after reporting date, which are classified as non-current.
(e) Other taxes
Revenues, expenses and assets are recognised net of the amount of GST except:
when the GST incurred on a purchase of goods and services is not recoverable from the taxation authority, in which case the GST is recognised as part of the cost of acquisition of the asset or of the expense item as applicable; and
receivables and payables are stated with the amount of GST included.
The net amount of GST recoverable from, or payable to, the taxation authority is included as part of receivables or payables in the statement of financial position.
Cash flows are included in the Statement of Cash Flows on a gross basis and the GST component of cash flows arising from investing and financing activities, which is recoverable from, or payable to, the taxation authority are classified as operating cash flows.
Commitments and contingencies are disclosed net of the amount of GST recoverable from, or payable to, the taxation authority.
(f) Comparatives
Where necessary, comparatives have been reclassified and repositioned for consistency with current year disclosures.
For
per
sona
l use
onl
y

Directors Declaration
50
In accordance with a resolution of the directors of Pro Medicus Limited, I state that:
(1) In the opinion of the directors:
(a) the financial statements, notes and the additional disclosures included in the directors’ report designated as audited, of the consolidated entity are in accordance with the Corporations Act 2001, including:
(i) giving a true and fair view of the consolidated entity’s financial position as at 30 June 2018 and of the performance for the year ended on that date; and
(ii) complying with Accounting Standards (including the Australian Accounting Interpretations) and the Corporations Regulations 2001; and
(b) there are reasonable grounds to believe that the consolidated entity will be able to pay its debts as and when they become due and payable.
(c) the financial statements and notes comply with International Financial Reporting Standards (IFRS) as disclosed in Note 2(b).
(2) This declaration has been made after receiving the declarations required to be made to the directors in accordance with section 295A of the Corporations Act 2001 for the financial year ended 30 June 2018.
On behalf of the Board
P T Kempen
Chairman
Melbourne, 16 August 2018
For
per
sona
l use
onl
y
A member firm of Ernst & Young Global Limited
Liability limited by a scheme approved under Professional Standards Legislation
Ernst & Young 8 Exhibition Street Melbourne VIC 3000 Australia GPO Box 67 Melbourne VIC 3001
Tel: +61 3 9288 8000 Fax: +61 3 8650 7777 ey.com/au
Independent Auditor's Report to the Members of Pro Medicus Limited
Report on the Audit of the Financial Report
Opinion
We have audited the financial report of Pro Medicus Limited (the Company) and its subsidiaries (collectively the Group), which comprises the consolidated statement of financial position as at 30 June 2018, the consolidated statement of comprehensive income, consolidated statement of changes in equity and consolidated statement of cash flows for the year then ended, notes to the financial statements, including a summary of significant accounting policies, and the directors declaration.
In our opinion, the accompanying financial report of the Group is in accordance with the Corporations Act 2001, including:
a) giving a true and fair view of the consolidated financial position of the Group as at 30 June 2018 and of its consolidated financial performance for the year ended on that date; and
b) complying with Australian Accounting Standards and the Corporations Regulations 2001.
Basis for Opinion
We conducted our audit in accordance with Australian Auditing Standards. Our responsibilities under those standards are further described in the Auditor’s Responsibilities for the Audit of the Financial Report section of our report. We are independent of the Group in accordance with the auditor independence requirements of the Corporations Act 2001 and the ethical requirements of the Accounting Professional and Ethical Standards Board’s APES 110 Code of Ethics for Professional Accountants (the Code) that are relevant to our audit of the financial report in Australia. We have also fulfilled our other ethical responsibilities in accordance with the Code.
We believe that the audit evidence we have obtained is sufficient and appropriate to provide a basis for our opinion.
Key Audit Matters
Key audit matters are those matters that, in our professional judgement, were of most significance in our audit of the financial report of the current year. These matters were addressed in the context of our audit of the financial report as a whole, and in forming our opinion thereon, but we do not provide a separate opinion on these matters. For each matter below, our description of how our audit addressed the matter is provided in that context.
We have fulfilled the responsibilities described in the Auditor’s Responsibilities for the Audit of the Financial Report section of our report, including in relation to these matters. Accordingly, our audit included the performance of procedures designed to respond to our assessment of the risks of material misstatement of the financial report. The results of our audit procedures, including the procedures performed to address the matters below, provide the basis for our audit opinion on the accompanying financial report.
For
per
sona
l use
onl
y

A member firm of Ernst & Young Global Limited
Liability limited by a scheme approved under Professional Standards Legislation
1. Capitalisation of development costs
Why significant How our audit addressed the key audit matter
The Group develops medical software related to radiology systems. Development costs are capitalised and presented as intangible assets on the consolidated statement of financial position.
The carrying value of intangible assets as at 30 June 2018 was $16.9 million (30% of total assets).
Capitalised development costs was a key audit matter as product development is core to the Group’s operations and it is the key asset on the Group’s consolidated statement of financial position. This involves judgement to determine whether the costs meet the capitalisation criteria in accordance with Australian Accounting Standards.
The measurement of capitalised development costs is based on the time and overhead costs associated with individuals employed by the Group for the specific purpose of developing software. Capitalised development costs are amortised once the product is available for use. Capitalised development costs are amortised over a useful life of five years.
Refer to Note 13 of the financial report for disclosure relating to capitalised program development costs.
Our audit procedures included the following:
► Assessed key measurement inputs, including
salaries and overhead costs, used in the
Group’s capitalisation model which
determines the amount of capitalised
development costs.
► Selected a sample of overhead costs
capitalised within the capitalisation model to
assess whether these costs were
appropriately capitalised in accordance with
Australian Accounting Standards.
► Agreed a sample of employee costs recorded
within the capitalisation model to employee
timesheets and payroll records. We enquired
with the Group regarding the development
activities that were undertaken relating to
these costs and determined whether the
sample of employees were directly involved in
developing software and not maintenance, as
maintenance costs are not eligible for
capitalisation.
► Assessed the useful life and amortisation rate
allocated to capitalised development costs.
► Assessed the consistency of the capitalisation methodology applied by the Group in comparison to prior reporting periods.
► Assessed the adequacy of the disclosures included in Note 13.
For
per
sona
l use
onl
y
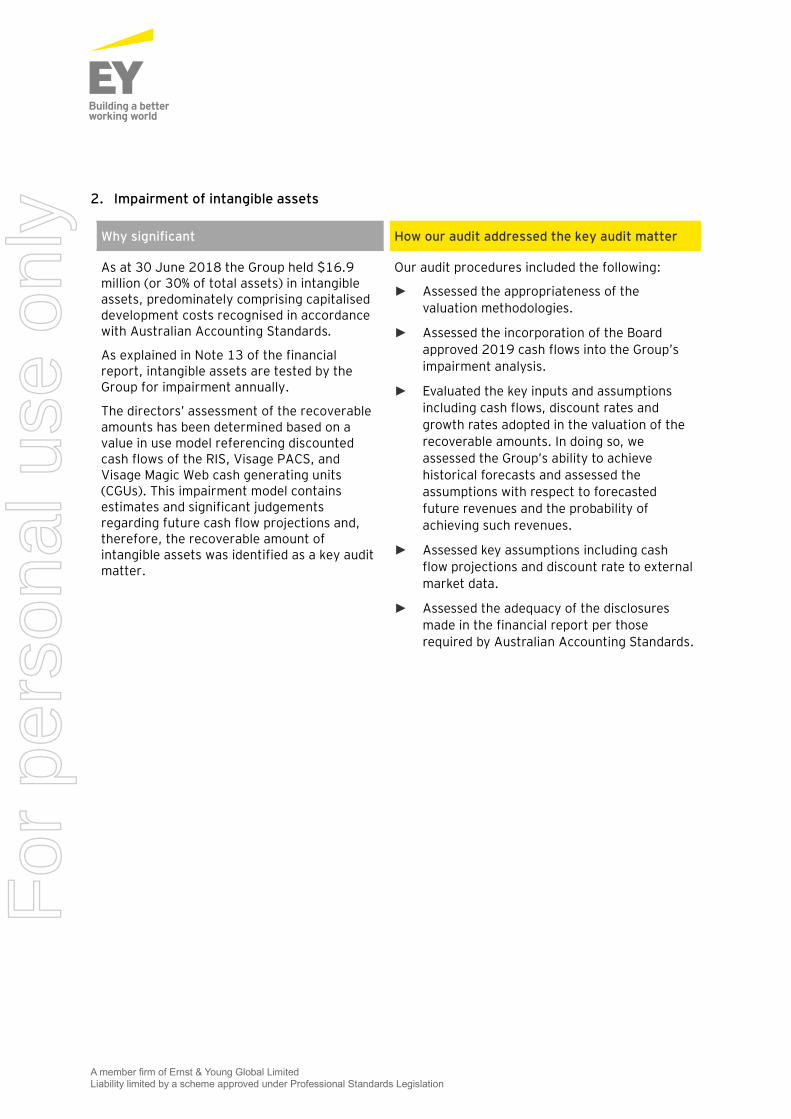
A member firm of Ernst & Young Global Limited
Liability limited by a scheme approved under Professional Standards Legislation
2. Impairment of intangible assets
Why significant How our audit addressed the key audit matter
As at 30 June 2018 the Group held $16.9 million (or 30% of total assets) in intangible assets, predominately comprising capitalised development costs recognised in accordance with Australian Accounting Standards.
As explained in Note 13 of the financial report, intangible assets are tested by the Group for impairment annually.
The directors’ assessment of the recoverable amounts has been determined based on a value in use model referencing discounted cash flows of the RIS, Visage PACS, and Visage Magic Web cash generating units (CGUs). This impairment model contains estimates and significant judgements regarding future cash flow projections and, therefore, the recoverable amount of intangible assets was identified as a key audit matter.
Our audit procedures included the following:
► Assessed the appropriateness of the
valuation methodologies.
► Assessed the incorporation of the Board
approved 2019 cash flows into the Group’s
impairment analysis.
► Evaluated the key inputs and assumptions
including cash flows, discount rates and
growth rates adopted in the valuation of the
recoverable amounts. In doing so, we
assessed the Group’s ability to achieve
historical forecasts and assessed the
assumptions with respect to forecasted
future revenues and the probability of
achieving such revenues.
► Assessed key assumptions including cash
flow projections and discount rate to external
market data.
► Assessed the adequacy of the disclosures
made in the financial report per those
required by Australian Accounting Standards.
For
per
sona
l use
onl
y
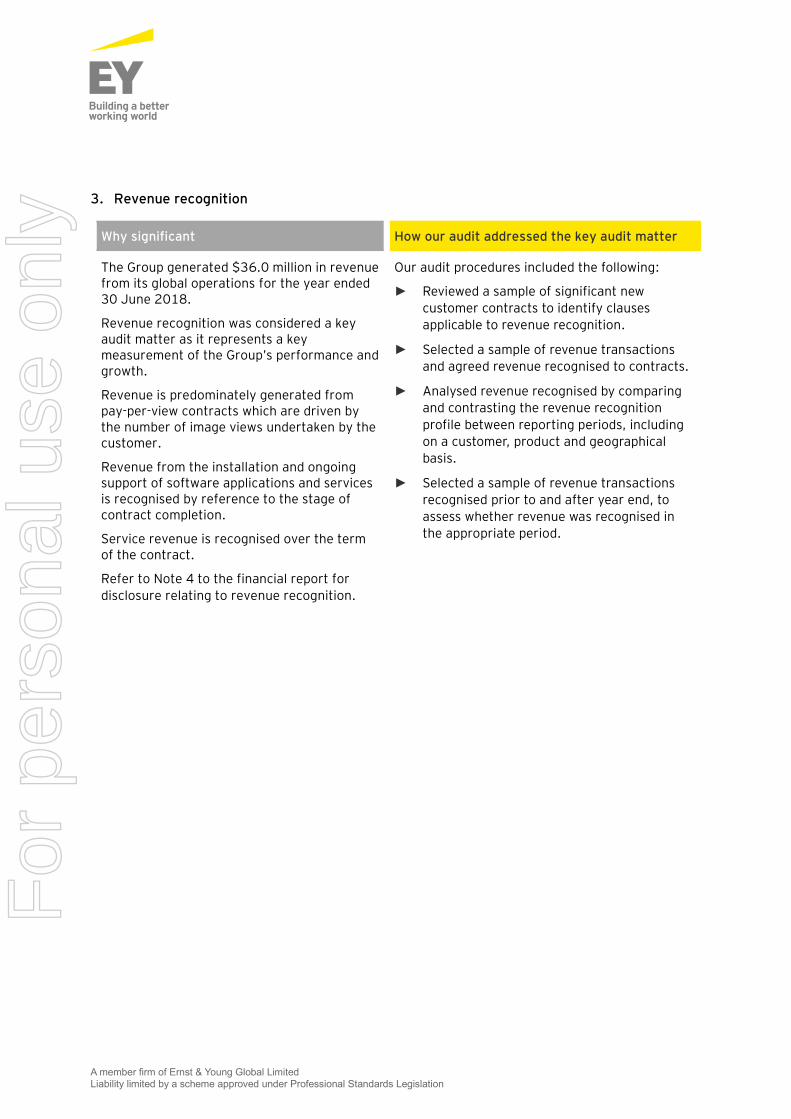
A member firm of Ernst & Young Global Limited
Liability limited by a scheme approved under Professional Standards Legislation
3. Revenue recognition
Why significant How our audit addressed the key audit matter
The Group generated $36.0 million in revenue from its global operations for the year ended 30 June 2018.
Revenue recognition was considered a key audit matter as it represents a key measurement of the Group’s performance and growth.
Revenue is predominately generated from pay-per-view contracts which are driven by the number of image views undertaken by the customer.
Revenue from the installation and ongoing support of software applications and services is recognised by reference to the stage of contract completion.
Service revenue is recognised over the term of the contract.
Refer to Note 4 to the financial report for
disclosure relating to revenue recognition.
Our audit procedures included the following:
► Reviewed a sample of significant new
customer contracts to identify clauses
applicable to revenue recognition.
► Selected a sample of revenue transactions
and agreed revenue recognised to contracts.
► Analysed revenue recognised by comparing
and contrasting the revenue recognition
profile between reporting periods, including
on a customer, product and geographical
basis.
► Selected a sample of revenue transactions
recognised prior to and after year end, to
assess whether revenue was recognised in
the appropriate period.
For
per
sona
l use
onl
y

A member firm of Ernst & Young Global Limited
Liability limited by a scheme approved under Professional Standards Legislation
Information Other than the Financial Report and Auditor’s Report Thereon
The directors are responsible for the other information. The other information comprises the information included in the Group’s 2018 Annual Report other than the financial report and our auditor’s report thereon. We obtained the Directors’ Report and the Corporate Governance Statement that are to be included in the Annual Report, prior to the date of this auditor’s report, and we expect to obtain the remaining sections of the Annual Report after the date of this auditor’s report.
Our opinion on the financial report does not cover the other information and we do not and will not express any form of assurance conclusion thereon, with the exception of the Remuneration Report and our related assurance opinion.
In connection with our audit of the financial report, our responsibility is to read the other information and, in doing so, consider whether the other information is materially inconsistent with the financial report or our knowledge obtained in the audit or otherwise appears to be materially misstated.
If, based on the work we have performed on the other information obtained prior to the date of this auditor’s report, we conclude that there is a material misstatement of this other information, we are required to report that fact. We have nothing to report in this regard.
Responsibilities of the Directors for the Financial Report
The directors of the Company are responsible for the preparation of the financial report that gives a true and fair view in accordance with Australian Accounting Standards and the Corporations Act 2001 and for such internal control as the directors determine is necessary to enable the preparation of the financial report that gives a true and fair view and is free from material misstatement, whether due to fraud or error.
In preparing the financial report, the directors are responsible for assessing the Group’s ability to continue as a going concern, disclosing, as applicable, matters relating to going concern and using the going concern basis of accounting unless the directors either intend to liquidate the Group or to cease operations, or have no realistic alternative but to do so.
Auditor's Responsibilities for the Audit of the Financial Report
Our objectives are to obtain reasonable assurance about whether the financial report as a whole is free from material misstatement, whether due to fraud or error, and to issue an auditor’s report that includes our opinion. Reasonable assurance is a high level of assurance, but is not a guarantee that an audit conducted in accordance with the Australian Auditing Standards will always detect a material misstatement when it exists. Misstatements can arise from fraud or error and are considered material if, individually or in the aggregate, they could reasonably be expected to influence the economic decisions of users taken on the basis of this financial report.
As part of an audit in accordance with the Australian Auditing Standards, we exercise professional judgement and maintain professional scepticism throughout the audit. We also:
Identify and assess the risks of material misstatement of the financial report, whether due to fraud or error, design and perform audit procedures responsive to those risks, and obtain audit evidence that is sufficient and appropriate to provide a basis for our opinion. The risk of not detecting a material misstatement resulting from fraud is higher than for one resulting from error, as fraud may involve collusion, forgery, intentional omissions, misrepresentations, or the override of internal control.
For
per
sona
l use
onl
y

A member firm of Ernst & Young Global Limited
Liability limited by a scheme approved under Professional Standards Legislation
Obtain an understanding of internal control relevant to the audit in order to design audit procedures that are appropriate in the circumstances, but not for the purpose of expressing an opinion on the effectiveness of the Group’s internal control.
Evaluate the appropriateness of accounting policies used and the reasonableness of accounting estimates and related disclosures made by the directors.
Conclude on the appropriateness of the directors’ use of the going concern basis of accounting and, based on the audit evidence obtained, whether a material uncertainty exists related to events or conditions that may cast significant doubt on the Group’s ability to continue as a going concern. If we conclude that a material uncertainty exists, we are required to draw attention in our auditor’s report to the related disclosures in the financial report or, if such disclosures are inadequate, to modify our opinion. Our conclusions are based on the audit evidence obtained up to the date of our auditor’s report. However, future events or conditions may cause the Group to cease to continue as a going concern.
Evaluate the overall presentation, structure and content of the financial report, including the disclosures, and whether the financial report represents the underlying transactions and events in a manner that achieves fair presentation.
Obtain sufficient appropriate audit evidence regarding the financial information of the entities or business activities within the Group to express an opinion on the financial report. We are responsible for the direction, supervision and performance of the Group audit. We remain solely responsible for our audit opinion.
We communicate with the directors regarding, among other matters, the planned scope and timing of the audit and significant audit findings, including any significant deficiencies in internal control that we identify during our audit.
We also provide the directors with a statement that we have complied with relevant ethical requirements regarding independence, and to communicate with them all relationships and other matters that may reasonably be thought to bear on our independence, and where applicable, related safeguards.
From the matters communicated to the directors, we determine those matters that were of most significance in the audit of the financial report of the current year and are therefore the key audit matters. We describe these matters in our auditor’s report unless law or regulation precludes public disclosure about the matter or when, in extremely rare circumstances, we determine that a matter should not be communicated in our report because the adverse consequences of doing so would reasonably be expected to outweigh the public interest benefits of such communication.
For
per
sona
l use
onl
y
A member firm of Ernst & Young Global Limited
Liability limited by a scheme approved under Professional Standards Legislation
Report on the Audit of the Remuneration Report
Opinion on the Remuneration Report
We have audited the Remuneration Report included in pages 7 to 13 of the directors' report for the year ended 30 June 2018.
In our opinion, the Remuneration Report of Pro Medicus Limited for the year ended 30 June 2018, complies with section 300A of the Corporations Act 2001.
Responsibilities
The directors of the Company are responsible for the preparation and presentation of the Remuneration Report in accordance with section 300A of the Corporations Act 2001. Our responsibility is to express an opinion on the Remuneration Report, based on our audit conducted in accordance with Australian Auditing Standards.
Ernst & Young
Paul Gower Partner Melbourne 16 August 2018
For
per
sona
l use
onl
y

ASX Additional Information
58
Additional information required by the Australian Stock Exchange Ltd and not shown elsewhere in this report is as follows.
(a) Distribution of equity securities
The number of shareholders, by size of holding, in each class of share are:
Ordinary shares
Number of holders
Number of shares
1 – 1,000 1,830 940,764
1,001 – 5,000 1,536 3,831,527
5,001 – 10,000 336 2,582,977
10,001 – 100,000 325 8,589,039
100,001 and Over 39 87,424,742
4,066 103,369,049
The number of shareholders holding less than a marketable parcel are:
80 1,214
(b) Twenty largest shareholders
The names of the twenty largest holders of quoted shares are:
Listed ordinary shares
Number of shares
Percentage of ordinary shares
1 Dr S Hupert (multiple shareholdings) 29,107,660 29.33%
2 Mr A Hall (multiple shareholdings) 29,067,500 29.29%
3 HSBC Custody Nominees (Australia) Limited 5,902,948 5.71%
4 J P Morgan Nominees Australia Limited 5,727,443 5.54%
5 Citicorp Nominees Pty Ltd 3,728,228 3.61%
6 UBS Nominees Pty Ltd 2,699,945 2.61%
7 National Nominees Limited 1,984,641 1.92%
8 BNP Paribas Noms Pty Ltd 1,085,113 1.05%
9 HSBC Custody Nominees (Australia) Limited – A/C No 2 879,125 0.85%
10 Mr Bram Vander Jagt & Mrs Maaike Vander Jagt 850,000 0.82%
11 Grain Exporters (Australia) Pty Ltd 680,000 0.66%
12 Mr Peter Terence Kempen & Mrs Elaine Margaret Kempen (multiple shareholdings)
678,082 0.66%
13 Mr Danny Tauber 419,496 0.41%
14 Mr Kenneth John Vander Jagt & Mrs Tanya Vander Jagt 412,200 0.40%
15 Mr John Charles Plummer 365,000 0.35%
16 Mr Roderick Lyle (multiple shareholdings) 340,000 0.33%
17 Mr Stephen Geoffrey Wilson & Ms Denise Adele Prandi 337,537 0.33%
18 Mr Evan Philip Clucas and Ms Leanne Jane Weston 317,980 0.31%
19 Mr Colin Gregory Organ 271,000 0.26%
20 Mr Michael Wu 250,912 0.24%
85,104,810 82.33%
(c) Substantial shareholders
The names of substantial shareholders who have notified the Company in accordance with section 671B of the Corporations Law are:
Number of shares S. Hupert 29,107,660 A Hall 29,067,500
(d) Voting rights
All ordinary shares carry one vote per share without restriction.
For
per
sona
l use
onl
y

Corporate Governance Statement FOR THE YEAR ENDED 30 JUNE 2018
59
The Board of Directors of Pro Medicus Limited is responsible for the corporate governance of the entity having regard to the ASX Corporate Governance Council (CGC) published guidelines as well as its corporate governance principles and recommendations. The Board guides and monitors the business and affairs of Pro Medicus Limited on behalf of the shareholders by whom they are elected and to whom they are accountable.
The table below summaries the Group’s compliance with the CGC’s recommendations.
Comply Reference/
Recommendation Yes/No explanation
Principle 1 - Lay solid foundations for management and oversight
1.1
A listed entity should disclose:
a) roles and responsibilities of its board and management; and b) those matters expressively reserved to the board and those
delegated to management. Yes Page 63
1.2
A listed entity should:
a) undertake appropriate checks before appointing a person, or putting forward to security holders a candidate for election, as a director; and
b) provide security holders with all material information in its possession relevant to a decision on whether or not to elect or re-elect a director. Yes Page 63
1.3 A listed entity should have written agreement with each director and senior executive setting out the terms of their agreement. No Page 63
1.4
The company secretary of a listed entity should be accountable directly to the board, through the chair, on all matters to do with the proper functioning of the board. Yes Page 63
1.5
A listed entity should:
a) have a diversity policy which includes requirements for the board or a relevant committee of the board to set measurable objectives for achieving gender diversity and to assess annually both the objectives and the entity’s progress in achieving them;
b) disclose that policy or a summary c) disclose as at the end of each reporting period the measurable
objectives for achieving gender diversity set by the board or a relevant committee of the board in accordance with the entity’s diversity policy and its progress towards achieving them, and either: 1) the respective proportions of men and women on the board, in
senior executive positions and across the whole organisation (including how the entity has defined “senior executive” for these purposes); or
2) if the entity is a “relevant employer” under the Workplace Gender Equality Act, the entity’s most recent “Gender Equality Indicators”, as defined in and published under that Act. Yes Page 64
1.6
A listed entity should:
a) have and disclose a process for periodically evaluation the performance of the board, its committees and individual directors; and
b) disclose, in relation to each reporting period, whether a performance evaluation was undertaken in the reporting period in accordance with that process. Yes Page 64
1.7
A listed entity should:
a) have and disclose a process for periodically evaluating the performance of its senior executives; and
b) disclose, in relation to each reporting period, whether a performance evaluation was undertaken in the reporting period in accordance with that process. Yes Page 64
For
per
sona
l use
onl
y

Corporate Governance Statement FOR THE YEAR ENDED 30 JUNE 2018
60
Comply Reference/
Recommendation Yes/No Explanation
Principle 2 - Structure the board to add value
2.1
The board of a listed entity should:
a) have a nomination committee which: 1) has at least three members, a majority of whom are
independent directors; and 2) is chaired by an independent directors, and disclose 3) the charter of the committee; 4) the members of the committee; and 5) as at the end of each reporting period, the number of times the
committee met throughout the period and the individual attendances of the members at this meetings; or
b) if it does not have a nomination committee, disclose the fact and the process it employs to address board succession issues and to ensure that the board has the appropriate skills, knowledge, experience, independence and diversity to enable it to discharge its duties and responsibilities effectively. No Page 65
2.2
A listed entity should have and disclose a board skills matrix setting out the mix of skills and diversity that the board currently has or is looking to achieve in its membership. Yes
Directors Report
2.3
A listed entity should disclose:
a) the names of the directors considered by the board to be independent directors;
b) if a director has an interest, position, association or relationship of the type described in Box 2.3 but the board is of the opinion that it does not compromise the independence of the director, the nature of the interest, position, association or relationship in question and an explanation of why the board is of that opinion; and
c) the length of service of each director. Yes Page 63
2.4 A majority of the board of a listed entity should be independent directors. Yes Page 63
2.5 The chair of the board of a listed entity should be an independent directors and, in particular, should not be the same person as the CEO of the entity. Yes Page 63
2.6
A listed entity should have a program for inducting new directors and provide appropriate professional development opportunities for directors to develop and maintain the skills and knowledge needed to perform their role as a directors effectively. Yes Page 63
Principle 3 - Act ethically and responsibly
3.1
A listed entity should:
a) have a code of conduct for its directors, senior executives and employees; and
b) disclose that code or a summary of it. Yes Page 67
Principle 4 - Safeguard integrity in corporate reporting
4.1
The board of a listed entity should:
a) have an audit committee which: 1) has at least three members, all of whom are non-executive
directors and a majority of whom are independent directors; and 2) is chaired by an independent director, who is not the chair of
the board; and disclose 3) the charter of the committee 4) the relevant qualifications and experience of the members of
the committee; and No Page 65
For
per
sona
l use
onl
y

Corporate Governance Statement FOR THE YEAR ENDED 30 JUNE 2018
61
5) in relation to each reporting period, the number of times the committee met throughout the period and the individual attendances of the members at those meetings; or
b) if it does not have an audit committee, disclose that fact and the processes it employs that independently verify and safeguard the integrity of its corporate reporting, including the processes for the appointment and removal of external auditor and the rotation of the audit engagement partner.
Comply Reference/
Recommendation Yes/No Explanation
4.2
The board of a listed entity should, before it approves the entity’s financial statements for a financial period, receive from its CEO and CFO a declaration that, in their opinion, the financial records of the entity have been properly maintained and that the financial statements comply with the appropriate accounting standards and give a true and fair view of the financial position and performance of the entity and that the opinion has been formed on the basis of a sound system of risk management and internal control which is operating effectively. Yes Page 66
4.3
A listed entity that has an AGM should ensure that its external auditor attends its AGM and is available to answer questions from security holders relevant to the audit. Yes Page 66
Principle 5 - Make timely and balanced disclosure
5.1
A listed entity should:
a) have a written policy for complying with its continuous disclosure obligations under the Listing Rules; and
b) disclose that policy or a summary of it. Yes Page 66
Principle 6 - Respect the rights of security holders
6.1 A listed entity should provide information about itself and its governance to investors via its website. Yes Page 66
6.2 A listed entity should design and implement an investor relations program to facilitate effective two-way communication with investors. Yes Page 66
6.3 A listed entity should disclose policies and progress it has in place to facilitate and encourage participation at meetings of security holders. Yes Page 66
6.4
A listed entity should give security holders the option to receive communications from, and send communications to, the entity and its security registry electronically. Yes Page 66
Principle 7 - Recognise and manage risk
7.1
The board of a listed entity should:
a) have a committee or committees to oversee risk, each of which: 1) has at least three members, a majority of whom are
independent directors; and 2) is chaired by an independent director; and disclose 3) the charter of the committee 4) the members of the committee; and 5) as at the end of each reporting period, the number of times the
committee met throughout the period and the individual attendances of the members at those meetings; or
b) if it does not have a risk committee or committees that satisfy (a)
above, disclose that fact and the processes it employs for overseeing the entity’s risk management framework. No Page 67
For
per
sona
l use
onl
y

Corporate Governance Statement FOR THE YEAR ENDED 30 JUNE 2018
62
7.2
The board or a committee of the board should:
a) review the entity’s risk management framework at least annually to satisfy itself that it continues to be sound; and
b) disclose, in relation to each reporting period, whether such a review has taken place. Yes Page 67
7.3
A listed entity should disclose:
a) if it has an internal audit function, how the function is structured and what role it performs; or
b) if it does not have an internal audit function, that fact and the processes it employs for evaluation and continually improving effectiveness of its risk management and internal control processes. No Page 67
7.4
A listed entity should disclose whether it has any material exposure to economic, environmental and social sustainability risks and, if it does, how it manages or intends to manage those risks. Yes Page 67
Principle 8 – Remunerate fairly and responsibly
8.1
The board of a listed entity should:
a) have a remuneration committee which: 1) has at least three members, a majority of whom are
independent directors; and 2) is chaired by an independent director; and disclose 3) the charter of the committee 4) the members of the committee; and 5) as at the end of each reporting period, the number of times the
committee met throughout the period and the individual attendances of the members at those meetings; or
if it does not have a remuneration committee, disclose that fact and the processes it employs for setting the level and composition of remuneration for directors and senior executives and ensuring that such remuneration is appropriate and not excessive. No Page 65
8.2
A listed entity should separately disclose its policies and practices regarding the remuneration of non-executive directors and the remuneration of executive directors and other senior executives. Yes Page 65
8.3
A listed entity which has an equity-based remuneration scheme should:
a) have a policy on whether participants are permitted to enter into transactions (whether through the use of derivatives or otherwise) which limit the economic risk of participating in the scheme; and
b) disclose that policy or a summary of it. No Page 65
For
per
sona
l use
onl
y
Corporate Governance Statement FOR THE YEAR ENDED 30 JUNE 2018
63
Pro Medicus Limited’s corporate governance practices were in place throughout the year ended 30 June 2018.
Structure of the Board
The skills, experience and expertise relevant to the position of director held by each director in office at the date of the annual report is included in the Directors’ Report.
The composition of the Board was determined in accordance with the following principles and guidelines:
The Board should comprise at least four directors and should maintain a majority of non-executive directors, or at least a 50/50 ratio of non-executives and executive directors;
The Chairperson must be a non-executive director and not occupy the role of CEO;
The Board should comprise directors with an appropriate range of qualifications and expertise; and
The Board shall meet monthly and follow meeting guidelines set down to ensure all directors are made aware of, and have available all necessary information, to participate in an informed discussion of all agenda items.
Directors of Pro Medicus Limited are considered to be independent when they are independent of management and free from any business or other relationship that could materially interfere with – or could reasonably be perceived to materially interfere with the exercise of their unfettered and independent judgement.
In the context of director independence, “materiality” is considered from both the company and individual director perspective. The determination of materiality requires consideration of both quantitative and qualitative elements. An item is presumed to be quantitatively immaterial if it is equal or less than 5% of the appropriate base amount. It is presumed to be material (unless there is qualitative evidence to the contrary) if it is equal to or greater than 10% of the appropriate base amount.
Qualitative factors considered include whether a relationship is strategically important, the competitive landscape, the nature of the relationship and the contractual or other arrangements governing it and other factors which point to the actual ability of the director in question to shape the direction of the company’s loyalty.
In accordance with the definition of independence above, and the materiality thresholds set, the following directors of Pro Medicus Limited are considered to be independent:
Name Position
P T Kempen Chairman, Non-Executive Director, Chairman Audit Committee
A Glenning Non-Executive Director
L Farrell Non-Executive Director
The Board wishes to advise that it continues to maintain responsibility for the actions of the Chief Executive Officer and any tasks delegated to the management by the Board.
The appointment of appropriately skilled Non-Executive Directors, together with a broadly unchanged business base has meant one new director nomination has occurred this year.
Executive Directors’ Appointment Letters have not been revised in the prescribed format as the board considered this unnecessary given the small number of fairly recently appointed current directors who understand their roles and responsibilities. The board has undertaken that the recommended format should be used for any future director appointments.
Non-Executive Directors and senior executives have a written employment agreement with the Company setting out the terms of their appointment.
Dr Sam Hupert and Mr. Anthony Hall were directors in Pro Medicus Pty Ltd since incorporation in 1983. Mr. Peter Kempen was appointed in March 2008, Mr Anthony Glenning was appointed in May 2016 and Dr Leigh Farrell was appointed in September 2017.
Company Secretary
The Company Secretary is accountable to the Board on all matters to do with the proper functioning of the Board. The Company Secretary, who is also the Chief Financial Officer, attends all Board meetings and ensures that the business at Board meetings is accurately captured in the minutes of these meetings.
Board Functions
As the Board acts on behalf of and is accountable to the shareholders, it seeks to identify the expectations of the shareholders, as well as other regulatory and ethical expectations and obligations. In addition, the Board is responsible for identifying areas of significant business risk and ensuring arrangements are in place to adequately manage those risks. The Board seeks to discharge these responsibilities in a number of ways.
For
per
sona
l use
onl
y

Corporate Governance Statement FOR THE YEAR ENDED 30 JUNE 2018
64
The Board has delegated responsibility for the operation and administration of the group to the Chief Executive Officer and the executive team (as detailed in Note 21). The Board ensures that this team is appropriately qualified and experienced to discharge their responsibilities and has in place procedures to assess the performance of the Chief Executive and the executive team.
The Board is responsible for ensuring that management’s objectives and activities are aligned with the expectations and risks identified by the Board. The Board has a number of mechanisms in place to ensure this is achieved. These mechanisms include the following:
approval of strategic plans, which encompass the entity’s vision, mission and strategy statements, designed to meet stakeholders’ needs and manage business risk;
involvement in developing the strategic plan (a dynamic document) and approving initiatives and strategies designed to ensure the continued growth and success of the entity;
overseeing implementation of operating plans and budgets by management and monitoring of progress against budget - this includes the establishment and monitoring of key performance indicators (both financial and non-financial) for all significant business processes; and
utilising appropriately skilled professionals to provide advice on relevant discussion topics and procedures to allow Directors, in the furtherance of their duties, to seek independent professional advice at the Company’s expense.
Performance
The performance of the board and key executives is reviewed regularly against both measurable and qualitative indicators. During the reporting period the board conducted performance evaluations that involved an assessment of each board member’s and key executive’s performance against specific and measurable qualitative and quantitative performance criteria.
The performance criteria against which directors and executives are assessed are aligned with the financial and non-financial objectives of Pro Medicus Limited.
In order to ensure that the Board continues to discharge its responsibilities in an appropriate manner, the Chairman annually reviews the performance of all Directors who will be asked to retire from the board if not performing in a satisfactory manner.
Diversity
The Group recognises the value contributed to the organisation by employing people with varying skills, cultural backgrounds, ethnicity and experience. Pro Medicus believes its diverse workforce is the key to its continued growth, improved productivity and performance.
We actively value and embrace the diversity of our employees and are committed to creating an inclusive workplace where everyone is treated equally and fairly, and where discrimination, harassment and inequity are not tolerated. While Pro Medicus is committed to fostering diversity at all levels, gender diversity has been and continues to be a priority for the Group.
The Group has established a diversity policy outlining the board’s measureable objectives for achieving diversity. This is assessed annually to measure the progress towards achieving those objectives.
The table below outlines the diversity objectives established by the board, the steps taken during the year to achieve these objectives and the outcomes.
Objectives Steps taken/Outcome
Increase the number of women in the workforce, including senior management positions and at board level.
There were no key senior female appointments made during
the year as there were no key senior appointments made
during the year.
Pro Medicus did not appoint any females in managerial roles
as there were no managerial appointments made during the
year
As at 30 June 2018, women represented 23% in the Group’s
workforce (2017:21%), 20% in key executive positions
(2017:20%) and 0% at board level (2017:0%)
For
per
sona
l use
onl
y

Corporate Governance Statement FOR THE YEAR ENDED 30 JUNE 2018
65
Women represented 43% of new hires during the year
(2017:0%)
For the upcoming financial year, the Group targets to increase female representation in the Group’s workforce to 25-30%
Promote an inclusive culture that treats the workforce with fairness and respect.
Pro Medicus has set a zero tolerance policy against
discrimination of employees at all levels. The company also
provides avenues for employees to voice their concerns or
report any discrimination.
No cases of discrimination were reported during the year
(2017: nil).
Objectives Steps taken/Outcome
Provide career development opportunities for every employee, irrespective of any cultural, gender or other differences.
Whilst Pro Medicus place focus on gender diversity, career
development opportunities are equal for all employees.
During the year, representation at training and development
programs was based on performance of the employees.
The achievement of the measurable objectives in the current financial year was taken into consideration in assessing bonuses for employees. The Group will continue to review and update the measureable objectives to promote diversity for the upcoming year.
Committees
Due to the small number of Directors, the Board decided it was more appropriate to handle nomination and remuneration issues at full Board level. No Committees for these functions have been established at this time.
In addition the full Board handles any matters as and when they arise concerning environmental issues, occupational health and safety, finance and treasury.
In order to maintain good corporate governance the Non-Executive Directors assume responsibility for determining and reviewing compensation arrangements for the Executive Directors of the Group. The Executive Directors in turn are responsible for determining and reviewing the compensation arrangements for the Non-Executive Directors. The CEO, in conjunction with the full Board reviews the terms of employment for all executives.
The Board has delegated the responsibility of executive remuneration to the management who will assess the appropriateness of the nature and amount of remuneration of such executives on a periodic basis by reference to relevant employment market conditions with the overall objective of ensuring maximum stakeholder benefit from the retention of a high quality board and executive team.
The Company does not have a policy in regards to whether participants are permitted to enter into transactions (whether through derivatives or otherwise) which limit the economic risk of participating in the scheme, however the Board are in the process of evaluating a policy for such issues.
Strategic planning has been an important objective of the Board. Meetings are scheduled so that all Board members can attend and are conducted in an informal fashion to allow non-executive directors to gain enhanced industry, customer, product and research knowledge.
Audit Committee
The Board has established an audit committee, which operates under a charter approved by the Board.
It is the Board’s responsibility to ensure that an effective internal control framework exists within the entity. This includes internal controls to deal with both the effectiveness and efficiency of significant business processes. This also includes the safeguarding of assets, the maintenance of proper accounting records, and reliability of financial information as well as non-financial considerations such as the benchmarking of operational key performance indicators.
The members of the audit committee are:
P T Kempen Chairman
S A Hupert A B Hall A Glenning L Farrell
For
per
sona
l use
onl
y
Corporate Governance Statement FOR THE YEAR ENDED 30 JUNE 2018
66
The audit committee is also responsible for nomination of the external auditor and reviewing the adequacy of the scope and quality of the annual statutory audit and half yearly audit review.
Due to the small number of Directors, the Committee does not meet the requirements of Recommendation 4.1 as all members of the Board serve on the Audit Committee, whilst the Board Chairman is also the Audit Committee Chairman as his area of expertise is in Accounting and Finance.
The number of meetings held and individual attendance of Committee members at those meetings are disclosed in the Directors Report.
Prior to approval of the Company’s annual financial statements, the Board obtains a declaration from the Chief Executive Officer and Chief Financial Officer that, in their opinion, the financial records of the entity have been properly maintained and that the financial statements comply with the appropriate accounting standards and give a true and fair view of the financial position and performance of the entity and that the opinion has been formed on the basis of a sound system of risk management and internal control which is operating effectively.
A representative of the external auditors Ernst & Young will continue to attend the Annual General Meeting and is available to answer questions from security holders relevant to the audit.
Continuous Disclosure Policy
The board has developed a written policy to ensure compliance with the ASX Listing Rules on continuous disclosure and has adopted measures to ensure the market and shareholders are fully informed. The measures in place require all potential market sensitive matters are discussed with the Chief Executive Officer who in conjunction with the Chairman and other relevant directors decide whether to make an appropriate announcement to the market.
Only nominated authorised persons have the authority to release these communications to the ASX. This policy is displayed on the company website.
Shareholder Communication
The Board of Directors aims to ensure that the shareholders, on behalf of whom they act, are informed of all information necessary to assess the performance of the Directors. Information is communicated to the shareholders through:
the annual report which is distributed to all shareholders registered to receive copies;
through the release of information to the market via the ASX
the annual general meeting and other meetings so called to obtain approval for Board action as appropriate;
an up to date website - www.promedicus.com.au;
email contact with registered users; and
special written communications to shareholders distributed with the dividend notifications. The company ensures that any material given to a particular group is available to all interested parties via the company website. This includes any material presented at the Annual General Meeting. Shareholders are encouraged to receive communications electronically as requested and can elect to do so through the company’s share registry.
A copy of the Corporate Governance Statement is also available of the Company’s website – www.promedicus.com.au.
The Company effectively facilitates two-way communication with shareholders, through six monthly investor relations roadshows and through constant investor meetings and conference calls with shareholders on request.
Trading policy
Under the group’s security trading policy, an executive, director, or any employee of the group, must not trade in any securities of the parent company at any time when they are in possession of unpublished, price-sensitive information in relation to those securities.
Executives, directors and employees of the group may only trade in the securities of the parent company during an open period.
Only in exceptional circumstances will approval be forthcoming outside of an open period which is 30 days after:-
One day following the announcement of the half-yearly and full year results as the case may be.
One day following the holding of the annual general meeting.
One day after any other form of earnings forecast update is given to the market.
As required by the ASX listing rules, the Group notifies the ASX of any transaction conducted by directors in the securities of the parent company.
For
per
sona
l use
onl
y

Corporate Governance Statement FOR THE YEAR ENDED 30 JUNE 2018
67
Code of Conduct
The board has developed a “Code of Conduct”” consistent with the recommendations and details are disclosed on the company website.
Risk Management Policies
The Company takes a proactive approach to risk management. The Board is responsible for ensuring that risks are identified on a timely basis and that the Group’s objectives and activities are aligned with the risks identified by the Board.
The Company believes that it is crucial for all Board members to participate in this process; as such the Board has not established separate committees for areas such as risk management, environmental issues, occupational health and safety or treasury.
Whilst the Company has not established an internal audit function, it is committed to the identification; monitoring and management of risks associated with its business activities and has included in its management and reporting systems a number of risk management controls, such as:
Annual budgeting and monthly reporting systems for all operations which enable the monitoring of progress against performance targets and to evaluate trends
Guidelines and limits on capital expenditure and purchasing authority matrix
Executive approvals for staffing requirements
Detailed monthly management reports including cash flow reports, and to identify any foreign currency risks associated with contracts written in and cash being held in foreign currencies
The Company up until late in the financial period was not exposed to any interest rate or significant currency sensitive loans or debts. Given the increase in overseas operations there is now an increased currency risk as a consequence of contracts written in and cash being held in foreign currencies. This change in risk profile has been noted by the board and action is being taken to manage this risk. The Board oversees appropriate backup procedures for important company data. Detailed annual review of insurance policies in force to ensure cover is at appropriate levels to safeguard key executives, Company assets and operations. The Board regularly considers succession planning to ensure staff of appropriate skill and experience are available to the Company.
A review of the Company risk management policy was not undertaken during the year.
The Board does not believe the Company has any material exposure to economic, environmental and social sustainability risks at the present time.
For
per
sona
l use
onl
y

Corporate Information
68
ABN 25 006 194 752
Directors
The names of the Directors of the Company in office during the year and until the date of this report are:
Peter Terence Kempen Chairman/Non-Executive Director/Chairman Audit Committee
Dr Sam Aaron Hupert Chief Executive Officer/Managing Director
Anthony Barry Hall Technology Director
Roderick Lyle
Anthony Glenning
Dr Leigh Farrell
Non-Executive Director (retired 14 November 2017)
Non-Executive Director
Non-Executive Director (appointed 8 September 2017)
Company Secretary
Clayton James Hatch
Registered Office
450 Swan Street
Richmond, VIC, 3121
(03) 9429 8800
Internet Address
www.promedicus.com.au
www.promedicus.com
www.visageimaging.com
Solicitors
Sci-Law Strategies
Morrison Foerster
Bankers
Westpac Banking Corporation
Auditors
Ernst & Young
Share Registry
Link Market Services Limited Level 12, 680 George Street Sydney NSW 2000 Australia Mailing address: Link Market Services Limited Locked Bag A14 Sydney South NSW 1235 Australia Telephone +612 8280 7111 Toll free 1300 554 474 Facsimile +612 9287 0303 Facsimile (proxy forms only) +612 9287 0309 E-mail [email protected] Website: www.linkmarketservices.com.au F
or p
erso
nal u
se o
nly

Corporate Information
69
You can do so much more online Did you know that you can access – and even update – information about your holdings in Pro Medicus Limited via the Internet. Visit Link Market Services’ website www.linkmarketservices.com.au and access a wide variety of holding information, make some changes online or download forms. You can:
Check your current and previous holding balances
Choose your preferred annual report delivery option
Update your address details
Update your bank details
Lodge, or confirm lodgement of, your Tax File Number (TFN), Australian Business Number (ABN) or exemption
Check transaction and dividend history
Enter your email address
Check the share prices and graphs
Download a variety of instruction forms
Subscribe to email announcements You can access this information via a security login using your Security holder Reference Number (SRN) or Holder Identification Number (HIN) as well as your surname (or company name) and postcode (must be the postcode recorded on your holding record). Don’t miss out on your dividends Dividend cheques that are not banked are required to be handed over to the State Trustee under the Unclaimed Monies Act. You are reminded to bank cheques immediately. Better still, why not have us do your banking for you. Wouldn’t you prefer to have immediate access to your dividend payment? Your dividend payments can be credited directly into any nominated bank, building society or credit union account in Australia as cleared funds on dividend payment date – and we will still mail [(or email if you prefer)] you a dividend advice confirming your payment details. Not only can we do your banking for you, but payment by direct credit eliminates the risk of cheque fraud. Top 5 tips for Pro Medicus Limited investors visiting Link’s (our registry) website 1. Bookmark www.linkmarketservices.com.au – to bookmark, click on ‘Favourites’ on the menu
bar at the top of your browser then select ‘Add to Favourites’ 2. Create a portfolio for your holding or holdings and you don’t have to remember your SRN or
HIN every time you visit 3. Lodge your email via the ‘Communications Options’ and benefit from the online
communications options Pro Medicus Limited offers its investors 4. Check out the ‘FAQs’ page (accessible via the orange menu bar) for answers to frequently
asked questions 5. Use the ‘Client List’ page (accessible via the orange menu bar) to link to Pro Medicus Limited
website and the website of the other Link clients in which you invest. Contact Information You can also contact the Pro Medicus Limited share registry by calling +61 2 8280 7111 or Toll Free 1300 554 474
For
per
sona
l use
onl
y