For personal use only CorporatePresentation · For personal use only. Ownership (31 Oct 17)...
23
November 2017 Corporate Presentation AGM Presentation Nic Earner, Managing Director For personal use only
Transcript of For personal use only CorporatePresentation · For personal use only. Ownership (31 Oct 17)...

November 2017
Corporate PresentationAGM PresentationNic Earner, Managing Director
For
per
sona
l use
onl
y
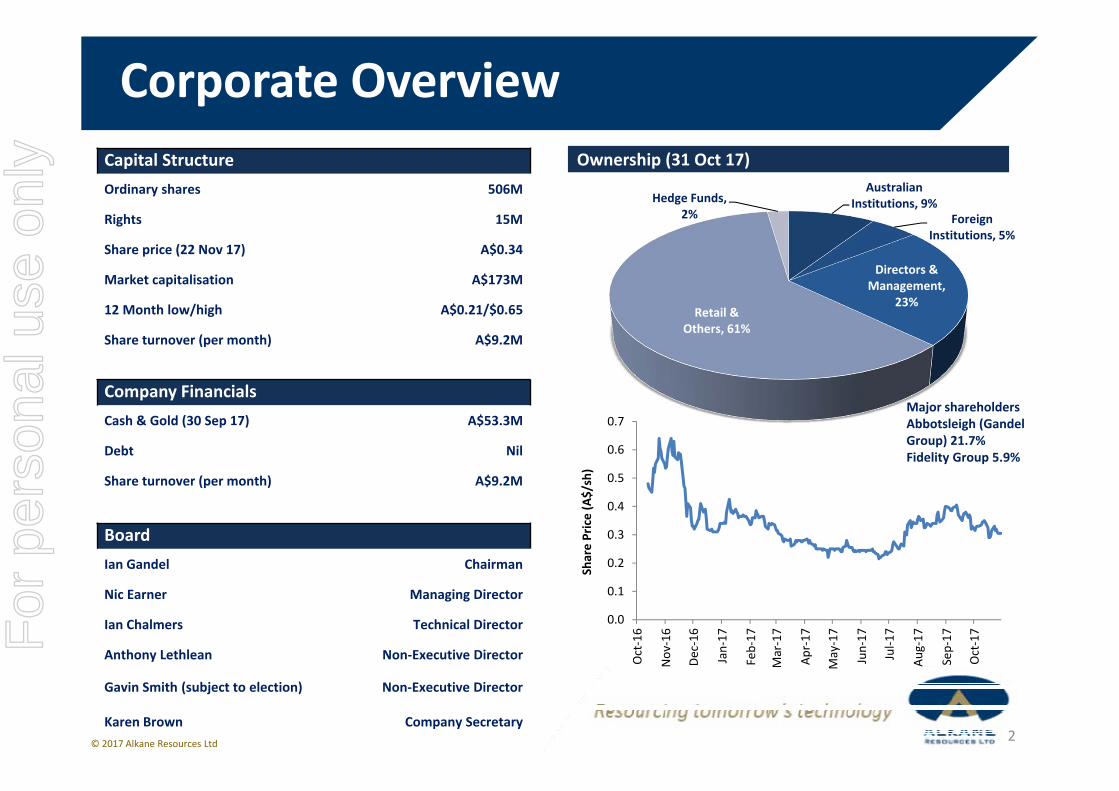
Ownership (31 Oct 17)
Corporate Overview
2
Australian Institutions, 9%
Foreign Institutions, 5%
Directors & Management,
23%Retail &
Others, 61%
Hedge Funds, 2%
Capital StructureOrdinary shares 506M
Rights 15M
Share price (22 Nov 17) A$0.34
Market capitalisation A$173M
12 Month low/high A$0.21/$0.65
Share turnover (per month) A$9.2M
Company FinancialsCash & Gold (30 Sep 17) A$53.3M
Debt Nil
Share turnover (per month) A$9.2M
BoardIan Gandel Chairman
Nic Earner Managing Director
Ian Chalmers Technical Director
Anthony Lethlean Non‐Executive Director
Gavin Smith (subject to election) Non‐Executive Director
Karen Brown Company Secretary
0.0
0.1
0.2
0.3
0.4
0.5
0.6
0.7
Oct‐16
Nov‐16
Dec‐16
Jan‐17
Feb‐17
Mar‐17
Apr‐17
May‐17
Jun‐17
Jul‐1
7
Aug‐17
Sep‐17
Oct‐17
Share Price (A$/sh)
Major shareholdersAbbotsleigh (Gandel Group) 21.7%Fidelity Group 5.9%
© 2017 Alkane Resources Ltd
For
per
sona
l use
onl
y

• FY2017 Financials• Total revenue A$117.8 million• Loss before income tax A$33.6 million (driven by impairment charges of $40.0 million)• Total equity A$164.9 million
• Tomingley Gold Operations• Production 68,836 ounces• Gold revenue A$117.3 million• AISC(1) A$1,335/oz• Operating cash flow A$32.7 million (site operating cashflow after development costs)• Profit before income tax and non‐recurring items A$17.1 million
• Dubbo Project • ECI, process development/pilot plant, marketing• Vietnam Rare Earths (VTRE) test run and production• FY17 total outflows A$9.2 million (FY16 A$7.0 million) • Funded from TGO cash flows
FY2017 Snapshot
1AISC = All in Sustaining Cost comprises all site operating costs, royalties, mine exploration, sustaining capex, mine development and an allocation of corporate costs, on the basis of ounces produced. AISC does not include share based payments or net realisable value provision for ore inventory
3© 2017 Alkane Resources Ltd
For
per
sona
l use
onl
y

Highlights – Last 12 Months
Dubbo Project • Process development of high grade ZrO2 and now progressing towards
high grade hafnium product• Strategic agreements with marketing agreement with Mintech – (global
zirconium specialists), zirconium LOIs & Siemens MOU • Modular design prepared for improved capital and execution strategy for
Dubbo ProjectTomingley• Strong revenue, costs falling• Underground resources – drilling results show continuity of underground
resource • Gold discovery at El Paso – similar mineralogy to TomingleyRegional Exploration• Mineralisation confirmation in the Northern Molong Porphyry Project
with further targets identified
4© 2017 Alkane Resources Ltd
For
per
sona
l use
onl
y

Tomingley Gold Operations FY17
CIL Processing Plant
Caloma open cut October 2015 Note: ASX announcement 4 September 2017 ‐ the Company confirms that all material assumptions and technical parameters underpinning the estimated Mineral Resources andOre Reserves, and production targets and the forecast financial information as disclosed continue to apply and have not materially changed.
• Resource – 508,000oz of gold (3 Sept 2017)• Reserve – 166,000oz (3 Sept 2017)• Mine method – open cut W1, W3, C1 & C2• Underground feasibility in progress W1• Mine Life – 12 months without underground• 218,000oz produced to end June 2017• FY17 – production 68,836 @ AISC A$1,335• FY17 – revenue A$117.3M• FY17 – profit before tax and non‐recurring items
A$17.1M• FY18 guidance 65‐70,000oz @ AISC A$1,100 – 1,200• Forward gold contracts at 30 Sept 2017 4,500oz @
A$1,720/oz
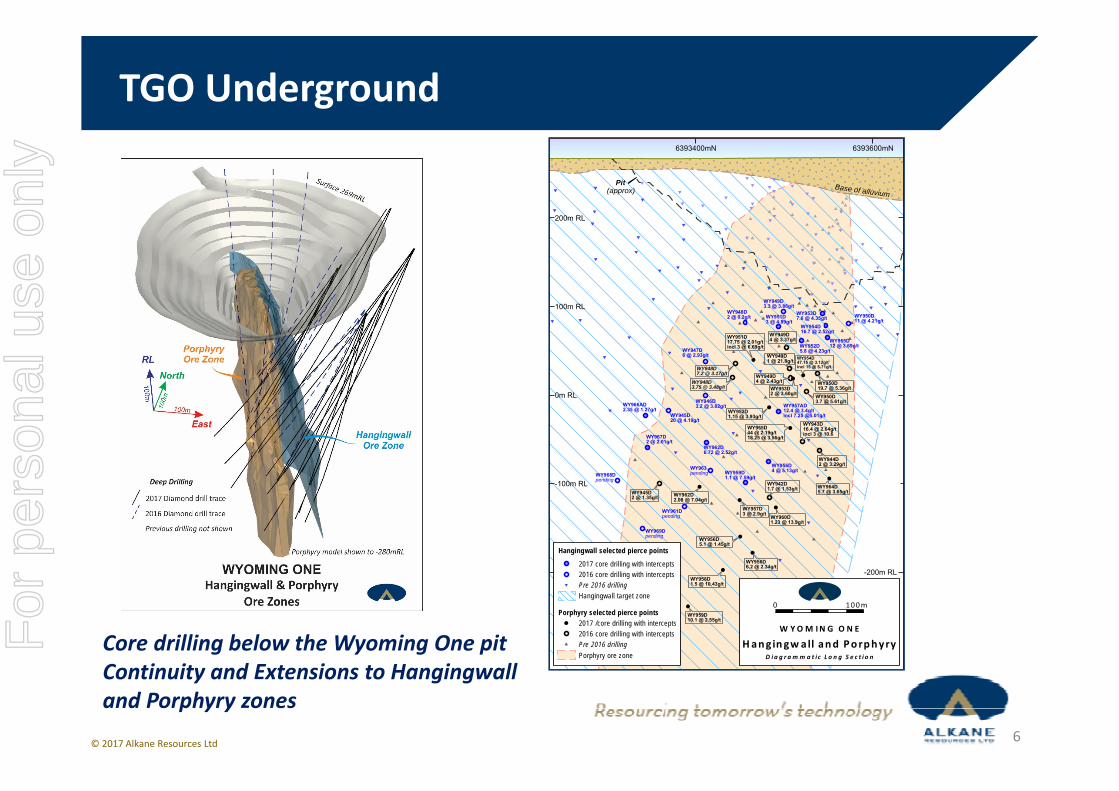
Resource Expansion and Exploration• Regional aircore drilling to test multiple targets, generated intercepts to be followed up• Re‐evaluation of large gold‐copper system at Peak Hill mine site• Major WY1 subpit core drilling programs drawing to close to expand resource/reserve base in mine environs
5© 2017 Alkane Resources Ltd
For
per
sona
l use
onl
y
CIL Processing Plant
Caloma open cut October 2015
TGO Underground
Core drilling below the Wyoming One pitContinuity and Extensions to Hangingwall and Porphyry zones
WY947D6 @ 2.93g/t
WY946D3.2 @ 3.82g/t
(approx) Pit
WY948D2 @ 0.2g/t
WY945D20 @ 4.19g/t
WY950D11 @ 4.21g/t
WY949D3.3 @ 3.86g/t
WY967D2 @ 2.01g/t
WY957AD12.4 @ 3.4g/tincl 7.25 @5.01g/t
WY956D4 @ 5.13g/t
WY942D1.7 @ 1.53g/t
WY944D2 @ 3.29g/t
WY949D1 @ 21.8g/t
WY949D4 @ 2.43g/t
WY949D4 @ 3.37g/tWY951D
17.75 @ 2.01g/tincl 3 @ 6.69g/t
WY943D16.4 @ 2.64g/tincl 3 @ 10.6
WY954D47.15 @ 3.12g/tincl 15 @ 5.71g/t
WY955D44 @ 2.19g/t18.25 @ 3.56g/t
WY963pending
WY961Dpending
WY969Dpending
WY968Dpending
WY958D1.5 @ 10.43g/t
WY956D6.2 @ 2.34g/t
WY959D10.1 @ 2.55g/t
WY960D1.23 @ 13.9g/t
WY964D5.7 @ 3.65g/t
WY957D3 @ 2.9g/t
WY962D2.08 @ 7.04g/t
WY945D2 @ 1.35g/t
WY953D2 @ 3.60g/t WY950D
3.7 @ 5.61g/t
WY950D19.7 @ 5.36g/t
WY948D7.2 @ 3.17g/t
WY948D3.75 @ 3.48g/t
WY955D12 @ 3.69g/t
WY953D7.6 @ 4.35g/t
WY954D16.7 @ 2.52g/t
WY952D5.8 @ 4.23g/t
WY951D3 @ 4.89g/t
WY962D6.72 @ 2.52g/t
WY959D1.1 @ 7.59g/t
WY966AD2.35 @ 1.27g/t WY952D
1.15 @ 3.93g/t
Base of alluvium
WY956D5.1 @ 1.45g/t
100m RL
0m RL
-100m RL
-200m RL
200m RL
6393400mN 6393600mN
0 100m
W YOM IN G O N E
Hangingw all and PorphyryD ia g r a m m a t ic L o n g S e c t i o nPorphyry ore zone
Porphyry selected pierce points
Hangingwall selected pierce points
Hangingwall target zone
Pre 2016 drilling
Pre 2016 drilling
2017 core drilling with intercepts2016 core drilling with intercepts
2017 /core drilling with intercepts2016 core drilling with intercepts
6© 2017 Alkane Resources Ltd
For
per
sona
l use
onl
y

CIL Processing Plant
Caloma open cut October 2015
Tomingley Regional Exploration
1.2km long mineralised zone, open to the north. Mineralisation similar to TGO.
7© 2017 Alkane Resources Ltd
For
per
sona
l use
onl
y

Toongi Pastoral Company (TPC)• 3,500 Ha (incl. 1,021Ha of
biodiversity offsets)• Farming, mining, cultural
heritage protection and conservation co‐existing
• 420 Breeding age cattle (self replacing & terminal breeding –Wagyu)
• Trading sheep and cattle• 500 Ha’s cropping for forage and
cereal production• Agistment livestock
8© 2017 Alkane Resources Ltd
For
per
sona
l use
onl
y

Dubbo Project is Development ReadyKey Permitting Complete• Front End Engineering Design (FEED)
• Fully Permitted: Mining Lease 1724 (18 Dec 2015), Environment Protection Licence (14 Mar 2016)
Development Ready• Long history of pilot plant• Provisional offtake in place• Team evolving ready for construction
StudiesFEED completed
in Aug‐15
Development Consent
Mining Lease granted in Dec‐15
WaterWater sources secured Jan‐17
InfrastructureKey infrastructure
in place
FinancingFinancing the Dubbo Project
2018
PowerPowerline
easement Sep‐17
Pilot PlantOperational at
ANSTO since 2008
Team Nic Earner MD from Sep‐17
New NED from Nov‐17
Siemens Offtake
Offtake MOU with Siemens Oct‐16
ModularModular dev study Q1‐2018
OfftakeBinding offtake agreements
2018
Pathway to Construction• Low capex modular study due Q1 2018
• Binding offtakes and financing throughout 2018
Zirconium Offtake
60% Zr offtake under LOI’s by
Minchem Mar‐17
9
EPLGrantedMar‐16
© 2017 Alkane Resources Ltd
For
per
sona
l use
onl
y

Project Financials
10
1.0Mtpa (base case) CAPEX – $1.3B Revenue – A$580m Operating Costs – A$260m EBITDA – $320Mpa IRR – 17.5% NPV – A$1.22B
Modular – Scoping Study (Oct 2016) – Update due Q1 2018
0.5Mtpa CAPEX – A$600 ‐ 700m Revenue – A$290m
Stage 1 Stage 2
0.5Mtpa CAPEX – A$400 ‐ 600m Revenue – A$290m
FEED (Aug 2015)
Advantage
Large elements of construction occur offsite Significantly reduces initial start‐up capex Reduces construction period Allows Alkane to develop and grow with its customers
and the target markets for its products
FEED completed in Aug 2015 Outotec undertaking a review of modular staging approach
Scoping Study completed in Oct 2016 Updated financials, cost and execution plan due Q1 2018
Note: As per ASX announcements of 27 August 2015 and 27 October 2016.
© 2017 Alkane Resources Ltd
For
per
sona
l use
onl
y

DPProcessP
lant
@ 1mtpa
Rare earth chemical concentrate 95% REO 6,667 tpa(REOunits) 30%
Zirconium as Zr chemicals & zirconia 99% ZrO216,374 tpa(ZrO2units)
43%
Hafnium as HfO2 HfO250 tpa(Hf units) 10%
Niobium as ferro‐niobium 65%Nb 1,967 tpa(Nbunits) 17%
Total = 25,058 tpa
Products from Dubbo
11
REO for magnet production 1,294 tpa(REOunits)
25%
REO for other applications 5,373 tpa(REOunits)
5%
Product Stream Specification Tonnes Revenue %
© 2017 Alkane Resources Ltd
For
per
sona
l use
onl
y

12
NbRevenue 17%
Zirconium Ceramics Chemicals Refractory Foundry Jet engines
Niobium Superalloys Bridges Rockets
HfRevenue 10%
REERevenue 30%
Revenue 43%
Hafnium Superalloys Plasma cutting tips Nuclear control rods Catalyst precursor Jet engines
Magnets 25% EV’s Wind power Robotics
Non‐Magnets 5% Catalysts Glass Phosphors Metal alloys Polishing Ceramics
REE 30%
Products from Dubbo ProjectThe Dubbo Project provides a strategic source of zirconium, rare earths, niobium and hafnium.
Revenue split at spot prices
© 2017 Alkane Resources Ltd
For
per
sona
l use
onl
y

Key Product Pricing ‐ 2017
PrNd Mischmetal Pr Oxide PrNd Oxide
Nd Oxide ZOC Zircon Sand
13© 2017 Alkane Resources Ltd
For
per
sona
l use
onl
y

Applications of Rare Earth Elements
14
• 30% of revenue forecast from REE• 175,000tpa global consumption 2017E• 10+% annual consumption growth estimates in magnets• ~90% REE produced by China• Alkane uniquely placed as a source of REE outside of
China
China83%
Japan12%
US2%
Other3%
Metallurgy2%
Catalyst1%
Magnets73%
Ceramics5%
Other3%
Phosphors16%
End Markets (% of revenue)
Global Magnet RE Demand
Source: IMCOA© 2017 Alkane Resources Ltd
For
per
sona
l use
onl
y

Rare Earth Permanent Magnets (REPM)
• Growing at 14% CAGR• 196kg of REE used per MW• Additional 10‐15ktpa of Nd‐Pr required
0
100
200
300
400
500
600
700
800
900
2010
2011
2012
2013
2014
2015
2016
2017
f
2018
f
2019
f
2020
f
2021
f
Inst
alle
d C
apac
ity G
W
0
50
100
150
200
250
2015 2020 2025 2030
Elec
tric
Veh
icle
Sto
ck (m
)
IAEA target 2DS Paris Target
• Growing at up to 50% CAGR• 0.7kg of REE for traction motor• 0.8kg of REE for other motors (windows/seats)• Additional 10‐15ktpa of Nd‐Pr required
Demand for rare earth permanent magnets is intense from fast growing sectors such as electric vehicles, renewable energy and consumer electronics.
Wind Power Electric Vehicles
Source: Global Wind Energy Council Source: International Energy Agency
15© 2017 Alkane Resources Ltd
For
per
sona
l use
onl
y

Zirconium Chemicals Demand
Applications of Zirconium
16
38% Advanced Ceramics
18% Ceramic Pigments
14% Cubic Zirconia
15% Catalysts
4% Paper Coatings
2% Paint Drier
5% TiO2 Pigment Coatings
2% Tanning
2% Other Coatings
Ceramics55%
Refractory14%
TV Glass/ Other3%
Foundry10%
Zirconium Chemicals
18%
Zirconium materials typically traded as:• fused zirconia – zirconium oxide (ZrO2), typically
produced from zirconium silicate (zirconia sands)• zirconium chemicals – including zirconium oxychloride
(ZOC), zirconium basic carbonate (ZBC), zirconium sulphate (ZBS) and zirconium hydroxide (ZHO)
• zirconium bar – metallic zirconium, typically produced from either fused zirconia or zirconium chemicals.
Zircon Demand
• 42% of revenue forecast from zirconium• Zirconium price leveraged to the zircon market which is benefiting from a recent rally in prices
© 2017 Alkane Resources Ltd
For
per
sona
l use
onl
y

Applications of Niobium
17
• 17% of revenue forecast from niobium• 90% of Nb used in the production of high strength low alloy (HSLA) steels.• World production estimated at 80,000t Nb with a global market of US$3‐4B. • CAGR anticipated at 10%. Demand expected to be driven by greater use in steels by BRIC producers.
Auto24%
Pipe24%
Structural29%
Stainless10%
Other13% $9 of Nb
Weight reduction:100kg
Fuel efficiency: ~5% km/l
0.022% of Nb
Weight reduction:15,000t
Cost Savings: $25M
© 2017 Alkane Resources Ltd
For
per
sona
l use
onl
y

Applications of Hafnium
Superalloy (60%) Plasma cutting tips (15%) Nuclear control rod (11%) Catalyst precursor (7%) Semiconductors (3%) Oxide for Optical (3%)
10t7t
5t
2t
2t
40t
Demand 66t AREVA35t
ATI20t
China2t
Westinghouse2t
Revert10t
Others1t
Supply 70t
80% of hafnium metal is produced by France and the USA (~10t recycled)
Stability and strength at high temperatures makes hafnium ideally suited to superalloy applications
• 10% of revenue forecast from hafnium
18© 2017 Alkane Resources Ltd
For
per
sona
l use
onl
y
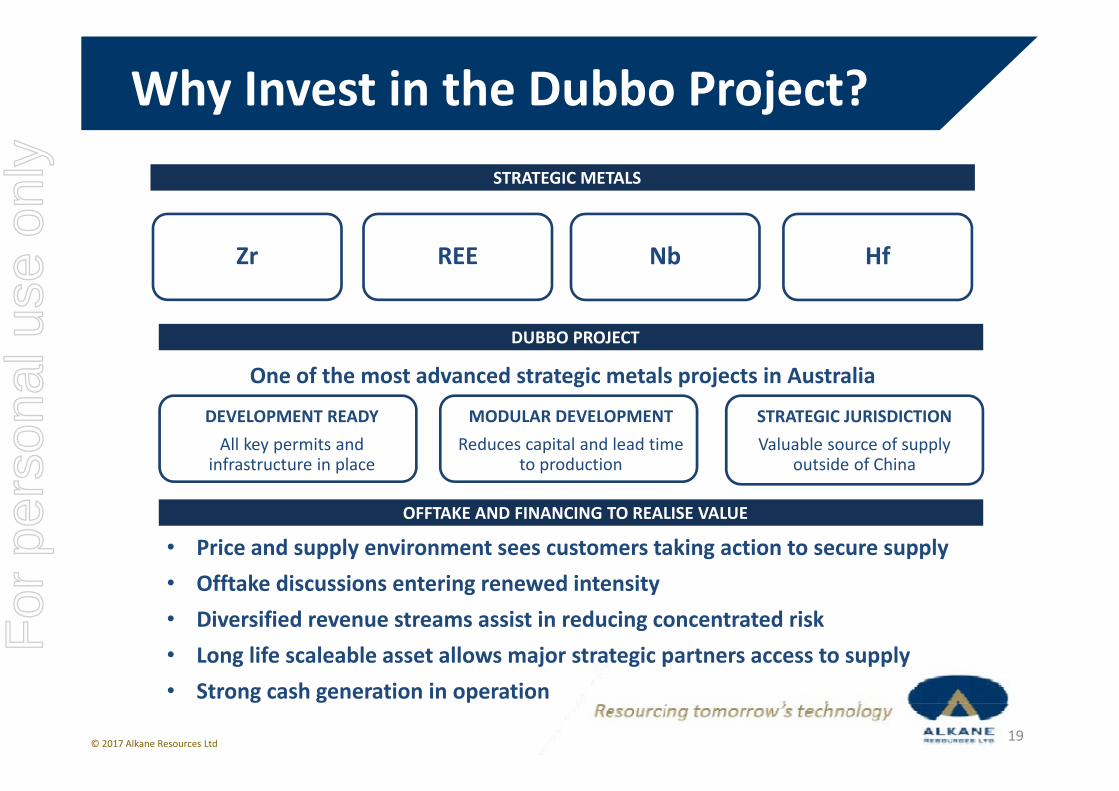
Why Invest in the Dubbo Project?
19
STRATEGIC METALS
Zr REE Nb Hf
DUBBO PROJECT
STRATEGIC JURISDICTIONValuable source of supply
outside of China
MODULAR DEVELOPMENTReduces capital and lead time
to production
DEVELOPMENT READYAll key permits and
infrastructure in place
One of the most advanced strategic metals projects in Australia
OFFTAKE AND FINANCING TO REALISE VALUE
• Price and supply environment sees customers taking action to secure supply• Offtake discussions entering renewed intensity• Diversified revenue streams assist in reducing concentrated risk• Long life scaleable asset allows major strategic partners access to supply• Strong cash generation in operation
© 2017 Alkane Resources Ltd
For
per
sona
l use
onl
y

Next 12 Months
Dubbo Project • Updated hafnium product development• Updated speciality zirconium product development• Updated business case for modularisation, including financial and marketing• Securing and negotiation of offtake• Progression of financing• Commencement of early works and detailed engineeringTomingley• Safe and stable operation to end of open cut life• Decision on underground opportunity• Continue near mine regional explorationRegional Exploration• IP and drilling programs, particularly in the Northern Molong Porphyry Project• Evaluation of remaining tenements
20© 2017 Alkane Resources Ltd
For
per
sona
l use
onl
y

This presentation contains certain forward looking statements and forecasts, including possible or assumed reserves and resources, production levels and rates, costs, prices, future performance or potential growth of Alkane Resources Ltd, industry growth or other trend projections. Such statements are not a guarantee of future performance and involve unknown risks and uncertainties, as well as other factors which are beyond the control of Alkane Resources Ltd. Actual results and developments may differ materially from those expressed of implied by these forward looking statements depending on a variety of factors. Nothing in this presentation should be construed as either an offer to sell or a solicitation of an offer to buy or sell securities.
This document has been prepared in accordance with the requirements of Australian securities laws, which may differ from the requirements of United States and other country securities laws. Unless otherwise indicated, all ore reserve and mineral resource estimates included or incorporated by reference in this document have been, and will be, prepared in accordance with the JORC classification system of the Australasian Institute of Mining, and Metallurgy and Australian Institute of Geosciences.
Competent PersonUnless otherwise stated, the information in this presentation that relates to mineral exploration, mineral resources and ore reserves is based on information compiled by Mr D I Chalmers, FAusIMM, FAIG, (director of the Company) who has sufficient experience which is relevant to the style of mineralisation and type of deposit under consideration and to the activity which he is undertaking to qualify as Competent Person as defined in the 2012 Edition of the Australasian Code for Reporting of Exploration Results, Mineral Resources and Ore Reserves. Ian Chalmers consents to the inclusion in the presentation of the matters based on his information in the form and context in which it appears.
Disclaimer
21© 2017 Alkane Resources Ltd
For
per
sona
l use
onl
y

Dubbo Project – Mineral Resources
Dubbo Project – Ore Reserves
Dubbo Project Resources & Reserves
Resource Category Tonnes
(Mt)
ZrO2
(%)
HfO2
(%)
Nb2O5
(%)
Ta2O5
(%)
Y2O3
(%)
TREO*
(%)Measured 42.81 1.89 0.04 0.45 0.03 0.14 0.74
Inferred 32.37 1.90 0.04 0.44 0.03 0.14 0.74
Total 75.18 1.89 0.04 0.44 0.03 0.14 0.74
*TREO% is the sum of all rare earth oxides excluding ZrO2, HfO2, Nb2O3, Ta2O5, Y2O3,
Reserve Category Tonnes
(Mt)
ZrO2
(%)
HfO2
(%)
Nb2O5
(%)
Ta2O5
(%)
Y2O3
(%)
TREO*
(%)
Proved 18.90 1.85 0.04 0.440 0.029 0.136 0.735
Probable 0
Total 18.90 1.85 0.04 0.440 0.029 0.136 0.735
*TREO% is the sum of all rare earth oxides excluding ZrO2, HfO2, Nb2O3, Ta2O5, Y2O3,
Note: Full details including Competent Person statements in ASX announcement 19 September 2017 ‐ the Company confirms that all material assumptions and technical parameters underpinning the estimated Mineral Resources and Ore Reserves, and production targets and the forecast financial information as disclosed continue to apply and have not materially changed
22© 2017 Alkane Resources Ltd
For
per
sona
l use
onl
y

Note: ASX announcements 21 September 2015 and 10 December 2015 ‐ the Company confirms that all materialassumptions and technical parameters underpinning the estimated Mineral Resources and Ore Reserves, and productiontargets and the forecast financial information as disclosed continue to apply and have not materially changed.
TGO Resources and Reserves
Note: Full details including Competent Person Statements in ASX announcement 3 September 2017 ‐ the Company confirms that all material assumptions and technical parameters underpinning the estimated Mineral Resources and Ore Reserves, and production targets and the forecast financial information as disclosed continue to apply and have not materially changed
TOMINGLEY GOLD OPERATIONS MINERAL RESOURCES (as at 30 June 2017)MEASURED INDICATED INFERRED TOTAL Total GoldDEPOSIT Tonnage Grade Tonnage Grade Tonnage Grade Tonnage Grade(Kt) (g/t Au) (Kt) (g/t Au) (Kt) (g/t Au) (Kt) (g/t Au) (Koz)
Open Pittable Resources (cut off 0.50g/t Au)Wyoming One 1,716 1.7 400 1.6 625 1.1 2,741 1.6 137Wyoming Three 86 2.0 16 1.3 33 1.4 135 1.7 8Caloma One 954 1.6 1,016 1.2 824 1.2 2,794 1.3 120Caloma Two - 0.0 956 2.1 927 1.1 1,883 1.6 97Stockpiles 762 1.0 762 1.0 23Sub Total 3,518 1.6 2,388 1.73 2,409 1.3 8,315 1.4 385Underground Resources (cut off 2.50g/t Au)Wyoming One 169 4.8 206 4.4 363 4.2 738 4.4 104Wyoming Three 10 3.6 6 3.1 4 3.1 20 3.4 2Caloma One - 0.0 5 3.0 16 2.9 21 2.9 2Caloma Two - 0.0 80 3.4 53 3.2 133 3.3 14Sub Total 179 4.7 297 4.1 436 4.0 912 4.2 122TOTAL 3,697 1.8 2,685 1.9 2,845 1.7 9,227 1.7 508
TOMINGLEY GOLD OPERATIONS ORE RESERVES (as at 30 June 2017)
DEPOSITPROVED PROBABLE TOTAL
Total GoldTonnage Grade Tonnage Grade Tonnage Grade
(Kt) (g/t Au) (Kt) (g/t Au) (Kt) (g/t Au) (Koz)Open Pittable Reserves (cut off 0.50g/t Au)Wyoming One 1,033 1.7 134 1.5 1,167 1.6 63
Wyoming Three 0 0 0 0 0 0 0
Caloma One 58 2.2 0 0 58 2.2 4
Caloma Two ‐ ‐ 167 2.7 167 2.7 14
Stockpiles 762 1.0 ‐ ‐ 762 1.0 22
Sub Total 1,853 1.4 301 2.2 2,154 1.5 104
Underground Reserves (cut off 2.50g/t Au)
Wyoming One* 224 4.0 300.5 3.4 524.4 3.7 62
Sub Total 224 4.0 300.5 3.4 524.4 3.7 62
TOTAL 2,077 1.7 602 2.8 2,678 1.9 166
23© 2017 Alkane Resources Ltd
For
per
sona
l use
onl
y