FOR FILE COPY - World Bankdocuments.worldbank.org/curated/en/769081468230081087/pdf/multi... ·...
103
Document of The World Bank FOR OFFICIAL USE ONLY FILE COPY Report No. 2418-BR STAFF APPRAISAL REPORT NORTHEAST BRAZIL PERNAMBUCO RURAL DEVELOPMENT PROJECT AGRESTE SETENTRIONAL May 22, 1979 This document has a restricted distribution and may be used by recipients only in the performance of their official duties. Its contents may not otherwise be disclosed without World Bank authorization. Public Disclosure Authorized Public Disclosure Authorized Public Disclosure Authorized Public Disclosure Authorized Public Disclosure Authorized Public Disclosure Authorized Public Disclosure Authorized Public Disclosure Authorized
Transcript of FOR FILE COPY - World Bankdocuments.worldbank.org/curated/en/769081468230081087/pdf/multi... ·...

Document of
The World Bank
FOR OFFICIAL USE ONLY
FILE COPYReport No. 2418-BR
STAFF APPRAISAL REPORT
NORTHEAST BRAZIL
PERNAMBUCO RURAL DEVELOPMENT PROJECT
AGRESTE SETENTRIONAL
May 22, 1979
This document has a restricted distribution and may be used by recipients only in the performance oftheir official duties. Its contents may not otherwise be disclosed without World Bank authorization.
Pub
lic D
iscl
osur
e A
utho
rized
Pub
lic D
iscl
osur
e A
utho
rized
Pub
lic D
iscl
osur
e A
utho
rized
Pub
lic D
iscl
osur
e A
utho
rized
Pub
lic D
iscl
osur
e A
utho
rized
Pub
lic D
iscl
osur
e A
utho
rized
Pub
lic D
iscl
osur
e A
utho
rized
Pub
lic D
iscl
osur
e A
utho
rized

CURRENCY EQUIVALENTS
Currency Unit = Brazilian Cruzeiro (Cr$)US$1.00 = Cr$ 19.15 (October, 1978)*Cr$1.00 US$0.0522Cr$1 million = US$52,219
WEIGHTS AND MEASURES
1 meter (m) 3.28 feet1 kilometer (km) 0.62 miles
1 hectare (ha) 10,000 m2 = 2.47 acresI square kilometer (km2) = 100 ha = 247.1 acres = 0.386
3 sq. miles1 cubic meter (m ) 1.31 cubic yards = 264.2 US gallons1 kilogram (Kg) 2.2 pounds1 ton = 1,000 Kg = 2,205 pounds
GLOSSARY OF ACRONYMS
(see next page)
GOVERNMENT OF BRAZIL FISCAL YEAR
January 1 to December 31
POLONORDESTE PROGRAM FISCAL YEAR
April 1 to March 31
* Average Exchange Rates:October
1975 1976 1977 1978
US$1.00 = Cr$ 8.128 10.786 14.138 19.15

FOR OFFICIAL USE ONLY
GLOSSARY. OF ACRONYMS
ASSOCENE ^ Associacao de Orientacao as Cooperativas do Nordeste (Associationfor the Orientation of Cooperatives in the Northeast).
BB - Banco do Brasil (Bank of Brazil)BNB - Banco do Nordeste do Brasil (Bank of the Northeast of Brazil)BANDEPE - Banco do Estado de Pernambuco (State Bank of Pernambuco)
CAGEP - Companhia de Armazens Gerais do Estado de Pernambuco(State Storage Company)
CEASA - Centrais de Abastecimento de Pernambuco S.A. (CentralMarketing Organization of Pernambuco)
CEBRAE - Centro Brasileiro de Ass:Lstencia as Pequenas e Medias Empresas(Brazilean Center for Assistance to Small and Medium Enterprises)
CELPE - Companhia de Electrificacao de Pernambuco(State Electrification Company)
CEPA-PE - Fundacao Estadual de Planejamento Agricola(State Agricultural Plananing Commission)
CIBRAZEM a Companhia Brasileira de Armazenamento(Brazilian Storage Company)
CILPE = Companhia de Industrializacao de Leite de Pernambuco(State Milk Marketing CDmpany)
CISAGRO = Companhia Integrada de Servicos Agropecuarios de Pernambuco(State Integrated Agricultural Service Company)
COBAL - Companhia Brasileira de Alimentos (Brazilian Food Company)COCANE - Cooperativa Central Agricola de Nordeste (Central Cooperative
of Agricultural Cooperatives in Northeast Brazil)COMPESA - Companhia Pernambucana de Saneamento (State Watersupply and
Sanitation Company)CONDEPE - Instituto Pernambucano de Desenvolvimento (State Development Institute)CPRH a Companhia Pernambucana de Poluicao Ambiental e Desenvolvimento de
Recursos Hidraulicos (State Pollution Control and Water ResourcesDevelopment Institute)
DAC - Departamento de Assistencia as Cooperativas (State Departmentfor Assistance to Cooperatives)
DER-PE - Departamento de Estradas; de todaRem (State Highway Department)DNER = Departamento National de Estradas de Rodagem (National Highway
Department)DNOCS - Departamento National de Obras Contra as Secas (National
Department for Anti-Drought Operations)DNOS = Departamento Nacional de Obras de Saneamento (National Department
for Watersupplv and Sanitation Works)DPV - Departamento de Producac Vegetal (Department of Plant Production)
EMATER-PE = Empresa de Assistencia l'ecnica e Extensao Rural de Pernambuco(State Rural Extension Company)
EMBRATER = Empresa Brasileira de Assistencia Tecnica e Extensao Rural (BrazilianTechnical Assistance and Rural Extension Company)
EMBRAPA = Empresa Brasileira de Pesquisa Agropecuaria (BrazilianAgricultural Research Company)
FECOFIPE = Federacao de Cooperativas Mixtas de Pernambuco (Federation ofMixed Cooperatives in T'ernambuco)
FSESP = Fundacao de Servico Especial de Saude Publica (Foundation forSpecial Health Services)
FUNRURAL = Fundo de Assistencia ao rrabalhador Rural (Assistance Fund forRural Workers)
FUSAM = Fundacao de Saude Amaury de Medeiros (Health Foundation ofAmaury de Medeiros)
GECA = Grupo Especial de Coordinacao e Acompanhamento (POLONORDESTESpecial Coordinating Group in Brasilia)
GRPN - Grupo Regional de Polonordeste (POLONORDESTE Rcgional (CoordinatingGroup, ir. nce_fe)
This document has a restricted distribution and may be used by recipients only in the performanceof their official duties. Its contents may not otherwise be disclosed without World Bank authorization.

GLOSSARY OF ACRONYMS (Continued)
IBGE - Instituto Brazileiro de Geografia e Estadistica (BrazilianInstitute for Geography and Statistics)
INAN = Instituto Nacional de Alimentacao e Nutricao (National NutritionInstitute)
INCRA = Instituto Nacional de Colonizacao e Reforma Agraria (NationalInstitute for Colonization and Agrarian Reform)
INAMPS = Instituto Nacional de Assistencia Medica e Provisao Social(National Institute for Social Security and Medical Assistance)
IPA-PE = Instituto de Pesquisa da Agricultura de Pernambuco (StateAgricultural Research Institute)
IPEA = Instituto de Pesquisa de Algodao (Cotton Research Institute)ITEP = Instituto Tecnologico de Pernambuco (Technological Institute of
Permanbuco)MOBRAL = Movimento Brasileiro de Alfabetizacao (Brazilian Literacy Movement)MVR = Maior Valor de Referencia (Maximum Reference Value)NAI-PE = Nucleo de Assistencia Industrial de Pernambuco (Center for
Industrial Technical Assistance in Pernambuco)PENA = Pequenas Empresas Nao-Agricolas (Special small scale non-
agricultural enterprises)
PINES = Programa Integrado de Mestrado em Economia e Sociologia de UFPe(Tntparptpd Masters Prozram of Economy and Sociology of the UFPe)
PIPMO - Programa Intensivo de Preparacao de Mao-de-Obra (Intensive Programfor the Train.ine of Labor)
PIASS = Programa de Interiorizacac das Acoes de Saude e Saneamento (Programfor the Extension of Health and Sanitation Activities)
PMU = Project Management Unit of the Agreste Setentrional Rural DevelopmentProject (Gerencia do Projeto Integrado de Desenvolvimento Rural -PDRI - do Agreste Setentrional) r
POLONORDESTE= Programa de Desenvolvimento de Areas Integradas do Nordeste (Develop-ment Program for Integrated Areas in the Northeast of Brazil)
PROAGRO = Programa de Garantia da Atividade Agricola (Agricultural ProductionInsurance Program)
PROTERRA = Programa de Redistribuicao da Terra e de Estimulo a Agro-Industria doNorte e do Nordeste (Program for Land Redistribution and Developmentin the North and Northeast of Brazil)
SEC Secretaria de Educacao e Cultura (State Secretariat of Education)SENAC = Servico Nacional de Aprendizagem Commercial (National Service for
Apprenticeship in Commerce)SENAI = Servico Nacional de Aprendizagem Industrial (National Service for
Apprenticeship in Industry)SENAR = Servico Nacional de Aprendizagem Agricola (Nacional Service for
Apprenticeship in Agriculture)SEPLAN = Secretaria de Planejamento (State Secretariat for Planning)SES - Secretaria de Saude (State Secretariat for health)SIMA = Servico de Informacao Agricola (Agricultural Information Service)STE = Secretaria de Transportes, Communicacoes e Energia (State
Secretariat for Transport, Communications and Energy)SUCAM = Superintendencia de Campanhas de Saude Publica (National Super-
intendency of Public Health Campaigns)SUDENE = Superintendencia de Desenvolvimento do Nordeste gortheast Development
Superintendency)TU = Unidade Tecnica do POLONORDESTE (Technical Unit for Coordination
of POLONORDESTE - Projects in Pernambuco)UFPe = Universidade E'ederal de Pernambuco (Federal University of Pernambuco)UNO = Uniao Nordestina de Assistencia as Pequenas Organizacoes (Northeast
Union for Assistance to Small Enterprises)UPEA = Unidade d, Pesquisa Agricola (Experimental Research Unit of the
Agricultural Research Company, IPA-PE)

NORTHEAST BRAZIL
PERNAMBUCO RURAL DEVELOPMENT PROJECT
AGRESTE SETENTRIONAL
STAFF APPRAISAL REPORT
Table of Contents
Page No.
I. THE AGRICULTURAL SECTOR .............................. 1
The Sector in the Economy ............................ 1Government Agricultural Policies ..................... 1Agriculture in Northeast Brazil ...................... 2Bank Involvement in the Agricultural Sector .... ...... 3
II. THE STATE OF PERNAMBUCO AND THE PROJECT AREA ... ...... 3
The State ............................................ 3The Project Area ..................................... 4
III. THE EXECUTING AGENCIES ................... ............ 9
State Framework for Executing the POLONORDESTE Program 9Institutions Engaged in Rural Development in theProject Area ......... .............................. 9
IV. THE PROJECT .......................................... 10
A. Origin .......................................... 10B. Brief Description ............................... 10C. Detailed Features ............................... 12
V. PROJECT COSTS AND FINANCING ........... .. ............. 25
Cost Estimates ....................................... 25Financing ............................................ 26Procurement .......................................... 28Disbursements ........................................ 28
The report is based on the findings of an appraisal mission in October 1978composed of Messrs. E. Los, J. Coates, Y. Tencalla, W. Matthey andMs. C. Carr (Bank), and Messrs. N. Rask, T. Cox, J. Mora, E. Calderon,Z. Kowalski and J. Sheehy (Consultants).

TABLE OF CONTENTS (Continued)
Page No.
VI. PROJECT IMPLEMENTATION ................................ 29
Organization and Management ..... ...................... 29
Project Management Unit ............. .. ................ 29
Operating Agreements and Procedures ......... .......... 30
Implementation Schedule ............. .. ................ 30
Project Monitoring .................. .................. 31
Project Evaluation ................ .. .................. 31
Accounts and Auditing ................................. 32
VII. PRODUCTION, DEMAND, MARKETING AND PRICES .32
Production ........ .................................... 32
Demand ................................................ 34
Marketing and Prices ...... ................................. 36
Non-Farm Enterprise Production and Marketing .......... 37
VIII. FINANCIAL ANALYSIS ..... ................................... 38
Illustrative Farm Types ............. .. ........ 38
On-farm Operations .................. .......... 38
Non-farm Activities ............... .. .................. 39
Producer Income ....................................... 39
IX. ECONOMIC BENEFITS AND JUSTIFICATION ................... 40
Economic Rate of Return ...... ......................... 40
Employment ............................................ 43
Fiscal Impact ......................................... 43
Environmental Impact . . .................. . 44
Project Risks ......................................... 44
X. SUMMARY OF AGREEMENTS REACHED AND
RECOMMENDATIONS ....................................... 45
ANNEXES
1. Improved Road Characteristics2. Annual Phasing of Project Costs3. Estimated Schedule of Bank Disbursements and Disbursements
against Statements of Expenditures4. List of Executing Agencies5. Organization Chart of the Project
Management Unit6. Implementation Schedule7. Monitoring of Project Impact8. Agricultural Development
Table: 1. Summary of Illustrative Farm Models

TABLE OF CONTENTS (Continued)
ANNEXES (Continued)
9. Financial Analysis of Illustrative Farm Models
Tables: 1. Input and output coefficients per hectare2. Farm Model 6, Cropping Pattern,
Financial Analysis, Debt Service andCash Flow Projections
3. Farm Model 11, Cropping Pattern,Financial Analysis, Debt Service andCash Flow Projections
4. Farm Model 19, Cropping Pattern,Financial Analysis, Debt Service andCash Flow Projections
5. Estimated Farm Income of Project Participants6. Financial Rates of Return for Project Farm Models
10. Economic Analysis of Small Non-Farm Enterprises
Tables: 1. Condensed Financial Position of SelectedSmall Non-Farm Enterprises
2. Indicative Rate of Return Calculation forSmall Non-Farm Enterprise Component
11. Cost and Benefit Streams for Economic Analysis
Table: 1. Economic Analysis of Agricultural ActivitiesUnder the Project and Economic Analysis ofthe Total Project
12. Related Documents Available in Project File
MAPS
Project Area (IBRD 14004)Climate (IBRD 14005)

NORTHEAST BRAZIL
PERNAMBUCO RURAL DEVELOPMENT PROJECT - AGRESTE SETENTRIONAL
STAFF APPRAISAL REPORT
I. THE AGRICULTURAL SECTOR
The Sector in the Economy
1.01 Although agricultural production in Brazil has been growing at a
lower rate than the GDP as a whole, agriculture continues to be an important
sector in the economy. The national agricultural work force numbers
12.8 million, or 39.5% of the economically active2population, and 43.1 million
ha (out of a national territory of 8.5 million km ) are in agricultural use.About 56% of agricultural merchandise exports account for more than 50% of the
country's export earnings. Brazil is the world's largest exporter of coffee
and orange juice, the largest producer of cane sugar, and the third largest
producer of soybeans. It is also a major supplier of cotton, peanuts, cocoa,
castor oil and sisal. In 1976, the value of Brazil's exported agricultural
products was the third highest in the world.
1.02 The most important products for the domestic market include cassava,
maize, rice, wheat, beans, potatoes, vegetables, bananas, citrus fruit, dairy
products, poultry, beef and pork; coffee, sugar, soybeans, cotton and cocoa
are also important. With the exception of wheat, Brazil is largely self-
sufficient in basic food production, although some staples such as beans are
imported seasonally. More than half of the wheat consumed in Brazil is still
imported.
1.03 From 1967 to 1974, the agricultural sector performed well in meeting
domestic demand for food and fibers as well as in supplying a rising volume of
export commodities, with output growing at an annual average of 5.7% despite
adverse weather conditions in three of the seven years. Farm output increased
4.2% over 1975/76, an increase due more to productivity gains with livestock
(12.2%) than with crops, where a gain of 9% is reduced to 0.4% if the negative
effects of the reduced coffee crop are included. Until 1977, the value of
agricultural output increased steadily, more as a result of an expansion of
production area than of improved productivity. Despite increased attention to
productivity and increasing market integration, subsistence and semi-commercial
production and use of rudimentary technologies continue to be widespread,
particularly in the Northeast, North and Center-West. Because of the large
rural population (para 1.05), the agricultural sector remains a substantial
source of labor for the other sectors of the economy.
Government Agricultural Policies
1.04 The agricultural development strategy of Brazil's Second National
Development Plan (1975-79) aims at more efficient exploitation of the country's
agricultural potential by increasing agricultural output by 40% in real terms.

This goal reflects the Government's intention to encourage production of anincreasing share of Brazil's growing domestic requirements for food and fibersas well as to increase agricultural exports. In addition the Government hasacknowledged the gravity of the country's income distribution problems.Important measures to increase agricultural output have included: (a) utili-zation of substantial public resources to incorporate new areas into production;(b) significant expansion in the supply of agricultural credit, most of it atsubsidized rates; (c) strengthening of research and extension services; and(d) special regional programs, such as the Development Program for IntegratedAreas in the Northeast (POLONORDESTE), that focus on poorer regions and smallerscale farmers.
Agriculture in Northeast Brazil
1.05 The nine states of Northeast Brazil have a population of about35 million persons, two-thirds of whom live in rural areas. The population isgrowing at a net rate of 800,000 inhabitants per year. Much of the region hasa semi-arid climate with periodic serious droughts and extensive areas of poorsoils. Nonetheless, the Northeast is a significant agricultural region, with40% of the agriculturally employed population of Brazil usually accounting for20% of Brazil's agricultural production and a major share of the nationalproduction of cocoa, cotton, manioc, beans and sugar. In 1977, about 30% ofthe area harvested in Brazil was in the Northeast. Throughout the region, mostfood and industrial crops are produced by small farmers. Their technology isunsophisticated and yields are poor. The difficulties facing them include,lack of credit for working capital or investment, limited agriculturalextension services, market isolation and weak linkages with the regionaleconomy, insecurity of land titles and, in some areas, a difficult physicalenvironment. These problems are compounded by a highly skewed pattern of landownership. For instance less than 1% of the total number of farms establish-ments accounts for 40% of the area, whereas in some areas up to 80% of therural labor force owns no land at all. Among Northeastern states, the pro-portion of land holders who own less than 10 ha ranges from 49% in Ceara to87.6% in Maranhao.
1.06 Various Government programs have been directed at speeding economicdevelopment in the Northeast. The Government operates a special agency, theNortheast Development Superintendency (SUDENE), and a special development bankfor the Northeast, the Bank of the Northeast of Brazil. Substantial fiscaland monetary incentives have been made available over the past two decades forboth industry and agriculture. Programs to generate jobs in the industrialsector have not however kept pace with population increases, and continuousimmigration from rural to urban areas has been coupled with considerablemovement to the more industrialized Center-South and Center-West of Brazil.Past Government programs directed to the rural population of the Northeast haveconcentrated on public works, with substantial efforts in drought-prone areasto develop dams and ponds. The administration has however also started tostrengthen the institutions offering the support services required to developmore productive farmings sytems, particularly under the POLONORDESTE program(in which the Bank is involved).

- 3 -
Bank Involvement in the Agricultural Sector
1.07 The Bank has so far made 15 loans, totalling US$543.4 million, foragriculture and rural development in Brazil. These include two, amounting toUS$60.5 million, for livestock development; two, amounting to US$137 million,for agro-industries; one for US$18.2 million for grain storage; one forUS$40 million for agricultural research; one, for US$100 million, to improveagriculture extension services; and eight, totalling US$187.7 million, forvarious settlement, irrigation and rural development projects, seven of whichare located in the Northeast. Additional agricultural and rural developmentprojects and a rural education project, all in the Northeast, are underconsideration for possible future Bank financing. Completion reports forthree projects have been issued: the grain storage and the two livestockdevelopment projects.
II. THE STATE OF PERNAMBUCO AND THE PROJECT AREA
The State
2.01 Location and Natural Features. Pernambuco is one of the 2centralstates of the nine in Northeast Brazil. With an area of 98,300 km (6% of theNortheast), it is only 200 km wide, but stretches 700 km inland, across thethree ecological areas characteristic of the Northeast: a humid coastal zone(Zona da Mata) 50 to 80 km wide, with an annual rainfall of over 1,200 mm; anintermediate area (Agreste) with a transitional climate and a 500 to 1,200 mmannual rainfall, and the arid interior (Sertao) with a rainfall below 600mm per annum. The coastal zone, covering 17% of the state, is the most populated(52% of the State's total) and includes the capital, Recife. The Agreste covers20% of the State and contains 29% of the State's population, and the Sertao,with 63% of the total area, contains only 19% of the population. About 46% ofthe State population of 5.85 million (1975) is rural.
2.02 Social and Economic Conditions. Recife has been one of the leadingcities in the Northeast since colonial times and is a major commercial, indus-trial and administrative center for the region. Since the first Europeansettlers arrived, sugarcane grown in the humid coastal zone has dominated theagricultural sector, and the politics and economics of sugarcane cultivationhave heavily influenced the State's development. Agriculture still plays afundamental role and it has maintained a constant share of the value of goodsand services produced in the State (25%). Industry contributes around 20%,and the service industry with 55% has the highest share for this sector inthe Northeast, providing employment for around 50% of the economically activepopulation in the State. Labor absorption in agriculture has been low, withnew job offers growing at 0.9%/annum, compared to 2.4% for industry and 3.6%for services. This, combined with the availablility of better social servicesin the urban centers, has led to a continuous migration to the cities. Theurban population of the State grew between 1960 and 1970 at 4.2% per annum,while the rural population remained virtually constant. Growth in the agri-cultural sector has been weak (3.3%/annum between 1947-68). By 1972, some75% of the 5 million cultivable hectares had been absorbed into production.

- 4 -
Productivity is low, and the average farm size of 19 ha/farm is among the
smallest in the Northeast. Pernambuco is among the top six states in Brazilin the production of sugar, tomatoes, onions, perennial cotton, bananas,pineapple and manioc. The State's cattle herd is around 1.5 million head,
and there is another 2.1 million head of other livestock. The State isself-sufficient in sugar, beans and manioc, but is still an importer of corn,fruits, vegetables and powdered milk.
2.03 Development Strategy. Growth of output for the State between 1959-69was about 6.5% per annum. The current government established an annual target
of 9% per annum in its five year plan 1975-79, with an increase in the miningand manufacturing share of output from 17% (1970) to 24% (1979) and an improve-ment in the growth of new employment opportunities from 1.4% (1970) to 2.3%
per annum (1979). Means to this end include: (a) in industry, completion ofan industrial complex south of Recife; establishment of industrial districts,
development of agro-industries and expansion and modernization of traditional,
and small-scale enterprises; (b) in agriculture, establishment of the institu-tional framework for the implementation of integrated rural developmentprojects; diversification of production and improvement of productivity;
and development of a Capibaribe river control plan, which would serve agri-
culture as well as prevent the flooding of Recife; and (c) in the service
sector, development of tourism, and improvement of transportaion, energy andwater supply and social services.
The Project Area
2.04 Location and Natural Features. The 10,823 km project area, with apopulation estimated currently at about 1 million (61% rural), includes 31
municipalities. Centered at Caruaru, 8 0S and 36 0W, the largest city in theAgreste, the project area extends 80 km north-south and 150 km east-west between
the semi-arid Sertao in the west and the humid Zona da Mata in the east. It
borders on the State of Paraiba in the north and the Agreste Meridional Project
of POLONORDESTE in the south. The topography ranges from the hilly more humidareas in the east, with an altitude of 100 to 300 m, through the flat central
plains with lower rainfall to the more mountainous west with altitudes of 600to 800 m.
2.05 The mean annual rainfall decreases from 1,100 mm in the east to 500to 700 mm in the west. However, the pattern is discontinuous, with enclavesof high rainfall near escarpments and mountain ridges and low rainfall in theplains around Caruaru. The precipitation is concentrated between March andAugust, with a high annual variability. Mean temperatures range from 160 to32 C, and the relative humidity is low, reaching only 80% in the rainy season.Soils are of medium fertility but often with good physical structure. Ground
water resources are limited, costly to exploit and high in salt content. Onthe basis of these ecological conditions, agricultural development is very
localized and varies within short distances. For project planning and imple-
mentation (IBRD Map No. 14005), three sub-areas were delineated, with the
following characteristics:

-5-
SubareasUnits I (East) II (Center) III (West) Project-Area
Area km 1,077 6,171 3,575 10,823
Population (1970) 2 130,118 500,922 191,143 822,183
Population density persons/km 121 81 53 76Municipalities 5 17 9 31
Rural population % 72 58 64 61
Altitude range meters 100-300 100-800 600-800 100-800
Rainfall range mm/annum 800-1,100 400-1,000 500-800 400-1,100
Dry season weeks 11-15 10-25 13-18 10-25
Land not suitable % 9 19 24 20
for exploitation
2.06 Socio-economic Conditions. The population of the project area in
1970 was 822,183 (6% of the State's population) a2d was estimated at2 l million
in 1978. The average populatio2 density of 76/km varies from 25/km in the
dry areas in the west to 300/km in the most populous eastern municipality.The overall population growth in the area is about 2.5% per annum (2.5% for
the State), indicating a relatively rapid emigration to metropolitan areas. The
urban population increased from 29% (1960) to 39% (1970) of the total population,
and the seven cities in the area with over 20,000 inhabitants are rapidly
growing. The population is young with 44% under 15 years of age. The average
family composition is similar to that found in other Northeastern States:
parents, three to four children, and one dependent for every three families.
2.07 Agriculture is the chief economic activity of the area and accounts
for 68.2% of the economically active population. Within the project area there
are marked differences in occupations and living conditions, due to the rapid
development of urban centers and small-scale industries, as shown below:
Percentage of EconomicActive Population Project State of
Working in: I (East) II (Center) III (West) Area Pernambuco
Agriculture 81.4 41.9 67.9 68.2 50.8
Industry 5.1 9.6 8.4 8.6 13.4
Service sector 13.5 48.5 23.7 23.2 35.8
The central subarea is generally more developed. Its social indicators such
as percentage of houses with electricity (24.4%), of houses with water (19.8%);
number of motor vehicles per 1,000 inhabitants (18.8) and of television sets
per 1,000 inhabitants (11) are almost double those of the other tw ? subareas.The road network is also more intensive there, with about 600 m/km against
200 m/km2 elsewhere.
2.08 Precise data on income are unavailable. The average per capitaincome in the industry and service sectors in the urban centers of the stateis approaching the US$400 per annum level, and in agriculture, covering two

- 6 -
thirds of the population, US$222 per annum (1970). 1/ Calculations for agri-
cultural models in the project area indicate that for most of the smallfarmers the per capita income level is still below US$200 per annum. Income
of farmers in the dairy business or with 10 to 50 ha of land, rises to the
US$250 per capita level, which is still less than the relative poverty level
income of US$330 in 1978.
2.09 Land Tenure. The small and medium farmers produce most of the
food products, while the big farmers concentrate on cattle. Land distribu-
tion is skewed and in the project area about 92% of the farmers cultivate
37% of the farm area. About 45% of the farmers have less than 5 ha. The
following table summarizes the size distribution of all farms in the project
area:
SubareasProject
I (East) II (Center) III (West) Area
Number of Farms
Number of farms owned 6,620 29,060 12,320 48,000
Non-owner farms /a 3,440 15,600 10,900 30,000
% Farms by Farm Size /b
Less than 5 ha 47.3 47.9 37.1 45.1
6-10 ha 23.7 19.4 20.5 20.3
11-50 ha 25.1 26.7 24.2 25.7
above 50 ha 5.7 7.7 11.2 8.2
% Farm Area by Farm Size /b
Less than 5 ha 6.8 5.9 3.6 5.2
6-10 ha 8.7 6.9 5.3 6.6
11-50 ha 25.1 26.7 24.2 25.7
above 50 ha 59.4 60.5 66.9 62.5
/a Includes renters and sharecroppers, but not landless rural labor.
/b Data for owner-operated farms only. Comparable data for non-owner
operations are not available. However, it is estimated that non-owner
operations are mostly below 10 ha. This would reduce the percentage of
farmers with more than 50 ha to about 5%.
Source: CEPA-PE calculation from IBGE (1970) and INCRA (1972) data.
2.10 Agriculture. Relative to its size or population (11 and 16% respec-
tively of Pernambuco), the project area accounts for a disproportionately high
share of the state's production of the traditional food crops, fruits, vegetables
and milk. About 80% of the project area, or 800,000 ha, are cultivatable land,
with 1% in permanent crops, 36% in temporary crops, and 63% in pasture.
1/ Source: "A Economia de Pernambuco", UFPe, 1975.

Cotton, beans, maize and manioc are grown in mixed cropping systems, and coverin total an area of about 280,000 ha (37% of the cultivated and 88% of the
crop land). Cultivation of vegetables (3,100 ha) and fruits (7,500 ha) is
steadily expanding. Tree crops (7,500 ha) and industrial crops (1,800 ha) are
relatively stable. All farmers, including the cattle farmers, grow some or
all of the basic food crops, but generally the big farmers concentrate on beef
and dairy cattle and the farmers with less than 50 ha produce the bulk of the
food crops for sale to the urban centers. The cropping systems are adapted
to the various ecosystems in the project area. As a result various municipal-ities are characterized by cultivation of special crops, such as carrots in
Brejo da Madre de Deus (Mother of God Bluff), and pineapple in Riacho dasAlmas (Soul Creek). Estimated project area production in 1975 was as follows:
Value % PernambucoCrop Units US$ '000 Quantity production
Manioc (root) '000 tons 15.4 352,8 22,4Beans '000 tons 8.0 23,4 18,4
Maize '000 tons 7.5 74,7 21,2Tomatoes '000 tons 4.1 59,0 59,2Cotton (herbaceous) '000 tons 3.2 9,7 33,1
Pineapple million fruit 8.6 14,4 55,3Bananas million fruit 3.1 5,4 22,1Milk million litres 14.4 65,4 40,6
2.11 Industry. The project area also has a disproportionate share of the
State's industrial enterprises. The share of the value of industrial production
is low, however, indicating that industries in the project area are small:
Project Areain % of
Project Area Pernambuco Pernambuco
Number of registered industrialenterprises 1,729 5,913 29
Number of personnel engaged bythese enterprises 8,836 89,258 10
Number of employees per enterprise 5.1 15.1 34
Value of industrial products(Cr$ million) 144 2,646 5
Added value (Cr$ million) 50 1,153 4
Source: Pernambuco Statistical Year Book. 1975.

- 8 -
These figures do not reflect the actual number of people engaged in industry,
because there are many unregistered activities (such as food processing houseindustries and artesan works). A regional artesan center has been developed
in Caruaru, and Santa Cruz de Capibaribe has a center for the production of
low-cost clothing. In addition there is a small milk factory in Sanharo and
various large fruit and vegetable processing plants in Pesqueira and Belo
Jardim.
2.12 Physical Infrastructure. The project area is well served by 304 km
of national highways and 768 km of State roads. Feeding into this primary
road system are 3,900 km of mostly poorly maintained municipal roads. Mainte-
nance of State roads is performed by the State highway department, which is
expected to receive assistance in improving road maintenance under a proposedBank assisted program starting in 1980. Municipal centers and small rural
communities are directly served by the State electricity company (CELPE) and
isolated rural properties in the project area are served through seven rural
electrification cooperatives. In 1970 about 20% of all houses had electricity
and in 1977 only about 1.6% of the rural properties were served. Most of the
municipal centers are served by the State water and sanitation company withwater from tubewells or public dams. Of the roughly 200 rural villages and
communities, only 10 have simple water supply systems. In 1970 about 18% of
all houses in the area received water from public systems, private wells or
nearby springs. Twenty-eight public dams are in operation, of which fiveprovide water for agricultural purposes. Recently the State integrated
agricultural services company started to assist farmers with the constructionof small dams.
2.13 Agricultural Services. Agricultural extension services are credit-
oriented and favor larger farmers, as revealed in the fact that during theperiod 1973-77, over 50% of rural credit granted was for livestock (generally
raised on large and medium scale farms) and 50% went in large loans to 3% of
the borrowers. Only when the POLONORDESTE project started, in April 1977, didthe State agricultural extension service establish local agencies in 25 of the31 municipalities. The State operated storage system is generally serving
larger farmers, middlemen, feed factories and sugar producers. The State
provides input-supply and mechanization services, competing with the privateand cooperative sector. Private intermediaries are the main link betweenfarmers and markets. Agricultural credit is channeled principally through
the 13 agencies of the Banco do Brasil and the Banco do Nordeste do Brasil.
2.14 Social Services. Health and education services, although widely
extended in recent years, are still weak and sometimes ineffective. Only 44%of the school-age children attend school. About 40% of the population over14 years is literate. Infant mortality is high (200-250 per thousand), and
malnutrition is wide-spread, reaching about 60% of the pre-school age children.
There are many contagious diseases, due to poor hygienic conditions and water
supply systems. Only one city, Caruaru, has a solid waste disposal system.
Schistosomiasis is present in 10 (out of 31) municipalities, five of which
show an incidence of between 10 and 40%. Chagas (South American trypanosomiasis)also occurs. There are 29 hospitals, 36 health centers and 60 rural health
posts. The area has one to two beds per 1,000 inhabitants, with an occupancyrate of only 63%. The medical coverage of the population is estimated at 40%,the dental care coverage at 2% and the immunization rate at 10%.

- 9 -
III. THE EXECUTING AGENCIES
State Framework for Executing the POLONORDESTE Program
3.01 The POLONORDESTE programs in Pernambuco are coordinated by aManagement Council (Conselho Diretor) created in October 1975 through StateDecree No.3760. The Council is chaired by the State Secretary of Planning.Other members are the State Secretaries of Agriculture; Industry and Commerce;Transport, Energy and Communications; Sanitation, Housing and Works; Educationand Culture; and Health. Representatives from the Bank of the Northeast ofBrazil and the Bank of Brazil also participate. The Council is responsiblefor: preparing general directives for the POLONORDESTE Programs in .Pernambuco; defining overall priorities and strategy; ensuring adequateparticipation in the programs by executing agencies; approving the annualoperating plans for specific projects; reviewing the quartqrly executingreports of the projects; coordinating and mediating between executing agencies;and resolving problems affecting project implementation.
3.02 Within the State Secretariat of Planning, the Technical Unit forCoordination (TU), also created in 1975, performs the functions of theSecretariat of the Council, and has responsibility for the day-to-day manage-ment and supervision of the four POLONORDESTE projects currently being imple-mented. The TU is managed by a General Coordinator who is directly responsibleto the Secretary of Planning and who approves the annual operating plan and theprogress reports of the projects, before they are sent for final approval tothe Council. Each of the four projects has a project manager, supervised bythe Coordinator. Besides this, the TU has a management team of 10 plbofessionalsand 10 administrative staff members to assist the executing agencies whennecessary in monitoring the projects and preparing the annual operating plansand progress reports.
Institutions Engaged in Rural Development in the Project Area
3.03 The chief agencies involved in rural development in the project areaare: the Government-owned Bank of Brazil (BB), the Bank of the Northeast ofBrazil (BNB) and the State Bank of Pernambuco (BANDEPE); the State RuralExtension Company (EMATER-PE); the State Agricultural Research Institute (IPA-PE);the Integrated Agricultural Services Company (CISAGRO); the State Water Supplyand Sanitation Company (COMPESA)-and the Secretariat for Transport, Energyand Communications, through its State Highway Department (DER-PE); Agriculture,through its Department of Plant Production (DPV); Education (SEC) and Health (SES),including the Health Foundation Amaury de Medeiros (FUSAM), and, finally, theNortheast Union for Assistance to Small Enterprises (UNO). Further support comesfrom the wide range of agencies, with some involvement in rural development suchas the State Storage Company (CAGEP), the Program for the Extension of Healthand Sanitation Activities (PIASS), and the cooperative organizations. Theeffectiveness of many of these agencies has been hampered by limited resources,administrative constraints and relatively little experience in the field.

- 10 -
IV. THE PROJECT
A. Origin
4.01 The POLONORDESTE program, established to raise productivity and
incomes, broaden employment opportunities, and generally improve living
conditions of small farmers in the Northeast was initiated in Pernambuco in
1976. Four rural development2projects are currently under implementation,
covering an area of 25,300 km and a population of about 2 million people.
The State Government gives high priority to the development of the Agreste and
has two rural development projects there. It is a region with reasonably good
agricultural development potential and one which plays a complementary role
in the development of the coastal lands by supplying the Recife metropolitan
area with food and the sugar belt with seasonal labor.
4.02 The original Agreste Setentrional Rural Development project was
prepared early in 1976 and initiated early in 1977. Due to a variety of
problems implementation was slow. In view of the importance of the area, the
State Government requested Bank participation in project preparation and
financing in November 1977. The Bank expressed willingness to consider such
participation, provided that the original project would be reformulated for
Bank financing, which was agreed. The original proposal, devoid of a unifying
organic framework, consisted of a series of isolated programs for small-
and medium-sized farms of up to 100 ha in size, scattered across the project
area. The current proposal has a broader and more integrated base and would
build on the results already achieved in the original project.
B. Brief Description
4.03 The proposed project aims to:
(a) increase production and productivity in agriculture and small
non-farm enterprises by focussing on a target group of low income
producers in the 31 municipalities of the project area;
(b) increase rural per capita income levels and rural employment
opportunities, improve income distribution, and alleviate
rural-urban migration;
(c) raise living standards by improving social and physical
infrastructure; and
(d) improve the State-wide effectiveness of institutions partici-
pating in the project.

- 11 -
4.04 The proposed project would seek to achieve its objectives by:
(a) strengthening agricultural extension, agricultural research,seed supply, water storage and mechanization services; andinitiating land tenure studies;
(b) providing credit to 15,540 small farmers with less than 50 haof land, living on or near their farms and obtaining more than50% of their family income from agricultural activities;
(c) improving input supply, storage and marketing services andproviding assistance to eight agricultural cooperativesocieties;
(d) providing technical assistance and training to 2,700 smallnon-farm enterprises, each of which would have less than 10employees, fixed assets below 200 MVR 1/ (US$12,000), and anowner-income under 8 MVR per month (US$480);
(e) upgrading of about 950 km of municipal roads;
(f) expanding and improving educational and health services,with emphasis on training and including the constructionand upgrading of various health centers, village water supplysystems, sanitary installations and schools; and
(g) strengthening project management, including monitoring andevaluation.
4.05 Because of the size of the project area, the number and unevendistribution of the small farmers, and the weakness of the institutionswhich serve them, the project would concentrate on 63 areas, selectedbecause they exhibit favorable development conditions and contain atleast 150 potential small farmer beneficiaries. The distribution ofexpected direct farmer beneficiaries in the project area by farm size isgiven in the following table.
1/ The MVR (maior valor de referencia), established in 1975, is a standardunit of value used in various financial transactions. Originally basedon the minimum wage, it is now adjusted each May by the cumulative indexof monetary correction for the previous 12 months. One MVR currentlyequals about Cr$ 1,150 or US$60.

- 12 -
______ ____ SubareasI (East) II (Center) III (West) Project Area
Number % Number % Number % Number %
Landless farmers 438 18 690 7 276 7 1,404 9
Farmers with:
0- 2 ha 168 7 1,101 12 299 8 1,568 102.1-55 ha 818 34 3,002 33 1,097 28 4,917 325.1-10 ha 529 22 1,902 21 850 22 3,281 2110.1-50 ha 462 19 2,535 27 1,373 35 4,370 28
Total 2,415 100 9,230 100 3,895 100 15,540 100
4.06 The credit, extension, seed supply and agricultural research componentswould primarily benefit the target group of 15,540 small farmer beneficiaries;the broader based agricultural services, social and physical infrastructureand project management would reach a wider group of some 40,000 farm families,living in the 63 concentration areas where project investments are focussed.Support services for small enterprise development would benefit primarily the2,700 enterprises receiving direct assistance and training. The project would
benefit many more persons than those mentioned above, and would have a positiveeffect on the living standards of most of the one million people living in theproject area.
C. Detailed Features
Credit
4.07 Use by small farmers of institutionalized credit would be expandedsignificantly. The component would include:
(a) incremental short-term credit (custeio) for annual crops andthe establishment of two-year crops; and
(b) medium- and long-term credit to establish permanent crops,especially fruit trees, to make other permanent on-farm improve-ments such as the addition of on-farm storage installations,reservoirs and stables, and for livestock development, includingpasture improvement and livestock purchases. Livestock purchaseswould be financed only as an integral component of a crop andlivestock plan.
4.08 Project credit would be channeled to farmers through the 13 branchesof BB and BNB located in or near the project area. Project credit terms andconditions would be those established by Government for the POLONORDESTEprogram, namely, interest to the farmer at 10%, unindexed for both investmentand seasonal credit (with the exception of fertilizer credit, which is non-interest bearing), with repayment terms for investment credit of up to 12 years,

- 13 -
including a grace period of up to six years. The repayment of seasonalcredit would depend on the production cycle of the crop produced. TheCentral Bank would normally maintain credit lines with the participatingbanks to make available the necessary funds to cover 100% of subloan value.These banks would be required to repay the Central Bank in line with repaymentof subloans made, but retaining a 5% spread. Where lending is channelledthrough cooperatives, the cooperative would receive 2%, leaving the bank with 3%.
4.09 Given Brazil's inflation rate of 42% over the past three years, theinterest rates adopted by the Government for POLONORDESTE projects are negativein real terms. Interest rates were marginally increased in early 1978 (from7% to 10% for smaller loans and from 12% to 14% for larger loans), but aconsiderable subsidy remains. The Government, at least for the time being, isreluctant to reduce the subsidy further for small farmer programs such asPOLONORDESTE. Since the beneficiaries of the proposed project are mainly inthe lower income classes, and since the possibility of misallocations ofresources would be maintained at a minimum through the proposed supervisionfrom the project extension and monitoring activities, the Bank should beprepared to acquiesce to the Government's position.
4.10 Assurances were obtained at negotiations from the Governmentthat it would maintain existing agreements with the participating banks, BBand BNB, to ensure their continued collaboration in the execution of thecredit component, and that additional participating banks could only beincluded after approval by the Bank ; that project credit would be extendedto the small-scale farmers on POLONORDESTE terms and conditions, and thatthe Bank would be promptly informed of changes in such POLONORDESTE lendingterms and conditions. Also, to help insure that the project credit is madeavailable to as large a number of farmers as possible and that the focus onsmaller scale operations is achieved, assurances were obtained that Bankdisbursements would be limited to subloans to farmers whose total debt(investment and working capital) outstanding was under 100 MVR 1/ (or aboutUS$6,000). No project subloans would be made for farm operations requiringfinancing of more than 100 MVR. Family labor would be financed up to 50% ofimputed value, especially for the smallest farmers, whose cash positionduring the year could be severely restricted, especially during the firstfew years of development, as family labor is shifted into on-farm employment.With respect to seasonal crop production credit, since repayment of theseshort-term subloans would, on average, occur in up to one year, assuranceswere obtained during negotiations that the Government would make these fundsavailable each subsequent year for reapplication under the project creditcomponent. Bank disbursements for seasonal crop credit in POLONORDESTEfiscal year 1979, (April 1, 1979-March 31, 1980) would begin only afteraggregate project working capital credit exceeded the comparable amountextended under POLONORDESTE in the project area in fiscal 1978. In eachfollowing year, disbursements for seasonal crop credit would be made onlyagainst credit in excess of the amount extended under the project during theprevious year. Regarding the use of Bank financed agricultural investmentcredit, assurances were obtained at negotiations from State Government thatfinancing for livestock purchases would only be provided as part of anintegrated crop and livestock development plan, to be executed by the smallfarmer.
1/ See Note 1/, page 11.

- 14 -
Production Support Services
4.11 Agricultural Extension. The proposed project would finance: (a)
vehicles and equipment of an expanded extension system; (b) salaries duringtheir first four years of employment and training expenses of the incrementalextension staff, including 25 extensionists only recently employed under thethe original Agreste Setentrional POLONORDESTE Project (para 4.02) who wouldwork full-time for the proposed project; (c) incremental operating costs(materials, supplies, rent) during the project period; (d) costs of pre- andin-service training of extensionists and of short course training of farmers;and (e) consultant services.
4.12 After the four POLONORDESTE projects had started in Pernambuco,EMATER-PE reorganized to cope with the rapidly increasing task. EMATER-PE'sapproach to agricultural extension reflects experience gained in other ruraldevelopment projects in the Northeast of Brazil, and operating methodsdeveloped under the Bank-financed project to assist EMBRATER, the BrazilianTechnical Assistance and Rural Extension Company. It currently operates on adecentralized basis in the proposed project area through two regional officesin Caruaru, and Surubim, and a third one will be established in Pesqueira. Thenumber of local offices has already been expanded from six to 25 and would befurther increased to 31 under the proposed project. The project would resultin the expansion of the regional technical specialists from nine to 16, the localextension field staff from 34 to 165, and the staff of social extensionistsfrom six to 40. A group approach to extension would be developed, as well asextended use of mass media, such as radio, portable loudspeakers, and printedleaflets. It would start with periodic visits by middle level technicians togroups of 10 to 20 farmers, to be followed up by meetings at the districtlevel to inform larger groups on general topics such as input availability,product prices and outlets, credit procedures, and community matters and byfield days to demonstrate field results obtained by experiments and by pro-gressive farmers. Through these contacts, extensionists would promote adoptionof improved production techniques. The extensionists would be backed bysubject matter specialists from the regional offices in the project area andthe central office in Recife. They would be assisted by natural leadersemerging from the farmer groups who would receive special training fromEMATER-PE. To increase the extensionists' effectiveness, EMATER-PE wouldfocus on 63 priority areas (out of roughly 200 rural communities in theproject area) with the highest concentration of small farmers and the bestdevelopment prospects (para 4.05).
4.13 By concentrating its efforts in these areas, containing about35,000 farmers and about 5,000 landless farmers, EMATER-PE would attain atfull project development a coverage of about 250 small farmers per extensionist.Of these, it is estimated that about 40% would adopt new techniques and needcredit. The project would assist some 15,540 new farmers with credit, resultingin a coverage of 100 credit receiving farmers per extensionist in the fifthyear of the project. To reach this coverage, it is assumed that farmers wouldgraduate within two or three years into direct bank clients, requiring onlylimited assistance and supervision from the extension service. EMATER-PEwould be the executing agent for the agricultural and social extension compo-nent, as well as the day-to-day coordinator for the cooperative assistance and

- 15 -
marketing components (paras 4.21 and 4.23). EMATER-PE has prepared a
detailed staff-expansion and training plan for the first year of project
implementation (April 1, 1979 - March 31, 1980). The project would provide
for consultant services during the first two years of the project and
assurances were obtained from Government at negotiations that it would
engage the services of consultants by December 31, 1979, under terms and
conditions satisfactory to the Bank.
4.14 Agricultural Research. The proposed component, an adaptive research
and experimentation effort, would include the staffing, equipping and training
of an eight man research team, with support staff, which would carry out a
research program at farm-level at various locations and farm types in the
project area, establishing a framework to incorporate extensionists and farmers
into the research program. The project costs to be financed include vehicles,
equipment, and materials for research purposes; and incremental personnel and
operating costs during the five year project period.
4.15 Agricultural research in the State of Pernambuco is carried out by
IPA-PE an affiliate of the Brazilian Agricultural Research Company (EMBRAPA).
IPA-PE operates through decentralized Experimental Research Units (UPEA) which
in turn run several experimental stations. The station in Caruaru is in charge
of research into crops typical of the Agreste Region, including cotton, coffee,
maize, beans, carrots, tomatoes and dairy cattle, as well as soil conservation.
However, the research activities are performed without adequate linkage with
the extension service and the farmers. Under EMBRAPA guidance, IPA-PE would
be responsible for component execution. Although there is a general plan for
about 34 annual experiments, covering seven crops, IPA-PE would prepare a
detailed program for each year in consultation with EMATER-PE, the Project
Management Unit and the Bank. EMATER-PE would participate in all facets of
the experimentation program, with heaviest involvement in the demonstration
and dissemination of research results and improved technologies, and of inform-
ing researchers of the acceptance of these new techniques among farmers.
Farmers themselves would be involved in the actual execution of some of the
research projects, as well as providing feedback on the new techniques. The
program for the first year has been prepared and focusses on experiments
within intercropping farming systems in 13 municipalities, as a first step
in a long range research program.
4.16 Seed Supply. The project component aims to coordinate seed produc-
tion, demand and distribution, and to set up a mechanism to guarantee suffi-
cient funds to finance the seed production contracts. The proposed component
would include staffing, training, equipment and incremental costs needed to
adjust production to the project generated increase in demand, to upgrade the
four nurseries in the project area and to improve seed distribution. The
project would provide financing for small trucks, equipment, materials and
incremental personnel and operating costs during the five year project period.
4.17 DPV is in charge of the production of certified seeds for cotton,
maize and beans and of planting materials for fruit crops, and would be the
executing agent for the seed supply component. The private sector provides

- 16 -
adequate quantities of good quality vegetable seeds. DPV operates a 1,200 hairrigated farm to produce basic seeds from the genetic seeds, and then usesthe basic seeds to produce improved or certified seeds in five productioncenters. It also uses farmers in the project area to produce the balance ofrequired certified seeds under contract. During harvest time DPV is committedto pay for and store all contracted seed production. Farmers' requirementsfor improved seeds and planting materials are frequently not met, due to thelack of funds necessary to buy contracted production from the multiplyingfarms at harvest time. To improve this situation, the State recently estab-lished a special fund to finance seed production and improve the infrastructureof seed supply. Assurances were obtained at negotiations from the StateGovernment that a reserve sufficient to finance the annually contractedseed-production would be maintained in this fund. This reserve would beestablished yearly by Government in consultation with the Secretaries ofPlanning, Finance and Agriculture, based on the annual production plan of DPVand the demand-projections prepared by EMATER-PE. Assurances were also beobtained from State Government that DPV's distribution activities would servethe needs of the project beneficiaries with priority.
4.18 Water Conservation. The project area is characterized by an irregularand mostly low rainfall. In addition, groundwater of adequate quality andquantity is difficult to find and costly to exploit. The situation results insocial hardship and difficult to measure risks in agricultural production.Various measures to counteract these climatic disadvantages have been proposedor initiated. Credit has been made available to construct house-tanks for rain-water collection and in recent yearS 20 public dams of various capacities,ranging from 10,000 to 15 million m have been constructed. The problemsencountered are salinization, sedimentation, contamination, leakage and inade-quate design due to the lack of information of local conditions. Some damsnever functioned and most supply only water for human consumption. Where theyare used for agricultural purposes, there are no structured water-user charges.In addition to the public dams, there are numerous small private on-farm dams,mostly providing water for animals. Private entities and CISAGRO have con-structed in recent years about 150 such dams with capacities varying between100 and 5,000 m . The major problems in these cases are a lack of local studies,unreliable tractor services and inadequate capacity.
4.19 In order to improve the availability of water for human consumptionand for agricultural purposes, the project would provide for: (a) the studyand analysis of rainfall patterns in the proposed area, and of the availableclimatological and hydrological data and the preparation of a data base for eachmunicipality; (b) preparation of a manual of technical requirements for directrainfall collection, dam construction and protection, water uses, and qualitycontrol for each of the various ecological regions of the project area;(c) training of extensionists in on-farm water management; (d) improvementof the CISAGRO tractor workshop in Caruaru and purchase of eight tractors; and(e) design and construction of two communal dams and preparation of theiroperational guidelines. It is unlikely that multipurpose dams can be built onsmall or even medium-sized farms, so the solution would be sought in communaldams, constructed and operated by a group of farmers. As there is no experi-ence to date in Pernambuco with this type of communal operation, the project

- 17 -
would construct two dams of about 50,000 m (at US$30,000 each), andorganize two farmer assocations, whose members would be responsible fordam operation and maintenance. For the selection of the dam-sites andthe establishment of farmer-organizations, the project has to rely on thesupport and assistance of EMATER-PE. The experience gained with thesedemonstratio.. dams could serve as a model for future expansion of waterstorage systems. Assurances were obtained at negotiations from State Govern-ment that CISAGRO, responsible under the component for improving the opera-tion of, and the quality and coverage of tractor maintenance servicesprovided by, the Caruaru workshop, would complete this task by December 31,1980. The Project Management Unit would direct the studies and assuranceswere obtained from Government that consultants would be hired by December31, 1979, to perform the data collection, studies, and prepare the manualson water conservation, with terms of reference and on conditions satisfactoryto the Bank, and that these studies and manuals would be presented tothe Bank for review before December 31, 1980. Assurances were also obtainedfrom the State that it would maintain nine tractors in operation in theproject area, in addition to the tractors to be acquired under the currentproject. It would be a condition of disbursement for the construction ofcommunal demonstration dams, that constructions plans which include engineer-ing designs, land specification and an evaluation of water quality andavailability had been approved by the Bank, the farmer associations hadbeen established, the manuals on water conservation had been completed, andextension agents trained in water conservation.
4.20 Assistance to Cooperative Societies. The project would build onGovernment initiatives in the project area and use cooperatives to providesome of the services necessary to support small farmer development. Underthe component eight agricultural cooperatives would be assisted in a phasedfashion with: (a) administrative and managerial guidance, including the finan-cing of studies and key administrative personnel for three years; (b) coopera-tive education to improve member participation; and (c) training of personnelfrom a broader selection of cooperatives in management, administration andmarketing techniques.
4.21 There are 15 primary agricultural cooperatives in the projectarea, providing input supply, mechanization, marketing and extension servicesto their members. The principal problem facing cooperatives in the area isa lack of administrative expertise. Assistance is provided by variousGovernment agencies, principally EMATER-PE and INCRA, and by three secondarysocieties: COCANE, FECOMIPE and ASSOCENE. The execution of the componentwould be coordinated by a full time officer within EMATER-PE. The agricul-tural cooperatives to be selected for project assistance should have thefollowing characteristics: (a) an organizational structure with the potentialto profit from project assistance; (b) a sufficient number of active members(over 200), with 30% or more of them being either landless or small farmerswith less than 20 ha; (c) a location in an area of good agricultural potentialand a concentration of potential small farmer-members; and (d) a managementopen to operational innovation. Assistance would be initiated with an in-depth study of management functions, followed by the implementation of thestudies' recommendations, the hiring of administrative personnel and the

- 18 -
training of existing personnel, where necessary. The studies and their
implementation would be undertaken by ASSOCENE, which has experience in this
field. FECOMIPE would implement the education program. With the administra-
tive mechanisms strengthened, the selected cooperatives would be in a
position to identify and provide those agricultural services, principally
marketing, which are needed most. Assurances were obtained at negotiations
from the State Government that it would confirm in a supplemental letter to
the Project Agreement, that the agreed-upon guidelines would be followed in
selecting cooperatives for project assistance and assurances were also
obtained from the State Government that agreement would be entered into and
maintained with those cooperatives receiving project assistance on admini-
strative and auditing requirements and on the maintenance of adequate staffing.
4.22 Marketing. To ensure adequate marketing services and to resolve
potential bottlenecks, the marketing component would: (a) improve communica-
tion between EMATER-PE, cooperatives, and the Agricultural Information Service
(SIMA) through the use of two-way radios, making price and volume information
available to the small farmer so that harvests would be channeled to the most
advantageous markets; (b) assistance to eight selected cooperatives in the
project area, providing them with two assembly warehouses, each with a
capacity of 300 tons (at an average cost of US$13,700 each), and a small
truck to enable them to participate in the marketing of members' produce; and
(c) train staff of institutions engaged in marketing activities in the
project area; (d) provide information on market conditions for area produce,
through a program on local radio stations; (e) undertake a study, in parallel
with ongoing SUDENE studies, on the intermediation processs, price performance
and potential markets for twelve products 1/ to identify ways in which
efficiency could be improved and an increased share of final product price
made available to the farmer; and (f) study the farmers' participation in
municipal markets, one of the principal outlets for their produce, in order
to identify ways of improving their position with respect to intermediaries.
The latter studies would result in recommendations on design and location
of municipal market facilities to be constructed for small farmers. The
outcome of the experiment in the Paraiba-Bank project (Loan 1537-BR) with
small multi-purpose markets would be followed closely for possible replica-
tion in Pernambuco. The costs of such markets would be about US$20,000 each.
It would be a condition of disbursement for construction of market facilities,
that they would be based on plans, satisfactory to the Bank, and that an
agreement had been signed (convenio) between the State and the municipalities
to ensure proper maintenance of the market facilities. Prevailing market user
charges are adequate to cover operating and maintenance costs.
4.23 EMATER-PE would act as the executing agency for the implementation
of the marketing component, as the investments are closely tied to EMATER-
PE's ongoing cooperative and on farm assistance activities. EaATER-PE
would nominate a full-time officer for component implementation. The studies
and training would be coordinated by the PMU, in consultation with EMATER-PE.
1/ Cotton, maize, manioc, beans, green beans, cucumbers, chayote, pineapple,
sweetsop, meat and dairy products, in addition to the eight studied by
SUDENE: bananas, yams, guavas, onions, carrots, tomatoes, passion fruit
and cashews.
- i9 -
Assurances were obtained at negotiations from State Government that the
terms of reference for the commodity studies and the municipal markets
studies would be satisfactory to the Bank, and that the results of these
studies would be provided to the Bank, for comment, when available, but no
later than December 31, 1980.
4.24 Feeder Roads. The network of Federal and State highways in the
project area is fed by 3,900 km of municipal roads, but these are often
impassable during rainy periods. Improvement of road conditions under the
project would provide for better use of farm inputs, better distribution of
agricultural and social services and improved access to farm areas and markets.
The road component would include: (a) road improvements (civil works) and
consulting services for engineering design and construction supervision, (b)
procurement of road construction and maintenance equipment, and (c) training
of municipal maintenance staff.
4.25 The civil works would provide for upgrading of some 950 km of
municipal roads in support of the project sponsored agricultural development
activities. A preliminary identification of those roads to be upgraded has
been done, with the rough breakdown of the number of kilometers to be upgraded
to given standards as follows: about 180 km to a 5.0 m wide gravel surfaced
standard (at US$26,000/ km); about 290 km to a 3.5 m wide gravel surfaced
standard (at US$18,000/km); and spot improvement of critical stretches and
road drainage along about 480 km (at US$6,200 km). The actual roads to be
upgraded each year would be presented in an annual work plan. No new road
construction is proposed as the existing road network would be adequate to
meet project requirements provided it is upgraded and well maintained.
Assurances were obtained at negotiations from State Government that: (a)
roads would be selected to support those priority areas where agricultural
activities are focussed (para 4.05); any standards higher than minimum would
be justified on the basis of the incremental economic benefits expected; (b)
the specific roads to be improved under the project, as well as the proposed
standards, schedules and methods of execution would be reviewed and confirmed
annually by the Bank on the basis of field reviews, applying agreed criteria
(Annex 1); and (c) that consultants to assist in the preparation of engineer-
ing designs would be hired by December 31, 1979, on terms of reference and
conditions acceptable to the Bank. The DER-PE would be responsible, with
assistance from consultants, for preparation of engineering designs, for
supervision of construction done by contractors, and for executing limited
force account improvements. The arrangements for the execution of the road
component would be included in a general agreement between the POLONORDESTE
management council and DER-PE. Final agreement on the organization and
full-time staff needed would be a condition for disbursement for project
expenditures related to the road component.
4.26 Road maintenance equipment and training of municipal maintenance
staff would be provided in an attempt to ensure that the improvements made
under the project were properly maintained. DER-PE has eight maintenance
field offices (residencias), two of which are in the project area, but they
are poorly equipped and staffed only for maintenance of State highways.
Further, DER-PE gives maintenance priority to paved roads and the more
important unpaved roads but gives only sporadic help to municipalities,
which have little or no maintenance capabilities. Maintenance equipment
consisting chiefly of motorgraders, road rollers and trucks would be financed
to provide the DER-PE with the capability for implementing a regular program

- 20 -
of mechanized road maintenance assistance to the municipalities. However,in view of the limitations of municipal funds and low anticipated trafficlevels, municipal road maintenance would be primarily dependent on municipalwork forces equipped with hand tools. Thus, DER-PE would train municipalforemen in road maintenance and provide two years of supervised implementa-tion. In addition, municipal maintenance supervisors would be trained inplanning, organizing and supervising road maintenance so as to profit fromsystematically programmed assistance from the State to the municipalities.All costs of maintenance of municipal roads would be paid by the municipali-ties, and assurances were obtained at negotiations from State Governmentthat written agreements (convenios) would be established with municipalitiesthat funds would be sufficient to ensure that feeder roads were maintainedin accordance with an agreed program, before any road improvements areundertaken in the municipality. Assurances were obtained at negotiationsfrom State Government that DER-PE would adequately maintain and renewmaintenance equipment for project area roads, and that charges for use ofDER-PE maintenance equipment would cover operation, maintenance and depre-ciation expenses.
4.27 Small Non-farm Enterprises: The project would support the develop-ment of small non-farm enterprises in the project area performing a varietyof activities including food processing, carpentry, ceramics, sewing, leatherwork, small retail stores and services such as those provided by mechanics,electricians, and stone masons. The component would provide: (a) equipmentand staffing for seven offices in the project area for a non-farm enterpriseextension service; (b) training of extensionists; (c) training of about 400small entrepreneurs; and (d) research into local production problems and inter-mediate technology. The costs to be financed include equipment, vehicles,materials and incremental salaries for the local extension offices (para4.9°). Development of micro-enterprises woula provide emiployraent and respondto increased demand for agricultural inputs and servic s and con. umption itemsresulting from project-initiated growth in the area. The existel e of thistype of component helps ensure additional impact from project inx'stments, asopportunities would be provided for spending the additional income to beearned from project activities within the project area. This componentreplicates a similar Bank effort in the State of Paraiba (Loan 1537-BR),which is being implemented successfully.
4.28 UNO would be the executing agency. UNO, a State government agencyis a part of the Federal level Brazilian Center for Assistance to Smalland Medium Enterprises (CEBRAE) and has had six years of experience inproviding this kind of assistance, through the implementation of a similartype of program in Recife. The component would provide for a regional officefor UNO in Caruaru, and for gradually opening local offices in the six largesttowns in the project area during the project investment period. Some 15technical advisors and 60 additional extension agents would be incorporatedin a phased fashion into the extension service. Extension agents wouldidentify those enterprises to be assisted, provide guidance in managerialand production matters, assist in the preparation of investment proposalsfor the banks, and serve as a link between the entrepreneur and other sourcesof information and expertise. The specialized technical advisors wouldsupport the work of the extension agents, assist in training them, and pro-vide advice on detailed managerial and production problems. Training forentrepreneurs would be provided by the National Services for Apprenticeshipin Commerce and Industry (SENAC and SENAI respectively), and the Intensive
- 21 -
Program for the Training of Labor, (PIPMO). Assurances were obtainedat negotiations from State Government that assistance from UNO, would beprovided only to small enterprises with less than 10 employees, fixed assetsof less than 200 MVR (US$12,000), annual sales under 1,000 MVR (US$60,000),and monthly owner net income of under 8 MVR (US$480). It is expected thatabout 2,700 micro-enterprises would receive technical assistance and training,with 2,300 receiving credit from local sources. Credit would be provided byBANDEPE, with which UNO has already established a close working relationship,BB and BNB, from credit lines that are presently available. Local bankexperience with UNO activities in Recife, and with the non-farm enterprisesupport component in the Bank-financed rural development project in Paraiba(Loan 1537-BR) has been favorable, and at appraisal the banks expressedwillingness to support expansion of this type of activity. Assurances wereobtained at negotiations that State Government would make adequate arrange-ments with the banks, to ensure the availability of credit for the develop-ment of small non-farm enterprises assisted under the project.
4.29 The project also would, over the five-year project period, contri-bute 20% to the costs of a research program on production and managementproblems of small enterprises currently being undertaken by the TechnologicalInstitute of Pernambuco (ITEP), with support from CEBRAE. Some five differentkinds of engineers, plus a coordinator, would work under this program,identifying and developing solutions for technological problems for each ofthe representative groups of enterprises; demonstrating improved technologiesto groups of small entrepreneurs; and identifying and cataloging existingtechnological possibilities from world-wide sources to serve as a resourcebase for local small-scale entrepreneurs. Assurances were obtained atnegotiations from the State Government that studies to be undertaken underthe component would have terms of reference satisfactory to the Bank, andthat the studies would be provided to the Bank for comment upon completion.
Social Infrastructure
4.30 Village Water Supply. In conjunction with the proposed healthcomponent the project would provide for the design and construction of 36village water supply systems serving some 28,500 families, of which 27,000would receive in-house water and 1,500 would receive standpipe facilities,covering altogether about 160,000 individuals. The project component wouldinclude: (a) preparation of the engineering designs and operating andmaintenance manuals for the water supply systems during the first year ofthe project; (b) construction of 36 systems; (c) purchase of operating toolsand equipment; and (d) training and supervision of operating staff. Thereare various types of systems: (a) seven with underground water supply atUS$86,800 per unit; (b) 19 with surface water supply at US$83,900 per unit;(c) five with water derived from an existing urban supply system at US$53,400per unit; and (d) five simple standpipe systems at US$29,500 per unit. Theaverage per beneficiary household costs would be US$92. Assurances wereobtained at negotiations, from State Government that the State Water Supplyand Sanitation Company (COMPESA), responsible for the construction of thewater supply systems, would submit for Bank approval before constructionstarted, designs whose cost exceeded US$120 per beneficiary household. Thecosts of individual house connections are collected from the consumer,although financing is available upon request in rural areas. In-houseplumbing is financed by the consumer.

- 22 -
4.31 COMPESA would prepare the engineering designs and carry outconstruction of the systems in consultation with PIASS. It would alsoprepare operation and maintenance manuals, set up supervision systems, andcarry out the training program for operators. Assurances were obtained atnegotiations from State Government, that it would cause COMPESA to preparethe detailed designs and standards for the various types of water supplysystems, operating manuals for the systems and the details of the trainingprogram and present them for comment to the Bank when they become available,but not later than December 31, 1980, and that the terms of reference forthe preparation of these items would be acceptable to the Bank. COMPESAwould operate and maintain through local offices the five systems that wouldbe extensions of existing COMPESA-operated systems and 11 other new systemswith service to more than 1,000 houses. The operation and maintenance costswould be recovered through a monthly tariff of about US$1.50 per connectionper month. The other 20 systems would be administered by local communityassociations to be promoted, and organized by EMATER-PE. It would be acondition of disbursement for the construction of water supply systems thatthe designs had been approved by the Bank, and the responsibility for theoperation and maintenance of the system assumed by COMPESA or a communityassociation. In this respect, the project relies heavily on EMATER'scommunity development activities to mDtivate the farmer groups to participate.The community-administered water supply systems would be operated by thelocal health attendant under the PIASS program and supervised by COMPESA.The costs would be covered by monthly family quotas, to be established andlevied through the community associations, with possible municipal subsidiesfor not more than two years where necessary.
4.32 Education and Training. The education component would assist SECin expanding and strengthening basic education opportunities in the projectarea and in providing trainipw courses for both the rural target - pulationand technical personnel of small farm enterprises. The component wouldinclude: (a) construction furnishing and equipping of 60 rural primaryschools, for a total of 8,400 student places, double shift; (b) construction,furnishing and equipping of 15 intermediate schools (eight primary levelgrades), for a total of 4,200 students, double shift; (c) construction,furnishing and equipping of one Rural Education Center for both formal andnon-formal education and training programs; (d) the training and/or upgradingof about 1,600 teachers and supervisors and of about 170 State and municipalschool administrators, instructors leaders and technicians; (e) provision ofnon formal training and upgrading programs for the adult target populationof the project area; (f) two studies, one to define educational and trainingrequirements for the adult target population in the project area, based onits present educational level, and one to identify trained manpower require-ments within the project area; (g) technical assistance to SEC; and (h)strengthening of the administrative and supervisory capacity of SEC in viewof the project, including salary complements for full-time SEC staff incharge of the implementation of the education component and the equipment,materials and operating costs of component implementation.
4.33 Assurances were obtained from State Government at negotiations that(a) construction would be according to detailed site plans satisfactory tothe Bank, reviewed and confirmed annually on the basis of field reviews; and(b) schools would be built at sites where (i) the school age population numbers

- 23 -
at least 1,200 within a catchment area of about 28 km for the basic schoolsand about 1,400 within the same catchment area for the intermediate schools;(ii) inadequate facilities exist; (iii) students do not have to walk morethan 3 km to reach the school; and (iv) there is year-round vehicle accessfor the intermediate schools and for the Center. Disbursements againstconstruction costs would be conditioned upon provision to the Bank ofsatisfactory evidence of acquisition of the respective sites.
4.34 The strengthening of the primary school infrastructure, theupgrading and occupational training courses, and the studies aim at improvingthe access to basic education and the quality of that education and atoffering training opportunities suitable to the requirements of the projectarea. To assure the effectiveness of the education component, assuranceswere also obtained from State Government during negotiatons that: (a) priorto starting construction of project schools in a particular municipality,the State would secure the municipality's agreement to give priority to thecontinued employment of the trained teachers following their successfulcompletion of the training courses and pay at least the minimum salariesguaranteed by SEC for teachers on the State payroll; (b) the State wouldgive priority to continuing the employment of project-trained school super-visors and SEC technical personnel following their successful completion ofthe training upgrading course; (c) by April 1, 1980, SEC would provide theBank, for comment, with the results of the study on manpower trainingrequirements and of the first phase of the educational needs surveys, all ofwhich would be conducted under terms of reference satisfactory to the Bank;and (d) the State would arrange for adequate funding to maintain appropriatelythe education facilities and services developed under the project, andsupport project municipalities where necessary in financing recurrentexpenditures generated by the project.
4.35 Health and Sanitation. The project would build on the recentexpansion of the health delivery system, particularly on the network ofabout 110 village health posts (miniposts). The objective of the componentwould be to deliver integral health care to 80% of the project's beneficiaries,80% of the mother and child health care groups and 45% of the adults living inthe concentration areas of the project. In doing this, it would reach some18,000 farmers and some 96,000 mothers and children. The component wouldinclude: (a) construction and equipment of regional health centers atLimoeiro and Caruaru, and of two local health centers; (b) the upgrading of20 local health centers; (c) construction and placing of 5,660 pit latrines;(d) training of staff for health centers, miniposts, and community healthagents, refresher courses for the local rural staff, and two instructionseminars for the professional team managing the health care program in theproject area at the regional and local level; (e) construction of storagefacilities serving both village health posts and the supporting healthcenters and the acquisition of six motor vehicles for supervision and trans-port of materials; and (f) development of an improved health administrationsystem in two of the regional departments of SES, in Caruaru and Limoeiro.For this purpose, provisions would be made for 18 man-months of technicalassistance to identify and suggest solutions for administrative problems andfor the salaries of two administrators and one nurse for two years duringimplementation of the accepted recommendations. Assurances were obtained at

- 24 -
negotiations from Government that the consultants would be hired under terms
and conditions acceptable to the Bank, and that the administrative studies
would be undertaken under terms and conditions acceptable to the Bank.
4.36 The SES would be the executing agent of the health component.
SES' Health Department, through its unit for Special Programs and Projects
would implement the administrative and technical subcomponents, and handle
the technical assistance. SES's Administration Department would carry
out the construction of the regional health centers and storage facilities.
The Caruaru and Limoeiro Regional Departments (DIRES II and IV), advised
by SES, would execute the construction and upgrading of local health centers
as well as the training of the rural staff. Funds to carry out these
activities would be transferred from the State to the regional Departments,
forming special budgetary units. The project would improve and consolidate
the DIRES II and IV administrative structure by providing for consultants'
services and personnel to develop and implement acceptable proposals.
Assurances were obtained at negotiations from State Government that SES
would present for comment to the Bank by October 30, 1980, proposals to
improve the administrative structure of the health services in the project
area. Disbursements for the construction of health centers would be condi-
tioned on the Bank receiving evidence of the acquisition of the respective
sites.
Project Management
4.37 The TU of POLONORDESTE in Pernambuco is responsible for the imple-
mentation of the four POLONORDESTE-projects in the State (para 3.02). The
staff in charge of the on-going Agreste Setentrional project, would be
expanded and reorganized into the Project Management Unit (PMU) for the
proposed project. It would be in charge of the administration and monitoring
of this project as well as of the coordination of the activities of all execut-
ing agencies. The PMU would also coordinate the engagement of consultants and
the execution of special studies in the various project components. The PMU
would maintain its main office in Recife and establish a regional office in
Caruaru. The evaluation of the project would be carried out by an independent
agency, the Integrated Masters Program for Economic and Social Studies of the
Federal University of Pernambuco (UFPe) (para 6.07). The majority of the
PMU staff still has to be recruited or trained. To ensure an effective start
of project implementation, the project would provide consultancy services for
24 man-months to assist the Project Manager in establishing his organization,
promoting the project, and setting up the monitoring system.
4.38 The project would finance: (a) vehicles and equipment for PMU's
offices; (b) staff salaries and travel expenses; (c) staff training and
consultant services; (d) monitoring; and (e) evaluation. Project evalua-
tion activities would be based on an agreement between the POLONORDESTE
Management Council and the UFPe, and would include: (a) three baseline
studies; (b) ongoing evaluation assistance to the PMU; and (c) post project
evaluation (para 6.07). Assurances were obtained at negotiations from
Government that the consultants to assist the PMU in the management of the
project would be engaged by December 31, 1979 with terms of reference and on
conditions satisfactory to the Bank.

- 25 -
4.39 The management component also includes the costs for the land tenurestudies and the possible costs for improving land titling services. As notedin paragraph 2.09 the distribution of land ownership is extremely unequal,with a very small number of families controlling most of the availablefarm land. Various possibilities for attempting to improve the situationwere proposed at appraisal, but insufficient data were available to arriveat a workable proposition. The ownership of sufficient land and securityof tenure are important factors in determining small farmer motivation anddevelopment. The component would finance: (a) consultant services, tostudy and identify the best ways in which land purchase credit and landtitling services can be provided for small farmers and sharecroppers; and(b) the startup costs of the institutional framework needed to implementacceptable proposals. The studies would look into other experiences in theNortheast, including those of ongoing rural development projects, would makerecommendations for the mechanisms to provide adequate land purchase credit,land titling services and would identify areas of priority. The directbeneficiaries of the project are mostly landowners and the studies would notdelay the implementation of the credit component. The studies and theeventual land titling services aim to improve and complement existingprocedures and to make them more accesible for small and landless farmers.Assurances were obtained at negotiations from Government that consultantsfor these studies would be hired by December 31, 1979, under terms ofreference and conditions satisfactory to the Bank, and from State Governmentthat these studies would be concluded by June 30, 1980, and that theresults and proposals coming from the studies would be discussed with theBank. The PMU within POLONORDESTE would be responsible for their execution.It would be a condition of disbursement for the establishment of the institu-tional framework that the proposals to be implemented are acceptable to theBank.
V. PROJECT COSTS AND FINANCING
Cost Estimates
5.01 The total project cost over the five year project implementationperiod (April 1, 1979 to March 30, 1984) is estimated at US$116.7 million,including taxes of US$2.3 million, physical contingencies 1/ estimated at
1/ Physical contingencies were estimated based on the level of preparationof the various components. They reflect the extent to which detailedplans were available at appraisal and provide for justifiable variationin physical sizes and quantities of goods purchased under the project,over and above the best estimates made at appraisal. Physical contin-gencies applied were as follows: extension services, 2%; agriculturalresearch, 3%; improved seed supply, 8%; water conservation, 11%; coop-erative society assistance, 6%; marketing, 10%; feeder roads, 15%; smallnon-farm enterprises, 5%; village water supply, 18%; education, 11%;health and sanitation, 8%; administration and monitoring, 5%; and evalua-tion, 8%.

- 26 -
5% of the baseline cost, and price contingencies 1/ estimated at 24% of thebaseline cost plus physical contingencies. Baseline costs, in October 1978prices were estimated in cruzeiros at the rate of US$1.00 = Cr$ 19.15. Theforeign exchange component is estimated at US$18 million, about 16% of totalproject costs. The project costs are summarized overleaf and annual phasingis in Annex 2.
Financing
5.02 The proposed Bank loan of US$40 million to the Federative Republicof Brazil would finance 35% of project costs net of taxes (34% of totalproject costs), the balance being financed by the Federal Government under thePOLONORDESTE program. The loan would be for 15 years, including three yearsof grace. It would cover the project's foreign exchange costs of US$18million, as well as US$22 million or 22% of the local costs.
5.03 It would be appropriate for the Bank to assist in financingpart of the local currency for expenditures in the project, which has ahigh priority, and yet a relatively low foreign exchange component (16%),due to the capability of the Brazilian economy to produce the inputs requiredby the proposed project. If the Bank is to succeed in mobilizing additionalBrazilian resources and commitment for this kind of project, it seems reason-able that the Bank contribute to the financing of the project with at least34% of total costs. During negotiations assurances were obtained fromGovernment that adequate funds would be made available promptly for theeffective and timely execution of the project and adequate operation andmaintenance of the facilities and services developed under the project.Assurances were also obtained from State Government that it would arrangefor timely acquisition and necessary financing of any additional land orrights of way necessary for project works.
5.04 The proposed project builds on an ongoing and reformulated project.To ensure a smooth transition, retroactive financing of up to US$1,500,000equivalent is proposed to finance start-up costs, incurred after the beginningof the POLONORDESTE fiscal year of 1 April 1979 but before signing of theloan. Eligible activities would include: (a) recruitment and staffing of thePMU, the extension service, research team and the non-farm enterprise technicalassistance agency; (b) designs and engineering studies for roads, schools,health centers and village water supply systems; and (c) incremental creditfor the 1979 agricultural season, starting in March.
1/ Price contingencies were calculated based on the US dollar baselinecost plus physical contingencies, as follows, in annual percentagerates of increase: (a) civil works: 15% in 1978, and 7% thereafter;(b) equipment: 14% in 1978, and 6% thereafter; and (c) other items,including materials, salaries and credit: 7% from 1978 onwards. Pricecontingencies were calculated starting from 31 October 1978, throughthe fiscal years of the project, which start on 1 April and go to 31March of the following year.

- 27 -
NORTHEAST BRAZIL
PERNAMBUCO RURAL DEVELOPMENT PROJECT - AGRESTE SETENTRIONAL
Total Project Costs
(US$ million) % of total %
Baseline Foreign
Local Foreign Total Costs Exchange
Credit
On-farm Investment Credit 23.16 3.16 26.32 29.3 12Incremental On-Farm WorkingCapital Credit 16.00 2.61 18.61 20.7 14
Production Support Services
Agricultural Extension 8.00 0.70 8.70 9.7 8Agricultural Research 1.23 0.11 1.34 1.5 8Seed Supply 0.33 0.09 0.42 0.5 21
Water Conservationi- 0.50 0.21 0.71 0.8 29Assistance to Cooperative
Societies 0.90 0.09 0.99 1.1 9
Marketing 1.62 0.14 1.76 2.0 8
Feeder Roads 9.95 5.13 15.08 16.8 34
Small Non-Farm Enterprises 2.52 0.13 2.65 3.0 5
Social Infrastructure
Village Water Supply 2.10 0.87 2.97 3.3 30Education and Training 4.04 0.50 4.54 5.1 11Health and Sanitation 1.40 0.29 1.69 1.9 17
Project Management
Administration and Monitoring 2.98 0.12 3.10 3.4 4Evaluation 0.80 0.01 0.81 0.9 1
Baseline Costs 75.53 14.16 89.69 100.0 16
Physical Contingencies 3.65 0.69 4.34 4.8 1/ 16Price Contingencies 19.09 3.57 22.66 24.1 - 16
Total Project Costs 98.27 18.42 116.69 130.1- 16
1/ Price contingencies calculated as percent of baseline plus physical contingencies.

- 28 -
Procurement
5.05 Farm inputs and investment items would be procured by individual
farmers through local trade channels. The equipment, tractors and vehicles
required (in relatively small amounts) over the project execution period
by the numerous agencies responsible for the different project components
are locally produced and readily available. Such items (amounting to a
total of roughly US$2.2 million without contingencies) would be procured in
accordance with local procurement and competitive bidding procedures, which
are acceptable. Construction works for feeder road improvement (totalling
US$12.4 million) would be planned annually on the basis of previous field
surveys, establishing the quantity and quality of works required, and divided
in construction lots per municipality for Class A, B and C roads. The Bank
would review the construction standards, bidding and contract documents
before the first round of bidding. Contracts for the works for feeder road
improvement and for civil works required for the rural primary schools,
rural educational centers, health centers, and market places (an additional
US$3.9 million) would be awarded to prequalified bidders on the basis of
competitive bidding advertised locally and in accordance with procedures
which are satisfactory. Brazil has a competitive local constructionindustry capable of carrying out the project works. Water supply works
(totalling US$2.6 million) would be constructed by COMPESA by force account
or, if so required, by prequalified bidders on the basis of competitive
bidding advertised locally. Since the individual construction works are
relatively small and quite dispersed, foreign contractors are not expected
to be interested, though they would not be excluded from bidding. All other
construction work, including storage facilities, sanitation installationsand two small demonstration dams (totalling US$1.3 million) would be of
minor size and also dispersed. These would be constructed under local
procurement and competitive bidding, self-help or in the case of the demon-
stration dams, by force account. Consultancy services (totalling US$2.4
million) would include about 800 man-months (at an average cost of US$3,000/
month). It is expected that practically all consultant expertise could be
found in Brazil, but expatriate services are not excluded. About 40% of the
consultancy services would go to feeder road works, about 30% to assistance
for institution building, 20% to special studies and 10% to construction.
Disbursements
5.06 The proposed loan, which would finance 34% of total project
costs, would be disbursed at the rate of 34% of project expenditures for each
component. Disbursements would be made to the Central Bank of Brazil, the
fiscal agent for the POLONORDESTE program, against withdrawal applications
covering statements of expenditures initiated by the various executing agencies
under the project and certified by the PMU of POLONORDESTE in Pernambuco.
Statements of expenditures would be audited as indicated in para. 6.08.
Supporting documentation for credit, salaries, administrative expenses and
minor construction under force account would not be submitted to the Bank but
would be retained by the PMU and made available for inspection by the Bank
during the course of project supervision missions. Standard documentation
covering civil works, vehicles, tractors and equipment and consultancies and
technical assistance would be submitted to the Bank. Details of the
- 29 -
documents required have been reviewed during negotiations and a descriptionof disbursement procedures against statements of expenditures is given inAnnex 3. Disbursements are expected to occur over about five years. Theestimated disbursement schedule is given in Annex 3.
VI. PROJECT IMPLEMENTATION
Organization and Management
6.01 The State of Pernambuco has already created a Management Council(Conselho Diretor) composed of representatives of the principal executingagencies and chaired by the Secretary of Planning to guide implementationof its POLONORDESTE projects. In 1975 a technical unit was organizedwithin the Secretary of Planning to manage the POLONORDESTE projects in theState (paras 3.01-3.02). The TU started as a single team for all fourPOLONORDESTE projects, but with the increasing workload separate managementunits (gerencias) for each project were set up in 1978. The proposedproject would be managed by the PMU for the ongoing Agreste Setentrionalproject. To ensure proper coordination and adequate integration, the
Secretary of Planning through the TU and the PMU would enter into contracts(convenios) with the executing agencies, outlining their responsibilities(para 6.04). Each component would be the primary responsibility of only oneagency, which would closely cooperate with other agencies active in the same
field. A detailed list of the executing agencies and the collaboratingagencies by component is given in Annex 4. Coordination would be facilitatedby the nomination of a full-time liaison officer in each agency who wouldwork exclusively for the project and be responsible for channeling therequired quarterly monitoring data to the PMU. Assurances were obtained atnegotiations from State Government that the staff of the PMU would beadequately maintained during the project period and that it would supportother participating state agencies in executing the project.
Project Management Unit
6.02 The PMU would be responsible for day-to-day management, overall
coordination of the activities of the executing agencies, and monitoring ofthe project. While remaining part of the TU and responsible to thePOLONORDESTE coordinator, the Unit would be headed by an autonomous projectmanager, headquartered in Recife. The PMU would establish a regional officein Caruaru. Staff would consist of: (a) a project manager, an assistantmanager primarily in charge of monitoring, six technical assistants andadministrative supporting staff (budget clerks, typists, drivers) in theRecife Office; and (b) a regional coordinator, two technical assistantsand some administrative supporting staff in the Caruaru office. An organiza-tion chart of the PMU is provided in Annex 5. The regional coordinator, withthe primary tasks of promoting the project in the area and maintaining closeand continuous contact with local Bank agents and the mayors (prefeitos),would be experienced in agricultural credit matters. One of his assistantswould concentrate on production issues and the other on all social developmentquestions. This regional staff would coordinate project implementation at thelocal level, being principally involved in troubleshooting, solving minorproblems and functioning as a link between PMU, executing agencies and benefi-ciaries. The staff of the Recife office would spend a substantial part of its

- 30 -
time making field visits to improve project monitoring and to adjust implemen-
tation strategies, when necessary. Staffing of the PMU is of vital importanceand it would be a condition for negotiations that the project manager andthe regional coordinator had been nominated and were in position. Assuranceswere also obtained at negotiations from State Government that it wouldappoint qualified personnel and that the Bank would be consulted should theincumbant project manager or the regional coordinator, have to be replaced.Since the State of Pernambuco has had little experience in handling aproject of the proposed scale and complexity, consultants would be engaged(24 man-months) to assist project management during the startup period.
Operating Agreements and Procedures
6.03 Since the project covers a broad range of activities, the timingand scope of some would undoubtedly require adjustments as experience isgained. Thus, each participating agency would prepare jointly with the PMUan annual plan detailing the activities and expected expenditures under theproject for the following year, to coincide with POLONORDESTE's April 1 toMarch 31 fiscal year. The work program, consisting of the integratedpackage of annual plans, as reviewed and approved by the State POLONORDESTEManagement Council, would then be submitted to the regional and federalPOLONORDESTE coordinating groups as a basis for yearly budget allocations.Assurances were obtained during negotiations from Government that (a) theannual work program would be submitted to the Bank by November 30 each yearfor review and comment; (b) the annual work program would be reviewedpromptly by the regional POLONORDESTE coordinating group and (c) the Bankwould be provided with the approved program by January 31 each year.
6.04 Consistent with common practice in Brazil, the State Governmentthrough the Management Council and the TU of POLONORDESTE would enter intowritten agreements (convenios) with the executing agencies to specify theirrespective responsibilities under the project and help ensure timely projectcompletion (para 6.01). In addition, convenios would need to be concluded,under the aegis of the PMU, between the executing agencies themselves whenmore than one entity is involved in project implementation. Assurances wereobtained at negotiations from State Government that agreements would beentered into between various executing agencies and the correspondingmunicipalities or community organizations, to ensure adequate operation andmaintenance of project facilities and services, prior to the construction ofcivil works for feeder roads, schools, health centers, water supply systems,communal demonstration dams and municipal markets. These inter-agencyagreements would be coordinated by the PMU. Draft convenios required forproject execution were prepared by the PMU and reviewed by the Bank beforenegotiations. During negotiations, assurances were obtain from the StateGovernment that it would enter into and maintain during the project executionperiod all such agreements as are necessary to assure active cooperation andestablish execution responsibilities of the various participating agencies(Annex 4). Receipt by the Bank of satisfactory signed agreements betweenthe Executing Agency for a given component, and the POLONORDESTE Managementcouncil, delineating implementation and funding responsibilities, would be acondition of disbursement for each of these components.
Implementation Schedule
6.05 A chronogram of the main project activities is given in Annex 6.

- 31 -
Project Monitoring
6.06 The project monitoring unit would comprise one assistant projectmanager and two assistants, one for all production support components and onefor all social components. The PMU would be responsible for oreparingquarterly monitoring reports and assisting the evaluation team in datagathering. The basic information for monitoring would be provided by theexecuting agencies, mainly through their monitoring or statistical depart-ments, and the technical assistants of the PMU. To ensure timely data
collection, the PMU would prepare standard forms compatible with the admi-nistrative systems of the executing agencies, establishing additional admi-
nistrative mechanisms when required. The monitoring data would be distri-
buted to the members of the POLONORDESTE Management Council, the EvaluationTeam, the regional coordinator and the executing agencies. After receipt of
possible comments the PMU would feed the relevant monitoring information back
to the regional and local levels during ensuing field visits. The quarterlymonitoring report would point out shortfalls in project achievements relativeto expectations, by comparing actual performance to targets of the same dateby itemized indicators. Assurances were obtained during negotiations fromGovernment that quarterly monitoring reports would be provided to the Bankwhen available. The monitoring staff of the PMU would cooperate with theevaluation team in preparing yearly surveys, comparing achievements to theinitial situation by itemized objectives and key indicators (Annex 7). Themonitoring team would take the lead within the PMU in preparing the ProjectCompletion Report. Assurances were also obtained from Government that thisreport would be prepared and submitted to the Bank within six months afterfinal disbursement.
Project Evaluation
6.07 The evaluation of project impact and results would be executed byan independent entity -- the Integrated Master's Program of Economics and
Social Studies of the UFPe -- which would report report directly to thePOLONORDESTE Management Council. The evaluation exercise would consist ofbaseline studies, on-going evaluation of project implementation and a postproject evaluation. The baseline studies would provide the UFPe and manage-ment with a point of reference for evaluating project impact. The pre-projectsituation would be established by three studies concerning: (a) the presenthealth situation, (b) the present situation in education and (c) the actuallevel of income of small farmers and employment, in the project area. Theannual evaluation, using monitoring data and spot-checks as required, wouldcall the attention of management to existing development trends in theproject area and make proposals for project adjustment where appropriate.The evaluation exercise would be an in-depth analysis of project-motivateddevelopments, trying to identify the less visible factors that shape themand to anticipate future developments in order to enable management torespond adequately to up-coming demands in the project area. The post
project evaluation exercise would describe final project impact and assistproject management in preparing the Completion Report. Assurances wereobtained at negotiations from State Government that: (a) the baselinestudies would be carried out under terms and conditions acceptable to theBank; (b) the Bank would be provided with a definitive evaluation program,
- 32 -
before December 31, 1979; (c) that the evaluation reports would be submitted
to the Bank for comment, when they become available; and from the Governmentthat a post-project evaluation report would be prepared and submitted to theBank within eight months after the final disbursement.
Accounts and Auditing
6.08 Each of the participating agencies including the PMU would maintainseparate accounts of its project expenditures, which would be auditedannually by Government auditors (Inspetoria Geral das Financas, IGF) accord-
ing to standard Government practice for POLONORDESTE projects. Both BB andBNB are audited by the Central Bank's auditing unit (Divisao de Auditoria da
Contadoria Geral) and BNB is also audited by satisfactory independentauditors. The PMU would maintain accounts of its own project expendituresas well as of the expenditures by each participating agency. Assuranceswere obtained at negotiations from Government that (a) copies of the audited
statements of project accounts of the various participating agencies and thePMU and of the audited statements of the participating banks and of theirlending under the project would be provided to the Bank through the PMUwithin six months of the end of each POLONORDESTE fiscal year, and (b) thatsuch audit reports would include a separate opinion as to whether theprocedures and controls relating to the statements of expenditures wereproperly prepared and in accordance with the legal project requirements.
VII. PRODUCTION, DEMAND, MARKETING AND PRICES
Production
7.01 The thrust of the proposed project would be to diversify smallfarmer activities from the traditional cultivation of subsistence crops,into far more remunerative vegetable and fruit crops. Previous levels ofsubsistence food production would be maintained and risks from drought
reduced under improved mixed farming systems (see Annex 8). The incrementalproduction would be derived from (a) expansion of the area under improvedpastures; (b) cultivation of about 14,000 ha of newly introduced fruit and
vegetable crops; and (c) the increase of productivity through the use ofimproved seeds, and improved management and technology, as well as throughoff-farm investments, particularly in roads, storage facilities, extension and
research and agricultural information services. Details of expected productionand productivity derived from assumptions contained in 19 illustrative farm
models are given overleaf. The project would build on developments already
initiated by progressive farmers in the project area and would assist smallfarmers to participate in these trends. At estimated 1978 farmgate prices,
incremental annual production at full development is expected to amount to
US$35.2 million equivalent. Value of production per hectare is expected toincrease about 143%, from US$226 to US$550 equivalent.
7.02 Since there are only limited possibilities for increasing thecropped area within a given farm size and with a given soil quality, thefarmer has to balance a decrease in the area under traditional crops with anincrease in productivity, if he is to introduce new crops while maintainingproduction levels of subsistence crops adequate to cover his needs. The
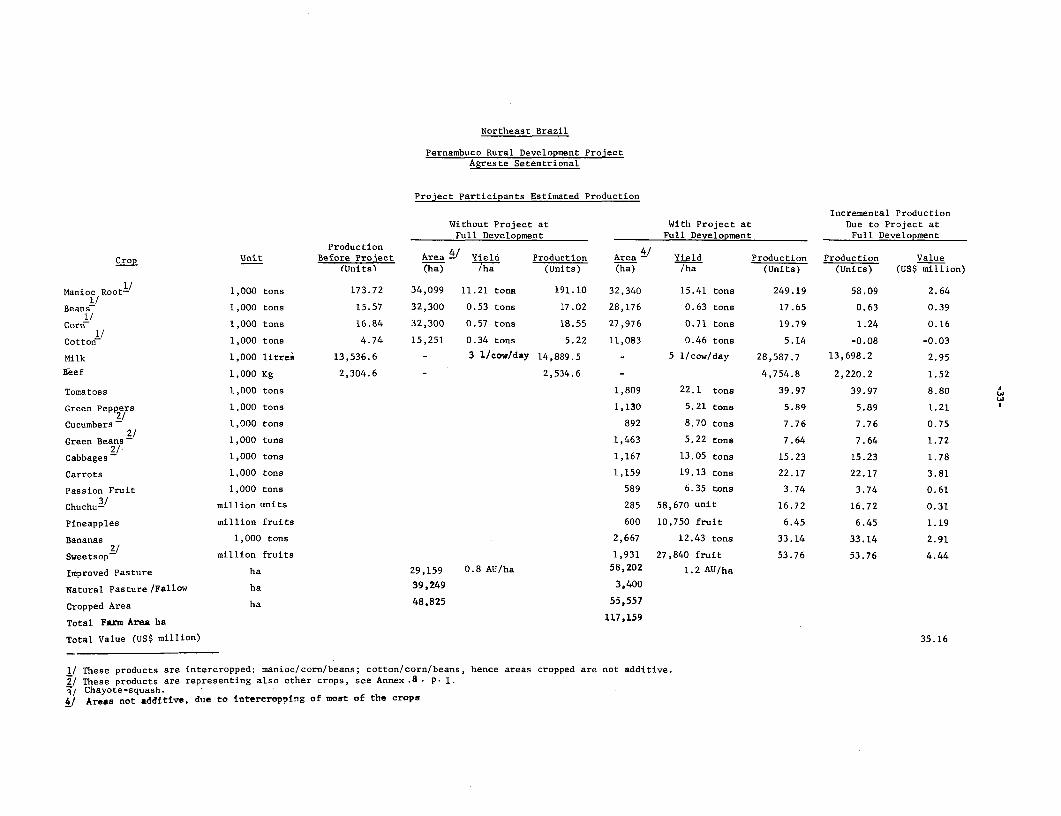
Northeast Brazil
Pernambuco Rural Development ProjectAgreste Setentrional
Project Participants Estimated Production
Incremental ProductionWithout Project at With Project at Due to Project at
Full Development Full Development Full Development
Production
Crop Unit Before Project Area 4/ Yield Production Area - Yield Production Production Value{Units] ~ (ha) /ha (Units) (ha) /ha (Units) (Units) (US$ million)
Manioc Root- 1,000 tons 173.72 34,099 11.21 tona 191.10 32,340 15.41 tons 249.19 58.09 2.641/
Beans- 1,000 tons 15.57 32,300 0.53 tons 17.02 28,176 0.63 tons 17.65 0.63 0.39
1/ 1,000 tons 16.84 32,300 0.57 tons 18.55 27,976 0.71 tons 19.79 1.24 0.16
Cotto1 1,000 tons 4.74 15,251 0.34 tons 5.22 11,083 0.46 tons 5.14 -0.08 -0.03
Milk 1,000 litres 13,536.6 - 3 1/cow/day 14,889.5 - 5 1/cow/day 28,587.7 13,698.2 2.95
Beef 1,000 Kg 2,304.6 - 2,534.6 - 4,754.8 2,220.2 1.52
Tomatoes 1,000 tons 1,809 22.1 tons 39.97 39.97 8.80 w
Green Peppers 1,000 tons 1,130 5.21 tons 5.89 5.89 1.212/
Cucumbers - 1,000 tons 892 8.70 tons 7.76 7.76 0.75
Green Beans - 1,000 tons 1,463 5.22 tons 7.64 7.64 1.72
Cabbages - 1,000 tons 1,167 13.05 tons 15.23 15.23 1.78
Carrots 1,000 tons 1,159 19.13 tons 22.17 22.17 3.81
Passion Fruit 1,000 tons 589 6.35 tons 3.74 3.74 0.61
Chuchu-/ million units 285 58,670 unit 16.72 16.72 0.31
Pineapples million fruits 600 10,750 fruit 6.45 6.45 1.19
Bananas 1,000 tons 2,667 12.43 tons 33.14 33.14 2.91
Sweetsop2 million fruits 1,931 27,840 fruit 53.76 53.76 4.44
Improved Pasture ha 29,159 0.8 AU/ha 58,202 1.2 AU/ha
Natural Pasture /Fallow ha 39,249 3,400
Cropped Area ha 48,825 55,557
Total Farm ArES ha 117,159
Total Value (US$ million) 35.16
1/ These products are intercropped: manioc/corn/beans; cotton/corn/beans, hence areas cropped are not additive.
2/ These products are representing also other crops, see Annex .8 * P. 1.j, Chayote-squash. -4/ Areas not additive, due to intereropping of most of the crops

- 34 -
relative importance of the different crops of project participants wouldchange during project implementation (Annex 8, Table 1). Manioc, corn andbeans would remain key crops, with their production increasing slightly overwithout-project levels. However, their share of the total value of theproduction of participating farmers would drop from 76% to 39%. Total cottonproduction would not be substantially affected by project activities. Aswith the other subsistence crops, decreases in area under cultivation wouldbe offset by increases in productivity. Some 30,000 ha of pastures would beimproved, in farms over 5 ha in size, replacing natural pastures. Vegetableproduction would increase markedly. Farmers would plant small quantities ofa wide variety of vegetables, responding to market trends. Fruit, meat andmilk production would also increase, as farmers combine cultivation of highyielding but more risky vegetables, with more stable perennial fruit andlivestock. The incremental value of fruit and vegetable production is esti-mated at US$27.5 million per year at full development.
7.03 Yield increases due to project activities, used in analyzing ex-pected agricultural production, average 30% over without project levels, withmaximum levels of production attained within a 10 year development period.The highest increases of between 40 and 50% are achieved in special cases formanioc, cotton and certain fruits. Yields would be increased and unnecessarycrop losses reduced principally through better farm management, coupled withthe use of improved seeds, improved disease and pest control methods, fertil-izer and other inputs. Estimated yields at full development are below levelsattained by the most progressive farmers in the project area, and they reflectbest judgements on what could be achieved within the constraints imposed byclimatic and soil conditions. Farmers to be assisted under the project wouldcome from regions selected for their favorable development potential (para.4.05). Yields were decreased from projected levels by a loss factor, estimatedat 13%, as an allowance for the effect of the irregular climate in the projectarea. Approximately 52% of the incremental production (by value) would comefrom vegetables, 26% from fruits, 13% from livestock products, and 9% fromtraditional crops. Because of the "demonstration effect" of project activitiesand infrastructural development, production increase are also probable fromother farms in the project area.
Demand
7.04 The project area covering half of the Agreste region alreadyaccounts for an important share of the current state agricultural productionand is becoming a major food producing area for the State. The projectwould further reinforce this trend. Available data on demand from potentialmarkets and production in other potentially competitive production areas,suggests that project production could face demand constraints or pricereductions were it not for planned project investments in increased storagefacilities, improved market services and access roads (para. 4.22 and4.24). The chief markets for project production include (a) the urbancenters in the Agreste area and the Recife metropolitan area, all of whichare growing at about 3% per annum and will total around 3.3 million inhabi-tants in the mid-1980s; (b) the food processing industries located in thewestern half of the project area, which include five factories processingfruit and vegetables drawn from the whole of the northeast for nation-wide

distribution; and (c) the consumption on the farms and in the rural areas.It should be noted that the actual fruit and vegetables used in the projec-
tion of future production and consumption are proxies for those which wouldactually be produced. The most important are those included in productionplanning. The actual fruits and vegetables planted would deDend on pre-vailing agricultural and market conditions. A summary of current agricul-tural production at the State and project level and an indication of probable
urban and industrial demand are summarized as follows:
Project Incremental a/ Urban andPernambuco Area Project Produc- IndustrialProduction Production tion at Full Demand
Crop Units 1975 1975 Development mid 1980s
Manioc '000 tons 1,575.0 352.8 58.1 215 b/Beans '000 tons 127.3 23.4 0.6 39Corn '000 tons 352.7 74.7 1.2 17.2 c/Bananas million units 3,234.0 714.0 232.0 856Pineapples million units 25.6 14.4 6.4 21
Tomatoes '000 tons 99.7 59.0 40.0 140Milk million litres 189.7 93.8 11.9 103Cotton '000 tons 29.3 9.7 -0.1 n.a.Other Vegetables '000 tons 131.5 29.5 80.7 122
Other Fruit million units 1,092.3 110.9 109.9 217
a/ Increment, after allowing for increase in pre-project yields.b/ Consumed as manioc flour. Rural consumption of flour and manioc root is
large but figures are not available.c/ Corn flour for human consumption. Rural consumption and use as livestock
fodder accounts for the balance.
7.05 Traditional Foodcrops. The State is practically self-sufficientin manioc flour. The expected increase in manioc root production underthe project (58.1 thousand tons at full production) would be readily pro-
cessed by the numerous casas de farinha, which would also receive projectsupport. Manioc is the main root crop grown under the project. The cul-tivation of many other root crops (such as yams, and arrow-root) would expandto meet demand which currently exceeds production. Demand for beans, one ofthe staple foods in the northeast of Brazil, is always good and project outputwould easily be sold. With the expansion of livestock and increased poultryand egg production in the project area, the demand for corn, one of the mainingredients in various feed preparations, would steadily increase.
7.06 Milk. Milk production in the project area has increased rapidlyin the recent past (14%/annum between 1971-77). Processing and pasteurizingfacilities have not expanded as rapidly, however, and may have difficultyin absorbing incremental project production. Government, fully aware ofpossible difficulties and that the potential demand for pasteurized milkin urban areas exceeds current production, has already increased the process-ing capacity of two factories and has initiated in-depth studies of the milkproduction, collection and processing in the eastern part of the State.Assurances were obtained from State Government at negotiations, that, beforeDecember 31, 1979, Government would furnish to the Bank, for comment, copies

- 36 -
of the studies, together with findings and recommendations then available,and upon completion with the final results and recommendations of thestudies. Assurances were also obtained from the State Government that itwould take all measures necessary to ensure that the milk processing capacityin the eastern part of the State would be adequate to absorb the incrementalmilk production in the Project Area.
7.07 Cotton. The project area is a "cotton land" and has well estab-lished cotton processing and marketing mechanisms. However, low prices andfalling productivity, together with new agricultural opportunities havecaused many farmers to reduce cotton production. Any increase motivated bymore favorable price circumstances, would be marketed easily.
7.08 Fruit Crops. Fruit produced under the project are short-cyclecrops such as pineapple and passion fruit and long-cycle crops such as fruittrees and bananas. Although pineapple is the major fruit crop under theproject, many other fruits would also be grown, mainly melon types. Pine-apple production in the project area is expected to increase to about 21million units annually at full development, all of which could be absorbed bythe local urban centers. The State's current pineapple imports from Paraibamay be gradually substituted for by production from the project area.Competition from other areas in the State is not expected since the areassuitable for pineapple production in the vicinity of Recife are limited.Banana production would supply the growing local and metropolitan urbanmarkets. Passion fruit and tree fruits are in constant demand by urbanmarkets and the fruit processing industries. Sweetsop production, a proxyfor such fruits as guava, soursop and papaya, could be absorbed withoutaffecting prices to producers.
7.09 Tomatoes. Production in the project area is either for industrialuses or fresh consumption. Most of the tomatoes consumed fresh are grown inthe eastern municipalities and the area of Limoeiro, while the tomato factoriesin Pesqueira, Belo Jardim and Arcoverde absorb the bulk of industrial tomatoproduction grown mainly in the western region. The projected demand forurban and industrial consumption in Recife and the Agreste would exceed theexpected incremental project area production of 40,000 tons annually at fulldevelopment. No major price effects are expected.
7.10 Vegetables. Production in the State has expanded continuouslyin recent years to supply the expanding markets in Recife and local urbancenters. Farmers plant a variety of vegetables, but an unplanned expansionof some could cause a temporary saturation of markets and affect producerprices. Since the aggregate demand for vegetables has constantly exceededproduction in the State, the assurance of adequate markets depends largely onan effective information system that would inform the farmer about crops indemand and provide the marketing organizations with accurate and timelyharvest forecasts. With improved roads, reduced transport losses and animproved market information system, it is expected that the incrementalproduction of 80,700 tons could be marketed without affecting normal fluc-tuations in producers' prices.
Marketing and Prices
7.11 Most of the agricultural production from the small farmers in theproject area is marketed at the traditional weekly agricultural markets, andthrough truckers/intermediaries. Small farmers have virtually no participation

- 37 -
in the minimum price purchase scheme, and direct Government involvementstarted only recently with the Advance Crop Purchase mechanism. Administeredby CISAGRO, in conjunction with EMATER, the program provided some 1,200farmers with working capital financing for traditional crops during the1978 season. Crops such as beans are also purchased for specific Governmentprograms. Some farmers make use of on-farm storage silos for beans andcorn. Large Government-owned storage facilities in the area, with a totalcapacity of 43,000 tons, are used for grain storage for the cattle/chickenfeed producing industries, as well as for cotton and sugar storage. Smallfarmers use of these facilities is limited to stocks held by variouscooperatives.
7.12 The project would seek to increase the competitiveness of the exist-ing system by improving on and off-farm storage (para 4.07), the marketingcapabilities of agricultural cooperatives (para 4.21), market informationservices (para 4.22) and the road system (para 4.24). With greater competitionamong intermediaries, and improved farmer awareness of market possibilities,it is expected that the farmer would be able to improve his share of the finalretail price of his products. Prices offered for agricultural produce in theproject area are not expected to decrease in real terms. Additional on-farmstorage capabilities should help to reduce fluctuations in corn and beans.Vegetables, whose prices are subject to a higher degree of annual variation,would be sufficiently diversified so that prices at harvest would not go belownormal levels, which for some crops are around 60% of the average annual price.Prices used in evaluating farmers' incomes have been adjusted to take thesefluctuations into account. The share of final retail produce prices whichremains with the producer varies substantially between the traditional cornand bean crops, for which it is around 70%, and fruit and vegetables, forwhich it is around 30%, due to better possibilities for storage and betterspacing of harvests for the former products. On average, wholesale marginsare smallest, around 20%, and fluctuate most widely during the year. Retailerson average retain around 35% of the final price and farmers get 45%.
Non-Farm Enterprise Production and Marketing
7.13 Non-farm enterprises in the project area are engaged in (a) theproduction of simple items such as furniture, tinware, ropes, ceramics, maniocflour, jams and preserves, bread, clothes, and leather goods; (b) commercialactivities on a small scale; and (c) services such as those provided bymechanics, welders and electricians. It is estimated that the impact of theproject would be to increase output from these types of enterprises by 25% to30%. Principal outlets for production are the local markets held in municipal-ities and the large regional weekly markets held in Limoeiro, Vitoria de SantoAntao and Caruaru. The latter is one of the largest regional agricultural/artesan markets in the Northeast. Intermediaries purchase ceramics and artesangoods for which the region is famous, as well as jams, preserves, and clothing,for distribution in the rest of the Northeast of Brazil. The Caruaru market'slocation, on excellent North/ South as well as East/West highways, makes com-munication with Paraiba, Ceara, Alagoas and Bahia, as well as Recife and theSertao, fairly easy. Increased demand for small non-farm enterprise productsis also expected to result from the growth in farmer incomes resulting fromproject investment activities.

- 38 -
VIII. FINANCIAL ANALYSIS
Illustrative Farm Types
8.01 To reflect the variety of ecological conditions, 19 illustrativefarm models have been constructed to represent agricultural development forproject participants. They are based on field surveys and informationgathered by EMATER-PE and the state agricultural planning commission (CEPA-PE)and represent four different farm types 1/ in five different micro-regions ofthe project area. The principal objectives of on-farm development are toincorporate underutilized lands into the farm system and to diversify intonew crops. On the average, the farm system of project participants woulddevelop as shown below:
With Project atFull Development
Before Project (about 10 years)Average Based on Total TotalEstimates for the 15,540 ha percent area, ha Percent area,Expected Participants per farm of farm ha per farm of farm ha
Farm area 7.5 100 117,200 7.5 100 117,200Area cultivated withtraditional crops a/ 3.1 42 48,800 2.7 37 42,800
Area cultivated withnew crops b/ - - - 0.8 11 12,800
Improved pasture 1.9 25 29,200 3.8 50 58,200Underutilized or follow 2.5 33 39,200 0.2 3 3,400
a/ Manioc, beans, maize, cotton, usually intercropped.b/ Vegetables, fruit - cropped areas not comparable with table on page 33,
as most products are intercropped.
The assumed distribution of cropped areas and number of participants per farmmodel is given in Annex 8, Table 1.
On-farm Operations
8.02 It is estimated that the financial rates of return to the 15,540farmers participating in the project would range from 22% to over 50% (Annex9). The estimates are based on analyses of the 19 illustrative farm models(Annex 8). The details of farm development, farm operating results and cashflows of three farm types (farms of 2.4 ha, 6 ha and 18 ha) are provided inAnnex 9. Costs in all analyses are the on-farm investments (e.g. land clear-ing, initial soil preparation, soil conservation works, reforestation, estab-lishment of permanent crops with a crop cycle over two years, pasture improve-ment, purchase of livestock, small on-farm storage facilities, equipment,tools, and small farm buildings) and the expected operating costs (includingestablishment of two-year cycle crops) of the crop and livestock production
1/ Landless, 0 to 2 ha, 5 to 10 ha, and 10 to 50 ha.

- 39 -
activities. Prices for inputs, labor, and production sold were assumed to begenerally at prevailing local market prices, averaged over the past threeyears. It should be emphasized that the models are purely illustrative andallow for losses due to irregularities in the climate. The return in givenyears will vary considerably, depending on rainfall and market trends.
8.03 In general, the financial rates of return are high. This reflects,for the landless and the smallest farmers, the low level of required invest-ments, and, for the farmers owning more than 5 ha, the remunerative effect ofrelatively small plots of fruits and vegetables. The illustrative farm modelsare oversimplifications of development conditions in the project area. Ratesof return have to be high to induce the farmer to risk the innovation beingproposed. In an attempt to reduce the variability of the farmers' income, andimprove his capability to withstand the vagaries of the climate, livestockdevelopment is being encouraged alongside the expansion in vegetable production.Although margins from livestock development are relatively low, this type ofinvestment provides the small farmer with a more stable source of funds,should his crop production be severely affected by the climate (Annex 8).
Non-farm Activities
8.04 Many farmers supplement their income by working as laborers inother farms in the sugarcane harvest or in small-scale industrial or commer-cial activities in the region. Thus, manioc root is processed into flour inmany small family operations; cheese and butter are made from excess milk;and jams and preserves are made from fruits. Also, family members may workin leather or lace as in Pocao, pottery as in Caruaru, or as clothing manu-facturers in Santa Cruz do Capibaribe. The project seeks to support thedevelopment of these off-farm activities with technical assistance andresearch in order to further augment farmer income and the income of theurban poor also engaged in these activities. Rates of return from variousillustrative microenterprises analyzed under this component varied from 40to 86%, with the net income of the micro-enterprises increasing at least 50%over five years (details are given in Annex 10).
Producer Income
8.05 As a result of the project, the estimated farm family income fromagricultural activities could increase from a weighted average of about US$757equivalent to about US$2,130 equivalent at full development, in about 10 years.The estimated income of all prospective participants is currently below therural relative poverty level in Brazil, that is, about US$330 per capita, orUS$1,650 1/ per family. "Before project" and "full development" income levels(including the imputed value of family labor as a cost and the value ofon-farm consumption as a benefit) are summarized below:
1/ Assuming a family composition of 5.0 (in 1970 - 5.3).

- 40 -
Average Before At Full Development
Farm Project (in about 10 years) ExpectedSize Family Family Per ParticipationIn Ha Income Income Capita a! Number _
(US$) (US$) (US$)
Non-owners 0-5 ha 2.3 499 999 200 1,403 9
Farmers 0-5 ha 2.4 436 1,438 287 6,486 42Farmers 5-10 ha 6.0 782 1,796 359 3,281 21
Farmers 10-50 ha 18.0 1,498 3,773 755 4,370 28
Weighted average total 757 2,130 426 15,540 100
a/ Assuming a family composition of 5.0 (in 1970 - 5.3).
Although projections show that farm incomes may be at least doubled under
the project, they would only go above the relative poverty level for those
farmers having 5 ha or more. However, many farm families have additional
sources of income from working on other farms or in the sugar harvest andfrom participating in small rural non-farm enterprises which gives the lowerincome farmers the possibility of bringing their income above the povertyline. Details of estimated farm incomes per illustrative model are given in
Annex 9, Table 6.
IX. ECONOMIC BENEFITS AND JUSTIFICATION
Economic Rate of Return
9.01 The economic rate of return for project activities relating to
agricultural production is estimated at about 22%. Project activities linked
only indirectly to agricultural productivity, such as improved health services,rural water-supply systems, education and training, have an important impact
on the standards of living of rural families in the project area, but their
direct benefits are not readily quantifiable. They have therefore not beenincluded in the cost-benefit calculation. Detailed cost and benefit streams
are given in Annex 11.
9.02 The cost streams used in the rate of return analysis of agricul-
tural activities include all on-farm investments and incremental operatingcosts (based on the phased aggregate of the different types of participants),and all the off-farm investment related to agricultural development: (a)
during the five year investment period, extension, research, seed supply,mechanization/dams, cooperatives, marketing, feeder roads, project admini-
stration and project evaluation; and (b) operating costs for the period after
project implementation, which include a share of continued operating costs
- 41 -
for a sufficiently large extension and research service to maintain projectmomentum, maintenance costs for feeder roads, and gradually diminishing proj-ect administration and evaluation costs, which terminate in year 10 of theproject. Overall, 88% of total project costs, without price contingencies,were included in the cost stream for the analysis of agricultural production.
9.03 The benefit stream for the analysis of agricultural productionincluded the incremental on-farm benefits of the incremental crop and live-stock production by project participants. It should be noted that some ofthe project investments would have benefits not measured by the incrementalproduction of the 15,540 project farm participants. For example rural exten-sion and agricultural research are certain to have demonstration effectson other farmers in the project area, given the dispersion of project targetfarmers located in 63 concentration areas distributed over the project area.Also, road improvements would benefit not only other farmers, but also othereconomic activities in the area, increasing access to public services, improv-ing the penetration of extension services, farmers access to credit andproduction inputs, and the marketing of valuable but perishable crops, whichwould in turn enhance the likelihood of intensified diversification and adop-tion of new techniques. Better roads and communications would also acceleratethe development of small enterprises. As part of the sensitivity analysis,in an attempt to see what the impact of the "demonstration effects" mentionedabove might be, it was assumed that they would increase incremental netagricultural benefits by 2% per annum, starting in year three of the project,and leveling off after seven years. From year 10 onwards, the indirectproduction benefits would be equivalent to roughly 14% of that of the 15,540direct participants (or equivalent to another 2,200 full participants). Theresults of this assumption are shown in paragraph 9.05.
9.04 Of the products produced in the project, Brazil is an exporterof bananas, cotton, maize and beef. Projected farmgate prices for theproject were compared to border prices for these products, adjusted to takeinto account transportation, insurance, handling and quality differences.Prices were adjusted upward, where justified (for bananas cotton and maize)to reflect the projected discounted border prices. Of those inputs used inthe project, urea and potassium chloride were adjusted to reflect the dis-counted projected border price. Estimates for the utilization of the laborforce in the project area, using statistics on population and employmentfrom the 1970 census, place unemployment at about 40%, out of a potentiallabor force of around 400,000 persons. In the rural areas, it is estimatedthat around 30% of a potential rural labor force of 250,000 is unemployed.Labor productivity is extremely low, however, and no one can be said to becompletely unemployed, but rather underemployed, as family and friends willalways guarantee the individual with some type of activity. Labor require-ments under the project, an additional 9,800 worker years by full developmentin 1989, would be more than provided for through the absorption of existingand underemployed personnel from the project area and surrounding region, andthe labor force growth, over the project period. Population growth for theState was 2.4% per annum, over the 1960-1970 period. There is a tradition ofhigh labor mobility in the area, with personnel moving to the Zona da Mataduring the sugar harvest, and back to the Agreste and Sertao for the cultiva-tion of their own plots. The project area is served by the principalhighways connecting Recife with the interior of the state, increasing

- 42 -
the possibility of drawing excess labor from sources in the Sertao, the Zonada Mata and the southern Agreste region. In order to reflect the underemploy-ment in the project area, and the availability of abundant skilled rural labor,the wage rate in the economic analysis was shadow priced at 50% of the averagemarket wage. Foreign exchange components of costs and benefits were adjustedupward by 30% to reflect trade distorting tariffs, subsidies, advance importdeposits, export taxes and quantitative restrictions.
9.05 The estimated economic rate of return was not found to be especiallysensitive to changes in costs, benefits, or lags in farmer participation.Several sensitivity tests were made, the results of which are as follows (inpercentages):
Best Estimate 22.4 Costs up by 20% and benefitsdown by 20%: 17.4
Costs up by 20% 20.1 Benefits delay one year: 20.0
Benefits down by 20%: 19.6 Benefits delay three years: 16.0
Costs up by 10% andbenefits down by 20%: 18.5 Inclusion of demonstration
effect: 24.3
9.06 The economic return from project activities aimed at developingsmall non-farm enterprises was also analyzed. Representative enterprisessuch as carpenters, mechanics, jam and preserve making concerns, and familyowned manioc grinding houses were projected to increase sales some 20 to30% over five years. The impact of the project-sponsored technical assist-ance, coupled with credit available from local sources, would improve thenet cash flow from these enterprises by some 50% over five years after allow-ing for a salary to the owner and the employees in his family. Rates ofreturn for the various micro-enterprises varied from 40 to 86%. Labor wasvalued at its financial rate, as most of the employees were using skillswhich are generally in short supply and were obtained through formal train-ing or apprenticeship. Some 2,340 micro-enterprises would receive technicalassistance, coupled with local credit, during the project period of fiveyears. In addition, some 400 enterprises would benefit from various trainingand technical assistance efforts of a more general nature provided by theproject. The benefits from the latter group are hard to quantify and havenot been included in the analysis. The net benefit stream reflects theincremental benefits obtained by the phased aggregation of the 2,340 smallenterprises. The cost stream included all the costs of technical assistanceand research incurred under the project, with the various foreign exchangecomponents revalued 30% to reflect the shadow rate of foreign exchange, andthe costs of the various investment and incremental working capital itemsused in the development of the enterprises. The rate of return for thiscomponent was estimated at 38%. When the cost and benefit streams are includedwith those of the agricultural production analysis, the rate of return for theproject as a whole increases to 23.6%.

- 43 -
9.07 In addition to direct benefits accruing to 15,540 project participants,
the social infrastructure components would have a definite beneficial impact
on the rural population, although these benefits are difficult to quantify.The education and training activities would play a significant role in helping
to achieve project targets and to improve living standards of the area's popula-
tion. The improved water supply, health and sanitation services would also con-
tribute to welfare. Hopefully, the interaction between the three main groups
of project activities, agricultural, social and industrial, would lead to a
self-sustaining development process.
Employment
9.08 The expected development of agricultural activities by 15,540 parti-
cipating farmers should increase employment opportunities and improve cash
revenues from marketed production. On the basis of the proposed development
pattern, the project should generate on-farm employment opportunities for some
6,700 in year 5 of the project and 9,800 worker years at full development, of
which about 50% would be met by family labor. Ancillary jobs resulting from
the increased agricultural production are estimated at about 600. Based on
experience with the development of small-scale enterprises, the project would
create 3,700 new jobs at an investment cost of around US$1,500 per job, well
below alternative employment creation costs in industry.
Fiscal Impact
9.09 The costs (including contingencies) of the productive support compo-
nents focussing directly on the 15,540 farm families that constitute the target
group for the project (credit, extension, research and seed supply) would
amount to about US$4,530 per family, over the five years of project implementa-
tion. Investments in social and physical infrastructure, broader based agri-
cultural services and project management would benefit mainly the 40,000 farm
families in the project concentration areas, resulting in a cost per beneficiary
family of US$1,070. Project investments in support services for small non-farm
enterprises would cost US$1,310 per beneficiary enterprise. The impact of
project investments is clearly not confined to those beneficiaries mentioned,
but would have a broader influence extending to the one million inhabitants of
the project area.
9.10 The extent to which on-farm costs would be recovered in real terms
is difficult to estimate because of the current inflationary environment in
Brazil and the Government's policy of providing unindexed credit. Assuming
a continuing inflation rate similar to the average over the last three years
(41.8%), real recovery of on-farm investment costs could well be low. On
the other hand, a decline in inflation or a continuation of the gradual reduc-
tion in the size of agricultural credit subsidies (a process in which initial,
though still marginal, steps were recently taken by the Government) wouldresult in higher real cost recovery. Although diversification into more remun-
erative crops would probably enable farmers to bear the burden of positivereal interest rates for credit received, the Government has so far chosen,
particularly in view of the still low income levels of the target beneficiaries
for programs such as POLONORDESTE, to maintain a considerable subsidy element
in the agricultural credit component.

- 44 -
9.11 Following the five-year project disbursement period, project invest-ments would give rise to additional recurrent costs to the Government in theorder of US$3 million per annum, decreasing to US$1.5 million in year 12.These expenses would be incurred principally for rural extension and industrialextension, but would also include continued operating costs of the improvedhealth system and education facilities. The additional recurrent expendituresare expected, however, to be totally offset by additional revenues of roughlyUS$7.2 million generated annually as a result of the circulation tax (ICM),and the rural social security tax (FUNRURAL) which would apply to the valueof incremental production from project participants.
Environmental Impact
9.12 The project should have a beneficial environmental impact. The areaunder crop cultivation by project beneficiaries would increase moderately byabout 6,700 ha. or 13.7% (para 8.01). The cultivated area would, in general,be improved as a result of intensified technical assistance and encouragementto diversify into permanent crops and tree crops (about 4% of the farm areaof project participants), to plant trees on contours and to adopt cultivationsystems which would control soil erosion. The prevention of contaminationof public water supply reservoirs and bigger private reservoirs with schisto-somiasis is adequately performed by SUCAM, and the project supports the expan-sion of controls over other reservoirs, and attempts to reduce the chances ofwater contamination by increasing the number of sanitation facilities.
Project Risks
9.13 The project's success depends on the total commitment of the man-agerial staff of the participating agencies to implement a wide variety ofactivities in a timely fashion and to coordinate and integrate their activi-ties at local, regional and central level. The risk of not achieving adequateinteragency cooperation should, however, be lessened by the plans to involvethe POLONORDESTE Management Counsel more actively in project implementation,to strengthen the PMU to nominate a full time project liaison officer in eachof the participating agencies and to require detailed agreements establishingimplementation responsibilities for each participating agency. Other riskslie in the limited experience of the participating agencies in carrying outlarge projects oriented toward low-income groups in rural areas, and in theabsorption capacity at the local level of such concentrated assistance efforts.The preparation of detailed annual work plans with the participating agencies,the dissemination of information, and the provision of additional consultingservices and continuous project monitoring and evaluation should help toresolve problems that might arise in this respect. In addition there is therisk of drought in the Northeast of Brazil. An "average" risk factor due toinadequate rainfall during the main cropping season, based on data for previousyears, has been allowed for, and crop and livestock yields reduced 13% (para.7.03). However, it is in the nature of work in this area that an extensivedrought can occur from time to time. Due to this and, for some crops,unforseen technical problems, there is a risk that the expected yields wouldnot be attained. The wide range of possible crop diversification and offarmtypes, the project experimentation and the intensified extension servicesshould help to alleviate the risks and to resolve the problems of these
- 45 -
types. Overall, the potential of the productive components to (a) increasethe value of agricultural production by US$35.2 million annually and thesmall-scale industry output by US$16.6 million annually; (b) provide about14,100 new jobs; and (c) improve the living standards of at least 40,000lower income rural families (200,000 people), combined with the social andphysical infrastructure components, make the project risks acceptable.
X. SUMMARY OF AGREEMENTS REACHED AND RECOMMENDATIONS
10.01 During negotiations, assurances were obtained from the FederalGovernment that:
(a) it would maintain existing agreements with participatingbanks, BB and BNB, to ensure their continued collaborationin the execution of the credit component; that additionalparticipating banks could only be included after approvalby the Bank; project credit would be extended to the small-scale farmers on POLONORDESTE terms and conditions; it wouldadvise the Bank promptly of changes in such POLONORDESTElending terms and conditions; and that project reimbursedshort-term credit funds would be made available for reappli-cation under the project credit component (para. 4.10);
(b) consultants would be employed by December 31, 1979, underterms and conditions satisfactory to the Bank, to assistEMATER-PE in project implementation (para 4.13); to assistthe PMU in carrying out data collection, studies anddeveloping manuals for water conservation (para 4.19);to assist the DER-PE in the preparation of engineeringdesigns for roads (para 4.25); to assist the PMU in themanagement of the project (para 4.38); and to assist thePMU with land purchase credit and land titling studies(para 4.39);
(c) consultants hired to assist SES and SEC in improving itsadministrative structure, would be employed under termsand conditions acceptable to the Bank (para 4.32 and 4.35);
(d) it would provide adequate funding to assure timely andeffective execution of the project and adequate operationand maintenance of the facilities and services developedunder the project (para 5.03);
(e) it would provide the Bank for review with the constructionstandards, bidding and contract documents before the firstround of bidding on construction works for feeder roadimprovement (para 5.05);

- 46 -
(f) by November 30 of each year, the Bank would be provided,for review and comment, with the project work program forthe following year, that the review of the program by theregional POLONORDESTE group would be timely, and thatthe Bank would be advised of the approved work program byJanuary 31 of each year (para 6.03);
(g) it would provide the Bank, for review and comment, with:(a) a quarterly progress report, including the results ofthe monitoring exercise (para 6.06); (b) a Project CompletionReport, within six months after the final disbursement(para 6.06); and (c) a Post-Project Evaluation Report,within eight months after the final disbursement (para 6.07);and
(h) it would provide the Bank with the audited statements ofthe various participating agencies and their statements ofexpenditure, and the audited statements of the participat-ing banks and their lending under the project, within sixmonths of the end of each POLONORDESTE program fiscal year(para 6.08).
10.02 During negotiations, assurances were obtained from the StateGovernment of Pernambuco that:
(a) it would take all measures necessary on its part to ensure(i) that sub-loans made under the Project would be made tosmall-scale farmers, including sharecroppers and tenants,having less than 50 hectares and (ii) that investment -credit for livestock purchase would only be provided as partof an integrated crop and livestock development plan (para.4.10);
(b) it would maintain a fund in the Secretariat of Agriculture,adequate to finance the acquisition at harvest time ofcertified seeds produced by farmers under contract to DPV,and that it would cause DPV to serve the needs of theproject beneficiaries with priority (para 4.17);
(c) it would cause CISAGRO to improve the operation of and themaintenance sevices provided by the CARUARU workshop byDecember 31, 1980; and to maintain nine tractors in opera-tion in the project area, in addition to the tractors tobe acquired under the project, during the project period(para 4.19);
(d) it would follow agreed upon guidelines in selecting coopera-tives for project assistance, and that it would obtainagreement with those cooperatives receiving project assist-ance on administrative and auditing requirements, and onthe maintenance of adequate staffing (para 4.21);

- 47 -
(e) studies would be undertaken under terms and conditionsacceptable to the Bank, to identify marketing problems ofcertain agricultural commodities, and to improve municipalmarkets (para 4.23); to investigate production problems ofsmall non-farm enterprises (para 4.29); to prepare Aesignsand operating manuals for village water supply systems(para 4.31); to identify manpower training requirementsand educational needs (para 4.34); to improve the adminis-trative structure of the health services in the projectarea (para 4.35) and to establish the baseline situationfor project evaluation (para 6.07);
(f) project feeder roads would be selected to support thosepriority areas where agricultural activities are focussed;any standards higher than minimum would be justified on thebasis of the incremental economic benefits expected; roads,standards, schedules and methods of execution would bereviewed and confirmed annually by the Bank, on the basisof field reviews applying agreed upon criteria (para. 4.25);
(g) it would cause DER-PE to adequately maintain and renew main-tenance equipment for project area roads, and that chargesfor use of DER-PE maintenance equipment would cover opera-tion maintenance and depreciation expenses (para 4.26);
(h) assistance from UNO would be provided only to small non-farm enterprises with less than 10 employees, fixed assetsof less than 200 MVR, annual sales under 1,000 MVR, andmonthly owner net income of under 8 MVR; and that the StateGovernment would make adequate arrangements with the banksto ensure the availability of credit for the developmentof small non-farm enterprises assisted under the project(para 4.28);
(i) it would cause COMPESA to submit for Bank approval beforeconstruction started, designs for each rural water supplysystem whose cost exceeded US$120 per beneficiary house-hold (para 4.30);
(j) construction of schools and the rural education centerwould be at sites selected according to agreed criteria,using detailed site plans satisfactory to the Bank, to bereviewed and confirmed annually on the basis of fieldreviews (para 4.33);
(k) it would cause SEC and the municipalities to give priorityto the placement of project-trained school supervisors andtechnical personnel, and prior to construction of projectschools, it would enter into agreements with the respectivemunicipalities, assuring priority in the placement of projectupgraded teachers, appropriate salaries for teachers, andfunding for the continued operation and maintenance ofeducational facilities and services developed under theproject, with the State Government providing support infinancing recurrent expenditures generated by the project,w'havrn npnAcc:rv (nnrn 4.34):

- 48 -
(1) the Bank would be provided, for comment and review, withthe results of the small non-farm enterprise studies(para 4.29), the evaluation reports (para 6.07), and thevarious other studies, when they become available, but notlater than (i) December 31, 1979, for the definitive projectevaluation program (para 6.07); (ii) April 1, 1980, for thereport on manpower training requirements and educational needs(para 4.34); (iii) June 30, 1980, for the recommendations fromthe land purchase credit and land titling studies (para 4.39);(iv) October 30, 1980 for the proposals on improvementsin the administrative structure for health services in theproject area (para 4.36); (v) December 31, 1980 for thestudies and manuals on water conservation (para 4.19); theresults and recommendations for the commodity and municipalmarkets studies (para 4.23); and the designs and operatingmanuals for village water supply systems, and the detailsof the training program for system operators (para 4.31);
(m) it would arrange for timely acquisition and necessaryfinancing of any additional land or rights of way neces-sary for project works (para 5.03);
(n) it would adequately maintain and strengthen the PMU and supportthe other state agencies participating in the project (para 6.01)that it would appoint qualified personnel to the PMU, and thatthe Bank would be consulted should the incumbant project manageror regional coordinator have to be replaced (para 6.02);
(o) it would enter into and maintain all such special agreementsas are necessary to assure full and active cooperation ofthe various executing agencies; and that it would causeagreements to be entered into between the various executingagencies and the corresponding municipalities or communityassociations to ensure adequate operation and maintenanceof project facilities and services, prior to the constructionof civil works for feeder roads where the agreement wouldinclude the funding of an agreed maintenance program (para 4.26),schools, health centers, water supply systems, communal demon-stration dams, and municipal markets (para 6.04); and
(p) it would (i) provide the Bank, for comment, by December 31, 1979,with copies of the studies currently in progress ott milk produc-tion, collection and processing in the eastern part of the State,together with any findings and recommendations then available,and upon completion, with the final findings and recommendationsof such studies, and (ii) take all measures necessary on its partto ensure that the milk processing capacity in the eastern partof the State would be adequate to absorb the increase of milkproduction in the Project Area.

- 49 -
10.03 Disbursement of funds for the following project components wouldbe contingent upon:
(a) For the construction of communal demonstration dams, that con-struction pl2ns which include engineering designs, land specifications andan evaluation of water quality and availability had been approved by theBank, the farmer associations had been established, the manuals on waterconservation had been completed, and the extension agents trained in waterconservation (para 4.19); (b) for the construction of marketing facilities,that they were based on plans satisfactory to the Bank, and that an agreementhad been signed between the State and the municipalities to ensure propermaintenance (para 4.22); for the feeder-roads component, that final agreementhad been reached on the full-time staff needed in DER-PE for componentimplementation (para 4.25); (c) for the construction of village water supplysystems, that the designs had been approved by the Bank, and that theresponsibility for the operation and maintenance of the system had beenassumed by COMPESA or a community association (para 4.31); (d) for theconstruction of schools, and health centers, that satisfactory evidence havebeen provided to the Bank of acquisition of the respective sites (paras 4.33and 4.36); (e) that the proposals for equipment and staffing for the estab-lishment of the institutional structure for providing land purchase creditand/or land titling services were acceptable to the Bank (para 4.39); and(f) for each and every component except the credit and management components(paras 4.08 and 4.37), that the Bank have received satisfactory signedagreements between the POLONORDESTE Management Council and the correspondingexecuting Agency, delineating implementation responsibilities (para 6.04).
10.04 With the assurances and conditions, indicated above, the proposedproject would be suitable for a Bank loan of US$40 million equivalent with aterm of 15 years, including a three-year grace period.

- 50 -
NORTHEAST BRAZIL ANNEX 1
PERNAMBUCO RURAL DEVELOPMENT PROJECT
AGRESTE SETENTRIONAL
Improved Road Characteristics
Class A Class B Class C
Approximate Kilometers: 180 km 290 km 480 km
Approximate TrafficLevels: 24 v.p.d. 18 v.p.d. 12 v.p.d.
Approximate AnnualTonnage: 18,000 tons/yr. 12,000 tons/yr. 8,000 tons/yr.
Drainage:
Stream crossings:
- small build all build all build allculverts culverts culverts
- larger bridge or improved orpaved ford paved ford paved ford
Longitudinal:
- raise roadbed ( eliminate sunken road platform ) only at culverts( except in short-cut sections ) and where road
floods
- ditches ( construct all longitudinal ditches required to keep)( platform free of water during rainstorms )
Geometric:
Platform:
- width 6.Om - min 4.5m - min. existing or3.5m - min.
- surfacing 5.Om full depth 3.5m full depth at spot locationstap~ering on both tapering on bothsides sides
Maximum grade 12% max. 12% max. desirable existingdesirable 15% absolute max.
15% absolute max.
Minimum curve radius 50m min. 50m min. desirable existingdesirable 30m absolute min.
30m absolute min.

NORTHEAST BRAZIL
PERNAMBUCO RURAL DEVELOPMENT PROJECT - AGRESTE SETENTRIONAL
Annual Phasing of Project Costs(US$'000)
Percentage PernenLof Total Foreign
Year 1" Year 2 Year 3 Year 4 Year 5 Total Baseline Costs Exchange
Credit
On-farm investment 1,993.6 3,721.9 5,333.4 6,843.8 8,425.2 26,317.9 29.3 12
Incremental on-farm working capital 1,694.9 2,771.8 3,725.4 4,692.1 5,721.7 18,605.9 20.7 14
Production Support
Extension 1,259.2 1,627.8 1,722.9 1,924.1 2,171.0 8,705.0 9.7 8
Agricultural research 311.1 254.3 260.1 254.3 260.1 1,339.9 1.5 8
Improved seed supply 243.0 43.5 43.5 43.5 43.5 417.0 0.5 21
Mechanization/multi-purpose dams 297.0 302.0 51.0 30.0 30.0 710.0 0.8 29
Cooperative society assistance 133.6 199.3 264.9 265.0 131.4 994.2 1.1 9
Marketing 376.9 380.4 365.8 413.7 220.3 1,757.1 2.0 8
Feeder roads 3,261.0 4,754.0 4,042.0 2,610.0 414.0 15,081.0 16.8 34
Small Non-Farm Enterprises 234.7 327.4 527.8 717.5 839.1 2,646.5 3.0 5
Social InfrastructureVillage Water Supply 235.0 812.5 829.3 666.2 427.0 2,970.0 3.3 30
Education and training 1,388.2 2,111.7 438.4 365.8 232.1 4,536.2 5.1 11
Health and sanitation 534.7 529.2 237.4 227.8 160.6 1,689.7 1.9 17
Project AdministrationAdministration and Monitoring 650.5 610.5 640.0 598.5 598.5 3,098.0 3.4 4
Evaluation 193.8 193.9 107.4 107.4 212.4 814.9 0.9 1
Total Baseline Costs- 12,807.2 18,640.2 18,589.3 19,759.7 19,886.9 89,683.3 100.0 16
Physical Contingencies-3 919.0 1,323.3 993.7 754.4 354.1 4.344.5 4.8 16
Price Contingencies 1,169.0 2,880.3 4,360.0 6,273.1 7,981.7 22,664.1 24.1- 16
Total Project Costs: 14.8_92S^ 22a=k3J ; L9gQ a_28,7_ L 1=30Q.1 16
1/ Year 1 of the project corresponds to the POLONORDESTE fiscal year of 1 April 1979 - 31 March 1910,and so on for subsequent years.
2/ In prices at time of appraisal (October, 1978), converted to US$ at Cr$19.15 = US$1.0.
3/ Physical contingencies based on level of preparation and availability of detailed plans for each aspect of each component, were applied
as follows: extension: 2% agricultural research 3'!.; improved seed supply 8 Z; water conservation 11%;
cooperative society assistance 6 %; marketing 10%; feeder roads 15%; small non-farm enterprises 5%; village water supply 18%,
education 11%.; health 8 %; administration 5 %; and evaluation 8%.
4/ Price contingencies were calculated based on the US$ baseline cost plus physical contingencies as follows, in annual percentage rates:
(i) civil works 15% in 1978 and 7% thereafter; (ii) equipment 14% ini 1978; and 6% thereafter; Ciiil otbhx itema. including
materials, salaries and credit: 7% from 1978 onwards. X
5/ Percentage calculated on baseline costs plus physical contingencies.
February 1979

- 52 -ANNEX 3
NORTHEAST BRAZIL Page 1 of 4
PERNAMBUCO RURAL DEVELOPMENT PROJECT - AGRESTE SETENTRIONAL
Estimated Schedule of Bank Disbursements
(US$ million)
Bank Quarter Disbursed CumulativeFiscal Year Ending During Quarter Amount Disbursed Balance of Loan
1980 Sept.30 0.0 0.0 40.0Dec. 31 0.0 0.0 40.0March 31 1.0 1.0 39.0June 30 0.8 1.8 38.2
1981 Sept.30 1.0 2.8 37.2Dec.31 1.3 4.1 35.9March 31 1.6 5.7 34.3June 30 1.8 7.5 32.5
1982 Sept.30 2.2 9.7 30.3Dec.31 2.5 12.2 27.8March 31 2.8 15.0 25.0June 30 2.3 17.3 22.7
1983 Sept.30 2.0 19.3 20.7Dec.31 2.5 21.8 18.2March 31. 2.8 24.6 15.4June 30 2.3 26.9 13.1
1984 Sept.30 3.0 29.9 10.1Dec. 31 2.8 32.7 7.3March 31 2.7 35.4 4.6June 30 2.5 37.9 2.1
1985 Sept.30 1.1 39.0 .1.0Dec.31 1.0 40.0 0.0

- 53 -
ANNEX 3Page 2 of 4
NORTHEAST BRAZIL
PERNAMBUCO RURAL DEVELOPMENT PROJECT - AGRESTE SETENTRIONAL
Disbursements Against Statement of Expenditures (SOE)
Budgeting and Funding
1. Each executing agency would conclude a contract (convenio) with the
Conselho Director of POLONORDESTE, stipulating its obligations under the con-tract, including objectives, physical targets and available funds during eachyear of the project period (see para 6.04 of the main text). According toPOLONORDESTE guidelines, each executing agency prepares a "plano operativo"which regulates the 'draw down' of funds (see para 6.03 of the main text).The 'draw down' is made per trimester, and based on progress made duringprevious trimesters (see also para 10.04 of the main text). The participatingbanks are rediscounted by the Central Bank; EMATER-PE and IPA-PE are funded byEMBRATER and EMBRAPA, respectively; and the other executing agencies are funded
by the Technical Unit of POLONORDESTE, which may hold back funds if progress isnot considered satisfactory.
Expenses to be Covered by SOEs
2. Disbursements against standard documentation cover the procurement ofcivil works (including A and B-type feeder roads and C-roads, which are con-structed under contracts; schools; education centers; health centers; storagefacilities; and market places), vehicles, tractors, equipment, and consult-ancies and technical assistance. These disbursements would cover about 25% ofthe project expenses.
3. For those works and expenses where full documentation is impractical,
the procedure of Statement of Expenses (SOE) would be followed. The SOEswould be applicable for:
(a) works executed by force account (water supply works byCOMPESA; and part of C-roads by DER-PE and small dams byCISAGRO after Bank approval);
(b) agricultural credit, extended under POLONORDESTE con-ditions by BB and BNB;
(c) project-financed operating costs of the PMU, the evalua-tion team of the UFPe, EMATER-PE, IPA-PE, DPV,assistance to Coops, extension service by UNO in theproject area, salary complements of full-time SEC-staffin charge of the education component;
(d) costs for studies in PMU, IPA-PE, EMATER-PE (as far asrelated to market studies) SEC, and SES (as far as relatedto studies to improve the administrative structure);
(e) short-term consultancy .services in DER-PE; and

- 54 -
ANNEX 3Page 3 of 4
(f) technical assistance and training expenditures in EMATER-PE for the cooperative component and marketing component;
the technical assistance given by DER-PE to the municipalities;
the training by COMPESA of operating personnel of smallerwater supply systems; and the training expenditures in SEC
for project-financed staff training.
SOE-Procedure
4. The SOEs would be summarized on Application Form 1C for the credit
component and on Form 1B for all other components. An annex showing monthly
expenditures by each participating agency (balancete) would be attached to the
Form 1B. These annexes would contain a basic breakdown of the totals on Form
1B as follows:
(a) personnel costs (salaries, wages and such);
(b) materials (material de consumo) (office supplies,gasoline, oil and such);
(c) general services (third-party payments coveringutilities, short-term contracts and such), and
(d) various operating expenses.
The procurement of permanent fixtures, equipment and installations would be
reimbursed on the basis of the normal documentation.
5. The basic headings would be broken down in the same annex as to the
costs per location of work performed or expenses incurred, cost per job per-
formed (such as a specific road section) groups or types of beneficiaries.
Adequate cross-reference should be given to the underlying documentation.
Additional data required to facilitate proper control may be worked out during
implementation.
6. General disbursement conditions are given in paragraph 10.04 of the
main text.
Internal Control by the Project
7. The executing agencies have established accounting systems, audited
by the auditors of federal organizations (such as Central Bank, ENBRATER, and
EMBRAPA), the auditors of a central organization (such as CEBRAE for UNO), or
the General Auditors of the State of Pernambuco (SES, SEC, DPV, CISAGRO, and
COMPESA). The accounting systems are capable of maintaining separate project
accounts, and a full-time project coordinator within each executing agent will
assist in keeping the accounts up to date and maintaining separate accounts
for each major job.

- 55 -
ANNEX 3Page 4 of 4
8. The SOEs will be prepared monthly by the executing agencies andremitted to the PMU through the project coordinators. After counter-signingby the project manager and general coordinator of the Unidade Tecnica ofPOLONORDESTE in Pernambuco, the SOEs will be sent to the Central Bank inBrasilia. The Banks will send the application forms 1C for the credit com-ponent directly to the Central Bank with copy to the PMU. Copies of allapplications are also sent to SUDENE. The basic documents of the SOEs willbe retained by the executing agencies.
9. During this process, the statements are controlled at the variouslevels by the responsible coordinators, and actual expenses are compared withthe estimated expenses specified in the annual project budget (plano operativo)and project estimates specified in the "convenios." Physical performances willbe compared with project targets specified in the convenios. In case of doubt,the Technical Unit of POLONORDESTE can rely on the services of "Tribunal deContas" of the State of Pernambuco, who would execute an immediate investi-gation. SUDENEs auditing department also performs an internal audit in thePOLONORDESTE projects, and the Tribunal de Contas controls the proper procure-ment procedures in the state institutions.
10. The project coordinator in each executing agency would keep, inaddition to the basic documents, a file containing copies of the most importantinternal control measures and instructions, such as:
(a) administrative and accounting procedures of the agency;
(b) indemnization rules, such as tariffs, per diems, andallowances applicable to personnel working for theproject;
(c) general control instructions, such as mileages allowedand type of log books to be kept;
(d) contracts used as a basis for calculation of expenses,such as rental contracts, public services (water andelectricity) and tariffs; and
(e) special requirements under the project.
He will also keep separate cost accounts of the component executed by hisagencies to be sent to the PMU within two months' after each fiscal year. ThePMU will retain a complete set of all project accounts.
Auditing
11. The project accounts will be audited by the Inspetoria Geral deFinancas (IGF) of the Ministry of Finance in Brasilia within six months afterthe end of each fiscal year. The IGF would be asked to include in its audit aspecial statement about proper execution of the SOE procedures by theexecuting agencies and the PMU.

- 56 -
ANNEX 4
NORTHEAST BRAZIL
PEINAMBUCO RURAL DEVELOPMENT PROJECT - AGRESTE SETENTRIONAL
List of Executing Agencies
COMPONENT EXECUTING AGENCY CHIEF, COLLABORATING AGENCIES
Agricultural Development
Extension Services EMATER-PE SENAR, IPA-PE
Agricultural Research IPA-PE EMATER-PE
Seed and Plant Production EMATER-PE, IPA-PE,
and Distribution DPV Agricultural Cooperatives
Mechanization and Input Supply CISAGRO EMATER-PE, COCANEAgricultural Cooperatives
Production Support
On-farm Development Credit BB, BNB EMATER-PE
Land-tenure studies P.M.U. CEPA-PE, INCRA, EMATER-PE
Small Non-Farm BB, BNB, BANDEPE- UNOEnterprise development credit
Storage-Marketing EMATER-PE/T.U. COCANE, FECOMIPE, COBAL, SIMA
Storage-Marketing EMATER-PE/T.U. GACEP, Municipalities
Assistance to Cooperative Societies EMATER-PE/T.U. COCANE, FECOMIPE, ASSOCENE
Water Conservation CISAGRO EMATER-PE
Technical Assistance Small Non-Farm Enterprises UNO SENAI, SENAC, ITEP
Physical Infrastructure
Feeder roads DER-PE EMATER-PE, Municipalities
Water Supply COMPESA PIASS, EMATER-PE,Municipalities
Social Infrastructure
SENAI, SENAC, PIPMO
cducation SEC Municipalities
SES/FUSAM FSESP, PIASS, INAMPS
Health SES/FUSAM Municipalities
Sanitation SES/FUSAM PIASS, COMPESA, Municipalities
Organizational Support
Secretary of Planning,Project Administration and Monitoring T.U. Executing Agencies
Project Evaluation U.F.P. T.U. Secretary of Planning
Note:
Note: A glossary of abbreviations and acronyms is provided inside thethe front cover of this report.
1/ This credit is not financed under the project
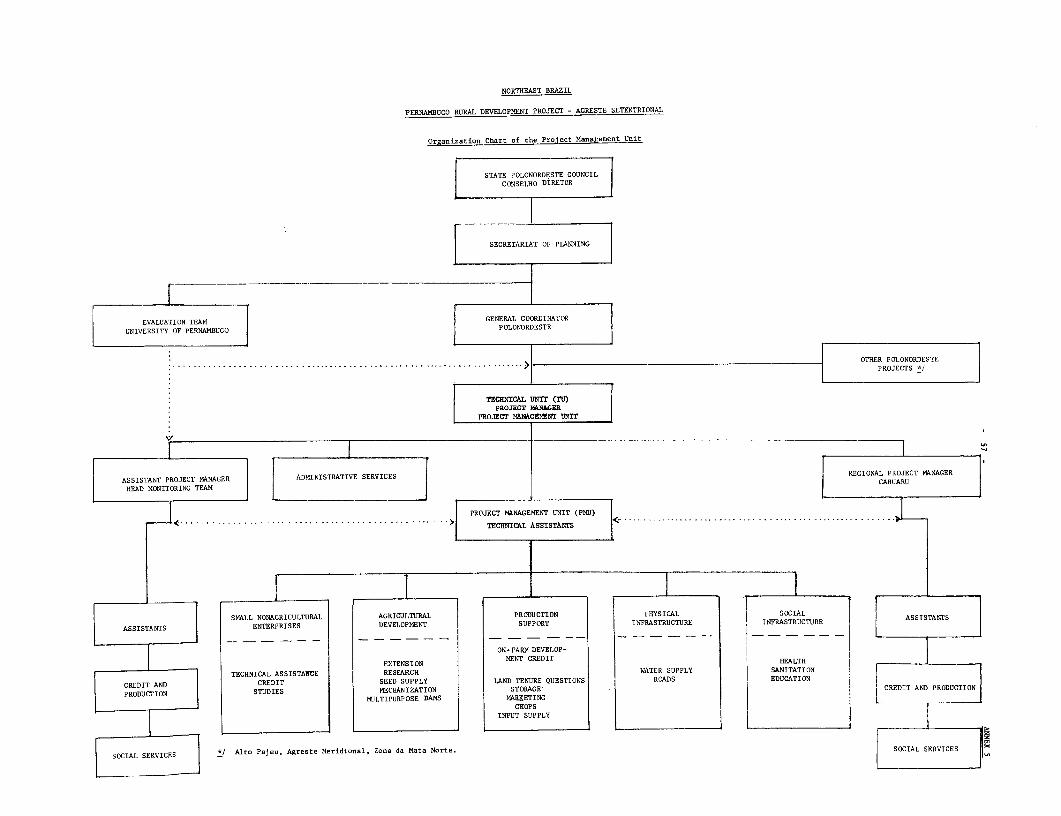
NORTHEAST BRAZIL
PERNAMBUCO RURAL DEVELOPMENT PROJECT - AGRESTE SETENTRIONAL
Organization Chart of the Prolect Management Unit
STATE POLONORDESTE COUNCIL
CONSELHO DIRETOR
SECRETARIAT OF PIANNING
l ~~ ______ _ ____.______
EVALUATION TEAM GENERAL COORDINATOR
UNIVERSITY OF PERNAMSBUCO POLONORDESTE
*........................................ .............................. > OTHER POLONORDESTE
PROJECTS *
TECHNICAL UNIT (TU)PRO.IECT RANAGER
PROJ13CT MANAGE1MINT IINI
ASSISTANT PROJECT MANAGER ADMINISTRATIVE SERVICES REGIONAL PROJECTMAGE.
HEAD MONITORING TEAM . ]_ _ [ CARUARU
PROJECT MANAGEMENT UNIT (PMU)
.> TECRNTCAl ASSISTANTS r_.
SMALL NONAGRICULTURAL AGRICULTURAL PRODUCTION PHYSICAL SOCIAL
ASSISTANTS ENTERPRISES DEVELOPMENT SUPPORT INFRASTRUCTURE INFRASTRUCTURE ASSISTANTS
l l i ~~~~~~~~~~~~~~~~~~~ON- FARM DEVELOP-
EXTENSION MENT CREDIT hEALTH
TECHNICAL ASSISTANCE RESEARCH WATER SUPPLY SANITATION
I CREDIT AND l l CREDIT SEED SUPPLY LAND TENURE QUESTIONS ROADS EDUCATION
PRODUCTION STUDIES MECRANIZATION STORAGE CREDIT AND
R|CCL SERVICES Alto PaMeU,AgresteMerdiona, naaLTIPURPOSE DAMS NeMArteE.TSNG SERVICER
l l l ~~~~~~~~~~~ ~ ~ ~~~~~INPUT SUPPLY |
| SOCIA SERVICS | */Alt. P.J.., Agreste Meridional, Zona d. Mata Norte. mOILSRIE

_ 58 _
ANNEX 6Page 1 of 3
NORTHEAST BRAZILPERNAYiBUCO RURAL DEVELOPMENT PROJECT - AGRESTE SETENTRIONAL
Implementation Schedule -
COMPONENT / ACTIVITY PROJECT YEAR
I II III IV V
CREDIT
On-Farm Credit- Provision of investment and
seasonal credit __ _ ___
PRODUCTION SUPPORT
Extension Activities- Office installation/equipment- Provision of extension services- Training of extension agents- Training of farmers . _
- Assistance to IPA-PE (research)- Assistance to DPV (seed production)- Assistance to DER (feeder-roads)- Assistance to COMPESA (water supply)- Coordination cooperative/marketing
activities- Consultant services
Agricultu-.al Research- Establish research team/equipment- Experimentation
- Divulgation of results
Seed and Plant Production- Upgrading production centers- Upgrading planning mechanism- Upgrading distribution mechanism
Water Conservation:
Mechanization/Input Supply- Improvement Caruaru Workshop- Improvement Input Supply l
Multipurpose Dams- Studies, consultant services and
preparation manuals- Training extensionists l- Design demonstration dams- Establishment farmers association l _
- Construction Dams

- 59ANNEX 6Page 2 of 3
COMPONENT/ACTIVITY PRO..ECT YEAR
I II III IV V
Assistance to Conperative Societies- Study restructuring cooperatives- Assistance to implement
restructuring- Administrative Assistance |- Training Cooperative Personnel- Education Cooperative membership l
Storage Marketing- Storage construction at
cooperatives . |- Improvement Information System . |- Improvement Product Transport _ |- Training Personnel . l
- Special Studies .- Market Construction
Feeder Roads- Acquisition Equipment- Training Municipal Personnel- Consultant Services _
- Technical Assistance DER-PE toMunicipalities
- Construction Roads Class A- Construction Roads Class B- Construction Roads Class C
Assistance to Small-ScaleScale Enterprises
- Technical Assistance toSmall Enterprises
- Upgrading Caruaru Office- Establishment New Extension
Offices- Training Extensionists- Special Local Surveys/Studies .- Participation in Research of
Intermediate Technology
SOCIAL INFRASTRUCTURE
Water Supply- Engineering and Design- Establishment Community
Associations- Construction Water Supply Systems .- Equipment (local .Equipment (regional)
- Training Local personnel __i

-60- ANNEX 6Page 3 of 3
COMPONENT/ACTIVITY PROJECT YEAR
I-II III IV v
SOCIAL INFRASTRUCTURE (Contd.)
Education- Construction basic schools- Construction intermediate schools- Construction rural education center- Training instructors education center
- Training technicians education center l
- Training administrative personnel- Training teachers/supervisors .- Training rural promotors- Technical assistance for SEC- Studies of SEC/IICA _- Study of demand of human resources- No-formal training
Health- Construction regional health center l- Construction local health centers l- Upgrading local health centers l- Training personnel- Construction storage facilities- Equipment purchase- Technical Assistance Institutional
Improvement l
Sanitation- Installation of Sanitary Facilities
PROJECT MANAGEMENT
Project Administration- Organization of Management Unit- Equipment Offices- Consultant Services- Supervision of Implementation
Monitoring- Organization Mechanism- Monitoring of Implementation
Land Tenure Studies- Consultant Services- Analysis Results of Studies- Implementation of Acceptable
Recommendations
Evaluation- R>qol1fne stuities 1/
- Annual Evaluation Assistance- Post Evaluation
1/ From UFPe to PMU

- 61 -ANNEX 7Page 1 of 3
NORTHEAST BRAZIL
PERNAMBUCO RURAL DEVELOPMENT PROJECT - AGRESTE SETENTRIO1 AL
Monitoring of Project Impact
Principal Objectives Key Indicator Responsible Institute
GENERAL
1. Increase agricultural production a) Production increase per crop and product T.U./EMATERb) Increase of area cultivated per crop T.U./EMATER
2. Increase agricultural productivity a) Productivity per ha, specified per crop T.U./EMATER(see also research, extension) and municipality
b) Productivity per labor-day T.U./EAMTER
3. Raise the income level of small-farmers a) Average income of small farmers, per type T.U./EMATERof farm, and farmer and municipality Municipalities
b) Percent of income derived from direct farmactivities, from off-farm agricultural, T.U./EMATERand off-farm non-agricultural activities, UNO/Municipalitiesper crop and municipality
4. Raise living standards of small farmers a) Family composition T.U./UF.P/b) Consumption budget composition participatingc) Rate of houses owned agenciesd) Rate of houses served with electricitye) Rate of houses served with waterf) Rooms per houseg) Radios/televisions per househ) Litteracy ratei) Children/family in secondary education
ON-FARM DEVELOPMENT CREDIT
1. Expand sma.l-farmers use of institu- a) Ratio between use of informal and EMATER/Banks/TU/UFPtionalized credit, to facilitate institutionalized creditadoption of new techniques, crop- b) Number of small farmers covered in relationdiversification and crop expansion to total number of small farmers
c) Amount lent to small farmers as percent oftotal agricultural credit, specified percrop and activity; municipality and typeof loan (investment or seasonal credit)
2. To improve the accessability to credit a) Average time required to grant a loan/agency Banks/EMATERfor small farmers b) Cost of loan Der agency
c) Loans refused as ratio of loan applications Banks
3. To increase the effectiveness of a) Debt service performance as percent of Banksagricultural credit, and to involve arrears for investment and seasonal creditthe small farmer into the credit-system b) Rate of compliance with original credit EMATER
farm-plansc) Rate of farms producing according to estimate, EMATER
or sufficiently to service their debts outof sale of farm produce
d) Rate of credit channelled through Banks/Cooperativesfarmers cooperatives
LAND TENURE
1. Increase small scale and non-land a) Distribution of land ownership per Technical Unit (TU)owning farmers' production potential municipalityby improving security of land-tenure b) Proportion of farms with inadequate title TUadd facilities to establish a productive per municipaltyunit c) Trends of land market, per municipality T.U./Municipalities
AGRICULTURAL EXTENSION
1. Orientation of extension service to Ratio of small farmers attended to total EMATER-PEsmall-scale farmers farmers attended
2. Reaching the farmer at the farm level Ratio of time spent with farm visits to total EMATER-PEavailable time of agricultural and socialextensionists (per municipality)
3. Orientation of the extension service Distribution of extensionists time to various EMATER-PEto farming systems aspects, such as administration, credit,
agronomic question, farm problems, socialproblems
4. Increase efficiency of the extension a) Coverage of farmers per extensionist, per EMATER-PEservice category; credit, new technology and
managementb) Number of contact farmers per extensionist EMATER-PEc) Number of farmers per contact farmer EMATER-PE
(or leader)
5. Improve delivery of know-how a) Number of field farmer-days, per crop EMATER-PEand per activity
b) Average attendance of field-days EMATER-PEc) Adoption rate of new technological packages EMATER-PE
(see also research)

- 62 - ANNEX 7
Page 2 of 3
Monitoring of Project Impact
Principal Objectives Key Indicator Responsible Institute
AGRICULTURAL ADAPTIVE RESEARCH
1. Improve productivity of crops, pasture a) Rate of adoption of more productive varieties IDA-PE/EMATER-PEand livestock in project area b) Rate of adoption of improved cultivation
techniques
2. Introduce, test and adopt varieties and a) Number of experiments per locality IPA-PEcultivation techniques more suitable b) Percentage of successful experimentsto local circumstances
3. Involve producer in research efforts a) Distribution of experiments per farm type IPA-PEand divulge research results to the b) Number of visitors to observation sites IPA-PEfarm level
MARKETING
1. Improve small farmers share of consumers Ratio of farmgate price to consumers sale price t.U./CEASA/Cooperatives/retail sales price per type of produce and municipality EMATER
2. To provide on-farm and off-farm storage a) Average on-farm storage capacity per crop EMATER/Banks/TUfacilities to small farmers for small farmers
b) Off-farm storage capacity accessible forsmall farmers per location, and per produce
c) Occupancy rate by small farmers products(per crop)
3. To tmprove market information a) Perceat of farmers reached effectively EMATER/Cooperativesb) Rate Df excess of production in relation T.U./CEASA/COBAL/EMATER
to demand at harvest time (per crop) Cooperatives
SEED SUPPLY AND PLANT PRODUCTION
1. Satisfy demand for certified seeds Ratio of coverage; tonnage of distributed; DPV/EMATERcertified seeds to estimated demand
2. Improve quality of planting material, a) Quantity produced DPVand distribution b) Ratio of quantity produced to sold
c) New varieties introduced
WATER CONSERVATION,
1. Improvement of tractor efficiency of a) Number of effective hours per tractor CISAGROCISAGRO b) Down time due to lack of demand CISAGRO
2. Promote adequate and economical Analysis of tractor and equipment output CISAGRO/EMATERmechanization service projected to demand
3. Promote adequate water conservation a) Direct rainwater conservation EMATER/CISAGRO *b) Small reservoir conservation CISAGRO/EMATER *c) Reforestation EMATER
* In cooperation withmunicipalities and
COOPERATIVE SOCIETIES private entities
1. To increase cooperative member parti- a) Cooperative membership as ratio 7.U./EMATER/DACcipation, particularly of small farmers of total number of small farmers
b) Ratio of active members to totalmembership of cooperatives
2. To improve managerial strength of a) Number of viable cooperatives as ratio T.U./EMATER/DACcooperatives of total number
b) Costs of cooperative administration aspercent of total turnover
c) Average turnover per member for id:putssold, produced, marketed and credit
SMALL-SCALE NON-AGRICULTURAL ENTERPRISES handled(non-registered)
1. _xpand small- cale enterprise use of a) Ratio of informal to institutional credit UNO/BB/BNB, BANDEPEinstitu:iona. .zed credit b) Number of enterprises covered as percent
of total existingc) Amount lent to non-registered small-scale
enterprises as ratio of total credit tosmall industries, specified per type of*ctivity
2. Increase che effectiveness of small- a) Arrears for investment and working BB/BNB/BANDEPEscale enterprise credit capital credit as percentage of total
outstanding.b) Rate of compliance with original credit tNO
enterprise development plansc) Rate of enterprises producing according UNO
to estimates, or sufficiently to servicetheir debts out of sale of products
3. To improve managerial and technological a) Number of non-registered as percent of UNO/T.U.level of small non-:_, 0 stered enterprises toral existing small industries
b) Number of small-scale non-registered UNO/T.U.enterprises receiving assistance;specified per municipality and activity
c) Number of viable enterprises as percent IUNO

- 63 -ANNEX 7Page 3 of 3
Monitoring of Project Impact
Principal Objectives Key Indicator Responsible Institute
SMALL-SCALE NON-AGRICULTURAL ENTERPRISES (Cont' d)
4. Improve effectiveness of technical a) Number of enterprises covered per extensionist UNOassistance b) Time spent per enterprise assisted, until UNO
final stagec) Success rate, as ratio graduated into self- UNO
sustaining registered enterprises to enterprisesassisted, per activity and municipality
5. Promote research and adoption of inter- Number of enterprises adopting new technologies UNO/TU/ITEPmediate technology as percent of total number
FEEDER ROADS
1. Improve the year round accessibility a) Average area served per km municipal road DER/T.U.to rural communities, for transport (per municipality)of agricultural products, inputs and b) Tonnage transported per Km/year T.U./EMATER municipalitiesdelivery of public services c) Persons transported per Km/year T.U./municipalities
2. To improve level of maintenance of a) Ratio of adequately maintained roads to DER/T.U./Municipalitiesmunicipal roads total of municipal roads
b) Average maintenance costs per km/year of DER/T.U./Municipalitiesmunicipal roads, specified per class
WATERSUPPLY
1. Improvement of health situation in Reduction of the mortality and disease rate SS/FUSAM/CONPESA/UFPrural areas in rural areas
2. Supply good quality drinking water Quality of water CODPESA
3. Increase of water supply to rural Population coveredpopulation
4. Serving small industries and agricultural a) Industriec served COMPESA/PSESP/enterpriaes b) Ratios of industrial, urban and rural EMATER
home consumption and agriculturalconsumption
EDUCATION
1. Improvement of school attendance of Ratio of children attending school to total SEC/Municipalitiesbasic education to 7fl of children in the respective school age
2. Increase opportunities to receive Attendance in series 5 - 8 of i- grade,continued formal education and secondary grade
3. Improve quality of formal education Ratio of upgraded schools to total schools
4. Increase opportunities for non-formal a) Number of non-formal educational courses SEC/Municipalitieseducation b) Number of students in non-formal courses SENAI/SENAC
as percent of total number in same age groupc) Number of non-formal students as ratio to
estimated demandHEALTH
1. To deminish infant mortality Infant mortality per area and per family SS/FUSAMregistered at Rural Health Post
2. To cover 80% of priority group and Control of (i) p gnant women, breast feeding SS/FUSAM50% of other groups with primary women, children below 1 year, children 1-4health care years, (ii) children 5 - 14 years and adults
3. To cover all benificiaries of rural a) Ratio of RHP referred, to health center SS/FUSAMprimary health care with medical and attended patientshospital care, when required b) Ratio health center referred, to hospital
attended patients
4. To upgrade supporting health centers Health centers fully upgraded physically and SS/FUSAMqualitatively
5. To upgrade quality rural health staff Percentage of staff fully trained SS/FUSAM
6. To strengthen rural health adminis- a) Days of supervision by regional staff of SS/FUSAMtration local centers and posts
b) Number of sapervision per RhP per year SS/FUSAMc) Non-attendance due to lack of funds, SS/FUSAM
PROJECT MANAGEMENT staff or materials
1. To develop and establish an effective a) Time lapse between date of data used and T.U.management system of rural development completion of monitoring reportprojects b) Implementation rate, as ratio of quantities T.U.
achieved to quantities estimated, percomponent and subcomponent
c) Cost overruns per component and subcomponent T.U.d) Costs of administration as percent of project T. U.
EVALUATION costs of other components
1. To develop and establish an on-going a) Time lapse between dates of analysis data UFP/T.U.evaluation system, suitable to be and evaluation completionapplied on state rural development b) Degree of follow-up, as ratio of recommen- UFP/T.U.projects dations incorporated in management policy
.- -- Am1 mAnns made

- 64 -ANNEX 8Page 1 of 3
NORTHEAST BRAZIL
PERNAMBUCO RURAL DEVELOPMENT PROJECT - AGRESTE SETENTRIONAL
Agricultural Development
1. Rainfall, rainfall distribution, topography and soil quality andhence, agricultural production systems vary considerably within the projectarea. Even within the three subareas a wide variety exists, mainly influencedby specific small farmer communities. Inter-cropping (consortium) is acommom practice adopted to reduce the risks of irregular climate conditionsand to maximize results in relatively short periods of adequate rainfall.These consortia include the traditional crops of the project area; beans,mandioca, maize and cotton. Similarly, mixed farming is widely adopted,and most small farmers favor raising of livestock to reduce risks and tohedge against persistent inflation. The vigorous growth of urban centersand the increased means of transport and information triggered a growinginterest in dairy farming and diversification into cash crops such as fruitsand vegetables. As a result there are many production systems, which can begrouped in four main types:
AverageFarm Size Cultivated
Type Ha Area - Ha Present Landuse
1 0 - 5 2.4 Subsistance crops and cotton2 5 - 10 6.0 Subsistance crops, cotton and cattle3 10 - 50 18.0 Subsistance crops, cotton and cattle4 Landless 2.5 Subsistance crops and cotton
The developing diversification in cashcrops is distributed over types 1, 2 and4 and dairying most in type 3. During preparation various (84) developmentmodels were described for each type and each micro region. Out of this numbernineteen were selected as illustrative farm models for the project area. Asummary is given in Table 1.
2. Farm Models The extent of diversification will vary and in the end adaptitself to those crops most suitable for special ecological islands (such ascarrots in Brejo de Madre de Deus and pineapples in Riacho das Almas) and todeveloping markets (such as bananas for Recife, tomatoes for the agroindustrialcenter in Pesqueira) and the introduction of semi-permanent crops (such asmaracuja and chuchu) and permanent crops (such as sweetsop and soursop). Themodels should therefore be considered as illustrations of possible developmentsrather than a firm estimate of project wide activities. It is also likelythat farmers will respond to variable demands and will adopt a crop-mix morediversified than that shown in the models. It is not feasible to reflect in alimited number of models all possibilities and therefore a choice was made ofproxy-crops, to represent similar produce, as follows: (i) beans for the varietyof beans grown in the area; (ii) mandioca for root crops; (iii) cabbage andstring beans for vegetables (iv) cucumber for a variety of Cucurbitaceae such assquash,pumpkin, and melons (v) sweetsop for early bearing fruittrees. Theincremental production, however, will be based on this broader spectrum of newcrops. In Annex 9, illustrative models for a 0-5 ha, a 5-lOha farm are analyzed

- 65 - ANNEX 8
Page 2 of 3
in more detail. In addition to crop diversification, the project would supportthe desire of small farmers to increase livestock productivity - natural pastureswould be improved, and existing herds developed to take advantage of the increasedcarrying capacity. As mentioned in paragraph 1, small farmers see the developmentof their herds as a way of reducing risks associated with irregular climate con-ditions. Animal herds can be maintained more easily than investments in crops;investments in inproved pasture can be recuperated; and in the last resort, theanimals can be sold. In addition, animals serve as a means of saving and providea reserve for emergencies, as they retain their real value fairly well, and arefairly easily sold.
3. Farm Development: Under the project farm development would dependprincipally on small farmers transforming uncultivated and under-utilized areasinto improved pastures, and on improved farm management. The improvements infarm management would result in (i) the better timing of farm activities;(ii) the use of certified improved seeds and better planting materials; (iii) theuse of appropriate pest and disease control techniques; (iv) the use of appropriatecultivation techniques and fertilizers; (v) increased use of on-farm storage andsoil conservation techniques; and (vi) the use of better tools and equipment toimprove labor productivity. The development of livestock, as well as crops, notonly responds to the desire to seek the best defense against drought, but it alsomakes more productive use of available land, and provides a part of the organicmanure, an important input in the projected farm models. As a consequence ofthese developments, land rotation would be introduced after the farmer had reacheda higher level of farm management capabilities. The models would include anallowance for fallow land. However, actual needs and use of fallow land will bedeveloped during implementation, as the farmer works out his ultimate farmingsystem. Details of cropped areas are given in Table 2 and details of inputs areshown in Annex 9, Table 1. To achieve these objectives credit will be needed,of which overall 59% will be needed for investment and 41% for incremental seasonalcredits (custeio). The required maximum credit levels per model are shown below.
Total Farmer Indebtedness, in MVRs -/Annual Average of Illustrative Farm Models
Number ofFarm Type Expected Projectby size Participants Year 1 Year 2 Year 3 Year 4 Year 5
Landless 1,403 12 10 10 9 880 - 5 ha 6,486 19 20 20 18 165 - 10 ha 3,281 40 53 54 50 4710 - 50 ha 4,370 64 89 96 98 97
1/ The MVR (Major Valor de Referenca) is a reference value readjusted periodicallyto offset inflation. Its value in July 1978 was Cr$ 1,150.50 or abour US$60.

- 66 -ANNEX 8Page 3 of 3
Livestock will only be financed as part of a mixed crop/livestock plan, andsince most farmers owning 5 ha and more, already have some cattle, the pur-chase of coWs will in practice only be financed for smaller farmers. Financingof cattle purchases under the project would be less than 1% of total creditgranted. In the models investments */ are also foreseen for plows about US$75.00,tools and implements (US$65.00 to 225.00), soil conservation (US$75.00 to 250.00),forestation (US$40.00 to 120.00), on-farm storage (US$150.00 to 240.00) andbetter conservation of organic manure (US$150.00 to 250.00). Replacement oftools for soil tillage and harvest are included in the cost of the current dailywage, calculated at Cr$ 45.00 or US$2.35. It was assumed that the average familygroup living on the farm would consist of 1 farmer and 4 dependants, while eachfamily would supply as family labor the equivalent of 2 adults, or 500 effectivelabor days. The heaviest labor requirements for the project are in May, August,and September, with peak requirements being met through the hiring of additionalpersonnel from the underemployed labor pool in the project area (see para 9.04 ofSAR). At full development, some 50% of the incremental labor requirements of9,800 man-years would be provided by family labor. Credit would be provided tofinance up to 50% of the inputed value of family labor during the first few yearsof development, where necessary, to improve a farmer's net cash flow. However,farmers are reluctant to go too heavily into debt to finance family consumption.
4. Crop Development The farmers are mostly concerned to protect themselvesagainst the risks of crop failure, due to irregular rainfall. They will givepreference to crops and cropping systems most resistant to drought, to varietieswith a short-maturing period and to the inclusion of some animals in theirfarmplan. Recommendations on production techniques have been prepared for themajor crops and crop combinations produced in the project area, including beans,manioc, maize, cotton, carrots, tomatoes, sweet peppers, green beans, cabbage,chuchu (or chayote-squash), pineapple, passionfruit, and sweetsop. Detailsof input and yield assumptions are available in the project file in working paperNo. 2. The assumptions are based on the best available data from local farmsurveys and experimentations. The yield projections are conservative sincethey are reached and even surpassed by some more progressive small farmers inthe project area. In general, new models will gradually be phased in into theexisting production system over a 5-year period. The initial years will beused to introduce new crops, better seeds and improved farm management, whilein subsequent years more sophisticated techniques of, among others, fertilizingand disease and pest control, will follow. In practice the introduction of newtechnology will be adapted to the type of farmer, since existing techniquesvary, with the lowest level among landless farmers and the best amongst farmowners of 10-50 ha, who sometimes have already advanced considerably. Soilconservation, and water conservation, however, are very poor amongst all farmers,and the project would emphasize the promotion of cultivation techniques withbetter protection against soil erosion (such as contour planting, adequatedry-farming techniques. The projected area cultivated by the various cropsand the projected yields are given in the main text (page 33 of chapter VII):
*/ Average cost per farm given in parenthesis.

NORTHEAST BRAZIL
PERSNA3(NCO RURAL DEVELOPMENT PROJECT - AGRESTE SETENTRIONEAL
Sosesay of Illustrated Farm Models
(Rotensism of Cropped Areas to Ha.)
LOCATTON ~~~~~~~~~~SHARE CROPPERS OR RENTERS FARMERS RAVING 0.5 HA. EARNERS HAVING 3-10 HA FARMERS HAVING 15-50 HALOCATION - ~~~~~~~~~~~~(AVEREAGE FARM SIZE 2-2.50 HA) (AVERAGE FARM SIZE 2.40 HA) (AVEREAGE FARM SIZE 6 HA)V (AVEREAGE FARM SIZE 15 HA)
SORBASRA IMosfutpalities: Nr. 1 (437) lear 0 Year NO Nr. 2 (987) leaLr 5 year 10 No. 3 (529) Year 0 Year1_0 Ho. 4 (462) 'fear 0 Yea 10lbs. Iond e. Ftra EN-o, Gbyte. d. osso/eseet. 250 2300 ....o/bom/matoe 2.05 2.00 MasE-/bea..s/-Ie 3.00 3.00 Msniomlbea.../IOioe 5.00 5.00Coite, Gravta, PoebosT-at
10.13 Maes./beams 0.10 Tomatoes- 0.30 Resaee- 2.00
Choobr - 0.20 Tomatoea/rur,ob... 0.10 Curobers 0.30 Ymstoesr.. mbrs0 .40Cisaysa 0.20 Improvd pastur 0.60 2.00 Sweet peppers 0.40Fellow 1.40 - NaCura pasture 2.40 - Improved pastors 6.00 10.00
Fallow or trees - 0.40 Nataral pastors 4.00 -Milk oow. S 1 Rot used 3.00 -Read of rattle (ASU.) 2.2 2.8 Fallow or trees - 0.20
MiEk Cow 4 6Reeds of rattle (ASU.) 0.6 14.8
SUBAREIA !I (Ceeter)*Nien MosfuOpalEtlsa: Nr. 5 (55) N-r 6. (210) Nio...7. (130) No. 0 (172)Riarbo des Almas, C-m-r, smd Cottor/Mair-/Bemo 2.00 2.00 Matobmsmle 1.00 1.00 Masioe/bee..s/malse 3.00 2.00 Maslo-/br..../eaiea 6.00 2.00Sertiom of: Toritano, pre.i Sweet peppers! Cotton(Mitmebean 1.01 0.90 Pi n.apple/bea./.a. or - .90 Cottoo/males/bea.. 1.00 0. 80Ntguelledur, S1gadleho strOng beams - 0.20 FPiseapple/bo..../-.J.rr - 0.30 Improvd pastors - 3.00 Ptneappla/be..../mmntor - 1.40
or. trees 0440 - Natural pasture 3.00 - Improved pastors 6.00 12.00
Milk rows1 Fallow or trees. - 1.10Heads of rattle (AlU.) 2.2 4.4 Milk rows 4 6
Reads of rattle (A.U) 9.6 14.8
SUBRESA II (lost. N-rtb East and Sarb) Sr- 9 (317) N0..10 (2690) No. 1t10 (1172) Ru. 12 (1472)NaGs M-sOipallties: Cottor/mai.e/b...s 2.50 2.30 Maaioo/baa.s/s,aliee 1.00 1.00 Nmbou./bea..s/malee 2.50 1.50 Maslor/be..../maiee 5.00 5.00 -BO...rroS, RBejo dm Mdre ds SD-u, Iabbage/vegetebl-a - 0.10 Iotooletss 1.00 - Ortr/ou/s,a 1.00 0.50 oorooeubse 1.00 1.00
Caruarm. Liu-ie-, Our C-at-0, Sw..etsop (males/beans). 0.50 Swesp(ae/em) - 0.50 Cabbages/-egetabRe 0.75Surobim. TaquaritigoH do Hurts B.sasas (beams 1st ye.,) - 0.50 Banama (beans 1st Fear) - 0.50 Ranamas (1st year beans). 0.50
lororts 0.30 Carrts 0.30 Fass.Oos Fruit - 0.40lUsed 0.40 - Improved pastors 1.00 2.50 Improved pasture 6.00 10.00Fallow 0.10 Natural pasture 1.50 - Natural paatur- 6.00 -
Fallow or trees - 0.20 Fallow or trees - 0.35Mlilkow - . I SHltlkuows 4 6Head of rattle (AlU.) 2.2 3.2 Head of rattle (AlU.) 9.6 14.8
SUBAREA II (W-ts, Nortboest) No., 5 (.32 3
) Nr..l1 (1203) Som 14 (600) No. 15 (000)Male. Stjsiupslitiea: Cotto/Maiee/b.on. 2.00 2.00 Maoiou/bean/vales 1.00 1.00 aMlor-/bean../mai.e 1.00 1.00 Mafrbasmfe 3.00 3.00Jataubs, Vorttemle, Su1gadihbo Iwet pPp-er/g-ea beus 020 Cott-n/maioe/b.... 1.00 1.00 cottvu/n -leeb.a.. 1.00 0.60 Cottru/maio/be..m. 1.50 5.50To_ ta-, rIet boor do Capiburlbm, Tomatoes/-uuber- - 0.10 Toaosuumea - 0.20 Mamlor - -Santa Maria de Cambuo Inward 0.40 - Improvd pastnre 1.10I 4.00 Tometoeu/strimg 'as - 0.50
Fallow or trees - 0.30 NatoraI pastur 3.00 - Improved pastors 6.00 13.00Fallow - 0.20 MaCweal RanCors 7.50 Milk row 1 2Head of rattle (AlU.) 2.0 4.8 Milk ros4 6
Reed of rattle (AlU.) 9.3 13.4
OSUIARO. Ill N.. 16L (376) Or. 17 (1396) Hr, 18 (850) Sr- 10' (1373)MuuOuiplIOtle- Mamior/voioe/be.u. 2.50 2.00 NuM-u/beans/vml- 1.40 1.40 alrben/ao 1.50 1.50 Maoirr/beass/mal- 3.00 3.00Alagoimhe,BrIO Jardim, Corboeitlnba. T-mtues/utrimR beors - 0.20 CIot-o/miee/beoms 0.60 0.50 Cottoo/maiee/be... 1.30 1.10 Cottom/maiee/b.a.. 2.00 2.00laproir-o Fu-o, Fesosira, OSoharo, Tooe/rumrs - 0.15 Nuess ~pepprs Tomatoe../strisg beao - 0.40Sao 3-mb do lU., T-elibs loosed 0.40 - utriug beans - 0.40 Sweet pepper - 0.40
Fallw1 o trees - 0.25 Improvd pasture 1.20 3.00 Improvd pasture 6.00 10.00NatoroI pasture 2.o0 - EaturoI pastur 7.00 -
k00rw 2 Fallow or trees 0.20Head of rattle (AlU) 2.2 2.4 MIlk ros4 6
Head of -nttle (A.U 5 9. 14.08
o Farm devalupreot, farm operatOr reslts ard roh flows are give in Amman No. 9, FIGURES IN PAPENTHESS INDICATE4 NUMBER OF ESTIMATED FROJECT PARTICIPANTSio Toblo 2, for No. 6 io TbAle 3, ro- No. 11; sod Ir Table 4, for No.19
1/ buoho or rhayote, a bi-noso1 orop, is a loraI gourd, used as vegetable

BRAZIL
PERNAMBUCO RURAL DEVELOPIIENT PROJECT
AGRESTE SETENTRIONAL
Input and Output Coefficients per Nectare
(for new crops - vegetables and fruits - the situation is given at full deveiop-nt)
- Manioc---- -__Beans- ---- ----- Maize---- ---aCotto-----
Pre Full Pre Full Pre Fu11 Pre Fu11 String Sweet Seeet PassionItem Unit Project Dev. Project Dv. Project e Project Dev. Pineapple Banana Chuchu Tonatno Cocu.ber Beans Peppers Cabbages Carrots sop Fruit Pasture
INPUTS
Labor-/ an/days 54-70 64-104 6-8 12 6-74 11-32 32 32 49-61 95 45-73 162 142 135 140 126-135 452 93 75 16(4510/)Seeds kg - - 20 20 10 10 15 25 - - - 0.5 1.- 90 1. 1 6 - - 412/Plants 000 units 4 4 - - - - - - 13 0.65 b5 - - - - - - 450 650
Chenicalfertili.er kg - - - - - - - 300-/' 430-/ 250* 700-1,000* 7/ 300-/ 300* 1,500* 800R 900-2
Qrganic 0fertilicer ton - 73- -771/ 2-/ 10 - - - 8 410/
Line ton - - - - - - - - - - - 2
Insecticides kg/l - 1-41/ - 125/ 1 1-3 3 5 8 8 8 5 2 18 12Fungicides kg/l - - - - 7 2 2 2 - 13 - 2
Fornioides kg/l - 1-3-/ - 1-25/ 1 1 1-2 3-4 - - - 2 2 2 - 1 2 - -Herbicides kg/l - - - - - - - - - - - - I 2 - 2 -
Draft sninal hour - 56-/ 6/ 6/ 6/ 6/ - 50 56- - 50- 50 6 - 14 - 5O -O/ -Tractor hour - - - - - 710/ - - 10 - 10 - 15 710/
Stakes/poles/posts 000 units - - - - - 5 3 _ _ 3 - - I 0.1
Sack bones units - - 8 8 10 10 25 25 200 - 50 200 100 50 50 100 200 100 50 -
Wire kg - - - - - - - 100- - - - - - 100 501°/Br.ds kg - - - - - - - - - - - - - - - - - - - 1510/
YIELD-3 ton 11.2 15.4 - - _ - - - - 12.4 - 22 8-10 4-6 4-6 10-16 18-22 - 6.35 13/kg - - 530 630 570 710 340 460 - - -
000 fruits - 18-20fE/ -4 5_99..J/ 26-30 - -
j/ Labor should be evaluated for the total consortiun, such as nanioc/beans/aaioe, and cotton/beans/saize and pineapple/beans/oanioc. Most labor imputed to main crops: anioc-cotton-pineapple.j/ Rupplied by internediaries, nostly and used in rotation.3/ Average of yields obtained in various production systems.4/ Once every two years.5/ Variation under various consortium" systens.6/ Land preparation included in preceding crop, or manioc.7/ Fertilizer obtained fron preceding crop, or oanioc.8/ Once every three years.9/ 200 kg As. 8ulphate, 130 kg SRper, 100 kg Potasiso Chloride.
10/ At year of planting or establishing.11/ Only if not rotated with tomatoes.
L2/ 150 kg Urea, 250 kg Dolomite, 100 kg Potassium Chloride, 400 kg Soper.U/ 1.2 AU-carrying capacity, however with additional feeding.14/ During two harvest years in three-year cycle.
Pertilizer formula adapted to circumstanees.
February 1979

-~ 69 -ANNEX 9Table 2Page 1 of 5
Farm Model 6, Cropping Pattern,
Financial Analysis, Debt Service and Cash Flow Projections
Model Nr. 6 (See Annex 8, Table 1)Subarea IIFarmer havin2 0-5 ha (number of participants 210)
A. Farm Development (in ha) Year
CROPS Refa-re-Project 1 2 3 4 5 6
Manioc/beans/maize 1.00 1.00 1.00 1.00 1.00 1.00 1.00
Cotton/maize/beans 1.00 1.00 1.00 0.90 0.90 0.90 0.90
Pineapples(preceded bybeans/manioc) - 0.05 0.10 0.15 0.20 0.25 0.30
Fallow or trees - - - 0.10 0.10 0.15 0.20
Not-utilized 0.40 0.35 0.30 0.25 0.20 0.10 -
Farm area 2.40 2.40 2.40 2.40 2.40 2.40 2.40
B. Farm Calender
Month J F M A M J J A S 0 N D
0.50 ha manioc beans and maize manioc 1st year
| 0.50 ha manioc 2nd year
0.90 ha no crop cotton/beans maize 'cotton no crop
0.30 ha no crop beans and Pineapple 1st year year
pineapple 2nd year, manioc 1st year
l____________________ man oc pineapple 3rd year

NE BRAZIL
PERNAMBUCC RURAL DEVELOPMENT PROJECT - AGRESTE SETENTRIONAL
FINANCIAL , ANNUAL FARM BUDGETTYPE mu(1I CRI
…------------------------- …- - ------------------------------------------- CALENDAR -----------------------------------1978 1979 1980 1981 1982 1983 1985 1948 1993
(BASE YR)
h%ITHOUT PROJECT
GROSS VALue 17,643 17,882 18,208 18,447 18,774 19,013 19,143 19,317 19,317= TOTAL INrLOW 17,643 17,882 18,208 18,447 18,774 19,013 199143 19,317 19,317
- wASTE AND LOSS 2,294 2,325 2,367 2,398 2,441 2,472 2,489 2,511 2,511- nN-FARPA CflNSJMPT ION 3,732 3,732 3,732 3,732 3,732 3,732 3,732 3,732 3,732
= NET 1iFLJW 11,617 11,825 12,109 12,317 12,601 12,809 12,922 13,074 13,074
91RECT PROJUCTION COST 459 459 459 459 459 459 459 459 459- TOTAL OUTFLOW 459 459 459 459 459 459 459 459 459
- NET FARM CASH FLOW 11,159 11,367 11,65G 11,858 12,142 12,350 12,464 12,615 12,615
ON-FARM CONSUMPTION 3,732 3,732 3,732 3,732 3,732 3,732 3,732 3,732 3,732 0+ NON-PRODUCT10 OUTFLOW 3,732 3,732 3,732 3,732 3,732 3,732 3,732 3,732 3,732
- LESS IMPUTED FAMILY LABOR COST 6,930 6,930 6,930 6,930 6,930 6,930 6,930 6,930 6,930
' NET FARM BENEFIT 7,961 8,169 .8,453 8,661 8,944 9,153 9,266 9,417 9,417
00
mx
0'Jh
Ln
--------- _------------------------------------------------------------__-----__---------------------------------------------
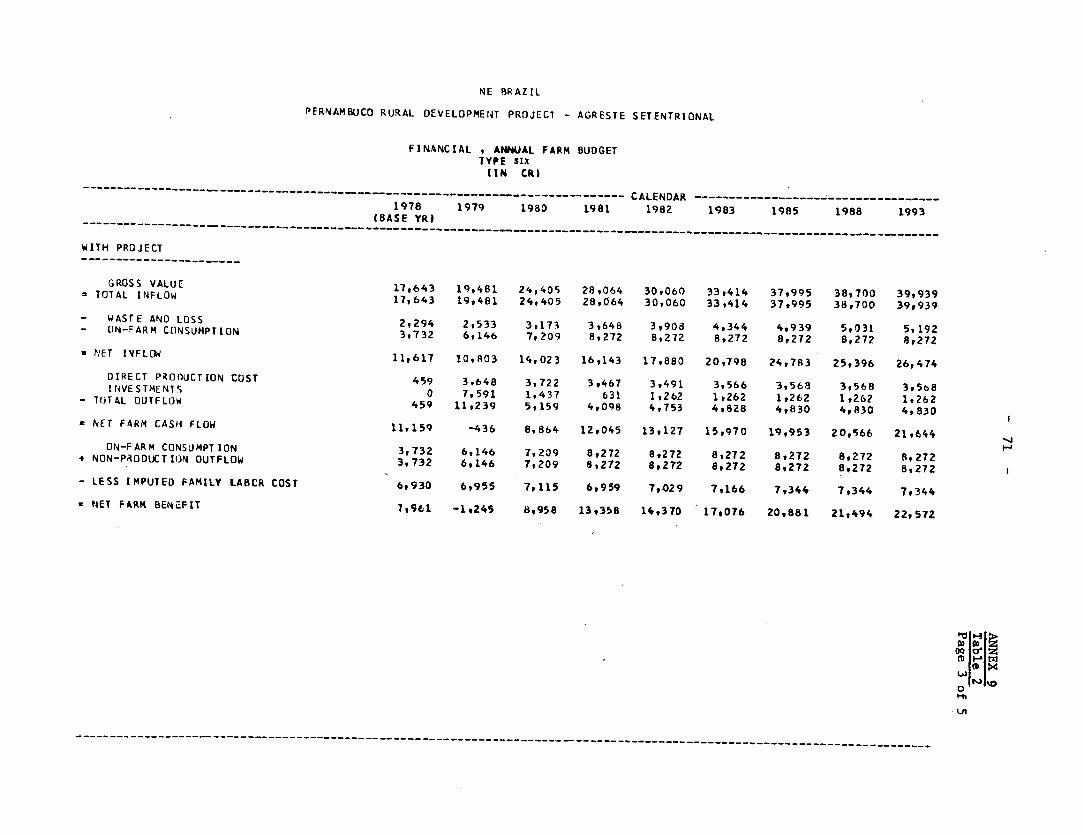
NE BRAZIL
PERNAMBUCO RURAL DEVELOPMENT PROJECT - AGRESTE SETENTRIONAL
FINANCIAL , ANhUAL FARM BUDGETTYPE sIX(IN CR)
------ ------------------ - - ------------------ ---------------- CALENDAR ------------------------------
1978 1979 1980 1981 1982 1983 1985 1988 1993
(BASE YRI…_____ _ ________________________ ________________ --------------- __ __ -------------------------- ____ -…___ _ __ _
WITH PROJECT
GROSS VALUE 17,643 19,481 24,405 28,064 30,060 33,414 37,995 38,100 39,939
= TOTAL INFLOW 17,643 19,481 24,405 28,064 30,060 33,414 37,995 38,700 39,939
- WASrE AND LOSS 2,294 2,533 3,173 3,648 3,908 4,344 4,939 5,031 5,192
- UN-FARM CONSUMPTION 3,732 6,146 7,209 8,272 8,272 8,272 8,272 8,272 8,272
= NET I4FLOW 11,617 10,R03 14,023 16,143 17,880 20,798 24,7F3 25,396 26,474
DIRECT PRODUCTION COST 459 3,648 3,722 3,467 3,491 3,566 3,568 3,568 3,568
INVESTMENTS 0 7,591 1,437 631 1,262 1,262 1,262 1,262 1,262
- TOTAL OUTFLOW 459 11,239 5,159 4,098 4,753 4,828 4,830 4,830 4,B30
N hET FARM CASH FLOW 11,159 -436 8,864 12,045 13,127 15,970 19,953 20,566 21,644
ON-FARM CONSUMPTION 3,732 6,146 7,209 8,272 8,272 8,272 8,272 8,272 8,272
* NON-PRODtETION OUTFLOW 3,732 6,146 7,209 8,272 8,272 8,272 8,272 8,272 8,272
- LESS IMPUTED FAMILY LABCR COST 6,930 6,955 7,115 6,959 7,029 7,166 7,344 7,344 7,344
= NET FARM BENEFIT 7,961 -1,245 8,958 13,358 14,370 17,076 209881 21,494 22,572
W ID OI I
U1
…________________- __--__________--________________________. _____________________.

NE BRAZIL
PERNAMBUCO RURAL DEVELOPMENT PROJECT - AGRESTE SETENTRIONAL
FINANCIAL , ANNUAL FARM BUDGETTYPE SIX
(IN CR\
--------------------------------------…---------------------- ---------------- CALENODAR ---- - --- …-…--------- - .-----
1978 1979 1980 1981 19%2 1983 1985 1988 1993(BASE YR)
INCREME'4TAL
GROSS VALUE 0 1,599 6,196 9,616 11,286 14,401 18,851 19,382 20,621= TOTAL INFLOW 0 1,599 6,196 9,616 11,286 14,401 18,P51 19,382 20,621
- .ASTE AND LOSS 0 208 806 11250 1,467 1,872 2,451 2,520 2,681- ON-FARM CONSUMPT ION 0 2,413 3,477 4,540 4,540 4,540 4,540 4,540 4,540
= NET IJFLJW 0 -1,022 1,914 3,826 5,279 7,989 11,861 12,323 13,401
DIRECT PROI)UCTION COST 0 3,189 3,264 3,009 3,033 3,107 3,110 3,110 3,110INVESTM4ENTS 0 7,591 1,437 631 1,262 1,262 1,262 1,262 1,262
- TnTAL OUTFLGW 0 10,780 4,701 3,640 4,295 4,369 4,372 4,372 4,372
= NET FARM CASH FLOW 0 -11,803 -2,787 187 984 3,620 7,489 7,951 9,029
ON-FARM CONSUMPTION 0 2,413 3,477 4,540 4,540 4,540 4,540 4,540 4,540 '+ NON-PRODUCTION OUTFLOW 0 2,413 3,477 4,540 4,540 4,540 4,540 4,540 4,540
- LESS IMPUTED FAMILY LABOR COST 0 25 185 29 99 236 414 414 414
= NET FARM BEN4EFIT 0 -9,414 505 4,697 5,425 7,923 11,615 12,077 13,155
INTERNAL RATE OF RETURN 52.50 X.
I(D P-t1m P40
Ln
- -- -- --- - - -- -- - - - - - - --- - - -- - - - - -- -- - -.-- - - - -- - - - - - -- - - - -- - - -- - -- - - - --- - -- - - - - - - -- - - -- - -- - - - - - -

NORTHEAST BRAZIL
PERNAMBUCO RURAL DEVELOPMENT PROJECT-AGRESTE
FARM TYPE SIXDEBT SERVICE AND CASH FLOW PROJECTION
(IN CR$000)
.. ....................... .... _ _._ _ -- --- --- .-. --------------------------------------------------------------------
0 1 2 3 4 5 6 7 8 9 10 12
(]:. CASH INFLOW:
I tJALE OF PROIDUCTION 11.6 10.8 14.0 16.1 17.9 20.8 24.8 24.8 24.9 25.4 25.4 25.92 INVESTMENT 1/ ...Ln. (:L00/ OF 5) 0 7.6 1.4 .6 1.3 1.3 1.3 1.3 1.3 1.3 1.3 1.33 SHORT TERM 2/ Ln. (6) .5 7.1 5.5 4.2 3.5 3.6 3.6 3.6 3.6 3.6 3.6 3.64 TOTAL INFLOW (1+2+3) 12.1 25.5 21.0 20.9 22.6 25.6 29.6 29.6 29.8 30.2 30.2 30.7
(11 ) CASH OUI'FLOW:
5 INVESTMENT COST 0 7.6 1.4 .6 1.3 1.3 1.3 1.3 1.3 1.3 1.3 1.36 OPER-ATING COST .5 31.6 ' 3.7 3.5 3.5 3.6 3.6 3.6 3.6 3.6 3.6 S4.67 TOTAL. OUTFLOW (5+6) .5 11. 2 5. 1 4. 1 4.8 4.8 4.8 4.8 4.8 4.8 4.8 4.8
(:I'.I NET CASH FlOW:
8 NETI' CASH FLOW (4-7) 11.6 14.3 15.9 16.8 17.9 20.8 24.8 24.8 24.9 25.4 25.4 25.9
(IV) DEBT SERVICES:
9 TINVEST'. LOAN PRINCIPAL PMTr. 0 0 0 0 1.0 1.3 1.5 1.8 2.1 2.5 1.2 1.3 10 'INVESTMENT LOAN INTEREST 0 .4 .8 .9 1.0 1.1 1.1 1.0 1.0 .9 .8 .8 0 & L1 SHORT' TERM LOlAN INTEREST .0 .4 .3 .2 .2 .2 .2 .2 .2 .2 .2 .212 SHOR(RT-VT'. LOAN PRTNCIPAL PMT. .5 7.1 5.5 4.2 3.5 3.6 3.6 3.6 3.6 3.6 3.6 3.6 13 TOTAL. DEBT SERVICE (9 TO :12) .5 7.9 6.6 5.3 5.7 6.1 6.3 6.6 6.9 7.1 5.7 58 0
t.(V) CASH BALANCE:
1.4 (C'OSH BALANCE (8-13) 11.1 6.4 9.3 .11.5 12.2 14.7 18.5 18.2 18.1 18.2 19.7 20.1
. _ ... .. .._.. ..... .... ...... _. .... ......... I... .... ... - ... ... .... .... ...._ .. - - - - - - - - - -- - --------- - - - -. - - - - - - -..- _ - - - - -_.-__-_ - -_ -_ -_ - -_ -__-_ - -_ -__- - - -..- -_ -__-_ - -_-__-_ _ __ _ _
j Investment loan on average terms of 9 years with 3 years grace. at 10% interest.2/ Jnterest for both loans is 10%, the POLONORDESTE rate.- Short term loan finances 50% of imputed family labor value in yr. 1, 25% in yr. 2, 10% in yr. 3, plus purchased inputs.

74 - ANNEX 9Table 3Page 1 of 6
Farm Model 11, Cropping Pattern,
Financial Analysis, Debt Service and Cash Flow Projections
Model Nr. 11 (See Annex 8, Table 1)
Subarea IIFarmers having 5-10 ha (number of participants 1,172)
A. Farm DevelopmentBefore Year
CROPS Project 1 2 3 4 5
Manioc/beans/maize 2.50 2.00 1.50 1.50 1.50 1.50
Cotton/maize/beans 1.00 0.80 0.50 0.50 0.50 0.50
Bananas 1/ - - 0.50 0.50 0.50 0.50
Sweetsop 1/ 0.50 0.50 0.50 0.50 0.50
Carrots - 0.30 0.30 0.30 0.30 0.30
Improved pasture 1.00 1.00 2.50 2.50 2.50 2.50
Natural pasture 1.50 0.40 0.20 0.20 - -
Fallow or trees - - - - 0.20 0.20
Farm area 6.00 6.00 6.00 6.00 6.00 6.00
B. Farm Calendar
Month J F M A M J J A S 0 N D
0.75 ha harnioe l beans and maize manioc 1st year
0.75 ha manioc 2nd year
0.50 ha no crop cotton/beans/maize cottoni no crop
0.50 _ no crop beans/maize/bananas bananas 1st year
bananas 2nd and following years
0.50 ha no crop sweetsop/beans/maize sweetsop lst year
sweetsop sweetsop/beans/maize sweetsop 2nd year
sweetsop 3rd and following years
0.30 ha no crop carrots no crop

~ir iRRA7 1
PFRIIAMBUICC RIRtAL DFVrLnPMFNT PRO.JFCT - AGRESTE srTFNTRIONAL
FINANCIAL , ANNUAL FARM BUDGETTYPE ELEVEN
(IN CRI
…---------------------------------------------------------------------------- CALENDAR -----------------------------------
1978 1979 1980 1981 1982 1983 1985 1988 1993(BASE YR)
ITHOUT PRCJECT
GROSS VALUE 41,415 41,971 42,744 43,299 44,181 44,736 44,953 45,497 45,497TVTAL INFLOW 41,415 41,971 4?,744 43,299 44,181 44,736 44,953 45,497 45,497
WASrE AAD) LOSS 5,384 5,456 5,557 5,629 5,743 5,816 5,844 5,915 5,915ON-FARM CTINSUMPTION 5,384 5,384 5,334 5,384 5,384 5,384 5,384 5,384 5,384
NET IdFLOW. 30,647 31.131 31,803 32,286 33,053 33,536 33t726 34,199 34,199
DIPECT PRnDcJTION COST 6,911 6,911. 6,911 6,911 6,911 6,911 6,911 6,911 6,911HIRED LABOR COST 1 1 1 1 1 1 1 1 1
TOTAL OJTFLOW 6,911 6,911 6,911 6,911 6,911 6,911 6,911 6,911 6,911
NET FARM CASH FLOW 23,736 24,219 24,892 25,375 26t142 26,625 26,814 27,287 27,287
ON-FARM CONSUMPTION 5,384 5,384 5,384 5,384 5,384 5,384 5,384 5,384 5,384NON-PRODUCTIO4 OUTFLOW 5,384 5,384 5,384 5,384 5,384 5,384 5,384 5,384 5,384
LESS IMPUTED FAMILY LABOR COST 12,403 12,403 12,403 12,403 12,403 12,403 12,403 12,403 12,403
NET FARM BENEFIT 16,717 17,200 17,872 189356 19,123 19,606 19,795 20,268 20,268
00h
…---------…- _- …- --…_______________

NE BRAZIL
PERNAMBUCO RURAL DEVELOPMENT PROJECT - AGRESTE SETENTRIONAL
FINANCIAI , ANNUAL FARM BUDGETTYPE ELEVEN
(IN CR)
------------------------------------------------------------------------------ CALENDAR ---- - ----------------------…1978 1979 1980 1981 1982 1983 1985 1998 1993
(BASE YRI
wITH PRJJECT_ S VL4,5 37 64 7,9 71_9,3 94
GROSS VALtJ'- 41,415 63,876 69,416 71,939 77,218 96,229- 98,p493 99,145 q99,145= TOTAL INFLOW 41,415 63,d76 6B,416 71,939 77,218 96,228 98,493 99,145 99,145
- WASTE AN9 LOSS 5,3S4 3,304 8,894 9,352 10,038 12,510 12,804 12,889 12,889- ON-FARM CONSUMPTION 5,384 9,565 11,495 11,612 11,612 11,612 11,612 11,612 11,612
= NET INFLOW 30,647 46,Co8 48,027 50,975 55,567 72,106 74,076 74,644 74,644
DIRECT PRODUCTION COST 6,911 19,359 20,600 20,036 20,343 21,345 21,345 2tv345 21,345HIRED LABOR COST 1 968 1,609 1,589 1,488 1,792 1,837 1,837 1,837INVESTMENTS 0 46,207 19,552 0 0 0 0 0 0 r
- TOTAL OUTFLOW 6,911 66,534 41,762 21,625 21,831 23,136 23,181 23,181 23,181
= NET FARM CASH FLOW 23,736 -20,526 6,265 29,350 33,736 48,969 50,895 51,463 51,463
nN-FARM CONSUMPTION 5,384 9,565 11,495 11,612 11,612 11,612 11,612 11,612 11,612+ NON-PROOUCrION OUTFLOW 5,384 9,565 11,495 11,612 11,612 11,612 11,612 11,612 11,612
- LESS IMPUTED FAMILY LABOR COST 12,403 15,118 17,307 17,957 18,284 18,632 18,767 18,767 18,767
= NET FARM BENEFIT 16,717 -26,079 453 23,005 27,065 41,949 43,740 44,308 44,308
mx%o
0
0'

NE BIAZIL
PFRNAMBUCO RUPAL OEVELOPPENTl PPtJECr - AGRESTE SETENTRICNAL
FINANCIAL . ANNUAL FARM BUDGETTYPE ELEVEN
(IN CR)
………………--- -…------A---------------------------------------------- CALENDAR ---------------------- ___-________
178 179 198'8 1981 1982 1983 L985 1988 19931BASE YR)
INCREMEENTAL
GROSS VALUE 0 21,905 25,572 28,640 33,037 51,492 53,539 53,648 53,648TOTAL INFLOW 0 21,905 25,j72 28,640 33,037 51,492 53,539 53,648 53,648
- WASTE AN) LOSS 0 2,848 3,337 3,723 4,295 6,694 6,960 6,974 6,974
- ON-FARM CONSUMPTION 0 4,181 6,Iil 6,228 6,228 6,228 6,228 6,228 6,228
. NET I4FLOW 0 14,877 16,224 18,688 22,514 38,569 40,351 40,445 40,445
DIE.CT P2U)JCTION COST 0 12;448 i3,690 13,125 13,433 14,434 14,434 14,434 14,434HIRE3 LASGR COST 0 968 1,609 1,589 1,487 1,791 lt836 1,836 1,836INV3ST-IEJTS 0 46,207 19,552 0 8 0 3 8 0
- TOTAL OUTFLC. J 59,623 34.850 14,714 14,920 16,225 16,270 16,270 16,270
NET FARM CASH FL3W 0 -44,746 -18,626 3,975 7,594 22,344 24,081 24,175 24,175
On-FAPM CONSUMPTION 0 4,181 6,111 6,228 6,228 6,228 6,228 6,228 6,228t PjOrl-PRODICTIfIN OUTFLCW 0 4,181 6,111 6,228 6,228 6,228 6,228 6,228 6,228
LESS PIPUTIE FAMILY LABOR COST 0 2,715 4,J04 5,554 5,880 6,229 6,364 6,364 6,364
0 -43,279 -17,419 4,649 7,942 22,344 23,945 24,039 24,039
M'4TERNAL RATE OF RETURN 22.B5 S.
a wi'o
Co '4C-
.~~~~~~~~~~~~~~~~~~~~~~~~~~~~~~~~~~
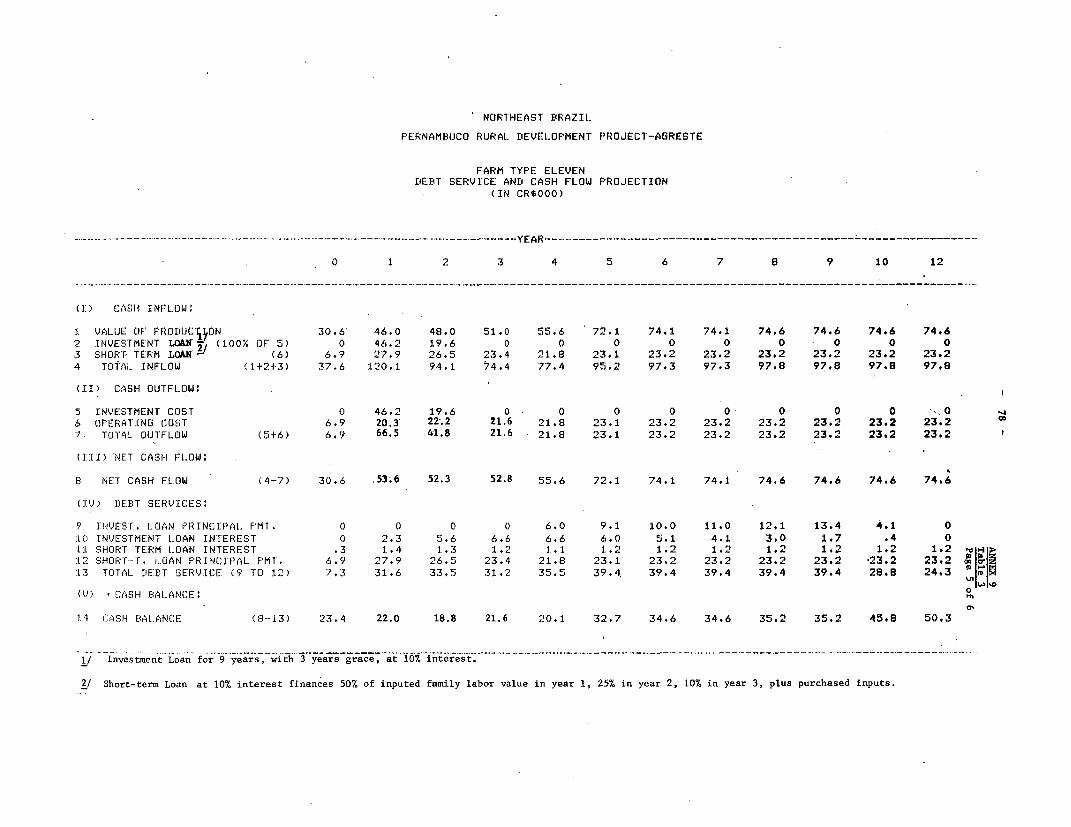
NORTHEAST BRAZIL
FERNAMBUCO RURAL DEVELOPMENT PROJECT-AGRESTE
FARM TYPE ELEVENDEBI SERVICE AND CASH FLOW FROJECTION
(IN CR$000)
.- - - - - - - - - - - - - - - - - - -…Y E- - - - - - - - - - - - - - - - - - - - - - - - - - - - --R…- -
0 1 2 3 4 5 6 7 8 9 10 12
(1:) CASH INFLOW:
J. VALUE OF FRODUCX .ON 30.6 46.0 48.0 51.0 55.6 72.1 74.1 74.1 74.6 74.6 74.6 74.62 INVESTMENT LOAN i2 (100% OF 5) 0 46.2 19.6 0 0 0 0 0 0 0 0 03 SHOR- TERM L4AN - (6) 6.9 27.9 26.5 23.4 21.8 23.1 23.2 23.2 23.2 23.2 23.2 23.24 TOTfAL INFLOW (1+2+3) 37.6 120.1 94.1 74.4 77.4 95.2 97.3 97.3 97.8 97.8 97.8 97.8
I]I CfASH OIJTFLOW:
5 INVESTMENT COST 0 46.2 19.6 0 - 0 0 0 0 0 0 0 .06 OFERATING COST 6.9 20.3 22.2 21.6 21.8 23.1 23.2 23.2 23.2 23.2. 23.2 23.2 07. TUlTAL OUTFLOW (5+6) 6.9 66.5 41.8 21.6 21.8 23.1 23.2 23.2 23.2 23.2 23.2 23.2
(III) NE:T CASH FLOW:
B NET CASH FLOW (4-7) 30.6 53.6 52.3 52.8 55.6 72.1 74.1 74.1 74.6 74.6 74.6 74.6
(]lJ I:IEBT SERV4CES:
9 INVEST. LOAN FRINCIFAL PMT. 0 0 0 0 6.0 9.1 10.0 11-0 12.1 13.4 4.1 0:10 INVESTMENT LOAN INTEREST 0 2.3 5.6 6.6 6.6 6.0 5.1 4.1 3.0 1.7 .4 0:11 EHORT TERM LO-AN INTEREST .3 1.4 1.3 1.2 1.1 1.2 1.2 1.2 1.2 1.2 1.2 1.2 :L2 SHoRT--r. LOAN FRINCIl,FAL PMT. 6.9 27.9 26.5 23.4 21.8 23.1 23.2 23.2 23.2 23.2 23.2:L3 TOTALL DEPT SERVICE (9 TO 12) 7.3 31.6 33.5 31.2 35.5 39,4. 39.4 39.4 39.4 39.4 28.8 24.3 m
(V) * CASH BALANCE:
li4 CtA,SH BAL.ANC.E (8-1-3) 23.4 22.0 18.8 21.6 20.1 32.7 34.6 34.6 35.2 35.2 45.8 50.3
1/ Investment Loan for 9 years, with 3 years grace, at 10,% interest.
2/ Short-term Loan at 107. interest finances 50% of inputed family labor value in year 1, 25% in year 2, 10% in year 3, plus purchased inputs.

- 79 -
NORTHEAST BRAZIL ANNEX 9Table 3
PERNAMBUCO RURAL DEVELOPMENT PROJECT - AGRESTE SETENTRIONAL Page 6 of 6
Livestock DevelopMent for Model Nr. 11
(5-10 ha farm, 2.5 ha pastures)
With ProjectWithout - - - - - - - - - - Year - - - - - - - - - -Project 1 2 3 4 5
1. INVESTMENT
Pasture establishment (includesfencing costs) - 9,952 - - -
2. CATTLE OPERATING COSTS (ter model)
Labor 3,285 3,285 3,285 3,285 3,285 3,285Vet. products 300 300 300 300 300 300Fences maintenance 300 300 350 350 350 350Feed for cows 1,440 1,440 1,440 1,440 1,440Depreciation of herd 200 200 200 200 200 200Other 1/ 600 600 600 600 600 600
Total Operating Costs: 4,685 6,125 6,175 6,175 6,175 6,175(2.5 ha) (2.5 ha)
3. CATTLE OPERATING COSTS (per ha) 1,875 2,450 2,470 2,470 2,470 2,470
4. CATTLE SALES (per model)
Milk 2,478 3,304 4,130 4,130 4,130 4,130Oxen change 2,000 2,500 2,500 2,500 2,500 2,500Calf 1,500 1,500 1,500 1,500 1,500 1,500
Total Sales>: 5,978 7,304 8,130 8,130 8,130 8,130
5. CATTLE SALES (per ha) 2,391 2,921 3,252 3,252 3,252 3,252(2.5 ha) (2.5 ha)
- Includes mortality and bull service.
Herd Composition
Full DevelopmentWithout Project A. U. With Project A. U.
1 cow 1 1 cow 11 calf 0.2 1 calf 0.22 steer 1.0 2 oxen 2.0
4 2.2 4 3.2
A. U./ha: 0.8 1.3
Technical Coefficients
- The farmer spends 1/5 of his time handling cattle.- Feed for miling cow: 2 kg/day during 200 days (lactating period).- Milk production: Year 0: 3 lts/day; Year 1: 4 lts/day; Year 2-5: 5 lts/day. Milk price: Cr$ 4.13 lt.- Mortality: the farmer loses one cattle head worth Cr$ 4,000 once every 10 years, with an annual
cost of Cr$ 400.- The farmer replaces his oxen every year and buys younger ones.

- 80 -ANNEX 9Table 4Page lof 6
Farm Model 19, Cropping Pattern,
Financial Analysis, Debt Service and Cash Flow Projections
Model Nr. 19 (See Annex 8, Table 1)Subarea IIIFarmer having 10-50 ha (number of participants 1373)
A. Farm Development YearBefore
CROPS Project 1 2 3 4 5
Manioc/beans/maize 3.00 3.00 3.00 3.00 3.00 3.00
Cotton/beans/maize 2.00 2.00 2.00 2.00 2.00 2.00
Tomatoes/string beans - 0.10 0.20 0.30 0.40 0.40
Sweet peppers - 0.10 0.20 0.25 0.30 0.40
Improved pasture 6.00 9.00 10.00 12.00 12.00 12.00
Natural pasture 7.00 3.80 2.60 0.45 0.10 -
Fallow or trees - - - - 0.20 0.20
Farm area 18.00 18.00 18.00 18.00 18.00 18.00
B. Farm Calender
Month i J F M A M J J A S 0 N D
1.50 ha anVoct beans/maize manioc 1st year
1.50 ha manioc - 2nd year2.00 ha Land Pre-cto noro2.00 ha paration maize/beans/cotton cotton no crop
1/ca0.40 ha no crop tomatoes - _ r.beans no crop
0.40 ha no crop sweet peppers no crop
1/ Tomatoes 0.40 ha, and second crop 0.3 ha

NE BRAZIL
PERNAMBUCC RURAL DEVELOPMENT PRUJECT - AGRESTE SETENTRIONAL
FINANCIAL , ANNUAL FARM BUDGET-TYPE NINETEEN
(IN -CR)
…--------------------------------------------------------…- -------------- CALENDAR ------------------
1978 1979 1980 1981 1982 1983 1985 1984 1993
(BASE YR)-___--_-------------------------------------------------------_----__--------__--_--___----_------------------------------
ITIIOUT PPnJECT
GROSS VALUE 74,171 75,326 76,743 77,899 79,446 80,602 80,P63 8!,515 91,515
TOTAL INFLJW 74,171 75,326 76,743 77,899 79,445 80,602 RO,863 81,515 81,515
WASTE AND LCSS 9,642 9,792 9,977 10,127 10,328 10,478 10,512 10,597 10,597
CN-FARM CONSUMPTION 5,384 5,384 5,384 5,384 5,384 5,384 5,384 5,384 5,384
NJFT I'4FLOW 59,145 60,150 61,383 62,388 63,734 64,740 64,067 65,535 65,535
DIRECT PROOiJCTION COST 15,535 15,535 15,535 15,535 15,535 15,535 15,535 15,535 15,535
HIR-D LAPOR COST 3,590 3,590 3,593 3,590 3,590 3,590 3,590 3,593 3,590
TOTAL OUTFLCW 19,125 19,125 19,125 19,125 19,125 19,125 19,125 19,125 19,125
NiET FARM CASH FLO4 43,020 41,025 42,258 43,263 44,609 45,615 45,842 46,410 46,410
ON-F 4RP CONSUMPTICN 5,384 5,384 5,384 5,384 5,384 5,384 5,384 5,384 5,384
14CN-PRODUCTION OUTFLOW 5,384 5,384 5,384 5,384 5,384 5,384 5,384 5,384 5,384
LFSS I1PUTED FAMILY LABOR COST 17,775 17,775 17,775 17,775 17,775 17,775 17,775 17,775 17,775
NET FARM BENEFIT 27,628 28,634 29,867 30,872 32,218 33,224 33,451 34,018 34,018
m
0%-----.~~~~~~~~~~~~~~~~~~~~~~~~~~~~~~~M>w

NE BRAZIL
PFRNAMBUCO RURAL DEVELOPMENT PROJECT - AGRESTE SETENTRIONAL
FINANCIAL , ANNUAL FAPM BUDGETTYPE NINETEEN
(IN -CR)
…-------------- ---- - -- - ---------…-------------- - ------------------------ CALENDAR --------------------------…--------1978 1979 1980 1981 1982 1983 1985 1988 1993
(BASE YR)…- - _ _ _ _ _ _ _ _ _ _ _ _ _ _ _ _ _ _ _ _ _ _ _ _ _ _ _ _ _ _ _ _ _ _ _ _ _ _ _ _ _ _ _ _ _ _ _ _ _ _ _ _ _ _ _ _ _ _ _ _ _ _ _ _--…- _ _ _ _ _ _ _ _ _ _ _ _ _ _ _ _ _ _ _ _ _ _ _ _ _ _ _ _ _ _ _ _ _ _ _ _ _ _ _ _ _ _ _ _ _ _ _ _ _ _
WITH PR3JECTG___OSS_- _______ V E1 1 6 , 1 8
GRCSS VALUE 749171 1149156 1419662 145,840 1579161 160,789 1639399 1649704 1649704
= TOTAL INFLOW 74,171 114,156 141,662 145,840 157,161 160,789 163,399 164,704 164,704
- WASTE AND LOSS 9,642 14,840 18,416 18,959 20,431 20,903 21,242 21,412 21,412- ON-FARM CONSUMPT ION 5,384 7,640 7,640 7,640 7,640 7,640 7,640 7,640 7,640
= NET I4FLOW 59,145 91,675 115,606 119,240 129,089 132,246 134,517 135,652 135,652
DIRECT PRODUCTION COST 15,535 32,668 36,956 40,217 41,209 41,459 41,459 41,459 41,459HIRED LABOR COST 3,590 6,698 13,214 15,599 16,274 16,904 16,904 16,904 16,904INVESTMENTS 0 34,043 19,660 2,800 0 0 0 0 0
- TOTAL OUTFLOW 19,125 73,403 69,830 58,615 57,483 58,363 58,363 58,363 58,363
= NET FARM CASH FLOW 40,020 18,267 45,776 60,625 71,606 73,883 769154 77,289 77,289
ON-FARM CONSUMPTICN 5,384 7,640 7,640 7,640 7,640 7,640 7,640 7,640 7,640+ NON-PRODUCTION OUTFLOW 5,384 7,640 7,640 7,640 7,640 7,640 7,640 7,640 7,640
- LESS IMPUTED FAMILY LABOR COST- 17,775 17,514 18,572 19,080 19,328 19,328 19,328 19,328 19,328
= NET FARM BENEFIT 27,628 8,393 34,845 49,185 59,919' 62,196 64,467 65,602 65,602
(D H MtCDXm > £
0
C'N--- --- -- ---- -- --- ---- --- --- -- - - --- --- ---- --- --- --- ---- --- --- ---- --- - -- ---- --- --- ---- --- --- ---

NE BRAZIL
PERNAM8UCO RURAL DEVELOPMENT PROJECT - AGRESTE SETENTRIONAL
FINANCIAL , ANNUAL FARM 8UaGETTYPE NINETEEN
(IN CR)
…---------------…- --------------- ---- --------- ------ CALENDAR -----------------------------------1978 1979 1980 1981 1982 1983 1985 1988 1993
I8ASE YR)
INtREMENTAL
GROSS VALUE 0 38,830 64,919 67,941 77,715 80,188 82,537 83,189 83,189TOTAL INFL)W 0 38,830 64,919 67,941 77,715 80,188 82,537 83,189 83,189
- WASTE AND LOSS 0 5,048 8,439 8,832 10,103 10,424 10,730 10,815 10.815- ON-FARM CONSUMPTION 0 2,257 2,257 2,257 2,257 2,257 2,257 2,257 2,257
s fJFT liFLOW 0 31,525 54,223 56,852 65,355 67,507 69,550 70,11R 70,118
DIRECT PROJUCTION COST 0 17,133 21,421 24,682 25,675 25,925 25,925 25,Q25 25,925HIRED LABOR COST 0 3,108 9,624 12,009 12,694 13,314 13,314 13,314 13,314 1INVESTMFtNTS 0 34,043 19,660 2,800 0 0 0 0 0
- TOTAL OUTFLOW 0 54,284 50,705 39,490 38,358 39,238 39,238 39,238 39,238 o
NET FARM CASH FLOW 0 -22,758 3,518 17,362 26,997 28,268 30,312 30,880 30,80w
ON-FARM C39NSUMPTION 0 2,257 2,257 2,257 2,257 2,257 2,257 2,257 2,257+ NON-PIODuCTIV4 OUTFLOW 0 2,257 2,257 2,257 2,257 2,257 2,257 2,257 2,757
- LESS IMPUTED FAMILY LABOR COST 0 -261 797 1,305 1,5$3 1,553 1,553 1,553 1,553
5 NET FIRM BEN_FIT 0 -20,240 4,978 18,313 27,701 28,972 31,016 31,564 31,584
INTERNAL RATE OF RETURN 78.24 7.
OQ Ir
ae---
-_--- _ _ _ _ _ _ _ _ _ _ _ _ _ _ _ _ _ __- _ _ _ _ _ _ _ _ _ _ _ _ _ _ _ _ _ _ 0'

NORT'HEAST BRAZIL
PERNAMBUCO RURAL DEVELOPMENI' PROJECT-AGRESTE
FARM T'YPE NINETEENDEBT SERVICE AND CASH FLOW PROJECTION
(IN CR$000)
....................--------------------------------------. YEAR---
0 1 2. 3 4 5 6 7 8 9 10 12
(i' C,ASH IN1FLO0W:
i VALUE OF PRODUCXON 59.2 91.7 115.6 119.2 129.1 132.2 134.5 134.5 135.7 135.7 135.7 135.7INVESTMENT IOAND (100% OF' 5) 0 34.0 19.7 2.6 0 0 0 0 0 0 0 Q
3 SHORT TERM LOAN- (6) 19.1 39.4 50.2 55.8 57.5 58.4 58.4 58.4 58.4 58.4 58.4 59.4-4 'T OTAtL INF-LOW (1+2+3) 78.3 165.1 185.4 177.9 186.6 190.6 192.9 192.9 194.0 194.0 194.0 194.0
(. I'h;CASH OUTFLOW:
J INVE ST MENT COST 0 34.0 19.7 2.8 0 0 0 0 0 0 0 06 OPERATING COST 19-1 39.4 50.2 55.8 57.5 58.4 58.4 58.4 58.4 58.4 58.4 58.47 TOTAL UUT'FLOW (5+6) 1.9.1 73.4 69-8 58.6 57-5 58.4 58.4 58.4 58.4 58.4 58.4 58.4
(lII) NET CASH-FLOW:
8 NET CASHI FLOW (4-7) 59.2 91.7 115.6- 119.2 129.1 132.2 134.5 134.5 135.7 135.7 135.7 135M7
(IV) DEB'T' SER VICES:
9 INVEST. LOAN PRINCIPAL PMT. 0 0 0 0 4-4 7.4 8.5 9.4 10.3 11.3 4.6 01(0 INVESTMENT LOAN INTEREST 0 1.7 4.4 5.5 5,7 5.2 4.5 3.6 2.7 1.7 .5 01I SH-IORT TERM LOAN INTEREST 1.0 2.0 2.5 2.8 2.9 2.9 2.9 2.9 2.9 2.9 2.9 2.9 + -12 SHORT-T. LOAN PRINCIPAL PMT'. 19.1 39.4 50.2 55.8 57.5 58.4 58.4 58.4 58.4 58.4 58.4 58.413 TOTAL. DEBT SERVICE (9 TO 12) 20.1 43-0 57.1 64.1 70.4 73.9 74.3 74.3 74.3 74.3 66.4 61.3 u.
'0(V) CASH BALANCE:
14 CASH BALANCE (8-13) 39.1 48.6 58.5 55.1 58.7 58.4 60.3 60,3 61.4 61.4 69.2 74..4
1/ Investment Loan for 9 years with 3 years grace, at 10% interest.
2/ Short term loan at 107. interest, covers purchased inputs only.
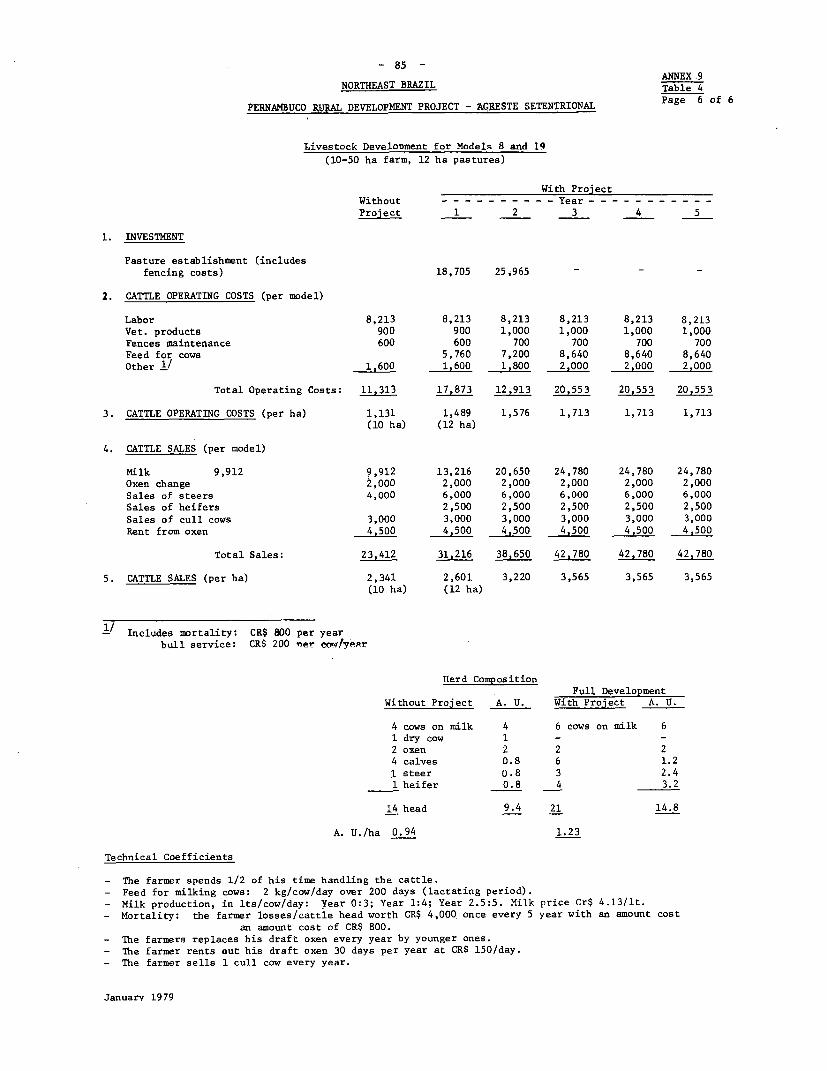
- 85 -ANNEX 9
NORTHEAST BRAZIL Table 4
PERNAMBUCO RURAL DEVELOPMENT PROJECT - AGRESTE SETENTRIONAL Page 6 of 6
Livestock DeveloDment for Models 8 and 19(10-50 ha farm, 12 ha pastures)
With ProjectWithout - - - - - - - - - - Year - - - - - - - - - - -Project 1 2 3 4 5
1. INVESTMENT
Pasture establishment (includesfencing costs) 18,705 25,965 - - -
2. CATTLE OPERATING COSTS (per model)
Labor 8,213 8,213 8,213 8,213 8,213 8,213Vet. products 900 900 1,000 1,000 1,000 1,000Fences maintenance 600 600 700 700 700 700Feed for cows 5,760 7,200 8,640 8,640 8,640Other 1/ 1,600 1,600 1,800 2,000 2,000 2,000
Total Operating Costs: 11,313 17,873 12,913 20,553 20,553 20,553
3. CATTLE OPERATING COSTS (per ha) 1,131 1,489 1,576 1,713 1,713 1,713(10 ha) (12 ha)
4. CATTLE SALES (per model)
Milk 9,912 9,912 13,216 20,650 24,780 24,780 24,780Oxen change 2,000 2,000 2,000 2,000 2,000 2,000Sales of steers 4,000 6,000 6,000 6,000 6,000 6,000Sales of heifers 2,500 2,500 2,500 2,500 2,500Sales of cull cows 3,000 3,000 3,000 3,000 3,000 3,000Rent from oxen 4,500 4,500 4,500 4,500 4,500 4,500
Total Sales: 23,412 31,216 38,650 42,780 42,780 42,780
5. CATTLE SALES (per ha) 2,341 2,601 3,220 3,565 3,565 3,565(10 ha) (12 ha)
Includes mortality: CR$ 800 per yearbull service: CR$ 200 ner cow/year
IHerd CompositionFull Development
Without Project A. U. With Project A. U.
4 cows on milk 4 6 cows on milk 61dry cow I - -2oxen 2 2 24 calves 0.8 6 1.21 steer 0.8 3 2.41 heifer 0.8 4 3.2
14 head 9.4 21 14.8
A. U./ha 0.94 1.23
Technical Coefficients
- The farmer spends 1/2 of his time handling the cattle.- Feed for milking cows: 2 kg/cow/day over 200 days (lactating period).- Milk production, in lts/cow/day: Year 0:3; Year 1:4; Year 2.5:5. Milk price Cr$ 4.13/lt.- Mortality: the farmer losses/cattle head worth CR$ 4,000, once every 5 year with an amount cost
an amount cost of CR$ 800.- The farmers replaces his draft oxen every year by younger ones.- The farmer rents out his draft oxen 30 days per year at CR$ 150/day.- The farmer sells 1 cull cow every year.
January 1979

- 86 -
ANNEX 9Table 5
NORTHEAST BRAZIL
PERNAMBUCO RURAL DEVELOPMENT PROJECT
AGRESTE SETENTRIONAL
Estimated Farm Income of Project Participants
Expected ParticipationEstimated Farm Income of this typeBefore At FullProject Proj.Development Number % of Total
(US$ equiv.)
Subarea I(East)
Non-owner, 0-5 ha 624 1289 437 2.8Owner, 0-5 ha 500 1177 987 6.4Owner, 5-10 ha 830 2099 529 3.4Owner, 10-50 ha 1483 3942 462 3.0
Subarea II (Center)
A) Center of Subarea
Non-owner, 0-5 ha 332 692 50 0.3Owner, 0-5 ha 416 1179 210 1.4Owner, 5-10 ha 862 2528 130 0.8Owner, 10-50 ha 2132 6274 175 1.1
B) Northeast and Southof Subarea
Non-owner, 0-5 ha 415 758 317 2.0Owner, 0-5 ha 416 1909 2690 17.3Owner, 5-10 ha 873 2314 1172 7.5Owner, 10-50 ha 1652 3791 1472 9.5
C) Northwest of Subarea
Non-owner, 0-5 ha 332 692 323 2.1Owner, 0-5 ha 416 966 1203 7.7Owner, 5-10 421 1289 600 3.9Owner, 10-50 1210 3699 888 5.7
Subarea III (West)
Non-owner,0-5 ha 624 1231 276 1.8Owner, 0-5 ha 449 1159 1396 9.0Owner, 5-10 ha 649 1139 850 5.5Owner, 10-50 ha 1443 3426 1373 8.8
Weighted Average/Total 757 2130 15540 100.0

- 87 - ANNEX9Table 6
Northeast Brazil
Pernambuco Rural Development Project
Agreste SetentrionalEinancial ,ates o Uetumrn for rlFoect Farm Models
(by farm-size and sub-area)in percent
Landless Farmers Having:Farmers 0-5 ha 5-10 ha 10-50 ha
Subarea I
More humid eastern section.Staple foodcrops with introductionof vegetables and expansion of live-stock on farms over 5 ha. 55.7 55.0 59.3 48.3
Subarea II
Drier central section.
A. Center of subarea. Staple foodcrops,cotton and introduction of pine-apple and vegetables and expansionof livestock on farms over 5 ha. 59..3 52.5 34.3 44.6
B. Northeast and South of subarea,-Staple food crops and introductionof fruits and vegetables and exDan-sion of livestock on farms over 5 ha. 67.6 29.9 22.8 49.0
C. North-jest of subarea. Staple food-crops and introduction of vegetablesand expansion of livestock on farms 1|over 5 ha. 59.3 77.1 46.3 64.8.
Subarea III
More humid western section.Staple foodcrops and introduction ofvegetables and expansion of livestockon farms over 5 ha. 51.5 65.1 25.3 78.2
1/ Same model

- 88 - ANNEX 10NORTHEAST BRAZIL AgE 1
PERNAMBUCO RURAL DEVELOPMENT PROJECT - AGRESTE SETENTRIONAL
Economic Analysis of Small Non-Farm Enterprises
1. General The increasing urbanization of the project area has beenaccompanied by a growth in industrial, commercial and service activitiesgenerally undertaken by very small family-owned and operated enterprises,catering to the needs of the small farmers and poor urban dwellers in the region.Activities include carpentry, welding, bucket and artefact manufacture, pottery,leather work, sewing, bakeries, small retail stores, and construction. Theseenterprises also use agricultural products from the area as inputs in the productionof processed foodstuffs, such as cheese, sweets, jams, and manioc flour. Manyof these very small establishments operate without official registration. Thus,their numbers are much larger than the official statistics indicate. The 1970census showed that there were a total of 4,200 industrial, commercial or servicetype enterprises in the project area. Average persons employed per establishmentwas 3.1. These types of activities are clustered around the larger urban centersin the region, which also have the largest weekly markets, where much of thebusiness is transacted. The principal towns are: Caruaru, Limoeiro, Gravata,Bezerros, Pesqueira, Surubim, and Belo Jardim.
2. Economic Analysis To evaluate the incremental impact of project sponsoredactivities in this sector, various representative situations were derived fromexamples of actual enterprises. The incremental impact of the technical as-sistance offered in the project, coupled with investment and working capitalcredit obtainable from local banks9 was then projected. Firms were assumed toincrease sales 25 to 30% over the next five years, as the availability of creditand technical assistance enabled them to expand production, find new markets, andincrease efficiency. Wages for skilled personnel remained at market levels,which was judged to reflect underlying market conditions for this type of labor,which is generally in short supply. Wages for unskilled workers are about 3/4of a minimum wage in many cases, and were left at this very low level, on thejudgement that they also reflected the overall market situation for this typeof personnel. Prices for the goods produced remain at their financial levels,as they are not the type of goods Brazil imports or exports. Conditions arefairly competitive at their levels of production with little productdifferentiation.
3. The mix of types of enterprises to' be assisted was judged to be:50% from industry, 30% from commercial and 20% from the services sector,based on the experience UNO has obtained working in this sector in Recife.Rates of return ranged between 41% and 86% for individual enterprises. Atotal of 2,340 non-farm enterprises would be assisted with technicalassistance associated with credit during the 5-year project implementationperiod, 100 in year 1, 210 in year 2, 400 in year 3, 670 in year 4, and 960in year 5. These enterprises were included in the rate of return calcula-tion. In addition, some 400 concerns would benefit from just the trainingand technical assistance aspects of the project, including training providedunder the education component. Benefits from these activities are even harderto quantify, and are not included in the analysis.
4. In the analysis of the economic rate of return of the small farmenterprise as a whole, the benefit stream was taken as net incremental smallenterprise benefits, resulting from expanded operation under the project.The cost stream included the incremental investments and working capitalnecessary for expanded operation, and all the project technical assistanceand research and demonstration costs9 with their toreign excnange componentrevalued to allow for a shadow foreign exchange rate 30% above the officialone: i.e. 1 Cr$ = US$24.90. The estimated rate of return was 37.7%.

NORTHEAST BRAZILPERNAMBUCO RURAL DEVELOPMENT PROJECT
AGRESTE SETENTRIONALCondensed and Indicative Financial Position for Selected Small
Non-Farm Enterprises in the Project Area
(Cr$ '000)
Tin bucket ManiocDoor- and artefact Jams and Grinding Retail
Carpenter maker maker Baker Mechanic Preserves House Staire Ceramics
Employees(including owner) 3 4 4 9 8 10 8 2 8Balance Sheets
Fixed Investment(Cr$'000) 57.0 38.0 4.0 228.0 278.0 659.0 50.0 15.0 103.0
Working Capital 3.0 15.0 0.6 5.0 30.0 100.0 30.0 6.0 5.0
Capital Stock:
Owner 6.0 53.0 4.6 93.0 308.0 609.0 50.0 28.0 108.0
Others - - - 140.0 - 150.0 - - -
Income Statements
Sales 240.0 248.8 100.8 552.0 1044.0 1728.0 120.0 168.0 240.0
Fixed Costs:
Depreciation/Maintenanceof investments: 6.2 4.2 0.4 28.1 14.3 92.9 2.0 1.7 2.5
Rent - 18.0 1.2 30.0 6.0 24.0 0.2 12.0 -
Total 6.2 22.2 1.6 58.1 20.3 116.9 2.2 13.7 2.5 X
Variable Costs
Salaries (2)59.2 (3)73.1 (3)14.4 (8)86.7(7)180.0 (9)164.0 15.0 3/QL)3.0 (7)68.2 4/
Materials 70.8 110.3 35.5 327.5 720.0 992.4 90.0 100.8 101.5
Utilities 4.2 - - - 3.7 95.6 .5 - -
Taxes(10% IPI + 15% ICM) 60.0 - - - 3.0 24.0 - 6.0 -
Transport 4.8 3.6 - 25.2 - 57.6 - 2.4 9.6
Entrepreneur's wage 1/ 20.0 20.0 13.0 30.0 2/ 20.0 20.0 10.0 13.0 20.0
Total 219.0 207.0 62.9 469.4 926.7 1353.6 115.5 135.2 119.3
Total Costs 225.2 229.2 64.5 527.5 947.0 1470.5 117.7 148.9 201.8
Net Income 14.8 19.6 36.3 24.5 97.0 257.5 2.3 19.1 38.2
% of Sales 6% 8% 36% 4% 9% 15% 2% 11% 16%
1/ Inputed value, in cases where it was not included2/ Includes family members o3/ Unskilled labor provided at very low cost by family4/ Seven persons at 3/4 of a minimum salary each
Source: Survey undertaken by POLONORDESTE Technical Unit - PE.

NORTHEAST BRAZIL
PERNAMBUCO RURAL DEVELOPMENT PROJECTAGRESTE SETENTRIONAL
Indicative Rate of Return Calculation for Small Non-Farm Enterprise Component(Cr$ '000)
Number ofIndividual Net Inc.Benefit Stream Enterprises Year 1 Year 2 Year 3 Year 4 Year5 Year 6 Year 7 Year 8 Year 9 Year 10 Year 11 - 25
Retail 1 -3 -1 2 2 3 3 3 3 3 3 3Carpenter 1 -19 2 12 22 18 18 18 18 18 18 18Mechanic 1 -56 19 23 40 59 59 59 59 59 59 59Preserves 1 -40 15 35 55 75 75 75 75 75 75 75Manioc 1 -91 2 3 5 6 6 6 6 6 6 6
Weighted Average Incremental NetBenefit Stream
Commerce: Commerce 30 -90 30 60 60 90 90 90 90 90 90 90Services: Mechanic 20 -380 40 240 440 1180 1180 1180 1180 1180 1180 1180
Carpenter 20 -1120 380 460 800 1180 1180 1180 1180 1180 1180 1180Industry: Preserves 20 -800 300 700 1100 1500 1500 1500 1500 1500 1500 1500
Manioc 10 - 91 20 30 50 60 60 60 60 60 60 60Total 100 -2481 710 1490 2450 4010 4010 4010 4010 4010 4010 4010
Net Small-enterprise Incremental oBenefit Stream
Year 1 100 -2481 710 1490 2450 4010 4010 4010 4010 4010 4010 4010Year 2 210 - -5210 1491 3129 5145 8421 8421 8421 8421 8421 8421Year 3 400 - - -9924 2840 5960 9800 9800 9800 9800 9800 9800Year 4 670 - - - -16622 4757 9983 16415 26867 26867 26867 26867Year 5 960 - - - - -23818 6816 14304 23520 38496 38496 38496
Total Benefit Stream 2340 -2481 -4500 -6943 -8203 -3946 39030 52950 72618 87594 87594 87594Cost Stream I/ 2340 4787 6607 10672 14516 16986 15282 13597 11873 10188 8483 8483
Net Incremental Benefit Stream -7268 -11107 r17615 -22719 -'20932 23748 39353 60745 77406 79111 79111
ROR= 37.7%
I/ Includes technical assistance and research and demonstration activities provided under the project - Costs include taxes, S xwhich average 1.2% of project costs during the 5 year project investment period - Deduction of taxes would not materially oeffect the rate of return. C
Source: World Bank mission
April 1979

NORTHEAST BRAZIL
PERNAMBUCO RURAL DEVELOPMENT PROJECT - AGRESTE SETENTRIONAL
Cost and Benefit Streams for Economic Analysis of Agricultural Activities under the Project(in efficiency prices and Cr$ million)
------------------------------------------------------------------- Y E A R S ------------------ __---_______________________________________________--
1 2 3 4 5 6 7 8 9 10 11 12 13 14 15-25
INCREMENTAL BENEFIT STREAM
Net farm benefit -45.0 -65.8 -65.1 -40.8 12.4 204.5 324.0 407.1 451.8 478.6 482.9 485.7 484.3 486.6 487.1
COST STREAM -
Agricultural extension 25.0 32.4 34.3 38.3 43.2 33.2 29.5 25.9 22.2 18.4 18.4 18.4 18.4 18.4 18.4Agricultural research 6.2 5.1 5.2 5.1 5.2 4.7 4.2 3.8 3.4 3.2 2.8 2.5 2.5 2.5 2.5Improved seed supply 5.3 0.9 0.9 0.9 0.9 0.8 0.8 0.6 0.6 0.5 0.5 0.5 0.5 0.5 0.5Mechanization/multipurpose dams 6.8 6.9 1.1 0.7 0.7 - - - - - - - - - -
Cooperative society assistance 2.8 4.1 5.5 5.5 2.7 1.4Marketing 8.0 8.0 8.0 9.1 4.8 0.6 - - - - - - - - -Feeder toads 77.5 114.2 100.1 67.9 16.6 6.0 6.0 6.0 6.0 6.0 6.0 6.0 6.0 6.0 6.0Administration and monitoring 13.0 15.4 12.3 12.0 12.0 9.6 7.2 4.8 2.4 - - - - - -
Evaluation 4.1 4.1 2.2 2.2 4.4 3.6 2.7 1.8 0.9 -
Total 148.7 191.1 169.6 141.7 90.5 59.9 50.4 42.9 35.5 28.1 27.7 27.4 27.4 27.4 27.4
NET BENEFIT STREAM -193.7 -256.9 -234.7 -182.5 -78.1 144.6 273.6 364.2 416.3 450.5 455.2 458.3 456.9 459.2 459.7
INTERNAL RATE OF RETURN 22.4%
Cost and Benefit Streams for Economic Analysis of Total Project(in efficiency prices and Cr$ million)
------------------------------------------------------------------ Y E A R S-----------------------------------------------------------------------1 2 3 4 5 6 7 8 9 10 11 12 13 14 15-25
NET BENEFIT STREAMS
Agricultural production -193.7 -256.9 -234.7 -182.5 -78.1 144.6 273.6 364.2 416.3 450.5 455.2 458.3 456.9 459.2 459.7
Small non-farm enterprises3/ -7.3 -11.1 -17.6 -22.7 -20.9 23.7 39.3 60.7 77.4 79.i 79.1 79.1 79.1 79.1 79.1
Total Project -201.0 -268.0 -252.3 -205.2 -99.0 168.3 312.9 424.9 493.7 529.6 534.3 537.4 536.0 538.3 538.8
INTERNAL RATE OF RETURN 23. 6%
j/ Includes taxes. Taxes average 1.2% of the relevant project costs during the 5 year project investment period, and subsequently are reduced even further, their impact on the rate ofreturn calculation was judged imnaterial.
a' See above.3/ See table mSource: World Bank mission.February 1979

-9R - ANNEX 12
NORTHEAST BRAZIL
PERNAMBUCO RURAL DEVELOPMENT PROJECTAGRESTE SETENTRIONAL
Related Documents Available in Project File
A. Supplementary Staff Working Papers
1. Project area summary data2. Agricultural development3. Agricultural extension4. Agricultural adaptive research5. Supply of improved seeds and planting material6. Land tenure studies7. Credit for agriculture8. Input supply9. Marketing10. Assistance to Cooperative Societies11. Mechanization and small dam construction12. Small non-agricultural enterprises13. Feeder-roads14. Water-supply15. Education and training16. Health and sanitation17. Production estimates, marketing and prices18. Producers income and employment, and detailed farm and enterprise-models19. Economic analysis20. Fiscal analysis21. Organization and management22. Monitoring and evaluation
B. Principal Documents prepared by the State
1, Governo do Estado de Pernambuco -Secretaria de Planejamento - Instituto de Desenvolvimentode Pernambuco (CONDEPE) and Commissao Estadual de PlanejamentoAgricola de Agricultura (CEPA-PE)
Projeto de Desenvolvimento Rural Integrado do Agreste SetentrionalMarch 1976, two volumes
2. Governo do Estado de Pernambuco -Conselho Director - Unidade TecnicaProjeto de Desenvolvimento Rural Integrado do Agreste SetentrionalReformulation, September 1978, eleven volumes
3. Governo do Estado de Pernambuco -CONDEPEAproveitamento Integral da Bacia do rio Capibaribe(General Development Plan of the Capibaribe river-basin)September, 1978. Draft edition, 3 volumes, 1 volume of maps.

IBRD 14004.. eARA PAR A[BA
MARCH 1979[ul oieos
PAAR A I 3A,0
X ~ ~~~~~~~~~~~~~~~~~~~~~~~~~~ ~ |O C ~ T /o 9 I 9 9
5 0 +0 5: F o Q o n o ,A G , ,TE h
Ck B.l R A P AR A Z
~~ 8 Molu18v \ / / AG~~OLON RDESTE RUENRALO EV LOP EN PROJECT A E
PhAU0~d IR0ro.0
~~~~~>CAK'H)lCCOB VNA
t - PRJC ONA GlUrRL-OEtIE
0R0o ~ _F`0.r 0ok,00. E d..o
0oo,,oEC,.
0od,0. 00
09 ,0y 0Rg 000 3090OOOooR. ALAGOAS0000,. d3000 poNS
30 > \ / WO RENTO DO UNs v | <o/ A CENIRAL NURSERIE;
O RURAL ECUCATIOIq CEL4IDOEAGPDO;T~ENG
1 onf/}\/#/ 3LCLHAT ETR OBE COSRUCE AND EOIPPE DAMOVRl0,D0a
0 a ( a cz,tnicobg * P' PLY YSTEM O BE CON519UCTED _ DERA EOADS~~~~~~~~~~~~~~~~~~~~~D( 91 | ,FJ3tQbebo / 7 Loz3do 03 EXISblNG OCA HEALTH CENTERS W IH CONSTRUCT ON STATE ROADS~~~~~~
\;l X 4 j 5 I / t U DE THE PROJECT ~ ~ ~ M NICIPAL B UNdAREl
\ \ / / 0 | N R - -- STATE BOUNDARES~~~~~~~~~J
4° 4 c o w r,t \t d/ L , 10 , 2D 30 40 50.r t ~~~~~ 3ff h > . ~~~~~~~_ \\w>
/ K X n S h xh e l i h 7h slP ds ehe s M v m o c _ \ > / L 5 °j 0
D 5 1 0 IS 2 p 2,5 3 0~ ~ ~ ~ ~ ~ ~ ~ ~ ~ ~ ~ ~ ~ ~ ~ ~ ~ ~ ~ ~ ~ ~ ~ ~ ~ ~ ~ ~~ ~ ~ ~ ~ ~~~~~~~~~~~~~~~~~~~~~~~~~~~~~~~~~~~~1 *:L I E,P v" vsh SvrS vfvd de O(,<3,3 II!FF 6C
53


IBRD 14005MARCH 1979
BRAZIL
State of PernambucoPOLONORDESTE RURAL DEVELOPMENT PROJECT
AGRESTE SETENTRIONAL 0 Project Area BoundoryCLIMATE ol ~~~~~~~~~~~~~~~~~~~~~~~~~~~~~Federal Roads
_____ State RoadsGO ~~~~~~~~~~~~~~~~~--.-State Boundary
-. Sub-Areais Boundary~~~~~~~~Munincipal Boundaries
rs ~o,p,,,e - 700 Annual Average Rainfall (In mm)
ELEVATION IN METERS
1000 and AboveA 0 LORIA D ~~~~~~~~~~~~~~~~~801 - 1000
601 -800
9'40i-600
SA TO ANTAG ~~Less Than 400
Th.s map has been prepared by the World Banics staff eacl-nmey tor the c-nven-ecat the reders of the reprt to which t/s attached. The denominat,ons used and thebou-daries sho- on thin map do e-t imply,.,a the part at the Wurtd each -nd toaffiliates, any jdgment en the legal stats at any terntory -ray endorsement oracceptance of such baundarie..
ACHOEIRINHA ~~~AGRESTE SETENTRIONAL-PE...
9 ~ ~ ~ ~ ~ ~ ............PEPNAM8UCO Ipoisro.................4~~~~~~~~~~~~~~~~~~~~~~~~........ --.R 1- .L..aec
A~~~en RIVER BASINS.............~~n~~n,i,n ~ ~ ~ ~ ~ jv....A...BAR......TO ............. ..........~~~~~L u l] PO UC"do ~ & .... ... .... ...~~ ~~~M R ~~~~I C A Rc.. .. ..d. .. ... .. .. .. .. .. .. ..
I I '~~~,---.-~~~~-.- R / L icKILOMETERS ?~~~~~~~~~~~~~'eaCRVERhASIN