
FOR CONTROL AND QUALITY ASSURANCE (used with permission … · SOFTWARE METRICS FOR CONTROL AND...
207
SE3S03 SOFTWARE METRICS FOR CONTROL AND QUALITY ASSURANCE (used with permission of Norman Fenton) SECTION OVERVIEW
-
Upload
nguyendiep -
Category
Documents
-
view
222 -
download
0
Transcript of FOR CONTROL AND QUALITY ASSURANCE (used with permission … · SOFTWARE METRICS FOR CONTROL AND...

SE3S03
SOFTWARE METRICS FOR CONTROL AND QUALITY ASSURANCE (used with permission of Norman Fenton)SECTION OVERVIEW

SE3S03
Course ObjectivesAt the end of this section of the
course you should be able to: write a metrics plan (define appropriate
software metrics and data collection programmes to satisfy different quality assurance objectives)
understand the importance of quantification in software engineering.
differentiate between good and bad use of measurement in software engineering
know how to use a range of software

SE3S03
Section Structure Software quality metrics basics Software metrics practice Framework for software metrics Software reliability (Measurement theory and statistical
analysis: review) Empirical software engineering Software metrics for risk and uncertainty

SE3S03
Recommended ReadingThe main course text for this
part of the course is: Fenton NE and Pfleeger SL,
‘Software Metrics: A Rigorous & Practical Approach’ (2nd Edn), PWS, 1998

SE3S03
Part 1:SOFTWARE QUALITY METRICS BASICS

SE3S03 6
Part 1 objectives Understand different definitions of
software quality and how you might measure it
Understand different notions of ‘defects’ and be able to classify them
Understand the basic techniques of data collection and how to apply them

SE3S03
How many Lines of Code?

SE3S03
What is software quality? Fitness for purpose? Conformance to specification? Absence of defects? Degree of excellence? Timeliness?
All of the above? None of the above?

SE3S03 9
Software quality - relevance
Process maturity/stability
capability index
Technical product quality
delivered defectsper KLOC
Conformance toschedule
deviation fromplanned budgets/
requirements
Productivity
LOC or FP per month
Timeliness
Time to market
Relevance to customer
Relevance to
producer
low high
high
SE3S03 10
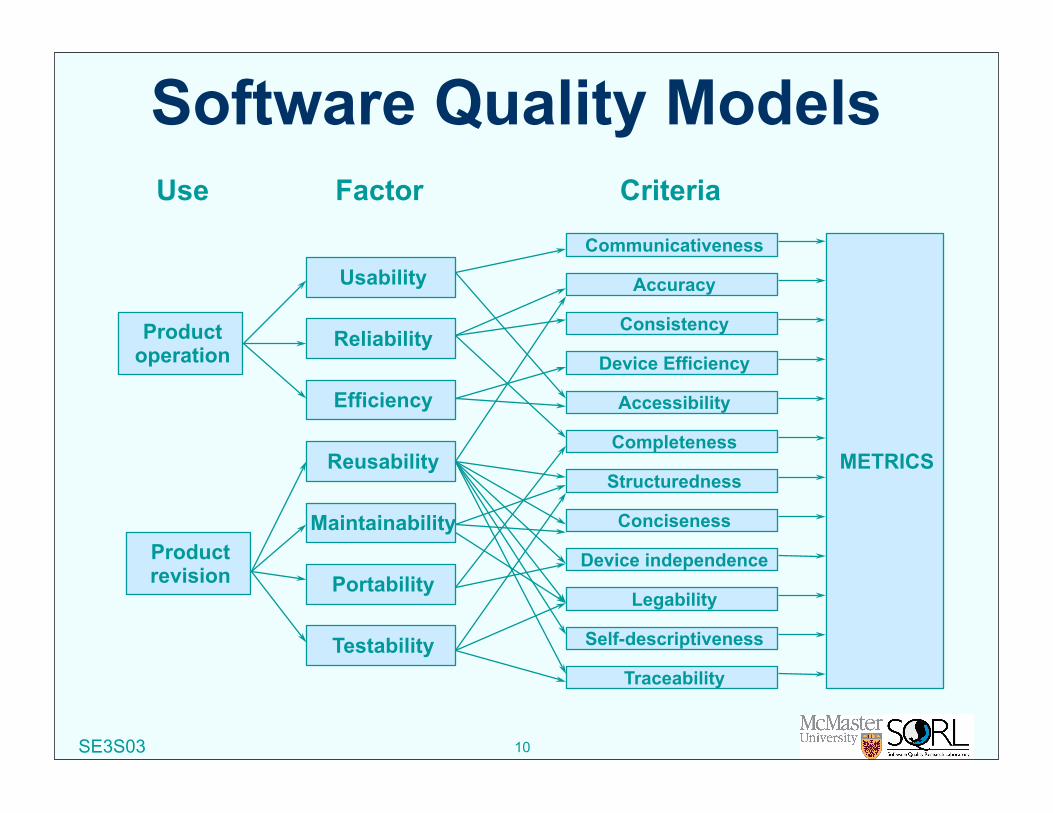
Software Quality Models
Accuracy
Consistency
Device Efficiency
Accessibility
Completeness
Structuredness
Conciseness
Device independence
Legability
Self-descriptiveness
Traceability
Communicativeness
Reliability
Efficiency
Reusability
Maintainability
Portability
Testability
Usability
Productoperation
Productrevision
METRICS
Use Factor Criteria

SE3S03
Definition of system reliability
Implications: No single reliability number for a given
system - dependent on how the system is used
Use probability to express our uncertainty Time dependent
The reliability of a system is the probability that the system will execute without failure in a given environment for a given period of time.

SE3S03
What is a software failure?Alternative views: Formal view
Any deviation from specified program behaviour is a failure
Conformance with specification is all that matters This is the view adopted in computer science
Engineering view Any deviation from required, specified or
expected behaviour is a failure If an input is unspecified the program should
produce a “sensible” output appropriate for the circumstances
This is the view adopted in dependability assessment

SE3S03
Human errors, faults, and failures
Human Error: Designer’s mistake Fault: Encoding of an error into a software
document/product Failure: Deviation of the software system
from specified or expected behaviour
?
human error fault failure
can lead to can lead to

SE3S03
Processing errors
HumanError Fault
FailureInput
In the absence of fault tolerance:
ProcessingError

SE3S03
Relationship between faults and failures (Adams 1984)
Faults Failures (sized by MTTF)
35% of all faults only lead to very rare failures (MTTF>5000 years)

SE3S03
The relationship between faults and failures
Most faults are benign For most faults: removal will not lead to
greatly improved reliability Large reliability improvements only come
when we eliminate the small proportion of faults which lead to the more frequent failures
Does not mean we should stop looking for faults, but warns us to be careful about equating fault counts with reliability

SE3S03
The ‘defect density’ measure: an important health warning Defects = {faults} ∪ {failures}
but sometimes defects = {faults} or defects = {failures}
System defect density =
where size is usually measured as thousands of lines of code (KLOC)
Defect density is used as a de-facto measure of software quality. in the light of the Adams’ data this is very dangerous
What are industry ‘norms’ and what do they mean?
number of defects found system size

SE3S03 18
Defect density vs module size
Lines of Code
DefectDensity
Observation?
Theory

SE3S03
A Study in Relative Efficiency of Testing Methods
Testing Type Defects foundper hour
Regular use
Black box
White box
Reading/Inspections
0.21
0.282
0.322
1.057
R B Grady, ‘Practical Software metrics for Project Management and Process Improvement’, Prentice Hall, 1992

SE3S03 20
The problem with ‘problems’ Defects Faults Failures Anomalies Bugs Crashes

SE3S03
Incident Types Failure (in pre or post release) Fault Change request

SE3S03
Generic DataApplicable to all incident typesWhat: Product detailsWhere (Location): Where is it? Who: Who found it?When (Timing): When did it occur?What happened (End Result): What was
observed?How (Trigger): How did it arise?Why (Cause): Why did it occur?Severity/Criticality/Urgency
Change

SE3S03
Example: Failure DataWhat: ABC Software Version 2.3Where: Norman’s home PCWho: NormanWhen: 13 Jan 2000 at 21:08 after 35
minutes of operational useEnd result: Program crashed with error
message xyzHow: Loaded external file and clicked the
command Z.Why: <BLANK - refer to fault>Severity: MajorChange: <BLANK>

SE3S03
Example: Fault Data (1) - reactiveWhat: ABC Software Version 2.3Where: Help file, section 5.7Who: NormanWhen: 15 Jan 2000, during formal
inspectionEnd result: Likely to cause users to enter
invalid passwordsHow: The text wrongly says that passwords
are case sensitiveWhy: <BLANK>
Urgency: MinorChange: Suggest rewording as follows ...

SE3S03
Example: Fault Data (2) - responsiveWhat: ABC Software Version 2.3Where: Function <abcd> in Module <ts0023>Who: SimonWhen: 14 Jan 2000, after 2 hours investigationWhat happened: Caused reported failure id
<0096>How: <BLANK>Why: Missing exception code for command ZUrgency: MajorChange: exception code for command Z added
to function <abcd> and also to function <efgh>. Closed on 15 Jan 2000.

SE3S03
Example: Change RequestWhat: ABC Software Version 2.3Where: File save menu optionsWho: NormanWhen: 20 Jan 2000End result: <BLANK>How: <BLANK>Why: Must be able to save files in ascii
format - currently not possible
Urgency: MajorChange: Add function to enable ascii format
file saving

SE3S03
Tracking incidents to components
Incidents need to be traceable to identifiable components - but at what level of granularity?
Unit Module Subsystem System

SE3S03
Fault classifications used in Eurostar control
SE3S03
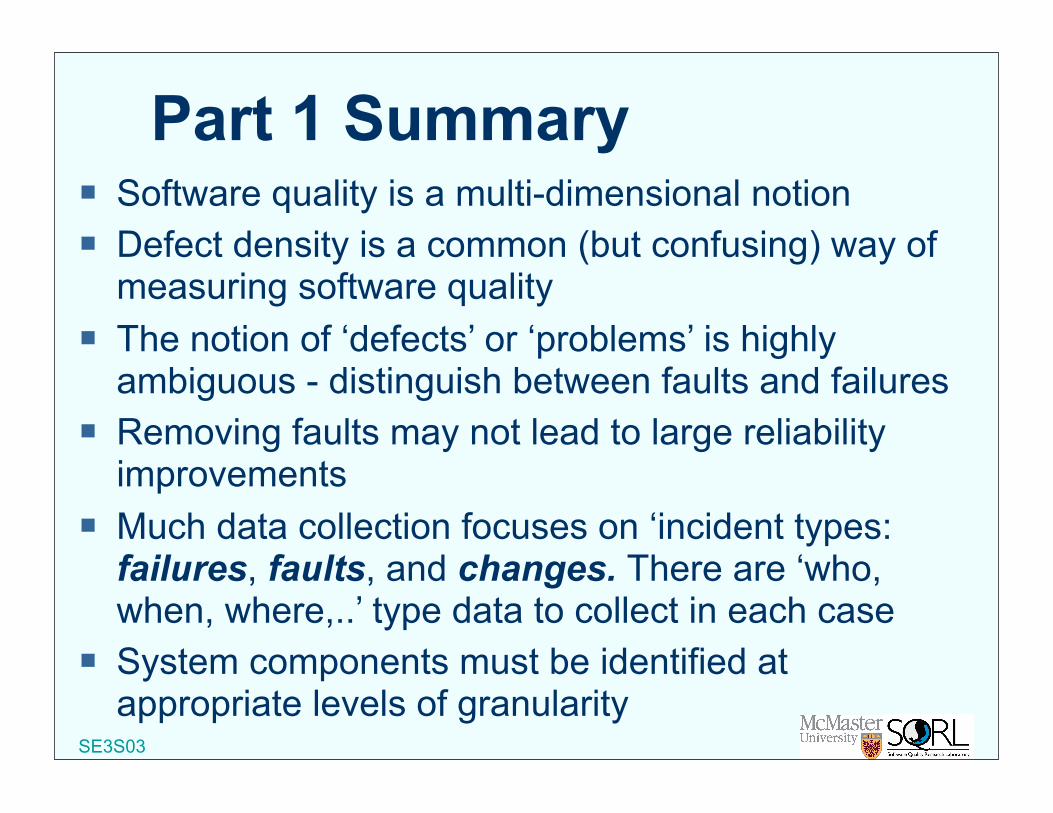
Part 1 Summary Software quality is a multi-dimensional notion Defect density is a common (but confusing) way of
measuring software quality The notion of ‘defects’ or ‘problems’ is highly
ambiguous - distinguish between faults and failures Removing faults may not lead to large reliability
improvements Much data collection focuses on ‘incident types:
failures, faults, and changes. There are ‘who, when, where,..’ type data to collect in each case
System components must be identified at appropriate levels of granularity

SE3S03 30
Part 2: SOFTWARE METRICS PRACTICE

SE3S03 31
Part 2 Objectives Understand why measurement is important
for software quality assurance and assessment
Understand the basic metrics approaches used in industry and how to apply them
Understand the importance of goal-driven measurement and know how to identify specific goals
Understand what a metrics plan is and how to write one

SE3S03
Why software measurement? To assess software products To assess software methods To help improve software processes

SE3S03
From Goals to Actions
Goals
Measures
Data
Facts/trends
Decisions
Actions

SE3S03
Goal Question Metric (GQM) There should be a clearly-defined need
for every measurement. Begin with the overall goals of the
project or product. From the goals, generate questions
whose answers will tell you if the goals are met.
From the questions, suggest measurements that can help to answer the questions.
From Basili and Rombach’s Goal-Question-Metrics paradigm, described in IEEE Transactions on Software Engineering, 1988 paper on the TAME project.

SE3S03 35
Identify fault-prone modules as early as possibleGoal
Questions
Metrics
What do we mean by‘fault-prone’ module?
Does ‘complexity’ impactfault-proneness?
How much testingis done per module?
….
‘Defect data’ for each module• # faults found per testing phase• # failures traced to module
‘Effort data’ for each module• Testing effort per testing phase• # faults found per testing phase
‘Size/complexity data’ for each module• KLOC• complexity metrics
GQM Example

SE3S03
The Metrics PlanFor each technical goal this contains
information about• WHY metrics can address the goal• WHAT metrics will be collected, how they will be
defined, and how they will be analyzed• WHO will do the collecting, who will do the
analyzing, and who will see the results• HOW it will be done - what tools, techniques and
practices will be used to support metrics collection and analysis
• WHEN in the process and how often the metrics will be collected and analyzed
• WHERE the data will be stored

SE3S03 37
The Enduring LOC Measure LOC: Number of Lines Of Code The simplest and most widely used
measure of program size. Easy to compute and automate
Used (as normalising measure) for productivity assessment (LOC/effort) effort/cost estimation (Effort = f(LOC)) quality assessment/estimation (defects/LOC))
Alternative (similar) measures KLOC: Thousands of Lines Of Code KDSI: Thousands of Delivered Source Instructions NCLOC: Non-Comment Lines of Code Number of Characters or Number of Bytes

SE3S03 38
Example: Software Productivity at Toshiba
Instructions per programmer month
0
50
100
150
200
250
300
1972 1974 1976 1978 1980 1982
Introduced SoftwareWorkbench System

SE3S03 39
Problems with LOC type measures No standard definition Measures length of programs rather than size Wrongly used as a surrogate for:
effort complexity functionality
Fails to take account of redundancy and reuse Cannot be used comparatively for different types of
programming languages Only available at the end of the development life-
cycle

SE3S03
Fundamental software size attributes• length the physical size of the product• functionality measures the functions supplied
by the product to the user• complexity
– Problem complexity measures the complexity of the underlying problem.
– Algorithmic complexity reflects the complexity/efficiency of the algorithm implemented to solve the problem
– Structural complexity measures the structure of the software used to implement the algorithm (incudes control flow structure, hierarchical structure and modular structure)
–Cognitive complexity measures the effort required to understand the software.

SE3S03 41
The search for more discriminating metricsMeasures that: capture cognitive complexity capture structural complexity capture functionality (or functional
complexity) are language independent can be extracted at early life-cycle
phases

SE3S03 42
The 1970’s: Measures of Source CodeCharacterized by: Halstead’s ‘Software Science’ metrics McCabe’s ‘Cyclomatic Complexity’ metric
Influenced by: Growing acceptance of structured programming Notions of cognitive complexity

SE3S03 43
Halstead’s Software Science Metrics
A program P is a collection of tokens, classified aseither operators or operands.
n1 = number of unique operatorsn2 = number of unique operandsN1 = total occurrences of operatorsN2 = total occurrences of operands
Length of P is N = N1+N2 Vocabulary of P is n = n1+n2
Theory: Estimate of N is N = n1 log n1 + n2 log n2
Theory: Effort required to generate P is
Theory: Time required to program P is T=E/18 seconds
E = n1 N2 N log n2n2
(elementary mental discriminations)

SE3S03 44
McCabe’s Cyclomatic Complexity Metric v
If G is the control flowgraph of program Pand G has e edges (arcs) and n nodes
v(P) = e-n+2
v(P) is the number of linearly independent paths in G
here e = 16 n =13 v(P) = 5
McCabe proposed: v(P)<10 for each module P
More simply, if d is the number ofdecision nodes in G then
v(P) = d+1

SE3S03
Flowgraph based measures Many software measures are based on
a flowgraph model of a program Most such measures can be
automatically computed once the flowgraph ‘decomposition’ is known
The notion of flowgraph decomposition provides a rigorous, generalised theory of structured programming
There are tools for computing flowgraph decomposition

SE3S03 46
The 1980’s: Early Life-Cycle Measures Predictive process measures - effort and
cost estimation Measures of designs Measures of specifications

SE3S03 47
Software Cost Estimation
How can I tell byjust looking at the
screen? I don’thave any instruments
or context
See that building on the screen?
I want to know
its weight
I don’t care. You’vegot your eyes and
a thumb and I wantthe answer to thenearest milligram

SE3S03 48
Simple COCOMO Effort Prediction
effort = a (size)b
effort = person monthssize = KDSI (predicted)
a,b constants depending on type of system:
‘organic’: a = 2.4 b = 1.05‘semi-detached’: a = 3.0 b = 1.12‘embedded’: a = 3.6 b = 1.2

SE3S03 49
COCOMO Development Time Prediction
time = a (effort)b
effort = person monthstime = development time (months)
a,b constants depending on type of system:
‘organic’: a = 2.5 b = 0.38‘semi-detached’: a = 2.5 b = 0.35‘embedded’: a = 2.5 b = 0.32

SE3S03 50
Regression Based Cost Modelling
10,000
1000
100
10
log a
1K 10K 100K 1000K 10000K
log E (Effort)
log S(Size)
Slope b
log E = log a + b * log S
E = a * S b

SE3S03 51
Albrecht’s Function PointsCount the number of:
External inputsExternal outputsExternal inquiriesExternal filesInternal files
giving each a ‘weighting factor’The Unadjusted Function Count (UFC) is the sum ofall these weighted scores
To get the Adjusted Function Count (FP), multiplyby a Technical Complexity Factor (TCF)
FP = UFC x TCF

SE3S03 52
Function Points: ExampleSpell-Checker Spec: The checker accepts as input a document file and anoptional personal dictionary file. The checker lists all words not containedin either of these files. The user can query the number of words processedand the number of spelling errors found at any stage during processing
A = # external inputs = 2, B =# external outputs = 3, C = # inquiries = 2, D = # external files = 2, E = # internal files = 1
Assuming average complexity in each case
SpellingCheckerUser User
errors found enquiry
words processes enquiry
Document file
Personal dictionary
# words processed message
# errors message
report on misspelt wordswords
UFC = 4A + 5B + 4C +10D + 7E = 58
Dictionary

SE3S03 53
Function Points: Applications Used extensively as a ‘size’
measure in preference to LOC Examples:
Productivity
Quality
Effort prediction
FPPerson months effort
DefectsFP
E=f(FP)

SE3S03 54
Function Points and Program Size
AssemblerCAlgolCOBOLFORTRANPascalRPGPL/1MODULA-2PROLOGLISPBASIC4 GL DatabaseAPLSMALLTALKQuery languagesSpreadsheet languages
320150106106106
9180807164646440322116
6
Language Source Statements per FP

SE3S03 55
The 1990’s: Broader Perspective Reports on Company-wide measurement
programmes Benchmarking Impact of SEI’s CMM process assessment Use of metrics tools Measurement theory as a unifying framework Emergence of international software
measurement standards measuring software quality function point counting general data collection

SE3S03 56
The SEI Capability Maturity Model
Level 1: Initial/ad-hoc
Level 2: Repeatable
Level 3: Defined
Level 4: Managed
Level 5: Optimising
Peer reviews Training programmeIntergroup coordinationIntegrated s/w managementOrganization process definition/focus
S/W configuration managementS/W QA S/W project planningS/W subcontract managementS/W requirements management
Software quality managementQuantitative process mgment
Process change managementTechnology change managementDefect prevention

SE3S03 57
Results of 1987-1991 SEI Assessments
Level 1
Level 2
Level 3
Level 4
Level 5
81%
12%
7%
0%
0%
87%
9%
4%
0%
0%
Column Title All 59 46 self 13 SEI
62%
23%
15%
0%
0%

SE3S03 58
Process improvement at Motorola
0
200
400
600
800
1000
In-processdefects/MAELOC

SE3S03 59
IBM Space Shuttle Software Metrics Program (1)
Early detection rate
Total inserted error rate

SE3S03 60
IBM Space Shuttle Software Metrics Program (2)
95% high
expected
95% low
Actual
Predicted total error rate trend (errors per KLOC)
Onboard flight software releases
0
2
4
6
8
10
12
14
1 3 5 7 8A 8C 8F

SE3S03 61
IBM Space Shuttle Software Metrics Program (3)
Onboard flight software failuresoccurring per base system
Basic operational increment

SE3S03 62
ISO 9126 Software Product Evaluation Standard
Quality characteristics and guidelines for their use
Chosen characteristics are: Functionality Reliability Usability Efficiency Maintainability Portability

SE3S03 63
Lesson 2 Summary Measurement activities should be goal-driven Metrics Plan details how to create metrics programme to
meet specific technical objectives ‘Software metrics’ usually driven by objectives:
productivity assessment cost/effort estimation quality assessment and prediction
All common metrics traceable to above objectives Recent trend away from specific metrics and models toward
company-wide metrics programmes Software measurement now widely accepted as key subject
area in software engineering

SE3S03 64
LESSON 3: SOFTWARE METRICS FRAMEWORK

SE3S03 65
Part 3 Objectives Learn basic measurement definitions
and a software metrics framework that conforms to these
Understand how and why diverse metrics activities fit into the framework
Learn how to define your own relevant metrics in a rigorous way
Bringing it together in case study

SE3S03
Software Measurement Activities
CostEstimation
ProductivityModels Complexity
Metrics
SoftwareQualityModels
ReliabilityModels
GQMStructuralMeasures
Algorithmiccomplexity
FunctionPoints
Are these diverse activities related?

SE3S03
Opposing Views on Measurement?‘‘When you can measure what you are speaking about, and express it in numbers, you know something about it; but when you cannot measure it, when you cannot express it in numbers, your knowledge is of a meagre kind.”
Lord Kelvin“In truth, a good case could be made that if your knowledge is meagre and unsatisfactory, the last thing in the world you should do is make measurements. The chance is negligible that you will measure the right things accidentally.”
George Miller

SE3S03
Definition of Measurement
Measurement is the process of empirical objective assignment of numbers to entities, in order to characterise a specific attribute.
• Entity: an object or event• Attribute: a feature or property of an entity• Objective: the measurement process must be based on a well-defined rule whose results are repeatable

SE3S03
Example Measures

SE3S03
Avoiding Mistakes in MeasurementCommon mistakes in software measurement
can be avoided simply by adhering to the definition of measurement. In particular:\
You must specify both entity and attribute The entity must be defined precisely You must have a reasonable, intuitive
understanding of the attribute before you propose a measure
The theory of measurement formalises these ideas

SE3S03
Be Clear of Your AttributeIt is a mistake to propose a ‘measure’ if
there is no consensus on what attribute it characterises.
o Results of an IQ test intelligence? or verbal ability? or problem solving skills?
o # defects found / KLOC quality of code? quality of testing?

SE3S03
A Cautionary Note
We must not re-define an attribute to fit in with an existing measure.
His IQ ratingis zero - he
didn’t managea single answer
Well I know he can’twrite yet, but I’ve always
regarded him as arather intelligent dog
SE3S03
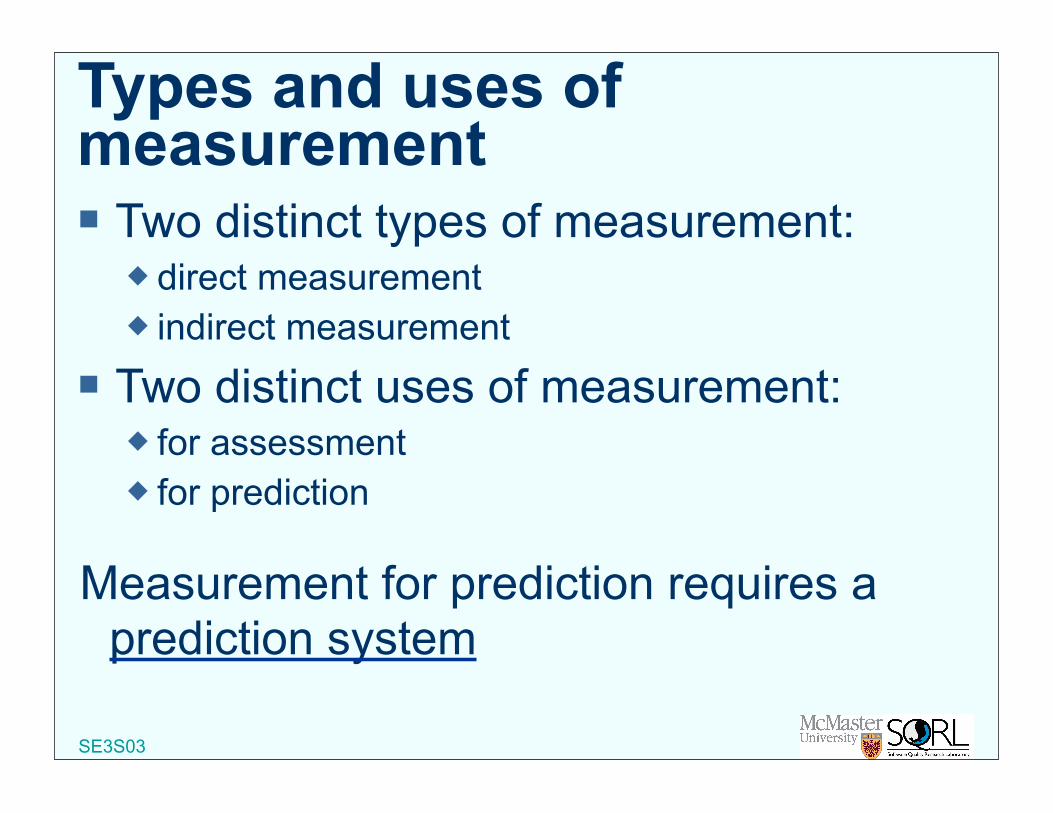
Types and uses of measurement Two distinct types of measurement:
direct measurement indirect measurement
Two distinct uses of measurement: for assessment for prediction
Measurement for prediction requires a prediction system

SE3S03
Some Direct Software Measures• Length of source code (measured by
LOC)• Duration of testing process (measured
by elapsed time in hours)• Number of defects discovered during
the testing process (measured by counting defects)
• Effort of a programmer on a project (measured by person months worked)

SE3S03
Some Indirect Software Measures
number of defectsmodule sizeModule defect density
Defect detectionefficiency
Requirements stability
Test effectiveness ratio
System spoilage effort spent fixing faultstotal project effort
number of defects detectedtotal number of defects
numb of initial requirementstotal number of requirements
number of items coveredtotal number of items
LOC producedperson months of effortProgrammer productivity

SE3S03
Predictive MeasurementMeasurement for prediction requires a prediction
system. This consists of: Mathematical model
e.g. ‘E=aSb’ where E is effort in person months (to be predicted), S is size (LOC), and a and b are constants.
Procedures for determining model parameters e.g. ‘Use regression analysis on past project data to
determine a and b’. Procedures for interpreting the results
e.g. ‘Use Bayesian probability to determine the likelihood that your prediction is accurate to within 10%’

SE3S03
No Short Cut to Accurate Prediction‘‘Testing your methods on a sample of past data gets to the heart of the scientific approach to gambling. Unfortunately this implies some preliminary spadework, and most people skimp on that bit, preferring to rely on blind faith instead’’
• [Drapkin and Forsyth 1987]Software prediction (such as cost estimation) is no different from gambling in this respect

SE3S03
Products, Processes, and Resources
Process: a software related activity or event testing, designing, coding, etc.
Product: an object which results from a process test plans, specification and design documents,
source and object code, minutes of meetings, etc.Resource: an item which is input to a process
people, hardware, software, etc.
Resources ProductsProcesses
SE3S03
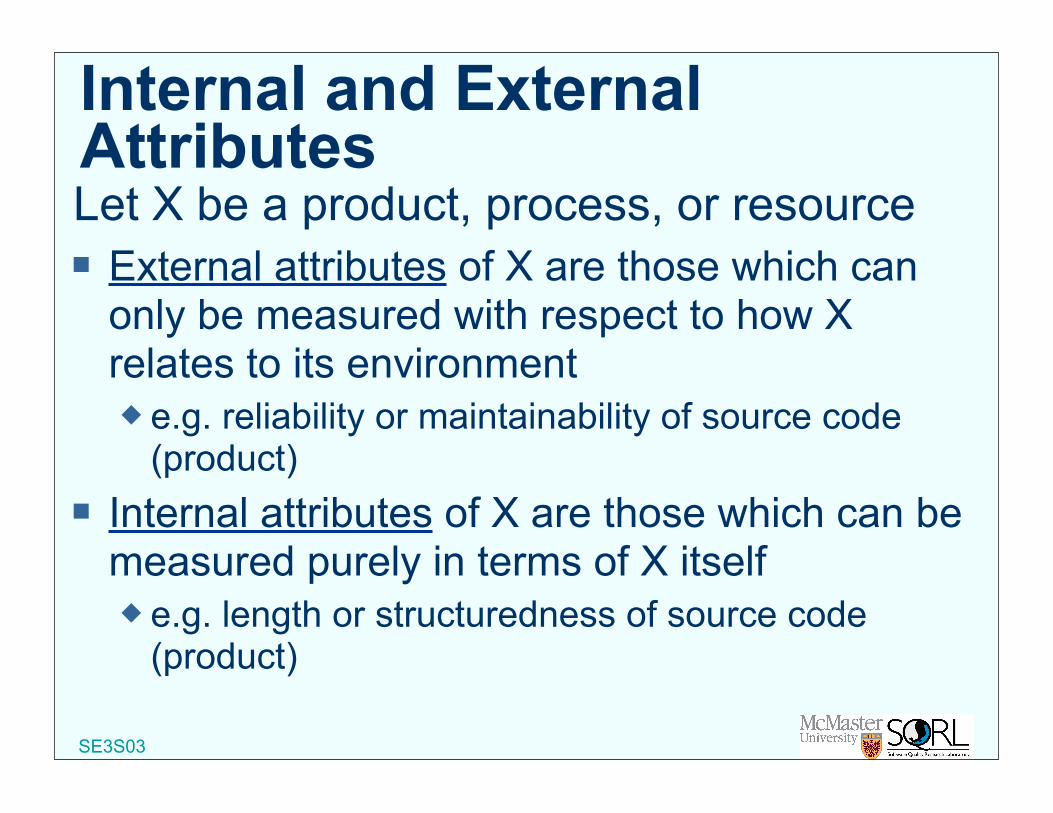
Internal and External AttributesLet X be a product, process, or resource External attributes of X are those which can
only be measured with respect to how X relates to its environment e.g. reliability or maintainability of source code
(product) Internal attributes of X are those which can be
measured purely in terms of X itself e.g. length or structuredness of source code
(product)

SE3S03
The Framework Applied
ENTITIES
ATTRIBUTES
ExternalInternal
PRODUCTS Specification Source Code ....
PROCESSES Design Test ....
RESOURCES People Tools ....
Length, functionalitymodularity, structuredness, reuse ....
maintainabilityreliability.....
time, effort, #spec faults foundtime, effort, #failures observed....
stabilitycost-effectiveness....
age, price, CMM levelprice, size....
productivityusability, quality....

SE3S03 81
Part 3 Summary Measurement is about characterising
attributes of entities Measurement can be either direct or indirect Measurement is either for assessment or
prediction The framework for software measurement is
based on: classifying software entities as products, processes, and
resources classifying attributes as internal or external determining whether the activity is assessment or predictiononly when you can answer all these questions are you ready
for measurement

SE3S03
CASE STUDY : COMPANY OBJECTIVES Monitor and improve product reliability
requires information about actual operational failures
Monitor and improve product maintainability requires information about fault discovery and
fixing ‘Process improvement’
too high a level objective for metrics programme previous objectives partially characterise process
improvement

SE3S03
General System Information
1991 19920
200000
400000
600000
8000001000000
1200000
1400000
1600000
COBOL
Natural
27 releases since Nov '87 implementation Currently 1.6 Million LOC in main system (15.2%
increase from 1991 to 1992)
LOC

SE3S03
Main Data
‘faults’ are really failures (the lack of a distinction caused problems)
481 (distinct) cleared faults during the year 28 system areas (functionally cohesive) 11 classes of faults Repair time: actual time to locate and fix defect
Fault NumberWeek In System AreaFault TypeWeek OutHours to Repair... ... ... ... ... ...
F254 92/14 C2 P 92/17 5.5

SE3S03
Case Study Components 28 ‘System areas’
All closed faults traced to system area System areas made up of Natural, Batch COBOL,
and CICS COBOL programs Typically 80 programs in each. Typical program
1000 LOC No documented mapping of program to system area For most faults: ‘batch’ repair and reporting
No direct, recorded link between fault and program in most cases
No database with program size information No historical database to capture trends

SE3S03
Single Incident Close Report
Fault idReportedDefinition
Description
Programs changedSPEDate closed
F75218/6/92Logically deleted work done recordsappear on enquiriesCauses misleading info to usersAmend ADDITIONAL WORK PERFORMEDRDVIPG2A to ignore work done records withFLAG-AMEND = 1 or 2RDVIPG2A, RGHXXZ3BJoe Bloggs26/6/92

SE3S03
Single Incident Close Report: Improved Version
Fault idReportedTrigger
End result
Cause
Change
Programs changedSPEDate closed
F75218/6/92Delete work done record, then open enquiry
Deleted records appear on enquiries, providingmisleading info to users
Omission of appropriate flag variablesfor work done records
Amend ADDITIONAL WORK PERFORMEDin RDVIPG2A to ignore work done records withFLAG-AMEND = 1 or 2
RDVIPG2A, RGHXXZ3BJoe Bloggs26/6/92

SE3S03
Fault Classification
Non-orthogonal:
DataMicroJCLOperationsMiscUnresolved
ProgramQueryReleaseSpecificationUser

SE3S03
Missing Data Recoverable
Size information Static/complexity information Mapping of faults to programs Severity categories
Non-recoverable Operational usage per system area Success/failure of fixes Number of repeated failures

SE3S03
‘Reliability’ Trend
Faults received per week
0
10
20
30
40
50
Week
Faults
10 20 30 40 50

SE3S03
Identifying Fault Prone Systems?
0
10
20
30
40
50
60
70
80
90
System area
Number of faults per system area (1992)
faults
C2 J

SE3S03
Analysis of Fault Types
Faults by fault type (total 481 faults)
Data
Unresolved
Misc
Program
Release
Query
User
Others

SE3S03
Fault Types and System Areas
C2 C J G G2 N T C3 W D F C1Program
UserUnresolved
Miscellaneous0
10
20
30
40
50
60
70
Area
Most common faults over system areas
ProgramDataUserRelease
UnresolvedQuery
Miscellaneous
faults

SE3S03
Maintainability Across System Areas
0
1
2
3
4
5
6
7
8
9
10
D O S W1 F W C3 P L G C1 J T D1 G2 N Z C C2 G1 USystem Area
Mean Time To Repair Fault (by system area)
hours

SE3S03
Maintainability Across Fault Types
Fault type
0
1
2
3
4
5
6
7
8
9
Mean Time To Repair Fault (by fault type)
Hours
JCL
Prog
ram
Spec
Rel
ease
Ope
ratio
ns
Use
r
Unr
esol
ved
Mis
c
Dat
a
Que
ry

SE3S03
Case study results with additional data: System Structure

SE3S03
Normalised Fault Rates (1)
C2 C3 P C L G2 N J G F W G1 S D O W1 C4 M D1 I Z BArea
0.00
2.00
4.00
6.00
8.00
10.00
12.00
14.00
16.00
18.00
20.00
Faults per KLOC

SE3S03 98
Normalised Fault Rates (2)
C3 P C L G2 N J G F W G1 S D O W1 C4 M D1 I Z B
Area
0.00
0.20
0.40
0.60
0.80
1.00
1.20
Faults per KLOC

SE3S03
Case Study 1 Summary The ‘hard to collect’ data was mostly all there
Exceptional information on post-release ‘faults’ and maintenance effort
It is feasible to collect this crucial data Some ‘easy to collect’ (but crucial) data was omitted
or not accessible The addition to the metrics database of some
basic information (mostly already collected elsewhere) would have enabled proactive activity.
Goals almost fully met with the simple additional data.
Crucial explanatory analysis possible with simple additional data
Goals of monitoring reliability and maintainability only partly met with existing data

SE3S03
Part 4: SOFTWARE METRICS: MEASUREMENT THEORY AND STATISTICAL ANALYSIS

SE3S03 101
Part 4 Objectives To understand in a formal sense what it
means to measure something and to know when we have a satisfactory measure
To understand the different measurement scale types
To understand which types of statistical analyses are valid for which scale types
To be able to perform some simple statistical analyses relevant to software measurement data

SE3S03
Natural Evolution of MeasuresAs our understanding of an attribute
grows, it is possible to define more sophisticated measures; e.g. temperature of liquids:
200BC - rankings, ‘‘hotter than’’ 1600 - first thermometer preserving ‘‘hotter than’’ 1720 - Fahrenheit scale 1742 - Centigrade scale 1854 - Absolute zero, Kelvin scale

SE3S03
Measurement Theory ObjectivesMeasurement theory is the scientific basis
for all types of measurement. It is used to determine formally:
When we have really defined a measure Which statements involving measurement are
meaningful What the appropriate scale type is What types of statistical operations can be applied
to measurement data

SE3S03
Measurement Theory: Key Components Empirical relation system
the relations which are observed on entities in the real world which characterise our understanding of the attribute in question, e.g. ‘Fred taller than Joe’ (for height of people)
Representation condition real world entities are mapped to number (the
measurement mapping) in such a way that all empirical relations are preserved in numerical relations and no new relations are created e.g. M(Fred) > M(Joe) precisely when Fred is taller than Joe

SE3S03
Measurement Theory: Key Components Uniqueness Theorem
Which different mappings satisfy the representation condition, e.g. we can measure height in inches, feet, centimetres, etc but all such mappings are related in a special way.
105

SE3S03
Representation Condition
Joe taller than Fred
M
63 72
M(Joe) > M(Fred)
Joe
Fred
Empirical relation Numerical relationpreserved under M as
Real World Number System

SE3S03
Meaningfulness in MeasurementSome statements involving measurement
appear more meaningful than others: Fred is twice as tall as Jane The temperature in Tokyo today is twice that in London The difference in temperature between Tokyo and London
today is twice what it was yesterday
Formally a statement involving measurement ismeaningful if its truth value is invariant oftransformations of allowable scales

SE3S03
Measurement Scale TypesSome measures seem to be of a different
‘type’ to others, depending on what kind of statements are meaningful. The 5 most important scale types of measurement are:
Nominal Ordinal Interval Ratio Absolute
Increasing orderof sophistication

SE3S03
Nominal Scale Measurement Simplest possible measurement Empirical relation system consists only
of different classes; no notion of ordering.
Any distinct numbering of the classes is an acceptable measure (could even use symbols rather than numbers), but the size of the numbers have no meaning for the measure

SE3S03
Ordinal Scale Measurement In addition to classifying, the classes are
also ordered with respect to the attribute Any mapping that preserves the
ordering (i.e. any monotonic function) is acceptable
The numbers represent ranking only, so addition and subtraction (and other arithmetic operations) have no meaning

SE3S03
Interval Scale Measurement Powerful, but rare in practice Distances between entities matters, but
not ratios Mapping must preserve order and
intervals Examples:
Timing of events’ occurrence, e.g. could measure these in units of years, days, hours etc, all relative to different fixed events. Thus it is meaningless to say ‘‘Project X started twice as early as project Y’’, but meaningful to say ‘‘the time between project X starting and now is twice the time between project Y starting and now’’
Air Temperature measured on Fahrenheit or Centigrade scale

SE3S03
Ratio Scale Measurement
Common in physical sciences. Most useful scale of measurement
Ordering, distance between entities, ratios Zero element (representing total lack of the attribute) Numbers start at zero and increase at equal intervals (units) All arithmetic can be meaningfully applied

SE3S03
Absolute Scale Measurement Absolute scale measurement is just
counting The attribute must always be of the form
of ‘number of occurrences of x in the entity’ number of failures observed during integration testing number of students in this class
Only one possible measurement mapping (the actual count)
All arithmetic is meaningful

SE3S03
Problems of measuring of program ‘complexity’
Attribute is ‘complexity’ of programs Let R be empirical relation ‘more complex than’
xRy but neitherxRz nor zRy
• No real-valued measure of ‘complexity’ is possible’

SE3S03
Validation of Measures Validation of a software measure is the
process of ensuring that the measure is a proper numerical characterisation of the claimed attribute
Example: A valid measure of length of programs must not contradict
any intuitive notion about program length If program P2 is bigger than P1 then m(P2) > m(P1) If m(P1) = 7 and m(P2) = 9 then if P1 and P2 are
concatenated, m(P1;P2) must equal m(P1)+m(P2) = 16 A stricter criterion is to demonstrate that the
measure is itself part of valid prediction system

SE3S03
Validation of Prediction Systems Validation of a prediction system, in a given
environment, is the process of establishing the accuracy of the predictions made by empirical means i.e. by comparing predictions against known data points
Methods Experimentation Actual use
Tools Statistics Probability

SE3S03
Scale Types Summary
Scale Types
Nominal
Ordinal
Interval
Ratio
Absolute
Characteristics
Entities are classified. No arithmetic meaningful.Entities are classified and ordered. Cannot use + or -.Entities classified, ordered, and differences between them understood (‘units’). No zero, but can use ordinary arithmetic on intervals.Zeros, units, ratios between entities. All arithmetic.Counting; only one possible measure. All arithmetic.

SE3S03
Meaningfulness and StatisticsThe scale type of a measure affects what operations it is meaningful to perform on the dataMany statistical analyses use arithmetic operators
These techniques cannot be used on certain data - particularly nominal and ordinal measures

SE3S03
Example: The Mean
Suppose we have a set of values {a1,a2,...,an} and wish to compute the ‘average’
The mean is
The mean is not a meaningful average for a set of ordinal scale data
a1+a2+...ann

SE3S03
Alternative Measures of Average
Median: The midpoint of the data when it isarranged in increasing order. It divides the datainto two equal parts
Mode: The commonest value
Suitable for ordinal data. Not suitable for nominaldata since it relies on order having meaning.
Suitable for nominal data

SE3S03
Summary of Meaningful Statistics
Scale Type
Nominal
Ordinal
Interval
Ratio
Absolute
Average
Mode
Median
Arithmetic mean
Geometric mean
Any
Spread
Frequency
Percentile
Standard deviation
Coefficient of variation
Any

SE3S03
Non-Parametric Techniques Most software measures cannot be
assumed to be normally distributed. This restricts the kind of analytical techniques we can apply.
Hence we use non-parametric techniques: Pie charts Bar graphs Scatter plots Box plots

SE3S03
Box Plots Graphical representation of the spread of data. Consists of a box with tails drawn relative to a
scale. Constructing the box plot:
Arrange data in increasing order The box is defined by the median, upper quartile (u) and lower
quartile (l) of the data. Box length b is u − l Upper tail is u+1.5b, lower tail is l − 1.5b Mark any data items outside upper or lower tail (outliers) If necessary truncate tails (usually at 0) to avoid meaningless
concepts like negative lines of code
upper taillower tail upper quartilemedian
lower quartilescale
xoutlier

SE3S03
Box Plots: Examples
ABCDEFGHI
JKLMNPQR
1023263131404752546770758383
100110200
1543611043575865506050965161327848
3622153315132216151810341618122021
System KLOC MOD FD
KLOC 0 50 100 150 200
31 54 83 161 Rx
MOD0 25 50 75 100
D A16 43 51 61 88 L
xx x
FD0 10 20 30 40
D L A
4.5 15 18 22 32.5xxx

SE3S03
Scatterplots
Scatterplots are used to represent data for which two measures are given for each entity
Two dimensional plot where each axis represents one measure and each entity is plotted as a point in the 2-D plane

SE3S03
Example Scatterplot: Length vs Effort
Length (KLOC)
Effort(months)
0 10 20 300
20
40
60
SE3S03
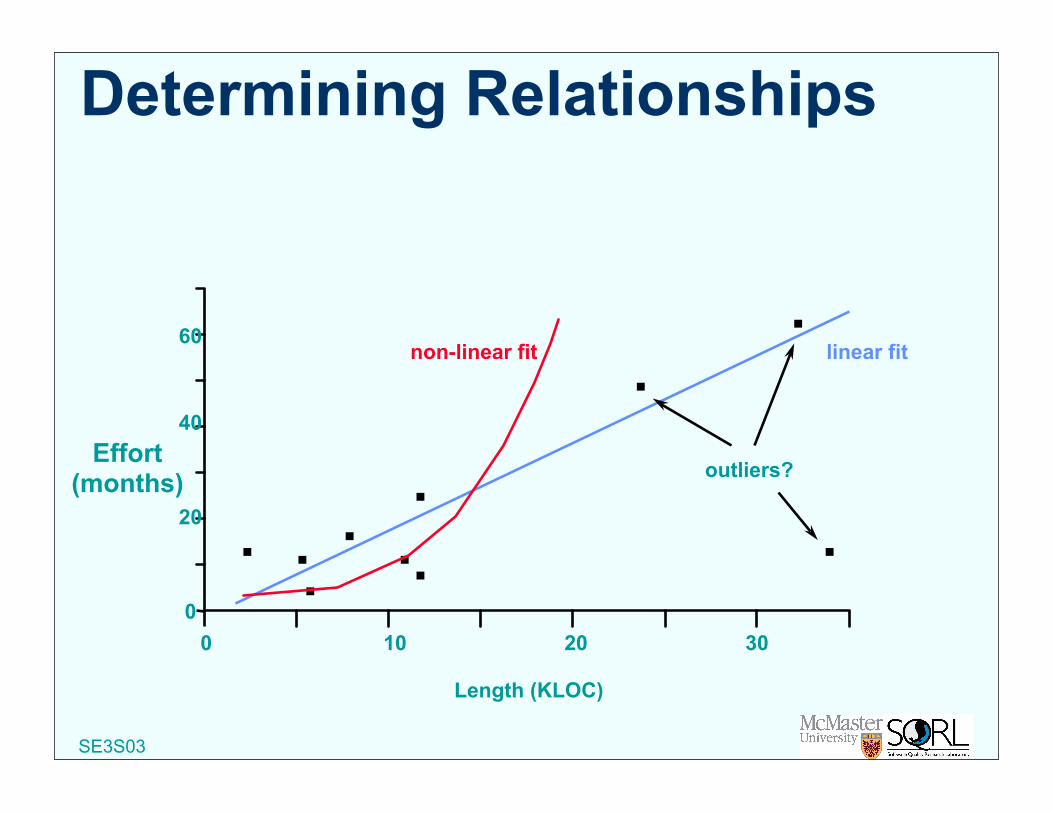
Determining Relationships
Length (KLOC)
Effort(months)
0 10 20 300
20
40
60non-linear fit linear fit
outliers?

SE3S03
Causes of Outliers There may be many causes of outliers, some
acceptable and others not. Further investigation is needed to determine the cause
Example: A long module with few errors may be due to: the code being of high quality the module being especially simple reuse of code poor testingOnly the last requires action, although if it is the first it would
be useful to examine further explanatory factors so that the good lessons can be learnt (was it use of a special tool or method, was it just because of good people or management, or was it just luck?)

SE3S03
Control Charts Help you to see when your data are within
acceptable bounds By watching the data trends over time, you
can decide whether to take action to prevent problems before they occur.
Calculate the mean and standard deviation of the data, and then two control limits.

SE3S03
Control Chart Example
0 1 2 3 4 5 6 7
0.51.01.52.02.53.03.54.0
Components
UpperControlLimit
Mean
LowerControlLimit
Preparation hours per hour of inspection

SE3S03
Part 4: Summary Measurement theory enables us to determine
when a measure is properly defined and what its scale type is
The scale type for a measure determines: Which statements about the measure are meaningful Which statistical operations can be applied to the data
Most software metrics data comes from a non-normal distribution. This means that we need to use non-parametric analysis techniques Pie charts, bar graphs, scatterplots, and box plots Scatterplots and box plots are particularly useful for outlier
analysis Finding outliers is a good starting point for
software quality control

SE3S03
Part 5: EMPIRICAL RESULTS

SE3S03 133
Part 5 Objectives To see typical metrics from a major system To understand how these metrics cast doubt
on common software engineering assumptions
To understand from practical examples both the benefits and limitations of software metrics for quality control and assurance
To learn how measurement is used to evaluate technologies in software engineering
To appreciate how little is really known about what really works in software engineering

SE3S03 134
Case study: Basic data
• Major switching system software• Modules randomly selected from those that were
new or modified in each release• Module is typically 2,000 LOC• Only distinct faults that were fixed are conted• Numerous metrics for each module

SE3S03 135
Hypotheses tested Hypotheses relating to Pareto principle of
distribution of faults and failures Hypotheses relating to the use of early fault
data to predict later fault and failure data Hypotheses about metrics for fault prediction Benchmarking hypotheses

SE3S03 136
Hypothesis 1a: a small number of modules contain most of the faults discovered during testing
0
20
40
60
80
100
30 60 90
% of Modules
% of Faults

SE3S03 137
Hypothesis 1b: If a small number of modules contain most of
the faults discovered during pre-release testing then this is simply because those modules constitute most of the code size.
For release n, the 20% of the modules which account for 60% of the faults (discussed in hypothesis 1a) actually make up just 30% of the system size. The result for release n+1 was almost identical.

SE3S03 138
Hypothesis 2a: a small number of modules contain most of the operational faults?
0
20
40
60
80
100
10 100
% of Failures
% of Modules

SE3S03 139
Hypothesis 2bif a small number of modules contain most of
the operational faults then this is simply because those modules constitute most of the code size.
No: very strong evidence in favour of a converse hypothesis:
most operational faults are caused by faults in a small proportion of the code
For release n, 100% of operational faults contained in modules that make up just 12% of entire system size. For release n+1, 80% of operational faults contained in modules that make up 10% of the entire system size.

SE3S03 140
Higher incidence of faults in function testing implies higher incidence of faults in system testing?
0%
20%
40%
60%
80%
100%
15% 30% 45% 60% 75% 90%
FT
ST
% of Modules
% of AccumalatedFaults in ST

SE3S03 141
Hypothesis 4:Higher incidence of faults pre-release implies higher incidence of faults post-release?
• At the module level• This hypothesis underlies the wide
acceptance of the fault-density measure

SE3S03 142
Pre-release vs post-release faults
Modules ‘fault prone’ pre-release are NOT ‘fault-prone post-release -demolishes most defect prediction models
Post-release faults
0
5
10
15
20
25
30
35
0 20 40 60 80 100 120 140 160
Pre-release faults

SE3S03 143
Size metrics good predictors of fault and failure prone modules?• Hypothesis 5a: Smaller modules are less likely to
be failure prone than larger ones • Hypothesis 5b Size metrics are good predictors of.
number of pre-release faults in a module• Hypothesis 5c: Size metrics are good predictors of
number of post-release faults in a module• Hypothesis 5d: Size metrics are good predictors of
a module’s (pre-release) fault-density • Hypothesis 5e: Size metrics are good predictors of
a module’s (post-release) fault-density

SE3S03 144
Plotting faults against size
Correlation but poor prediction
0
20
40
60
80
100
120
140
160
0 2000 4000 6000 8000 10000
Faults
Lines of code

SE3S03 145
Cyclomatic complexity against pre-and post-release faults
Cyclomatic complexity no better at prediction than KLOC (for either pre- or post-release)
020406080
100120140160
0 1000 2000 3000
Pre-release
Faults
Cyclomatic complexity
05
101520253035
0 1000 2000 3000
Post-release
Faults
Cyclomatic complexity

SE3S03 146
Defect density vs sizeSize is no indicator of defect density(this demolishes manysoftware engineering assumptions)
Defectsper KLOC
Module size (KLOC)
0
5
10
15
20
25
30
35
0 2000 4000 6000 8000 10000

SE3S03 147
Complexity metrics vs simple size metrics• Are complexity metrics better predictors of fault
and failure-prone modules than simple size metrics : Not really, but they are available earlier
• Results of hypothesis 4 are devastating for metrics validation
• A ‘valid’ metric is implicitly a very bad predictor of what it is supposed to be predicting
• However– complexity metrics can help to identify modules likely
to be fault-prone pre-release at a very early stage (metrics like SigFF are available long before LOC)
– complexity metrics may be good indicators of maintainability

SE3S03 148
Benchmarking hypotheses
Do software systems produced in similar environments have broadly similar fault densities at similar testing and operational phases?

SE3S03 149
Case study conclusions Pareto principle confirmed, but normal explanations
are wrong ‘Complexity metrics’ not significantly better than
simple size measures Modules which are especially fault-prone pre-
release are not especially fault-prone post-release; this result is very damaging to much software metrics work
Clearly no causal link between size and defect density
Crucial explanatory variables missing: testing effort and operational usage - incorporated in BBNs

SE3S03
Evaluating Software Engineering Technologies through Measurement
SE3S03
The Uncertainty of Reliability Achievement methods Software engineering is dominated by
revolutionary methods that are supposed to solve the software crisis
Most methods focus on fault avoidance Proponents of methods claim theirs is best Adopting a new method can require a
massive overhead with uncertain benefits Potential users have to rely on what the
experts say

SE3S03
Actual Promotional Claims for Formal Methods
Maintenanceeffort reduced
80%
Productivitygains of
250% SoftwareIntegrationtime-scales
cut to
1/6
What are we to make of such claims?

SE3S03
The Virtues of Cleanroom‘‘... industrial programming teams can produce
software with unprecedented quality. Instead of coding in 50 errors per thousand lines of code and removing 90% by debugging to leave 5 errors per thousand lines, programmers using functional verification can produce code that has never been executed with less than 5 errors per thousand lines and remove nearly all of them in statistical testing.’’Mills H, Dyer M, Linger R, ‘Cleanroom software
engineering’, IEEE Software, Sept 1987, 19-25

SE3S03
The Virtues of Verification (in Cleanroom)‘‘If a program looks hard to verify, it is the program that
should be revised not the verification. The result is high productivity in producing software that requires little or no debugging.’’Mills H, Dyer M, Linger R, ‘Cleanroom software
engineering’, IEEE Software, Sept 1987, 19-25

SE3S03
Use of Measurement in Evaluating Methods Measurement is the only truly convincing
means of establishing the efficacy of a method/tool/technique
Quantitative claims must be supported by empirical evidence
We cannot rely on anecdotal evidence. There is simply too much at stake.

SE3S03
Weinberg-Schulman Experiment
Completiontime
Program size
Data spaceused
Programclarity
User-friendlyoutput
Completiontime
Program size
Data spaceused
Programclarity
User-friendlyoutput
1 4 4 5 3
2-3
1-2
1-22-3
5
4
1 2 3 5
2
3
5
1 4 4
3
5
2
1
Ref: Weinberg GM and Schulman EL, ‘Goals and performance in computer programming’, Human Factors 16(1), 1974, 70-77
SE3S03
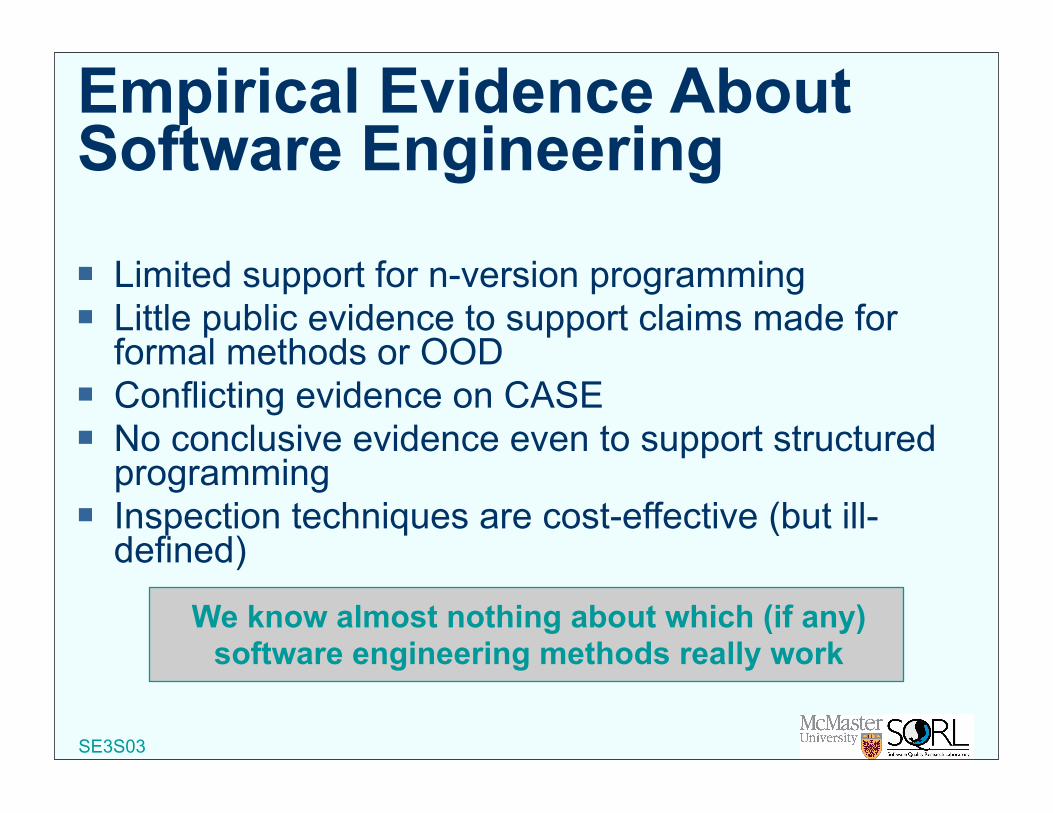
Empirical Evidence About Software Engineering
Limited support for n-version programming Little public evidence to support claims made for
formal methods or OOD Conflicting evidence on CASE No conclusive evidence even to support structured
programming Inspection techniques are cost-effective (but ill-
defined)
We know almost nothing about which (if any)software engineering methods really work

SE3S03
The Case of Flowcharts vs Pseudocode (1) ‘‘... flowcharts are merely a redundant presentation
of the information contained in the programming statements’’Schneiderman et al, ‘Experimental investigations of
the usability of detailed flowcharts in programming’, Comm ACM, June 1977, 861-881
led to flowcharts being shunned as a means of program or algorithm documentation:
‘‘... flowcharts should be avoided as a form of program documentation’’J Martin and C McClure, ‘Diagramming Techniques
for Analysts and Programmers’, Prentice-Hall, 1985

SE3S03
The Case of Flowcharts vs Pseudocode (2)‘‘... these experiments were flawed in method and/or
used unstructured flowcharts’’‘‘... significantly less time is required to comprehend
algorithms presented as flowcharts’’DA Scanlan, ‘Structured flowcharts outperform
pseudocode: an experimental comparison’, IEEE Software, Sept 1989, 28-36
SE3S03
The Evidence for Structured Programming
‘‘The precepts of structured programming are compelling, yet the empirical evidence is equivocal’’I Vessey and R Webber, ‘Research on
structured programming: an empiricists evaluation’, IEEE Trans Software Eng, 10, July 1984, 397-407
It is hard to known which claimswe can believe

SE3S03
The Virtues of Structured Programming‘‘When a program was claimed to be 90% done with
solid top-down structured programming, it would take only 10% more effort to complete it (instead of another 90%).’’Mills H, ‘Structured programming: retrospect and
prospect’, IEEE Software, 3(6), Nov 1986, 55-66

SE3S03
Management Before TechnologyResults of SQE’s extensive survey were summarised as:‘‘Best projects do not necessarily have state of the art methodologies or extensive automation and tooling. They do rely on basic principles such as strong team work, project communication, and project controls. Good organization appears to be far more of a critical success factor than technology or methodology.’’
Hetzel B, ‘Making Software Measurement Work’, QED, 1993

SE3S03
Formal Methods: Rewarding ‘Quantified’ SuccessThe Queen’s award for technological achievement 1990 to INMOS and Oxford University PRG:‘‘Her majesty the Queen has been graciously pleased to approve the Prime Minister’s recommendation that the award should be conferred this year ... for the development of formal methods in the specification and design of microprocessors ... The use of formal methods has enabled development time to be reduced by 12 months’’The 1991 award went to PRG and IBM Hursley for the use of formal methods (Z) on CICS.

SE3S03
IBM/PRG Project: Use of Z in CICSMany measurements of the process of developing
CICS/ESA V3.1 were conducted by IBM Costs of development ‘reduced by almost
$5.5M’ (8%) Significant decreases in product failure rate claimed‘‘The moral of this tale is that formal methods can not
only improve quality, but also the timeliness and cost of producing state-of-the-art products’’Jones G, ‘Queen’s Award for Technology’, e-mail
broadcast. Oxford University PRG, 1992But the quantitative evidence is not in the public domain

SE3S03
CICS study: problems found during development cycle
non Z
Z
Z used
Pld Cld Mld Ut Fv St Ca
ProblemsperKLOC

SE3S03
Comprehensibility of Formal specifications‘After a week’s training in formal specification, engineers can use it in their work’
ConForm project summary , European Focus, Issue 8, 1997
‘Use of a formal method is no longer an adventure; it is becoming routine’
FM’99: World Congress of Formal Methods, Publicity Material 1998

SE3S03
Difficulty of understanding Z
0
10
20
0
1
2
3
Number of correct responses
Number of students

SE3S03
Experiment to assess effect of structuring Z on comprehension65 students (who had completed extensive Z course).
Blocking applied to groups:
Specification A: monolithic 121 lines mostly in one Z schema.
Specification B: 6 main schemas each approx 20 lines. Total spec 159 lines
Specification C: 18 small schemas. Total spec 165 lines

SE3S03
Comparisons of scores for the different specifications
0
10
20
30
40
50
60
0 5 10 15 20 25student id
A monolithicB 6 schemasC small schemas
score out of 60

SE3S03
Formal Methods for Safety Critical Systems Wide consensus that formal methods must be used Formal methods mandatory in Def Stan 00-55
‘‘These mathematical approaches provide us with the best available approach to the development of high-integrity systems.’’McDermid JA, ‘Safety critical systems: a vignette’,
IEE Software Eng J, 8(1), 2-3, 1993
SE3S03
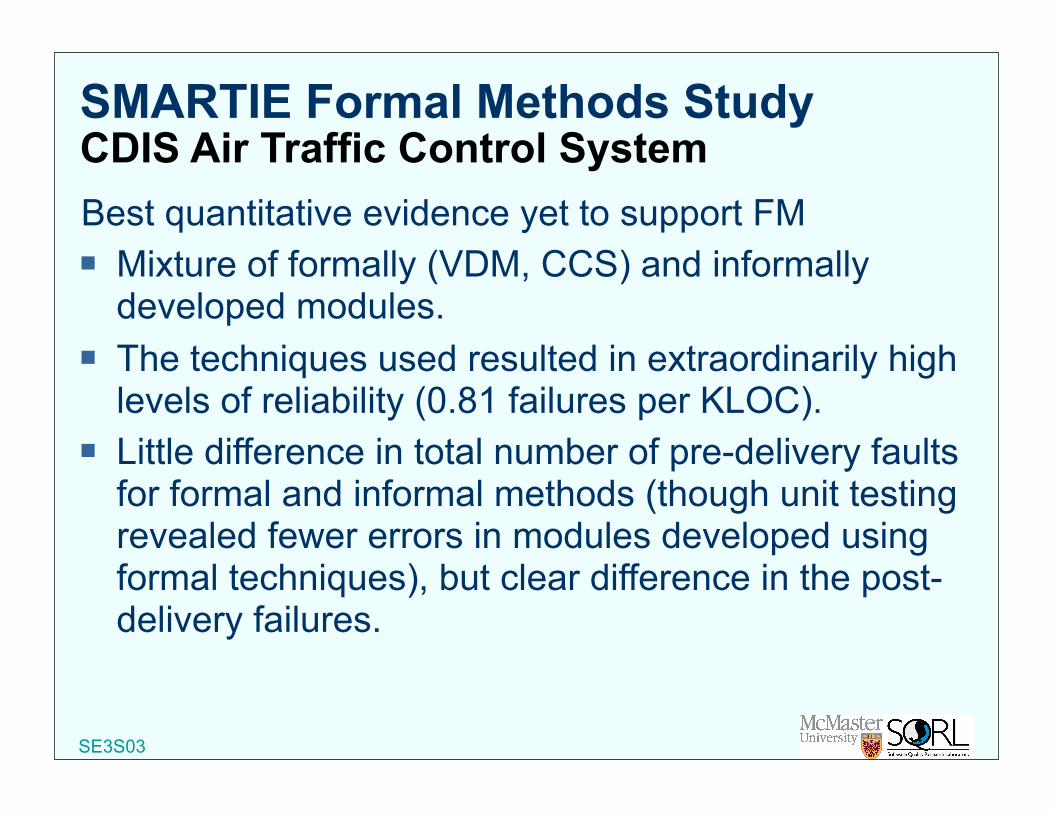
SMARTIE Formal Methods Study CDIS Air Traffic Control SystemBest quantitative evidence yet to support FM Mixture of formally (VDM, CCS) and informally
developed modules. The techniques used resulted in extraordinarily high
levels of reliability (0.81 failures per KLOC). Little difference in total number of pre-delivery faults
for formal and informal methods (though unit testing revealed fewer errors in modules developed using formal techniques), but clear difference in the post-delivery failures.

SE3S03
CDIS fault report form

SE3S03
Relative sizes and changes reported for each design type in delivered code
Design Type Total Linesof Delivered
Code
Number ofFault
Report-generated
CodeChanges inDelivered
Code
CodeChanges
perKLOC
Numberof
ModulesHavingThis
DesignType
TotalNumber
ofDeliveredModulesChanged
PercentDeliveredModulesChanged
FSM 19064 260 13.6 67 52 78%VDM 61061 1539 25.2 352 284 81%VDM/CCS 22201 202 9.1 82 57 70%Formal 102326 2001 19.6 501 393 78%Informal 78278 1644 21.0 469 335 71%

SE3S03
Code changes by design type for modules requiring many changes
Design Type TotalNumber
ofModulesChanged
Numberof
Moduleswith Over5 Changes
PerModule
Percent ofModulesChanged
Numberof
Moduleswith Over
10Changes
PerModule
Percentof
ModulesChanged
FSM 58 11 16% 8 12%VDM 284 89 25% 35 19%VDM/CCS 58 11 13% 3 4%Formal 400 111 22% 46 9%Informal 556 108 19% 31 7%

SE3S03
Changes Normalized by KLOC for Delivered Code by Design Type
0
1
2
3
4
5
6
7
8
9
10
0 2 4 6 8
Quarter of Year
Cha
nges
per
Qua
rter
/KLO
C FSM
Informal
VDM
VDM/CCS

SE3S03
Faults discovered during unit testing

SE3S03
Changes to delivered code as a result of post-delivery problems

SE3S03
Post-delivery problems discovered in each problem category

SE3S03
Post-delivery problem rates reported in the literature
Source Language Failures perKLOC
Formalmethodsused?
Siemens operating system Assembly 6-15 NoNAG scientific libraries Fortran 3.00 NoCDIS air traffic control support C .81 Yes
Lloyd’s language parser C 1.40 YesIBM cleanroom development Various 3.40 PartlyIBM normal development Various 30.0 NoSatellite planning study Fortran 6-16 NoUnisys communications software Ada 2-9 No

SE3S03
Efficacy of Formal Methods: Summary Little hard evidence to show that:
formal methods have been used cost-effectively on a major system
formal methods can deliver reliability more cost effectively than say, traditional structured methods with enhanced testing
developers can ever be trained in sufficient numbers to make proper use of formal methods
The case for form The case for formal methods on traditional
commercial applications is very weak Problems choosing between competing formal
methods

SE3S03
Part 5: Summary Very impressive claims are made for new methods No silver bullet Claims normally made by self-interested parties Almost no empirical evidence to support the claims Some fundamental beliefs by software engineering
experts have proved to be wrong Proper measurement based studies are the key to
objective methods evaluation

SE3S03 182
Part 6: SOFTWARE METRICS FOR RISK AND UNCERTAINTY

SE3S03 183
Part 6: Objectives Understand that classical size-driven metrics
approaches provide limited support for risk management and decision making
Learn an approach - Bayesian nets - that incorporates best of software metrics to provide true decision support for software risk management
Be able to work with simple Bayesian nets using tool support provided

SE3S03 184
The Classic size driven approach Since mid-1960’s LOC used as surrogate for
different notions of software size LOC used as driver in early resource prediction and
defect prediction models Drawbacks of LOC led to complexity metrics and
function points ...But approach to both defects prediction and
resource prediction remains ‘size’ driven

SE3S03 185
Predicting road fatalities
Month
Numberof
fatalities
Month
Weatherconditions
Roadconditions
Numberof
journeys
Numberof
fatalities
Averagespeed
Naïve model Causal/explanatory model

SE3S03 186
Predicting software effort
Size
Effort
ProblemComplexity
ScheduleResource
quality
ProductQuality
Effort
Naïve model Causal/explanatory model
Size

SE3S03 187
Typical software/systems assessment problem“Is this system sufficiently reliable to ship?”You might have:
Measurement data from testing Empirical data Process/resource information Proof of correctness ….None alone is sufficient So decisions inevitably involve expert judgement

SE3S03 188
What we really need for assessmentWe need to be able to incorporate: uncertainty diverse process and product information empirical evidence and expert judgement genuine cause and effect relationships incomplete information
We also want visibility of all assumptions

SE3S03
Bayesian Belief Nets (BBNs)
Powerful graphical framework in which to reason about uncertainty using diverse forms of evidence
Nodes of graph represent uncertain variables Arcs of graph represent causal or influential
relationships between the variables Associated with each node is a probability table
(NPT)
B
A
C
D
P(A |B,C)
P(B | C)P(C)
P(D)

SE3S03 190
Defects BBN (simplified)
Residual DefectsTesting Effort
Design Effort
Defects Detected
Defects IntroducedProblem Complexity
Operational defectsOperational usage

SE3S03
Bayes’ TheoremA: ‘Person has cancer’ p(A)=0.1 (prior)B: ‘Person is smoker’ p(B)=0.5
What is p(A|B)? (posterior)
p(B|A)=0. 8 (likelihood)PriorprobabilityLikelihoodPosterior
probability
So p(A|B)=0.16
p A Bp B A p A
p B( | )
( | ) ( )( )
=

SE3S03
Bayesian Propagation Applying Bayes theorem to update all probabilities
when new evidence is entered Intractable even for small BBNs Breakthrough in late 1980s - fast algorithm Tools like Hugin implement efficient propagation Propagation is multi-directional Make predictions even with missing/incomplete data

SE3S03 193
Classic approach to defect modelling
Solution/problem size/complexity
Resources/processquality
ComplexityFunctionality
Quality of staff, tools
Number ofdefects

SE3S03 194
Problems with classic defects modelling approach Fails to distinguish different notions of ‘defect’ Statistical approaches often flawed Size/complexity not causal factors Obvious causal factors not modelled Black box models hide crucial assumptions Cannot handle uncertainty Cannot be used for real risk assessment

SE3S03 195
Many defects pre-release, few after

SE3S03 196
Few defects pre-release, many after

SE3S03 197
Schematic of classic resource model
Solution/problem size
Resourcesquality
Solutionquality
Required durationRequired effort
ComplexityFunctionality
Quality of staff, tools
Required reliability
RequiredResources

SE3S03 198
Problems with classic approach to resource prediction Based on historical projects which happened to be
completed (but not necessarily successful) Obvious causal factors not modelled or modelled
incorrectly - solution size should never be a ‘driver’ Flawed assumption that resource levels are not
already fixed in some way before estimation (i.e. cannot handle realistic contraints)
Statistical approaches often flawed Black box models hide crucial assumptions Cannot handle uncertainty Cannot be used for real risk assessment

SE3S03 199
Classic approach cannot handle questions we really want to ask For a problem of this size, and given these limited
resources, how likely am I to achieve a product of suitable quality?
How much can I scale down the resources if I am prepared to put up with a product of specified lesser quality?
The model predicts that I need 4 people over 2 years to build a system of this kind of size. But I only have funding for 3 people over one year. If I cannot sacrifice quality, how good do the staff have to be to build the systems with the limited resources?

SE3S03 200
Schematic of ‘resources’ BBN
Problem size Solution size
Required resources
Appropriateness of actual
resources
Solutionquality
Problem size
Required durationRequired effort
Functionality
Proportion implemented
ComplexityFunctionality
Actual durationActual effort
Quality of staff, tools
Solution reliability

SE3S03 201
“Appropriateness of resources” Subnet
number_staff actual_duration
actual_effortrequired_duration
required_effort
appropriate_durationappropriate_effort
appropriate_resources

SE3S03 202
Specific values for problem size

SE3S03 203
Now we require high accuracy

SE3S03 204
Actual resources entered

SE3S03 205
Actual resource quality entered

SE3S03 206
Software defects and resource prediction summary Classical approaches:
Mainly regression-based black-box models Predicted_attribute = f(size) Crucial assumptions often hidden Obvious causal factors not modelled Cannot handle uncertainty Cannot be used for real risk assessment
BBNs provide realistic alternative approach
SE3S03 207
Conclusions: Benefits of BBNs Help risk assessment and decision making in a wide
range of applications Model cause-effect relationships, uncertainty Incorporate expert judgement Combine diverse types of information All assumptions visible and auditable Ability to forecast with missing data Rigorous, mathematical semantics Good tool support