Foothill Transit Battery Electric Bus Demonstration Results
60
NREL is a national laboratory of the U.S. Department of Energy Office of Energy Efficiency & Renewable Energy Operated by the Alliance for Sustainable Energy, LLC This report is available at no cost from the National Renewable Energy Laboratory (NREL) at www.nrel.gov/publications. Contract No. DE-AC36-08GO28308 Foothill Transit Battery Electric Bus Demonstration Results Leslie Eudy, Robert Prohaska, Kenneth Kelly, and Matthew Post National Renewable Energy Laboratory Technical Report NREL/TP-5400-65274 January 2016
-
Upload
duongtuyen -
Category
Documents
-
view
216 -
download
0
Transcript of Foothill Transit Battery Electric Bus Demonstration Results

NREL is a national laboratory of the U.S. Department of Energy Office of Energy Efficiency & Renewable Energy Operated by the Alliance for Sustainable Energy, LLC
This report is available at no cost from the National Renewable Energy Laboratory (NREL) at www.nrel.gov/publications.
Contract No. DE-AC36-08GO28308
Foothill Transit Battery Electric Bus Demonstration Results Leslie Eudy, Robert Prohaska, Kenneth Kelly, and Matthew Post National Renewable Energy Laboratory
Technical Report NREL/TP-5400-65274 January 2016

NREL is a national laboratory of the U.S. Department of Energy Office of Energy Efficiency & Renewable Energy Operated by the Alliance for Sustainable Energy, LLC
This report is available at no cost from the National Renewable Energy Laboratory (NREL) at www.nrel.gov/publications.
Contract No. DE-AC36-08GO28308
National Renewable Energy Laboratory 15013 Denver West Parkway Golden, CO 80401 303-275-3000 • www.nrel.gov
Foothill Transit Battery Electric Bus Demonstration Results
Leslie Eudy, Robert Prohaska, Kenneth Kelly, and Matthew Post National Renewable Energy Laboratory
Prepared under Task No. WW4K.1000
Technical Report NREL/TP-5400-65274 January 2016

NOTICE
This report was prepared as an account of work sponsored by an agency of the United States government. Neither the United States government nor any agency thereof, nor any of their employees, makes any warranty, express or implied, or assumes any legal liability or responsibility for the accuracy, completeness, or usefulness of any information, apparatus, product, or process disclosed, or represents that its use would not infringe privately owned rights. Reference herein to any specific commercial product, process, or service by trade name, trademark, manufacturer, or otherwise does not necessarily constitute or imply its endorsement, recommendation, or favoring by the United States government or any agency thereof. The views and opinions of authors expressed herein do not necessarily state or reflect those of the United States government or any agency thereof.
This report is available at no cost from the National Renewable Energy Laboratory (NREL) at www.nrel.gov/publications.
Available electronically at SciTech Connect http:/www.osti.gov/scitech
Available for a processing fee to U.S. Department of Energy and its contractors, in paper, from:
U.S. Department of Energy Office of Scientific and Technical Information P.O. Box 62 Oak Ridge, TN 37831-0062 OSTI http://www.osti.gov Phone: 865.576.8401 Fax: 865.576.5728 Email: [email protected]
Available for sale to the public, in paper, from: U.S. Department of Commerce National Technical Information Service 5301 Shawnee Road Alexandria, VA 22312 NTIS http://www.ntis.gov Phone: 800.553.6847 or 703.605.6000 Fax: 703.605.6900 Email: [email protected]
Cover Photos by Dennis Schroeder: (left to right) NREL 26173, NREL 18302, NREL 19758, NREL 29642, NREL 19795. Bus Photo by Leslie Eudy, NREL.
NREL prints on paper that contains recycled content.

iii This report is available at no cost from the National Renewable Energy Laboratory (NREL) at www.nrel.gov/publications.
Acknowledgments This evaluation at Foothill Transit would not have been possible without the support and cooperation of many people. The authors thank the following individuals:
California Air Resources Board Yachun Chow Jennifer Lee Craig Duehring
U.S. Department of Energy’s National Renewable Energy Laboratory Keith Wipke Jen Kurtz
Foothill Transit Roland Cordero TJ Nass Andrew Papson
Proterra Mike Finnern
Unless otherwise noted, all photos by L. Eudy, NREL

iv This report is available at no cost from the National Renewable Energy Laboratory (NREL) at www.nrel.gov/publications.
Acronyms and Abbreviations Ah amp-hours BEB battery electric bus CARB California Air Resources Board CNG compressed natural gas DGE diesel gallon equivalent DOE U.S. Department of Energy ESS energy storage system FCEB fuel cell electric bus ft feet FTA Federal Transit Administration GGE gasoline gallon equivalent GVWR gross vehicle weight rating hp horsepower HVAC heating, ventilation, and air conditioning in. inches kg kilograms kW kilowatts kWh kilowatt hours lb pounds MBRC miles between roadcalls mph miles per hour NREL National Renewable Energy Laboratory PMI preventive maintenance inspection psi pounds per square inch PTC Pomona Transit Center SI International System of Units SOC state of charge TIGGER Transit Investments for Greenhouse Gas and Energy
Reduction TRL technology readiness level ZBus zero emission bus

v This report is available at no cost from the National Renewable Energy Laboratory (NREL) at www.nrel.gov/publications.
Definition of Terms Availability: The number of days the buses are actually available compared to the days that the buses are planned for operation expressed as percent availability.
Clean point: For each evaluation, NREL works with the project partners to determine a starting point—or clean point—for the data analysis period. The clean point is chosen to avoid some of the early and expected operations problems with a new vehicle going into service, such as early maintenance campaigns. In some cases, reaching the clean point may require 3 to 6 months of operation before the evaluation can start.
Deadhead: The miles and hours that a vehicle travels when out of revenue service with no expectation of carrying revenue passengers. Deadhead includes leaving or returning to the garage or yard facility and changing routes.
Miles between roadcalls (MBRC): A measure of reliability calculated by dividing the number of miles traveled by the number of roadcalls. (Also known as mean distance between failures.) MBRC results in the report are categorized as follows:
• Bus MBRC: Includes all chargeable roadcalls. Includes propulsion-related issues as well as problems with bus-related systems such as brakes, suspension, steering, windows, doors, and tires.
• Propulsion-related MBRC: Includes roadcalls that are attributed to the propulsion system. Propulsion-related roadcalls can be caused by issues with the transmission, batteries, and electric drive.
• Energy storage system (ESS)-related MBRC: Includes roadcalls attributed to the energy storage system only.
Revenue service: The time when a vehicle is available to the general public with an expectation of carrying fare-paying passengers. Vehicles operated in a fare-free service are also considered revenue service.
Roadcall: A failure of an in-service bus that causes the bus to be replaced on route or causes a significant delay in schedule. The analysis includes chargeable roadcalls that affect the operation of the bus or may cause a safety hazard. Non-chargeable roadcalls can be passenger incidents that require the bus to be cleaned before going back into service, or problems with an accessory such as a farebox or radio.
vi This report is available at no cost from the National Renewable Energy Laboratory (NREL) at www.nrel.gov/publications.
Executive Summary In October 2010, Foothill Transit began a demonstration of three Proterra battery electric buses (BEBs) in its service area located in the San Gabriel and Pomona Valley region of Los Angeles County, California. The agency had a goal of evaluating the technology to determine if it could meet service requirements and was feasible for selected Foothill routes. The demonstration went well, and Foothill moved forward with an order of 12 next-generation BEBs. In March 2014, Foothill Transit began operating the new fleet in its service area. These electric buses, produced by Proterra, are 35-foot, composite body buses that are capable of being charged quickly on route.
Foothill Transit is collaborating with the California Air Resources Board (CARB) and the U.S. Department of Energy’s (DOE’s) National Renewable Energy Laboratory (NREL) to evaluate the buses in revenue service. NREL has been evaluating advanced technology buses under funding from DOE and the U.S. Department of Transportation’s Federal Transit Administration (FTA). The objectives of these evaluations are to provide comprehensive, unbiased evaluation results of advanced technology bus development and performance compared to conventional baseline vehicles.
CARB staff has been gathering data on zero-emission buses (ZBuses) to assess the status of the technology. The majority of ZBus data collected and reported to date are for fuel cell electric buses. CARB would like to have similar analysis and reporting for the other primary ZBus technology being adopted in the state of California, that is, BEBs. CARB has enlisted NREL to conduct a third-party evaluation of the Foothill Transit fleet.
In 2014, Foothill purchased 12 BEBs from Proterra through a $10.2 million grant under FTA’s Transit Investments for Greenhouse Gas and Energy Reduction (TIGGER) Program. Foothill’s project goal was to fully electrify one route in its service area—Line 291—and to investigate the feasibility of the technology for other routes. The buses are charged on route at a charging station built at a transit center mid-way along the route.
The focus of this evaluation is to compare performance of the BEBs to that of conventional technology and to track progress over time toward meeting performance targets. In the commercialization process that begins at technology readiness level (TRL) 1—basic research/concept—and ends at TRL 9—commercial deployment—NREL considers the BEBs to be at TRL 7. At this point of development, the manufacturers’ goals for the demonstration are to verify that the BEB performance meets the technical targets and identify any issues that need to be resolved. Selecting a comparable baseline bus for a project can be challenging, especially when evaluating a unique design such as the Proterra BEB. Foothill does not operate conventional buses that are similar in size, weight, and year to the BEBs, so an apples-to-apples comparison is not possible for some performance metrics. The primary baseline buses selected are eight new NABI compressed natural gas (CNG) buses of the same model year as the BEBs. Like the BEBs, the NABI CNG buses are under warranty and should have very low maintenance costs.
This report provides data on the buses from April 2014 through July 2015. The data period for the eight new NABI CNG buses used as a baseline comparison begins in October 2014 when the

vii This report is available at no cost from the National Renewable Energy Laboratory (NREL) at www.nrel.gov/publications.
buses were placed into service. Table ES-1 provides a summary of results for several categories of data presented in this report. From the start of the demonstration through July 2015, the BEBs have traveled more than 401,000 miles. This equates to an average of 33,437 miles per BEB during the data period.
Table ES-1. Summary of Evaluation Results
Data Item BEB CNG Number of buses 12 8 Data period 4/14–7/15 10/14–7/15 Number of months 16 10 Total mileage in period 401,244 364,373 Average total miles per bus 33,437 45,547 Average monthly mileage per bus 2,333 4,555 Total operating hours 47,462 — Availability (85% is target) 90 94 Fuel economy (kWh/mile or miles/GGEa) 2.15 4.04 Fuel economy (miles/DGEb) 17.48 4.51 Average speed (mph) 10.6 17.6 Miles between roadcalls (MBRC) – bus 9,331 45,547 MBRC – propulsion system only 25,078 91,093 MBRC – ESSc only 133,748 — Total maintenance ($/mile)d $0.16 $0.18 Maintenance – propulsion system only ($/mile) $0.02 $0.08
a Gasoline gallon equivalent. b Diesel gallon equivalent. c Energy storage system. d Work order maintenance cost.
The average monthly operating mileage for the BEBs for the evaluation period is 2,333 miles, which is about half that of the CNG buses. This is expected, considering that the BEBs are operated primarily on Line 291 and the CNG buses are randomly dispatched on all routes out of the Pomona Depot, including express and commuter routes, which have much higher average speeds. The results presented in this report are based on the planned route for the buses and do not indicate a specific limitation of the technology.
During the evaluation period, the average availability for the BEBs was 90% compared to 94% for the CNG baseline buses. The per-bus availability for the BEBs ranged from a high of 98% to a low of 62%. One specific bus experienced several issues that kept it out of service for extended periods of time. The majority of issues were for general bus problems—repair of accident damage and the air conditioning system—and not due to any advanced technology component. None of the other buses had an availability of less than 85%, which indicates that this bus could be considered an outlier. If this bus is removed from the data set, the overall fleet availability is 93%.
The BEBs had an overall average efficiency of 2.15 kWh per mile, which equates to 17.48 miles per diesel gallon equivalent (DGE). The CNG buses had an average fuel economy of 4.04 miles per gasoline gallon equivalent (GGE), which equates to 4.51 miles per DGE. These results indicate that the BEBs have an average fuel economy that is nearly 4 times higher than that of the CNG buses.

viii This report is available at no cost from the National Renewable Energy Laboratory (NREL) at www.nrel.gov/publications.
Reliability, measured as miles between roadcalls (MBRC), was high during the data period. The overall bus MBRC for the BEB fleet was more than 9,000. During the data period, there were only three roadcalls that were attributed to issues with the ESS, the primary power system for the buses. This resulted in an ESS-related MBRC of more than 133,000. This is exceptional for an advanced technology bus in the early stage of commercialization. The CNG baseline buses achieved an overall bus MBRC that was more than 45,000, which is expected of a new, fully commercial product.
In addition to analyzing the BEB performance, NREL provides a cost analysis and comparison. Maintenance costs for both the BEBs and CNG buses were low because they are under warranty. During the reporting period, the BEBs had a maintenance cost per mile that was slightly lower (11% less) than that of the CNG buses.
This project has also provided an opportunity for DOE to conduct a detailed evaluation of the BEBs and charging infrastructure. Under funding from DOE’s Vehicle Technologies Office, NREL’s Fleet Test and Evaluation team is collecting detailed data from the Foothill BEBs to assess vehicle and component performance and conduct detailed drive cycle analysis, as well as to build and refine vehicle models for further analysis. Proterra provided in-use raw vehicle data for this analysis including details on vehicle speed; GPS location; battery pack state of charge (SOC); battery pack current; battery pack voltage; inverter current; inverter voltage; motor heating, ventilating, and air conditioning (HVAC) status; and more. Additional analysis is still required to draw significant conclusions on the technology, but the findings to date include the following:
• The average energy efficiency is 2.15 kWh per mile over 399,663 miles of use.
• The average battery pack SOC is 75.4%, indicating a possibility for a usage window shift.
• The average runtime per day is 13.2 hours with an average of 13 charges per day. Each charge averages 20 kWh energy delivered.
• Accessory loads contribute to the overall range capability, as more than 50% of “system on” time is spent at a speed of 0 mph where lighting and HVAC loads are still required.
Foothill and Proterra report that the project went extremely well because they worked carefully up front to plan and execute the project. There have been many achievements for the demonstration, including:
• The project deployed 12 fast charge buses to fully electrify one route.
• The BEB fleet operated well, with no major issues due to the advanced-technology components. Bus-related components were the cause of the majority of issues.
• The on-route fast chargers operated reliably with minimal issues, none of which resulted in downtime for the buses.
Advanced technology demonstrations typically experience challenges and issues that need to be resolved. The challenges and lessons learned from the demonstration included bus-related problems as well as programmatic issues. One major challenge is addressing demand charges

ix This report is available at no cost from the National Renewable Energy Laboratory (NREL) at www.nrel.gov/publications.
and time of use charges that affect electricity cost. This will be a major challenge for any fleet looking to deploy electric buses that charge during peak times. The industry needs to work on a permanent solution for all BEB adopters to keep costs reasonable in the future. Another challenge is training operators and maintenance staff in the differences between BEBs and conventional buses. Foothill reports that there is still a lot of learning as the agency ramps up to a larger BEB fleet. The team needs to understand how service can transition to a higher number of buses.
x This report is available at no cost from the National Renewable Energy Laboratory (NREL) at www.nrel.gov/publications.
Table of Contents Introduction ................................................................................................................................................. 1
ZBus Demonstrations in California ........................................................................................................ 2 Fleet Profile—Foothill Transit Agency .................................................................................................. 2 Manufacturer Profile—Proterra .............................................................................................................. 3 Foothill Transit ZBus Project ................................................................................................................. 4
Advanced Technology Bus Development Process—Technology Readiness Levels .......................... 6 Bus Technology Descriptions ................................................................................................................... 8 Charging and Maintenance Facilities ...................................................................................................... 11
Fast-Charge Station .............................................................................................................................. 11 In-Service Operations Evaluation Results.............................................................................................. 14
Route Assignments ............................................................................................................................... 14 Bus Use and Availability ...................................................................................................................... 14 Energy Use, Fuel Economy, and Cost .................................................................................................. 18 Roadcall Analysis ................................................................................................................................. 21 Maintenance Analysis .......................................................................................................................... 23
Total Work Order Maintenance Costs ........................................................................................... 23 Work Order Maintenance Costs Categorized by System ............................................................... 26 Propulsion-Related Work Order Maintenance Costs ..................................................................... 27
Detailed Technology Evaluation Results ................................................................................................ 29 Detailed Data Collection Approach ...................................................................................................... 29 Results .................................................................................................................................................. 30 Detailed Analysis Summary Findings .................................................................................................. 35
Summary of Achievements and Challenges .......................................................................................... 36 Lessons Learned ................................................................................................................................... 37
What’s Next ................................................................................................................................................ 39 Future Analysis ..................................................................................................................................... 39
Contacts ..................................................................................................................................................... 40 References and Related Reports ............................................................................................................. 41 Appendix A: TRL Guideline Table ........................................................................................................... 42 Appendix B: Foothill Fleet Summary Statistics ..................................................................................... 43 Appendix C: Fleet Summary Statistics—SI Units .................................................................................. 49

1 This report is available at no cost from the National Renewable Energy Laboratory (NREL) at www.nrel.gov/publications.
Introduction In October 2010, Foothill Transit began a demonstration of three Proterra battery electric buses (BEBs) in its service area located in the San Gabriel and Pomona Valley region of Los Angeles County, California. The agency had a goal of evaluating the technology to determine if it could meet service requirements and was feasible for selected Foothill routes. The demonstration went well, and Foothill moved forward with an order of 12 next-generation BEBs. In March 2014, Foothill Transit began operating the new fleet in its service area. These electric buses, produced by Proterra, are 35-foot, composite body buses that are capable of being charged quickly on route.
Foothill Transit is collaborating with the California Air Resources Board (CARB) and the U.S. Department of Energy’s (DOE’s) National Renewable Energy Laboratory (NREL) to evaluate the buses in revenue service. NREL has been evaluating advanced technology buses under funding from DOE and the U.S. Department of Transportation’s Federal Transit Administration (FTA). The focus of these evaluations over the last 10 years has been fuel cell electric buses (FCEBs). NREL uses a standard data-collection and analysis protocol originally developed for DOE heavy-duty vehicle evaluations. The objectives of these evaluations are to provide comprehensive, unbiased evaluation results of advanced technology bus development and performance compared to conventional baseline vehicles.
CARB, primarily through evaluations conducted by NREL, has been monitoring the development progress of FCEBs being demonstrated in California and other parts of the United States. More recently, transit agencies have begun to demonstrate BEBs. The introduction of opportunity fast charging has addressed the early range issues that were a challenge for deployment of BEBs. CARB staff has been gathering data on zero-emission buses (ZBuses) to assess the status of the technologies. The majority of ZBus data collected and reported to date are for FCEBs. CARB would like to have similar analysis and reporting for the other primary ZBus technology being adopted in the state of California, that is, BEBs. CARB has enlisted NREL to conduct a third-party evaluation of the Foothill Transit fleet.
This project has also provided an opportunity for DOE to conduct a detailed evaluation of the BEBs and charging infrastructure. Under funding from DOE’s Vehicle Technologies Office, NREL’s Fleet Test and Evaluation team has evaluated electric and plug-in electric vehicles in a variety of medium- and heavy-duty applications. These evaluations involve collection of raw second-by-second data from the vehicles in service, including GPS location; battery pack state of charge (SOC); battery pack current; battery pack voltage; inverter current; inverter voltage; motor heating, ventilating, and air conditioning (HVAC) status; and more. The Fleet Test and Evaluation team is collecting these data from the Foothill BEBs to assess vehicle and component performance and conduct detailed drive cycle analysis, as well as to build and refine vehicle models for further analysis.
This report provides data on the buses from April 2014 through July 2015. Data are provided on a selection of compressed natural gas (CNG) buses as a baseline comparison. The early results of the detailed drive cycle and component analysis are summarized in the section “Detailed Technology Evaluation Results.” The team is still collecting data on the BEBs and charging equipment and plans to publish a report outlining all of the analysis results in the future.

2 This report is available at no cost from the National Renewable Energy Laboratory (NREL) at www.nrel.gov/publications.
ZBus Demonstrations in California CARB’s 2000 “Fleet Rule for Transit Agencies”1 has been the primary driver for demonstrations of advanced technology buses in the state of California. This rule set more stringent emission standards for new urban bus engines and promoted advances in the cleanest technologies, specifically ZBuses. The fleet rule required transit agencies to choose a compliance path—alternative fuel or diesel—for meeting emission standards. This selection determined the fuel type for new bus acquisitions through model year 2015. The alternative fuel path could include low-emission alternative fuels such as compressed or liquefied natural gas, propane, electricity, hydrogen, or another advanced technology (such as gasoline hybrid-electric). Agencies choosing the diesel path were required to reduce fleet average emissions through methods such as purchasing the cleanest diesel engines and retrofitting existing diesel engines with emission control devices (i.e., diesel particulate filters).
Under the rule, agencies with more than 200 buses must include ZBuses as 15% of new bus purchases. Agencies choosing the diesel path were scheduled to meet these requirements on a more accelerated timeline than those on the alternative fuel path. Diesel path fleets were also required to demonstrate the use of ZBus technology in revenue service. ZBus technologies that qualify for this regulation include electric propulsion (battery or trolley buses) and fuel cell propulsion. At the time of the original ruling, 11 agencies in the state had more than 200 buses. Of those agencies, five had selected the diesel path and were subject to the required ZBus demonstration. Those agencies selected fuel cell bus technology over BEBs, primarily because the state of electric bus technology at the time required overnight charging for a very limited range.
Since that time, development of higher-energy-capacity traction battery designs has improved significantly with the introduction of lithium-based batteries. The improved performance that lithium-based batteries provide resulted in a renewed interest in developing battery-only propulsion for full-sized transit buses. This new approach to battery-only propulsion includes opportunity charging of the batteries while the bus is out on route, usually at layover points in the route design. This on-route, fast-charge capability addresses many of the concerns over lower range and long charge times for BEBs. As a result, a number of transit agencies in California (and other areas of the United States) began purchasing small fleets of BEBs for demonstrations.
Fleet Profile—Foothill Transit Agency Foothill Transit serves a 327-square-mile area covering the San Gabriel and Pomona Valley region of Los Angeles County. Foothill’s administrative office is located in West Covina, California. Foothill Transit is governed by a Joint Powers Authority of 22 member cities and the County of Los Angeles with representation from the following areas:
Arcadia Azusa
Baldwin Park Bradbury
Claremont Covina
1 Fact Sheet: Fleet Rule for Transit Agencies: Urban Bus Requirements, California Air Resources Board, http://www.arb.ca.gov/msprog/bus/ub/ubfactsheet.pdf.

3 This report is available at no cost from the National Renewable Energy Laboratory (NREL) at www.nrel.gov/publications.
Diamond Bar Duarte
El Monte Glendora
Industry Irwindale
La Puente La Verne
Monrovia Pasadena
Pomona San Dimas
South El Monte Temple City
Walnut West Covina
Los Angeles County
Foothill operates 36 local and express routes including commuter runs to downtown Los Angeles. The current bus fleet consists of 315 CNG buses and 15 BEBs. Figure 1 shows the Foothill Transit service area.
Figure 1. Foothill Transit service area
The agency began a path to cleaner buses in 2002 by adding CNG buses to its fleet. The agency retired its last diesel bus in 2013, making the fleet 100% alternative fuel. Foothill Transit’s commitment to clean and efficient technologies has led the agency to initiate additional projects such as adding photovoltaic panels and making efficiency improvements to its facilities, installing a water-saving bus wash, and purchasing zero-emission BEBs.
Manufacturer Profile—Proterra Proterra was founded in 2004 in Golden, Colorado, with a goal of producing advanced technology heavy-duty vehicles that emit zero emissions and are domestically fueled. In 2006, Proterra was awarded a grant through FTA’s National Fuel Cell Bus Program to design, build,

4 This report is available at no cost from the National Renewable Energy Laboratory (NREL) at www.nrel.gov/publications.
and demonstrate a battery-dominant hybrid fuel cell bus. The company elected to use a 35-foot composite body to keep the weight down and maximize efficiency. Proterra’s propulsion system was based on an all-electric design with the capability to add a fuel cell power system as a range extender. Taking its all-electric concept one step further, Proterra added the capability for fast charging while on route. The capability to charge on route addressed the range issue, which was the biggest challenge for deployment of BEBs at the time. The National Fuel Cell Bus Program award helped Proterra acquire the start-up capital to begin manufacturing this electric bus.
Foothill Transit was Proterra’s first customer for its BEB design—the EcoRide. Foothill’s three-bus order was produced in Proterra’s Colorado facility. As orders for the BEB increased, Proterra set up an assembly line in a new facility in South Carolina to produce the bus more economically. In 2011, the company moved its entire operation to the Greenville, South Carolina, facility. Since that time, Proterra has produced 59 of its 35-foot EcoRide buses, which are in service in nine fleets in the United States.
Proterra’s next-generation design is a 40-foot, composite body electric bus called the Catalyst. This bus is available with a fast-charge energy storage system (ESS) or an extended range, in-depot charging system. Foothill will be the first customer for the extended range version of this design with an order of 13 buses. Foothill Transit has also ordered two Catalyst short range fast-charge models. As of September 2015, Proterra has orders for 50 of the Catalyst buses, which will bring the total number of Proterra BEBs in the United States to 109. Options on the current contracts add a potential 300 more Proterra BEBs to the overall number. Proterra is in the process of expanding and has added an office in the San Francisco Bay Area. The company was awarded a grant by the California Energy Commission in April 2015 to expand its manufacturing capability and is planning a second facility in the City of Industry, California.
Foothill Transit ZBus Project Foothill Transit’s first three BEBs—funded through an American Recovery and Reinvestment Act grant—were delivered in 2011 and were placed in service on Line 291. The demonstration team reviewed the different routes and selected Line 291 as the optimal route for the technology. Line 291 is a 16.1-mile route that travels between La Verne and Pomona with minimal deadhead distance from the Pomona depot. The line is heavily traveled and serves a transit dependent community. The route loops through the Pomona Transit Center (PTC) in both directions, making it an ideal location for the fast charger system. Over the next year, the agency worked with Proterra to evaluate the technology, determine if it could meet service requirements, and investigate the feasibility for other Foothill routes. The demonstration went well, and Proterra used the lessons learned by the team to make upgrades to the system. After this initial testing, Foothill moved forward with plans to procure additional BEBs.
In 2013, Foothill was awarded a $10.2 million grant through the second round of FTA’s Transit Investments for Greenhouse Gas and Energy Reduction (TIGGER) Program to acquire nine more fast-charge BEBs. The TIGGER Program made funds available for capital investments over a 3-year period from 2009 through 2011 that would reduce greenhouse gas emissions and/or lower the energy use of public transportation systems. Foothill replaced older CNG buses that had reached the end of useful life.

5 This report is available at no cost from the National Renewable Energy Laboratory (NREL) at www.nrel.gov/publications.
The Foothill TIGGER project goal was to fully electrify Line 291, which requires seven buses during peak hours. The agency adjusted the schedule to accommodate time for charging the buses. The schedule already included some layover time, so the primary adjustment was to allow for the 45 seconds it takes to dock the bus. Figure 2 shows the route map for Line 291. The additional buses would be used as spares to allow for maintenance downtime, and also as fill-in buses for other appropriate routes that go through the PTC, such as Line 855. By the time Foothill negotiated the final contract with Proterra, the per-bus cost had dropped, which enabled the agency to purchase 12 buses.
Figure 2. Route map for Line 291 (courtesy of Foothill Transit)

6 This report is available at no cost from the National Renewable Energy Laboratory (NREL) at www.nrel.gov/publications.
Advanced Technology Bus Development Process—Technology Readiness Levels In its 2012 annual status report on fuel cell electric buses,2 NREL introduced a guideline for assessing the technology readiness level (TRL) for FCEBs. This guideline was developed using a Technology Readiness Assessment Guide3 published by DOE in September 2011. Although the guideline was developed for FCEBs, the same basic concept applies to any advanced technology buses including BEBs. Figure 3 provides a graphic representation of the development process. (Appendix A provides the TRL guideline table tailored for advanced technology bus commercialization.) The guideline considers the bus as a whole and does not account for differing TRLs for separate components or sub-systems. Some sub-systems may include off-the-shelf components that are considered commercial, while other sub-systems may feature newly designed components at an earlier TRL.
Figure 3. Graphic representation of the commercialization process developed for FCEBs
BEB development is currently in the technology demonstration/commissioning phase that includes TRLs 6 through 8. This phase begins the iterative process to validate the design, analyze the results, and reconfigure or optimize the design as needed. The manufacturer typically works with a transit agency partner to conduct in-service tests on the bus. Updates to the design are made based on the performance results, and the buses go back into demonstration and through the cycle until the design meets the performance requirements. This can be a time-consuming process as manufacturers work through technical difficulties.
NREL considers the Proterra BEB to be at TRL 7 because the design of the bus is a next-generation version based on lessons learned with earlier models and the deployment includes the 12-bus Foothill fleet as well as numerous other fleets around the country. These buses represent a full-scale validation in a relevant environment. Proterra reports that its Catalyst bus is a 3rd-generation design that is considered to be at TRL 8.
2 Fuel Cell Buses in U.S. Transit Fleets: Current Status 2012, NREL/TP-5600-56406, http://www.nrel.gov/docs/fy13osti/56406.pdf. 3 DOE Technology Readiness Assessment Guide, G 143.3-4a, https://www.directives.doe.gov/directives/0413.3-EGuide-04a/view.

7 This report is available at no cost from the National Renewable Energy Laboratory (NREL) at www.nrel.gov/publications.
At this point in the development, BEBs are not fully commercial products. The manufacturers’ goals for the demonstration are to verify that the BEB performance meets the technical targets and identify any issues that need to be resolved. The capital costs for BEBs are currently higher than that of conventional technology, although the costs have dropped considerably over the last few years as orders for the buses have increased. The increase in orders allows the manufacturers to take advantage of economies of scale to reduce the production costs. Operating costs for BEBs are currently low because the buses are all under warranty and the original equipment manufacturers are handling much of the repair costs. Once these buses pass the warranty period and transit staff takes over the repair work, operating costs are expected to increase.
NREL’s goal in evaluating advanced technology buses is to document the performance and track progress over time toward meeting the technical targets. NREL collects data on conventional buses at each demonstration site for a baseline comparison. This is important primarily because fuel economy is highly dependent on duty cycle, but also because maintenance practices can be different from site to site. The best comparisons need to include buses operated in similar service at the same operating division. The most accurate comparison would be between buses of the same manufacturer, model, production year, and mileage. In that case, the only difference between the advanced technology and baseline buses would be the propulsion system. This type of baseline comparison is not always possible.
The Proterra BEBs at Foothill are 35-foot, composite body buses. This is a unique model for the transit industry, which makes it a challenge to find a comparable baseline bus. NREL has collected data on two groups of baseline buses at Foothill. The agency has a new fleet of 42-foot NABI CNG buses, and NREL is collecting data on a selection of these buses for comparison of reliability, availability, fuel economy, and maintenance cost. Foothill has also provided fueling data on a selection of older, 40-foot CNG buses for fuel economy comparisons.

8 This report is available at no cost from the National Renewable Energy Laboratory (NREL) at www.nrel.gov/publications.
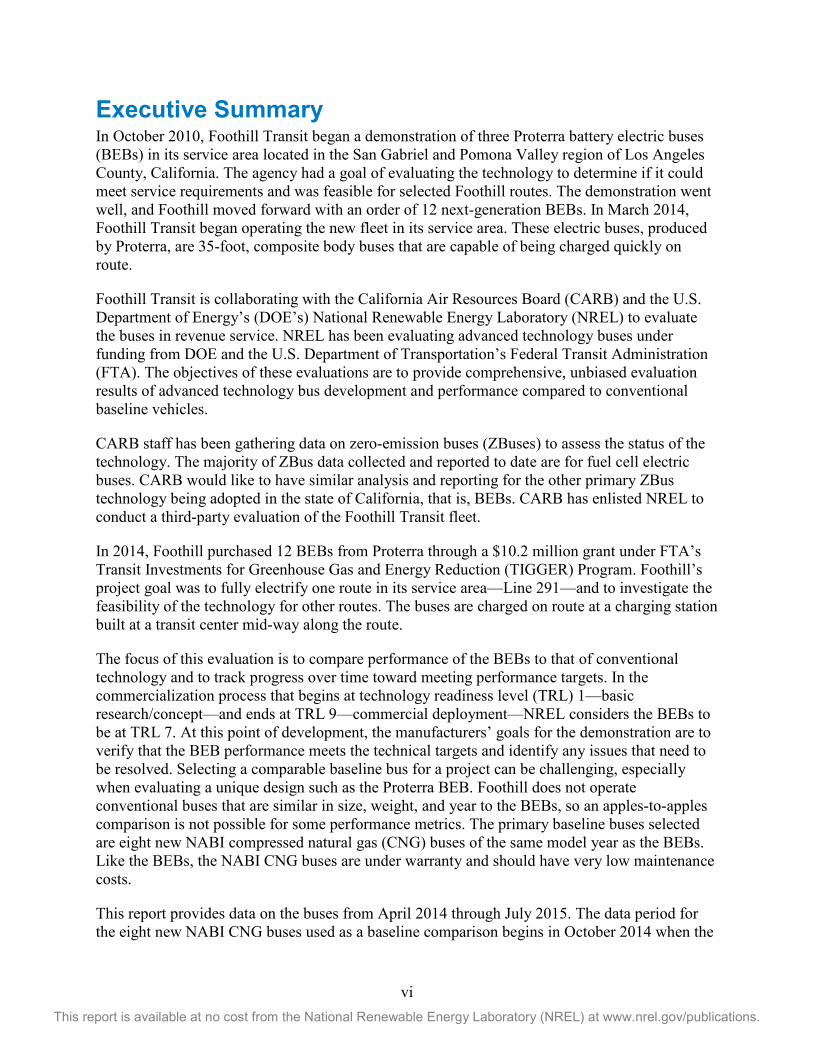
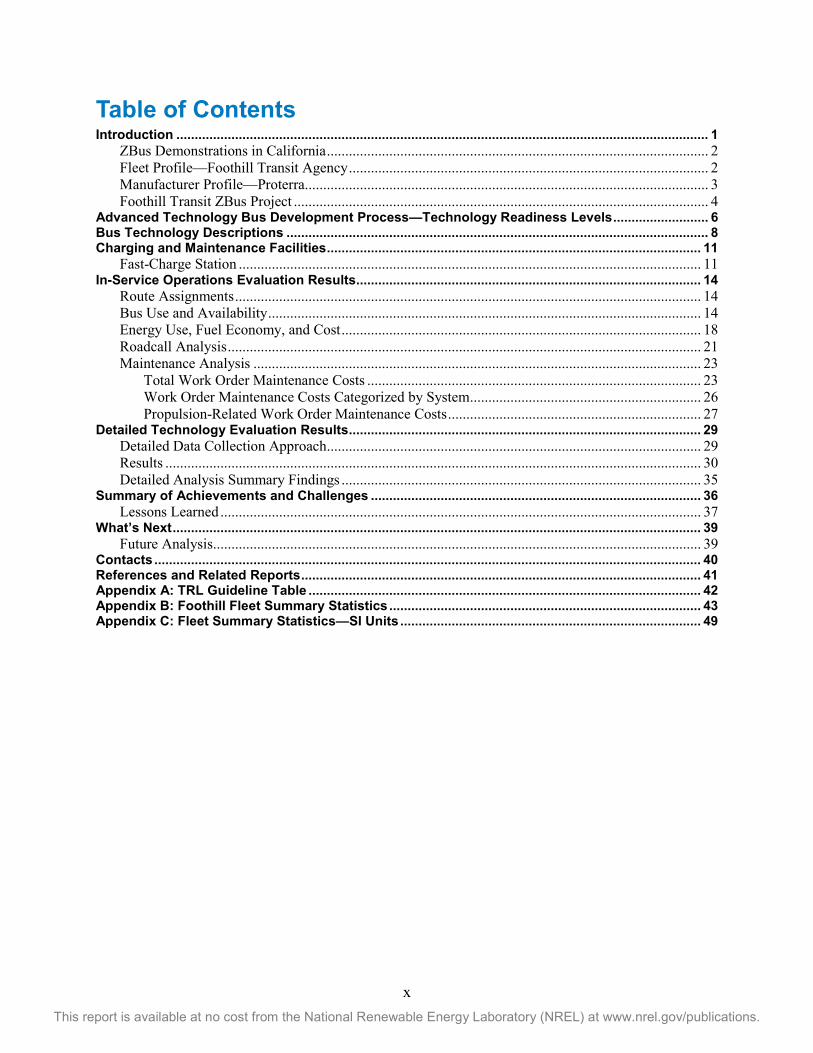
Bus Technology Descriptions The BEBs in service at Foothill (Figure 4) are 35-foot, composite body buses built by Proterra. As mentioned earlier, selecting a comparable baseline bus for a project can be challenging, especially when evaluating a unique design such as the Proterra BEB. Foothill does not operate conventional buses that are similar in size, weight, and year to the BEBs. The primary baseline buses selected are new NABI CNG buses of the same model year as the BEBs. Like the BEBs, the NABI CNG buses are under warranty and should have very low maintenance costs. The NABI CNG buses have Cummins engines with a three-way catalyst. Table 1 provides bus system descriptions for the BEB and CNG buses that were studied in this evaluation. Figure 5 shows one of the NABI CNG baseline buses. For efficiency and fuel economy comparisons, Foothill has also provided fueling data from a subset of 40-foot Orion CNG buses.
Table 1. Fuel Cell and CNG Bus System Descriptions
Vehicle System BEB CNG Number of buses 12 8 Bus manufacturer/model Proterra/BE35 NABI/BRT-07.03 Model year 2014 2014 Length/width/height 35 ft/102 in./129 in. 42 ft/102 in./137 in. GVWR/curb weight 37,320 lb/27,680 lb 42,540 lb/33,880 lb Wheelbase 237 in. 308 in.
Passenger capacity 35 seats, 2 wheelchair positions, 18 standees
38 seats, 2 wheelchair positions, 10 standees
Motor or engine Permanent magnet, UQM, PP220
CNG engine, Cummins, 8.9 ISL G
Rated power 220 kW peak (295 hp) 280 hp @ 2,200 rpm
Energy storage
Lithium-titanate batteries,
Altairnano, TerraVolt 368 V, 88 kWh total
energy
N/A
Accessories Electric Mechanical Emissions equipment None 3-way catalyst Transmission/retarder Regenerative braking N/A
Fuel capacity N/A 7 Type IV cylinders,
22,204 scf at 3,600 psi Bus purchase cost $904,490 $575,000
The warranty for the BEBs is included in the bus purchase cost and covers the following:
• Bumper to bumper – 2 years
• Powertrain subsystem – 5 years
• Major subsystems – 3 years
• Main structure – 12 years
• Battery warranty – 12 years.
9 This report is available at no cost from the National Renewable Energy Laboratory (NREL) at www.nrel.gov/publications.
Figure 4. Foothill Transit Proterra BEB
Figure 5. Foothill Transit NABI CNG bus
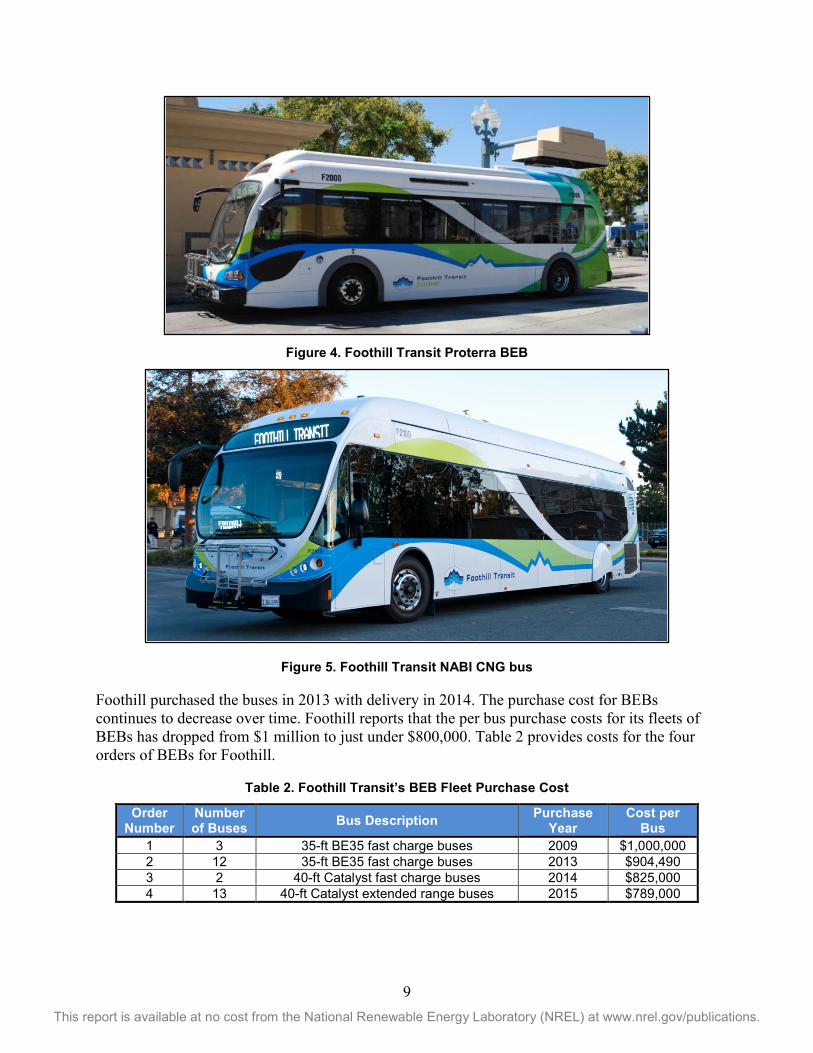
Foothill purchased the buses in 2013 with delivery in 2014. The purchase cost for BEBs continues to decrease over time. Foothill reports that the per bus purchase costs for its fleets of BEBs has dropped from $1 million to just under $800,000. Table 2 provides costs for the four orders of BEBs for Foothill.
Table 2. Foothill Transit’s BEB Fleet Purchase Cost
Order Number
Number of Buses Bus Description Purchase
Year Cost per
Bus 1 3 35-ft BE35 fast charge buses 2009 $1,000,000 2 12 35-ft BE35 fast charge buses 2013 $904,490 3 2 40-ft Catalyst fast charge buses 2014 $825,000 4 13 40-ft Catalyst extended range buses 2015 $789,000

10 This report is available at no cost from the National Renewable Energy Laboratory (NREL) at www.nrel.gov/publications.
The most recent order was eligible for the California Hybrid and Zero-Emission Truck and Bus Voucher Incentive Project (HVIP).4 The HVIP was designed to speed up the market introduction of clean technologies in the state by providing funds to help offset the incremental cost. Incentives through the program bring Foothill’s cost for the most recent order down to $689,000 per bus.
4 For more information see the HVIP website at https://www.californiahvip.org/.
11 This report is available at no cost from the National Renewable Energy Laboratory (NREL) at www.nrel.gov/publications.
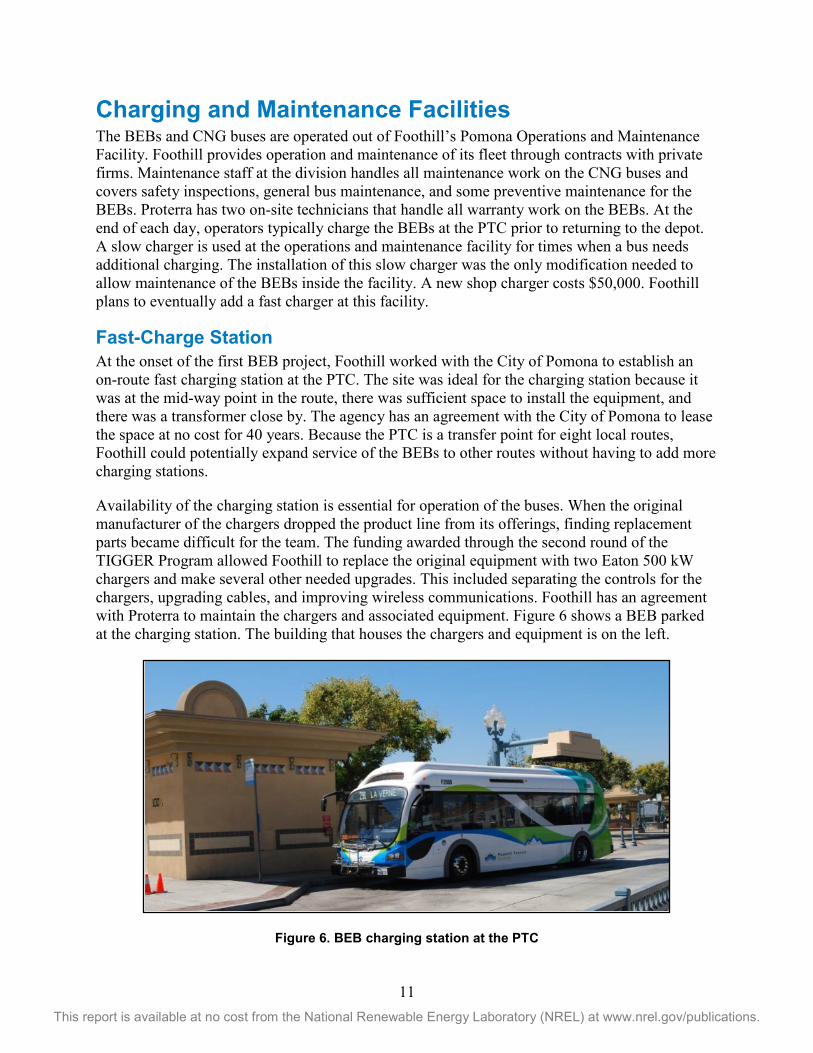
Charging and Maintenance Facilities The BEBs and CNG buses are operated out of Foothill’s Pomona Operations and Maintenance Facility. Foothill provides operation and maintenance of its fleet through contracts with private firms. Maintenance staff at the division handles all maintenance work on the CNG buses and covers safety inspections, general bus maintenance, and some preventive maintenance for the BEBs. Proterra has two on-site technicians that handle all warranty work on the BEBs. At the end of each day, operators typically charge the BEBs at the PTC prior to returning to the depot. A slow charger is used at the operations and maintenance facility for times when a bus needs additional charging. The installation of this slow charger was the only modification needed to allow maintenance of the BEBs inside the facility. A new shop charger costs $50,000. Foothill plans to eventually add a fast charger at this facility.
Fast-Charge Station At the onset of the first BEB project, Foothill worked with the City of Pomona to establish an on-route fast charging station at the PTC. The site was ideal for the charging station because it was at the mid-way point in the route, there was sufficient space to install the equipment, and there was a transformer close by. The agency has an agreement with the City of Pomona to lease the space at no cost for 40 years. Because the PTC is a transfer point for eight local routes, Foothill could potentially expand service of the BEBs to other routes without having to add more charging stations.
Availability of the charging station is essential for operation of the buses. When the original manufacturer of the chargers dropped the product line from its offerings, finding replacement parts became difficult for the team. The funding awarded through the second round of the TIGGER Program allowed Foothill to replace the original equipment with two Eaton 500 kW chargers and make several other needed upgrades. This included separating the controls for the chargers, upgrading cables, and improving wireless communications. Foothill has an agreement with Proterra to maintain the chargers and associated equipment. Figure 6 shows a BEB parked at the charging station. The building that houses the chargers and equipment is on the left.
Figure 6. BEB charging station at the PTC

12 This report is available at no cost from the National Renewable Energy Laboratory (NREL) at www.nrel.gov/publications.
The Foothill charging station is different from other deployments of Proterra BEBs because it has two chargers at one station. Both chargers are housed in the same climate-controlled building with charge heads positioned on either side. The two chargers operate as separate units with a dedicated control system for each. A common communication network serves both units with sensors to detect which charge head a bus is approaching to enable proper bus-to-charger communication for docking. Emergency shut-off switches for each charge head are located on either side of the building. Figure 7 shows one of the charging heads and an emergency shut-off switch.
Figure 7. A charging head (left) and an emergency shut-off control (right) at the PTC
The system can charge two buses simultaneously. Docking a bus with the charging head occurs semi-autonomously. The operator does not have to exit the bus to make any connections. The docking process works as follows:
• The charger’s wireless communication is automatically established as a bus approaches.
• Sensors on the bus and charger detect the presence and location of a bus.
• At approximately 10 feet from the charger, the bus speed is automatically limited. The driver only has to steer the bus just as they would approaching any normal bus stop.
• As the bus passes under the charger it automatically comes to a stop and the charge head lowers to the roof of the bus.
• The bus moves forward automatically to seat the charge head with the charging connection on the roof of the bus.

13 This report is available at no cost from the National Renewable Energy Laboratory (NREL) at www.nrel.gov/publications.
• The driver sets the parking brake to start the charging process. At this time, there are numerous automatic safety checks performed by the system before any current begins to flow.
• Passengers can get on and off the bus as they normally would.
• After the batteries are fully charged, the connecting arms automatically retract.
The system is designed to fully charge a bus in under 10 minutes. For Foothill’s Line 291, typical charge times are around 5 minutes. Foothill built a layover time into the schedule to allow enough time for charging. Figure 8 shows an up-close photo of one of the Foothill BEBs docked with the charging head.
Figure 8. A Foothill BEB docked with the fast charger at the PTC
Costs for the chargers and installation continue to drop. Installation costs will vary from site to site depending on a number of factors including the distance to a transformer. The total cost for the new charging station being installed at the Azuza park and ride was $998,000. The installation includes two 500-kW fast chargers at $349,000 each. The cost to install the chargers was $300,000.

14 This report is available at no cost from the National Renewable Energy Laboratory (NREL) at www.nrel.gov/publications.
In-Service Operations Evaluation Results Foothill Transit put the first of the 12 buses in service in March of 2014. The remaining buses were phased into service over the following 4 months. The results presented in this section are focused on data from April 2014 through July 2015. During that data period, the BEBs operated 401,244 miles over 47,462 hours of operation. This indicates an overall operational speed of 8.4 mph. The NABI CNG buses were delivered in late summer of 2014 and went into service around late September/early October 2014. The data period for the CNG buses begins in October 2014.
Route Assignments Foothill Transit’s BEB fleet operates out of its Pomona Division. The service consists of 21 routes: 12 local and 9 commuter/express routes. The BEB fleet is operated primarily on Line 291. Based on Foothill’s schedule for the division, in-service speed for that route is 10.6 mph. An analysis of the route from detailed GPS data is included in the next section of the report. The BEBs are also operated on Line 855 on most mornings. That route runs through the PTC where the charger is located. The BEBs are not operated on Line 855 during the afternoons because those route blocks include service on commuter routes, which is beyond the current range of the buses. The CNG baseline buses are randomly dispatched on all of the routes out of the division including commuter routes. Average in-service speed for the Pomona Division as a whole is 17.6 mph.
Bus Use and Availability Bus use and availability are indicators of reliability. Lower bus usage may indicate downtime for maintenance or purposeful reduction of planned work for the buses. This section summarizes bus usage and availability for the BEBs and baseline buses.
Table 3 summarizes the average monthly mileage for the BEB and CNG baseline buses for the data period. The average monthly operating mileage for the BEBs for the evaluation period is 2,333 miles, which is about half that of the CNG buses. This is expected, considering that the BEBs are operated primarily on Line 291 and the CNG buses are randomly dispatched on all routes out of the Pomona Depot, including express and commuter routes, which have much higher average speeds. The results presented in this report are based on the planned route for the buses and do not indicate a specific limitation of the technology. Figure 9 tracks the monthly average miles for the BEBs and CNG buses for the data period. The CNG buses were phased into service starting in October 2014.

15 This report is available at no cost from the National Renewable Energy Laboratory (NREL) at www.nrel.gov/publications.
Table 3. Average Monthly Mileage (Evaluation Period)
Bus Total Mileage Months
Average Monthly Mileage
BEB Fleet 2004 37,502 16 2,344 2005 37,866 16 2,367 2006 40,532 16 2,533 2007 32,241 13 2,480 2008 32,743 14 2,339 2009 37,052 14 2,647 2010 39,171 14 2,798 2011 28,920 14 2,066 2012 34,998 14 2,500 2013 17,243 14 1,232 2014 31,944 13 2,457 2015 31,032 14 2,217
BEB Total 401,244 172 2,333 CNG Fleet
2200 38,971 10 3,897 2201 46,891 10 4,689 2202 43,657 10 4,366 2203 47,439 10 4,744 2204 46,773 10 4,677 2205 46,605 10 4,661 2206 46,763 10 4,676 2207 47,274 10 4,727
CNG Total 364,373 80 4,555
Figure 9. Monthly average miles for the Foothill BEBs and CNG buses
0
1,000
2,000
3,000
4,000
5,000
6,000
Mon
thly
Ave
rage
Mile
s
BEB CNG

16 This report is available at no cost from the National Renewable Energy Laboratory (NREL) at www.nrel.gov/publications.
Another measure of reliability is availability—the percentage of days the buses are actually available out of days that the buses are planned for operation. The data presented are based on availability for morning pull-out and don’t necessarily reflect all-day availability. Transit agencies typically have a target of 85% availability for their fleets to allow for time to handle scheduled and unscheduled maintenance. For the Foothill fleet, the buses are planned to operate every day, including weekends. To calculate availability, NREL collected data from several sources. One source was the daily service reports that Proterra provides to Foothill. These reports list the availability of each BEB for that day and outline any reasons for unavailability. Foothill provided approximately 88% of the daily service reports, which is considered to be a sufficient sample size to be representative of the total. Foothill also provided the daily garage activity sheets for the Pomona Depot, which list each bus that is not available for morning pull-out and provide a general reason for unavailability. These activity sheets are for the depot as a whole and include the BEBs as well as the CNG buses. This was the only source of availability data for the CNG buses. The garage activity sheets were not available for every day. During the early data period, only 37% of the activity sheets were provided; for the later months of the period (4/15–7/15), 84% of the activity sheets were provided. Because these are new conventional technology buses, the availability is expected to be high.
Table 4 summarizes the availability for the BEBs during the data period. The per-bus availability ranges from a high of 98% to a low of 62%. The overall average for the group is 90%. One specific BEB (2013) experienced several issues that kept it out of service for extended periods of time. The majority of issues were for general bus problems—repair of accident damage and the air conditioning system—and not due to any advanced technology component. Difficulties in getting parts for the air conditioning system resulted in longer downtimes than necessary had the parts been readily available. None of the other buses had an availability of less than 85%, which indicates this bus could be considered an outlier. If this bus is removed from the data set, the overall fleet availability is 93%.
Table 4. Summary of Availability by Bus for the BEBs
Bus Planned Days
Available Days
Percent Availability
2004 427 416 97 2005 429 380 89 2006 429 407 95 2007 354 322 91 2008 377 337 89 2009 377 369 98 2010 377 347 92 2011 370 348 94 2012 370 349 94 2013 370 230 62 2014 354 305 86 2015 366 334 91
Total BEB 4,600 4,144 90 adjusted (w/o 2013) 4,230 3,914 93

17 This report is available at no cost from the National Renewable Energy Laboratory (NREL) at www.nrel.gov/publications.
Figure 10 tracks the monthly availability for the BEBs (dark blue line) and CNG buses (green line) for the data period. The adjusted average availability for the BEBs without 2013 is also shown in the graph (light blue line) to indicate how the extended downtime for that one bus affected the data. The figure also provides an indication of the reasons for unavailability. The stacked bars for each month show the number of days the BEBs were not available by five categories. The majority of issues causing downtime for the buses were related to bus systems. The availability of the CNG buses dropped significantly during the last 2 months of the data period. One of the baseline buses was involved in an accident and has been out of service for major body work.
Figure 10. Availability for the BEBs and CNG buses
Table 5 summarizes the reasons for unavailability for the BEBs and CNG buses. During this reporting period, the average availability was 90% for the BEBs and 94% for the CNG buses. Bus-related maintenance is the reason for the highest percentage of unavailability for the BEBs and CNG buses. Figure 11 presents the overall reasons for unavailability for the BEBs in a pie chart.
0
10
20
30
40
50
60
70
80
90
100
0%
10%
20%
30%
40%
50%
60%
70%
80%
90%
100%
Apr-1
4
May
-14
Jun-
14
Jul-1
4
Aug-
14
Sep-
14
Oct
-14
Nov
-14
Dec
-14
Jan-
15
Feb-
15
Mar
-15
Apr-1
5
May
-15
Jun-
15
Jul-1
5
Num
ber o
f day
s
Avai
labi
lity
ESS
ChargingissuesElectric drive
PM
Bus
BEB
CNG
Target
w/o 2013
Reasons for Unavailability

18 This report is available at no cost from the National Renewable Energy Laboratory (NREL) at www.nrel.gov/publications.
Table 5. Summary of Availability and Unavailability of Buses for Service
Category BEB # Days
BEB %
CNG # Days
CNG %
Planned work days 4,600 1,360 Days available 4,144 90 1,283 94 Unavailable 456 77 ESS 40 9 — — CNG engine — — 5 6 Electric drive 101 22 — — Charging issues 6 1 — — Preventive maintenance 8 2 12 16 General bus maintenance 301 66 54 70 Transmission 0 0 6 8
Figure 11. Reasons for unavailability for the Foothill BEBs
Energy Use, Fuel Economy, and Cost The BEBs are typically charged each time the bus stops at the PTC. Figure 12 shows the total energy used and number of charges for the BEB fleet by month. The figure shows the ramp-up in use of the fleet as the buses were delivered and placed into service. Once all of the buses were in service (July 2014), the fleet averaged 61,174 kWh and 3,131 charges per month.
Proterra records and stores data—including total kWh, number of charges, and miles driven—on each of the buses. These data were provided to NREL for calculating efficiency of the buses in kWh per mile. Foothill’s CNG buses are typically fueled once each day. Foothill provided individual fueling records for the CNG buses. CNG is typically tracked in units of gasoline gallon equivalent (GGE). NREL used these records to calculate the CNG fuel economy in miles per GGE as well as miles per diesel gallon equivalent (DGE). To compare the BEBs to the baseline buses, NREL converted the kWh to DGE using a conversion factor of 37.7 kWh/gallon. The explanation of the energy conversion from kWh of electricity to DGE appears at the end of Appendix B. (Appendices B and C contain summary statistics for the BEB and CNG buses.)
Bus66%
PM2%
Electric drive22%
Charging issues
1%
ESS9%

19 This report is available at no cost from the National Renewable Energy Laboratory (NREL) at www.nrel.gov/publications.
Figure 12. Monthly energy use and number of charges for the BEB fleet
Table 6 shows electricity and CNG fuel consumption and fuel economy for the study buses during the reporting period. The BEBs had an overall average efficiency of 2.15 kWh per mile, which equates to 17.48 miles per DGE. The CNG buses have an average fuel economy that is 4.04 miles per GGE, which equates to 4.51 miles per DGE. These results indicate that the BEBs have an average fuel economy that is nearly 4 times higher than that of the CNG buses.
0
500
1,000
1,500
2,000
2,500
3,000
3,500
4,000
0
10,000
20,000
30,000
40,000
50,000
60,000
70,000
80,000
Num
ber o
f Cha
rges
Ener
gy u
sed
(kW
h)
Energy use kWh Number of charges

20 This report is available at no cost from the National Renewable Energy Laboratory (NREL) at www.nrel.gov/publications.
Table 6. Energy Use and Fuel Economy (Evaluation Period)
Bus Mileage (fuel base)
Energy (kWh) or
CNG (GGE)
kWh per Mile or
Miles per GGE
Diesel Equivalent Amount (Gallon)
Miles per Gallon (DGE)
BEB Fleet 2004 37,502 80,818 2.16 2,146 17.47 2005 37,866 82,451 2.18 2,190 17.29 2006 40,532 86,822 2.14 2,306 17.58 2007 32,241 70,386 2.18 1,869 17.25 2008 32,743 71,473 2.18 1,898 17.25 2009 37,052 79,184 2.14 2,103 17.62 2010 39,171 81,101 2.07 2,154 18.19 2011 28,920 60,815 2.10 1,615 17.91 2012 34,998 75,647 2.16 2,009 17.42 2013 17,243 36,398 2.11 967 17.84 2014 31,944 67,492 2.11 1,792 17.82 2015 31,032 71,999 2.32 1,912 16.23
BEB Total 401,244 864,586 2.15 22,959 17.48 CNG Fleet
2200 31,407 7,785 4.03 6,967 4.51 2201 39,567 9,816 4.03 8,785 4.50 2202 34,540 8,189 4.22 7,329 4.71 2203 36,537 9,631 3.79 8,620 4.24 2204 36,591 9,200 3.98 8,234 4.44 2205 37,894 9,360 4.05 8,377 4.52 2206 36,342 8,915 4.08 7,979 4.55 2207 41,655 10,083 4.13 9,024 4.62
CNG Total 294,533 72,979 4.04 65,315 4.51
Figure 13 shows monthly average fuel economy for the BEBs and CNG buses in miles per DGE. The monthly average high temperature is included in the graph to track any seasonal variations in the fuel economy due to heating or cooling of the bus, which might require additional energy use. The fuel economy for the 40-foot Orion bus fleet is also included for comparison. The average fuel economy for the Orion fleet is 4.4 miles per DGE, which is not significantly different from the NABI 45-foot CNG buses.

21 This report is available at no cost from the National Renewable Energy Laboratory (NREL) at www.nrel.gov/publications.
Figure 13. Monthly average fuel economy for the BEBs and CNG buses (evaluation period)
Foothill’s charging station was installed with a separate utility meter. Foothill provided the monthly utility bills to NREL to determine the energy cost. During the evaluation period, the electricity cost averaged $0.18 per kWh. The electricity cost for the fleet calculates to $0.39 per mile. The CNG fuel cost during the reporting period averaged $0.93 per GGE, which calculates to $0.23 per mile for the NABI CNG buses.
Roadcall Analysis A roadcall or revenue vehicle system failure (as named in the National Transit Database5) is defined as a failure of an in-service bus that causes the bus to be replaced on route or causes a significant delay in schedule.6 If the problem with the bus can be repaired during a layover and the schedule is kept, this is not considered a roadcall. The analysis described here includes only roadcalls that were caused by “chargeable” failures. Chargeable roadcalls include systems that can physically disable the bus from operating on route, such as interlocks (doors, air system), engine, or things that are deemed to be safety issues if operation of the bus continues. They do not include roadcalls for things such as problems with radios, fareboxes, or destination signs.
The transit industry measures reliability as mean distance between failures, also documented as miles between roadcalls (MBRC). Table 7 provides the MBRC for the BEBs and CNG buses categorized by bus roadcalls, propulsion-related roadcalls, and ESS-related roadcalls. 5 National Transit Database website: www.ntdprogram.gov/ntdprogram/. 6 AC Transit defines a significant delay as 6 or more minutes.
10
20
30
40
50
60
70
80
90
100
0
2
4
6
8
10
12
14
16
18
20
Aver
age
Hig
h Te
mpe
ratu
re (F
)
Fuel
Eco
nom
y (m
pDG
E)
BEB (35-ft) CNG (Orion, 40-ft) CNG (NABI, 42-ft) Avg High Temp (F)

22 This report is available at no cost from the National Renewable Energy Laboratory (NREL) at www.nrel.gov/publications.
Propulsion-related roadcalls include all roadcalls due to propulsion-related systems including the battery system (or engine for a conventional bus), electric drive, fuel, exhaust, air intake, cooling, non-lighting electrical, and transmission systems. The ESS-related roadcalls and MBRC are included for the BEBs.
Table 7. Roadcalls and MBRC (Evaluation Period)
BEB CNG Dates 4/14–7/15 10/14–7/15 Mileage 401,244 364,373 Average miles accumulated per bus 33,437 45,547 Bus roadcalls 43 8 Bus MBRC 9,331 45,547 Propulsion-related roadcalls 16 4 Propulsion-related MBRC 25,078 91,093 ESS-related roadcalls 3 ESS-related MBRC 133,748
Figure 14 presents the cumulative MBRC by category for the BEBs and CNG baseline buses. DOE and FTA have not established performance targets specific to electric drive buses. The MBRC targets for FCEBs were based on typical conventional buses and could be considered appropriate for any advanced technology. The ultimate target for bus MBRC (4,000) is included in the figure as a black dotted line. The ultimate target for fuel-cell-system-related MBRC is 20,000. This is considered comparable to roadcalls for BEBs that are related to the battery, or ESS. This is shown in the figure as a dashed red line designated ESS MBRC Target. At this stage of demonstration, the Foothill BEBs have achieved an ESS MBRC that is significantly higher than the target.
Figure 14. Cumulative MBRC for the BEBs and CNG buses
0
50,000
100,000
150,000
200,000
250,000
Jul-14 Aug-14 Sep-14 Oct-14 Nov-14 Dec-14 Jan-15 Feb-15 Mar-15 Apr-15 May-15 Jun-15 Jul-15
Mile
s B
etw
een
Roa
dcal
l
BEB Bus MBRC
BEB Propulsion MBRC
BEB Battery MBRC
CNG Bus MBRC
CNG Propulsion MBRC
Bus MBRC Target
ESS MBRC Target

23 This report is available at no cost from the National Renewable Energy Laboratory (NREL) at www.nrel.gov/publications.
Maintenance Analysis All work orders for the study buses were collected and analyzed for this evaluation. For consistency, the maintenance labor rate was kept at a constant $50 per hour; this does not reflect an average rate for Foothill Transit. Costs for accident-related repair, which are extremely variable from bus to bus, were eliminated from the analysis. This section first covers total maintenance costs and then maintenance costs by bus system. Warranty costs are not included in the cost-per-mile calculations. All of the buses are currently under warranty.
At the beginning of the project, all maintenance on the BEBs was performed by Proterra technicians. In January 2015, the Foothill contractor staff took over the preventive maintenance inspections (PMI) and general bus work. Because of this, the work orders provided on the BEBs cover a different time period than the overall evaluation period. To calculate maintenance cost per mile, NREL used the mileage accumulated from January 2015 through July 2015.
Total Work Order Maintenance Costs Total maintenance costs include the price of parts and labor rates at $50 per hour. Cost per mile is calculated as follows:
Cost per mile = [(labor hours * 50) + parts cost] / mileage
Table 8 shows total maintenance costs for the BEBs and CNG buses. Scheduled and unscheduled maintenance cost per mile is provided for each bus and study group of buses.
During the reporting period, the BEBs had a maintenance cost per mile that was slightly lower (11% less) than that of the CNG buses.

24 This report is available at no cost from the National Renewable Energy Laboratory (NREL) at www.nrel.gov/publications.
Table 8. Total Work Order Maintenance Costs (Evaluation Period)
Bus Mileage Parts ($) Labor Hours
Total Cost per Mile
($)
Scheduled Cost per Mile ($)
Unscheduled Cost per Mile
($) BEB Fleet
2004 16,191 $1,124.69 45.0 $0.21 $0.09 $0.12 2005 16,581 $1,262.52 63.5 $0.27 $0.07 $0.20 2006 18,916 $405.35 53.7 $0.16 $0.08 $0.09 2007 19,120 $1,447.90 50.5 $0.21 $0.10 $0.11 2008 17,817 $788.72 32.7 $0.14 $0.06 $0.08 2009 18,254 $495.90 37.5 $0.13 $0.08 $0.05 2010 18,630 $1,621.40 33.8 $0.18 $0.06 $0.12 2011 15,881 $0.00 35.5 $0.11 $0.09 $0.02 2012 18,330 $394.36 37.7 $0.12 $0.08 $0.05 2013 11,409 $11.00 35.5 $0.16 $0.11 $0.05 2014 17,321 $12.36 26.0 $0.08 $0.06 $0.02 2015 16,591 $1,780.52 31.0 $0.20 $0.06 $0.14
Total BEB 205,041 $9,344.72 482.4 $0.16 $0.08 $0.09 CNG Fleet
2200 38,971 $2,747.20 67.5 $0.16 $0.12 $0.04 2201 46,891 $5,354.20 94.9 $0.22 $0.18 $0.04 2202 43,657 $4,426.53 108.3 $0.23 $0.16 $0.07 2203 47,439 $3,771.99 85.5 $0.17 $0.14 $0.03 2204 46,773 $4,826.42 93.5 $0.20 $0.15 $0.06 2205 46,605 $3,932.59 81.8 $0.17 $0.15 $0.02 2206 46,763 $4,442.17 90.3 $0.19 $0.14 $0.05 2207 47,274 $3,260.65 57.8 $0.13 $0.09 $0.04
Total CNG 364,373 $32,761.73 679.5 $0.18 $0.14 $0.04
The monthly scheduled and unscheduled maintenance cost per mile for the BEBs is shown in Figure 15. The average monthly odometer is included on the graph. Figure 16 provides the same information for the CNG buses. Scheduled maintenance for the BEBs was fairly consistent over the data period. The higher unscheduled maintenance during May and June was primarily due to tire replacement on four buses and low-voltage battery replacement on three buses. Foothill reports that the tire damage is not typical of its fleet. A broken curb at one of the stops on Line 291 has resulted in tire and fender damage as drivers stop to pick up passengers. Monthly scheduled and unscheduled maintenance costs for the CNG buses are generally consistent until July 2015, when all eight buses reached the mileage for a major PMI.

25 This report is available at no cost from the National Renewable Energy Laboratory (NREL) at www.nrel.gov/publications.
Figure 15. Monthly scheduled and unscheduled maintenance costs per mile for the BEBs
Figure 16. Monthly scheduled and unscheduled maintenance costs per mile for the CNG buses
0
10,000
20,000
30,000
40,000
50,000
60,000
$0.00
$0.10
$0.20
$0.30
$0.40
$0.50
$0.60
$0.70
Aver
age
odom
eter
Cos
t per
Mile
Unscheduled Scheduled Average odometer
0
10,000
20,000
30,000
40,000
50,000
60,000
$0.00
$0.10
$0.20
$0.30
$0.40
$0.50
$0.60
$0.70
Aver
age
odom
eter
Cos
t per
Mile
Unscheduled Scheduled Average odometer

26 This report is available at no cost from the National Renewable Energy Laboratory (NREL) at www.nrel.gov/publications.
Work Order Maintenance Costs Categorized by System Table 9 shows maintenance costs by vehicle system and bus study group (without warranty costs). The vehicle systems shown in the table are as follows:
• Cab, body, and accessories: Includes body, glass, and paint repairs following accidents; cab and sheet metal repairs on seats and doors; and accessory repairs such as hubodometers and radios
• Propulsion-related systems: Repairs for exhaust, fuel, engine, electric motors, battery modules, propulsion control, non-lighting electrical (charging, cranking, and ignition), air intake, cooling, and transmission
• PMI: Labor for inspections during preventive maintenance
• Brakes
• Frame, steering, and suspension
• HVAC
• Lighting
• Air system, general
• Axles, wheels, and drive shaft
• Tires.
Table 9. Work Order Maintenance Cost per Mile by System (Evaluation Period)
System
BEB CNG Cost per Mile ($)
Percent of Total
(%)
Cost per Mile ($)
Percent of Total
(%)
Propulsion-related 0.02 13 0.08 42 Cab, body, and accessories 0.03 17 0.02 10 PMI 0.07 44 0.06 33 Brakes 0.00 0 0.00 0 Frame, steering, and suspension 0.00 0 0.00 0 HVAC 0.00 0 0.00 2 Lighting 0.00 0 0.00 0 Air, general 0.00 0 0.02 9 Axles, wheels, and drive shaft 0.00 2 0.00 1 Tires 0.04 24 0.01 3 Total 0.16 100 0.18 100
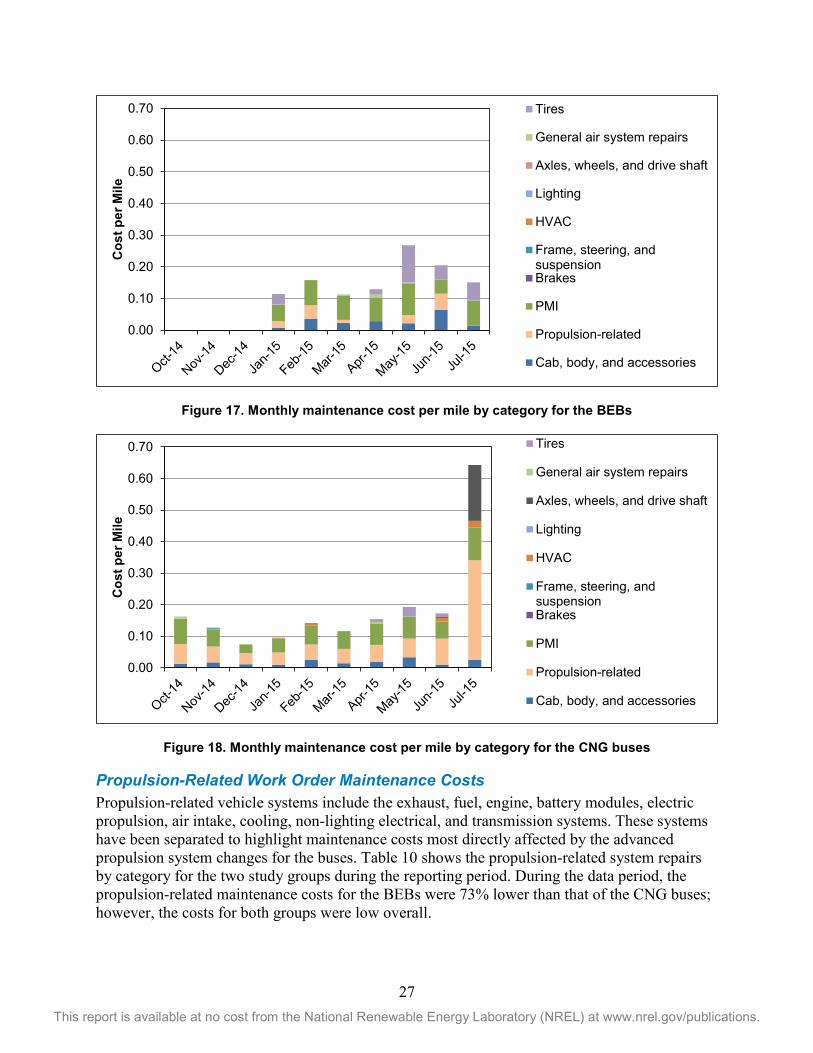
The systems with the highest percentage of maintenance costs for the BEBs were PMI; cab, body, and accessories; and propulsion-related. For the NABI CNG buses the systems with the highest percentage of maintenance costs were propulsion-related; PMI; and cab, body, and accessories. Figure 17 shows the monthly maintenance cost per mile by category for the BEBs. Figure 18 presents the same data for the CNG buses.
27 This report is available at no cost from the National Renewable Energy Laboratory (NREL) at www.nrel.gov/publications.
Figure 17. Monthly maintenance cost per mile by category for the BEBs
Figure 18. Monthly maintenance cost per mile by category for the CNG buses
Propulsion-Related Work Order Maintenance Costs Propulsion-related vehicle systems include the exhaust, fuel, engine, battery modules, electric propulsion, air intake, cooling, non-lighting electrical, and transmission systems. These systems have been separated to highlight maintenance costs most directly affected by the advanced propulsion system changes for the buses. Table 10 shows the propulsion-related system repairs by category for the two study groups during the reporting period. During the data period, the propulsion-related maintenance costs for the BEBs were 73% lower than that of the CNG buses; however, the costs for both groups were low overall.
0.00
0.10
0.20
0.30
0.40
0.50
0.60
0.70C
ost p
er M
ileTires
General air system repairs
Axles, wheels, and drive shaft
Lighting
HVAC
Frame, steering, andsuspensionBrakes
PMI
Propulsion-related
Cab, body, and accessories
0.00
0.10
0.20
0.30
0.40
0.50
0.60
0.70
Cos
t per
Mile
Tires
General air system repairs
Axles, wheels, and drive shaft
Lighting
HVAC
Frame, steering, andsuspensionBrakes
PMI
Propulsion-related
Cab, body, and accessories

28 This report is available at no cost from the National Renewable Energy Laboratory (NREL) at www.nrel.gov/publications.
Table 10. Propulsion-Related Work Order Maintenance Costs by System (Evaluation Period)
Maintenance System Maintenance Costs BEB CNG Total mileage 205,041 364,373 Average miles per bus 17,087 45,546
Total propulsion-related systems (roll-up)
Parts cost ($) 2,421.01 23,240.22 Labor hours 37.0 94.8 Total cost ($) 4,271.01 27,977.72 Total cost ($) per mile 0.02 0.08
Exhaust system repairs
Parts cost ($) 0.00 0.00 Labor hours 0.0 0.0 Total cost ($) 0.00 0.00 Total cost ($) per mile 0.00 0.00
Fuel system repairs
Parts cost ($) 0.00 64.68 Labor hours 0.0 6.5 Total cost ($) 0.00 389.68 Total cost ($) per mile 0.00 0.00
Power plant system repairs (battery system or CNG engine)
Parts cost ($) 0.00 15,590.27 Labor hours 10.5 25.5 Total cost ($) 525.00 16,865.27 Total cost ($) per mile 0.00 0.05
Electric motor and propulsion system repairs
Parts cost ($) 0.00 0.00 Labor hours 1.5 0.0 Total cost ($) 75.00 0.00 Total cost ($) per mile 0.00 0.00
Non-lighting electrical system repairs (general electrical, charging, cranking, ignition)
Parts cost ($) 2,421.01 1,158.84 Labor hours 24.5 29.0 Total cost ($) 3,646.01 2,608.84 Total cost ($) per mile 0.02 0.01
Air intake system repairs
Parts cost ($) 0.00 4,427.07 Labor hours 0.0 0.8 Total cost ($) 0.00 4,464.57 Total cost ($) per mile 0.00 0.01
Cooling system repairs
Parts cost ($) 0.00 1,810.22 Labor hours 0.0 24.5 Total cost ($) 0.00 3,035.22 Total cost ($) per mile 0.00 0.01
Transmission system repairs
Parts cost ($) 0.00 189.15 Labor hours 0.5 5.0 Total cost ($) 25.00 439.15 Total cost ($) per mile 0.00 0.00
Hydraulic system repairs
Parts cost ($) 0.00 0.00 Labor hours 0.0 3.5 Total cost ($) 0.00 175.00 Total cost ($) per mile 0.00 0.00

29 This report is available at no cost from the National Renewable Energy Laboratory (NREL) at www.nrel.gov/publications.
Detailed Technology Evaluation Results NREL’s Fleet Test and Evaluation team has found medium-duty and heavy-duty vehicle fleets to be good candidates for deploying low-emitting advanced technologies due to their large numbers, high vehicle miles traveled—and consequent high petroleum fuel consumption and emissions—and frequent operation in large population centers, as well as common return-to-base fueling regimes and consistent driving routes.
Previous testing and analysis conducted by NREL have illustrated the influence of drive cycle and vehicle usage on both energy consumption (from liquid fuels and high-voltage hybrid battery packs) and exhaust (or well-to-wheels) emissions. Drive cycle has also been shown to influence the all-electric range of battery electric vehicles, the charge-depleting range of plug-in hybrid electric vehicles, and the potential fuel economy benefit of hybrid electric vehicles. Accordingly, fleet customers can benefit from a further understanding of advanced vehicle technology deployment to minimize fuel consumption and emissions. Large-scale deployments of electric vehicles in a localized area can lead to power quality and power cost issues due to increased peak demand.
Under DOE funding, NREL’s Fleet Test and Evaluation team partnered with Proterra to perform a detailed performance evaluation of its BEBs in use at Foothill Transit. Proterra provided the in-use raw vehicle data for this analysis as Proterra collects and maintains detailed (2 Hz) data for monitoring and development work.
These data will be used to understand the overall usage and effectiveness of the BEBs in transit fleet operations and will be compared to operations of conventional counterparts in the same location. Through this collaboration with Proterra, NREL hopes to provide a more focused investigation to understand the implementation and performance of BEBs.
Detailed Data Collection Approach Data were received electronically from Proterra via a secure File Transfer Protocol site starting in the summer of 2015. A total of 774 days of operational data were provided for 12 buses during the following four periods throughout the year (to account for any seasonal variation).
• July–August 2014
• October–November 2014
• January–February 2015
• April–May 2015.
Data channels include details on vehicle speed; GPS location; battery pack SOC; battery pack current; battery pack voltage; inverter current; inverter voltage; motor HVAC status; and more. These data are being used to assess vehicle and component performance; conduct detailed drive cycle analysis; and build and refine vehicle models for further analysis.
Battery lifetime uncertainty is a major barrier to fleet manager decisions regarding the adoption of electric vehicles of all types. To reduce lifetime uncertainty, NREL and Proterra are

30 This report is available at no cost from the National Renewable Energy Laboratory (NREL) at www.nrel.gov/publications.
developing a study to perform benchmarking tests of Proterra’s BE35 battery packs at regular stages throughout their life.
Proterra is currently finalizing its in-field battery pack health test procedure, which will be used on every vehicle at least every 12 months and at every individual customer facility at least once per quarter. NREL will perform an independent test to validate this procedure, and then Proterra will provide the results of the in-field testing from the Foothill Transit buses.
The battery health benchmarking test results will provide valuable in-use data. These data will allow NREL to better quantify battery pack health and track battery performance changes over a lifetime as well as validate battery life assumptions to help develop a fleet business case.
Results Initial analysis was performed on the location-based data to ensure data integrity and to better understand the operation of the BEBs on an electrified route. Figure 19 shows the GPS data for Foothill Transit Line 291 with the fast charger located approximately in the middle at the PTC. This route consists of two loops, a 9.3-mile northern loop and a 6.8-mile southern loop, for a total distance of 16.1 miles.
Figure 19. Foothill Transit Line 291 route shown with GPS data
The location of the fast charger stations at the PTC can be seen in Figure 20 as green traces of bus activity pulling into the charging station.

31 This report is available at no cost from the National Renewable Energy Laboratory (NREL) at www.nrel.gov/publications.
Figure 20. Fast charger location on Foothill Transit’s Line 291
NREL used its Drive-Cycle Rapid Investigation, Visualization, and Evaluation Analysis (DRIVE) tool to calculate preliminary drive cycle statistics for all 774 driving days. These drive cycle statistics are provided in Table 11.
Table 11. Foothill Transit Daily Drive Cycle Statistics
Daily Average Foothill Transit Average speed (including idle time) (mph) 8.42 Average driving speed (mph) 17.66 Kinetic intensity (1/mi) 2.75 Stops per mile 3.70 Number of stops per day 444 Distance traveled (miles) 119.30 Daily hours of operation (hours) 13.9 total / 6.72 driving Acceleration (ft/s2) 1.44 Deceleration (ft/s2) −1.81 Percent of total time charging 5.56%
Additional drive cycle metrics were also calculated for the Foothill Transit data set as well as for the existing NREL Fleet DNA mass transit data set. Figure 21 shows the kinetic intensity vs. average driving speed for these two data sets as well as for four standard chassis dynamometer test cycles. Kinetic intensity is a measure of drive cycle kinetics to define how much ‘stop and go’ is in a drive cycle; it is derived from the ratio of aerodynamic speed and characteristic

32 This report is available at no cost from the National Renewable Energy Laboratory (NREL) at www.nrel.gov/publications.
acceleration.7 Drive cycles with higher kinetic intensity, with lots of ‘stop and go’ events, offer more opportunities for regenerative braking energy recapture through hybridization or electrification, while drive cycles with higher steady state speeds, and lower kinetic intensity are more likely to benefit from aerodynamic improvements.
Figure 21. Kinetic intensity shown as a function of average driving speed for all Foothill Transit data (purple) and all Fleet DNA mass transit data (blue) compared to select standard chassis
dynamometer test cycles
When comparing the Foothill Transit data set to the existing Fleet DNA mass transit database, one can see that on average the Foothill Transit buses stop more frequently and, as shown in Figure 22, have a more consistent (tightly clustered) pattern on a per-mile basis than the other vehicles do.
7 M. O’Keefe, A. Simpson, K. Kelly, and D. Pedersen, “Duty cycle characterization and evaluation towards heavy hybrid vehicle applications,” SAE Technical Paper 2007-01-0302, 2007. doi:10.4271/2007-01-0302. http://www.nrel.gov/docs/gen/fy07/40929.pdf.

33 This report is available at no cost from the National Renewable Energy Laboratory (NREL) at www.nrel.gov/publications.
Figure 22. Kinetic intensity as a function of daily average stops per mile for both the Fleet DNA mass transit database and the Foothill Transit BEBs
Further investigation into the operation of these BEBs confirms that these buses not only stop quite often when on route, they also spend very little time at the fast charging stations while their battery packs are recharged. Figure 23 shows a single 16.1-mile loop on Line 291 with three separate charging events. The green line shows the cumulative distance for the day. Between charges, the battery pack SOC fluctuates between approximately 30% and 80%.
Figure 23. Vehicle speed, distance, and battery pack SOC shown for one full “loop” on Line 291

34 This report is available at no cost from the National Renewable Energy Laboratory (NREL) at www.nrel.gov/publications.
Figure 24 shows a histogram of the average battery pack SOC. For the majority of the time the battery pack is between 60% and 90% SOC with a mean of 75.4% and a standard deviation of 11.3%. This indicates there may be an opportunity to shift the usage window to a lower SOC on average to help prolong battery pack life.
Figure 24. Average battery pack SOC for all vehicles sampled at 2 Hz
More detailed analysis will be performed on power electronics and accessory loads in the future. Figure 25 shows an example of a bus heater cycling on and off while stationary, allowing for isolation of this 8.3-kW load.
Figure 25. Auxiliary load analysis example showing the power impact of the resistive element heater during stationary use

35 This report is available at no cost from the National Renewable Energy Laboratory (NREL) at www.nrel.gov/publications.
Figure 26 shows a “heat map” illustrating the relationship between calculated battery power and vehicle speed. In this figure, positive power represents charging or regenerative braking, and negative power is power being drawn from the pack. There are two areas of interest in this figure. The first is at zero speed where there is a concentration of power going into the pack. The second is at 20 mph, which shows a higher concentration of regeneration braking energy into the pack during at what appears to be the downshifting sequence where the transmission holds speed for a brief amount of time while the shift occurs.
Figure 26. Heat map showing the distribution of battery power as a function of vehicle speed (positive power indicates energy into the pack)
Detailed Analysis Summary Findings Additional analysis is still required to draw significant conclusions about the technology, but the findings to date include the following:
• The average energy efficiency is 2.15 kWh per mile over 399,663 miles of use.
• The average battery pack SOC is equal to 75.4%, indicating a possibility for a usage window shift.
• The average runtime per day is 13.2 hours with an average of 13 charges per day. Each charge averages 20 kWh energy delivered.
• Accessory loads contribute to the overall range capability, as more than 50% of “system on” time is spent at a speed of 0 mph where lighting and HVAC loads are still required.

36 This report is available at no cost from the National Renewable Energy Laboratory (NREL) at www.nrel.gov/publications.
Summary of Achievements and Challenges This section focuses on the achievements and challenges of Foothill Transit and its partners in implementing BEBs into the fleet. As with all new technology development, there have been many lessons learned that can be used by other agencies considering BEB technology. There have been many achievements for the demonstration, including the following:
• The project deployed 12 fast-charge buses to fully electrify one route. The selected route, Line 291, is considered an optimal route for the technology.
• The BEB fleet operated well, accumulating more than 401,000 miles (through July 2015).
• There were no major issues with the advanced technology components. Bus-related components were the cause of the majority of issues.
• To date, the BEBs have proved very reliable. Bus MBRC for the data period was more than 9,000; propulsion-related MBRC was more than 25,000.
• The on-route fast chargers operated reliably with minimal issues, none of which resulted in downtime for the buses.
• The project team took a proactive approach to technical problems, capturing issues in the early stages and implementing long-term solutions.
Advanced technology demonstrations typically experience challenges and issues that need to be resolved. The challenges and lessons learned from the demonstration included bus-related problems as well as programmatic issues. The remainder of this section summarizes the primary issues that affected the demonstration as a whole, beginning with the programmatic issues followed by the technical issues.
Electricity cost/demand charges—One major challenge for Foothill is addressing demand charges that increase electricity cost. Foothill is subject to tiered rates, depending on use, and demand charges. Anticipating this issue when the first BEB demonstration began, Foothill negotiated a waiver for demand charges from its utility provider (Edison). With an increase from 3 to 15 BEBs, the utility will not renew the waiver when it expires at the end of 2015. Foothill is working with Edison on a new agreement to set a reasonable rate charge. This will be a major challenge for any fleet looking to deploy electric buses that charge during peak times. The industry needs to work on a permanent solution for all BEB adopters to keep costs reasonable in the future.
Training drivers for docking the BEBs at the chargers—Operator training was a challenge because the procedure for docking with the charger is very different from the process of driving conventional buses. During the docking procedure, the operator needs to apply the accelerator instead of the brake, which is the opposite of the process for pulling up to a stop with a CNG or other conventional bus. The project team recommends providing thorough and ongoing driver training for new technology buses.
Evolution of technology and components—The project partners have experienced issues similar to other advanced technologies where manufacturers change or components are modified or discontinued. When the original supplier for the charger dropped the product from its line, the
37 This report is available at no cost from the National Renewable Energy Laboratory (NREL) at www.nrel.gov/publications.
team was forced to find another supplier. This increased the overall project costs and had the potential to disrupt service of the buses while the installation was being completed.
Emergency stop button activation—One issue that occurred in the early stages of the project was with the emergency stop button at the charging station. Occasionally someone would push the button, disabling the charger. This required someone at the site to physically reset the system. To discourage this situation, Foothill added a cover over the button and a sign to indicate the area was under surveillance. This has been successful so far in deterring troublemakers from activating the emergency stop. The team also made modifications so the site can be reset remotely to avoid having to send staff to the site.
Tire and body damage—Tire damage from a cracked curb at one of the stops on Line 291 resulted in unexpected repair costs. Since the buses went into service, Foothill has replaced 19 tires at a parts cost of more than $6,700 and 25 labor hours. In some cases, the fenders were also damaged. The agency has reported the issue to local officials and requested that the curb be repaired to prevent future problems.
HVAC issues—The BEBs developed a few issues with the HVAC system, primarily due to refrigerant leaks. On one bus, the HVAC compressor failed. This bus experienced extended downtime for the repair because of parts supply issues and because the replacement compressors also failed.
Traction motor inverter—A few buses experienced issues with inverter failure due to poor cooling distribution. Proterra increased the coolant flow through the inverter to address the issue. This modification was rolled out to the entire fleet of buses at Foothill as well as other locations.
Starter battery issues—The low-voltage starter batteries on several of the buses had to be replaced during the data period. The primary cause was considered a driver training issue. Operators would fail to shut the bus down at the end of a shift, likely because they could not hear it running. After several occurrences, the batteries would need to be replaced.
Battery system updates—As part of the battery management system, a local monitoring unit is connected to each module to track battery conditions. Several buses in the fleet experienced failure of this system that was traced to the low-voltage connection between the local monitoring unit and the battery module. Proterra replaced the wires for all the local monitoring unit/module connections.
Parts availability issues—As with other advanced technology buses, the project partners have experienced issues with availability of parts. The majority of issues were with components from outside suppliers, such as the HVAC compressor.
Lessons Learned Foothill and Proterra report that the project went extremely well because they worked carefully up front to plan and execute the project. This included engaging local officials early on to work through any issues with siting the charging station. Officials with the City of Pomona were supportive of the project and cooperated on the charger installation at the PTC. The team has

38 This report is available at no cost from the National Renewable Energy Laboratory (NREL) at www.nrel.gov/publications.
identified several key lessons learned during the early implementation that could be helpful for other transit agencies considering electric bus technology.
• Plan ahead to determine what organizations need to be engaged in the early stage of implementation. Key stakeholders can include utilities, local city officials, first responders, and the general public.
• Review potential routes and consider the ones that best fit how BEBs operate.
• Adjust route schedules to accommodate BEB charging time; this is part of the transition from conventional technology buses to electric buses. The starting point for a route also may need to be adjusted depending on the location of the charging station(s).
Foothill reports that there is still a lot of learning as the agency ramps up to a larger BEB fleet. The team needs to understand how service can transition to a higher number of buses. Charger availability is imperative for successful deployment.

39 This report is available at no cost from the National Renewable Energy Laboratory (NREL) at www.nrel.gov/publications.
What’s Next Foothill Transit will continue operating the 12 BEBs on Line 291 and is evaluating other routes that might be well suited for electric buses. The agency has orders for Proterra’s new Catalyst 40-foot BEB. The first two will be fast-charge buses, followed by 13 of the Catalyst XR extended range model BEBs.
Foothill is looking at potential routes for the 40-foot buses. The agency plans to operate the buses on Line 286, a 22-mile round trip. Foothill is also building a new transit center with a park and ride in partnership with the LA Metro Gold Line. The transit center will include two chargers, which will expand the number of routes that the BEBs could operate on.
Future Analysis NREL plans to continue the in-service performance evaluation for another year and expects to publish a second report in late 2016. The data available from Foothill and Proterra align well with the NREL data collection protocol. Using the data provided, NREL is able to analyze all of the key performance metrics in comparison to conventional technology. NREL does not typically collect data on warranty repairs for the buses. These repairs are covered by the manufacturer and are part of the purchase price of the bus. It could be beneficial to collect these data to give an indication of the future maintenance costs of the buses.
In continuation of the DOE-funded Fleet Test and Evaluation project, NREL will deploy vehicle data loggers on CNG buses operating on a variety of routes to collect in-use operational data on baseline buses. These data will allow researchers to characterize the different routes and drive cycles as well as compare the operational performance of the CNG buses. Additionally NREL has created a power-based vehicle model for the Proterra BE35 that will be used to evaluate the feasibility of operating electric buses on additional routes.
NREL is also very interested in performing chassis dynamometer testing of the BEBs and the CNG buses and hopes to precisely quantify both energy and emissions savings in a controlled environment on a variety of drive cycles.

40 This report is available at no cost from the National Renewable Energy Laboratory (NREL) at www.nrel.gov/publications.
Contacts California Air Resources Board 1001 I Street P.O. Box 2815 Sacramento, CA 95812
Yachun Chow, Manager, Zero Emission Truck and Bus Section Phone: 919-322-7450 Email: [email protected]
NREL 15013 Denver West Parkway Golden, CO 80401
Leslie Eudy, Senior Project Leader, Technology Validation Team Phone: 303-275-4412 Email: [email protected]
Ken Kelly, Section Supervisor/Project Leader, Fleet Test and Evaluation Team Phone: 303-275-4465 Email: [email protected]
Foothill Transit 100 S. Vincent Ave. Suite 200 West Covina, CA 91790
Roland Cordero, Director of Maintenance and Vehicle Technology Phone: 626-931-7246 Email: [email protected]
Proterra 1 Whitley Court Greenville, SC 29607
Mike Finnern, Customer Service Director Phone: 864-214-0393 Email: [email protected]
41 This report is available at no cost from the National Renewable Energy Laboratory (NREL) at www.nrel.gov/publications.
References and Related Reports All NREL hydrogen and fuel cell-related evaluation reports can be downloaded from the following website: www.nrel.gov/hydrogen/proj_fc_bus_eval.html.
O’Keefe, M.; Simpson, A.; Kelly, K.; Pedersen, D. “Duty cycle characterization and evaluation towards heavy hybrid vehicle applications.” SAE Technical Paper 2007-01-0302, 2007. doi:10.4271/2007-01-0302. http://www.nrel.gov/docs/gen/fy07/40929.pdf.
Eudy, L.; Post, M.; Gikakis, C. (2015). Fuel Cell Buses in U.S. Transit Fleets: Current Status 2015. NREL/TP-5400-64974. Golden, CO: National Renewable Energy Laboratory.
Eudy, L. (2010). Fuel Cell Transit Bus Evaluations, Joint Evaluation Plan for the U.S. Department of Energy and the Federal Transit Administration. NREL/TP-560-49342. Golden, CO: National Renewable Energy Laboratory.

42 This report is available at no cost from the National Renewable Energy Laboratory (NREL) at www.nrel.gov/publications.
Appendix A: TRL Guideline Table Technology Readiness Levels for Advanced Technology Bus Commercialization
Relative Level of Technology Development
Technology Readiness
Level TRL Definition Description
Deployment TRL 9
Actual system operated over the full
range of expected conditions
The technology is in its final form. Deployment, marketing, and support begin for the first fully commercial products.
Technology Demonstration/ Commissioning
TRL 8
Actual system completed and
qualified through test and demonstration
The last step in true system development. Demonstration of a limited production of 50 to 100 buses at a small number of locations. Beginning the transition of all maintenance to transit staff.
TRL 7 Full-scale validation in relevant environment
A major step up from TRL 6 by adding larger numbers of buses and increasing the hours of service. Full-scale demonstration and reliability testing of 5 to 10 buses at several locations. Manufacturers begin to train larger numbers of transit staff in operation and maintenance.
TRL 6 Engineering/pilot-scale validation in relevant
environment
First tests of prototype buses in actual transit service. Field testing and design shakedown of one to two prototypes. Manufacturers assist in operation and typically handle all maintenance. Begin to introduce transit staff to technology.
Technology Development
TRL 5
Laboratory scale, similar system
validation in relevant environment
Integrated system is tested in a laboratory under simulated conditions based on early modeling. System is integrated into an early prototype or mule platform for some on-road testing.
TRL 4 Component and
system validation in laboratory environment
Basic technological components are integrated into the system and begin laboratory testing and modeling of potential duty cycles.
Research to Prove Feasibility
TRL 3
Analytical and experimental critical
function and/or proof of concept
Active research into components and system integration needs. Investigate what requirements might be met with existing commercial components.
TRL 2 Technology concept and/or application
formulated
Research technology needed to meet market requirements. Define strategy for moving through development stages. Basic
Technology Research TRL 1 Basic principles
observed and reported Scientific research and early development of concepts.

43 This report is available at no cost from the National Renewable Energy Laboratory (NREL) at www.nrel.gov/publications.
Appendix B: Foothill Fleet Summary Statistics BEB and CNG Fleet Operations and Economics
BEB CNG
Number of vehicles 12 8 Period used for fuel and energy op analysis 4/14–7/15 10/14–7/15 Total number of months in period 16 10 Fuel and energy analysis base fleet mileage 401,244 294,533 Period used for maintenance op analysis 1/15–7/15 10/14–7/15 Total number of months in period 7 10 Maintenance analysis base fleet mileage 401,244 364,373 Average monthly mileage per vehicle 2,333 4,555 Availability 90 94 Fleet energy usage in kWh (BEB) or GGE (CNG) 864,586 72,979 Roadcalls 43 8 Total MBRC 9,331 45,547 Propulsion-related roadcalls 16 4 Propulsion-related MBRC 25,078 91,093 Fleet kWh per mile (BEB) or miles per GGE (CNG) 2.15 4.04 Representative fleet miles per DGE 17.48 4.51 Electricity cost per kWh or CNG cost per GGE 0.18 0.93 Energy cost per mile 0.39 0.23 Total scheduled repair cost per mile 0.08 0.14 Total unscheduled repair cost per mile 0.09 0.04 Total maintenance cost per mile 0.16 0.18 Total operating cost per mile 0.55 0.41
Maintenance Costs BEB CNG
Fleet mileage 205,041 364,373 Total parts cost 9,344.72 32,761.73 Total labor hours 483.4 679.5 Average labor cost (@ $50.00 per hour) 24,170.00 33,972.50 Total maintenance cost 33,514.72 66,734.23 Total maintenance cost per bus 2,792.89 8,341.78 Total maintenance cost per mile 0.16 0.18

44 This report is available at no cost from the National Renewable Energy Laboratory (NREL) at www.nrel.gov/publications.
Breakdown of Maintenance Costs by Vehicle System
BEB CNG
Fleet mileage 205,041 364,373 Total Engine/Fuel-Related Systems (ATA VMRS 27, 30, 31, 32, 33, 41, 42, 43, 44, 45, 46, 65) Parts cost 2,421.01 23,240.22 Labor hours 37.00 94.75 Average labor cost 1,850.00 4,737.50 Total cost (for system) 4,271.01 27,977.72 Total cost (for system) per bus 266.94 1,748.61 Total cost (for system) per mile 0.02 0.08 Exhaust System Repairs (ATA VMRS 43) Parts cost 0.00 0.00 Labor hours 0.0 0.0 Average labor cost 0.00 0.00 Total cost (for system) 0.00 0.00 Total cost (for system) per bus 0.00 0.00 Total cost (for system) per mile 0.00 0.00 Fuel System Repairs (ATA VMRS 44) Parts cost 0.00 64.68 Labor hours 0.0 6.5 Average labor cost 0.00 325.00 Total cost (for system) 0.00 389.68 Total cost (for system) per bus 0.00 24.36 Total cost (for system) per mile 0.00 0.00 Power Plant (Engine) Repairs (ATA VMRS 45) Parts cost 0.00 15,590.27 Labor hours 10.5 25.5 Average labor cost 525.00 1,275.00 Total cost (for system) 525.00 16,865.27 Total cost (for system) per bus 32.81 1,054.08 Total cost (for system) per mile 0.00 0.05 Electric Propulsion Repairs (ATA VMRS 46) Parts cost 0.00 0.00 Labor hours 1.5 0.0 Average labor cost 75.00 0.00 Total cost (for system) 75.00 0.00 Total cost (for system) per bus 4.69 0.00 Total cost (for system) per mile 0.00 0.00
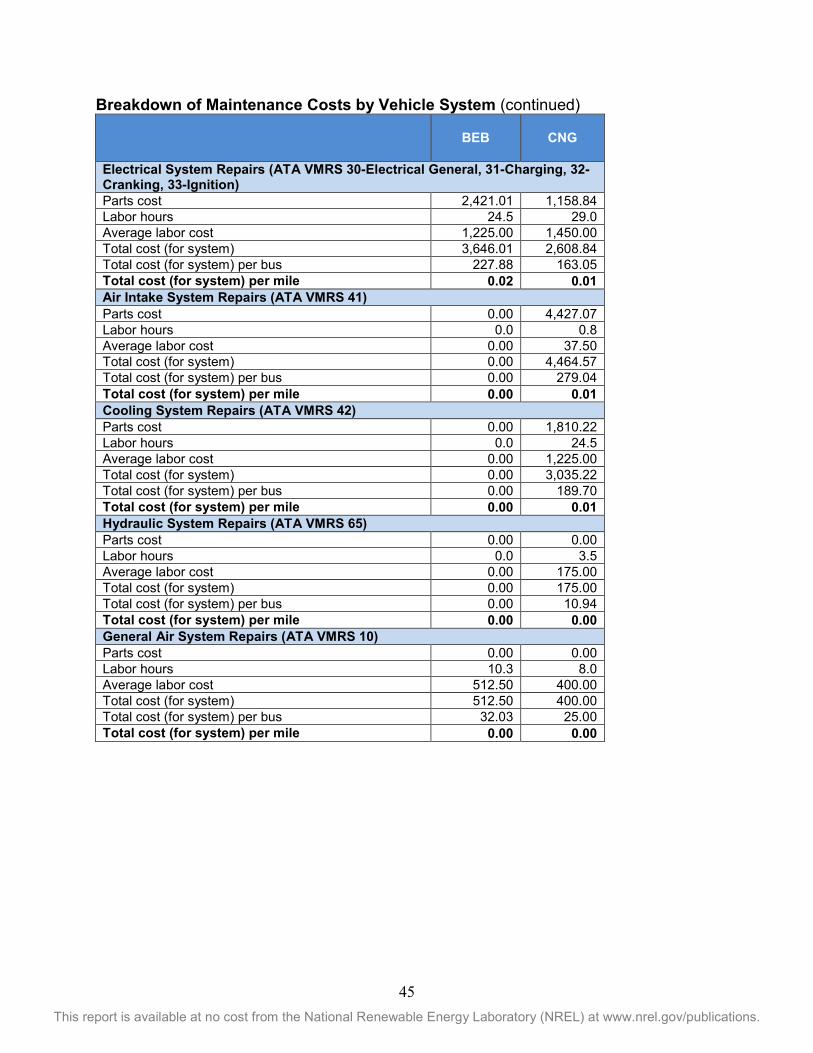
45 This report is available at no cost from the National Renewable Energy Laboratory (NREL) at www.nrel.gov/publications.
Breakdown of Maintenance Costs by Vehicle System (continued)
BEB CNG
Electrical System Repairs (ATA VMRS 30-Electrical General, 31-Charging, 32-Cranking, 33-Ignition) Parts cost 2,421.01 1,158.84 Labor hours 24.5 29.0 Average labor cost 1,225.00 1,450.00 Total cost (for system) 3,646.01 2,608.84 Total cost (for system) per bus 227.88 163.05 Total cost (for system) per mile 0.02 0.01 Air Intake System Repairs (ATA VMRS 41) Parts cost 0.00 4,427.07 Labor hours 0.0 0.8 Average labor cost 0.00 37.50 Total cost (for system) 0.00 4,464.57 Total cost (for system) per bus 0.00 279.04 Total cost (for system) per mile 0.00 0.01 Cooling System Repairs (ATA VMRS 42) Parts cost 0.00 1,810.22 Labor hours 0.0 24.5 Average labor cost 0.00 1,225.00 Total cost (for system) 0.00 3,035.22 Total cost (for system) per bus 0.00 189.70 Total cost (for system) per mile 0.00 0.01 Hydraulic System Repairs (ATA VMRS 65) Parts cost 0.00 0.00 Labor hours 0.0 3.5 Average labor cost 0.00 175.00 Total cost (for system) 0.00 175.00 Total cost (for system) per bus 0.00 10.94 Total cost (for system) per mile 0.00 0.00 General Air System Repairs (ATA VMRS 10) Parts cost 0.00 0.00 Labor hours 10.3 8.0 Average labor cost 512.50 400.00 Total cost (for system) 512.50 400.00 Total cost (for system) per bus 32.03 25.00 Total cost (for system) per mile 0.00 0.00

46 This report is available at no cost from the National Renewable Energy Laboratory (NREL) at www.nrel.gov/publications.
Breakdown of Maintenance Costs by Vehicle System (continued)
BEB CNG
Brake System Repairs (ATA VMRS 13) Parts cost 0.00 0.00 Labor hours 0.0 0.0 Average labor cost 0.00 0.00 Total cost (for system) 0.00 0.00 Total cost (for system) per bus 0.00 0.00 Total cost (for system) per mile 0.00 0.00 Transmission Repairs (ATA VMRS 27) Parts cost 0.00 189.15 Labor hours 0.5 5.0 Average labor cost 25.00 250.00 Total cost (for system) 25.00 439.15 Total cost (for system) per bus 1.56 27.45 Total cost (for system) per mile 0.00 0.00 Inspections Only - no parts replacements (101) Parts cost 0.00 0.00 Labor hours 295.2 438.5 Average labor cost 14,760.00 21,925.00 Total cost (for system) 14,760.00 21,925.00 Total cost (for system) per bus 922.50 1,370.31 Total cost (for system) per mile 0.07 0.06 Cab, Body, and Accessories Systems Repairs (ATA VMRS 02-Cab and Sheet Metal, 50-Accessories, 71-Body) Parts cost 187.36 936.07 Labor hours 112.0 112.3 Average labor cost 5,597.50 5,615.00 Total cost (for system) 5,784.86 6,551.07 Total cost (for system) per bus 361.55 409.44 Total cost (for system) per mile 0.03 0.02 HVAC System Repairs (ATA VMRS 01) Parts cost 0.00 887.58 Labor hours 0.5 11.4 Average labor cost 25.00 570.00 Total cost (for system) 25.00 1,457.58 Total cost (for system) per bus 1.56 91.10 Total cost (for system) per mile 0.00 0.00

47 This report is available at no cost from the National Renewable Energy Laboratory (NREL) at www.nrel.gov/publications.
Breakdown of Maintenance Costs by Vehicle System (continued)
BEB CNG
Lighting System Repairs (ATA VMRS 34) Parts cost 0.00 0.00 Labor hours 1.0 0.0 Average labor cost 50.00 0.00 Total cost (for system) 50.00 0.00 Total cost (for system) per bus 3.13 0.00 Total cost (for system) per mile 0.00 0.00 Frame, Steering, and Suspension Repairs (ATA VMRS 14-Frame, 15-Steering, 16-Suspension) Parts cost 0.00 34.72 Labor hours 0.0 4.0 Average labor cost 0.00 200.00 Total cost (for system) 0.00 234.72 Total cost (for system) per bus 0.00 14.67 Total cost (for system) per mile 0.00 0.00 Axle, Wheel, and Drive Shaft Repairs (ATA VMRS 11-Front Axle, 18-Wheels, 22-Rear Axle, 24-Drive Shaft) Parts cost 0.00 6,102.94 Labor hours 0.0 2.0 Average labor cost 0.00 100.00 Total cost (for system) 0.00 6,202.94 Total cost (for system) per bus 0.00 387.68 Total cost (for system) per mile 0.00 0.02 Tire Repairs (ATA VMRS 17) Parts cost 6,736.35 1,560.20 Labor hours 27.5 8.5 Average labor cost 1,375.00 425.00 Total cost (for system) 8,111.35 1,985.20 Total cost (for system) per bus 506.96 124.08 Total cost (for system) per mile 0.04 0.01

48 This report is available at no cost from the National Renewable Energy Laboratory (NREL) at www.nrel.gov/publications.
Notes
1. To compare the charging energy to CNG fuel and diesel equivalent, the energy and CNG were converted into diesel energy equivalent gallons. Actual energy content will vary by location, but the general energy conversions are based on the following:
Lower heating value (LHV) for diesel = 128,488 Btu/gal (Alternative Fuels Data Center, fuel properties database8)
U.S. average energy content of electricity = 3,412 Btu/kWh (Energy Information Administration)
Conversion factor for calculations = 37.7 kWh/gal
CNG fuel is reported as gasoline gallon equivalent (GGE). The gasoline LHV is 115,000 Btu/gal. Gasoline/Diesel = 115,000 Btu/gallon / 128,400 Btu/gallon = 0.896 GGE/gal
2. The propulsion-related systems were chosen to include only those systems of the vehicles that could be affected directly by the selection of a fuel or advanced technology.
3. ATA VMRS coding is based on parts that were replaced. If there was no part replaced in a given repair, then the code was chosen by the system being worked on.
4. In general, inspections (with no part replacements) were included only in the overall totals (not by system). Category 101 was created to track labor costs for PMIs.
5. ATA VMRS 02-Cab and Sheet Metal represents seats, doors, etc.; ATA VMRS 50-Accessories represents things like fire extinguishers, test kits, fareboxes, etc.; ATA VMRS 71-Body represents mostly windows and windshields.
6. Average labor cost is assumed to be $50 per hour.
7. Warranty costs are not included.
8 http://www.afdc.energy.gov/fuels/fuel_properties.php

49 This report is available at no cost from the National Renewable Energy Laboratory (NREL) at www.nrel.gov/publications.
Appendix C: Fleet Summary Statistics—SI Units BEB and CNG Fleet Operations and Economics
BEB CNG
Number of vehicles 12 8 Period used for fuel and energy op analysis 4/14–7/15 10/14–7/15 Total number of months in period 16 10 Fuel and energy analysis base fleet mileage (km) 645,722 473,992 Period used for maintenance op analysis 1/15–7/15 10/14–7/15 Total number of months in period 7 10 Maintenance analysis base fleet kilometers 645,722 586,385 Average monthly kilometers per vehicle 3,754 7,330 Availability 90 94 Fleet fuel usage in kWh or CNG liter equiv. 864,586.0 276,255.6 Roadcalls 43 8 Total KMBRC 15,017 73,298 Propulsion roadcalls 16 4 Propulsion KMBRC 40,358 146,596 Rep. fleet fuel consumption (L/100 km) 13.44 52.16 Number of vehicles 12 8 Electricity cost per kWh or CNG cost per liter 0.18 0.25 Energy cost per kilometer 0.24 0.14 Total scheduled repair cost per kilometer 0.05 0.09 Total unscheduled repair cost per kilometer 0.05 0.03 Total maintenance cost per kilometer 0.10 0.11 Total operating cost per kilometer 0.34 0.26
Maintenance Costs
BEB CNG
Fleet mileage (km) 329,972 586,385 Total parts cost 9,344.72 32,761.73 Total labor hours 483.40 679.45 Average labor cost (@ $50.00 per hour) 24,170.00 33,972.50 Total maintenance cost 33,514.72 66,734.23 Total maintenance cost per bus 2,792.89 8,341.78 Total maintenance cost per kilometer 0.10 0.11