Foothill/Eastern Transportation Corridor Agency Foothill/Eastern

FOOTHILL TRANSIT
BUSINESS PLAN & BUDGET FISCAL YEAR 2014-2015 PROPOSED

FOOTHILL TRANSITBUSINESS PLAN AND BUDGET
PROPOSED - MAY 21, 2014

2
GOVERNING BOARD CLUSTER 1 Claremont Councilmember Corey Calaycay Councilmember Sam Pedroza, Alternate La Verne Mayor Pro Tem Charles A. Rosales Councilmember Ron Ingels, Alternate Pomona Councilmember Paula Lantz Mayor Elliot Rothman, AlternateSan Dimas Councilmember Emmett Badar Councilmember John Ebiner, Alternate Walnut Mayor Antonio Cartagena Councilmember Robert Pacheco, Alternate
CLUSTER 2 Azusa Mayor Pro Tem Uriel Macias Councilmember Edward J. Alvarez, Alternate Baldwin ParkCouncilmember Cruz Baca Councilmember Susan Rubio, Alternate Covina Mayor Peggy A. Delach Councilmember John C. King, Alternate Glendora Councilmember Doug Tessitor Councilmember Gene Murabito, Alternate Irwindale Mayor Mark A. Breceda Councilmember Manuel R. Garcia, Alternate West Covina Councilmember Corey Warshaw Councilmember James Toma, Alternate
CLUSTER 3 Arcadia Councilmember Roger Chandler Mayor John Wuo, Alternate Bradbury Mayor Pro Tem Richard G. Barakat Councilmember Richard T. Hale Jr., Alternate Duarte Mayor Pro Tem Tzeitel Paras-Caracci Councilmember Samuel Kang Monrovia Mayor Pro Tem Becky Shevlin Mayor Mary Ann Lutz, Alternate Pasadena Vice Mayor Margaret McAustin Mayor Bill Bogaard, Alternate Temple City Mayor Cynthia Sternquist Councilmember Fernando Vizcarra, Alternate
CLUSTER 4El Monte Councilmember Juventino “J” Gomez Councilmember Victoria Martinez, Alternate Diamond Bar Mayor Carol Herrera Councilmember Nancy A. Lyons, AlternateIndustry Mayor Pro Tem Jeff Parriott Mayor Tim Spohn, Alternate La PuenteMayor Pro Tem Violeta Lewis Mayor Charlie Klinakis, Alternate South El Monte Councilmember Hector Delgado Councilmember Willhans A. Ili, Alternate
CLUSTER 5 County of Los Angeles David C. Rodriguez (Representing Supervisor Don Knabe) Michael De La Torre (Representing Supervisor Mike Antonovich) Patricia Wallach (Representing Supervisor Gloria Molina)
SENIOR MANAGEMENT Doran J. Barnes Executive Director
Kevin O. McDonald Deputy Executive Director
Matt Mumford Director of Customer Relations
LaShawn Gillespie Director of Customer Service and Operations
Sharlane Bailey Director of Facilities
Michelle Caldwell Director of Finance
David Reyno Director of Government Relations
Donald Luey Director of Information Technology
Roland Cordero Director of Maintenance and Vehicle Technology
Felicia Friesema Director of Marketing and Communications
Joseph Raquel Director of Planning
Bobby Magee Director of Procurement
EXECUTIVE BOARD DOUG TESSITOR Executive Board Chair Cluster 2 – GlendoraPeggy Delach, Covina, Alternate
PAULA LANTZ Executive Board Vice Chair Cluster 1 – Pomona Corey Calaycay, Claremont, Alternate
CAROL HERRERA Executive Board Treasurer/Auditor/Controller Cluster 4 – Diamond Bar Jeff Parriott, City of Industry, Alternate
MICHAEL DE LA TORRE Board Member Cluster 5 – Representing Supervisor Mike Antonovich Patricia Wallach, representing Supervisor Gloria Molina, Alternate
MARGARET MCAUSTIN Board Member Cluster 3 – Pasadena Becky Shevlin, Monrovia, Alternate

3
TABLE OF CONTENTS:
EXECUTIVE SUMMARY ............................................................................................................................................... 7
OVERALL SYSTEM STATISTICS ............................................................................................................................. 9
ACCOMPLISHMENTS FOR FY 2013-2014 AND INITIATIVES FOR FY 2014-2015 ......................... 11
SERVICE SUMMARY ................................................................................................................................................... 13
AGENCY HISTORY .................................................................................................................................................. 15
STRUCTURE ............................................................................................................................................................... 17
FOOTHILL TRANSIT FLEET ................................................................................................................................ 18
FOOTHILL TRANSIT FACILITIES ...................................................................................................................... 18
SERVICE CHANGES THROUGH FY 2017....................................................................................................... 19
FY 2013-2014 ACCOMPLISHMENTS ................................................................................................................... 21
OVERALL SYSTEM STATISTICS ...................................................................................................................... 23
MAJOR ACCOMPLISHMENTS IN FY 2013-2014 ........................................................................................ 26
FY 2014-2015 INITIATIVES .................................................................................................................................... 29
OVERALL SYSTEM STATISTICS…………………………………………………………… ................................................. 31
FY 2014-2015 GOALS AND TARGETS ........................................................................................................... 32
MAJOR INITIATIVES FOR FY 2014-2015 ...................................................................................................... 34
AGENCY FUNDING AND OPERATING BUDGET .......................................................................................... 37
FUNDING SOURCES.............................................................................................................................................. 39
OPERATING REVENUES ...................................................................................................................................... 41
OPERATING EXPENSES ...................................................................................................................................... 42
CAPITAL BUDGET ...................................................................................................................................................... 43
CAPITAL REVENUE ............................................................................................................................................... 45
CAPITAL EXPENDITURES .................................................................................................................................. 46
CAPITAL CARRY OVER ....................................................................................................................................... 47
DEPARTMENT BUDGETS AND SUMMARIES .................................................................................................. 49
CUSTOMER SERVICE AND OPERATIONS ................................................................................................... 51
MAINTENANCE AND VEHICLE TECHNOLOGY ........................................................................................ 56
MARKETING AND COMMUNICATIONS ........................................................................................................ 58
PLANNING .................................................................................................................................................................. 61
INFORMATION TECHNOLOGY ........................................................................................................................ 63
ADMINISTRATION .................................................................................................................................................. 65
PROCUREMENT ...................................................................................................................................................... 68
FINANCE ....................................................................................................................................................................70
FACILITIES ................................................................................................................................................................ 72

4
THIS PAGE IS INTENTIONALLY LEFT BLANK

FOOTHILL TRANSITBUSINESS PLAN AND BUDGET
EXECUTIVE SUMMARY

6
THIS PAGE IS INTENTIONALLY LEFT BLANK

7
EXECUTIVE SUMMARY Foothill Transit's FY 2014-2015 Business Plan incorporates the organization’s Budget and Short Range Transit Plan (SRTP) into a single document. The Business Plan projects that Foothill Transit will operate 754,227 vehicle service hours in FY 2014-2015. FY 2014-2015 vehicle service hours represents an increase of 7.5 percent over FY 2013-2014 service levels.
The agency's FY 2014-2015 operating cost, budgeted at $76.5 million, represents a 13.4 percent increase over FY 2013-2014 projections, and is 5.1 percent higher than the budgeted FY 2013-2014 amount. The primary drivers in the increase are the inclusion of cost assumptions related to the procurement of a new agreement for operation of transit services at Foothill Transit’s Arcadia/Irwindale facility in FY 2014-2015 and the performance of a Comprehensive Operational Analysis (COA) that was budgeted in FY 2013-2014 and is currently underway with the majority of that project’s expenditures occurring in FY 2014-2015. Overall, front line operations account for 85.7 percent of Foothill Transit's total operating budget. Foothill Transit's FY 2014-2015 fare revenue projection is $18.9 million and represents a 0.5 percent increase compared to projected FY 2013-2014 levels. This figure includes the continuation of our Class Pass pilot programs with Mt. San Antonio College and the University of La Verne through fall 2014. Should those programs continue beyond the fall semester, both institutions will identify a revenue source to fund their continuation.
The state's proposed budget includes an allocation to the State Transit Assistance (STA) fund for FY 2014-2015. Foothill Transit’s Volumetric Excise Tax Credit revenues have not been budgeted as a current year source of capital funding in FY 2014-2015 as the legislation that authorized that funding source has not been approved beyond December 2013. Foothill Transit will remain keenly focused on safety, customer service, efficiency and innovation and a number of capital and operating programs designed to achieve these goals will be underway this year. Among these are the development of Park & Ride facilities within the San Gabriel and Pomona Valleys, new CNG bus procurements and the procurement of a new computer aided dispatch and automatic vehicle location (CAD/AVL) system, all with the goal of improving our customers’ day-to-day experience with our service.
Adhering to our mission statement will continue to guide planning and day-to-day operations as we advance Foothill Transit’s mission into and through the coming year.

8
FOOTHILL TRANSIT’S VALUES RESULTS
We value the achievement of organizational goals and initiatives as defined in our business plan and involving all levels of the organization.
INTEGRITY
We are committed to high ethical standards based on accountability, honesty, respect and transparency, and a high level of fiscal responsibility.
DIVERSITY
We create an environment rich with talented people and differing viewpoints, valuing the unique perspectives that everyone brings.
TEAM MEMBERS
Our team members are the key to Foothill Transit’s success and we are committed to supporting them through education, development and recognition.
COMMUNICATION
We value and are committed to open, honest and respectful discussion that is responsive, informative and constructive.
MISSION STATEMENT The mission of Foothill Transit is to be the premier public transit provider committed to
safety, courtesy, quality, responsiveness, efficiency and innovation.

9
OVERALL SYSTEM STATISTICS This chart shows a comparison of Foothill Transit’s overall system performance for FY 2012-2013, the projected performance for FY 2013-2014, and the targeted performance goals for FY 2014-2015.
Overall System Performance
FY 13-14 Actual
FY 13-14 Target
FY 13-14 Estimate
FY 14-15 Target
Passenger Boardings 14,079,592 14,100,000 14,501,980 14,700,000
Vehicle Service Hours 655,743 738,300 701,455 754,227
Fare Revenue $18,442,459 $18,800,000 $18,775,000 $18,870,000
Operating Expense $62,513,268 $72,792,400 $67,519,156 $76,536,790

10
Goal Indicator FY 12-13 Actual
FY 13-14 Target
FY 13-14 Estimate
FY 14-15 Target
Operate a Safe Transit System
Preventable Accidents per 100,000 miles
0.72 0.60 0.60 0.60
Provide Outstanding Customer Service
Schedule Adherence 74% 90% 77% 85%
Miles Between Service Interruptions 15,684 15,000 16,300 15,000
Complaints per 100,000 Boardings 11.97 10.25 15.50 15.00
Average Hold Time (Average Time to
Answer) 43 seconds 45 seconds 45 seconds 45 seconds
Operate an Effective Transit System
Boardings per Service Hour 21.5 19.1 20.7 19.5
Average Weekday Boardings 46,983 49,250 48,392 48,900
Operate an Efficient Transit System
Farebox Recovery Ratio 29.50% 25.83% 27.81% 24.65%
Average Cost per Vehicle Service Hour $95.33 $98.59 $96.26 $101.48

11
ACCOMPLISHMENTS FOR FY 2013-2014 AND INITIATIVES FOR FY 2014-2015
FY 2013-2014 ACCOMPLISHMENTS
FY 2014-2015 INITIATIVES
Bus Replacement Project
System Performance Improvements Electric Bus Program ESMS at Pomona College Pass Program San Gabriel and Pomona Valley Park & Rides
Legislative Advocacy
Website Redesign
25th Anniversary Customer Appreciation
Bus Replacement Project Comprehensive Operational Analysis Development College Pass Program Implementation Customer Service Training Expansion ISO 14001 Certification for Pomona Legislative Advocacy Arcadia Operations Contract Procurement San Gabriel Valley Park & Facilities SMARTBus System (SBS) Replacement
BUDGET ORGANIZATION Service Summary: Information about Foothill Transit’s history, the services that are currently provided to the community, and proposed service changes.
FY 2013-2014 Performance Indicators and Initiatives: Foothill Transit’s accomplishments for FY 2013-2014 in greater detail and as measured by performance indicators.
FY 2014-2015 Performance Indicators and Initiatives: Foothill Transit’s targeted performance for several key indicators and agency-wide initiatives for FY 2014-2015.
Agency Funding: Foothill Transit’s operating and capital budget for FY 2014-2015.
Departmental Summary: Departmental operating budgets, including department-specific initiatives for FY 2014-2015.

12
THIS PAGE IS INTENTIONALLY LEFT BLANK

FOOTHILL TRANSITBUSINESS PLAN AND BUDGET
SERVICE SUMMARY

14
THIS PAGE IS INTENTIONALLY LEFT BLANK

15
AGENCY HISTORY Foothill Transit was created in 1988 as a unique joint powers authority following the Southern California Rapid Transit District (RTD) announcement of service cuts and fare increases that would negatively impact the San Gabriel Valley. The Los Angeles County Transportation Commission (LACTC) approved Foothill Transit's application to assume operation of 14 lines which were operated by the RTD and was tasked by community leaders to provide superior public transportation while reducing costs and improving local control. Its leadership is comprised of elected representatives of 22 member cities in the San Gabriel and Pomona Valleys and three appointees from the Board of Supervisors of the County of Los Angeles.
Foothill Transit’s service began in December 1988 with operation of two fixed-route bus lines absorbed from RTD - Lines 495 and 498. The remaining 12 lines approved by the LACTC were shifted to Foothill Transit operation over a period of five years. The new agency also assumed administration of the Bus Service Continuation Project and began providing service on an additional six lines that were abandoned by the RTD. Analysis of regional transit needs modified existing lines, increasing weekday service, introducing new weekend service, and creating brand new service to connect communities.
In FY 2013-2014, Foothill Transit now operates 36 fixed-route local and express lines, covers over 300 square miles in eastern Los Angeles County, and serves approximately 14 million customers each year. This number is up from 9.5 million at the time of Foothill Transit's original application.
At its inception, Foothill Transit relied on contractor-provided operations facilities to maintain its growing fleet. Foothill Transit opened its first agency-owned operations facility in Pomona in 1997. A second facility in Arcadia completed construction in September 2002. And in 2007, the administrative offices moved from leased property to its current address at 100 South Vincent Avenue in West Covina. This purchase of the administrative building enabled the investment of capital dollars to offset ongoing operating costs associated with the lease of the previous office space.
Foothill Transit began converting its diesel-fueled fleet to compressed natural gas in 2002. As of the publication of this business plan, fleet conversion is 100% complete. The final diesel-fueled bus was retired in late 2013.
Agency growth continued and in 2007, Foothill Transit launched the region’s first cross-valley, high occupancy bus service – the Silver Streak. Covering approximately 40 miles – from Montclair to Grand and Olympic in downtown Los Angeles – the Silver Streak route spends about five percent of its total trip time on surface streets, utilizing freeways and HOV lanes for quick commuting between designated station stops, mimicking the efficiency and speed of light rail. The Silver Streak was also the first public transit service in Southern California to offer customers free mobile Wi-Fi service on all 30 of its 60-foot articulated buses. Wi-Fi service was discontinued in early 2009 due to smart phone advancements and looming operating budget cuts from the state.
Continuing its commitment to adopting low emissions technology, the agency took a bold step in 2010 with the implementation of the first-of-its-kind all-electric, zero-emissions Ecoliner. Funded through the American Recovery and Reinvestment Act of 2009 (ARRA), these vehicles are the first all-electric, heavy duty public transit buses ever to utilize in-route fast charging capability, enabling them to remain in service throughout the day without having to leave the route to be charged before returning to service. Foothill Transit received a $10.2 million TIGGER II grant in early 2011 to expand the Ecoliner program. This funding will

16
enable the purchase of nine more electric vehicles for use on Line 291, making it the first all-electric, zero-emissions bus line in the county.
In recognition of the maturity of the organization and to ensure continuing the pursuit of what best serves the organization and its stakeholders, on June 15, 2013, Foothill Transit began the transition to in-house management by hiring its first full-time employee – Executive Director Doran J. Barnes. Doran had previously served in that capacity since 2003 under a management contract with Veolia Transportation. At the direction of the Board, senior leadership and technical staff for each functional area of the organization was hired and the management services contract with Veolia Transportation was amended, resulting in management of Foothill Transit being brought in-house on July 1, 2013. On-street operations and maintenance, as well as Transit Store operations and bus stop maintenance, continue to be provided under contracts with private firms.
In the quest to provide more convenient and predictable commuting options for residents of the San Gabriel and Pomona Valleys, Foothill Transit began providing service to the organization’s first agency-owned parking structure – the Industry Park & Ride in the City of Industry on October 7, 2013. The structure houses 622 parking spaces and its construction allowed for the introduction of Foothill Transit’s first new commuter line to be introduced since 2007 (Silver Streak). Line 495 was launched on February 3, 2014 as a one-year pilot route designed to transport customers from the San Gabriel Valley to and from destinations in downtown Los Angeles. During FY 2014-2015, the route will be evaluated to determine its long-term feasibility.

17
STRUCTURE General membership in the Foothill Transit Joint Powers Authority includes one city council member and one alternate from each of the 22 cities in the Foothill Transit service area and three appointed representatives for the County of Los Angeles. A five-member Executive Board governs Foothill Transit: four elected officials representing four clusters of cities, and the fifth member is elected by the Los Angeles County representatives (Cluster Five). The Board directs policy that is implemented by a directly employed administrative staff. On-street operations and front-line customer service are provided through contracts with First Transit and Veolia Transportation.
Join
t P
ow
ers
Aut
hori
ty
Executive Board
Executive Director
Deputy Executive Director
Director of Finance
Director of Procurement
Director of Planning
Director of Information Technology
Director of Customer Service and Operations
Arcadia Contractor
Pomona Contractor
Customer Service and
Facilities Contractor
Director of Maintenance and
Vehicle Technology
Director of Facilities
Director of Customer Relations
Director of Marketing and
Communications
Director of Government
Relations

18
1200s 29 currently in the fleet Seats 41 CNG fueled
1300s 51 currently in the fleet Seats 40 CNG fueled
1400s 75 currently in the fleet Seats 40 CNG fueled
1500s 10 currently in the fleet Seats 40 CNG fueled
1600s 30 currently in the fleet Seats 58 CNG fueled
1700s 30 currently in the fleet Seats 40 CNG fueled
1800s 12 currently in the fleet Seats 40 CNG fueled
1900s 14 currently in the fleet Seats 38 CNG fueled
2000s 15 currently in the fleet Seats 35 100% Electric bus
2100s 64 currently in the fleet Seats 35 CNG fueled
FOOTHILL TRANSIT FLEET
FOOTHILL TRANSIT FACILITIES
West Covina Administrative Offices 100 S. Vincent Ave. Suite 200 West Covina, CA Arcadia Operations and Maintenance Facility 5640 Peck Rd. Arcadia, CA Pomona Operations and Maintenance Facility 200 S. East End Ave. Pomona, CA

19
SERVICE CHANGES THROUGH FY 2017 In FY 2013-2014, Foothill Transit implemented service enhancements aimed at improving the customer experience by reducing wait times at stops through updated route run times, filling in gaps in service, increasing frequencies in routes with heavy ridership, and increasing the span of service to accommodate customers working later hours. The enhancements improved overall schedule adherence to 80% during the months of December and January; this marks the first time the agency achieved 80% schedule adherence since shifting from manually collected data to data recorded by the SMARTBus system. The lines where service gaps were filled also saw an increase in ridership compared to last fiscal year.
Overall ridership in FY 2013-2014 increased three percent over FY 2012-2013. The increased ridership was a result of the Silver2Silver and Class Pass promotions introduced during the fiscal year. The Silver Streak saw a ridership increase of 19% for FY 2014 compared to the previous fiscal year. The Class Pass helped increase ridership on Line 486, the primary line that serves Mt. San Antonio College.
Comprehensive Operational Analysis Foothill Transit has contracted with Nelson\Nygaard to perform a Comprehensive Operational Analysis of the transit system. Following their evaluation, Nelson\Nygaard will propose possible route changes that will improve the customers’ mobility throughout the service area. A big part of the analysis includes customer and non-customer surveys to determine if there are any unmet transit needs within the area and what improvements Foothill Transit can make to improve the overall customer experience. Nelson\Nygaard will also look at the effects the Gold Line will have on the service as well as overall mobility throughout the San Gabriel Valley region. Any proposed changes will be thoroughly evaluated by staff prior to a recommendation to the Governing Board regarding implementation. It is anticipated that any recommended service changes will go into effect during FY 2015-2016 and FY 2016-2017.

20
THIS PAGE IS INTENTIONALLY LEFT BLANK

FOOTHILL TRANSITBUSINESS PLAN AND BUDGET
FY 2013-2014 ACCOMPLISHMENTS

22
THIS PAGE IS INTENTIONALLY LEFT BLANK

23
OVERALL SYSTEM STATISTICS
ANALYSIS Passenger Boardings and Fare Revenues FY 2013-2014 ridership is projected to surpass FY 2012-2013 levels by three percent, while fare revenue is projected to be 1.8 percent above FY 2012-2013 levels. The increase in ridership can largely be attributed to the Class Pass Programs at the University of La Verne and Mt. San Antonio College.
Vehicle Service Hours and Operating Expenses In FY 2013-2014, service levels increased seven percent over FY 2012-2013. In FY 2013-2014, additional trips funded by the ExpressLanes project were added to Line 699 and the Silver Streak, resulting in an increase in vehicle service hours. Running times were also adjusted to improve on-time performance. Operating expenses in FY 2013-2014 are projected to be within budget at $67.5 million compared to the budget of $72.8 million. Primary contributors to the positive budget variance are fuel and contracted operations cost savings.
Goals and Performance Standards Performance indicators are established annually based on projections of total vehicle service hours, ridership, revenues, and expenses. The estimated boardings per vehicle service hour, farebox recovery ratio and cost per vehicle service hour are derived directly from overall system statistics. The other indicators are estimated based on historical data and current events. Each indicator is discussed on the next page.
Overall System Performance
FY 12-13 Actual
FY 13-14 Target
FY 13-14 Estimate
Passenger Boardings 14,079,592 14,100,000 14,501,980
Vehicle Service Hours 655,743 738,300 701,455
Fare Revenue $18,442,459 $18,800,000 $18,775,000
Operating Expense $62,513,268 $72,792,400 $67,519,156

24
OVERALL SYSTEM STATISTICS
Goal Indicator FY 12-13 Actual FY 13-14 Target
FY 13-14 Estimate
Operate a Safe Transit System
Preventable Accidents per 100,000 miles 0.72 0.60 0.60
Provide Outstanding Customer Service
Schedule Adherence 74% 90% 77%
Miles between Service Interruptions 15,684 15,000 16,300
Complaints per 100,000 Boardings 11.97 10.25 15.50
Average Hold Time 43 seconds 45 seconds 45 seconds
Operate an Effective Transit System
Boardings per Service Hour 21.5 19.1 20.7
Average Weekday Boardings 46,983 49,250 48,392
Operate an Efficient Transit System
Farebox Recovery Ratio 29.50% 25.83% 27.81%
Average Cost per Vehicle Service Hour $95.33 $98.59 $96.26
ANALYSIS Preventable Accidents per 100,000 Miles In FY 2013-2014, Foothill Transit is projected to meet the target of 0.60 preventable accidents per 100,000 miles, ending the year at 0.60 preventable accidents per 100,000 miles. This target is well below industry standards for preventable accidents.
Schedule Adherence In FY 2013-2014, Foothill Transit continued to use the SMARTBus system (SBS) to record and report route schedule adherence. Recent service adjustments have resulted in significantly improved performance, resulting in a higher projected FY 2013-2014 on-time performance of 77 percent compared to an FY 2012-2013 average of 74 percent.
Average Miles between Service Interruptions In FY 2013-2014, Foothill Transit averaged 16,300 miles between service interruptions, exceeding the performance target of 15,000 miles. This target was set to ensure that customers were served by a properly maintained transit vehicle fleet. The miles between service interruptions performance in FY 2013-2014 is a four percent improvement over FY 2012-2013.

25
Complaints per 100,000 Boardings Through Foothill Transit’s continued focus on customer service, complaints for the current fiscal year have steadily declined after peaking at the end of last fiscal year. In FY 2013-2014, Foothill Transit received more comments and complaints than in previous years, due to efforts to engage customers through more channels, including social media. We are projected to receive 15.50 complaints per 100,000 boardings at the end of this fiscal year, which is higher than the target of 10.25 complaints per 100,000 boardings.
Average Hold Time Average hold time for FY 2013-2014 is projected to meet the goal of 45 seconds.
Boardings per Service Hour Boardings per service hour for FY 2013-2014 are estimated to exceed the performance target of 19.1 with 20.7 boardings per vehicle service hour.
Average Weekday Boardings In FY 2013-2014, Foothill Transit carried an estimated average of 48,392 boardings per weekday. This is a three percent increase from FY 2012-2013, but is projected to be just short of the performance target of 49,250 average weekday boardings.
Farebox Recovery Ratio Farebox recovery ratio is one of the two indicators used to measure efficiency by evaluating total fare revenue as a percent of total operating expenses. For FY 2013-2014, it is estimated that 27.81 percent of service costs will be paid for directly by fare revenue. The estimated farebox recovery exceeds the fiscal year target of 25.83 percent.
Average Cost per Vehicle Service Hour The current fiscal year’s average cost per vehicle service hour of $96.26 is 2.9 percent less than the targeted cost of $98.59 per vehicle service hour. Total operating expenditures for FY 2013-2014 are lower than budgeted.
.

26
MAJOR ACCOMPLISHMENTS IN FY 2013-2014 Bus Replacement Project In FY 2013-2014 Foothill Transit procured 64 new 42-foot CNG buses from North American Bus Industries (NABI). In addition to replacing Foothill Transit’s first CNG coaches, the new buses replaced the 23 remaining diesel fueled buses making Foothill Transit one of the greenest transit agencies in Southern California. System Performance The overall route schedule adherence in FY 2013-2014 improved to 77%, a first for this agency since we started using the SMARTBus system data to compute on-time performance. We will continue to monitor and adjust route run times as needed during the bi-annual service changes. Electric Bus Program In FY 2013-2014, the Executive Board approved the purchase of 12 additional Ecoliner buses. Nine of the twelve buses will be placed into service while the remaining three will serve as spare buses. Line 291 will soon be Southern California’s first fully electrified bus route. ESMS at Pomona The Environmental and Sustainability Management System (ESMS) Core Team, made up of administrative staff and representatives from each Operations and Maintenance facility, completed a 10-month FTA sponsored ESMS Training Course at Virginia Tech in Roanoke, Virginia. Implementation of the program is currently taking place at the Pomona facility, which includes environmental sustainability awareness training for all contractor employees, establishment of environmentally-friendly procedures, objectives, targets, and programs for more sustainable operations. The ESMS program has already been implemented at the Arcadia operating facility. College Pass Program Foothill Transit launched the Class Pass Pilot Program in fall of 2013 at Mt. San Antonio College (Mt. SAC) and University of La Verne, and both programs have been extremely successful. Students and administrators at each school will decide if they will keep the Class Pass program on campus at the end of the pilot process. San Gabriel and Pomona Valley Park & Rides
• Industry Park & Ride o Construction of Foothill Transit’s Industry Park & Ride parking structure
was completed on time and within budget. On Monday, October 7, 2013, Foothill Transit began scheduled bus service to the new Park & Ride parking structure and on February 3, 2014, a new express Line 495 began service between the Industry Park & Ride and downtown Los Angeles.
• Azusa Park & Ride
o On July 15, 2013, the Azusa City Council certified the Environmental Impact Report (EIR), and on December 2, 2013, Foothill Transit was notified by the Federal Transit Administration (FTA) of the results of the

27
Environmental Assessment (EA). The EA resulted in a Finding of No Significant Impact (FONSI). After receiving the California Environmental Quality Act (CEQA) and National Environmental Policy Act (NEPA) clearance, the architectural and engineering firm Choate Parking Consultants was given the Notice-to-Proceed to begin Phase II design services on the parking structure. All design work and issuance of drawings is scheduled to be submitted mid-April 2014. Construction is estimated to commence in October 2014 and be completed by October 2015.
• West Covina Park & Ride
o The West Covina Transit Center and Park & Ride Project is currently on hold. In March 2013 we reported on the proposed three-level 500 space parking structure and Transit Center at the Westfield Mall. The location of the new proposed parking structure was partially owned by the City of West Covina’s Redevelopment Agency. With the abolishment of redevelopment agencies, the City of West Covina requested that the State Department of Finance transfer ownership of the property to the Parking Authority. The Department of Finance rejected the transfer and as such, West Covina decided to put the project on hold. In addition, there has been a change in ownership for the West Covina Mall in recent months.
Legislative Advocacy Foothill Transit continues to maintain the strong relationships we have developed with our federal and state legislative delegation members and their staff and began developing relationships with our newest delegation members resulting from the 2010 census redistricting. This was done through capitol and district office meetings and regular attendance at events where they were featured speakers. Website Redesign Cultivating a successful online presence today requires a website that can reach customers on multiple platforms. The 2014 redesign of foothilltransit.org is underway and includes a complete revamp of its compatibility with mobile devices. The discovery stage and website architecture are already complete and copywriting and wire framing were completed in February 2014.

28
25th Anniversary Campaign Upon reaching our 25th anniversary milestone in December, we launched a celebratory, customer-focused, on-board campaign that highlights our appreciation for our customers. We also launched a very popular online “archive campaign” that showed images gleaned from our photography archives. The campaign will continue through summer 2014.

FOOTHILL TRANSITBUSINESS PLAN AND BUDGET
FY 2014-2015 INITIATIVES

30
THIS PAGE IS INTENTIONALLY LEFT BLANK

31
OVERALL SYSTEM STATISTICS During FY 2014-2015, Foothill Transit will continue to focus on the delivery of high quality transit service. The following table shows Foothill Transit‘s anticipated service delivery during the upcoming year. Performance targets for FY 2014-2015 have been adjusted to take into account any operational changes and performance trends during the prior year.
Passenger Boardings and Fare Revenue Boardings in FY 2014-2015 are projected to increase by 1.4 percent over projected FY 2013-2014 levels. This added ridership is projected to result from increased service frequency, the implementation of college ridership programs within our service area, and continued ridership growth associated with the Silver2Silver program.
Vehicle Service Hours and Operating Expenses Service hours are projected to increase by 7.5 percent in FY 2014-2015 with the continued implementation of service enhancements aimed at improving customer experience. In addition to increasing service hours, Foothill Transit will conduct a comprehensive operations analysis and transition to a new operating contract for the Arcadia Facility. These are the main factors in the increase in operating expenses.
Goals and Performance Standards The agency uses several performance indicators to evaluate Foothill Transit's achievement of its established goals.
These goals are established annually based on projections of total vehicle service hours, ridership, revenues and expenses. Each goal and its corresponding performance target are provided in the table on the next page.
Overall System Performance
FY 13-14 Target
FY 13-14 Estimate
FY 14-15 Target
Passenger Boardings 14,100,000 14,501,980 14,700,000
Vehicle Service Hours 738,300 701,455 754,227
Fare Revenue $18,800,000 $18,775,000 $18,870,000
Operating Expense $72,792,400 $67,519,156 $76,536.790

32
FY 2014-2015 GOALS AND TARGETS
Goal Indicator FY 13-14 Target
FY 13-14 Estimate
FY 14-15 Target
Operate a Safe Transit System
Preventable Accidents per 100,000 miles
0.60 0.60 0.60
Provide Outstanding Customer Service
Schedule Adherence 90% 77% 85%
Miles between Service Interruptions 15,000 16,300 15,000
Complaints per 100,000 Boardings 10.25 15.50 15.00
Average Time to Answer (Average
Hold Time) 45 seconds 45 seconds 45 seconds
Operate an Effective Transit System
Boardings per Service Hour 19.1 20.7 19.5
Average Weekday Boardings 49,250 48,392 48,900
Operate an Efficient Transit System
Farebox Recovery Ratio 25.83% 27.81% 24.65%
Average Cost per Vehicle Service Hour $98.59 $96.26 $101.48
Preventable Accidents per 100,000 Miles As safety is Foothill Transit’s first priority, the preventable accidents target for FY 2014-2015 will remain at 0.60 preventable accidents per 100,000 miles. This is a more rigorous target than the industry standard. It is important to note that preventable accidents include vehicle collisions as well as other types of preventable incidents, such as a customer fall onboard a vehicle or a bus hitting an overhanging tree, for example.
Schedule Adherence The target for schedule adherence will be lowered from 90 percent to 85 percent for FY 2014-2015. Schedule adjustments for the commuter express routes, running time adjustments to local lines, and analysis of the SBS data are targeted to improve the accuracy of on–time performance reporting and improve schedule adherence.
Average Miles between Service Interruptions The target for average miles between service interruptions is proposed to remain at 15,000 miles. Foothill Transit received 76 new coaches in FY 2013-2014 that lowered

33
the average age of the fleet and is expected to reduce the number of mechanical service interruptions.
Complaints per 100,000 Boardings The target for FY 2014-2015 has been increased from 10.25 complaints per 100,000 boardings to 15.00 per 100,000 boardings in light of customer service improvements that will increase the number of channels through which customers may provide feedback to Foothill Transit.
Average Time to Answer (Average Hold Time) To improve transparency, this target, previously known as “average hold time,” will be renamed to “average time to answer.” The target will be measured in the same way as in previous fiscal years. It represents the average time that customers calling a Transit Store for assistance must wait before their call is answered by a customer service representative.
Boardings per Service Hour The FY 2014-2015 boardings per service hour target will increase slightly to 19.5, as the agency anticipates ridership to increase slightly in response to continued service enhancements next year.
Average Weekday Boardings Weekday boardings are projected to increase by approximately one percent to 48,900 in FY 2014-2015 in line with the projected modest increase in overall ridership in the coming year.
Farebox Recovery Ratio The FY 2014-2015 farebox recovery ratio of 24.65 percent is a direct ratio between budgeted fare revenues and operating expenses projected for the year. It takes into account the projected increase in operating expenses for continued service enhancements and the comprehensive operational analysis.
Average Cost per Vehicle Service Hour The FY 2014-2015 average cost per vehicle service hour target of $101.48 is a direct ratio between overall operating expenses and planned service hours during the year. This figure is a five percent increase compared to end of year projections for FY 2013-2014.

34
MAJOR INITIATIVES FOR FY 2014-2015 Bus Replacement Project 30 new 42-foot CNG coaches will be delivered to Foothill Transit this year. The new buses will be equipped with standardized passenger amenities, including high-back reclining seats, individual overhead reading lights, and luggage racks. These coaches will replace the CNG buses that have met the FTA required bus replacement guideline of having at least 500,000 miles or have been in service for 12 years. In addition, procurement action will be underway for additional CNG coaches to replace coaches that are eligible for retirement.
Comprehensive Operational Analysis (COA) Development Foothill Transit has already started work on a Comprehensive Operational Analysis, a robust, analytical plan to optimize current transit services, maximize underutilized resources, and expand the system in an efficient manner to provide the most effective bus network for customers in the San Gabriel and Pomona Valley. Most of the work on this project will occur during FY 2014-2015.
College Pass Program The successful adoption of the Class Pass programs at Mt. SAC and University of La Verne is important for the future of the Class Pass program. Foothill Transit will continue to grow the Class Pass program by partnering with other major colleges and universities across the San Gabriel and Pomona Valleys.
Customer Service Training Expansion Foothill Transit’s Customer Service training program will be updated and enhanced. The roll-out of the Foothill Transit-specific Customer Service Training program to all front-line staff will focus on our history and on the characteristics that set an outstanding transit system apart from other transit providers.
ISO 14001 Certification at Pomona ISO 14001 certification will be the goal at the Pomona Operations and Maintenance Facility this year. This certification mitigates the environmental impacts of our daily operations at the yard. For this process, key environmental and sustainability goals are set and plans implemented to achieve these goals. Once completed, both Pomona and Arcadia facilities will be ISO 14001 certified.
Legislative Advocacy “The Moving Ahead for Progress in the 21st Century” (MAP-21) surface transportation authorization bill is set to expire on September 30, 2014. As part of its 2014 legislative program, Foothill Transit will urge Congress and work with our federal delegation to act on a longer-term surface transportation authorization measure.

35
Arcadia Operations Contract Procurement During FY 2014-2015, the contract for operations and maintenance at Foothill Transit‘s operations and maintenance facility in Arcadia/Irwindale will be re-procured. Together with the contract for operations and maintenance at our operations and maintenance facility in Pomona, these represent the core of Foothill Transit‘s service and the new or incumbent contractor will be responsible for delivery of service to our customers for the next four years or more. Several aspects of the contracts will be modified to fully incorporate the organization‘s SMARTBus system, and include contract incentives that encourage enhanced service delivery while targeting operating efficiency.
San Gabriel Valley Park & Ride Facilities Several Park & Ride facilities are in varying stages of development in the San Gabriel Valley to address the needs of Foothill Transit’s commuting customers:
Phase II design for the Azusa Intermodal Parking Facility is underway and the Invitation for Bid (IFB) for construction of the four-level, 547 space parking facility is slated for issuance in July 2014. Construction is anticipated to begin in October 2014 with an estimated completion date in October 2015.
The West Covina Transit Center and Park & Ride Project is currently on hold. The location of the new proposed parking structure was partially owned by the City of West Covina's Redevelopment Agency and the West Covina Mall has new owners. It is hoped that work can resume on this project in FY 2014-2015.
SMARTBus System (SBS) Replacement Foothill Transit’s aging computer aided dispatch and automated vehicle location (CAD/AVL) system will be replaced. The new system will include enhancements to better monitor on-street service in real time, while providing more accurate data for use by our customers for their daily travel and by agency staff for system planning and reporting purposes.

36
THIS PAGE IS INTENTIONALLY LEFT BLANK

FOOTHILL TRANSITBUSINESS PLAN AND BUDGET
AGENCY FUNDING AND OPERATING BUDGET

38
THIS PAGE IS INTENTIONALLY LEFT BLANK

39
FUNDING SOURCES Foothill Transit is funded through a combination of operating revenues and non-operating revenues.
The following funds are allocated by the Regional Transportation Planning entity (LA Metro) to Los Angeles County fixed-route transit operators through the Formula Allocation Procedure (FAP) and the Capital Allocation Procedure (CAP). The FAP uses vehicle service miles and passenger revenues to apportion the available revenues into percentage shares. The CAP uses total vehicle miles and active fleet size (National Transportation Database data) to apportion the shares.
Transportation Development Act (TDA) Article 4 These funds are derived from a statewide one-quarter cent sales tax that is deposited into the State Local Transportation Fund; they are eligible for capital and operating uses.
State Transit Assistance Funds (STA) These funds are derived from excise taxes on diesel fuel; they are eligible for use on transit capital and operating expenses.
Proposition A 40% Discretionary These funds are derived from a 1980 voter approved one-half cent local sales tax ordinance known as Proposition A; they may be used for operations or capital. This also includes the Prop A Bus Service Continuation Program (BSCP).
Measure R 20% These funds are derived from a 2008 voter approved sales tax ordinance known as Measure R; they are eligible for bus operating expenses.
Proposition C 40% (Discretionary) These funds are designated through the following LA Metro Board adopted programs: 1) Municipal Operator Service Improvement Program (MOSIP); 2) Bus System Improvement Plan Overcrowding Relief on Lines 480/481 and 707; 3) Transit Service Expansion on Line 690; 4) Base Restructuring on Lines 497/498 and local Saturday service on various lines, eligible for capital and operations; and, 5) Prop 1B Bridge funding eligible for public transportation modernization improvements and service enhancements, and security expenditures.
Proposition C 5% Transit Security These funds are distributed based on total unlinked passenger trips; they are eligible for operating or capital transit security expenditures.
Federal Urban Area Formula Program (Section 5307) These funds are based on the LA Metro Capital Allocation Procedure (CAP); they are used for capital improvements and require 20% local match.
Federal Bus and Bus Capital Program (Section 5339, formerly Section 5309) These funds are allocated through the CAP; they are used for capital improvements and require 20% local match.

40
Federal State of Good Repair Program Section 5337 These funds are allocated through the CAP; they are used to maintain, replace and rehabilitate vehicles and transportation equipment; they require 20% local match.
Federal Congestion Mitigation and Air Quality (CMAQ) These funds are programmed for diesel retrofit projects and programs, cost-effective emission reduction activities and congestion mitigation projects that provide air quality benefits. Foothill Transit received a $3.2 million grant for the Congestion Reduction Mitigation project to increase service on the Silver Streak and Line 699.
Auxiliary Revenue Foothill Transit operates a park and ride shuttle service for the Rose Bowl and a Dial-a-Ride shuttle service for the City of Monrovia. These special services revenues are eligible for operating and capital expenditures.

41
OPERATING REVENUES
FY 12-13 Actual
FY 13-14 Budget
Actual Through Dec 2014
FY 13-14 Estimate
FY 14-15 Budget
Fare Revenue:
Farebox $ 10,885,441 $ 11,100,000 $ 5,123,914 $ 10,968,270 $ 11,170,000
Pass Sales 3,256,125 3,100,000 1,510,108 3,020,220 3,100,000
TAP Cash Purse 2,335,453 2,200,000 1,269,712 2,539,430 2,200,000
Metrolink 508,030 500,000 282,208 564,420 500,000
EZ Transit Passes 1,456,385 1,900,000 841,330 1,682,660 1,900,000
Total Fare Revenue 18,441,434 18,800,000 9,027,272 18,775,000 18,870,000
Non-Fare Revenue:
TDA 9,786,046 18,513,600 10,414,956 11,983,402 22,181,644
Prop A Discretionary 13,026,271 13,484,000 6,741,978 13,483,950 13,834,445
Prop A BSCP 4,011,067 4,298,700 2,149,638 4,299,270 4,367,348
Transit Security 708,594 790,600 395,322 790,650 849,685
Prop C
Restructuring 1,813,737 1,848,000 924,102 1,848,200 1,890,706
Prop C
Line 690 302,245 308,000 153,996 307,990 315,071
Prop C
BSIP 844,426 860,000 430,236 860,470 880,260
STA 4,890,137 3,913,300 1,956,636 3,913,270 2,744,299
Measure R 7,886,309 9,352,100 4,676,052 9,352,100 9,902,812
Federal Section
5307 - - - - -
CMAQ 506,488 1,000,000 863,191 1,726,380 1,000,000
Auxiliary Revenue 1,907,724 1,500,000 798,053 1,596,110 1,500,000
Total Non-Fare
Revenue 45,683,044 55,868,300 29,504,160 50,161,792 59,466,270
TOTAL
REVENUE $ 64,124,478 $ 74,668,300 $ 38,531,432 $ 68,936,792 $ 78,336,270

42
OPERATING EXPENSES
FY 12-13 Actual
FY 13-14 Budget
Actual Through Dec 2014
FY 13-14 Estimate
FY 14-15 Budget
Transit Operating Expenses:
Customer Service & Operations $ 54,829,773 $ 61,539,200 $ 27,977,835 $ 58,547,687 $ 65,268,600
Maintenance & Vehicle Technology 50,033 830,600 241,403 497,977 682,600
Marketing & Communications 1,471,333 1,898,600 809,276 1,618,551 1,654,800
Planning 565,132 1,964,100 281,190 741,308 1,760,700 Information Technology 1,560,357 2,038,100 607,450 1,780,579 1,876,600
Administration 1,803,004 1,876,300 1,205,030 2,406,315 2,835,400
Procurement 624,984 855,600 266,366 609,442 820,300
Finance 1,138,798 1,206,100 329,118 846,427 1,043,600
Facilities 534,907 583,800 233,384 470,871 594,190 Total Transit
Operating Expense 62,578,321 72,792,400 31,951,052 67,519,156 76,536,790
Non-Transit Operating Expenses:
Property Management 674,498 800,900 283,172 566,344 724,480
Special Services 168,930 325,000 77,518 155,036 325,000
Dial-A-Ride 702,729 750,000 348,128 696,256 750,000 Total Non-Transit
Operating Expense 1,546,157 1,875,900 708,818 1,417,636 1,799,480
TOTAL EXPENSES
$ 64,124,478 $ 74,668,300 $ 32,659,870 $ 68,936,792 $ 78,336,270

FOOTHILL TRANSITBUSINESS PLAN AND BUDGET
CAPITAL BUDGET

44
THIS PAGE IS INTENTIONALLY LEFT BLANK
45
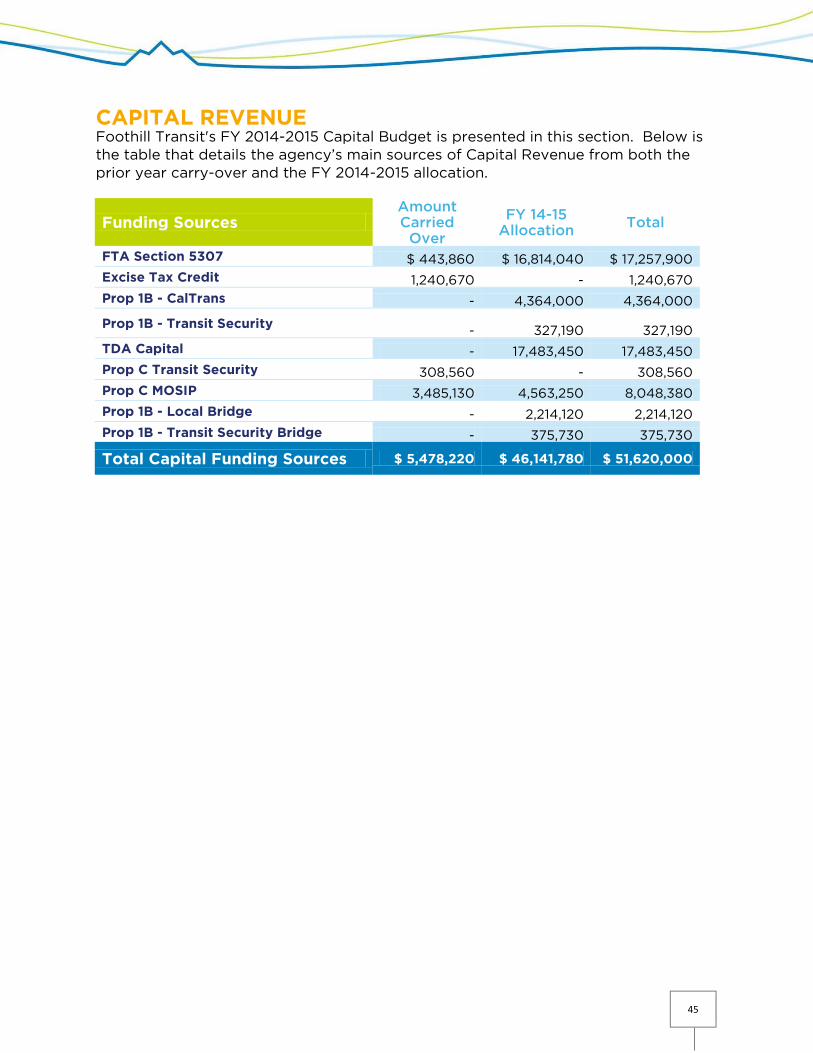
CAPITAL REVENUE Foothill Transit's FY 2014-2015 Capital Budget is presented in this section. Below is the table that details the agency’s main sources of Capital Revenue from both the prior year carry-over and the FY 2014-2015 allocation.
Funding Sources Amount Carried
Over
FY 14-15 Allocation Total
FTA Section 5307 $ 443,860 $ 16,814,040 $ 17,257,900
Excise Tax Credit 1,240,670 - 1,240,670
Prop 1B - CalTrans - 4,364,000 4,364,000
Prop 1B - Transit Security
- 327,190 327,190
TDA Capital - 17,483,450 17,483,450
Prop C Transit Security 308,560 - 308,560
Prop C MOSIP 3,485,130 4,563,250 8,048,380
Prop 1B - Local Bridge - 2,214,120 2,214,120
Prop 1B - Transit Security Bridge - 375,730 375,730
Total Capital Funding Sources $ 5,478,220 $ 46,141,780 $ 51,620,000
46
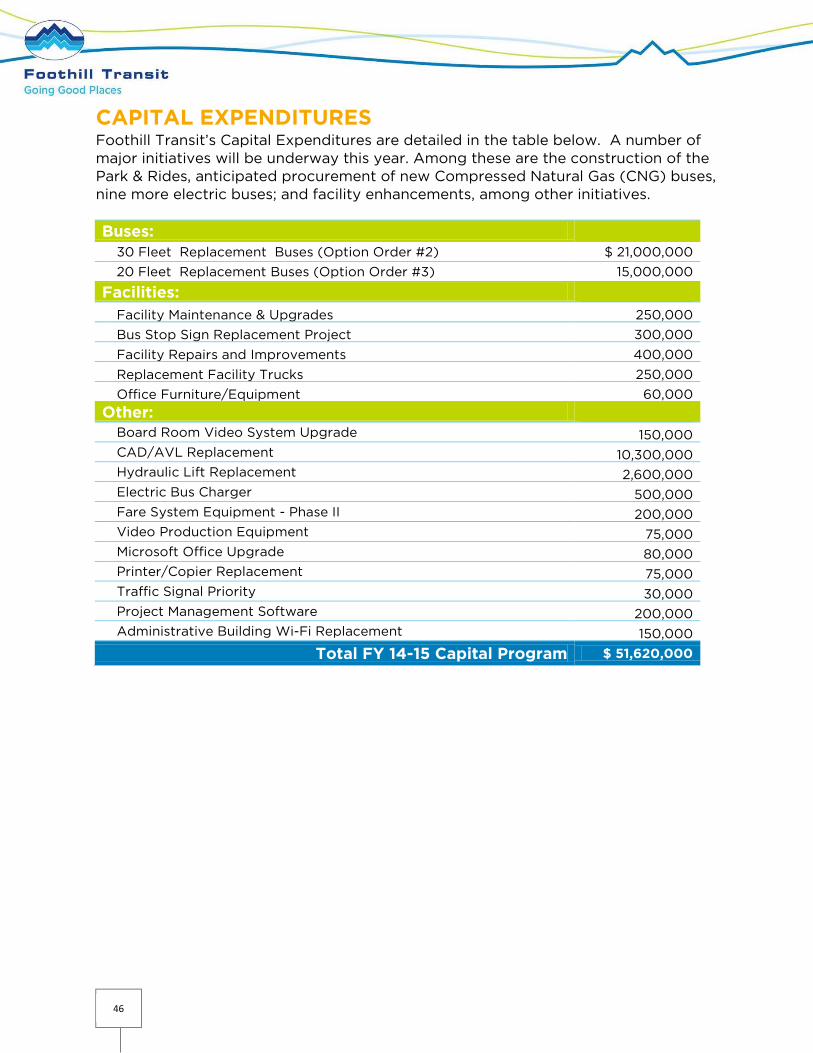
CAPITAL EXPENDITURES Foothill Transit’s Capital Expenditures are detailed in the table below. A number of major initiatives will be underway this year. Among these are the construction of the Park & Rides, anticipated procurement of new Compressed Natural Gas (CNG) buses, nine more electric buses; and facility enhancements, among other initiatives.
Buses:
30 Fleet Replacement Buses (Option Order #2) $ 21,000,000
20 Fleet Replacement Buses (Option Order #3) 15,000,000
Facilities:
Facility Maintenance & Upgrades 250,000 Bus Stop Sign Replacement Project 300,000 Facility Repairs and Improvements 400,000 Replacement Facility Trucks 250,000
Office Furniture/Equipment 60,000
Other:
Board Room Video System Upgrade 150,000
CAD/AVL Replacement 10,300,000
Hydraulic Lift Replacement 2,600,000
Electric Bus Charger 500,000
Fare System Equipment - Phase II 200,000
Video Production Equipment 75,000
Microsoft Office Upgrade 80,000 Printer/Copier Replacement 75,000
Traffic Signal Priority 30,000
Project Management Software 200,000
Administrative Building Wi-Fi Replacement 150,000
Total FY 14-15 Capital Program $ 51,620,000

47
CAPITAL CARRY OVER The FY 2014-2015 Capital Budget carry over includes capital projects approved in prior fiscal years that are not complete as of December 31, 2013.
Buses: Budget Expenditures Balance 30 Replacement Buses (Option Order #1) 22,999,940 - 22,999,940
Electric Buses – FY 13-14 2,500,000 - 2,500,000
Facilities:
Facility Repairs & Improvements 1,660,000 1,446,658 213,342
Admin Office Maintenance & Upgrades 1,000,000 834,765 165,235
Facility Security Upgrades/Hardening 2,556,530 2,270,962 285,568
Azusa Park & Ride 9,490,400 589,043 8,901,357
City of Industry Park & Ride 14,904,300 13,057,974 1,846,326
West Covina Park & Ride 12,938,310 22,000 12,916,310
Transit Center - West Covina 5,000,000 - 5,000,000
Bus Stop Enhancement Program (BSEP) 1,000,000 56,380 943,620
Facility Rehab/Repair/Maintenance 1,000,000 - 1,000,000
Puente Hills Transit Store Remodel 500,000 85,112 414,888
Other:
System Performance Dashboard 600,000 263,536 336,464
Security Equipment 250,000 84,103 165,897
Financial Software 300,000 248,581 51,419
Traffic Signal Priority 1,500,000 1,465,159 34,841
Web Page Development 150,000 55,339 94,661
Office Equipment/Furniture 155,355 99,818 55,537
Bus Stop Customer Information 600,000 168,587 431,413
Document Imaging Equipment 300,000 108,226 191,774
SBS Operating System Upgrade 100,000 44,443 55,557
I.T. Infrastructure – FY 12-13 250,000 188,384 61,616
Fleet Heavy Maintenance-FY 12-13 500,000 126,102 373,898
Board Room Audio Upgrade 100,000 9,334 90,666
Website Redesign 100,000 12,709 87,291
I.T. Infrastructure – FY 13-14 250,000
250,000
Fleet Heavy Maintenance-FY 13-14 1,795,300 1,795,300
Fare System Equipment - Phase I 400,000 7,585 392,415
Transit Store Security System 663,460 - 663,460
Data Center Upgrade/Replacement 800,000 758,399 41,601
Phone System Replacement 250,000 197,546 52,454
Totals $ 84,613,595 $ 22,200,745 $ 62,412,850

48
THIS PAGE IS INTENTIONALLY LEFT BLANK

FOOTHILL TRANSITBUSINESS PLAN AND BUDGET
DEPARTMENT BUDGET

50
THIS PAGE IS INTENTIONALLY LEFT BLANK

51
DEPARTMENT BUDGETS AND SUMMARIES Foothill Transit's operating budget for FY 2014-2015 is presented in this section. A brief description of each department has been provided. A list of each department's specific initiatives for FY 2014-2015 is presented and the operating budget for each department is shown. The department budgets are presented in the following order: Customer Service and Operations Maintenance and Vehicle Technology Marketing and Communications Planning Information Technology Administration Procurement Finance Facilities

52
CUSTOMER SERVICE AND OPERATIONS The Customer Service and Operations department was established in FY 2012-2013 to more effectively focus on key components of the agency’s mission. This department is responsible for ensuring the safe and efficient daily operation of Foothill Transit service, focusing specifically on applied enforcement of agency standards for operating performance.
The department also works closely with the Foothill Transit Stores to improve the customer service experience, from when a customer calls for information about their proposed trip, to the actual completion of their bus ride, and through the customer feedback process.
FY 2013-2014 ACCOMPLISHMENTS
Conducted coach operator audits Renewed efforts on management gate checks at Arcadia and Pomona
Operating Facilities Developed Contractor Accident/Incident Communication Process Established Performance Improvement Plan for Arcadia Operations Executed updated Memorandum of Understanding with Metrolink for Bus
Bridge service Conducted two Operations Workshop Developed Front Line Employee Recognition Program Intensified Quality Assurance Team enforcement of contract compliance Provided additional training on customer comment handling process
Dir
ecto
r o
f C
usto
mer
Ser
vice
an
d O
per
atio
ns
Operations Contract Manager
Quality Assurance
Inspectors (3)
Quality Assurance
Analyst
Safety Compliance Coordinator
Customer Service and Operations Administrative
Assistant
Receptionist

53
Incorporated social media comments into customer comments Provided premium Rose Bowl special shuttle services Provided LA Marathon special shuttle services Participated in new bus delivery acceptance process Incorporated Transit Store and Safety function into Operations Incorporated Quality Assurance Analyst position Completed facility security enhancements at all Foothill Transit facilities
FY 2014-2015 INITIATIVES
Procure new Arcadia Operations Contract Complete Headsign Standardization Project Prepare documentation for Federal Transit Administration Triennial Review Refine TransTrack reporting system Incorporate new telephone system reports into KPI and Customer Service
Initiatives Update the TSA Baseline Assessment and Security Enhancement (BASE)
Review of security systems Implement Front Line Customer Service Recognition Program Conduct table-top exercises with TSA and local municipal transit providers

54
Account Number
Account Name FY 12-13 Actual
FY 13-14 Budget
FY 13-14 Estimate
FY 14-15 Budget
5001 Arcadia Express Lines $ 6,716,561 $ 7,061,300 $ 7,358,917 $ 11,629,400
5002 Arcadia Local Lines 16,735,978 18,620,600 17,784,351 18,771,600
5003 Pomona Express Lines 6,954,134 7,589,500 7,878,929 8,968,800
5004 Pomona Local Lines 14,529,857 15,808,400 15,830,292 16,741,900
5020 Fuel - CNG Arcadia 2,095,906 3,060,000 2,387,270 3,000,000
5025 Fuel - CNG Pomona 3,012,354 4,284,000 3,646,921 3,000,000
5030 Diesel Fuel - Arcadia 662,967 1,000,000 367,890 -
5035Electricity Fuel - Pomona 63,588 94,800 46,743 260,000
5100 Salary, Wages & Benefits - 883,400 753,766 908,000
5150 Contracted Services -Transit Stores - - - 1,471,900
5152 Contracted Services -Management 1,306,520 - - -
5260 Professional/Technical 89,384 31,000 5,050 44,000
5411 Bus Roadeo 31,920 50,000 - 70,000
5430 Dues and Subscription 165 500 - 1,600
5441 Postage/Express Mail 747 500 7 1,600
5550 Travel and Meeting 32,509 12,900 9,085 13,700
5710 Transit Store Lease - - - 95,600
5720 Other Miscellaneous Contract Services 46,359 - - 36,900
5730 Other Misc. Expenses 9,124 5,000 1,901 14,200
5740 Other Services 253,394 212,000 198,788 210,000
5800 Clothing Supplies 2,798 5,500 5,299 4,800
5850 Office Supplies - - - 6,400
5950Repair and MaintenanceOther Equip 201 - - 6,600
5960 Repair and Maintenance Vehicles 8,599 - - -
5991 Security - - - 3,800
6100 Electricity - - - 7,800
SUB-TOTAL $ 52,553,063 $ 58,719,400 $ 56,275,209 $ 65,268,600
Transit Stores 1,750,655 1,824,850 1,996,286 -
Safety & Security 526,055 994,950 276,192 -
TOTAL $ 54,829,773 $ 61,539,200 $ 58,547,687 $ 65,268,600
Budget Notes: • Increase in Account 5001 reflects service increase and operating contract
changes • Account 5740 - Other Services includes SMARTBus Radio System
• Responsibility for Transit Stores including management of the service contract and responsibility for Safety and Security have been transferred to Customer Service and Operations for FY 2014-2015

55
• The FY 2012-2013 and FY 2013-2014 history for Accounts 5850, 5950, 5991 and 6100 are included in the summary lines for “Transit Stores” and “Safety and Security”
• Responsibility for Account 5960 - Repair Maintenance Vehicles has been transferred to Maintenance and Vehicle Technology

56
MAINTENANCE AND VEHICLE TECHNOLOGY The Maintenance and Vehicle Technology (MVT) Department ensures daily operation of Foothill Transit’s revenue and non-revenue vehicle fleet through the systematic enforcement of Foothill Transit standards for fleet maintenance and oversight of maintenance on fueling stations, including the electric bus charging station. The MVT Department ensures ongoing local, state and federal regulatory compliance of the fleet and environmental compliance of the operations. In addition, the MVT department is responsible for the development and implementation of Foothill Transit’s alternative fuels program including the specification, in-plant inspection, and acceptance of all new rolling stock and technologies to maximize efficiencies in both operations and maintenance.
FY 2013-2014 ACCOMPLISHMENTS
Implemented bus inspection standards to ensure 100% contractor compliance Retired the last 23 diesel buses Procured and put into service 64 42 ft. low floor CNG buses Procured and put into service 12 35 ft. low floor fast-charge electric buses Incorporated new livery on new NABI buses and electric buses Managed State of Good Repair fleet retrofits on 171 buses Completed in-plant bus inspections on 64 CNG bus and 12 electric bus
purchases
Dir
ecto
r o
f M
aint
enan
ce a
nd
Veh
icle
Tec
hno
log
y Maintenance and Vehicle Technology
Manager
Mechanical Service Quality Inspector (2)

57
Continued City of Monrovia Dial-A-Ride fleet inspection services FY 2014-2015 INITIATIVES
Complete full electrification of Line 291 Procure 30 42 ft. Low Floor CNG buses Inspect, accept, and deploy 30 new CNG buses into revenue service Implement ESMS at Pomona Operations and Maintenance Facility Develop and implement Surveillance Equipment Audit Develop and implement CAD/AVL Equipment Audit
Account Number
Account Name FY 12-13 Actual
FY 13-14 Budget
FY 13-14 Estimate
FY 14-15 Budget
5040 Gas and Lubricants $ 31,993 $ 60,000 $ 28,172 $ 35,000
5100 Salaries, Wages and Benefits - 487,200 384,231 462,900
5230 Consulting - 5,000 - 9,000
5260 Professional/Technical - 139,300 40,616 124,500
5430 Dues and Subscription - 500 - 500
5441 Postage/Express Mail - 500 1,414 2,000
5540 Tires 1,459 10,000 - 5,000
5550 Travel and Meeting - 22,300 22,609 18,000
5570 Vehicle Washing 7,982 10,100 7,263 9,000
5720 Other Miscellaneous Contractual Service - 70,700 449 1,700
5730 Other Miscellaneous Expenses - 5,000 3,353 5,000
5970Repair and Maintenance Vehicles 8,599 20,000 9,870 10,000
TOTAL $ 50,033 $ 830,600 $ 497,977 $ 682,600
Budget Notes: • Account 5260 – Professional and Technical includes the Zonar annual fee for
bus fleet audits and fleet audit for contactor turnover at Arcadia facility • Account 5230 – Consulting includes SMARTBus equipment audits and
maintenance training

58
MARKETING AND COMMUNICATIONS The Marketing and Communications Department supports and promotes Foothill Transit's services and promotes and maintains the Foothill Transit brand. The primary responsibility of the department is to communicate information to existing and potential customers and encourage them to ride Foothill Transit. We do this through advertising, community relations, media exposure, special events, on-board notices, interior cards, the Bus Book, and website. The Marketing Department is also responsible for heightening the public's awareness of Foothill Transit and increasing ridership. The department's main focus is to promote how the organization meets its goals of providing outstanding customer service and operating a safe, effective and efficient transit system. Foothill Transit will continue to utilize a combination of print, cable TV, and direct mail to reach our markets.
FY 2013-2014 ACCOMPLISHMENTS
Incorporated new real-time customer information system into marketing and communications programs
Redesigned foothilltransit.org to incorporate new branding elements Designed and oversaw installation of new Foothill Transit livery Launched the 25th anniversary campaign Expanded new media outreach to incorporate new technologies and data
analysis Launched Mt. SAC Student Pass Program marketing initiative Participated in the remodel and design of the Puente Hills Transit Store Updated Foothill Transit facility artwork and initiated new student art program
Dir
ecto
r o
f M
arke
ting
and
C
om
mun
icat
ions
Manager of Community Engagement
New Media and Customer Relations
Coordinator
Marketing and Communication
Coordinator
Marketing and Communications
Assistant

59
Launched localized marketing and communications initiatives to drive new riders for Line 495
Organized grand opening event for the Industry Park & Ride
FY 2014-2015 INITIATIVES
Launch real-time customer information system to customers Continue marketing initiatives as part of the Class Pass program Update Foothill Transit facility artwork and initiate new student/local artist art
program Centralize and expand online communication through the new website and
incorporate digital media to optimize Coordinate public arts requirement at the Azusa Park & Ride Organize grand opening event for the Azusa Park & Ride Expand and maintain ridership initiatives such as Silver2Silver, College Class
Pass program and introduce new initiatives for Commuter Express service Assist in the outreach for future Park & Rides Develop destination type marketing initiatives highlighting community
connections and events Synthesize COA data to inform strategic marketing decisions

60
Account Number
Account Name FY 12-13 Actual
FY 13-14 Budget
FY 13-14 Estimate
FY 14-15 Budget
5100 Salaries, Wages and Benefits - $ 596,300 $ 416,847 $ 462,800
5152 Contracted Services -Management 572,200 - - -
5230 Consulting 309,809 385,600 523,697 387,900
5260 Professional and Technical 34,092 77,500 43,176 90,500
5300 Advertising and Promotion 26,983 15,000 - 15,000
5330 Community Sponsorship 48,910 60,000 45,450 60,000
5350 General Advertising 252,879 300,000 307,209 300,000
5370 Promotional item 69,168 75,000 56,886 75,000
5380 Special Events 23,824 135,000 79,266 20,000
5411 Team Member Appreciation - 10,000 - 10,000
5430 Dues and Subscription 8,424 6,000 13,416 14,000
5441 Postage/Express Mail 4,407 9,600 7,267 9,600
5550 Travel and Meeting 13,464 15,200 20,719 20,800
5720 Other Miscellaneous Contractual Service 646 800 598 800
5730 Other Miscellaneous Expenses 1,051 1,000 1,779 1,000
6220 Event Coordination 1,019 - 363 3,800
6230 Footnotes 28,770 35,000 28,733 35,000
6240 Interior Cards 40,171 60,000 48,756 70,000
6250 Marketing Supplies 10,380 6,600 1,335 6,600
6270 Photography 6,214 80,000 - 30,000
6280 Printing Charges 18,922 25,000 23,054 37,000
6290 Reprints of Brochures - 5,000 - 5,000
TOTAL $1,471,333 $1,898,600 $1,618,551 $ 1,654,800

61
PLANNING The Planning Department is responsible for route planning, system performance monitoring, coordination with member cities and neighboring transit systems in the design and construction of transit related projects. The department works closely with cities to make sure bus stop locations are safe and ADA compliant. The department also projects service levels and budgets and monitors actual costs related to Foothill Transit’s two service contracts.
FY 2013-2014 ACCOMPLISHMENTS
Improved schedule adherence by adjusting route run times Launch Line 495 Pilot Completed the procurement of the Comprehensive Operational Analysis
(COA) Began testing the NexTrip real time customer information system Launched service enhancements that provided uniform and continuous service
throughout the day Updated the base map in the scheduling software to improve system routing
FY 2014-2015 INITIATIVES
Evaluate performance of Line 495 and determine if line should be implemented permanently
Complete the Comprehensive Operational Analysis (COA) Implement cellular based GPS on the buses as part of the roll-out of the
NexTrip real time customer information system Complete the Bus Signal Prioritization Project
Dir
ecto
r o
f P
lann
ing
Planning Manager
Transit Planner (2)

62
Complete the first draft of a Foothill Transit Planning Standards Guideline
Account Number
Account Name FY 12-13 Actual
FY 13-14 Budget
FY 13-14 Estimate
FY 14-15 Budget
5100 Salaries, Wages and Benefits - $ 504,000 $ 423,989 $ 446,900
5152 Contracted Services -Management 483,600 - - -
5230 Consulting 8,702 15,000 19,404 60,000
5260 Professional/Technical - 900,000 110,000 860,000
5430 Dues and Subscription 30 400 - 1,200
5441 Postage/Express Mail 702 1,000 613 1,000
5530 System Map - 50,000 - 50,000
5550 Travel and Meeting 4,937 22,000 21,930 20,500
5720 Other Miscellaneous Contractual Service 484 150,600 83,372 -
5860 Other Material and Supplies - 6,100 - 6,100
5880 Planning Supplies - 40,000 - 40,000
6200 Bus Book Printing 66,677 275,000 82,000 275,000
TOTAL $ 565,132 $ 1,964,100 $ 741,308 $ 1,760,700
Budget Notes: • Account 5230 – Consulting includes Hastus training and GIS analysis • Account 5430 – Dues and Subscription includes membership fees for Rotary
and WTS • Account 5880 – Planning Supplies includes GIS Maps, Transit Tube Inserts and
other materials printing costs

63
INFORMATION TECHNOLOGY The Information Technology (IT) Department is responsible for management, coordination, and implementation of information technology to ensure timely and cost-effective delivery of services to the public. The department provides data and communication solutions to Foothill's administrative staff, the Transit Stores, and the Operations and Maintenance contractors to achieve Foothill Transit’s goals and objectives.
FY 2013-2014 ACCOMPLISHMENTS
Virtualized SMARTBus system for better performance and operational stability Upgraded our Data Center with newer and faster technology and storage Replaced phone system with Cisco phones using SIP technologies Progressed NextBus Real-Time Bus Information System, into test phase. Implemented new Laserfiche archival and document system Implemented email redundant failover configuration to meet disaster recovery
plan best practices
FY 2014-2015 INITIATIVES
Begin the process to replace outdated CAD/AVL and radio hardware Implement a virtual disaster recovery plan for our data infrastructure to
comply with insurance standards
Dir
ecto
r o
f In
form
atio
n Te
chno
log
y
Network Manager
Help Desk Administrator
Information Technology Application Specialist

64
Upgrade wireless infrastructure to attain improved performance Update Microsoft Office to the latest version - Office 2013 Upgrade Executive Boardroom’s audio and video systems
Account Number
Account Name FY 12-13 Actual
FY 13-14 Budget
FY 13-14 Estimate
FY 14-15 Budget
5100 Salaries, Wages and Benefits - $ 797,100 $ 554,404 $ 457,600
5152 Contracted Services -Management 764,900 - - -
5430 Dues and Subscription - 600 320 600
5441 Postage/Express Mail 903 1,500 329 1,200
5550 Travel and Meeting 9,518 17,000 18,126 17,000
5650 Data Communication Service 2,068 2,300 1,627 2,300
5660 Internet Service 15,850 20,000 14,741 20,000
5720 Other Miscellaneous Contractual Service 461,033 843,500 820,900 796,700
5810 Computer Supplies 3,579 6,000 840 6,000
5950 Repair and Maintenance Other Equipment 3,817 12,000 10,928 9,000
6130 Telephone 298,689 338,100 358,364 566,200
TOTAL $ 1,560,357 $ 2,038,100 $ 1,780,579 $ 1,876,600
Budget Notes: • Account 5720 – Other Miscellaneous Contractual Service includes software
licenses and maintenance agreements for systems such as Zonar GPS, Hastus, TransTrack, etc.
• Account 6130 – Telephone increased due to improved internet connections to remote locations for SMARTBus operations and the addition of an additional remote location

65
ADMINISTRATION The Administration Department is responsible for providing management direction to all departments within the organization, while executing the strategies and policies of the Executive Board. In addition, the Administration Department coordinates all legislative and intergovernmental affairs for Foothill Transit. The Administration Department also provides agency-wide office support. In FY 2013-2014, a Director of Customer Relations was hired to focus on providing “World Class Customer Service.” Customer Relations interfaces with all departments and is an integral part of everything we do, from employee recruitment to front-line customer interaction.
FY 2013-2014 ACCOMPLISHMENTS
Successfully executed the Board’s direction to convert Foothill Transit’s management structure from contracted personnel to direct employment
Restructured Foothill Transit’s management team in line with organizational goals and to ensure compliance with federal guidelines
Successfully launched Foothill Transit’s Class Pass Pilot Program at Mt. San Antonio College and the University of La Verne
Implemented an electronic document/records management system Worked with contractors to ensure a consistently exceptional approach to
Customer Relations
Exe
cuti
ve D
irec
tor Deputy
Executive Director
Director of Customer Relations
Human Resources Manager
Director of Government
Relations Special Projects
Manager
Board Support Services Manager/ Executive Assistant
Administrative Assistant

66
Focused attention directly on customer issues to give ”Executive” level focus Set stage for new Customer Service Training Program Advocated for federal funding for Foothill Transit capital projects Advocated for passage of a new surface transportation funding authorization
bill Strengthened industry involvement and enhanced Foothill Transit’s visibility
and influence with the American Public Transportation Association, California Transit Association and Access Services
Maintained industry involvement in Conference of Minority Transportation Officials and Women‘s Transportation Seminar
FY 2014-2015 INITIATIVES
Implement an agency-wide Customer Service Training program Standardize customer response process Expand Foothill Transit’s Class Pass Program to include additional service area
colleges and universities Ensure progress toward completion of San Gabriel Valley Park & Ride projects Increase Disadvantaged Business Enterprise and Small Business Development
participation in Foothill Transit’s federally-funded projects Maintain effective Executive Board and Governing Board communications Advocate for Foothill Transit‘s interests in the upcoming Federal Funding
Authorization legislation Maintain Foothill Transit involvement in industry organizations such as
American Public Transportation Association, California Transit Association, Access Services, Conference of Minority Transportation Officials and Women‘s Transportation Seminar

67
Account Number
Account NameFY 12-13 Actual
FY 13-14 Budget
FY 13-14 Estimate
FY 14-15 Budget
5100 Salaries, Wages and Benefits - $ 806,500 $ 1,445,111 $ 1,473,400
5152 Contracted Services -Management 684,280 - - -
5230 Consulting 50,391 45,000 42,001 55,000
5250 Legal Fees 259,127 310,000 182,085 310,000
5265 Public Affairs 157,561 183,000 166,899 173,000
5400 Agenda Mailings - 3,200 - 3,200
5410 Board Procurement 283,000 50,000 - 50,000
5412 Board Stipend 21,233 35,800 29,381 45,000
5421 Copier 16,604 21,800 22,238 21,800
5430 Dues and Subscription 62,904 74,900 80,441 75,300
5441 Postage/Express Mail 1,902 5,000 2,745 5,000
5500 Mail Equipment Lease 4,888 13,700 8,180 8,400
5545 Training and Development - - - 200,000
5550 Travel and Meeting 108,946 120,000 230,000 200,000
5600 Auto Insurance 23,042 26,400 24,750 26,400
5610 Commercial Property 19,703 29,500 28,180 25,000
5620 Directors and Officers Liability 9,804 12,000 15,457 15,000
5630 Liability/Excess Liability Insurance 51,002 58,200 79,532 92,600
5720 Other Miscellaneous Contractual Service 3,555 4,000 3,889 1,500
5740 Other Services 748 1,800 1,118 1,800
5850 Office Supplies 43,285 55,500 44,308 53,000
6280 Printing Charges 1,029 20,000 - -
TOTAL $ 1,803,004 $ 1,876,300 $ 2,406,315 $ 2,835,400
Budget Notes: • Account 5100 - Salaries, Wages and Benefits includes budget assumptions for
employee pay for performance, administration fees for the retirement plan, administration of the transit subsidy program, one new employee and annual health plan cost increases
• Account 5545 - Training and Development includes budget for the tuition reimbursement program and other management training programs
• Account 5630 – Liability/Excess Liability increased in October 2013 with the addition of property insurance for the Industry Park and Ride structure

68
PROCUREMENT The Procurement Department is responsible for ensuring timely acquisition of goods and services to support Foothill Transit’s mission. The Procurement Department also provides support for Foothill Transit’s Disadvantaged Business Enterprise program.
FY 2013-2014 ACCOMPLISHMENTS
Procured new livery and livery installation services Completed request for proposals for Comprehensive Operational Analysis Procured new electronic records management system and hardware; a system
that will enhance Foothill Transit’s mission of going green by adding paperless capabilities
Procured phone system and data center upgrades Procured 12 electric coaches and 30 additional CNG coaches Provided organization-wide procurement training to ensure compliance with
FTA guidelines
FY 2014-2015 INITIATIVES
Ensure successful and timely procurement of goods and services to support Foothill Transit’s mission
Ensure Foothill Transit’s Procurement Manual remains consistent with federal and state procurement guidelines
Implement a centralized electronic database for procurement documents Manage necessary procurements for the Azusa Park and Ride project Manage the procurement of additional CNG coaches
Dir
ecto
r o
f P
rocu
rem
ent
Procurement Manager
Records Specialist

69
Account Number
Account NameFY 12-13 Actual
FY 13-14 Budget
FY 13-14 Estimate
FY 14-15 Budget
5100 Salaries, Wages and Benefits - 353,200 272,163 $ 327,900
5152 Contracted Services -Management 338,900 - - -
5230 Consulting - 10,000 - 10,000
5250 Legal Fees 233,977 390,000 306,353 390,000
5430 Dues and Subscription - 2,400 500 2,400
5441 Postage/Express Mail - 5,000 - -
5520 RFP - Issuance Cost 23,305 55,000 20,300 50,000
5550 Travel and Meeting 28,801 40,000 10,126 40,000
TOTAL $ 624,984 $ 855,600 $ 609,442 $ 820,300

70
FINANCE The Finance Department provides support services including accounting, financial planning, grant administration, budget development, account receivable billing and collections, and financial reporting for the organization. The department coordinates inventory of fixed assets and is responsible for adhering to local, state and federal requirements in the administration of grant funds. It also administers the required annual financial and compliance audits, oversees the investment portfolio, and monitors cash flow. The department also handles the fare revenue collection and maintenance of related equipment.
FY 2013-2014 ACCOMPLISHMENTS
Updated 15-year financial plan Completed financial audits without any material findings Prepared annual operating and capital budgets Maintained fareboxes and reprogrammed new fare schedules as-needed to
ensure accurate fare collections Received National Government Finance Officers Association award for
excellence in financial reporting Completed farebox laboratory (testing of fare collection system) Installed electronic key box to secure fare collection keys in Arcadia and
Pomona facilities Implemented board-adopted pension fund
Dir
ecto
r o
f Fi
nanc
e
Finance Manager
Senior Accountant
Staff Accountant
Revenue Specialist
Accounting Clerk
Project Accountant

71
FY 2014-2015 INITIATIVES
Update 5-year financial plan Complete procurement of audit services for the annual financial and single-
audit Complete the annual National Transit Database (NTD), Transportation
Performance Measure (TPM), State Controller’s and Comprehensive Annual Financial Reports (CAFR)
Successfully complete FTA Triennial Review and implement plan to navigate potential findings
Implement flex spending for all employees
Account Number
Account Name FY 12-13 Actual
FY 13-14 Budget
FY 13-14 Estimate
FY 14-15 Budget
5100 Salaries, Wages and Benefits - $ 1,065,300 $ 717,558 $ 864,400
5152 Contracted Services -Management 1,053,240 - - -
5210 Audit Fees 43,480 59,000 64,530 72,000
5230 Consulting 219 6,900 - 6,900
5430 Dues and Subscription 905 1,800 1,330 1,700
5441 Postage/Express Mail 1,484 2,100 2,989 3,300
5550 Travel and Meeting 17,741 20,000 4,508 39,500
5720 Other Miscellaneous Contractual Service 807 1,100 803 1,000
5741 Fare Collection Equipment/Maintenance 2,279 9,900 12,085 14,800
6210 Pass Sales Commission 18,644 20,000 18,624 20,000
6260 Fare Media - 20,000 24,000 20,000
TOTAL $ 1,138,798 $ 1,206,100 $ 846,427 $ 1,043,600

72
FACILITIES The Facilities Department is responsible for all of Foothill Transit’s physical assets, including grounds, administrative offices, operations and maintenance facilities and parking structures. The department implements a comprehensive and strategic approach to developing, enhancing, and sustaining Foothill Transit’s physical assets. In addition, the department plays a supporting role in the agency’s bus operations through the installation and upkeep of Foothill Transit’s bus stop signage program.
FY 2013-2014 ACCOMPLISHMENTS
Opened Industry Park & Ride parking structure Completed the CEQA and NEPA environmental requirements for the Azusa
Intermodal Parking Facility Completed the solar expansion project at the Arcadia Operations and
Maintenance Facility Completed the installation of the energy efficient HVAC system at the Pomona
Operations and Maintenance Facility Completed the Fare Collection System Upgrades at the Pomona Operations
and Maintenance Facility Completed the exterior painting upgrade at the Pomona Operations and
Maintenance Facility Upgraded the fire suppression system in the data room of the Administrative
Office with a Proinert Clean Agent Fire Suppression System Began development of the Environmental and Sustainability Management
System (ESMS) Program at the Pomona Operations and Maintenance Facility
Dir
ecto
r o
f Fa
cilit
ies Project Manager
– Construction
Facilities Manager
Facilities Assistant

73
Completed design for the remodel and expansion of the Puente Hills Transit Store
FY 2014-2015 INITIATIVES
Complete the Bus Stop Sign Replacement Project Complete the remodel and expansion of the Puente Hills Transit Store Replace in-ground lifts at the Pomona and Arcadia Operations and
Maintenance Facility Commence construction of Azusa Intermodal Parking Facility Complete Interior painting and upgrade at the Pomona Operations and
Maintenance Facility Implement ESMS at Pomona Operations and Maintenance Facility Achieve ISO14001 Certification for Pomona Operations and Maintenance
Facility Update main entrance and landscaping at the Administrative Office Reseal employee asphalt parking lot at Arcadia Operations and Maintenance
Facility Develop a long-term mechanical equipment replacement plan for Arcadia and
Pomona Operations and Maintenance Facilities and include new equipment for the Industry parking structure

74
Account Number
Account NameFY 12-13 Actual
FY 13-14 Budget
FY 13-14 Estimate
FY 14-15 Budget
5100 Salary, Wages and Benefits - $ 486,892 $ 319,431 $ 384,800
5151 Contracted Services –Facilities 310,480 322,008 288,398 408,500
5152 Contracted Services –Management 465,720 - - -
5260 Professional and Technical - 22,000 - 2,000
5420 Contract Maintenance 44,998 49,400 37,676 50,000
5430 Dues and Subscription 5,064 5,200 2,400 9,500
5441 Postage/Express Mail 19 500 350 500
5471 Janitorial 46,734 46,800 47,987 -
5550 Travel and Meeting 10,906 9,900 23,190 22,600
5560 Uniforms 4,000 6,000 7,537 -
5720 Other Miscellaneous Contractual Service 81,825 115,800 24,597 129,500
5730 Other Miscellaneous Expenses 4,570 1,000 4,499 1,500
5860 Other Material and Supplies 12,056 20,600 2,837 17,000
5890 Safety and Supplies 61 2,000 272 1,000
5910 Tools 7,325 5,000 2,281 9,000
5950 Repair and Maintenance Other Equipment 42,405 13,000 14,446 16,700
5990 Safety Programs 500 1,200 - 1,200
5991 Security 8,554 18,400 11,928 12,430
6100 Electricity 145,167 198,000 228,723 214,200
6110 Gas 7,070 38,400 9,100 14,400
6150 Waste 744 9,600 7,580 9,600
6160 Water - Facility 11,205 13,000 3,983 14,240
TOTAL $ 1,209,405 $ 1,384,700 $ 1,037,215 $ 1,318,670
Budget Notes: • Account 5720 – Other Miscellaneous Contractual Service includes contracts
(such as parking lot security) as well as maintenance activities, such as landscaping, building repairs and FMP software maintenance