FOOD STAMP PROGRAM CORRECTIVE ACTION PLAN
29
STATE OF ALASKA DEPARTMENT OF HEALTH AND SOCIAL SERVICES DIVISION OF PUBLIC ASSISTANCE QUALITY ASSESSMENT UNIT FOOD STAMP PROGRAM CORRECTIVE ACTION PLAN May 2007 Update Give Me Five!
Transcript of FOOD STAMP PROGRAM CORRECTIVE ACTION PLAN

STATE OF ALASKA DEPARTMENT OF HEALTH AND SOCIAL SERVICES DIVISION OF PUBLIC ASSISTANCE QUALITY ASSESSMENT UNIT
FOOD STAMP PROGRAM
CORRECTIVE ACTION PLAN
May 2007 Update
Give Me Five!

Table of Contents
Executive Summary 2 I. Introduction 4 II. Analysis of Errors 7
A. Methodology B. QC Active Case Error Data Analysis C. Negative Case Errors D. Quality Control Case Reviews Not Completed
III. Corrective Action Plan 14 A. Corrective Action on Top Four Errors
B. Corrective Action on Other Error Trends C. Ongoing Payment Accuracy Initiatives D. Case Review Non-Completion E. Detailed Corrective Action Plans

Executive Summary The Alaska Department of Health and Social Services (DHSS) is committed to improving food stamp program payment accuracy. Error trends are identified through analysis of Quality Control (QC) data and plans are formulated to reduce or eliminate errors. In federal fiscal year (FFY) 2006, Alaska reported its food stamp payment error rate for active cases was 5.74 percent. This is slightly above the national average of 5.72 percent and ranks Alaska 26th among States. Alaska ranks 16th in improvement between FFY 2005 to FFY 2006. Alaska reported its food stamp negative case error rate for denied, terminated, or suspended cases in FFY 2006 was 3.56 percent, which ranks Alaska 25th among States. While the error rate is an increase from the superb rate in FFY 2005, Alaska’s error rate remains well below the national average of 6.31 percent. Alaska’s May 2007 Food Stamp Program Corrective Action Plan focuses on the Quality Control reviews for FFY 2006 (October 2005 through September 2006). Alaska’s Food Stamp Payment Accuracy Rates for FFY 2006 were reported as follows: Active Payment Accuracy Rate: 94.26 percent (error rate 5.74 percent) Negative Case Accuracy Rate: 96.44 percent (error rate 3.56 percent)
5/2/2007 2

The chart below illustrates the progression of Alaska’s active payment accuracy rate for FFY 2003 - FFY 2007, with major initiatives that were implemented.
Year Corrective Action Activity Accuracy Rate
FFY 07 • Alaska implemented the Corrective Action Feedback and Evaluation (CAFÉ) Committee
FFY 06 • Alaska conducts Workload Analysis Study • DPA Reports Website 94.26%*
FFY 05 • Standardized Case Notes (CANO) implemented 93.49%
FFY 04
• Alaska implemented Semi-Annual Reporting in January 2004 to help reduce client errors
• Regional Case Readers deployed • Annual Statewide Learning Summits initiated • Web Based Skill Challenges introduced
93.04%
FFY 03
• Alaska implemented the Quality Assessment Review Committee (QARC) November 2003
• Implementation of the statewide Case Review Tool • Creation of Local Quality Councils
86.12%
* reflects unregressed accuracy rate for FFY 2006
5/2/2007 3
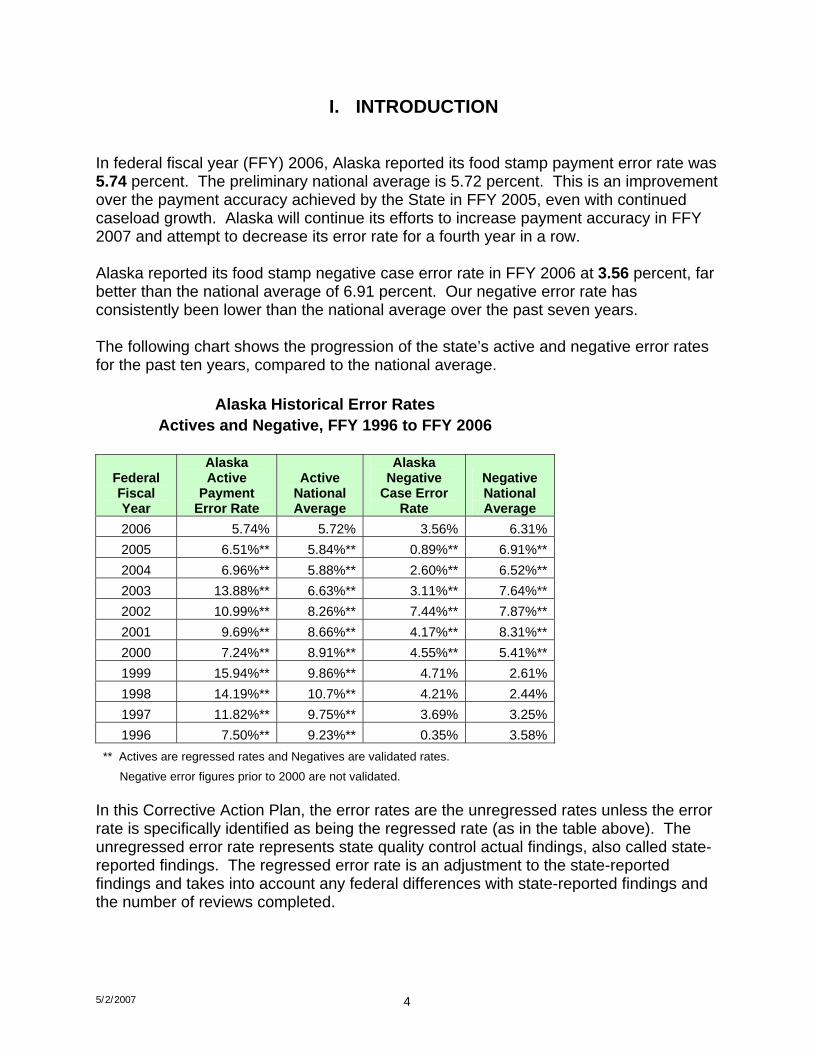
I. INTRODUCTION In federal fiscal year (FFY) 2006, Alaska reported its food stamp payment error rate was 5.74 percent. The preliminary national average is 5.72 percent. This is an improvement over the payment accuracy achieved by the State in FFY 2005, even with continued caseload growth. Alaska will continue its efforts to increase payment accuracy in FFY 2007 and attempt to decrease its error rate for a fourth year in a row. Alaska reported its food stamp negative case error rate in FFY 2006 at 3.56 percent, far better than the national average of 6.91 percent. Our negative error rate has consistently been lower than the national average over the past seven years. The following chart shows the progression of the state’s active and negative error rates for the past ten years, compared to the national average.
Alaska Historical Error Rates Actives and Negative, FFY 1996 to FFY 2006
Federal Fiscal Year
Alaska Active
Payment Error Rate
Active National Average
Alaska Negative
Case Error Rate
Negative National Average
2006 5.74% 5.72% 3.56% 6.31%2005 6.51%** 5.84%** 0.89%** 6.91%**2004 6.96%** 5.88%** 2.60%** 6.52%**2003 13.88%** 6.63%** 3.11%** 7.64%**2002 10.99%** 8.26%** 7.44%** 7.87%**2001 9.69%** 8.66%** 4.17%** 8.31%**2000 7.24%** 8.91%** 4.55%** 5.41%**1999 15.94%** 9.86%** 4.71% 2.61%1998 14.19%** 10.7%** 4.21% 2.44%1997 11.82%** 9.75%** 3.69% 3.25%1996 7.50%** 9.23%** 0.35% 3.58%
** Actives are regressed rates and Negatives are validated rates. Negative error figures prior to 2000 are not validated.
In this Corrective Action Plan, the error rates are the unregressed rates unless the error rate is specifically identified as being the regressed rate (as in the table above). The unregressed error rate represents state quality control actual findings, also called state-reported findings. The regressed error rate is an adjustment to the state-reported findings and takes into account any federal differences with state-reported findings and the number of reviews completed.
5/2/2007 4

The following graph further illustrates Alaska’s active payment accuracy for the past five years in comparison to the national average, and provides further delineation by Alaska region.
History of Food Stamp Payment Accuracy RatesNational, Statewide and Regional
FFY 2006
75%
80%
85%
90%
95%
100%
FFY 2002 FFY 2003 FFY 2004 FFY 2005 FFY 2006 FFY 2007
Paym
ent E
rror
Rat
e
Central Coastal Northern Southeast National Statewide
Target
Alaska met its 94 percent accuracy goal for 2006. To build upon our success we are striving for a 95 percent accuracy target under our new “Give Me Five” campaign for 2007. Achieving this goal will take a statewide effort to focus on actions that will bring each region’s accuracy up one more percentage point. Alaska was required to complete at least 415 federal active reviews for FFY 2006. This number has increased from 354, 377 and 394 in FFY 2003 through 2005, in response to increased caseloads. In FFY 2006 FNS Quality Control staff reviewed 48 percent of the state’s completed cases, plus 100 percent of cases dropped as “not subject to review” or “incomplete”. If FNS disagrees with the state finding, the difference (if upheld after arbitration) is factored into one part of the regression rate. The other part of the regression rate is determined by how many reviews are completed. The entire regression rate is then added to the state-reported rate. The (unregressed) state-reported rate for FFY 2005 was 6.17 percent. Adding the regression rate of 0.34 percent resulted in the official regressed rate of 6.51 percent. Regression rates are always determined after the final cases are reported for the federal fiscal year.
5/2/2007 5

A similar process is followed when determining the negative case error rate. In FFY 2006 the State was required to complete at least 299 negative reviews and did complete 309 negative reviews. In FFY 2006 FNS reviewed 37 percent of the completed cases, plus all cases dropped as “not subject to review". Alaska’s November 2006 Food Stamp Program Corrective Action Plan addressed all reviews for FFY 2006 and described initiatives to address the active and negative error rates. This plan focuses on our new goal of 95 percent accuracy for FFY 2007, and outlines the corrective actions to help us achieve it. Section II of this report contains the analysis of errors and error trends. Section III addresses corrective action activities and initiatives, specifically addressed to the error elements that have the greatest impact on the state’s error rate. Bonuses and Federal Sanctions With passage of the Farm Bill in 2002, the enhanced funding and sanction process previously used by FNS was changed to a system of bonuses based on performance in several categories. For the first time, states showing the most improvement in one of those categories, even if not in the top tier of states, are now eligible for a bonus. Alaska received a $205,389 bonus for most improved payment error rate from FFY 2003 to FFY 2004. Alaska Food Stamp Reinvestment Plans The State of Alaska met its obligations under the FFY97, FFY98, FY99, and FFY01 Reinvestment Plans. The plans aim to improve Food Stamp payment accuracy by state investment in corrective action initiatives with this purpose. The State still has FFY02 penalty money at risk for FFY 2004 and 2005, and has negotiated with FNS to reinvest 100 percent of its FFY 2004 at-risk amount. The state requested relief in spite of missing its target because it was able to reduce the error rate 6.92-percentage points between FFY 2003 and FFY 2004.
5/2/2007 6

II. ANALYSIS OF ERRORS
A. Methodology:
The primary data source for this report was the findings from the federally required QC review process conducted by the state.
Findings are listed as either dollar errors or case errors. A dollar error percentage rate (used for active reviews) is computed by dividing the dollar amount in error into the total dollars issued to sampled cases. A case error percentage rate (used for negative reviews) is determined by dividing the number of cases with countable errors into the total number of reviews completed.
B. QC Active Case Error Data Analysis:
Agency Versus Client Errors In January 2004, Alaska implemented Semi-Annual Reporting in an effort to reduce client errors. As the following chart illustrates, Semi-Annual Reporting appears to have contributed significantly to the improvement of Alaska’s payment error rate.
ALASKA FOOD STAMP ERROR RATE - CLIENT VS AGENCY ERRORSFFY 2001 to FFY 2006
3.2%
5.7%5.5%
9.2%6.5%6.3%
1.3%
3.4%
4.2%
4.7%
1.4%
2.5%
5.7%
8.3%
8.7%
6.6%
5.8%
5.9%
0.0%
3.0%
6.0%
9.0%
12.0%
15.0%
2001 2002 2003 2004 2005
FEDERAL FISCAL YEAR
Paym
ent E
rror
Rat
e
Agency Errors Client Errors National Average
5/2/2007 7
Alaska will continue to seek ways to reduce client-caused errors, however corrective action efforts are now mainly focused on reducing agency- caused errors.
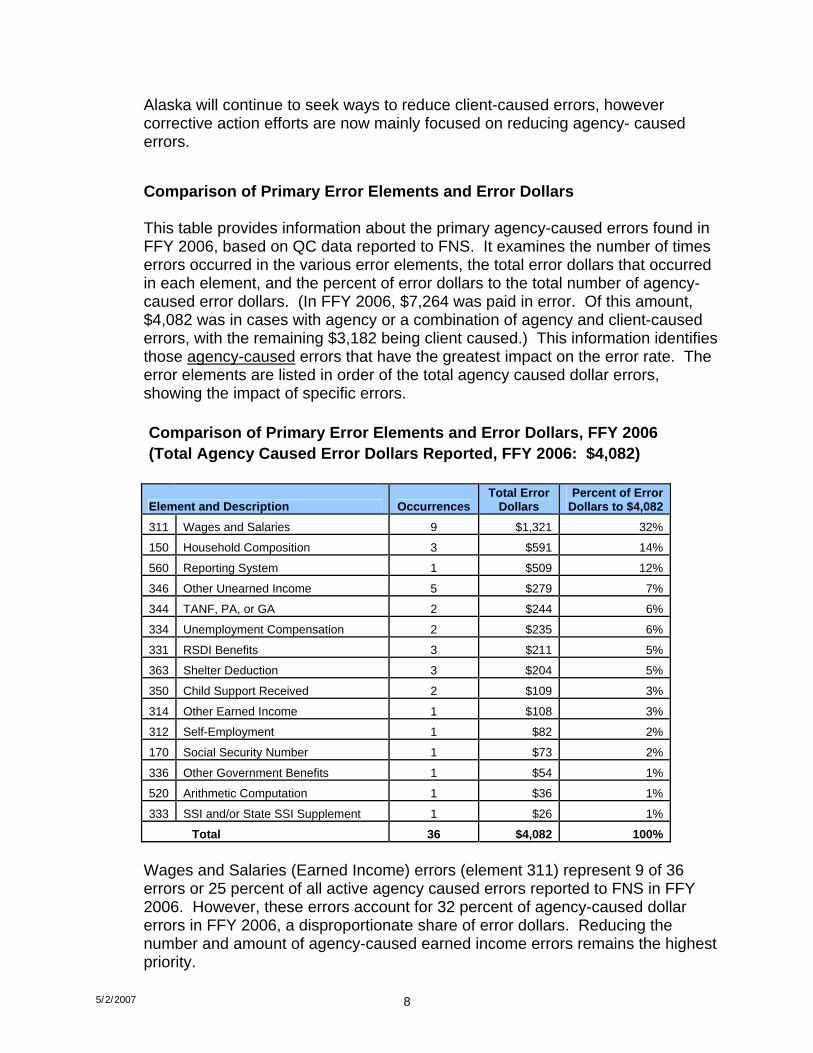
Comparison of Primary Error Elements and Error Dollars This table provides information about the primary agency-caused errors found in FFY 2006, based on QC data reported to FNS. It examines the number of times errors occurred in the various error elements, the total error dollars that occurred in each element, and the percent of error dollars to the total number of agency- caused error dollars. (In FFY 2006, $7,264 was paid in error. Of this amount, $4,082 was in cases with agency or a combination of agency and client-caused errors, with the remaining $3,182 being client caused.) This information identifies those agency-caused errors that have the greatest impact on the error rate. The error elements are listed in order of the total agency caused dollar errors, showing the impact of specific errors.
Comparison of Primary Error Elements and Error Dollars, FFY 2006 (Total Agency Caused Error Dollars Reported, FFY 2006: $4,082)
Element and Description Occurrences Total Error
Dollars Percent of Error
Dollars to $4,082311 Wages and Salaries 9 $1,321 32%
150 Household Composition 3 $591 14%
560 Reporting System 1 $509 12%
346 Other Unearned Income 5 $279 7%
344 TANF, PA, or GA 2 $244 6%
334 Unemployment Compensation 2 $235 6%
331 RSDI Benefits 3 $211 5%
363 Shelter Deduction 3 $204 5%
350 Child Support Received 2 $109 3%
314 Other Earned Income 1 $108 3%
312 Self-Employment 1 $82 2%
170 Social Security Number 1 $73 2%
336 Other Government Benefits 1 $54 1%
520 Arithmetic Computation 1 $36 1%
333 SSI and/or State SSI Supplement 1 $26 1%
Total 36 $4,082 100%
Wages and Salaries (Earned Income) errors (element 311) represent 9 of 36 errors or 25 percent of all active agency caused errors reported to FNS in FFY 2006. However, these errors account for 32 percent of agency-caused dollar errors in FFY 2006, a disproportionate share of error dollars. Reducing the number and amount of agency-caused earned income errors remains the highest priority.
5/2/2007 8

Causes of Agency Wages and Salaries Errors
Cause Description Dollars Percent Dollars Percent Policy Incorrectly Applied $572 0.41% $731 0.58% Reported information disregarded $465 0.33% $464 0.37% Data entry error $937 0.67% $65 0.05% Arithmetic error $124 0.09% $61 0.05% Failure to verify $356 0.25% $0 0.00% Failure to follow up on inaccurate info $255 0.18% $0 0.00% Falure to follow up on changes $248 0.18% $0 0.00% Total Agency Responsibility Errors $2,957 2.10% $1,321 1.04%
Total Food Stamp Sample Allotment $140,671 100.00% $126,633 100.00%
FFY 2005 FFY 2006
Agency caused wages and salaries errors represented 2.10% of the error rate in FFY 2005 and only 1.04% of the error rate in FFY 2006. Five of the seven cause types have shown improvement from FFY 2005 to FFY 2006. The three that have been eliminated entirely reflect a commitment to diligence and accountability on behalf of the staff. Error Case Counts and Error Dollar Amounts by Month of Occurrence The following table examines the FFY 2006 agency and client errors by the month that the error occurred. This table highlights a spike in both error cases and error dollars in the month of November. The other error dollar spike May is the result of one large $1,214 ineligible case and does not constitute an annual trend.
Food Stamp Sample: Agency Errors and All Errors by Occurrence Month FFY2004-06 Three Year Totals
0
2
4
6
8
10
12
14
16
18
20
Jan Feb Mar Apr May Jun Jul Aug Sep Oct Nov Dec
Occurrence Month
Erro
r Cas
es
$0
$500
$1,000
$1,500
$2,000
$2,500
$3,000
$3,500
Erro
r Dol
lars
Agency Error Cases All Error Cases Agency Error Dollars All Error Dollars 5/2/2007 9

Errors at Time of Occurrence
As illustrated in the following chart, in FFY 2006, Alaska reported that 67 percent of errors occurred before or at most recent certification. In FFY 2005, 74 percent of errors nationally occurred before or at most recent certification.
Distribution of Food Stamp Errors by Time of OccuranceFFY 2006
After most recent action33%
Before most recent action13%
At time of most recent action
54%
Of the three time periods, most errors occur at the time of the most recent action. Focusing case review efforts at the time of recertification and certification increases the likelihood of catching and correcting errors, and using case reviewer and supervisory resources most effectively. The next graph appears to show that more errors tend to occur at certification than at recertification. However, this is misleading because we must report a recertification that results in a break in service to FNS as a certification. There were actually more errors in cases that Alaska would consider recertifications than certifications.
5/2/2007 10
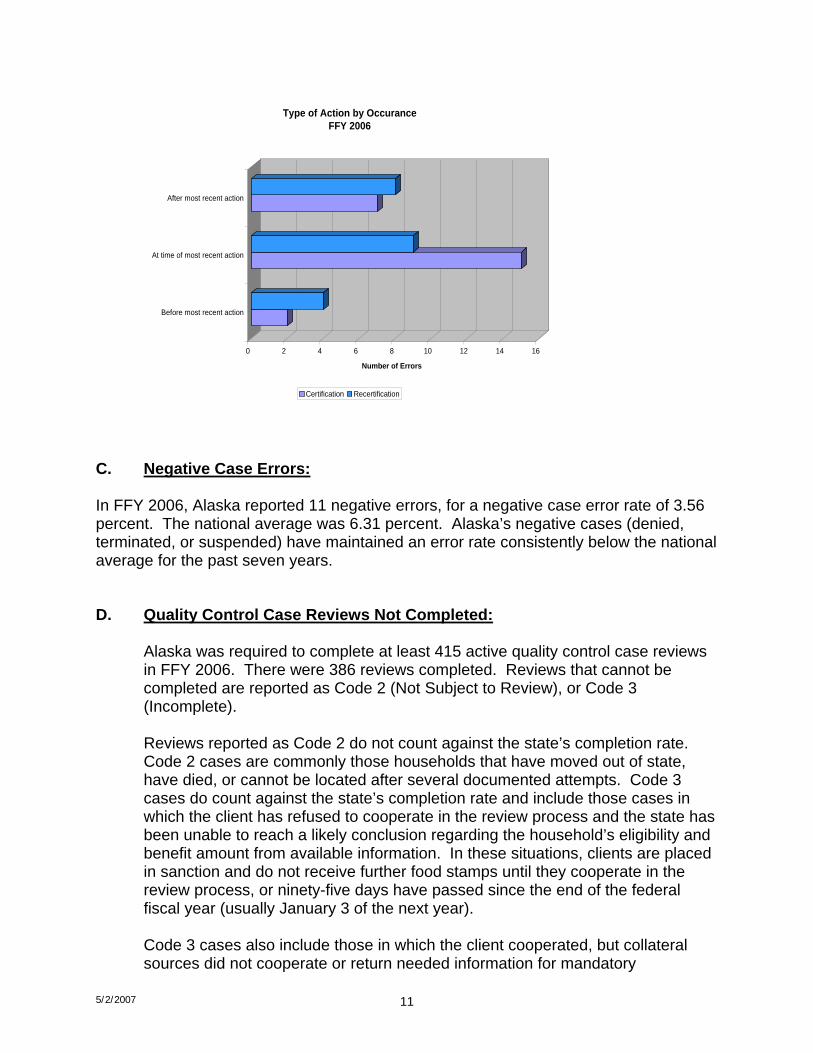
0 2 4 6 8 10 12 14 16
Number of Errors
Before most recent action
At time of most recent action
After most recent action
Type of Action by OccuranceFFY 2006
Certification Recertification
C. Negative Case Errors: In FFY 2006, Alaska reported 11 negative errors, for a negative case error rate of 3.56 percent. The national average was 6.31 percent. Alaska’s negative cases (denied, terminated, or suspended) have maintained an error rate consistently below the national average for the past seven years. D. Quality Control Case Reviews Not Completed:
Alaska was required to complete at least 415 active quality control case reviews in FFY 2006. There were 386 reviews completed. Reviews that cannot be completed are reported as Code 2 (Not Subject to Review), or Code 3 (Incomplete). Reviews reported as Code 2 do not count against the state’s completion rate. Code 2 cases are commonly those households that have moved out of state, have died, or cannot be located after several documented attempts. Code 3 cases do count against the state’s completion rate and include those cases in which the client has refused to cooperate in the review process and the state has been unable to reach a likely conclusion regarding the household’s eligibility and benefit amount from available information. In these situations, clients are placed in sanction and do not receive further food stamps until they cooperate in the review process, or ninety-five days have passed since the end of the federal fiscal year (usually January 3 of the next year). Code 3 cases also include those in which the client cooperated, but collateral sources did not cooperate or return needed information for mandatory
5/2/2007 11
verifications, and the state has been unable to reach a likely conclusion regarding the household’s eligibility and benefit amount. In the following table, Code 2 refers to cases that are not subject to review. Code 3 is used for all cases that could not be completed, whether because of client non-cooperation or other reasons.
5/2/2007 12

NSTR and Not Completed Cases by Month for FFY 03 through FFY 06
FFY 2003 FFY 2004 FFY 2005 FFY 2006 Code Code Code Code Month
2 3 Total 2 3 Total 2 3 Total 2 3 Total October 2 1 3 2 0 2 3 3 6 1 2 3
November 4 0 4 2 0 2 2 1 3 1 1 2 December 1 1 2 5 0 5 1 0 1 2 2 4 January 3 0 3 4 0 4 1 0 1 1 1 2 February 2 1 3 1 0 1 1 0 1 1 0 1
March 0 0 0 2 0 2 3 0 3 0 4 4 April 0 0 0 3 4 7 3 6 9 7 2 9 May 1 2 3 3 2 5 2 2 4 4 4 8 June 1 1 2 4 2 6 1 3 4 2 3 5 July 2 0 2 2 1 3 2 1 3 1 0 1
August 3 4 7 4 1 5 3 5 8 1 2 3 September 2 5 7 4 1 5 3 3 6 0 3 3
Total 21 15 36 36 11 47 25 24 49 21 24 45
Non-completion rates in the following table are determined by calculating the percentage of incomplete reviews (code 3) of the total number of reviewable cases (Total number of cases less the not subject to review cases). If the non-completion rate is above 2%, states incur a completion rate adjustment to their combined payment error rate (CPER) which is the final regressed payment error rate. The official non-completion rates can be higher than in the table if the reviewable cases are less than the required minimum sample. It is estimated that in FFY06 Alaska’s completion rate adjustment will add between 0.14% and 0.18% to the CPER.
Non-Completion Rate
FFY 2003
FFY 2004
FFY 2005
FFY 2006
Reviewable Cases (Total less NSTR) 367 343 425 410 Total Not Completed (Code 3) 15 11 24 24 Percent Not Completed 4.1% 3.2% 5.6% 5.9%
5/2/2007 13
III. CORRECTIVE ACTIONS Alaska remains committed to Food Stamp Program payment accuracy. Over the years, DHSS has implemented processes that we believe contribute to lowering the error rate. Examples include: implementation of the statewide Case Review Tool, adoption of Semi Annual Reporting, prospective budgeting, the Quality Assessment Review Committee (QARC), a process to ensure that QC errors found in the QARC process are being corrected, Local Quality Councils comprised of staff who strive to develop process improvements at the office level, regularly updated on-line policy manuals, regional case reviewer positions, standardized case notes (CANOs), increased involvement by supervisors in leadership meetings and in training and mentoring staff, annual statewide training workshops, DPA employee web site home page with constant focus on Food Stamp accuracy, and the DPA eNews. In the current federal fiscal year Alaska implemented the Corrective Action Feedback and Evaluation (CAFÉ) Committee to address and monitor the corrective actions outlined in the Corrective Action Plan. This section focuses on the most common errors, examines progress made in correcting these errors, and identifies initiatives and improvements. We believe the tools described in this section are our best means of reducing the food stamp error rate. One of the most significant payment accuracy initiatives has been the Quality Assessment Review Committee (QARC). Begun in 2003, it is the main forum for reviewing all quality control errors, whether active or negative. All errors are thoroughly examined within our Quality Assessment Unit, but the QARC provides a final evaluation of each error to determine if all policies were correctly applied. In addition, the substance of each error is reviewed to determine trends, system changes, training needs, and other corrective action needed to prevent future occurrences of the same type of error. Discussions of case errors at the QARC are also a primary source for articles for the Division’s electronic newsletter DPA ENews. The committee reviews error cases from other programs as well, which can lead to beneficial changes that also affect the Food Stamp Program. Another initiative involves the adoption of standardized case note (CANO) formats in our Eligibility Information System to help eligibility workers reduce the instances of overlooked eligibility criteria. This also helps workers document their actions and findings consistently statewide and helps prevent errors when cases are transferred between local offices. A common theme throughout all error elements is the prevalence of agency-caused errors. Workers not knowing what action to take, and workers not taking any action on the reported information most commonly cause these errors. Training addresses the first problem, as the purpose of training is to teach people what action needs to be taken and how to do so correctly. The second issue is more difficult. Quality Assessment and supervisory staff will be working with eligibility staff to identify critical points in the process. This information, will be used to identify and recommend needed improvements.
5/2/2007 14

For FFY 2006, we identified the top four agency-caused payment errors by identifying the dollar amount of these errors in relation to the amount of all agency error dollars. The top four errors (below) account for 65 percent of all agency caused dollar errors. The top four agency caused payment errors that occurred in FFY 2006 are: • • • •
Earned Income, 32% Household Composition, 14% Reporting System, 12% Other Unearned Income, 7%
A. Corrective Action on Top Four Errors
Earned Income, Element 311:
The 9 agency-caused earned income errors (totaling $1,321) accounted for 32 percent of all agency caused error dollars in FFY 2006.
Cause: As illustrated below, Alaska’s largest payment errors are due to incorrect application of policy and reported information disregarded. Incorrect application of policy occurred when: the worker set alerts no longer needed under prospective budgeting, the worker didn’t contact the employer as needed to anticipate irregular income, income for a child age 18 was not counted, and UIB was noted in case notes but not prospected. Reported information disregarded occurred when: income wasn’t recalculated when paychecks were provided, the worker didn’t know how to read U.S.P.S. pay stubs for regular and COLA income, and the wages of an 18 year old high school graduate were not counted.
Type of Agency Caused Food Stamp Errors Wage and Salary Errors
FFY 2006
Arithmetic Error5%
Reported Information Disregarded
35%
Policy Incorrectly Applied
55%
Data Entry or Coding Error
5%
5/2/2007 15

Corrective Actions: Supervisors and Regional Case Reviewers focus ongoing review efforts on work performed by new caseworkers and on high allotment earned income cases. This supplements the more formal classroom training provided by the Staff Development and Training (SD&T) Unit, and provides on-going and constant feedback within the offices. A number of additional initiatives are underway at the state, region and office level to promote payment accuracy. All of the initiatives described in Section C below have improvement of payment accuracy in cases with earned income as a primary focus. In addition, the updated corrective action planning record is presented in Section E.
Household Composition, Element 150: The 3 agency caused Household Composition errors (totaling $591) accounted for 14 percent of all agency caused error dollars in FFY 2006. Cause: Agency-caused errors occurred when: policy was applied incorrectly regarding a parent and her children 21 years of age or younger, and information reported at application was not applied. Corrective Action: Efforts have been made each year to identify ways to reduce the number of errors caused when eligibility workers do not take action, or do not take the correct action, on reported changes. Alaska plans to further enhance its corrective action strategies through training to help managers and supervisors gain the ability and knowledge to assess data and identify error trends and causal factors.
Reporting System, Element 560:
One $509 agency caused reporting system error accounted for 12 percent of all agency-caused error dollars in FFY 2006.
Cause: This error occurred when the eligibility worker was attempting to align the certification periods for a combo case, and certified the household for eight rather than six months. Corrective Action: Training was provided to staff on certification periods and how to align certification periods for combo cases.
5/2/2007 16
Other Unearned Income, Element 346: The 5 agency-caused Other Unearned Income errors (totaling $279) accounted for 7 percent of all agency caused error dollars in FFY 2006. Cause: These errors were due to: incorrect computation of mortgage/rental income, not counting Senior Care income, and receipt of the Permanent Fund Dividend (PFD) in the application month. Corrective Action: The Division has a work group focused on improving PFD training and work flow processes. Efforts are also being focused on identifying ways to reduce the number of errors caused when eligibility workers do not take action, or do not take the correct action, on reported changes.
B. Corrective Action on Other Error Trends
Historical Monthly Error Rates As illustrated in Section II of this report, Alaska tends to experience a spike in agency caused payment errors occurring in the month of November. Alaska is focusing efforts on identifying and addressing the cause of this seasonal payment error spike in an effort to prevent its reoccurrence. Errors By Time of Occurrence As noted in Section II of this report, Alaska reported that in FFY 2006, 67 percent of errors occurred before or at most recent certification. Alaska is reviewing its processes to determine if case reviewer, supervisory and other staff resources can be used more effectively to identify and correct errors at re-certification and certification.
C. Ongoing Payment Accuracy Initiatives:
The initiatives listed below involve ongoing long-term implementation plans. Focused Case Reviews: Intensive case reviews by supervisors and case reviewers are being used in all regions to address specific issues identified through QA reviews, Management Evaluation reviews, and Local Quality Councils. Ongoing review efforts target work performed by new caseworkers and on high allotment earned income cases. These reviews supplement the more formal classroom training provided by the Staff Development and Training (SD&T) Unit, and provide on-going and constant feedback within the offices.
5/2/2007 17
Quality Assessment Review Committee (QARC): Initiated in November 2003, the QARC meets every month. It is the primary statewide forum for discussing food stamp errors, trends, and action steps for improvement. We believe the greatest impact is in improved communication and in identifying training needs, unclear policies, and automation enhancements needed to improve operating systems. The state’s error rate is reduced by an average of 2 percentage points because cases are reviewed by the QARC. The Quality Assessment Unit also sends “Case Correct” recognition pins to the local offices for all workers with cases reported as correct. Corrective Action Feedback and Evaluation (CAFÉ) Committee: The CAFÉ meets monthly to address and monitor the corrective actions outlined in the Corrective Action Plan. The CAFÉ is comprised of representatives from the Policy and Program Development Unit, Staff Development and Training, Systems Operations, Quality Assessment, the Chief of Field Services, and each Field Services Region. The CAFÉ works collaboratively to implement and monitor the corrective actions that were identified and prioritized during the Corrective Action Planning meeting as having the greatest impact in addressing Food Stamp Program errors. DPA Electronic Newsletter: The newsletter, DPA ENews, is issued quarterly throughout the year and has replaced “QARC Rules” as the source of feature articles drawn from Quality Control errors discussed by the QARC. Recent issues have covered the “Notice of Missed Interview”, following up on Quality Assessment errors, the Food Stamp certification period for semi-annual reporting households, notifying households about shelter costs that have not been verified, and using the eligibility system’s advance issuance indicator for expedited food stamp situations. Prior issues of DPA eNews can be viewed at: http://dpaweb.hss.state.ak.us/training/enews/index.html DPA Web: The DPA employee home page prominently displays the state’s Food Stamp accuracy goal, as well as the year-to-date accuracy rate and the error rate as a four-month running average. Clicking on this information, which is updated every month, provides the user with a current analysis of errors on Food Stamp active cases including our national ranking and a breakdown of case and payment accuracy by Region and District Office. Periodic updates on the Division’s progress in its “Give Me Five!” Food Stamp Accuracy Campaign are featured on the employee home page to promote continuous focus on Food Stamp accuracy. The Division’s employee home page can be viewed at: http://dpaweb.hss.state.ak.us/ Skill Challenges: The Staff Development & Training Unit has produced a number of “Skill Challenges” as a means of providing ongoing refresher training on topics that are problematic for staff. The challenges are web based interactive training videos
5/2/2007 18
that provide an interesting and stimulating means of delivering targeted training. Each “Challenge” includes a quiz and links to the policy manual for further information. Topics include: Certification/Recertification, the Food Stamp Challenge, Semi-Annual Reporting, Estimated Income, and treatment of PFD Hold Harmless income. The “Skill Challenges” can be viewed at: http://dpaweb.hss.state.ak.us/training/Quiz/QuizMain.htm Learning Summits: The annual Learning Summits are a successful means of providing ongoing refresher training for all staff throughout the state. Training includes general eligibility policy for all programs, such as household composition and counting income. Offices are also given the option of an elective. Office agenda can be seen at our web site: http://dpaweb.hss.state.ak.us/training/Calendar/learningsummits/index.html. Local Quality Councils: The goals of the Local Quality Councils are to review, discuss and plan ways to continuously improve the Division’s business practices. The councils are comprised of staff representatives who enjoy the challenge of problem-solving their office issues, and soliciting and providing feedback from other staff in their regions. Among the top priorities of the councils are to review and assess local performance data, and to evaluate issues and initiate solutions when a performance area needs improvement. The local quality councils are an integral part of the Division’s corrective action planning efforts. More information about the quality councils can be viewed at: http://dpaweb.hss.state.ak.us/wiki/index.php?page=QualityCouncils Food Stamp Program Management Evaluation Reviews Alaska conducts periodic management evaluation reviews of program administration in local offices, focusing on the priority review topics established annually by FNS. In addition to interviews with staff, the review team examines office performance history and related documentation in advance of and during the review. Payment accuracy and corrective action follow-up and planning are an integral part of the reviews. Food Stamp Program Quality Assessment Report The Program Integrity and Analysis Unit produces an annual Food Stamp Program Quality Assessment Report. The report describes the Quality Control process and the Division’s progress in reducing Alaska’s Food Stamp payment error rate. Region and office level payment error findings are presented, as well as comparisons to other Western Region States. The report is another tool available to help managers analyze and address payment errors at the region and local office level. http://dpaweb.hss.state.ak.us/QA/PDF/FoodStampReportFFY2006.pdf
5/2/2007 19

5/2/2007 20
D. Case Review Non-Completion:
FNS reviews all cases reported as “incomplete” or “not subject to review”. Active case reviews: Federal quality control requirements state that a quality control review may be reported as incomplete if the sampled case meets certain requirements. If incomplete reviews comprise more than 5 percent of the sample, the state must identify corrective action. In FFY 2006, 24 cases were subject to review but not completed. This represents 5.9 percent of all completed active cases, and thus exceeds the threshold of 5 percent.
E. Detailed Corrective Action Plans:
Staff representing the Policy and Program Development Unit, Staff Development and Training, Systems Operations, Program Integrity & Analysis, Quality Assessment, the Chief of Field Services, and each Region have collaborated in the development of these corrective actions, and in monitoring them through the CAFE. The actions focus on the top agency caused payment error elements and other identified error trends.
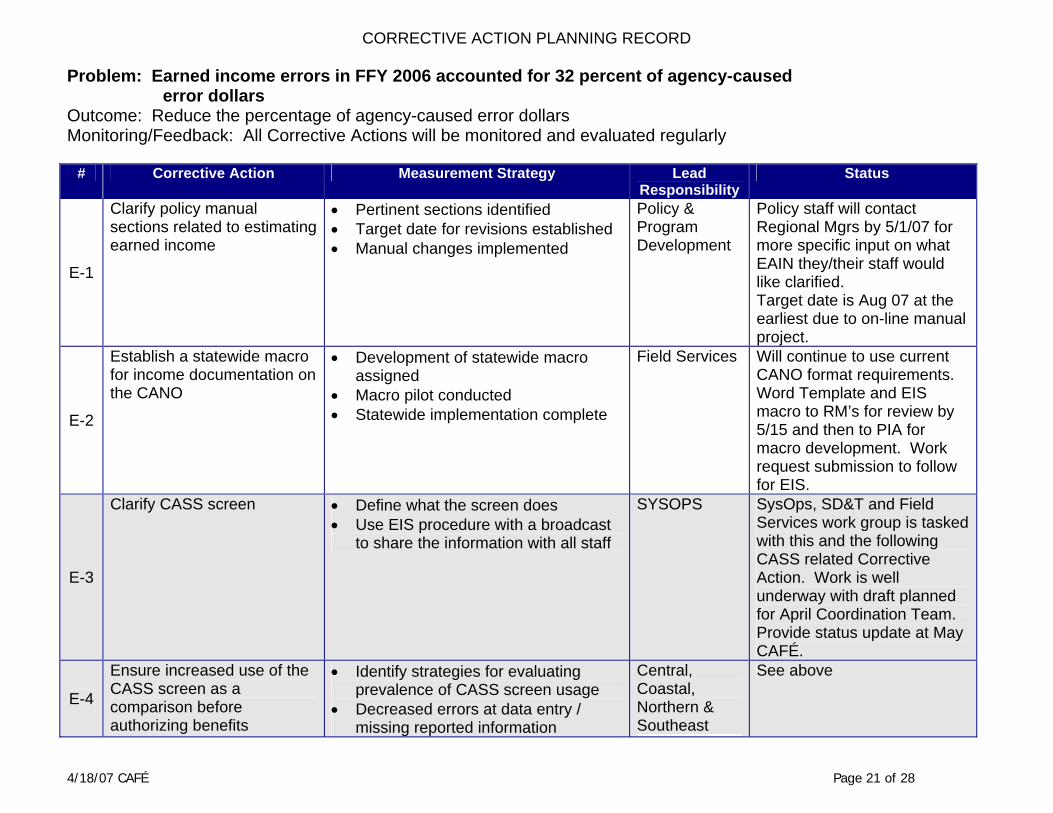
CORRECTIVE ACTION PLANNING RECORD
Problem: Earned income errors in FFY 2006 accounted for 32 percent of agency-caused error dollars
Outcome: Reduce the percentage of agency-caused error dollars Monitoring/Feedback: All Corrective Actions will be monitored and evaluated regularly
# Corrective Action Measurement Strategy Lead
Responsibility Status
E-1
Clarify policy manual sections related to estimating earned income
• Pertinent sections identified • Target date for revisions established • Manual changes implemented
Policy & Program Development
Policy staff will contact Regional Mgrs by 5/1/07 for more specific input on what EAIN they/their staff would like clarified. Target date is Aug 07 at the earliest due to on-line manual project.
E-2
Establish a statewide macro for income documentation on the CANO
• Development of statewide macro assigned
• Macro pilot conducted • Statewide implementation complete
Field Services Will continue to use current CANO format requirements. Word Template and EIS macro to RM’s for review by 5/15 and then to PIA for macro development. Work request submission to follow for EIS.
E-3
Clarify CASS screen • Define what the screen does • Use EIS procedure with a broadcast
to share the information with all staff
SYSOPS SysOps, SD&T and Field Services work group is tasked with this and the following CASS related Corrective Action. Work is well underway with draft planned for April Coordination Team. Provide status update at May CAFÉ.
E-4
Ensure increased use of the CASS screen as a comparison before authorizing benefits
• Identify strategies for evaluating prevalence of CASS screen usage
• Decreased errors at data entry / missing reported information
Central, Coastal, Northern & Southeast
See above
4/18/07 CAFÉ Page 21 of 28
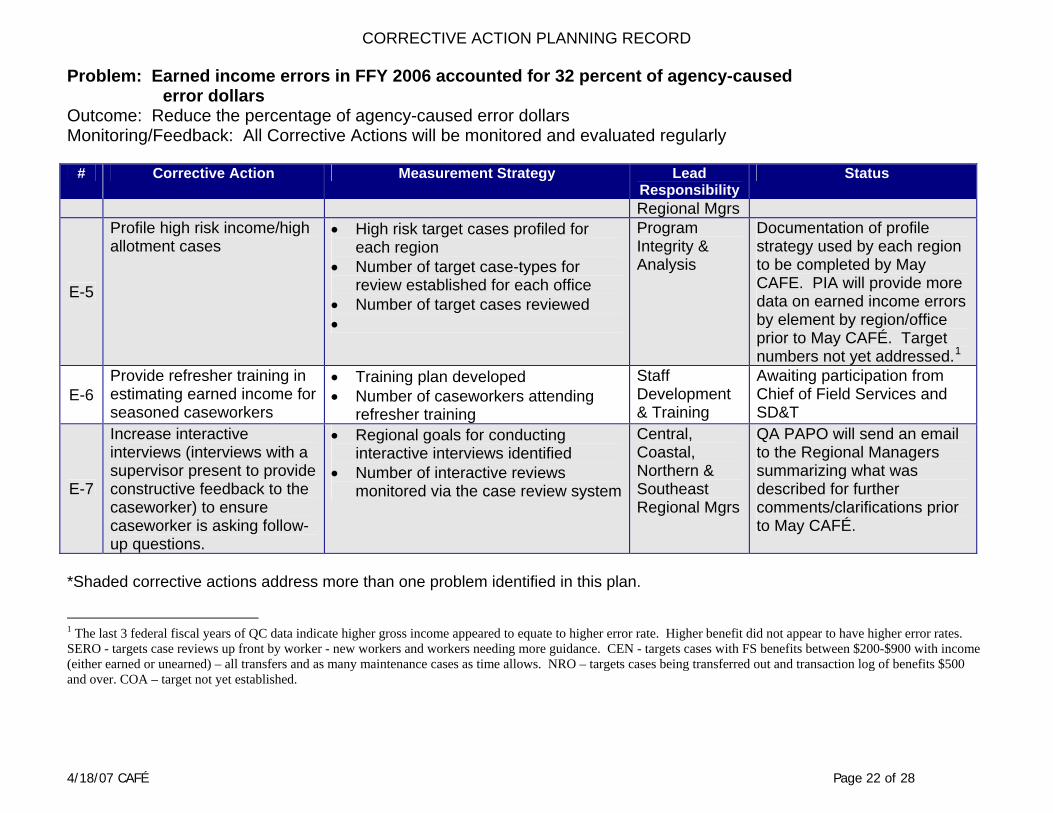
CORRECTIVE ACTION PLANNING RECORD
Problem: Earned income errors in FFY 2006 accounted for 32 percent of agency-caused error dollars
Outcome: Reduce the percentage of agency-caused error dollars Monitoring/Feedback: All Corrective Actions will be monitored and evaluated regularly
# Corrective Action Measurement Strategy Lead Status
Responsibility Regional Mgrs
E-5
Profile high risk income/high allotment cases
• High risk target cases profiled for each region
• Number of target case-types for review established for each office
• Number of target cases reviewed •
Program Integrity & Analysis
Documentation of profile strategy used by each region to be completed by May CAFE. PIA will provide more data on earned income errors by element by region/office prior to May CAFÉ. Target numbers not yet addressed.1
E-6 Provide refresher training in estimating earned income for seasoned caseworkers
• Training plan developed • Number of caseworkers attending
refresher training
Staff Development & Training
Awaiting participation from Chief of Field Services and SD&T
E-7
Increase interactive interviews (interviews with a supervisor present to provide constructive feedback to the caseworker) to ensure caseworker is asking follow-up questions.
• Regional goals for conducting interactive interviews identified
• Number of interactive reviews monitored via the case review system
Central, Coastal, Northern & Southeast Regional Mgrs
QA PAPO will send an email to the Regional Managers summarizing what was described for further comments/clarifications prior to May CAFÉ.
*Shaded corrective actions address more than one problem identified in this plan.
1 The last 3 federal fiscal years of QC data indicate higher gross income appeared to equate to higher error rate. Higher benefit did not appear to have higher error rates. SERO - targets case reviews up front by worker - new workers and workers needing more guidance. CEN - targets cases with FS benefits between $200-$900 with income (either earned or unearned) – all transfers and as many maintenance cases as time allows. NRO – targets cases being transferred out and transaction log of benefits $500 and over. COA – target not yet established.
4/18/07 CAFÉ Page 22 of 28

CORRECTIVE ACTION PLANNING RECORD
Problem: More errors tend to occur at re-certification than at certification Outcome: Improved accuracy of benefit issuance at re-certification Monitoring/Feedback: All Corrective Actions will be monitored and evaluated regularly
4/18/07 CAFÉ Page 23 of 28
# Corrective Action Measurement Strategy Lead Responsibility
Status
R-1
Develop standard requirements for interface checks and provide comprehensive interface training
• Interfaces and protocol for use evaluated
• Alerts generated by each interface evaluated
• Standard requirements for interface checks developed
• Training plan established • Number of caseworkers trained
TBD – multi-unit task
Taken to the Coordination Team, then to the Management Team and now to COFS to identify lead responsibility/authority.
R-2
Standardize case review process statewide
• Standard requirements for case reviews developed -
• Training plan established • Number of reviewers trained
Field Services • Case review guidelines have been developed by Field Services, however more work is needed to expand the rules for comments and to explore means of tracking trends on <$26 errors without impacting performance evaluation process.
• Plans are to post standards as a guide on the manuals area of the web.
• Field Services will provide a status update at May CAFÉ.
• Managers will bring issue of needed case review tool modifications to Managers and IT Prioritization Meetings.

CORRECTIVE ACTION PLANNING RECORD
Problem: More errors tend to occur at re-certification than at certification Outcome: Improved accuracy of benefit issuance at re-certification Monitoring/Feedback: All Corrective Actions will be monitored and evaluated regularly
4/18/07 CAFÉ Page 24 of 28
# Corrective Action Measurement Strategy Lead Responsibility
Status
• Field Services will submit a case review training plan to QA PAPO for possible FS Reinvestment funding by 4/20/07.
R-3
Profile high risk cases at re-cert
• High risk target cases profiled for each region
• Number of target case-types for review established for each office
• Number of target cases reviewed
Program Integrity & Analysis
• PIA provided group with error elements and causes for past three fiscal years to help identify high risk cases.
• CAFE group provided suggestions for factors to research for May & November payment spikes (combo cases, tribal TANF, PFD, seasonal work, holiday application surge)
R-4
Address issues with the GEN 72 form – fix multiple mailings, develop a new form or use the GEN 50 instead of the GEN 72
• Options and strategies to implement this change identified and evaluated
Application Project Team
• Await the rollout of the new GEN 50B to provide us with a test/feedback prior to tackling the GEN 72.
• SysOps will talk with COFS about approach for dealing with multiple mailings and will report back to CAFÉ.
• There is a work request that deals with the multiple

CORRECTIVE ACTION PLANNING RECORD
Problem: More errors tend to occur at re-certification than at certification Outcome: Improved accuracy of benefit issuance at re-certification Monitoring/Feedback: All Corrective Actions will be monitored and evaluated regularly
4/18/07 CAFÉ Page 25 of 28
# Corrective Action Measurement Strategy Lead Responsibility
Status
mailing issue.
R-5
Incorporate telephone contact at re-certification when no face-to-face interview is required (six month period with targeted reviews)
• Number of FS error cases with no interview at re-cert identified
• Case review tool enhanced to track interview type
Field Services • QA will continue to track whether or not an interview was done to see if it has any relation to errors.
• CAFÉ decided to remove this Corrective Action.
see E-3
Clarify CASS screen • Define what the screen does • Use broadcast and/or other means of
sharing the information with all staff
SYSOPS See E-3
see E-4
Ensure increased use of the CASS screen as a comparison before authorizing benefits
• Identify strategies for evaluating prevalence of CASS screen usage
• Decreased errors at data entry / missing reported information
Central, Coastal, Northern & Southeast Regional Mgrs
See E-4
see E-7
Increase interactive interviews (interviews with a supervisor present to provide constructive feedback to the caseworker) to ensure caseworker is asking follow-up questions.
• Regional goals for conducting interactive interviews identified
• Number of interactive reviews monitored via the case review system
Central, Coastal, Northern & Southeast Regional Mgrs
See E-7
R-6
Implement intranet web site to share best practices
• Explore feasibility and outline tasks necessary to establish and maintain the web site
Operations Support & QA
QA will work with Operations Support to draft a process similar to that used by Nevada and will provide an update at
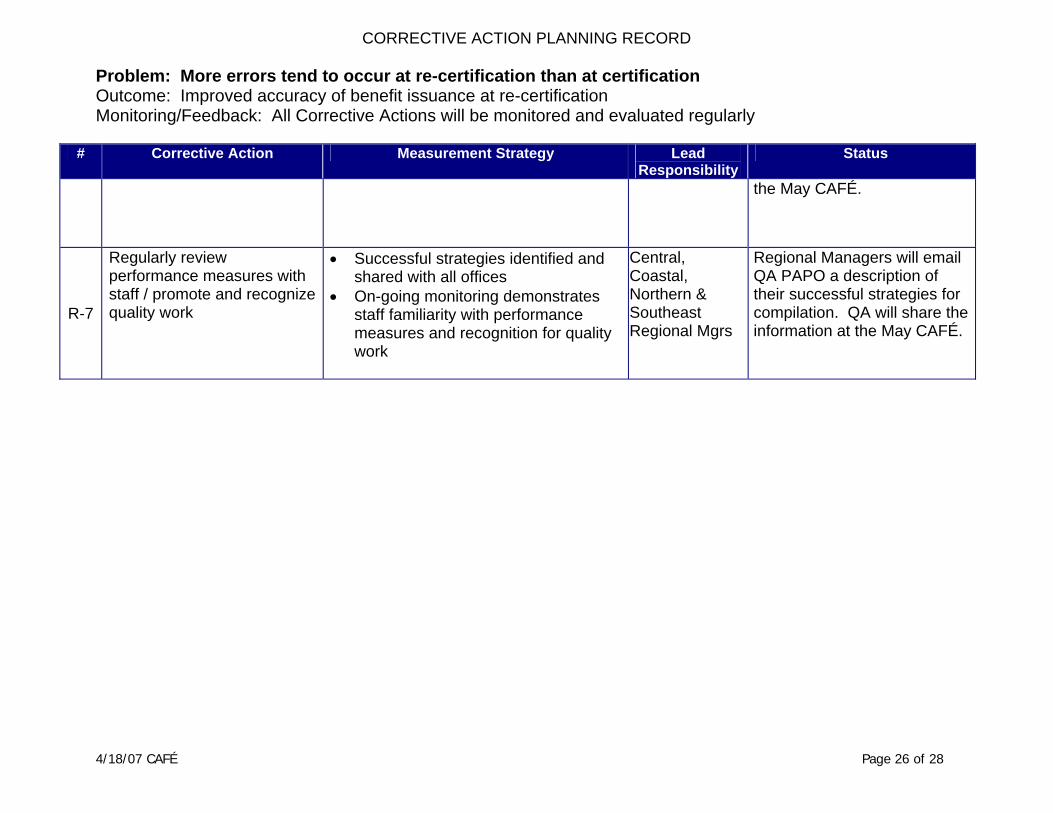
CORRECTIVE ACTION PLANNING RECORD
Problem: More errors tend to occur at re-certification than at certification Outcome: Improved accuracy of benefit issuance at re-certification Monitoring/Feedback: All Corrective Actions will be monitored and evaluated regularly
4/18/07 CAFÉ Page 26 of 28
# Corrective Action Measurement Strategy Lead Responsibility
Status
the May CAFÉ.
R-7
Regularly review performance measures with staff / promote and recognize quality work
• Successful strategies identified and shared with all offices
• On-going monitoring demonstrates staff familiarity with performance measures and recognition for quality work
Central, Coastal, Northern & Southeast Regional Mgrs
Regional Managers will email QA PAPO a description of their successful strategies for compilation. QA will share the information at the May CAFÉ.

CORRECTIVE ACTION PLANNING RECORD
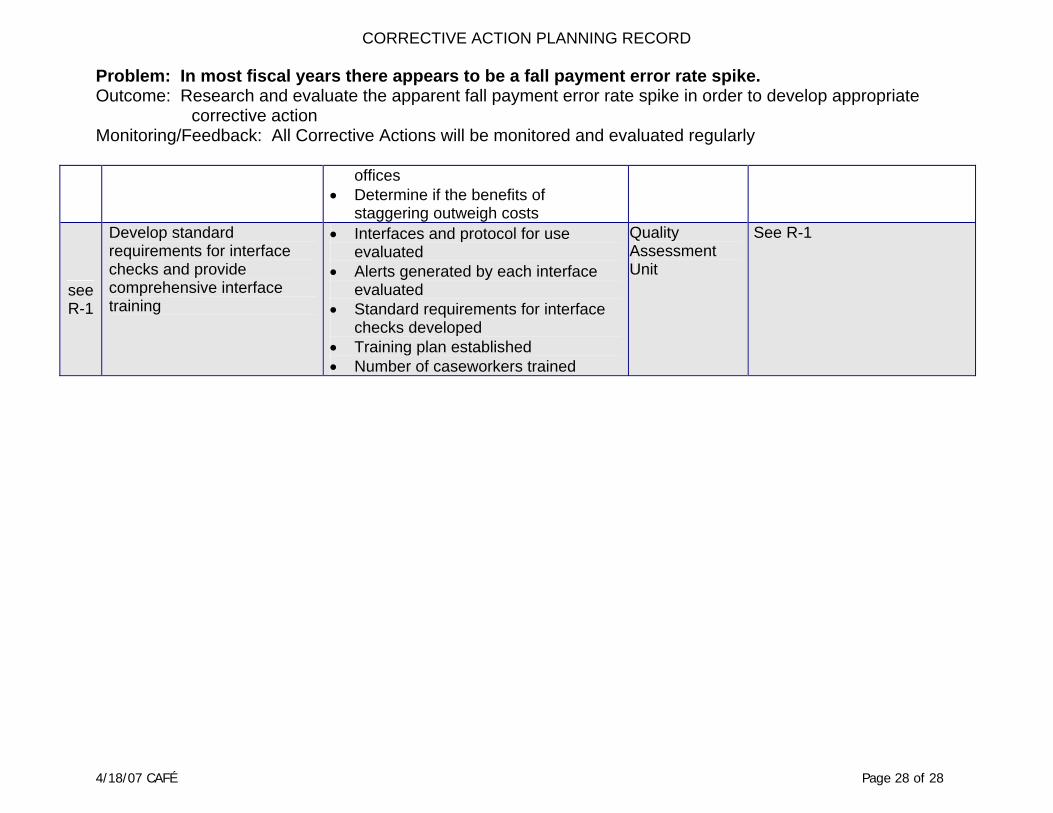
Problem: In most fiscal years there appears to be a fall payment error rate spike. Outcome: Research and evaluate the apparent fall payment error rate spike in order to develop appropriate
corrective action Monitoring/Feedback: All Corrective Actions will be monitored and evaluated regularly
# Corrective Action Measurement Strategy Lead Responsibility
Status
S-1
Analyze QA case errors as well as payment errors to get a better understanding of the problem
• Case errors graphed by occurrence for a 3 year period
• Case errors sorted and grouped by cause
Program Integrity & Analysis
• Graph provided • PIA provided group with
error elements and causes for past three fiscal years
S-2
Incorporate ability to track the date the error action/inaction occurred in the case review tool
• Occurrence request incorporated in system screen enhancements priority list
• Analysis on implementing this change completed
• Occurrence date incorporated in system
Field Services Field Services will add the occurrence request to the case review tool list.
S-3
Capture all errors, including those under $26, in the case review tool
• Reduced number of cases in case review tool listed as “no error” with an accompanying error reason and factor
Central, Coastal, Northern & Southeast Regional Mgrs
Field Services, QA and Analysis will work together to explore means of tracking trends on <$26 errors without impacting performance evaluation process.
see R-2
Standardize case review process statewide
• Standard requirements for case reviews developed
• Training plan established • Number of reviewers trained
Field Services See R-2
S-4
Use caseload management reports to track the number of re-certs due each month to see if staggering re-cert dates could level out peak processing months
• Identify any barriers to using reports to track number of re-certs due each month
• Review report data to identify possible re-cert staggering month(s)
• Pilot staggering in one or more
Central, Coastal, Northern & Southeast Regional Mgrs
SysOps will check to see if the existing work request incorporates the sort feature, check on the prioritization of the WR, and check on feasibility.
4/18/07 CAFÉ Page 27 of 28
CORRECTIVE ACTION PLANNING RECORD
Problem: In most fiscal years there appears to be a fall payment error rate spike. Outcome: Research and evaluate the apparent fall payment error rate spike in order to develop appropriate
corrective action Monitoring/Feedback: All Corrective Actions will be monitored and evaluated regularly
offices • Determine if the benefits of
staggering outweigh costs
see R-1
Develop standard requirements for interface checks and provide comprehensive interface training
• Interfaces and protocol for use evaluated
• Alerts generated by each interface evaluated
• Standard requirements for interface checks developed
• Training plan established • Number of caseworkers trained
Quality Assessment Unit
See R-1
4/18/07 CAFÉ Page 28 of 28