Food Security and Nutrition Analysis Unit Somalia
35
Shabelle Regions Deyr 2010/11 January 26, 2011 Information for Better Livelihoods Food Security and Nutrition Analysis Unit Somalia EUROPEAN COMMISSION Swiss Agency for Development and Cooperation SDC
-
Upload
lois-crawford -
Category
Documents
-
view
31 -
download
0
description
Deyr 2010/11. Information for Better Livelihoods. Food Security and Nutrition Analysis Unit Somalia. January 26, 2011. Shabelle Regions. Swiss Agency for Development and Cooperation SDC. EUROPEAN COMMISSION. Deyr 2010/11 Seasonal Assessment Coverage - PowerPoint PPT Presentation
Transcript of Food Security and Nutrition Analysis Unit Somalia

Shabelle Regions
Deyr 2010/11
January 26, 2011
Information for Better Livelihoods
Food Security and Nutrition Analysis Unit
Somalia
EUROPEAN COMMISSION
Swiss Agency for Development and Cooperation SDC
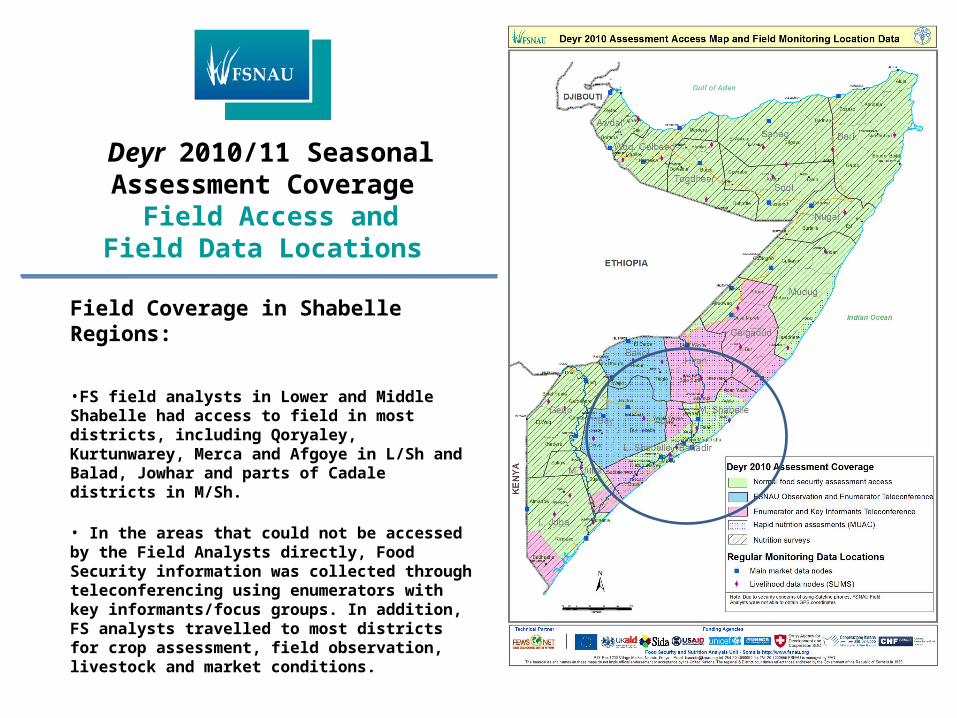
Field Coverage in Shabelle Regions:
•FS field analysts in Lower and Middle Shabelle had access to field in most districts, including Qoryaley, Kurtunwarey, Merca and Afgoye in L/Sh and Balad, Jowhar and parts of Cadale districts in M/Sh.
• In the areas that could not be accessed by the Field Analysts directly, Food Security information was collected through teleconferencing using enumerators with key informants/focus groups. In addition, FS analysts travelled to most districts for crop assessment, field observation, livestock and market conditions.
•Nutrition information was obtained through partners and key informants.
Deyr 2010/11 Seasonal Assessment Coverage Field Access and Field
Data Locations

Main Livelihood Groups Sources of Food and Income
Livelihood Groups & Main Sources of Food and Income:• Riverine livelihood: Primary sources of income of poor: sale of crops,
agricultural labour, and self employment. Primary food sources of poor: Own crop and
purchase. Primary livelihood asset of poor: Agriculture land
• Agropastoral Livelihoods (Agropastoral Maize/cattle and Agropastoral Sorghum/cattle)
Agropastoral Maize/Cattle: Primary sources of income of poor : crop sale, agricultural labour, livestock and livestock product sales, self-employment (fodder sales, firewood, construction materials, etc);
Main sources of food of poor: own production(maize) and purchase.
Agropastoral Sorghum/Cattle: Primary sources of income of poor: crop sale, agricultural labour, livestock and livestock product sales, self-employment (fodder sales, firewood, construction materials, etc); main sources of food : own production(Sorghum) and purchase.
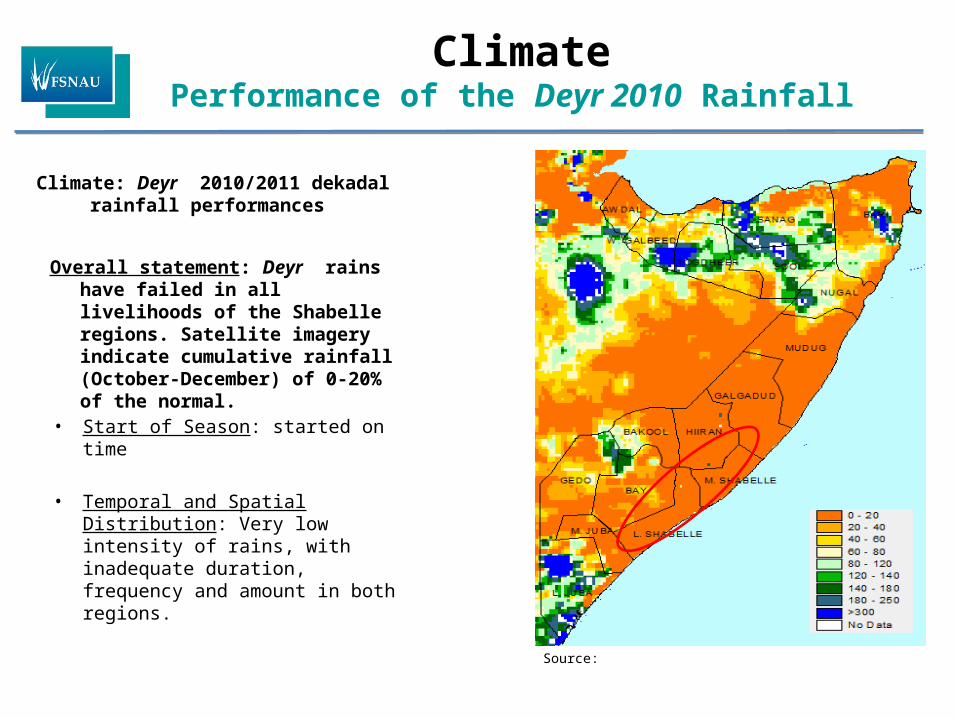
Overall statement: Deyr rains have failed in all livelihoods of the Shabelle regions. Satellite imagery indicate cumulative rainfall (October-December) of 0-20% of the normal.
ClimatePerformance of the Deyr 2010 Rainfall
Climate: Deyr 2010/2011 dekadal rainfall performances
• Start of Season: started on time
• Temporal and Spatial Distribution: Very low intensity of rains, with inadequate duration, frequency and amount in both regions.
Source:
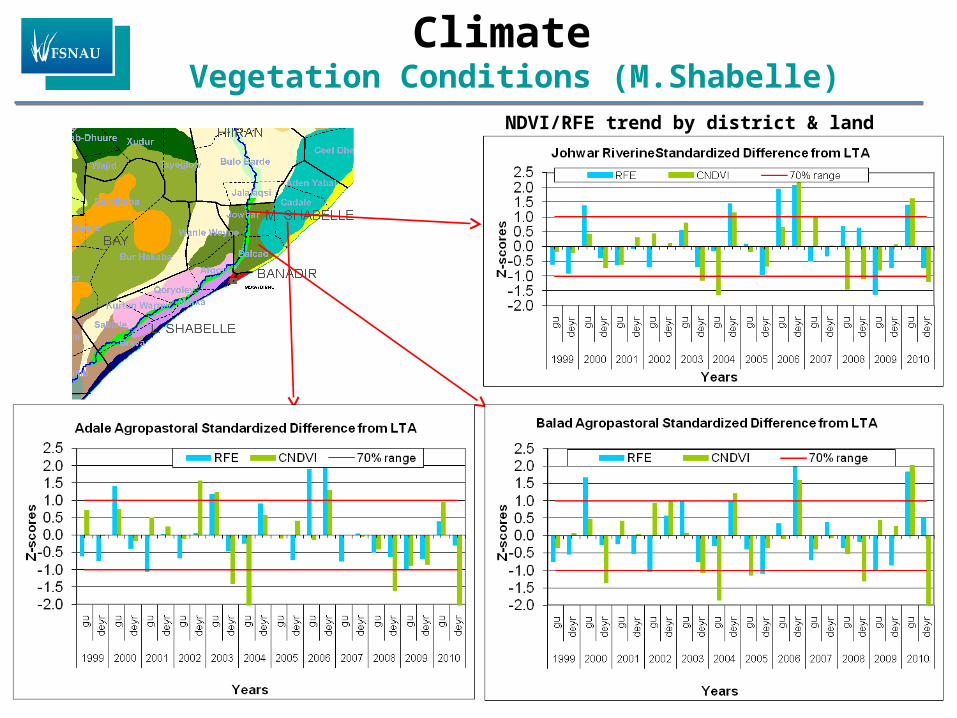
Climate Vegetation Conditions (M.Shabelle)
NDVI/RFE trend by district & land cover

Climate Vegetation Conditions (L.Shabelle)
NDVI/RFE trend by district & land cover

Civil Security Situation:• High political tension among religious groups
• Prolonged political confrontation in Mogadishu, and likely new conflicts at the border of M. Shabelle with Hiran
Direct and Indirect Impacts on Food Security & Nutrition: • Market disruption mainly in the districts surrounding Mogadishu.•Short term impact on urban areas and transportation routes in conflict areas.•Restriction of humanitarian intervention - (suspension of World vision, Diakonia and ADRA activities in southern Somalia) negatively impacting access to food and basic services (IDPs health posts and feeding centers ).• High taxation by local authorities in the rural areas that led many households to migrate to less controlled areas.
Source: FSNAU & Protection Cluster
Civil Insecurity
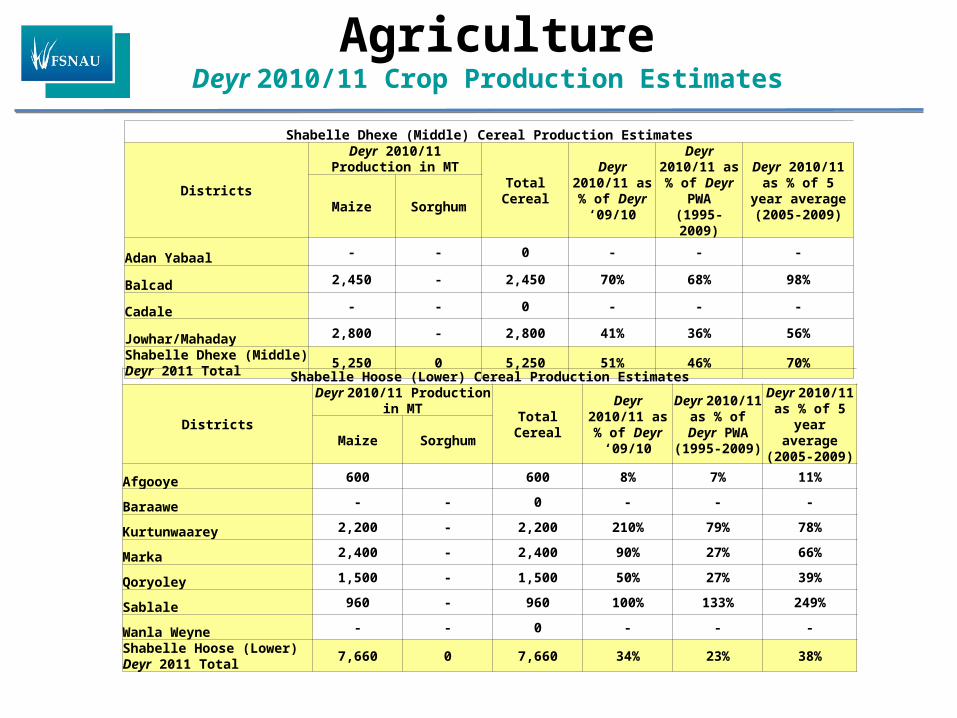
Agriculture Deyr 2010/11 Crop Production Estimates
Shabelle Dhexe (Middle) Cereal Production Estimates
Districts
Deyr 2010/11 Production in MT
Total CerealDeyr 2010/11 as % of Deyr
‘09/10
Deyr 2010/11 as % of Deyr
PWA(1995-2009)
Deyr 2010/11 as % of 5 year
average(2005-2009)
Maize Sorghum
Adan Yabaal - - 0 - - -
Balcad 2,450 - 2,450 70% 68% 98%
Cadale - - 0 - - -
Jowhar/Mahaday 2,800 - 2,800 41% 36% 56%
Shabelle Dhexe (Middle) Deyr 2011 Total
5,250 0 5,250 51% 46% 70%
Shabelle Hoose (Lower) Cereal Production Estimates
Districts
Deyr 2010/11 Production in MT
Total CerealDeyr 2010/11 as % of Deyr
‘09/10
Deyr 2010/11 as % of Deyr
PWA(1995-2009)
Deyr 2010/11 as % of 5 year
average(2005-2009)
Maize Sorghum
Afgooye 600 600 8% 7% 11%
Baraawe - - 0 - - -
Kurtunwaarey 2,200 - 2,200 210% 79% 78%
Marka 2,400 - 2,400 90% 27% 66%
Qoryoley 1,500 - 1,500 50% 27% 39%
Sablale 960 - 960 100% 133% 249%
Wanla Weyne - - 0 - - -
Shabelle Hoose (Lower) Deyr 2011 Total
7,660 0 7,660 34% 23% 38%
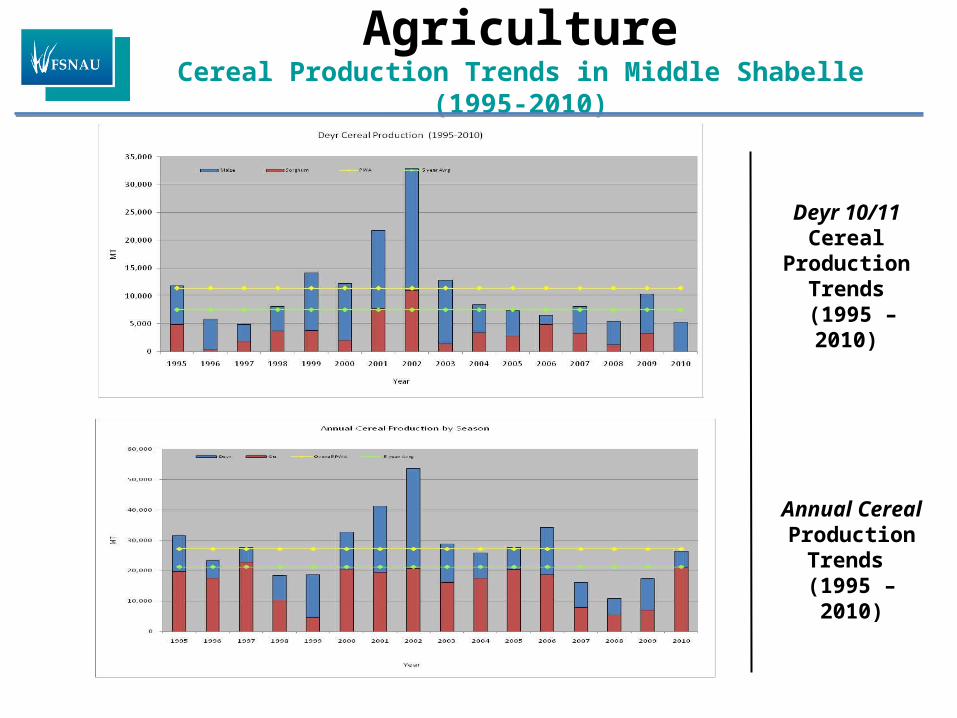
AgricultureCereal Production Trends in Middle Shabelle (1995-2010)
Deyr 10/11 Cereal
Production Trends
(1995 – 2010)
Annual Cereal Production
Trends (1995 – 2010)

Deyr 10/11 Cereal
Production Trends
(1995 – 2010)
Annual Cereal Production
Trends (1995 – 2010)
Agriculture Cereal Production Trends in Lower Shabelle (1995-2010)
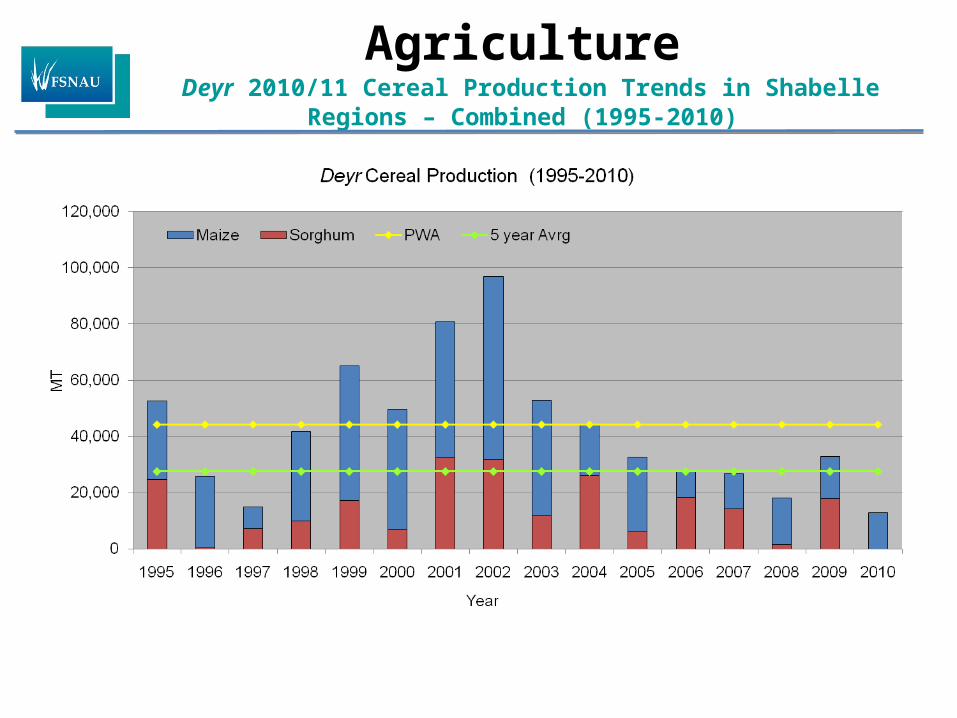
Agriculture Deyr 2010/11 Cereal Production Trends in Shabelle Regions –
Combined (1995-2010)
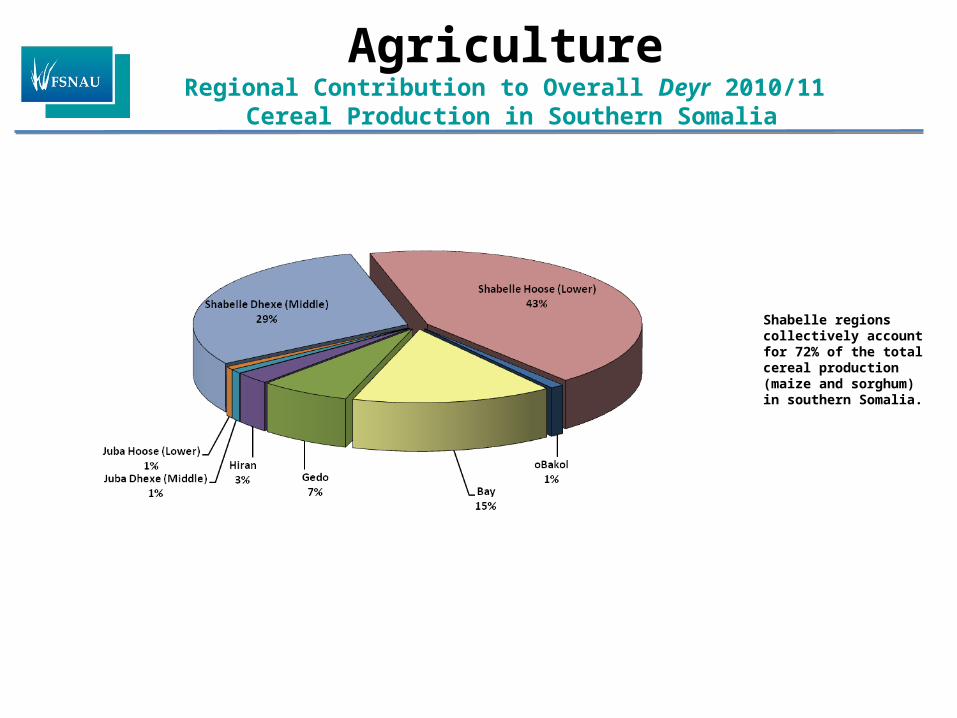
Agriculture Regional Contribution to Overall Deyr 2010/11
Cereal Production in Southern Somalia
Shabelle regions collectively account for 72% of the total cereal production (maize and sorghum) in southern Somalia.
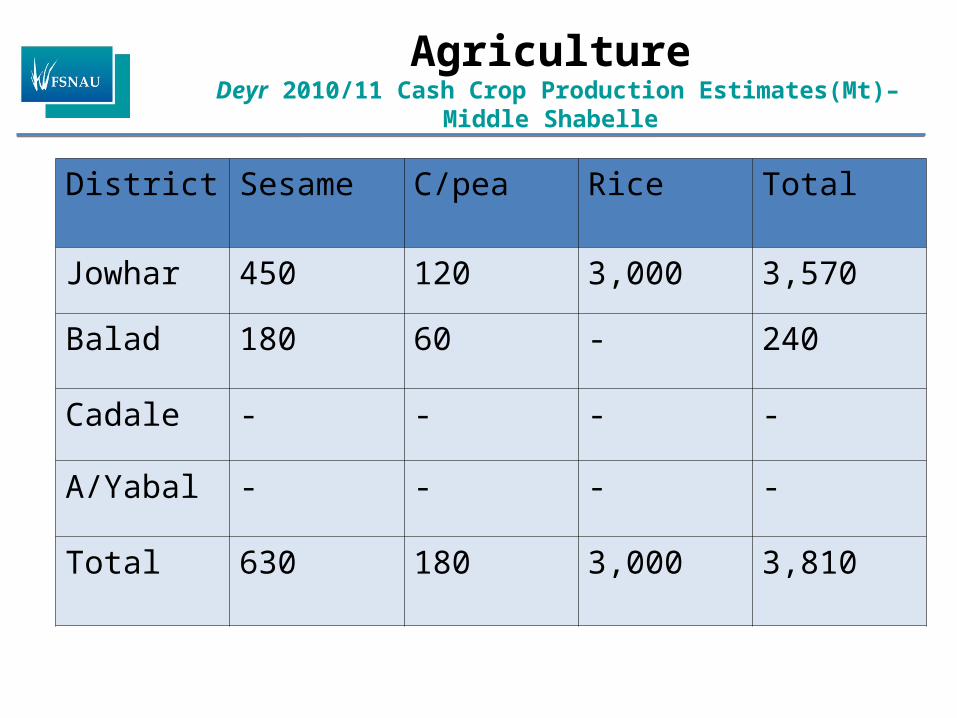
Agriculture Deyr 2010/11 Cash Crop Production Estimates(Mt)– Middle Shabelle
District Sesame C/pea Rice Total
Jowhar 450 120 3,000 3,570
Balad 180 60 - 240
Cadale - - - -
A/Yabal - - - -
Total 630 180 3,000 3,810

Agriculture Deyr 2010/11 Cash Crop Production Estimates – Lower Shabelle
District
Sesame Cowpea Total
Afgoye 150 30 180
Barawa 0 0 0
K/warey 2000 80 2080
Marka 40 300 340
Qorioley 60 35 95
Sablale 1000 150 1150
W/weyne 0 0 0
Total 3,250 595 3,845
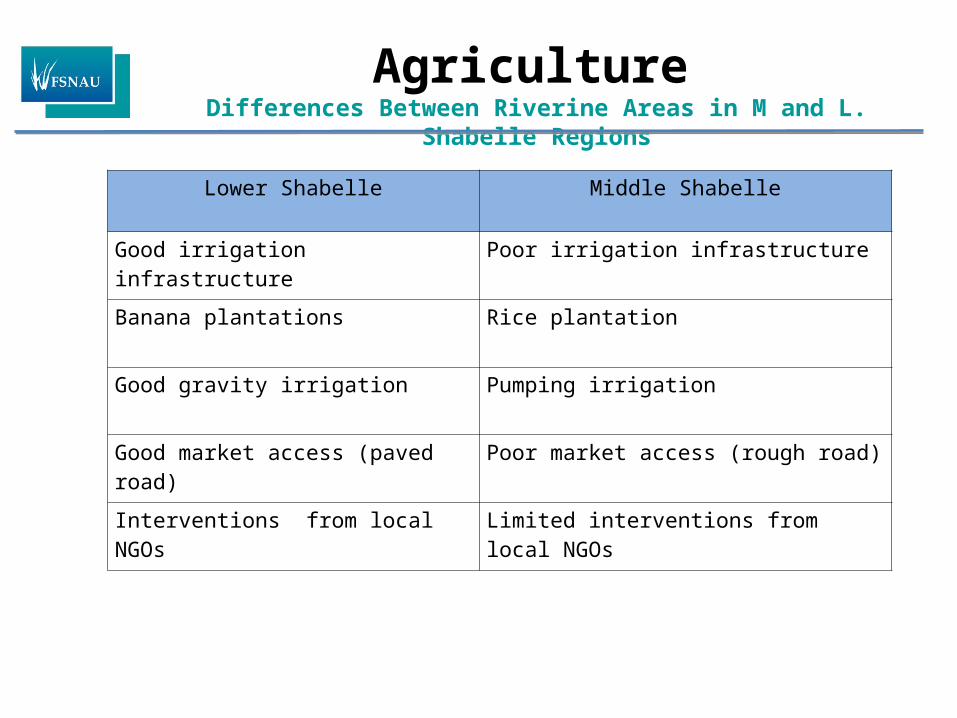
Agriculture Differences Between Riverine Areas in M and L. Shabelle
Regions
Lower Shabelle Middle Shabelle
Good irrigation infrastructure Poor irrigation infrastructure
Banana plantations Rice plantation
Good gravity irrigation Pumping irrigation
Good market access (paved road) Poor market access (rough road)
Interventions from local NGOs Limited interventions from local NGOs

AgricultureDeyr 2010/11 Assessment Photos
Good Riverine Rice Crop. Kallundi, Jowhar, M. Shabelle, FSNAU, Dec. ‘10
Poor Maize Crop. Marka, Lower Shabelle, FSNAU, December 2010.
Good sesame,Goosarow,Qoryoley,Lower Shabelle, FSNAU, Dec. ‘10
Significant drop down of Shabelle River Level. Qoryoley, Lower Shabelle, FSNAU, Dec. ‘10.

Agriculture
Deyr 2010/11 Local Cereal
Flow: Maize from Shabelle flows to Mogadishu markets and then to Hiran and central regions

AgricultureRegional Trends in Cereal Prices & Terms of Trade
Trends in Cereal Prices:
Jowhar (Middle Shabelle)
Trends in Cereal Prices:
Afgoye, Marka and Qoryoley (Lower Shabelle)
Factors Influencing cereal prices:
• Poor Maize production - Riverine•Sorghum crop failure in all agropastoral livelihoods. • High demand on maize from neighbouring regions, including Banadir

AgricultureLabour Rates & Availability
Factors Influencing Wage Labour Rates:
•High supply of casual labour (L. Shabelle in particular), pushing down the wage rates.
• Agricultural activities such as canal rehabilitation/road maintenance as a cash for work
•Seasonality
Middle Shabelle (Jowhar)
Lower Shabelle (all main markets)

AgricultureRegional Trends in Cereal Prices & Terms of Trade
Regional Trends in Terms of Trade: Jowhar, Middle Shabelle (5 kg of maize/ daily wage rate)
Regional Trends in Terms of Trade: Lower Shabelle(6 kg of maize/ daily wage rate)
Factors affecting Terms of Trade:
• High cereal prices • Decrease in labour wage rates• High supply of casual labour due to labour migration from agro-pastoral areas following a very poor seasonal performance.

Rangeland Conditions and Livestock Migration in Deyr ’10/11
Livestock
• Poor performance of Deyr ’10/11 season in both regions resulting in below normal pasture and water
• Abnormal migration to riverine areas of both regions.
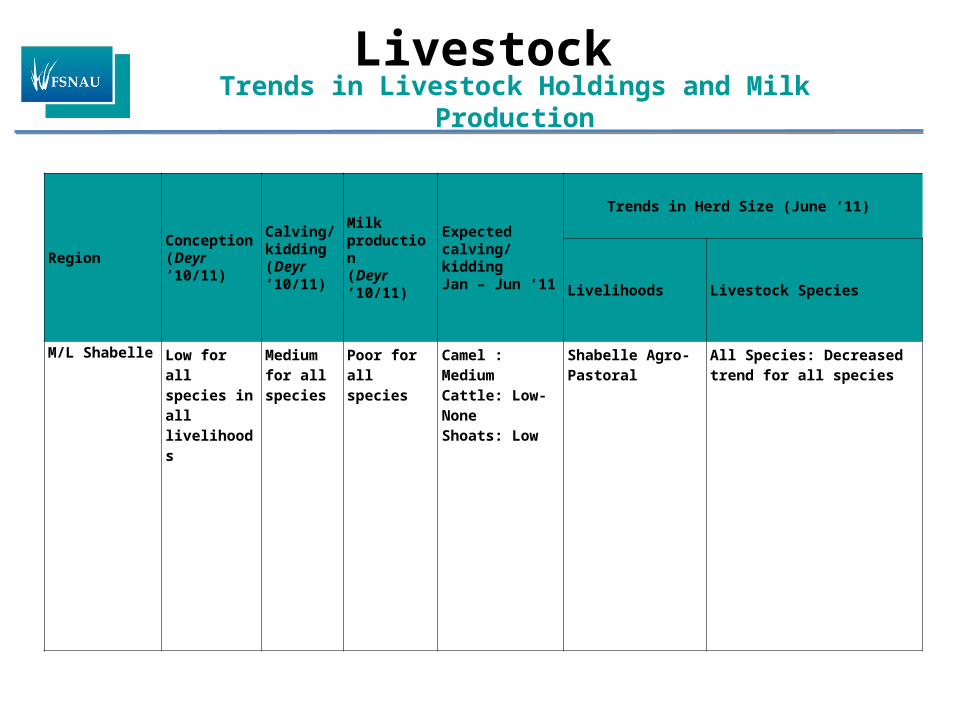
Livestock Trends in Livestock Holdings and Milk Production
RegionConception (Deyr ’10/11)
Calving/kidding (Deyr ’10/11)
Milk production (Deyr ’10/11)
Expected calving/ kidding Jan – Jun ‘11
Trends in Herd Size (June ‘11)
Livelihoods Livestock Species
M/L Shabelle Low for all species in all livelihoods
Medium for all species
Poor for all species
Camel : MediumCattle: Low-NoneShoats: Low
Shabelle Agro-Pastoral
All Species: Decreased trend for all species

Regional Trends in Local Goat Prices: M/ Shabelle
(Jowhar)
LivestockTrends in Goat Prices
Regional Trends in Local Goat Prices: L/ Shabelle (all markets)
Factors Influencing livestock prices:
• Poor body condition• Less saleable animals in Middle Shabelle • Increased livestock supply into Lower Shabelle markets after an influx of livestock from other livelihoods and regions into riverine• Low livestock demand after the end of Hajj period

LivestockTrends in Cattle Prices
Regional Trends in Local Cattle Prices (M/ Shabelle)
- Jowhar
Regional Trends in Local Cattle Prices
(L/Shabelle) – All markets
Factors Influencing Livestock Prices:
• Poor body condition
• High livestock supply into markets after an influx of livestock into riverine areas
• Reduced sales at Garissa market due to poor pasture and shortage of water along cattle trekking route to the market
•Low livestock demand after Hajj period
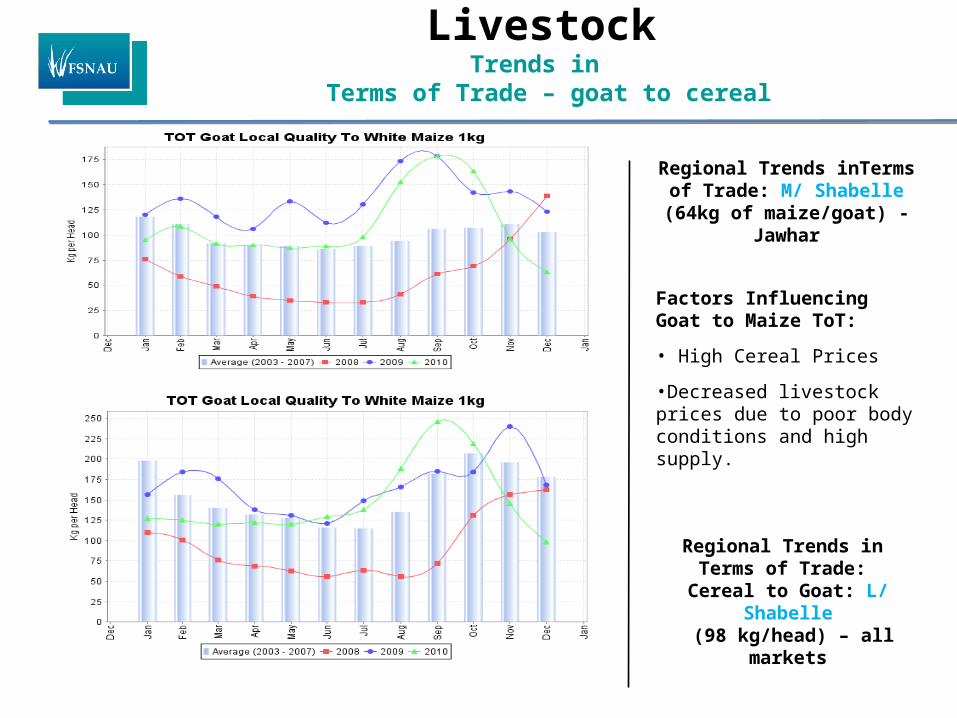
Regional Trends inTerms of Trade: M/ Shabelle (64kg of
maize/goat) - Jawhar
Regional Trends in Terms of Trade:
Cereal to Goat: L/ Shabelle (98 kg/head) – all markets
LivestockTrends in
Terms of Trade – goat to cereal
Factors Influencing Goat to Maize ToT:
• High Cereal Prices
•Decreased livestock prices due to poor body conditions and high supply.

Regional Trends in Terms of Trade: M/ Shabelle
(267kg of maize/head of cattle)
Regional Trends in Terms of Trade: L/
Shabelle
( 176 kg of maize/head of cattle)
LivestockTrends in Terms of Trade – local quality cattle to cereal
Factors Influencing TOT (cattle to maize):
• High Cereal Prices
•Decreased livestock prices due to poor body conditions, low demand and high supply.

Trends in Imported Commodity Prices
Factors Affecting Commercial Import Price increase (last six months)
•Disruption in commercial imports and Bakkara market, due to persisting fighting in Mogadishu and continuous piracy activities
•Increase in prices on international markets
Markets

NutritionSummary of Nutrition Findings
Region Nutrition Surveys (Oct – Dec 10)
Rapid MUAC Screening (% <12.5cm)
Health Information System Info
TFC/OTP/SFC
Other relevant information – Key
driving factors
Summary of analysis and change from Gu 10
Shabelle M. Shabelle RiverineN/A
M. Shabelle AgropastoralN/A
Afgoye IDPsGAM of 21.6% (18.2-25.3), SAM of 3.2% (2.2-4.6)(FSNAU & partners, Dec’10)
M. Shabelle Riverine>15% (23.0%;R=3) N=1650; 15 sites
M. Shabelle Agropastoral>15%25.0%; R=3)N=1650; 15 sites
L. Shabelle RiverineN=2200; 20 sitesGAM MUAC of >15% (27.7%; R3) SAM MUAC of >3% (8.7% R3)(FSNAU & partners, Dec‘10)
L. Shabelle AgropastoralN= 2200; 20 sitesGAM MUAC of >15% (23.4%; R3), SAMMUAC of >3% (7.4%; R3) (FSNAU & partners, Dec‘10)
Mogadishu/ BanadirN=1320; 6 District sitesGAMMUAC of >15% (29.2%; R3)SAMMUAC of >3% (12.0%; R3) (FSNAU & partners, Dec‘10)
High (>15%) and stable trends July-Dec ‘10, consistent with ‘09 trends
High (>20%) and increasing trends July-Dec ‘10, higher than ‘09 trends
High (>15%) and stable trends July-Dec ‘10, consistent with ‘09 trends
High (>20%) and increasing trends July-Dec ‘10, higher than ‘09 trends
Very high (>20%) and fluctuating trends in the last 6 months in Medina, Waberi, Hamar weyne and Hamar Jabjab. Low levels (<5%) and stable trends in Zam zam (July-Dec’10).
N/A
High and increasing numbers of admissions (in charge) in ACF managed centers (Hodan and Forlanini). Source: Jul – Dec ’ 2010)
Overall Aggravating Factors:•Civil insecurity - Mogadishu remains the epicenter•Limited Humanitarian space; displacement associated with civil insecurity•Disease outbreaks- AWD, cholera, malaria and whooping cough•Taxation•Limited access to health centers•Limited medical supplies in the area•Increasing number of new IDPs
Overall Mitigating Factors:•Limited access to SF programs•Income from sale of fodder and some labor opportunities among the riverine•Social support
M. Shabelle Riverine – Deterioration from Alert- No phase classification due to insufficient data but signs of deterioration and likely to be Critical
M. Shabelle Agrop -Deterioration from Alert- No phase classification due to insufficient data signs of deterioration and likely to be Critical
L. Shabelle Riverine – Deterioration from likely to be Serious in Gu ’10 - No phase classification due to insufficient data signs of deterioration and likely to be Critical
L. Shabelle Agrop -Deterioration from likely to be Serious in Gu ‘10- No phase classification due to insufficient data but signs of deterioration and likely to be Critical
Afgoye IDPsDeterioration from Critical in Gu ‘10 to Very Critical
BanadirDeterioration from likely Critical in Gu ‘10 to likely Very Critical

Nutrition Situation Estimates, January 2011Nutrition Situation Estimates, July 2010
NutritionNutrition Situation Estimates

IPC Summary: Progression of Rural IPC Situation (M.Shabelle)
Key IPC Reference Outcomes: Middle Shabelle (Central Agro-Pastoral (Aden Yabal and Adale) 50% Poor in HE, 50% Poor AFLC with Watch. Southern Agropastoral (Balad & Jowhar) 75% Poor AFLC with Watch, riverine (Balad and Jowhar) 50% Poor AFLC with Moderate Risk, Coastal Deeh 50% Poor in HE, 50% Poor AFLC with Watch.
• Acute malnutrition: insufficient data with signs of deterioration and likely to be Critical – Central AP• Food Access: entitlement gap; 2100kcal ppp/day• Water Access: average with poor quality• Destitution/Displacement: IDP concentration in camps; increasing. • Coping: collection of bush products, social support including Zakat of animals and crop - riverine, gifts in kind or cash,
migration.• Livelihood Assets: remain same as in Gu ’10 in most LZs but deteriorated in Coastal Deeh.
Main Contributing Factors: • Rainfall failure• Crop failure production• High cereal prices• Declining terms of trade• Job opportunity migrate to riverine• Poor livestock body condition and low livestock prices.
MAP 3: Livelihood ZonesMAP 1: IPC Gu 2010 MAP 2: IPC Deyr 2010/11

Key IPC Reference Outcomes: Lower Shabelle: Agropastoral (Wanlaweyn) BFI with High Risk (25% Poor in AFLC), Southeast
Pastoral - BFI with Moderate Risk, Southern Inland Pastoral - BFI with Moderate Risk, riverine - BFI with Moderate Risk,
Southern Coastal Pastoral - BFI with Moderate risk.• Acute malnutrition: Insufficient data with signs of deterioration and likely to be Critical• Food Access: borderline adequate (2100kcal ppp day)• Water Access: Average, but quality is very poor.• Destitution/Displacement: concentrated; increasing • Coping: insurance strategies - Collection of bush products, social support including Zakat of animals and crops - riverine. • Livelihood Assets: deteriorating for agro-pastoral and pastoral
Main Contributing Factors: • Maize and cash crop production (riverine)• Carry-over stocks• Cash for work, cash from grass sale • Low labour wages• High milk price• High grass prices for pastoralist and agropastoralists• High cereal prices•
MAP 3: Livelihood ZonesMAP 1: IPC Gu 2010
IPC Summary: Progression of Rural IPC Situation (L.Shabelle)
MAP 2: IPC Deyr 2010/11

IPC Classification of Rural Population (L.Shabelle)
Affected Regions and Livelihood Zone
Estimated Population by
Livelihood Zones
Assessed and High Risk Population in AFLC and HEGU 2010 Deyr 2010/11
Acute Food and Livelihood Crisis
(AFLC)
Humanitarian Emergency
(HE)
Acute Food and Livelihood Crisis
(AFLC)
Humanitarian Emergency
(HE)
L/ Shabelle Coastal pastoral: goats & cattle 2,534 0 0 0 0
L.Shab. r/fed & f/irr 372,273 0 0 0 0 Shabelle Riverine 115,552 0 0 0 0 South-East Pastoral 6,884 0 0 0 0 Southern Agro-Past 106,902 0 0 9,000 0 Southern Inland Past 73,793 0 0 0 0 SUB-TOTAL 677,937 0 0 9,000 0
TOTAL AFFECTED POPULATION IN AFLC & HE 0 9,000
Affected Regions and District UNDP 2005 Rural Population
Assessed and High Risk Population in AFLC and HE
GU 2010 Deyr 2010/11
Acute Food and Livelihood Crisis
(AFLC)
Humanitarian Emergency
(HE)
Acute Food and Livelihood Crisis
(AFLC)
Humanitarian Emergency
(HE)
L/ Shabelle Afgooye/Aw Dheegle 178,605 0 0 0 0
Baraawe 42,239 0 0 0 0 Kurtunwaarey 48,019 0 0 0 0 Marka 129,039 0 0 0 0
Qoryooley 111,364 0 0 0 0Sablaale 35,044 0 0 0 0Wanla Weyn 133,627 0 0 9,000 0
SUB-TOTAL 677,937 0 0 9,000 0
TOTAL AFFECTED POPULATION IN AFLC & HE 0 9,000

IPC Classification of Rural Population (M.Shabelle)
Affected Regions and District UNDP 2005 Rural Population
Assessed and High Risk Population in AFLC and HE
GU 2010 Deyr 2010/11
Acute Food and Livelihood Crisis
(AFLC)
Humanitarian Emergency
(HE)
Acute Food and Livelihood Crisis
(AFLC)
Humanitarian Emergency
(HE)M/ Shabelle Adan Yabaal 55,717 4,000 1,000 7,000 7,000 Balcad/Warsheikh 105,266 9,000 0 22,000 5,000
Cadale 35,920 2,000 1,000 5,000 5,000 Jowhar/Mahaday 222,167 30,000 0 36,000 0 SUB-TOTAL 419,070 45,000 2,000 70,000 17,000
TOTAL AFFECTED POPULATION IN AFLC & HE 47,000 87,000
Affected Regions and Livelihood Zone
Estimated Population by
Livelihood Zones
Assessed and High Risk Population in AFLC and HEGU 2010 Deyr 2010/11
Acute Food and Livelihood Crisis
(AFLC)
Humanitarian Emergency
(HE)
Acute Food and Livelihood
Crisis(AFLC)
Humanitarian Emergency
(HE)
M/ Shabelle Central Agro-Past 36,695 7,000 2,000 5,000 5,000 Coastal Deeh: sheep 93,722 0 0 12,000 12,000 Shabelle Riverine 53,657 0 0 11,000 0 Southern Agro-Past 160,948 28,000 0 42,000 0 Southern Inland Past 74,048 10,000 0 0 0 SUB-TOTAL 419,070 45,000 2,000 70,000 17,000
TOTAL AFFECTED POPULATION IN AFLC & HE 47,000 87,000

IPCEstimated Urban Population in AFLC & HE by District
District UNDP 2005 Urban Population
Acute Food and Livelihood Crisis (AFLC)
Deyr 10/11
Humanitarian Emergency (HE)
Deyr 10/11
Total in AFLC or HE as % of Urban population
Deyr 10/11
M/ Shabelle
Adan Yabaal 7,200 2,000 0 28Balcad 28,106 6,000 0 21Cadale 10,800 3,000 0 28Jowhar 36,844 8,000 0 22Mahaday 10,246 2,000 0 20Warsheikh 2,635 1,000 0 38
Sub-Total 95,831 22,000 0 23L/Shabelle
Afgooye 21,602 2,000 7,000 42Aw Dheegle 11,505 1,000 4,000 43Baraawe 15,413 1,000 4,000 32Kurtunwaarey 7,426 1,000 2,000 40Marka 63,900 7,000 22,000 45Qoryooley 22,841 2,000 6,000 35Sablaale 8,011 1,000 2,000 37Wanla Weyn 22,016 2,000 6,000 36
Sub-Total 172,714 17,000 53,000 41

The End