FOOD INSECURITY AND EATING BEHAVIOR … · conditions by providing older adults access to these...
85
FOOD INSECURITY AND EATING BEHAVIOR RELATIONSHIPS AMONG CONGREGATE MEAL PARTICIPANTS IN GEORGIA by TAMARA LYNN MYLES (Under the Direction of Mary Ann Johnson) ABSTRACT This study explored relationships of food insecurity with cognitive restraint, uncontrolled eating, and emotional eating behaviors among congregate meal participants in northeast Georgia (n = 118, age 60 and older, mean (SD) age = 75 (8) years, 75% female, 43% Black, 53% obese, BMI > 30). Food insecurity was assessed with a 6-item questionnaire (adapted from USDA 2012, Wolfe et al 2003); scores ranged from 0 to 6 and were categorized and defined from high or marginal food security to very low food security. Eating behavior was assessed with an 18- item Three-Factor Eating Questionnaire R-18 (Karlsson et al 2000, Porter and Johnson 2011). Food insecurity was consistently associated with cognitive restraint, but not with uncontrolled or emotional eating. These findings suggest there may be other dimensions of cognitive restraint to consider in nutritional assessment and interventions among food insecure older adults. INDEX WORDS: Food insecurity; Eating behavior; Older adult; Congregate meal participant; Cognitive restraint; Uncontrolled eating; Emotional eating, TFEQ-R18; Three-Factor Eating Questionnaire; OAANP
Transcript of FOOD INSECURITY AND EATING BEHAVIOR … · conditions by providing older adults access to these...

FOOD INSECURITY AND EATING BEHAVIOR RELATIONSHIPS AMONG
CONGREGATE MEAL PARTICIPANTS IN GEORGIA
by
TAMARA LYNN MYLES
(Under the Direction of Mary Ann Johnson)
ABSTRACT
This study explored relationships of food insecurity with cognitive restraint, uncontrolled
eating, and emotional eating behaviors among congregate meal participants in northeast Georgia
(n = 118, age 60 and older, mean (SD) age = 75 (8) years, 75% female, 43% Black, 53% obese,
BMI > 30). Food insecurity was assessed with a 6-item questionnaire (adapted from USDA
2012, Wolfe et al 2003); scores ranged from 0 to 6 and were categorized and defined from high
or marginal food security to very low food security. Eating behavior was assessed with an 18-
item Three-Factor Eating Questionnaire R-18 (Karlsson et al 2000, Porter and Johnson 2011).
Food insecurity was consistently associated with cognitive restraint, but not with uncontrolled or
emotional eating. These findings suggest there may be other dimensions of cognitive restraint to
consider in nutritional assessment and interventions among food insecure older adults.
INDEX WORDS: Food insecurity; Eating behavior; Older adult; Congregate meal
participant; Cognitive restraint; Uncontrolled eating; Emotional eating, TFEQ-R18; Three-Factor Eating Questionnaire; OAANP

FOOD INSECURITY AND EATING BEHAVIOR RELATIONSHIPS AMONG
CONGREGATE MEAL PARTICIPANTS IN GEORGIA
by
TAMARA LYNN MYLES
BS, University of Georgia, 2012
A Thesis Submitted to the Graduate Faculty of The University of Georgia in Partial Fulfillment
of the Requirements for the Degree
MASTER OF SCIENCE
ATHENS, GEORGIA
2014

© 2014
TaMara Lynn Myles
All Rights Reserved

FOOD INSECURITY AND EATING BEHAVIOR RELATIONSHIPS AMONG
CONGREGATE MEAL PARTICIPANTS IN GEORGIA
by
TAMARA LYNN MYLES
Major Professor: Mary Ann Johnson
Committee: Joan Fischer Jung Sun Lee Electronic Version Approved: Maureen Grasso Dean of the Graduate School The University of Georgia May 2014

iv
DEDICATION
I would like to dedicate this Thesis to my mom who has sacrificed so much for me in
achieving my educational goals; also to my son who is the greatest gift that God has given me.
Their sacrifices will never be forgotten.

v
ACKNOWLEDGEMENTS
I would like to thank my family especially my mom, sister, and my son for the sacrifices,
encouragement and support that they have made for me in achieving all of my goals especially
ones pertaining to my education. These are the most rewarding accomplishments that I have
made. All that you have done is greatly appreciated.
I would like to thank my advisor, Dr. Mary Ann Johnson. It was her who first
encouraged me to complete my masters degree and I have to say that without the encouragement
to do that I may not have gone this far. She has given me the greatest support, opportunity, and
encouragement in all that I have desired to achieve in my educational career as well as in my
personal growth. Her belief in me, and all that I have learned from her is priceless and has truly
helped to guide the success and direction of my life. It has truly been an honor to work with her.
Special thank you to my committee Dr. Joan Fischer and Dr. Jung Sun Lee for their
valuable support and guidance in my studies as an undergraduate and graduate student as well as
in the writing of my Thesis. Also a special thank you to Kristen Johnson for all the time that she
took out of her busy schedule to help me not only with my research but with work as well. You
are greatly appreciated.
Finally I would like to thank my friends, classmates and professors for the solid
foundation that they have helped me build to move on to the next phase of my life.

vi
TABLE OF CONTENTS
Page
ACKNOWLEDGEMENTS ............................................................................................................ v
LIST OF TABLES ....................................................................................................................... viii
CHAPTER
1 INTRODUCTION ........................................................................................................ 1
2 LITERATURE REVIEW ............................................................................................. 4
Older adults ............................................................................................................. 4
Older American’s Act health promotion and nutrition programs ........................... 5
Congregate meal participants and health ................................................................ 6
Food insecurity ........................................................................................................ 7
Food insecurity among older adults ........................................................................ 8
Food security measurement tools .......................................................................... 10
Hunger ................................................................................................................... 13
Binge eating .......................................................................................................... 13
Appetite ................................................................................................................. 14
Eating behaviors .................................................................................................... 15
Three-Factor Eating Questionnaire R-18 (TFEQ-R18) ........................................ 17
Rationale for study ................................................................................................ 18
Specific aims and hypotheses ............................................................................... 19

vii
3 FOOD INSECURITY AND EATING BEHAVIOR RELATIONSHIPS AMONG
CONGREGATE MEAL PARTICIPANTS IN GEORGIA ........................................ 20
Introduction ........................................................................................................... 21
Methods ................................................................................................................. 23
Results ................................................................................................................... 26
Discussion ............................................................................................................. 30
4 SUMMARY ................................................................................................................ 44
Future assessment of older adults ......................................................................... 44
Implications to congregate meal sites ................................................................... 45
Additional research in the current sample ............................................................ 46
Future studies ........................................................................................................ 47
REFERENCES ............................................................................................................................. 48
APPENDICES
A Live Healthy Georgia consent form and questionnaire .............................................. 53
B Three-Factor Eating Questionnaire (Revised 18-item) ............................................... 68
C US Household Food Security Survey Module questionnaire: Six-Item Short Form .. 70
D Results of associations of food insecurity and eating behaviors: (p-values) .............. 76

viii
LIST OF TABLES
Page
Table 2.1: Food insecurity questions and questionnaires ............................................................. 12
Table 3.1: Characteristics of participants ...................................................................................... 35
Table 3.2: Correlations of food insecurity with eating behaviors ................................................. 36
Table 3.3: Food insecurity, demographics, health and eating behaviors: bivariate relationships 37
Table 3.4: Correlations of food insecurity with demographics and chronic disease ..................... 39
Table 3.5: Correlations of eating behaviors with demographics and chronic disease ................... 40
Table 3.6: Bivariate characteristics: eating behaviors at the median split .................................... 41
Table 3.7: Associations of food insecurity and eating behaviors: regression analyses models .... 42

1
CHAPTER 1
INTRODUCTION
Individuals 65 and older, as of 2012, represented 13.7% of the US population and 11.5%
of the state of Georgia (US Census Bureau (C) 2014). The older adult population (65+) is
increasing rapidly and is projected to increase to 55 million in 2020 (Greenberg 2011). With
age, the likelihood of multiple chronic conditions increases presenting a problem for older adults.
More of them will be living with multiple chronic conditions and they are more likely than others
to have difficulty performing activities of daily living such as eating and getting in or out of bed
(Kleinman and Foster 2011).
To meet the diverse needs of older adults and in response to the lack of community services
available to them, the Older American’s Act (OAA) was implemented in 1965 to provide grants
to states for community planning and social services, research and development projects, and
personnel training in the field of aging (AOA 2013). The act provides for health promotion
services (OAA Title IIID) and social and nutrition services (OAA Title IIIC) to older adults
(60+). The disease prevention and health promotion services established in 1987 provide grants
to states for education and implementation activities that support healthy lifestyles and promote
healthy behaviors using evidence-based programs (AOA 2013). The nutrition services include
congregate nutrition services (Title III C1) and home-delivered nutrition services (Title III C2)
(AOA 2013). The purpose of the program is to reduce hunger and food insecurity (FI), promote

2
the socialization and the health and well being of older adults, and to delay adverse health
conditions by providing older adults access to these nutrition and health promoting services.
In 2012, 2.8 million households with older adults age 65 and older were FI (8.8%), and 18% of
older adults in Georgia were marginally food insecure (Coleman-Jenson et al 2013, Ziliak and
Gunderson 2013). The health and well being of older adults as well as their nutritional status is
greatly influenced by FI leading to health problems such as poor chronic disease management,
physical health, and medication non-adherence which can exacerbate existing poor health
conditions (Lee 2013). The congregate meal program targets older adults who are low-income
and FI, but we have observed a high prevalence of obesity in these elders in Georgia (40-50% or
more) that was similar to the national prevalence in older adults (Brewer et al 2010, Porter and
Johnson 2011). Among congregate meal participants in Georgia in 2007-2008, the prevalence of
FI was nearly 20% (Brewer et al 2010, Catlett 2009). Nationally, 41% of congregate meal
participants report having six or more chronic conditions with the most common being high
blood pressure and 9% report difficulty with at least three ADL limitations (Kleinman and Foster
2011).
The three most commonly studied psychological types of eating behaviors are cognitive restraint
(CR), disinhibition or uncontrolled eating (UE), and emotional eating (EE). Research has shown
that certain eating behaviors are associated with obesity in congregate meal participants (Porter
and Johnson 2011). Research of FI in older adult congregate meal participants is limited and
little is known about the relationship of FI and eating behaviors so it is important to determine
the association between FI and eating behaviors in this population.

3
This study explored relationships of FI with CR, UE, and EE behaviors among congregate meal
participants in Northeast Georgia, who were recruited from four senior centers affiliated with the
Northeast Georgia’s Area Agency on Aging (AAA) where they participated in the congregate
meal program.
Chapter 2 is a review of the literature outlining demographics and health of the older adult
population, a review and assessment measures of FI and CR, UE and EE eating behaviors and an
overview of hunger and binge eating.
Chapter 3 includes the methods, results, and discussion of the relationship between FI (food
secure, low food security and very low food security) and eating behavior (CR, UE and EE).
Chapter 4 presents a summary of the major findings and conclusions of this study.

4
CHAPTER 2
LITERATURE REVIEW
Older adults In 2012, there were over 43 million older adults in the US age 65 and older, which was over 13%
of the total population (US Census Bureau (A) 2013). The older adult population age 65 and
older is steadily increasing and is expected to reach 92 million by 2060 with dramatic growth
from 2010-2030 because of the large number of baby boomers (US Census Bureau (B) 2012).
Fertility and mortality levels as well as the migration of people from state to state contribute to
the varying proportion of those aged 65 and older. As the older adult population is growing, it is
also becoming more diverse. In 2010, 80% of the US older adult population were non-Hispanic
Whites, 9% Blacks and 7% Hispanics (of any race) (Older Americans 2012). By the year 2050,
the population change in race/ethnicity is expected to be 58% non-Hispanic Whites, 12% Blacks,
and 20% Hispanic (Older Americans 2012).
In 2011, life expectancy for those at age 65 increased and individuals who reach this age can
expect to live an average of 19.2 more years; however, multiple chronic diseases during this
stage of life can contribute to decreased quality of life and physical function (AOA 2013, Older
Americans 2012). About 41% of older adults 65 and older who were enrolled in Medicare
reported limitations in activities of daily living or instrumental activities of daily living in 2009
(Older Americans 2012). Most older adults have at least one chronic health condition and from

5
the latest data available from various years (2007-2011) the prevalence of several diseases was:
diagnosed arthritis (51%), diabetes (20%), all types of heart disease (31%), and hypertension
(72%) among older adults age 65 and older (AOA 2013).
Older American’s Act health promotion and nutrition programs
To meet the diverse needs of older adults and in response to the lack of community services
available to them, the Older American’s Act (OAA) was implemented in 1965 to provide grants
to states for community planning and social services, research and development projects, and
personnel training in the field of aging (AOA 2013). The act provides for health promotion
services (OAA Title IIID) and social and nutrition services (OAA Title IIIC) to older adults.
The disease prevention and health promotion services established in 1987 provide grants to states
for education and implementation activities that support healthy lifestyles and promote healthy
behaviors using evidence-based programs (AOA 2013). Some of the health promotion programs
available include: A Matter of Balance (emphasizing practical strategies to reduce fear of falling
and increase activity levels), Chronic Disease Self-Management Program (help older adults gain
self-confidence in their ability to control their symptoms and how their health problems affect
their lives), and Better Choices, Better Health (an online workshop for people with chronic
conditions) (NCOA 2013).
The Older American’s Act Nutrition Program (OAA section 330) provides nutrition services to
older adults through congregate nutrition services (Title III C1) and home-delivered nutrition
services (Title III C2) (AOA 2013). The purpose of the program is to reduce hunger and FI,
6
promote the socialization and the health and well being of older adults, and to delay adverse
health conditions by providing older adults access to these nutrition and health promoting
services. The program focuses on those who have the greatest social and economic need such as
minorities, those who are low income, live in rural areas, have limited English proficiency or are
at risk of institutional care (AOA 2013).
Congregate nutrition services (OAA section 331) were established in 1972 and provide meals
and nutrition services to older adults in a congregate setting such as senior centers (AOA 2013).
It includes services such as nutrition screening, education, assessment, and counseling in
addition to providing social engagement opportunities. Home-delivered nutrition services (OAA
section 336) were established in 1978 and are provided for older adults who are homebound
because of illness, disability, or geographic isolation. The same nutrition services are offered
with home-delivered meals as with congregate meals. Both congregate and home-delivered
services are available to older adults who are 60 or over and their spouses regardless of age.
Disabled individuals under the age of 60 and living with the older adult or caregivers under 60
who provide services during meal hours may also receive services (AOA 2013).
Congregate meal participants and health
The congregate meal program targets older adults who are low-income and FI, but we have
observed a high prevalence of obesity in these elders in Georgia (40-50% or more) that was
similar to the national prevalence (Brewer et al 2010, Porter and Johnson 2011). Older adults
who participate in the OAA are 3 times more likely to meet federal guidelines for poverty
compared to national averages (Penn et al 2009). In addition, there is a high prevalence of

7
overweight and obesity, chronic conditions, poor or fair self-reported health, and poor physical
function in Georgia’s OAA program participants who receive congregate meals and other
nutrition and wellness services (Penn et al 2009). For OAA program participants in Georgia,
being overweight is associated with an increase in diabetes prevalence (at least a 10 percentage-
point increase) while a decrease in flexibility and self-reported health and physical function was
associated with an increase in BMI or waist circumference (Penn et al 2009). Nationally, 41% of
congregate meal participants report having six or more chronic conditions with the most
common being high blood pressure, eye or vision conditions, and arthritis or rheumatism
(Kleinman and Foster 2011). In addition, 9% of congregate meal participants report difficulty
with at least three ADL limitations (Kleinman and Foster 2011).
Food insecurity
FI is defined as the limited or uncertain availability of nutritionally adequate and safe foods or
limited or uncertain ability to acquire acceptable foods in socially acceptable ways (Anderson
1990). In 2012, 14.5% of households in the US were FI (Coleman-Jenson et al 2013). Although
the prevalence of food security is high in older adults (USDA Economic Research Service 2002),
17.8% of those age 65 and older are between 100% and 200% of their poverty line (DeNavas-
Walt et al 2013) and FI prevalence for this population are two to three times higher than those
living above this poverty line (IOM 2012).
In response to recommendations by the Committee on National Statistics, the USDA introduced
new language to describe ranges of severity of FI in 2006 leaving previous methods to assess

8
households’ food security unchanged so it can still be compared with previous years (USDA
2012). USDA describes ranges of food security and FI as follows.
The ranges of food security are currently defined as:
• High food security (previously known as food security) – no reported indications of food
access problems or limitations
• Marginal food security (previously known as food security) – one or two reported
indications—typically of anxiety over food sufficiency or shortage of food in the house
with little or no indication of changes in diet or food intake
The ranges of FI are currently defined as:
• Low food security (previously known as FI without hunger) – reduced quality, variety, or
desirability of diet with little or no indication of reduced intake
• Very low food security (previously known as FI with hunger) – multiple indications of
disrupted eating patterns and reduced food intake
Food insecurity among older adults
FI in older adults is a clinically relevant nutritional problem because it is associated with poor
food and nutrition intake and with obesity (Johnson et al 2011, Lee et al 2010). In 2012, 2.8
million households with older adults age 65 and older were FI (8.8%), and 18% of older adults in
Georgia are marginally food insecure (Coleman-Jenson et al 2013, Ziliak and Gunderson 2013).
FI in older adults is more prevalent in minority populations who are less educated and low-
income (Lee 2013). The health and well being of older adults as well as their nutritional status is
greatly influenced by FI leading to health problems such as poor chronic disease management,
poor physical and functional health, and medication non-adherence, which can exacerbate
9
existing poor health conditions (Lee 2013). Multiple chronic conditions in low income older
adults may force them to choose between basic food and healthcare needs, and this can have
major consequences because FI in older adults may lead to poor management of chronic
diseases, exacerbate diseases, decrease resistance to infection, and extend hospital stays
(Bhargava et al 2012, Lee 2013, Seligman and Schillinger 2012). All of this contributes to an
increase in healthcare costs and national healthcare expenditures (Lee 2013). FI older adults
may spend more on healthcare expenditures because of their poorer health or they may spend
less if they substitute food for healthcare due to financial constraints (Bhargava et al 2012).
Although the OAANP is helping many older adults and funding has increased since 2008, it has
remained relatively flat over the last few years and it has not kept up with need (AOA 2013, Lee
et al 2010). In Georgia among those who request a meal, nearly 5% of older adults are on the
waitlist for congregate meals (CM) and nearly 60% are on the waitlist for home delivered meals
(HDM) (Lee et al 2010). Among those on the waitlist for CM and HDM, 47.2% and 59.2% are
FI, respectively. Among a convenience sample of congregate meal participants in Georgia in
2007-2008, the prevalence of FI was nearly 20% (Brewer et al 2010, Catlett 2009). Nationally
the prevalence of FI is higher in subgroups of the population such as Blacks and Hispanics and in
these same subgroups of the older adult population, and FI has been associated with obesity
(Johnson et al 2011). The prevalence of obesity is also likely to be higher among congregate
meal participants as well as older adults receiving other community-based services (Johnson et al
2011).

10
Food security measurement tools
The USDA uses several modules (questionnaires) to measure food security including the 18-item
US Household Food Security Survey Module, the Six-item Short Form (Appendix C) of the
Food Security Survey Module, the 10-item US Adult Food Security Survey Module and the Self-
Administered Food Security Survey Module for Youth Ages 12 and Older (USDA 2012). The
self-administered module for youth measures food security only in children. The 18-item
module measures food security of the household and asks questions about children and adults
and the 10-item and 6-item modules measure food security of the adult and does not ask
questions about children. The questions included in all of the modules aim to assure that the
behavior reported by the respondent occurred because of household financial limitations (Bickel
et al 2000).
In response to recommendations by the Committee on National Statistics, the USDA introduced
new language to describe ranges of severity of FI in 2006 leaving previous methods to assess
households’ food security unchanged so it can be compared with previous years, (USDA 2012).
The 6-item module has less respondent burden and is used when surveys cannot implement the
18-item or 10-item modules (USDA 2012). Scores using this module range from 0 to 6 and is
scored as high or marginal food security (score 0-1), low food security (scores 2-4) and very low
food security (scores 5-6). This module captures the thresholds of identifiable household FI and
hunger among household members and was designed for use in local as well as national surveys
to determine the extent and severity of FI and hunger within communities (Bickel et al 2000).
Local surveys using this module can obtain findings that are readily interpretable and can be

11
compared directly with national and state-level benchmark statistics published by the USDA
annually (Bickel et al 2000).
In the current study, FI will be assessed using a questionnaire that includes six questions that
were adapted from the original 18-item US Household Food Security questionnaire (Appendix
A) (USDA 2012). Item two was modified from the original 6-item questionnaire from “(I/we)
couldn’t afford to eat balanced meals” to “You couldn’t choose the right food and meals for your
health because you couldn’t afford them.” This adjustment was made to improve comprehension
of the question by older adult respondents. One point is given for an affirmative response and
scores range from 0 to 6 and are scored as high or marginal food security (score 0-1), low food
security (scores 2-4) and very low food security (scores 5-6) (Table 2.1 below).

12
Table 2.1. Food insecurity questions and questionnaires1
USDA HFSSM 20122 Myles 2014 (Thesis)2 Lee et al 20103 In the last 12 months. Think about the past 30 days. 30 days. 1. “The food that (I/we) bought just didn’t last, and (I/we) didn’t have money to get more.” Was that often, sometimes, or never true for (you/your household) in the last 12 months?
1. The food that you bought just didn’t last, and you didn’t have money to buy more. Often, sometimes, or never?
1. During the last 30 d, how often was this statement true: the food that we bought just didn’t last, and we didn’t have money to get more.
2. “(I/we) couldn’t afford to eat balanced meals.” Was that often, sometimes, or never true for (you/your household) in the last 12 months?
2. You couldn’t choose the right food and meals for your health because you couldn’t afford them. Often, sometimes, or never?
2. During the last 30 d, how often was this statement true: We couldn’t afford to eat balanced meals.
3. In the last 12 months, since last (name of current month), did (you/you or other adults in your household) ever cut the size of your meals or skip meals because there wasn't enough money for food?
3. Did you ever cut the size of your meals or skip meals because there wasn’t enough money for food? Yes or no?
3. In the past 30 d, did you or other adults in your household ever cut the size of your meals because there wasn’t enough money for food?
4. ([IF YES ABOVE, ASK] How often did this happen—almost every month, some months but not every month, or in only 1 or 2 months?)
4. a. If yes, in the last 30 days, how many days did this happen? 1 or more days coded as yes.
4. In the past 30 d, did you or other adults in your household ever skip meals because there wasn’t enough money for food?
5. In the last 12 months, did you ever eat less than you felt you should because there wasn't enough money for food?
5. Did you ever eat less than you felt you should because there wasn’t enough money to buy food? Yes or no?
5. In the last 30 d, did you ever eat less than you felt you should because there wasn’t enough money to buy food?
6. In the last 12 months, were you ever hungry but didn’t eat because there wasn’t enough money for food?
6. Were you ever hungry but didn’t eat because you couldn’t afford enough food? Yes or no?
6. In the last 30 d, were you ever hungry but didn’t eat because you couldn’t afford enough food?
1 The Nutrition Screening Initiative (Posner et al 1993) uses this question, which is adapted from the USDA HFSSM, “Do you always have enough money to buy the food you need?” that is answered “yes” or “no” without a specific time frame. This question was used to assess food insecurity in congregate meal participants by Brewer et al (2010) and Porter and Johnson (2011). 2 Coding for USDA HFSSM (2012) and Myles (2014), each question is scored 1 point for the affirmative answer (yes, often or sometimes = 1 point) and the maximum score is 6; high or marginal food security = 0-1; low food security = 2-4; very low food security = 5-6. 3 Coding for Lee et al (2010), each question is scored 1 point for the affirmative answer (yes, often or sometimes = 1 point) and the maximum score is 6: food security = 0; marginal food security = 1; low food security = 2-4; very low food security = 5-6. For some analyses, food secure = 0-1; food insecure = 2-6.

13
Hunger
Hunger is defined differently than FI, even though some of the questions in FI surveys include
being hungry (e.g., question 6 in Table 2.1). How the word hunger should be used in connection
with FI has been widely discussed (Nord et al 2009). Hunger is understood to refer to conditions
across a broad range of severity; so providing useful information about hunger is hampered by
lack of a consistent definition (Nord et al 2009). FI is defined as the limited or uncertain
availability of nutritionally adequate and safe foods or limited or uncertain ability to acquire
acceptable foods in socially acceptable ways (Anderson 1990), while hunger is defined as the
uneasy or painful sensation caused by a lack of food that may produce malnutrition over time
and is a potential, although not necessary, consequence of FI (Bickel et al 2000). In 2006, the
USDA began to use new descriptors for the ranges of severity of FI that did not include the word
hunger that was used in previous definitions (USDA 2012). This change was made in response
to the recommendations by the Committee on National Statistics that the USDA make a clear
distinction between FI and hunger (USDA 2012). The panel suggested that hunger “should refer
to a potential consequence of FI because of prolonged, involuntary lack of food, resulting in
discomfort, illness, weakness, or pain that goes beyond the usual uneasy sensation” and should
be measured as a physiological phenomenon at the individual level (Nord et al 2009, USDA
2012).
Binge eating
Binge eating differs from the eating behaviors that are being studied in this thesis research that
were originally conceptualized by Stunkard and Messick (1985), e.g., cognitive restraint and
uncontrolled eating. Binge eating disorder is the most common eating disorder in the US

14
(prevalence of 1.2% in adults, Weight-control Information Network (WIN) 2012). The average
age of onset is 25 years and individuals who are obese are at a higher risk than normal weight
individuals for developing the disorder (NIMH 2013, WIN 2012). Binge eating disorder is
defined as recurrent binge-eating episodes, not followed by purging, and excessive exercise or
fasting during which an individual feels a loss of control over the intake of food (NIMH 2013).
Problems that may result from binge eating include digestive problems, headaches, joint pains,
menstrual problems and muscle pain (WIN 2012). Individuals who binge eat do not do it in
response to hunger and therefore may experience a greater loss of control because of eating for
reasons other than in response to physiological cues (Haedt-Matt and Keel 2011). Those with
this disorder are often overweight or obese and experience guilt, shame and distress about their
actions that may lead to more binge eating (NIMH 2013). Hunger is greater before a binge
eating episode and cognitive or affective factors may take precedence over physiological cues
(Haedt-Matt and Keel 2011).
Appetite
Appetite is another concept that may be relevant to understanding the relationship of eating
behaviors (cognitive restraint, uncontrolled eating, and emotional eating) with FI.
It is distinct from hunger in that hunger is physiologically aroused by the body’s need for food,
while appetite is psychological and dependent on memory and associations (Miller-Keane and
O’Toole 2005). Appetite is defined as the desire for food that is stimulated by the sight, smell, or
thought of food and accompanied by the flow of saliva in the mouth, gastric juice in the stomach
and extra blood supply to the stomach in preparation for digestive activity (Miller-Keane and
O’Toole 2005). Although decreased appetite is medically defined as anorexia and accompanied

15
by weight loss, an increased appetite is an excess desire for food and can be intermittent or
persistent and does not always result in weight gain (MedlinePlus 2014). Appetite decreases
with age and as a result many older adults may experience nutrient deficiencies along with
involuntary weight loss that may result in a lower quality of life resulting from functional decline
(Engel et al 2011). In older adults, lower appetite is associated with lower commitment (level of
involvement that individuals have in their life activities) and appetite is also more strongly
associated with emotional well being than with depression (Engel et al 2011). In addition,
community dwelling older adults who had unfavorable health, medical, psychological, sensory,
and social conditions were more likely to have impaired appetite and also more likely to
complain about the hedonic quality of food than those who did not report impaired appetite (Lee
et al 2006).
Eating behaviors
Eating behavior is a very strong predictor of weight gain in adults (Hayes and Roberts 2008) and
although the assumption is that if individuals are given the correct information concerning
weight loss, then in the long term they will be able to maintain that loss, there are researchers
who believe that eating behavior is an automatic, uncontrollable, and unconscious behavior
(Moldovan and David 2012). Adult weight gain and obesity in individuals at 55-65 years of age
is strongly correlated to overeating in response to daily life (Hays and Roberts 2008) and there
are certain personality traits that may help to better understand the reasons for eating behaviors
in those who are obese (Elfhag and Morey 2008). Although there are many theories relating to
eating behaviors, the three most commonly studied psychological types are cognitive restraint
(CR), disinhibition or uncontrolled eating (UE), and emotional eating (EE).

16
CR is the conscious restriction of food intake to prevent weight gain or promote weight loss;
however, it has not been consistently associated with BMI or weight change (Hays and Roberts
2008). CR has been further divided into subscales of “rigid” (all-or-nothing approach to dieting)
and “flexible” (“fattening” foods can be eaten in limited quantities without guilt) to help define
the eating styles, with flexible restraint being the subscale that has been consistently negatively
correlated with BMI (Hays and Roberts 2008). Attempts to control food intake are often
triggered by the desire to lose weight so higher restraint may be a marker for overeating
tendencies predisposing an individual to weight gain (Johnson et al 2012). In normal weight
individuals, the association between CR and body weight are positive, however; in obese
individuals CR is usually associated with lower weight (Johnson et al 2012). Although some
studies have shown that CR eating behavior may lead to disordered eating, there has been little
support for a causal relationship when controlling for confounding factors (Johnson et al 2012).
Disinhibition or UE is when an individual loses control over food intake and eats in response to
external food cues such as the sight, smell and taste of food and it has consistently been
associated with BMI or weight change (Elfhag and Morey 2008, Hays and Roberts 2008).
Disinhibition has also been divided into subscales: “habitual” disinhibition refers to the
susceptibility of an individual to overeat in response to daily life, “emotional” disinhibition is
when an individual tends to overeat in response to emotional states such as depression or anxiety,
and “situational” disinhibition refers to the susceptibility of an individual to overeat in response
to environmental cues (Hays and Roberts 2008). Of the three subcategories mentioned, habitual
disinhibition is the most important correlate of weight gain leading to obesity in older women
and flexible control of dietary restraint attenuates this influence on weight gain and BMI (Hays

17
and Roberts 2008). Regardless of weight status in older women, habitual disinhibition scores are
associated with psychological well being (Hays and Roberts 2008).
EE is eating in response to negative emotions such as depression or anxiety and is premised on
the use of self-reward in which EE would decrease negative affect and increase positive affect
(Kemp et al 2011). Individuals with this type of eating behavior typically have episodes of binge
eating, graze, or eat when they are not hungry to help them feel better (Kemp et al 2011).
Women are more likely to be emotional eaters than men and are influenced greatly by food
advertising (Kemp et al 2011). In addition, social norms play a large role in eating behaviors,
and emotional eaters may be influenced by others who socially facilitate the behavior (Kemp et
al 2011). Those who are overweight eat more than normal and underweight individuals when
experiencing negative emotions and individuals who are underweight tend to eat more when
experiencing positive emotions (Geliebter and Aversa 2003).
Three-Factor Eating Questionnaire R-18 (TFEQ-R18)
The original 51-item Three Factor Eating Questionnaire by Stunkard and Messick (1985) was
designed to measure UE, CR and hunger. This questionnaire was revised in 2000 to a shorter
version containing 18-items and assessed CR, UE and EE in obese men and women (Karlsson et
al 2000). The TFEQ-R18 reduces respondent burden, increases relevancy, and was validated in
congregate meal participants to assess CR, UE and EE behavior (Furman 2012). In the present
study, the TFEQ-R18, as modified by Porter and Johnson (2011) (Appendix B), will be used to
measure CR, UE and EE behaviors on a 4-point Likert scale. “I” was changed to “you” since an
interviewer read the questions to the participants. In addition, item one was reworded from the

18
original question, ‘‘When I smell a sizzling steak or juicy piece of meat, I find it very difficult to
keep from eating, even if I have just finished a meal,’’ and was replaced with, ‘‘When you see
any of your favorite foods, do you find it very difficult to keep from eating, even if you have just
finished a meal?’’ This adjustment was made to improve comprehension of the question by older
adult respondents and to more accurately measure the difficulty of controlling eating when
presented with external cues. Summary scores were created from the three eating behaviors by
summing the responses that corresponded to CR (6 questions), UE (9 questions) and EE (3
questions).
Rationale for study
The congregate meal program targets older adults who are low-income and FI, but previous
studies have reported a high prevalence of obesity in these elders in Georgia (Brewer et al 2010).
In Georgia, 19.8% of congregate meal participants were FI in 2007 (Catlett 2009), which is over
two times the average of 8.8% in US households composed of older adults aged 65 years and
older (Coleman-Jensen et al 2013). This research is important because eating behavior is a
strong predictor of adult weight gain (Hays and Roberts 2008) and, paradoxically, FI has been
associated with obesity, but little is known about the relationships of eating behaviors and FI.
Those who are FI may have eating patterns that are disrupted for a time period due to lack of
finances and other resources for food (Coleman-Jensen et al 2012) and specific eating behaviors,
such as cognitive restraint and emotional eating behavior, have been significantly associated with
obesity in congregate meal participants in Georgia (Porter and Johnson 2011). Thus, this
research is significant for human health and will fill in the gaps in knowledge about the

19
relationship between FI and eating behavior and is innovative in that there has not been research
done on this association in older adult congregate meal participants.
Specific aims and hypotheses
The specific aim of this thesis research is to determine the relationship of FI with CR, UE, and
EE behaviors among congregate meal participants in northeast Georgia who are age 60 and
older. It is hypothesized that FI will be associated with these eating behaviors, because those
who are FI may have disrupted eating patterns for a period of time due to lack of finances and
other resources for food (Coleman-Jensen et al 2012). It is also hypothesized that of the three
eating behaviors, emotional eating will have the strongest association with FI due to emotional
stresses that people with FI may experience.

20
CHAPTER 3
FOOD INSECURITY AND EATING BEHAVIOR RELATIONSHIPS AMONG
CONGREGATE MEAL PARTICIPANTS IN GEORGIA
Myles TM, Starr KP, Johnson KB, Lee JS, Fischer JG, Johnson MA. To be submitted to Journal of Nutrition in Gerontology and Geriatrics

21
Abstract
This study explored relationships of food insecurity with cognitive restraint, uncontrolled eating,
and emotional eating behaviors among congregate meal participants in northeast Georgia [n =
118, age 60 and older, mean (SD) age = 75 (8) years, 75% female, 43% Black, 53% obese (BMI
> 30)]. Food insecurity was assessed with a 6-item questionnaire (adapted from USDA 2012,
Wolfe et al 2003); scores ranged from 0 to 6 and were defined as high or marginal food security,
FS, 0-1 (70%); low food security, LFS, 2-4 (20%); very low food security, VLFS, 5-6 (10%);
and low and very low food security, LVLFS, 2-6 (30%). Eating behavior was assessed with an
18-item Three-Factor Eating Questionnaire R-18 (Karlsson et al 2000, Porter and Johnson 2011).
Food insecurity was consistently associated with cognitive restraint (p ≤ 0.05), but not with
uncontrolled or emotional eating. Summary scores of food insecurity and cognitive restraint were
significantly correlated (rho = 0.20, p ≤ .05) and the prevalence of cognitive restraint scores
above the median split was 47% in FS and 71% in LVLFS (p ≤ 0.05). In multivariate linear and
logistic regression analyses, food insecurity was consistently associated with cognitive restraint
(p ≤ .05) even when controlled for potential confounders (demographics, BMI and chronic
diseases). Although cognitive restraint is defined as the conscious restriction of food intake to
control body weight or promote weight loss, these findings suggest there may be other
dimensions of cognitive restraint to consider in nutritional assessment and interventions among
food insecure older adults.
Introduction
The high prevalence of food insecurity (FI), 14.5% in households in the US and 8.8% of
households with older adults (Coleman-Jensen et al 2013), is of great concern because of the

22
important implications for healthcare costs, its association with chronic conditions such as
obesity and hypertension, poor glycemic control for those with diabetes, and functional
impairments (Brewer et al 2010, Lee 2013, Lee and Frongillo 2001, Seligman et al 2010,
Seligman et al 2012). FI has been steadily increasing in the US since 1995 when it was at 12%,
and in the state of Georgia it is above the national average at 16.9% (USDA 2013). The
prevalence of FI among a convenience sample of congregate meal participants in Georgia in
2007-2008 was nearly 20% (Brewer et al 2010, Catlett 2009).
Individuals that experience FI may change their eating behavior, experience cyclic food
restriction that alternates between having an adequate food supply and food scarcity, and
consume foods during periods when access to food is readily available. Three types of eating
behavior that may be relevant to obesity and to FI are cognitive restraint (CR, the conscious
restriction of food intake to prevent weight gain or promote weight loss), uncontrolled eating
(UE, when an individual loses control over food intake and eats in response to external food cues
such as the sight, smell and taste of food), and emotional eating (EE, eating in response to
negative emotions such as depression or anxiety) have been measured in obese individuals using
a revised 18-item Three-Factor Eating Questionnaire (TFEQ-R18) developed by Karlsson et al
(2000) that was revised from the original version (Stunkard and Messick 1985). Previous
research in congregate meal participants used a modified and validated TFEQ-R18 questionnaire
(Appendix B) and demonstrated associations of certain eating behaviors with obesity (Furman
2012, Porter and Johnson 2011).

23
Since research has shown previously that congregate meal participants in Georgia have a high
prevalence of FI (Catlett 2009, Brewer et al 2010), a high prevalence of obesity (Brewer et al
2010), and that obesity is associated with FI (Brewer et al 2010) and with eating behaviors
(Porter and Johnson 2011), a next logical step is to assess the relationship of FI and eating
behaviors in this population, which to my knowledge has not been examined. The specific aim of
this thesis research is to determine the relationship of FI with CR, UE, and EE behaviors among
congregate meal participants in northeast Georgia who are age 60 and older. It is hypothesized
that FI will be associated with these eating behaviors, because those who are FI may have
disrupted eating patterns for a period of time due to lack of finances and other resources for food
(Coleman-Jensen et al 2012). It is also hypothesized that of the three eating behaviors,
emotional eating will have the strongest association with FI due to emotional stresses that people
with FI may experience.
Methods
Study design
The Athens Community Council on Aging, the University of Georgia Institutional Review Board
on Human Subjects, and the Georgia Department of Human Services Institutional Review Board
on Human Subjects approved all methods and procedures. This study was cross-sectional and
included questionnaires administered by trained interviewers for assessment of self-reported
demographics, general health, eating behavior, and FI. The procedures were explained and the
consent form was read to and also signed by each participant. Individuals were congregate meal
participants age 60 and older (men, women, Whites, Blacks, N = 123), and were recruited from
four senior centers affiliated with the Northeast Georgia’s Area Agency on Aging. This study

24
focuses on the 118 participants who had responses for all variables of interest with no missing
data (excluded 5 individuals with missing data). The non-participants in this study (n = 106)
were individuals who refused or were uninterested in the study, unavailable during the study
period or unable to answer questions and/or understand the informed consent as determined by
the interviewer. Compared to non-participants, participants were younger (77 and 75,
respectively, p = 0.01) and more likely to be Black (30% and 43%, p = 0.04), but there was no
statistical difference in gender (67% and 76% female, p = 0.24).
Food insecurity assessment
FI was assessed using a questionnaire that included questions that were adapted from the original
18-item US Household Food Security questionnaire (Appendix A) (USDA 2012) as well as the
augmented items from Wolfe et al (2003). The questionnaire was modified as follows. Questions
were read to participants so on all questions “I” was changed to “you”. Question 2 was modified
from the original 6-item questionnaire from “(I/we) couldn’t afford to eat balanced meals” to
“You couldn’t choose the right food and meals for your health because you couldn’t afford
them.” This adjustment was made to improve comprehension of the question by older adult
respondents. The adapted questionnaire does not include questions about children and reduces
respondent burden. Scores ranged from 0 to 6 and were designated as high or marginal food
security (score 0-1 = food secure or FS), low food security (scores 2-4 = low food security or
LFS) and very low food security (scores 5-6 = very low food security or VLFS) (USDA 2012,
Wolfe et al 2003). One point was given for a positive response (“often” or “sometimes”) to the
questions, “The food that you bought just didn’t last, and you didn’t have money to buy more”
and “You couldn’t choose the right food and meals for your health because you couldn’t afford
25
them” and also by a positive response (“yes” or “one or more days”) to the questions, “Did you
ever cut the size of your meals or skip meals because there wasn’t enough money for food?” “If
yes, in the last 30 days, how many days did this happen?” “Did you ever eat less than you felt
you should because there wasn’t enough money to buy food?” and “Were you ever hungry but
didn’t eat because you couldn’t afford enough food?”
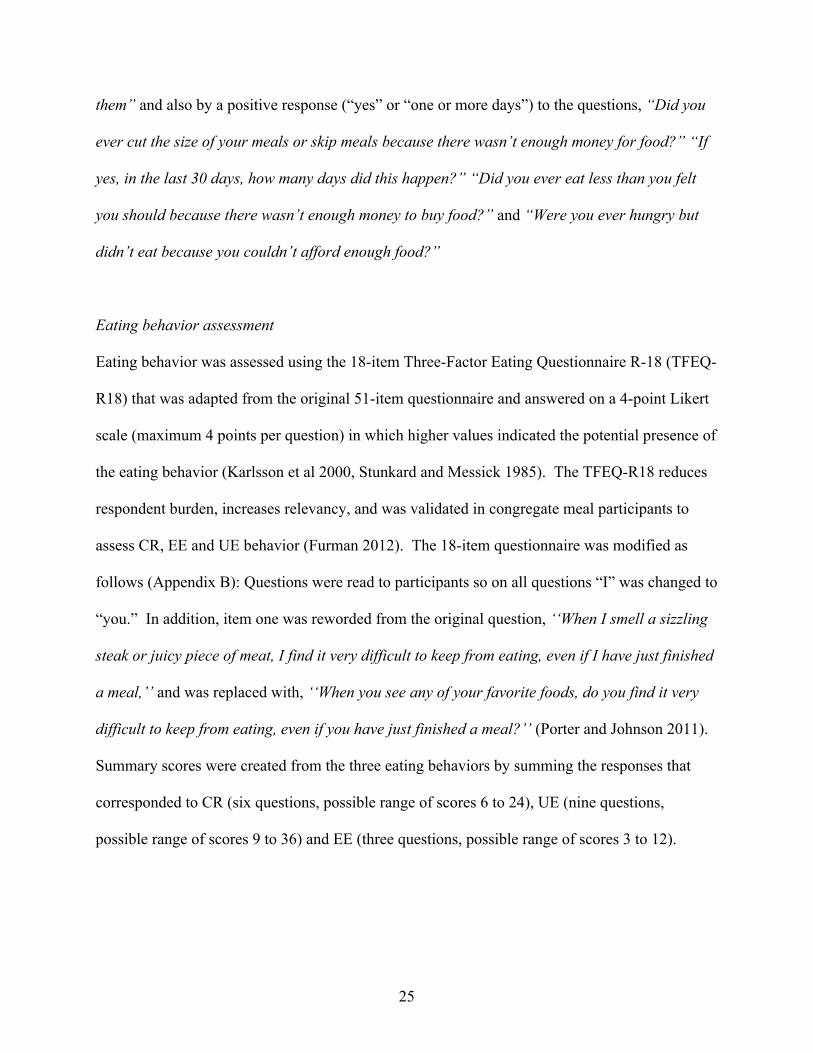
Eating behavior assessment
Eating behavior was assessed using the 18-item Three-Factor Eating Questionnaire R-18 (TFEQ-
R18) that was adapted from the original 51-item questionnaire and answered on a 4-point Likert
scale (maximum 4 points per question) in which higher values indicated the potential presence of
the eating behavior (Karlsson et al 2000, Stunkard and Messick 1985). The TFEQ-R18 reduces
respondent burden, increases relevancy, and was validated in congregate meal participants to
assess CR, EE and UE behavior (Furman 2012). The 18-item questionnaire was modified as
follows (Appendix B): Questions were read to participants so on all questions “I” was changed to
“you.” In addition, item one was reworded from the original question, ‘‘When I smell a sizzling
steak or juicy piece of meat, I find it very difficult to keep from eating, even if I have just finished
a meal,’’ and was replaced with, ‘‘When you see any of your favorite foods, do you find it very
difficult to keep from eating, even if you have just finished a meal?’’ (Porter and Johnson 2011).
Summary scores were created from the three eating behaviors by summing the responses that
corresponded to CR (six questions, possible range of scores 6 to 24), UE (nine questions,
possible range of scores 9 to 36) and EE (three questions, possible range of scores 3 to 12).

26
Statistical analysis
Descriptive statistics including means, standard deviations and frequencies, percentages, chi-
square, Student’s T-tests, and Spearman correlations were calculated, and linear and logistic
regression analyses were conducted (SAS, Version 9.3, Cary, NC). Chi-square analyses,
student’s T-tests, and Spearman correlations were used to assess the relationships among FI and
eating behaviors, demographics and health. For the Student’s T-tests, the Folded F p value for
equality of variances indicated that variances were unequal, so the Satterthwaite p values are
reported. A series of regression models were evaluated in which the independent variable was
one of the measures of FI [(summary score, 0-6; FS (0-1) vs. LVLFS (2-6); or FS (0-1) vs. LFS
(2-4) vs. VLFS (5-6)] and the dependent variable was one of the eating behaviors (as continuous
variables or with cut-points at the median split; the highest tertile vs. lowest two tertiles; or the
highest quartile vs. the lowest three quartiles for the CR, UE and EE behaviors). Model 1 was
these series of models that included only the primary independent variable (FI) and the
dependent variable (CR, UE or EE). Model 2 was the series of models that included the Model 1
variables and controlled for the potential confounders that were age (continuous), sex, race,
education (continuous), BMI (continuous), and health conditions (diabetes, high blood pressure,
heart disease, arthritis). A level of p ≤ 0.05 was accepted as statistically significant.
Results The participants’ mean age was 75 (8), 75% were female, 57% White, 43% Black, and 46% had
12 or more years of education. The prevalence of self-reported health problems was: diabetes
37%, high blood pressure 75%, heart disease 31% and arthritis 63% (n = 118, Table 3.1). About
half of the participants were obese (53%), 30% had low or very low food security, and by

27
definition about half of the participants were above the median split for CR (54%), UE (52%),
and EE (46%).
Correlations coefficients were calculated for the four measures of FI with the three measures of
eating behaviors (each coded as continuous, median split, lowest two tertiles vs. top tertile of the
sample, and lowest three quartiles vs. top quartile of the sample, Table 3.2). CR was consistently
associated with FI (12 of 16 correlations tested, p < 0.01-0.05), UE was generally not associated
with FI (only 3 of 16 correlations tested, p < 0.05), and EE was not associated with any measure
of FI.
T-tests and chi-square analyses were conducted to examine associations of FI with CR and UE
eating behaviors, demographics and health related variables (Table 3.3). EE is not reported,
because it was generally not associated with FI. There were no associations of age, BMI or any
of the chronic diseases (diabetes, heart disease, high blood pressure, and arthritis) with any
measure of FI, while race/ethnicity and education were consistently associated with all measures
of FI (4 of 4 measures, p ≤ 0.05), such that blacks had higher FI than whites and those with lower
education had higher FI. Only 1 of 4 measures of FI was associated with gender (women had
higher FI, FS vs. LVLFS, p ≤ 0.05) and less education (lower education had higher FI, FS and
LFS vs. VLFS, p ≤ 0.05). Higher CR was consistently associated with higher FI (3 of 4
measures of CR as the tertiles and quartiles, and 4 of 4 measures of CR as the median, p ≤ 0.05),
while UE (as the median) was associated with 2 of 4 measures of FI (p ≤ 0.05).
Correlation coefficients of the four measures of FI and the 12 measures of eating behaviors with
demographics and health related variables were calculated (Table 3.4, 3.5). Age was generally

28
not associated with FI or eating behaviors, except that age was negatively and significantly
associated with one measure of EE (quartile, p < 0.05). Being female was associated positively
and significantly with being food insecure specifically with two of the FI measures (FS vs.
LVLFS; FS vs. LFS vs. VLFS, both p < 0.05), but not with any measure of eating behavior.
Being Black (vs. White) was positively and significantly associated with all measures of FI (p ≤
0.001-0.01), but not with any measure of eating behavior. Education was negatively and
significantly associated with all four measures of FI (p < 0.01-0.05), but was positively and
significantly associated with several measures of eating behaviors (mainly CR and EE, but not
UE). The four chronic diseases and BMI were not associated with any measure of FI or with
BMI. Diabetes was positively and significantly associated most consistently with UE (all 4
measures, p < 0.001-0.05), but with only one measure of CR (p < 0.05) and not with any measure
of EE. Heart disease and arthritis were not associated with any measure of eating behaviors. BMI
was consistently and positively associated with every measure of the eating behaviors (p <
0.001-0.05).
Chi-square analyses were conducted to examine associations of the three eating behaviors
(median split) with demographics and health related variables (Table 3.6). Age, gender,
race/ethnicity, heart disease and arthritis were not associated with any of the eating behaviors.
Education was most consistently associated with EE, less consistently associated with CR and
not with UE; higher education was associated with higher EE (p < 0.05). Having diabetes was
associated with higher UE (p < 0.05), but not with CR or EE. Having high blood pressure was
associated with higher CR and higher EE (p < 0.05), but not with UE. All measures of FI were

29
positively associated with higher CR (3 of 3 measures, p < 0.05) and with higher UE (1 of 3
measures, FS and LFS vs. VLFS, p < 0.05), but not with EE.
Continuous and logistic multivariate regression analyses were conducted to determine the
independent associations of FI (independent variable) with eating behaviors (dependent variable)
when not controlled (Model 1) or when controlled (Model 2) for potential confounders including
demographics, BMI and health conditions (Table 3.7). FI was not significantly associated with
any measure of EE in these models (data not shown; p-values are in Appendix D). FI was not
consistently associated with UE, because only 6 of the 24 models showed a statistically
significant association of FI with UE (in 3 models when UE was continuous, and in 3 models
when UE was the median split). FI was consistently associated with CR (27 of 32 models
showed a statistically significant association of FI with CR, p < 0.001-0.05). In the eight models
for the continuous measure of CR, controlling for potential confounders attenuated the
relationship of CR and FI in only one model (FS vs. LVLFS, Model 2). In the eight models for
the median split measure of CR, the OR and the c-statistic (a measure of model fit) were
generally improved when the models were controlled for potential confounders. FI was related to
CR when controlling for potential confounders. In the eight models for the tertile measures of
CR and the eight models for the quartile measures of CR, only one measure of FI was not
statistically related to CR (FS vs. LVLFS), but the other FI measures were associated
significantly with higher CR (continuous) or higher OR for CR (logistic), and the model fit was
generally improved when controlled for potential confounders.

30
Discussion
The purpose of this study was to determine the relationship of FI with CR, UE, and EE behaviors
among congregate meal participants. The major findings are that FI was associated with eating
behaviors, the strongest association was seen with CR, and this association was not attenuated
when controlled for potential confounders. Although UE was significantly associated with FI in
some analyses, this relationship was attenuated when controlled for potential confounders.
Finally, higher CR was consistently associated with higher FI, while EE was not significantly
associated with any measure of FI. These associations occurred in this sample of older adults
with a high prevalence of obesity (53%) and FI (30%).
CR is the conscious restriction of food intake to prevent weight gain or promote weight loss and
has been shown to be associated with obesity and may be more likely due to rigid control (all or
nothing approach to eating, dieting, and weight) as opposed to flexible control (graduated
approach to eating, dieting, and weight in which foods that are fattening are eaten without guilt
and in limited quantities) (Karlsson et al 2000, Westenhoefer et al 1998). Rigid control of eating
behavior is associated with more disturbed eating patterns and is not beneficial in weight
reduction or maintenance while flexible control is associated with more successful weight
reduction and maintenance and less disturbed eating behavior (Westenhoefer et al 1999). Porter
and Johnson (2011) observed previously that CR was associated with obesity in this sample, but
to my knowledge this is the first time the relationship between FI and CR has been examined.
Although CR is the restriction of food in an effort to control body weight, it is speculated that the
association of CR with FI among these congregate meal participants may be due more to limiting
food intake or limited food availability related to FI rather than to concerns about body weight as

31
CR was consistently associated with the higher levels of FI. Some CR questions, although
related to weight, also hint at limited food availability (Do you deliberately take small helpings
as a means of controlling your weight? Do you consciously hold back at meals in order not to
gain weight? Do you not eat some foods because they make you fat?), while others indicate
limiting food more directly (How frequently do you avoid “stocking up” on tempting foods?
How likely are you to consciously eat less than you want? Do you feel you are restrained in your
eating?). Perhaps the association of FI with CR in these congregate meal participants support the
suggestion that there are factors other than finances that contribute to FI and these factors also
should be considered when assessing and addressing FI and CR in this population.
UE is when an individual loses control over food intake and eats in response to external food
cues such as the sight, smell and taste of food. UE can be conceptualized into three domains:
“habitual” (refers to the susceptibility of an individual to overeat in response to daily life,
“emotional” (when an individual tends to overeat in response to emotional states such as
depression or anxiety), and “situational” (the susceptibility of an individual to overeat in
response to environmental cues) (Elfhag and Morey 2008, Hays and Roberts 2008). UE was
significantly associated with FI in some, but not all analyses. Explanations for the association of
FI with UE may be that some UE questions involve hunger (Do you get so hungry that your
stomach often seems like a bottomless pit? Are you always hungry so it’s hard for you to stop
eating before you finish the food on your plate? Are you always hungry enough to eat at any
time? How often do you feel hungry?). The association of UE with FI was attenuated when
controlling for other factors (e.g., BMI and chronic diseases). Perhaps disease-related reductions
in quality of life leads to UE behaviors in the habitual, emotional and/or situational domains,

32
which may attenuate the associations of FI with UE. Note that the large CI for the ORs indicate
that these models are less precise and the true association may not be estimated at the point
estimates given.
It is difficult to compare the scores of CR, UE, and EE of this study with other studies, because
there are several different questionnaires in use, many studies focus on only obese populations,
and most samples are not exclusively older adults and low-income. Angle et al (2009) used the
same questionnaire employed in the present study, however it focused only on Finnish females
17-20 years. The TFEQ has other versions in addition to the one used in the present study
including the original version with 51 items and the TFEQ R-21 with 21 items (Stunkard and
Messick 1985, Cappelleri et al 2009).
Although it was initially hypothesized that EE would have the strongest association with FI due
to emotional stresses that individuals with FI may encounter, this study found that EE was not
associated with FI. The reason for this may be that there were only three questions in the EE
subscale, only one of them included anxiety, and none of the questions explored limited food
availability or hunger (When you feel anxious, do you find yourself eating? When you feel blue,
do you often overeat? When you feel lonely, do you console yourself by eating?)
Limitations and strengths
Participants self-reported their eating behavior and FI; however, previous studies have shown
that these methods provide useful information in the target population about FI (Catlett 2009,
Lee et al 2011) and eating behavior (Porter and Johnson 2011). The eating behavior

33
questionnaire was a short form with only 18 questions, so some dimensions that may be relevant
to FI could not be explored (e.g., flexible and rigid restraint in CR; habitual, emotional and
situational in UE). The short form of the HFSSM estimates food insecurity that is mainly due to
limited financial resources in older adults (USDA 2012) and may not measure certain aspects of
FI such as uncertainty and other experiential aspects (Wolfe et al 2003). This cross sectional
study does not allow for causal inferences to be made. This study was conducted among
congregate meal participants and may not reflect all older adult populations; however, this is also
a strength of the study in that the results may be applicable to the older adults currently being
served in northeast Georgia.
Conclusion
This study was able to fill in the gaps in knowledge of the relationship between FI and eating
behavior; it was found that there is an association between FI and eating behaviors particularly
CR, and to my knowledge this is the first time this relationship has been explored in older adult
congregate meal participants. The Older Americans Act Nutrition Program goals include
promoting health and reducing hunger and FI among older adults (AOA 2012). Although
cognitive restraint is defined as the conscious restriction of food intake to control body weight or
promote weight loss, these findings suggest there may be other dimensions of cognitive restraint
to consider in nutritional assessment and interventions among food insecure older adults.
FI should be assessed using validated measures. When the assessment method used to assess FI
in this study is compared to the validated Household Food Security Survey Module, it differs
mainly in that questions were read to participants so on all questions “I” was changed to “you”.

34
Question 2 was modified from the original 6-item questionnaire from “(I/we) couldn’t afford to
eat balanced meals” to “You couldn’t choose the right food and meals for your health because
you couldn’t afford them.” This adjustment was made to improve comprehension of the question
by older adult respondents. The assessment method for FI used in this study only estimates FI
that is mainly due to limited financial resources; however, it may aid researchers and policy
makers in understanding how to develop effective interventions and policies for food insecure
congregate meal participants and develop future studies that include assessment methods to
capture the other aspects of FI.

35
Table 3.1. Characteristics of participants1 n Mean (SD) or % Age (years) 75 (8) Gender Male 29 25 Female 89 75 Race/ethnicity White 67 57 Black 51 43 Education (years) < 8 22 19 > 8 96 81 < 12 64 54 > 12 54 46 Chronic disease Diabetes 44 37 High blood pressure 88 75 Heart disease 36 31 Arthritis 74 63 Body mass index (kg/m2) 31 (7) Obesity (BMI > 30, n = 118) 62 53 Eating behaviors (median)2 Cognitive Restraint or CR (6 items, max = 24, median > 10) 64 54 Uncontrolled Eating or UE (9 items, max = 36, median > 13) 61 52 Emotional eating or EE (3 items, max = 12, median > 4) 54 46 Food insecurity (6 items, max = 6)3 Food insecurity scores 0-1 (“food secure” or FS) 83 70 Food insecurity scores 2-4 (“low food security” or LFS) 23 20 Food insecurity scores 2-6 (“low and very low food security” or LVLFS) 35 30 Food insecurity scores 5-6 (“very low food security” or VLFS) 12 10 1N = 118, unless otherwise noted. 2Eating behaviors: at the median split about one-half of the sample is below the median and one-half of the sample is above the median. 3Food insecurity (FI), 6 items, max = 6, higher scores indicate higher food insecurity, 0-1 = food secure or FS, 2-4 = low food security or LFS, 2-6 = low and very low food security or LVLFS, 5-6 = very low food security or VLFS.

36
Table 3.2. Correlations1 of food insecurity2 with eating behaviors3
Eating behaviors
Spearman correlations with eating behaviors continuous
Food insecurity Cognitive restraint Uncontrolled
eating Emotional eating Summary score 0-6 0.20 0.16 -0.00 FS vs. LVLFS 0.20 0.18 0.03 FS and LFS vs. VLFS 0.28 0.19 -0.02 FS vs. LFS vs. VLFS 0.23 0.20 0.02
Spearman correlations with eating behaviors at median split of sample distribution
Food insecurity Cognitive restraint Uncontrolled
eating Emotional eating Summary score 0-6 0.16 0.14 -0.03 FS vs. LVLFS 0.22 0.15 -0.00 FS and LFS vs. VLFS 0.20 0.21 -0.03 FS vs. LFS vs. VLFS 0.24 0.17 -0.01 Spearman correlations with eating behaviors at lowest two tertiles vs. top tertile of sample distribution
Food insecurity Cognitive restraint Uncontrolled
eating Emotional eating Summary score 0-6 0.16 0.14 -0.07 FS vs. LVLFS 0.15 0.14 -0.05 FS and LFS vs. VLFS 0.28 0.16 -0.07 FS vs. LFS vs. VLFS 0.19 0.15 -0.05 Spearman correlations with eating behaviors at lowest three quartiles vs. top quartile of sample distribution
Food insecurity Cognitive restraint Uncontrolled
eating Emotional eating Summary score 0-6 0.21 0.08 -0.00 FS vs. LVLFS 0.16 0.08 0.03 FS and LFS vs. VLFS 0.34 0.05 -0.06 FS vs. LFS vs. VLFS 0.21 0.08 0.02 1N = 118; Spearman rho values given in table; if rho ≥ 0.30 then p ≤ 0.001, if rho ≥ 0.24 the p ≤ 0.01, if rho ≥ 0.18 the p ≤ 0.05, statistically significant rho are in bold. 2Food insecurity (FI), 6 items, max = 6, higher scores indicate higher food insecurity, 0-1 = food secure or FS, 2-4 = low food security or LFS, 2-6 = low and very low food security or LVLFS, 5-6 = very low food security or VLFS. 3Eating behaviors: at the median split about one-half of the sample is below the median and one-half of the sample is above the median; for the tertiles, eating behaviors at the lowest two tertiles are compared to the top tertile of the sample; for the quartiles, eating behaviors at the lowest three quartiles are compared to the top quartile of the sample.

37
Table 3.3. Food insecurity1, demographics, health and eating behaviors2 : bivariate relationships3
Mean (SD) of
FI Summary Score 0-6
FS vs. LVLFS %
FS and LFS vs. VLFS %
FS vs. LFS vs. VLFS %
Age (years)
< 70 1.36 (1.90) 61 39 89 11 61 28 11
> 70 1.08 (1.83) 74 26 90 10 74 16 10
Gender
Male 0.72 (1.49) 86 14 97 3 86 10 3
Female 1.31 (1.93) 65 35 88 12 65 22 12
Race/ethnicity
White 0.57 (1.25) 84 16 97 3 84 13 3
Black 1.96 (2.19) 53 47 80 20 53 27 20
Education
< 8 y 1.95 (2.40) 59 41 77 23 59 18 23
≥ 8 y 0.99 (1.66) 73 27 93 7 73 20 7
< 12 y 1.59 (2.10) 59 41 84 16 59 25 16
≥ 12 y 0.7 (1.3) 83 16 96 4 83 13 4
Diabetes
No 1.08 (1.74) 70 30 92 8 70 22 8
Yes 1.32 (2.02) 70 30 86 14 70 16 14
Heart disease
No 1.13 (1.78) 71 29 90 10 71 20 10
Yes 1.25 (2.01) 69 31 89 11 69 19 11 High blood pressure
No 1.00 (1.84) 83 17 90 10 83 7 10
Yes 1.23 (1.86) 66 34 90 10 66 24 10
Arthritis
No 1.20 (1.96) 73 27 86 14 73 14 14
Yes 1.15 (1.79) 69 31 91 8 69 23 8
BMI
Non-obese 1.07 (1.84) 73 27 89 11 73 16 11

38
Table 3.3. Food insecurity1, demographics, health and eating behaviors2 : bivariate relationships3
Mean (SD) of
FI Summary Score 0-6
FS vs. LVLFS %
FS and LFS vs. VLFS %
FS vs. LFS vs. VLFS %
Obese 1.26 (1.86) 68 32 90 10 68 23 10
CR
< Median 0.72 (1.34) 53 29 49 17 53 35 17
≥ Median 1.55 (2.12) 47 71 51 83 47 65 83
CR
< Top tertiles 0.83 (1.40) 70 54 70 25 70 70 25
≥ Top tertile 1.80 (2.37) 30 46 30 75 30 30 75
CR
< Top quartiles 0.87 (1.48) 81 66 81 33 81 83 33
≥ Top quartile 2.14 (2.51) 19 34 19 67 19 17 67
UE
< Median 0.79 (1.36) 53 37 52 17 53 48 17
≥ Median 1.52 (2.16) 47 63 48 83 47 52 83
UE
< Top tertiles 0.95 (1.62) 69 54 67 42 69 61 42
≥ Top tertile 1.57 (2.15) 31 46 33 58 31 39 58
UE
< Top quartiles 1.07 (1.74) 76 69 75 67 76 70 67
≥ Top quartile 1.45 (2.11) 24 31 25 33 24 30 33 1Food insecurity (FI), 6 items, max =6, higher scores indicate higher food insecurity, 0-1 = food secure or FS, 2-4 = low food security or LFS, 2-6 = low and very low food security or LVLFS, 5-6 = very low food security or VLFS.
2 Eating behaviors: at the median split about one-half of the sample is below the median and one-half of the sample is above the median, respondents were grouped into “low” or “high” demonstration of the eating behavior according to the median split: CR ≥ 10, UE ≥ 13, EE ≥ 4; for the tertiles, eating behaviors at the lowest two tertiles are compared to the top tertile of the sample; for the quartiles, eating behaviors at the lowest three quartiles are compared to the top quartile of the sample. 3Significance level at p ≤ 0.05. Statistically significant values are in bold.

39
Table 3.4. Correlations1 of food insecurity2 with demographics and chronic disease Food insecurity
0-6
FS vs. LVLFS
FS and LFS vs. VLFS
FS vs. LFS vs. VLFS
Age (years) (0 = <70; 1 = >70) -0.10 -0.12 0.05 -0.10
Gender (0 = male; 1 = female) 0.13 0.20 0.13 0.20
Race/ethnicity (1 = White; 2 = Black) 0.39 0.33 0.27 0.35
Education (years) -0.28 -0.27 -0.21 -0.28
Chronic disease (0 = no; 1 = yes)
Diabetes 0.05 -0.00 0.09 0.02
High blood pressure 0.04 0.17 0.00 0.15
Heart disease -0.01 0.01 0.02 0.02
Arthritis -0.01 0.04 -0.09 0.02
Body mass index (kg/m2) 0.13 0.08 0.05 0.08 1N = 118; Spearman rho values given in table; if rho ≥ 0.30 then p ≤ 0.001, if rho ≥ 0.24 then p ≤ 0.01, if rho ≥ 0.18 then p ≤ 0.05, statistically significant rho are in bold. 2Food insecurity (FI), 6 items, max = 6, higher scores indicate higher food insecurity, 0-1 = food secure or FS, 2-4 = low food security or LFS, 2-6 = low and very low food security or LVLFS, 5-6 = very low food security or VLFS.

40
Table 3.5. Correlations1 of eating behaviors2 with demographics and chronic disease Eating behaviors
Continuous Median split
Lowest two tertiles vs. highest tertile
Lowest three quartiles vs. highest quartile
CR UE EE CR UE EE CR UE EE CR UE EE Age (years) (0 = <70; 1 = >70) -0.12 -0.11 -0.12 -0.06 -0.11 -0.09 -0.11 -0.01 -0.08 -0.11 -0.07 -0.21
Gender (0 = male; 1 = female) 0.08 0.10 0.12 0.03 0.08 0.05 -0.04 0.05 0.09 -0.01 0.07 0.09
Race/ethnicity (1 = White; 2 = Black) 0.12 0.14 -0.03 0.05 0.12 -0.01 0.12 0.17 -0.10 0.08 0.06 -0.16
Education (years) 0.21 0.00 0.19 0.23 0.08 0.20 0.20 0.01 0.22 0.11 0.07 0.19
Chronic disease (0 = no; 1 = yes)
Diabetes 0.20 0.29 0.09 0.11 0.29 0.03 0.17 0.34 0.14 0.11 0.22 0.02
High blood pressure 0.20 0.08 0.22 0.21 0.02 0.18 0.18 0.03 0.22 0.10 -0.01 0.10
Heart disease 0.09 -0.08 0.04 0.05 -0.06 0.02 0.13 -0.11 -0.02 0.15 -0.10 -0.02
Arthritis 0.18 0.09 0.11 0.17 0.10 0.08 0.05 0.02 0.12 0.06 0.02 0.02
Body mass index (kg/m2) 0.47 0.28 0.35 0.42 0.27 0.24 0.36 0.23 0.34 0.33 0.22 0.32 1N = 118; Spearman rho values given in table; if rho ≥ 0.30 then p ≤ 0.001, if rho ≥ 0.24 then p ≤ 0.01, if rho ≥ 0.18 then p ≤ 0.05, statistically significant rho are in bold. 2Eating behaviors: at the median split about one-half of the sample is below the median and one-half of the sample is above the median; for the tertiles, eating behaviors at the lowest two tertiles are compared to the top tertile of the sample; for the quartiles, eating behaviors at the lowest three quartiles are compared to the top quartile of the sample.

41
Table 3.6. Bivariate characteristics: eating behaviors at the median split1 , 2 Eating behaviors CR UE EE n Low High Low High Low High 118 % % % % % % Age (years) < 70 36 47 53 44 56 58 42 > 70 82 45 55 50 50 52 48 Gender Male 29 48 52 55 45 59 41 Female 89 45 55 46 54 53 47 Race/ethnicity White 67 48 52 54 46 54 46 Black 51 43 57 41 59 55 45 Education < 8 y 22 59 41 59 41 77 23 ≥ 8 y 96 43 57 46 54 49 51 < 12 y 64 56 44 52 48 64 36 ≥ 12 y 54 33 67 44 56 43 57 Diabetes No 74 50 50 59 41 55 45 Yes 44 39 61 30 70 52 48 Heart disease No 82 48 52 46 54 55 45 Yes 36 42 58 53 47 53 47 High blood pressure No 30 63 37 50 50 70 30 Yes 88 40 60 48 52 49 51 Arthritis No 44 57 43 55 45 59 41 Yes 74 39 61 45 55 51 49 BMI Non-obese 56 64 36 61 39 64 36 Obese 62 29 71 37 64 45 55 Food insecurity3 FS vs. LVLFS FS 83 53 47 53 47 54 46 LVFS 35 29 71 37 63 54 46 FS and LFS vs. VLFS FS and LFS 106 49 51 52 48 54 46 VLFS 12 17 83 17 83 58 42 FS vs. LFS vs. VLFS FS 83 53 47 53 47 54 46 LFS 23 35 65 48 52 52 48 VLFS 12 17 83 17 83 58 42 1 Eating behaviors: at the median split about one-half of the sample is below the median and one-half of the sample is above the median, respondents were grouped into “low” or “high” demonstration of the eating behavior according to the median split: CR ≥ 10, UE ≥ 13, EE ≥ 4; for the tertiles, eating behaviors at the lowest two tertiles are compared to the top tertile of the sample; for the quartiles, eating behaviors at the lowest three quartiles are compared to the top quartile of the sample. 2Significance level at p ≤ 0.05. Statistically significant values are in bold. 3Food insecurity (FI), 6 items, max =6, higher scores indicate higher food insecurity, 0-1 = food secure or FS, 2-4 = low food security or LFS, 2-6 = low and very low food security or LVLFS, 5-6 = very low food security or VLFS.

42
Table 3.7. Associations of food insecurity1 and eating behaviors2: regression analyses models3 (p-values) 4,5,6 Eating behavior
Food Insecurity Continuous Median Split Highest tertile vs. lowest two tertiles Highest quartile vs. lowest three
quartiles CR UE CR UE CR UE CR UE
Estimate
Estimate
C statis
tic
OR (95% CI)
C statistic
OR (95% CI)
C statistic
OR (95% CI)
C statis
tic
OR (95% CI)
C statis
tic
OR (95% CI)
C statis
tic
OR (95% CI)
FI Summary Score
Model 1 0.665 0.544 0.58 1.31 (1.04, 1.65)4
0.57 1.26 (1.02, 1.57) 4
0.59 1.32 (1.07, 1.63)5
0.58 1.20 (0.98, 1.46)
0.63 1.39 (1.12, 1.73)5
0.55 1.11 (0.90, 1.38)
Model 2 0.645 0.40 0.82 1.56 (1.15, 2.10)5
0.75 1.25 (0.96, 1.62)
0.77 1.47 (1.11, 1.94)5
0.76 1.13 (0.88, 1.45)
0.78 1.53 (1.16, 2.04)5
0.71 1.07 (0.82, 1.38)
FS vs. LVLFS
Model 1 1.904 2.174 0.60 2.82 (1.21, 6.60) 4
0.57 1.91 (0.85, 4.29)
0.57 1.95 (0.87, 4.41)
0.55 1.85 (0.82, 4.15)
0.59 2.19 (0.90, 5.30)
0.54 1.44 (0.60, 3.46)
Model 2 1.62 1.76 0.82 4.23 (1.43,
12.65)5
0.74 1.86 (0.69, 4.97)
0.76 2.26 (0.83, 6.15)
0.76 1.84 (0.67, 5.11)
0.74 2.49 (0.85, 7.30)
0.70 1.36 (0.47, 3.89)
FS and LFS vs. VLFS
Model 1 4.266 2.95 0.56 4.81 (1.01,
23.02)4
0.56 5.39(1.13, 25.8) 4
0.59 6.93 (1.76, 27.3)5
0.55 2.84 (0.84, 9.59)
0.62 8.60 (2.36, 31.4)5
0.52 1.46 (0.41, 5.25)
Model 2 4.376 2.28 0.82 14.5 (2.05,
102.70)5
0.74 5.15 (0.92, 28.9)
0.80 14.1 (2.51,
79.14)5
0.77 1.92 (0.46, 7.94)
0.80 17.67 (3.31, 94.2)6
0.70 1.05 (0.24, 4.67)

43
FS vs. LFS vs. VLFS
Model 1 1.775 1.634 0.61 2.27 (1.20, 4.30) 4
.58 1.87 (1.04, 3.38) 4
0.59 2.03 (1.15, 3.57)4
0.57 1.66 (0.95, 2.89)
0.61 2.30 (1.27, 4.16)5
0.54 1.28 (0.71, 2.32)
Model 2 1.735 1.33 0.83 3.55 (1.57, 8.03) 5
.75 1.88 (0.92, 3.83)
0.77 2.60 (1.25, 5.41)4
0.77 1.53 (0.77, 3.04)
0.77 2.94 (1.37, 6.31)5
0.70 1.16 (0.57, 2.36)
N = 118 1Food insecurity (FI), 6 items, max =6, higher scores indicate higher food insecurity, 0-1 = food secure or FS, 2-4 = low food security or LFS, 2-6 = low and very low food security or LVLFS, 5-6 = very low food security or VLFS. In the various models the lower level of food insecurity = 0 and the higher level of food insecurity = 1.
2Eating behaviors: at the median split about one-half of the sample is below the median and one-half of the sample is above the median; for the tertiles, eating behaviors at the lowest two tertiles are compared to the top tertile of the sample; for the quartiles, eating behaviors at the lowest three quartiles are compared to the top quartile of the sample.
3Model 1 the dependent variable is eating behavior and independent variable is the specific measure of food insecurity. Model 2 the dependent variable is eating behavior and independent variable is the specific measure of food insecurity; model is controlled for age, gender, race, education (continuous), BMI (continuous), diabetes, hypertension, heart disease, and arthritis.
4Significance level at p ≤ 0.05
5Significance level at p ≤ 0.01
6Significance level at p ≤ 0.001

44
CHAPTER 4
SUMMARY
The purpose of this study was to determine the relationship of food insecurity (FI) with cognitive
restraint (CR), uncontrolled eating (UE), and emotional eating (EE) behaviors among congregate
meal participants in Georgia age 60 and older. The hypothesis was that FI would be associated
with these eating behaviors, because those who are food insecure may have disrupted eating
patterns for a period of time due to lack of finances and other resources for food (Coleman-
Jensen et al 2012). It was also hypothesized that among the three eating behaviors, EE would
have the strongest association with FI due to emotional stresses that people with FI may
experience. The major findings of this study are that FI is associated with eating behaviors, the
strongest association was seen with CR, and this association was not attenuated when controlled
for potential confounders. Although it was initially hypothesized that EE would have the
strongest association with FI, this study found the strongest association to be with CR.
Future assessment of older adults
Little is known about the relationships of eating behaviors and FI and the results of this study are
important because to my knowledge this is the first time the relationship between FI and CR has
been examined and it aids in filling in the gaps in this area. These findings suggest there may be
other dimensions of CR to consider in nutritional assessment and interventions among food
insecure older adults. The questionnaire used in the current study at congregate meal sites
includes questions on CR that are focused on weight. Perhaps in the future, assessment of FI in

45
congregate meal participants can incorporate questions focusing on FI and CR geared to
specifically capture the eating behavior along with FI. Although it is speculated that the
association of CR with FI may be due more to limiting food intake or limited food availability
related to FI rather than to concerns about body weight, it is possible that weight is still a concern
to older adults who are FI since FI has been associated with obesity (Brewer et al 2010, Johnson
et al 2011).
Implications to congregate meal sites
The goal of the Older Americans Act Nutrition Program (OAANP) is to reduce hunger and FI
and in doing this perhaps eating behaviors should be considered and their contribution to FI. In
Georgia, about 20% to 30% of congregate meal participants are FI (Catlett 2009, Brewer et al
2010, Lee et al 2011). Although this FI is supposedly related to financial problems, perhaps it
entails other aspects of FI that have not been recognized such as eating behavior. In addition,
CR and FI have both been associated with obesity in congregate meal participants in Georgia
(Brewer et al 2010, Johnson et al 2011, Porter and Johnson 2011). Perhaps eating behavior
needs to be looked at more extensively along with FI to see how it might be contributing to
obesity in congregate meal participants. Congregate meal sites encourage socialization which
may improve eating behavior. Although meals are provided to participants while they are at the
congregate meal site, their eating behavior while at home is not known and may differ in that
environment. The screening assessment used when older adults join a senior center could be
augmented by asking questions about eating behavior along with FI. The association of CR with
FI as mentioned before is most likely due to limiting food intake or limited food availability
rather than concerns about body weight. Congregate meal programs try to meet this need

46
through the provision of meals. Perhaps just providing meals is not enough in this population to
reduce FI and the eating behavior needs to be considered. The association of CR with FI even in
the presence of potential confounders shows that this eating behavior, along with other
contributors to FI other than finances such as environment, health conditions and physical
limitations, needs to be examined more closely to assess the full scope of ways to reduce FI in
this population.
Additional research in the current sample
CR questions, although related to weight, also hint at limited food availability (Do you
deliberately take small helpings as a means of controlling your weight? Do you consciously hold
back at meals in order not to gain weight? Do you not eat some foods because they make you
fat?), so it is possible that participants did not understand the question completely and in future
research in this target population their understanding of the questions needs to be assessed, and
perhaps the questions need to be modified. Since it was also found that CR was the eating
behavior that was consistently related to FI, perhaps additional questions related to CR that
capture rigid and flexible restraint should be included. Also future research in this target
population can include qualitative questions to determine the different types of environments of
participants and how this may contribute to FI and eating behaviors. Also perhaps there could be
a follow up study focusing on hunger and how hunger, FI and CR are related in this sample. To
do this perhaps the 36-item Three-Factor Eating Questionnaire could be used because this
version includes 14-items related to hunger (Karlsson et al 2000).

47
Another issue that could be addressed in this sample is whether interactions between FI and
obesity influence CR. For example, are the effects of FI and obesity additive or is there an
interaction such that those with both FI and obesity have higher than expected CR. The
influence of both FI and obesity on the individual questions that make up CR, as well as UE and
EE, could also be examined, to see if there are any questions that are particularly sensitive to
these measures.
Future studies
The USDA differentiates “hunger” from FI stating that hunger is physiological and may result
from FI, and in addition, the USDA does not currently have a measure of hunger (USDA 2013).
Perhaps future studies should identify hunger as well as FI, and their association with eating
behaviors since hunger and FI are related and the current measures of FI are only designed to
capture FI related to financial resources. In addition, perhaps future research can be done in
other regions in Georgia among congregate meal participants as well as home delivered meal
participants to determine if this association exists among OAANP participants in general as well
as with older adults outside of the OAANP in our community to see how they compare and make
it more generalizable. The Three-Factor Eating Questionnaire R-18 only included six hunger
items that were combined with three disinhibition items to form the uncontrolled eating behavior
items, so it is possible that it may not capture hunger appropriately (Karlsson et al 2000). The
suggested studies previously mentioned could perhaps include the longer version of the Three-
Factor Eating Questionnaire to capture hunger as well as the eating behavior. Finally, since the
current study focused on only White and Black participants, perhaps other studies could see if
this association exists in other ethnic groups.

48
REFERENCES
Administration On Aging. Nutrition Services. Internet: http://www.aoa.gov/AoARoot/AoA_Programs/HCLTC/Nutrition_Services/index.aspx. April 2013. (accessed 22 April 2013). Anderson SA. Core indicators of nutritional state for difficult to sample populations. J Nutr 1990;120:1557S-1600S. Angle S, Engblom J, Eriksson T, Kautiainen S, Saha M, Lindfors P, Lehtinen M, Rimpela A. Three factor eating questionnaire-R18 as a measure of cognitive restraint, uncontrolled eating and emotional eating in a sample of young Finnish females. Int J Behav Hlth PA 2009;6 (1):41-47. Bhargava V, Lee JS, Jain R, Johnson MA, Brown A. Food insecurity is negatively associated with home health and out-of-pocket expenditures in older adults. J Nutr 2012;142:1888-1895. Bickel G, Nord M, Price C, Hamilton W, Cook John. Measuring food security in the United States. Guide to measuring household food security. USDA:2000. Brewer DP, Catlett CS, Porter KN, Lee JS, Hausman DB. Physical limitations contribute to food insecurity and the food insecurity obesity paradox in older adults at senior centers in Georgia. J Nutr Elder 2010;29:150-169. Cappelleri, JC, Bushmakin AG, Gerber RA, Leidy NK, Sexton CC, Lowe MR, Karlsson J. Psychometric analysis of the Three-Factor Eating Questionnaire-R21: results from a large diverse sample of obese and non-obese participants. Int J Obes 2009;33:611-620. Catlett C. Dietary and health characteristics of food insecure older adult senior center participants in Georgia. Master’s thesis, University of Georgia, Athens, GA; 2009. Coleman-Jensen A, Nord M, Singh, A. USDA Economic Research Service. Household food security in the United States in 2012. Economic Research Report 2013;155:1-25. DeNavas-Walt C, Proctor BD, Smith JC. Income, poverty, and health insurance coverage in the United States: 2012. Current population reports. 2013;1-77. Elfhag K, Morey LC. Personality traits and eating behavior in the obese: Poor self-control in emotional and external eating but personality assets in restrained eating. Eat Behav 2008;9:285-293.

49
Engel JH, Siewerdt F, Jackson R, Akobundu U, Wait C, Sahyoun N. Hardiness, depression, and emotional well-being and their association with appetite in older adults. J Am Geriatr Soc 2011;59:482-487. Furman J. Three-Factor Eating Questionnaire-R18 is able to determine different eating behaviors and food patterns in congregate meal participants. Master’s thesis, University of Georgia, Athens, GA; 2012. Gliebter A, Aversa A. Emotional eating in overweight, normal weight, and underweight individuals. Eat Behav 2003;341-347. Greenberg, S. Administration On Aging. U.S. Department of Health and Human Services. A profile of older Americans: 2011. AOA; 1-16. Haedt-Matt AA, Keel PK. Hunger and binge eating: a meat-analysis of studies using ecological momentary assessment. Int J Eat Disord 2011;44:573-578. Hays NP, Roberts SB. Aspects of eating behaviors “disinhibition” and “restraint” are related to weight gain and BMI in women. Obesity 2008;16(1):52-58. Institute of Medicine (US) Food and Nutrition Board. Nutrition and Healthy Aging in the Community: Workshop Summary. Washington (DC): National Academies Press (US); 2012. Available from: http://www.ncbi.nlm.nih.gov/books/NBK91530/. (accessed 5 February 2013). Johnson F, Pratt M, Wardle J. Dietary restraint and self-regulation in eating behavior. Int J Obes 2012;36:665-674. Johnson MA, Dwyer JT, Jensen GL, Miller JW, Speakman JR, Starke-Reed P, Volpi E. Challenges and new opportunities for clinical nutrition interventions in the aged. J Nutr 2011;141:403-415. Karlsson J, Persson LO, Sjöström L, Sullivan M. Psychometric properties and factor structure of the Three-Factor Eating Questionnaire (TFEQ) in obese men and women. Results from the Swedish Obese Subjects (SOS) study. Int J Obes Relat Metab Disord. 2000;24(12):1715-25. Kemp E, Mui M, Grier S. Eating their feelings: examining emotional eating in at-risk groups in the United States. J Consum Policy 2011;34:211-229. doi:10.1007/s10603-010-9149-y. Kleinman R, Foster L. Multiple chronic conditions among OAA Title III program participants. AOA Research Brief 2011;4. Lee JS, Kritchevsky, Tylavsky FB, Harris TB, Ayonayon HN, Newman AB. Factors associated with impaired appetite in well-functioning community-dwelling older adults. J Nutr Elder 2006;26(1/2):27-43.

50
Lee JS. Food insecurity and healthcare costs: Research strategies using local, state, and national data sources for older adults. Adv Nut 2013;4:42-50. Lee JS, Fischer JG, Johnson MA. Food insecurity, food and nutrition programs, and aging: experiences from Georgia. J Nutr Elder 2010;29:116-149. Lee JS, Frongillo EA. Factors associated with food insecurity among U.S. elderly persons: Importance of functional impairments. J Gerontol 2001;56 (2):S94-S99. Lee JS, Sinnett S, Bengle R, Johnson MA, Brown A. Unmet needs for the Older Americans Act Nutrition Program. J Appl Gerontol 2011;(30)5:587-606. MedlinePlus. Appetite-decreased. 26 February 2014. Internet: http://www.nlm.nih.gov/medlineplus/ency/article/003121.htm (accessed 13 March 2014). MedlinePlus. Appetite-increased. 26 February 2014. Internet: http://www.nlm.nih.gov/medlineplus/ency/article/003134.htm (accessed 13 March 2014). Miller-Keane, O’Toole MT. Encyclopedia & dictionary of medicine, nursing & allied health—revised reprint, 7th Ed. Saunders; 2005. Moldovan AR, David D. Features of automaticity in eating behavior. Eat Behav 2012;13:46-48. Nord M, Finberg M, McLaughlin J. What should the government mean by hunger? J Hun Env Nut 2009;4:20-27. National Council on Aging. Center for healthy aging. A matter of balance. Internet: http://www.ncoa.org/improve-health/center-for-healthy-aging/a-matter-of-balance.html. (accessed 30 April 2013). National Council on Aging. Better choices, better health. Internet: http://www.ncoa.org/improve-health/chronic-conditions/better-choices-better-health.html. (accessed 30 April 2013). National Council on Aging. Center for healthy aging. Chronic disease self-management program. Internet: http://www.ncoa.org/improve-health/center-for-healthy-aging/chronic-disease.html. (accessed 30 April 2013). National Institute of Mental Health. What are the different types of eating disorders. Internet: http://www.nimh.nih.gov/statistics/1EAT_ADULT_RB.shtml. (accessed 30 April 2013). Older Americans 2012 key indicators of well-being. Federal interagency forum on aging related statistics. 2012. Internet: http://www.agingstats.gov/Main_Site/Data/2012_Documents/docs/EntireChartbook.pdf (accessed 30 April 2013).

51
Penn DM, Fischer JG, Lee JS, Hausman DB, Johnson MA. High BMI and wiast circumference are associated with a high prevalence of comorbidities in older Americans act programs in Georgia senior centers. J Nutr Health Aging 2019;13:827-832. Porter KN, Johnson MA. Obesity is more strongly associated with inappropriate eating behaviors than with mental health in older adults receiving congregate meals. J Nutr Gerontol Geriatr 2011;30(4):403-415. Posner BM, Jette AM, Smith KW, Miller DR. Nutrition and health risks in the elderly: The Nutrition Screening Initiative. Am J Public Health 1993;83(7):972-978. Seligman HK, Jacobs, EA, Lopez A, Tschann J, Fernandez A. Food insecurity and glycemic control among low-income patients with Type 2 Diabetes. N Engl J Med 2010;363(1):6-9. Seligman HK, Laraia BA, Kushel MB. Food insecurity is associated with chronic disease among low-income NHANES participants. J Nutr 2010;140:304-310. Seligman HK, Schillinger MD. Hunger and socioeconomic disparities in chronic disease. Diabetes care 2012;35:233-238. Stunkard AJ, Messick S. The three-factor eating questionnaire to measure dietary restraint, disinhibition and hunger. J Psychosom Res. 1985;29(1):71-83. US Census Bureau (A). Population estimates. Current estimates data. Internet: http://factfinder2.census.gov/faces/tableservices/jsf/pages/productview.xhtml?src=bkmk. December 2013. (accessed 12 March 2014). US Census Bureau (B). Population projections. 2012 national population projections: summary tables. December 2012. Internet: http://www.census.gov/population/projections/data/national/2012/summarytables.html. (accessed 22 April 2013). US Census Bureau (C). State and county quick facts. Internet: http://quickfacts.census.gov/qfd/states/00000.html. 07 January 2014. (accessed 28 Feb 2014). USDA Economic Research Service. Food security in the U.S. Definitions of food security 04 September 2012. Internet: http://www.ers.usda.gov/topics/food-nutrition-assistance/food-security-in-the-us/definitions-of-food-security.aspx#.UypvHChicQ4. (accessed 17 January 2013). USDA Economic Research Service. Food security rates are high for elderly households. September 2002. Internet: http://webarchives.cdlib.org/sw1bc3ts3z/http://ers.usda.gov/publications/FoodReview/Sep2002/frvol25i2d.pdf. (accessed 7 February 2013).

52
USDA Economic Research Service. Food security in the U.S: survey tools. August 15 2012. Internet: http://www.ers.usda.gov/topics/food-nutrition-assistance/food-security-in-the-us/survey-tools.aspx#household. (accessed 27 February 2013). USDA Economic Research Service. Food security in the U.S. Key statistics and graphics. 04 September 2013. Internet: http://www.ers.usda.gov/topics/food-nutrition-assistance/food-security-in-the-us/key-statistics-graphics.aspx#.UxWhiChicuJ. (accessed 28 February 2014). USDA Economic Research Service. Food security in the U.S. Measurement. 19 August 2013. Internet: http://www.ers.usda.gov/topics/food-nutrition-assistance/food-security-in-the-us/measurement.aspx#.UyXF-yhicQ4. (accessed 16 March 2014). Weight-control Information Network (WIN). Binge eating disorder. December 2012. Internet: http://www.win.niddk.nih.gov/publications/binge.htm#foot2 (accessed 1 May 2013). Westenhoefer J, Stunkard AJ, Pudel V. Validation of the flexible and rigid control dimensions of dietary restraint. Int J Eat Disord 1999;26:53-64. Wolfe WS, Frongillo EA, Valois P. Food insecurity by elders suggests ways to improve its measurement. J Nutr 2003;133(9):2762-2769. Ziliak JP, Gundersen C. Meals on Wheels Research Foundation. The state of senior hunger in America 2011: An annual report. Senior hunger in America 2010: an annual report. Supplemennt

53
APPENDICIES
APPENDIX A – Live Healthy Georgia consent form and questionnaire
LIVE HEALTHY GEORGIA! CONSENT FORM I, ______________________________, agree to participate in the research study titled "Live Healthy Georgia!" conducted by Dr. Mary Ann Johnson in the Department of Foods and Nutrition at the University of Georgia and at my local Senior Center. I understand that participation is voluntary and I do not have to take part if I do not want to. I can refuse to participate and stop taking part anytime without giving any reason and without penalty. I can ask to have all information concerning me removed from the research records, returned to me, or destroyed. My decision to participate will not affect the services that I am entitled to receive at the Senior Center. By participating in this study, I may improve my nutrition and physical activity habits and self-management of diabetes and other chronic conditions. This study will also help the investigators learn more about good ways to help older adults improve their nutrition and physical activity habits and self-management of diabetes and other chronic conditions. This study will be conducted at my local Senior Center. If I volunteer to take part in this study, I will be asked to do the following things: 1) Answer questions about my health, nutrition and physical activity. 2) Obtain medical clearance to participate in a physical activity program. 3) Provide information about my health, nutrition, and physical activity and complete a physical measurement of weight and waist circumference in a pre- test and post-test. The pre-test will last up to 90 minutes that may be divided into two sessions. The post-test will last up to 60 minutes that also may be divided into two sessions. 4) Attend up to 12 health, nutrition and physical activity programs that will last about 30 to 60 minutes each over a twelve-month period. 5) Take part in a physical activity program of chair exercises and walking to improve my strength, balance, endurance, and flexibility.

54
6) Someone from the study may contact me to clarify my information throughout the study. The instructor may provide food to taste. Mild to no risk is expected by tasting food. However, I will not taste foods that I should not eat because of swallowing difficulties, allergic reactions, dietary restrictions, or other food-related problems. There is minimal risk to participation in this study. I may experience some discomfort or stress when the researchers ask me questions about my nutrition, health, and physical activity habits. There is a possibility that I could temporarily injure a muscle or be sore from physical exertion. This risk is minimized by ability to rest at any time. The leaders will advise me to stop exercising if I experience any discomfort or chest pains. If additional care is needed, then my insurance company or myself will be responsible for any expense that may be incurred. As a participant, I assume certain risks of physical injury. The researchers will exercise all reasonable care to protect me from harm as a result of my participation. However, I do not give up or waive any of my rights to file a claim with the University of Georgia’s insurer (Department of Administrative Services or pursue legal action by signing this form. In case of a research-related injury, please contact Dr. Mary Ann Johnson at 706- 542-2292. No information concerning myself or provided by myself during this study will be shared with others without my written permission, unless law requires it. I may choose not to answer any question or questions that may make me uncomfortable. I will be assigned an identifying number and this number will be used on all of the questionnaires I fill out. Data will be stored in locked file cabinets under the supervision of Dr. Mary Ann Johnson at the University of Georgia; only the staff involved in the study will have access to these data and only for the purpose of data analyses and interpretation of results. My identity will not be revealed in any reports or published materials that might result from this study. All research records will be retained for three years after completion of the study. If I have any further questions about the study, now or during the course of the study I can call Dr. Mary Ann Johnson (706-542-2292). I will sign two copies of this form. I understand that I am agreeing by my signature on this form to take part in this study. I will receive a signed copy of this consent form for my records.

55
Signature of Participant Participant's Printed Name Date _____________________________________________________ Participant Address and Phone _______________ _____Mary Ann Johnson___ May 17, 2010 Signature of Investigator Printed Name of Investigator Date Email: [email protected] ________________ ________________________ _____________ Signature of Staff who Reads Printed Name of Staff Date Consent Form to Participant For questions or problems about your rights as a research participant please call or write: The Chairperson, Institutional Review Board, University of Georgia, 612 Boyd Graduate Studies Research Center, Athens, Georgia 30602-7411; Telephone (706) 542-3199; E-Mail Address [email protected]. (DHR IRB # 070702, UGA IRB # 2006-10842)

56
! 103
Read Questions to Participants and Record Thei r Answers
Name of T rained Interviewer : Line 1
ID of Participant: 1-4 Phone number to use to clarify information and get step counts: 1. County/Senior Center 10-12 2.
todaydate 13-18 3. Age of Participant: ___ ___ ___
age 19-21 4. Gender: Male (0) Female (1)
sex 22 5. Ethnicity: White (1) Black (2) Hispanic/Latino (3) Asian (4) Other (5)
race 23 6. How many years did you complete in school: ____ years
edu 24-25 7. How would you rate your overall health? Circle one:
Poor (0) Fair (1) Good (2) Very good (3) Excellent (4) SRH 26
8. Do you use any tobacco products such as cigarettes, cigars, pipe, or chewing tobacco?
No (0) Yes (1)
Race 27
9. Do you have diabetes? No (0) Yes (1)
Diab 28
10. Do you have high blood pressure? No (0) Yes (1)
HBP 29
11. Do you have heart disease such as angina, congestive heart failure, heart attack or other heart problems?
No (0) Yes (1)
Heartdx 30
12. Do you have arthritis? No (0) Yes (1) arthritis31
13. During the past 30 days, have you had symptoms of pain, aching, or stiffness in or around a joint?
No (0) Yes (1)
Jointpain 32
14. How many prescription medications, including insulin, do you take? Medp 34-35
15. How many over the counter medications do you take? (such as a daily multivitamin, supplements, Aspirin®, etc.)
medotc336-37
16. How often do you get the social and emotional support that you need?
1) Always 4) Rarely 2) Usually 5) Never 3) Sometimes
know/not sure
9 Refused Socemo 38
17. Has a doctor or other health care provider EVER told you that you have a depressive disorder? No (0) Yes (1)
know/ not sure 9 Refused depress 39
DI E T A ND PH YSI C A L A C T I V I T Y Line 1
18. How many times a day do you eat something sweet, such as candy, cookies, cakes, pie, donuts, ice cream?
0 1 2 3 4 5 6 7 sweet 40
19. How many times a day do you eat salty snacks, such as chips, French fries, pretzels?
0 1 2 3 4 5 6 7 salty 41
20. How many servings of fruits and vegetables should older people eat
00 01 02 03 04 05 06 07 08 09 10 Missing
(05)
DK (77) Missing (99)
Fvknow 42-43

57
! 104
21. How many servings of fruits and 100% fruit juices do you usually have each day?
0 1 2 3 4 5 6 7
Fruit 44
22. How many servings of vegetables do you usually eat each day? 0 1 2 3 4 5 6 7
Veget 45
23. On how many DAYS of the last WEEK (seven days) did you eat five or more servings of fruits and vegetables?
0 1 2 3 4 5 6 7
Fvdays 46
24. How many DAYS of the last WEEK (seven days) have you followed a healthful eating plan?
0 1 2 3 4 5 6 7
Eathdays 47
25. How many DAYS of the last WEEK (seven days) did you participate in at least 30 minutes of moderate physical activity? Examples of moderate activities are regular walking, housework, yard work, lawn mowing, painting, repairing, light carpentry, ballroom dancing, light sports, golf, or bicycling on level ground.
0 1 2 3 4 5 6 7
Pa1 48
26. How many days of the week do you participate in any physical activity (light or moderate)?
0 1 2 3 4 5 6 7
Pa2 49
27. About how many minutes of physical activity do you do on the days you are physically active?
___ ___ ___ min e.g., 50 min is 050
Pa3 50-52
28. How many DAYS of the last WEEK (seven days) did you participate in a specific exercise session other than what you do around the house or as a part of your daily activities (e.g., chair exercises, yoga, aerobics, organized walking programs, using workout machines, etc.)?
0 1 2 3 4 5 6 7
Pa4 53
F A L LS A ND F R A C T UR ES 29. Have you had a fracture or broken bone after age 50? No (0) Yes (1) Ff1 54 30. Have you fallen in the past year? No (0) Yes (1) Ff2 55 31. Do you feel limited in your daily life by a fear of falling? No (0) Yes (1) Ff3 56 32. Have you ever been told by a doctor or other health professional that
you have osteoporosis? No (0) Yes (1)
Osteo 57 F O O DS A ND SUPPL E M E N TS
33. Do you get a stomachache, gas, or diarrhea after drinking milk? No (0) Yes (1) Milkint 58 34. How many servings of milk products should most older people eat
daily? 0 1 2 3 4 DK Milkknow
59 35. How many whole grain servings should people eat each day? 0 1 2 3 4 DK Wwknow
60
How often do you eat or drink or take these items? (*includes 3 or more per day) Line 2
36. Whole wheat or whole grain bread (such as 100% whole wheat bread)? <1/wk 1/wk 2/wk 3/wk 4/wk 5/wk 6/wk 1/day 1-2/day 2/day 2-3/day 3/day* DK Wwb 1-2 37. Whole grain cereals (such as oatmeal, Cheerios®, bran flakes or bran cereal)? <1/wk 1/wk 2/wk 3/wk 4/wk 5/wk 6/wk 1/day 1-2/day 2/day 2-3/day 3/day* DK Wwc 3-4 38. Milk as a beverage (including soy milk)? <1/wk 1/wk 2/wk 3/wk 4/wk 5/wk 6/wk 1/day 1-2/day 2/day 2-3/day 3/day* DK Milkb 5-6 39. Milk on cereal (including soy milk)? <1/wk 1/wk 2/wk 3/wk 4/wk 5/wk 6/wk 1/day 1-2/day 2/day 2-3/day 3/day* DK Milkc 7-8 40. Calcium-fortified orange juice? <1/wk 1/wk 2/wk 3/wk 4/wk 5/wk 6/wk 1/day 1-2/day 2/day 2-3/day 3/day* DK Ojca 9-10

58
! 105
41. Calcium supplement?
<1/wk 1/wk 2/wk 3/wk 4/wk 5/wk 6/wk 1/day 1-2/day 2/day 2-3/day 3/day* DK
Suca 11-12
42. Calcium supplement with vitamin D?
<1/wk 1/wk 2/wk 3/wk 4/wk 5/wk 6/wk 1/day 1-2/day 2/day 2-3/day 3/day* DK
Sucavd 13-14
43. Multivitamin with vitamin D?
<1/wk 1/wk 2/wk 3/wk 4/wk 5/wk 6/wk 1/day 1-2/day 2/day 2-3/day 3/day* DK
Sumvmvd 15-16
44. Vitamin D-only supplement?
<1/wk 1/wk 2/wk 3/wk 4/wk 5/wk 6/wk 1/day 1-2/day 2/day 2-3/day 3/day* DK Suvd 17-18
For the data coder : <1/wk 1/wk 2/wk 3/wk 4/wk 5/wk 6/wk 1/day 1-2/day 2/day 2-3/day 3/day* DK Miss 00 01 02 03 04 05 06 07 10 14 17 21 77 99
F O O D SE C URI T Y
45. Do you always have enough money to buy the food you need? No (0) Yes (1) know/ not sure
9 Refused foodmon 19 46. In the past month, have you received food from a food
pantry or food bank? No (0) Yes (1) 9 Refused foodbank 20
47. Do you currently receive food stamps? No (0) Yes (1) not sure 9 Refused foodstamp 21
about their food situation. For these statements, please tell me whether the statement was often
true, sometimes true, or never true for you since last (name of current month). 48.
1) Often 2) Sometimes 3) Never
9 Refused fi1 22
49. choose the right food and meals for your
1) Often 2) Sometimes 3) Never
9 Refused fi2 23
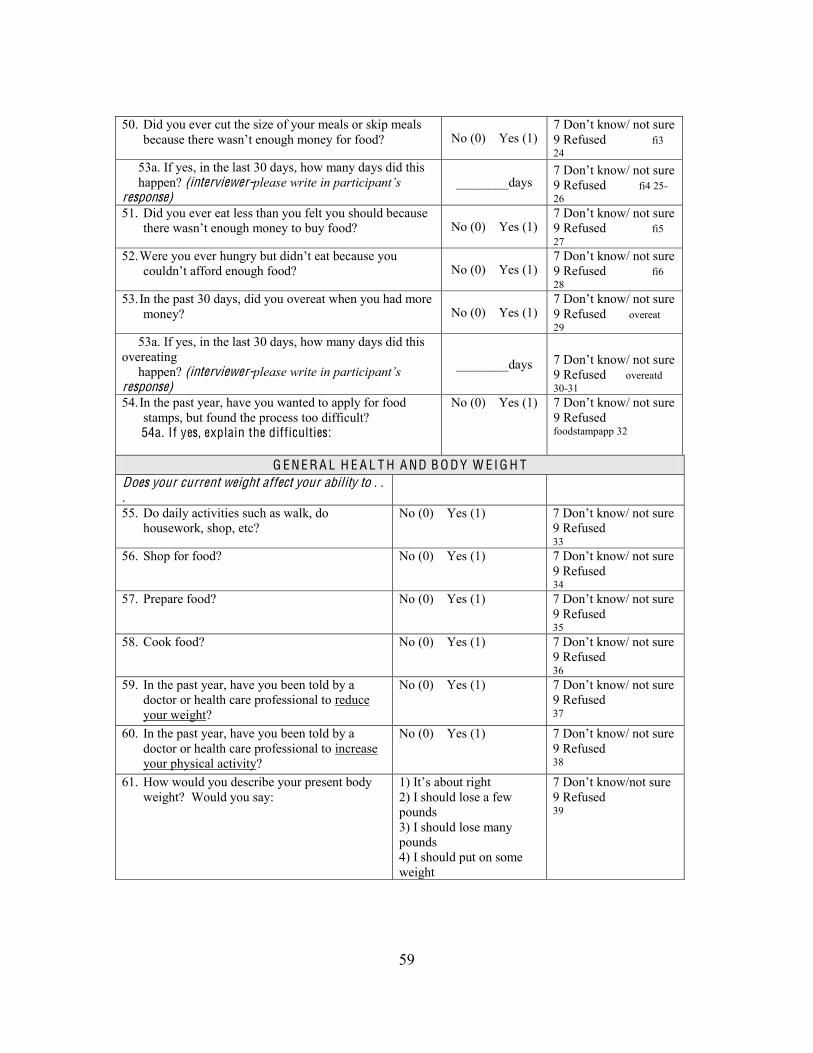
59
! 106
50. Did you ever cut the size of your meals or skip meals because there No (0) Yes (1)
9 Refused fi3 24
53a. If yes, in the last 30 days, how many days did this happen? (interviewer-response)
________days
9 Refused fi4 25-26
51. Did you ever eat less than you felt you should because No (0) Yes (1)
9 Refused fi5 27
52. No (0) Yes (1)
9 Refused fi6 28
53. In the past 30 days, did you overeat when you had more money? No (0) Yes (1)
9 Refused overeat 29
53a. If yes, in the last 30 days, how many days did this overeating happen? (interviewer-response)
________days sure 9 Refused overeatd 30-31
54. In the past year, have you wanted to apply for food stamps, but found the process too difficult?
54a. If yes, explain the difficulties:
No (0) Yes (1) 9 Refused foodstampapp 32
G E N E R A L H E A L T H A ND B O DY W E I G H T Does your current weight affect your ability to . . .
55. Do daily activities such as walk, do housework, shop, etc?
No (0) Yes (1) 9 Refused 33
56. Shop for food? No (0) Yes (1) 9 Refused 34
57. Prepare food? No (0) Yes (1) 9 Refused 35
58. Cook food? No (0) Yes (1) 9 Refused 36
59. In the past year, have you been told by a doctor or health care professional to reduce your weight?
No (0) Yes (1) 9 Refused 37
60. In the past year, have you been told by a doctor or health care professional to increase your physical activity?
No (0) Yes (1) 9 Refused 38
61. How would you describe your present body weight? Would you say:
1 2) I should lose a few pounds 3) I should lose many pounds 4) I should put on some weight
9 Refused 39

60
! 107
62. Your appetite is:
1) Very poor 2) Poor 3) Average 4) Good 5) Very good
9 Refused 40
63. Does the health of your mouth and teeth affect your food choices?
0) No If yes, 1) Eat softer foods 2) Avoid certain foods 3) Eat soft and avoid
(1&2)
9 Refused 41
F O R T H OSE W I T H DI A B E T ES O N L Y Line 2
1. What kind of effect does diabetes have on your daily activities? No effect (1) Little effect (2) Large effect (3)
1 2 3 Diab1 42
2. Thinking about your diet, on how many DAYS of the last WEEK (seven days) did you space carbohydrates evenly?
0 1 2 3 4 5 6 7 Diab2 43
3. On how many DAYS of the last WEEK (seven days) did you test your blood sugar?
0 1 2 3 4 5 6 7 Diab3 44
4. What medications do you take for your diabetes? 0-None 1-pills only 2-insulin only 3-pills and insulin
Diab4 45
5. On how many DAYS of the last WEEK (seven days), did you take your diabetes medication as prescribed by your doctor?
0 1 2 3 4 5 6 7 Diab5 46
6. On how many DAYS of the last WEEK (seven days) did you check your feet?
0 1 2 3 4 5 6 7 Diab6 47
7. On how many DAYS of the last WEEK (seven days) did you inspect the inside of your shoes?
0 1 2 3 4 5 6 7 Diab7 48
8. What should your hemoglobin A1c level be? ___% (interviewer-
99 Refused Diab8 49
9. What things are the hardest for you to do when managing your diabetes? (interviewer-
Diab9 50-51 For the diabetes questions, code 8 or 88 = not applicable; 9 or 99 = DK or missing
Medication Management Ask of A ll Participants Please answer the following questions regarding your use of prescription medications. Think back over the past 30 days.
No (0)
Yes (1)
Line 3
MM20. Have you ever taken less of a medication than prescribed by your doctor because of the cost? 1
MM21. Have you ever split pills because of the cost? 2 MM22. Have you ever delayed refills of prescriptions because of the cost? 3 MM23. Have you ever stopped taking medicines because of the cost? 4 MM24. Have you ever avoided new prescriptions because of the cost? 5

61
! 108
Subjective Measures of the Food Environment
The following are questions about food resources you use in your neighborhood/community. Please answer each question for your current situation. 1. Are there enough supermarkets/grocery stores/convenience stores in your neighborhood/community?
No (0) Yes (1) 15
2. Do supermarkets/grocery stores/convenience stores in your neighborhood/community always offer things you like and need?
No (0) Yes (1) 16
3. Do supermarkets/grocery stores/convenience stores in your neighborhood/community always offer affordable, healthy food choices?
No (0) Yes (1) 17
4. Do you shop for groceries for yourself? No (0) Yes (1) 18
MM25. Did you ever take less effective prescription medications than those initially prescribed by your doctor because of the cost? 6
MM26. Did you ever switch to an over-the-counter alternative to a prescription medication because of the cost? 7
Please answer the following questions about how you obtained your prescription medications. Think back over the past 30 days
No
(0) Yes (1)
MM26. Did you ever seek free samples of a prescription medication because of the cost? 8
MM28. Did you ever import a prescribed medication (order from another country) because of the cost? 9
MM29. Were you ever not able to purchase a prescribed medication because of the cost? 10
MM30. Have you ever had to borrow money from a relative or friend outside your household to pay for medications? 11
MM31. Have you ever had to increase credit debt to pay for medications? 12
MM32. Have you ever spent less money on food, heat, or other basic needs so that you would have enough money to pay for your medications? 13
MM33. Have you ever had to choose between purchasing food or medications? 14
! 110
it
Original questionnaire from: http://j n.nutrition.org/cgi/content/full/134/9/2372

62
! 109
Eating Questionnaire: Explain to the
answers, such as
Always Usually Sometimes Never L ine 4
1. When you see any of your favorite foods, do you find it very difficult to keep from eating, even if you have just finished a meal?
4 3 2 1 Eq1 1
2. Do you deliberately take small helpings as a means of controlling your weight?
4 3 2 1 Eq2 2
3. When you feel anxious, do you find yourself eating?
4 3 2 1 Eq3 3
4. Sometimes when you start eating, do you feel
4 3 2 1 Eq4 4
5. Being with someone who is eating often makes you hungry enough to eat also?
4 3 2 1 Eq5 5
6. When you feel blue, do you often overeat? 4 3 2 1 Eq6 6
7. When you see a real delicacy, do you often get so hungry that you have to eat right away?
4 3 2 1 Eq7 7
8. Do you get so hungry that your stomach often seems like a bottomless pit?
4 3 2 1 Eq8 8
9. Are you always hungry so it is hard for you to stop eating before you finish the food on your plate?
4 3 2 1 Eq9 9
10. When you feel lonely, do you console yourself by eating?
4 3 2 1 Eq10 10
11. Do you consciously hold back at meals in order not to gain weight?
4 3 2 1 Eq11 11
12. Do you not eat some foods because they make you fat?
4 3 2 1 Eq12 12
13. Are you always hungry enough to eat at any time?
4 3 2 1 Eq13 13
14. How often do you feel hungry? Almost always
(4)
Often between
meals (3)
Some-times
between meals (2)
Only at meal times
(1)
Eq14 14
15. How frequently do you avoid "stocking up" on tempting foods?
Almost Always
(4)
Usually (3)
Seldom (2) Almost never (1)
Eq15 15
16. How likely are you to consciously eat less than you want?
Very likely (4)
Moderately likely
(3)
Slightly likely (2)
Unlikely (1)
Eq16 16
17. Do you go on eating binges though you are not hungry?
At least once a
week (4)
Sometimes (3)
Rarely (2) Never (1)
Eq17 17
18. Do you feel restrained in your eating? Always restrained (constantly limiting food intake and
restrained, or Never restrained (eating whatever you want whenever you want).
To be completed by the data coder 19. The cognitive restraint scale is the sum of items 2, 11, 12, 15, 16, 18 20. The uncontrolled eating scale is the sum of items 1, 4, 5, 7, 8, 9, 13, 14 21. The emotional eating scale is the sum of items 3, 6, and 10

63
! 112
After attending the health, nutrition, and physical activity education programs at your center these past few months, have you done any of the following? Read the list and circle the answers.
Line 5
1. Increased your physical activity? No (0) Yes (1) s1 1 2. Tried to follow a healthier diet? No (0) Yes (1) s2 2 3. Increased your intake of fruit? No (0) Yes (1) s3 3 4. Increased your intake of vegetables? No (0) Yes (1) s4 4 5. Learned about healthy foods that are inexpensive? No (0) Yes (1) s5 5 6. Started washing your hands more often to prevent illness? No (0) Yes (1) s6 6 7. Started taking a supplement with calcium and vitamin D? No (0) Yes (1) s7 7 8. Eaten more calcium-rich foods? No (0) Yes (1) s8 8 9. Learned the warning signs of a heart attack? No (0) Yes (1) s9 9 10. Learned the warnings signs of a stroke? No (0) Yes (1) s10
10 11. Taken better care of your feet? No (0) Yes (1) s11
11 12. Talked with your doctor about bone health and osteoporosis? No (0) Yes (1) s12
12 13. Talked with your doctor about arthritis? No (0) Yes (1) s13
13 14. Talked with your doctor about your body weight? No (0) Yes (1) s14
14 15. Had your medications reviewed? No (0) Yes (1) s15
15 16. Taken your medications as recommended by your doctor? No (0) Yes (1) s16
16 17. Made your home a safer place to prevent falls? No (0) Yes (1) s17
17 18. Made a recipe from one of the lessons? No (0) Yes (1) s18
18 19. Modified a recipe to make it healthier? No (0) Yes (1) s19
19 20. If you have diabetes, did these programs help you space carbohydrates over
the day? No (0) Yes (1)
No diabetes (8) s20 20
21. If you have diabetes, did these programs help you maintain your blood sugar levels?
No (0) Yes (1) No diabetes (8) s21 21
22. If you have diabetes, did these programs help you control portion sizes of foods?
No (0) Yes (1) No diabetes (8) s22 22
23. What was your overall level of satisfaction with these health and nutrition education programs? Circle one: Poor (0) Fair (1) Good (2) Very good (3) Excellent (4)
0 1 2 3 4 s23
23 24. What was your overall level of satisfaction with this physical activity
program? Circle one: Circle one: Poor (0) Fair (1) Good (2) Very good (3) Excellent (4)
0 1 2 3 4 s24
24 25. How many sessions of the health, nutrition, and physical activity
education programs did the participant attend? Staff should document with attendance records. Maximum is 12 sessions.
s25 25-26
Please ask the participant for any additional comments about the education programs, physical activity programs, menus, recipes, games, etc

64
! 113
W A IST C IR C U M F E R E N C E : Instructions for Measuring Waist
C ircumference
The measurement should be made under the clothes. To measure waist circumference, locate the upper hipbone and the top of the right iliac crest. Place a measuring tape in a horizontal plane around the abdomen at the level of the iliac crest. Before reading the tape measure, ensure that the tape is snug, but does not compress the skin, and is parallel to the floor. The measurement is made at the end of a normal expiration. A high waist circumference is associated with an increased risk for type 2 diabetes, dyslipidemia, hypertension, and CVD in patients with a BMI between 25 and 34.9 kg/m2.
High-Risk Waist C ircumference
Men: > 40 in (> 102 cm) Women: > 35 in (> 88 cm)
http://www.nhlbi.nih.gov/guidelines/obesity/prctgd_c.pdf
Waist ci rcumference = ___ ___.___ INCHES Line 6 WCin ___ ___. ___ 1-4
How was the waist ci rcumference measurement made?
(1) Under clothes, (2) Over light (summer) clothes, (3) Over heavy (winter) clothes
WCmeas ___ 5
Chair sit-and-reach: sit in stable chair, keep knees straight, bend over, reach with arms straight to toes, then measure with a ruler:
Number of inches person is short of reaching the toes: ___ ___ . ___ (-) or Number of inches person reaches beyond toes: ___ ___ . ___ (+) Measure to the nearest ½ inch
csrneg ___ ___ . ___ 6-9
csrpos ___ ___ . ___ 10-13
One of above coded as
88.8
What is your current height without shoes? ** is preferred. (1) ** Self-report without shoes: ___ feet and ___ ___. ___inches (2) ** Tape measure without shoes: ___ feet and ___ ___. ___inches (3) Tape measure with shoes: ___ feet and ___ ___. ___inches
Enter the total inches: (12 x ft) + inches = total inches
Htin1 ___ ___ . ___ 14-17
Htin2 ___ ___ . ___ 18-21
Htin3 ___ ___ . ___ 22-25
(- 9.9 if missing)

65
! 114
What is your current weight? ** is preferred. (1) ** By interviewer: with a scale, with clothes, and without shoes: ___ ___ ___.___ pounds (2) ** Self-report without clothes and without shoes: ___ ___ ___.___ pounds (3) Self-report with clothes and with shoes: ___ ___ ___.___ pounds (4) By interviewer: with a scale, with clothes, and with shoes: ___ ___ ___.___ pounds
Wtlbs1 ___ ___ ___ . ___ 26-30
Wtlbs2 ___ ___ ___ . ___ 31-35
Wtlbs3 ___ ___ ___ . ___ 36-40
Wtlbs4 ___ ___ ___ . ___ 41-45
(- 99.9 if missing)
B M I body mass index [wtlbs /(htinches)2] x 703 BMI ___ ___ . ___ 46-49

66
! 115
Nutrition Screening, W eight, H eight, B M I (05/8/09) Name (ID): 2. County: 3. Date (M/D/Y) :
NU T RI T I O N A L H E A L T H Circle one
Missing = 9
NH1. Do you have an illness or condition that made you change the kind and/or amount of food you eat.*
No (0) Yes (2)
Nh1 1
NH2. Do you eat fewer than two meals per day? No (0) Yes (3)
Nh2 2
NH3A. Do you eat few fruits or vegetables?** No (0) Yes (1)
Nh3a 3
NH3B. Do you eat few milk products?** No (0) Yes (1)
Nh3b 4
NH4. Do you have 3 or more drinks of beer, liquor or wine almost every day.
No (0) Yes (2)
Nh4 5
NH5. Do you have tooth or mouth problems that make it hard for you to eat.*
No (0) Yes (2)
Nh5 6
NH6. Do you always have enough money to buy the food you need. No (4) Yes (0)
Nh6 7
NH7. Do you eat alone most of the time. No (0) Yes (1)
Nh7 8
NH8. Do you take 3 or more different prescribed or over-the-counter drugs a day.
No (0) Yes (1)
Nh8 9
NH9. Without wanting to, have you lost or gained 10 or more pounds in the last 6 months. Circle one: Lost weight OR Gained weight.
No (0) Yes (2)
Nh9 10
NH10. Are you not always physically able to (circle all that apply): Shop, cook, and/or feed yourself.*
No (0) Yes (2)
Nh10 11
If your score is: Total Score: Nhtot 12-13
0-2: Good. Recheck your nutritional score in 6 months. 3-5: You are at moderate nutritional r isk . See your dietitian or health care provider to help you improve your eating habits and lifestyle. Recheck your nutritional score in 3 months. 6 or more: You are at high nutritional r isk . See your dietitian or health care provider to help you improve your eating habits and lifestyle. Recheck your nutritional score in 3 months.
B O D Y W E I G H T , H E I G H T , A ND B M I If possible, use a Scale to Measure Body W eight And Tape Measure for Height
Record from previous pages Question reworded in May 2005*, May 2009**

67
! 116
Physical Performance T est-Task Descriptions
Equipment: Stopwatch, 8-F t Tape Measure, Ruler , Folding Chair
Use stopwatch to record time in
SE C O NDS
LINE 8 UGA Staff can score with open
coding ST A NDIN G B A L A N C E : T ime each item until person stands at least 10 seconds O R until person moves feet or reaches for support.
T ime to the nearest 10th second:
A-Side-by-side: F eet are touching side-by-side with toes and heels touching. If can hold for 10 seconds, then do the next semi-tandem stand. If not, then go to the 8 foot walk .
Standa: ___ ___. ___
___ ___ . ___ 1-4
B-semi-tandem: Place heel of one foot at mid- position of the other foot. If can hold for 10 seconds, then do the next tandem stand. If not, then go to the 8 foot walk .
Standb: ___ ___. ___
___ ___ . ___ 5-8
C-Tandem stand; place one foot directly in front of the other so that the heel and toes touch.
Standc: ___ ___. ___
___ ___ . ___
9-12 STAND SCORE: If A= 0-9 & B= <10, score= 0 A= 10 & B= <10, score= 1 B= 10 & C= 0-2, score= 2 B= 10 & C= 3-9, score= 3 B= 10 & C= 10, score= 4
Standscore: ____ 13
8 F O O T W A L K : Participant begins at standing position and will walk a
straight distance of 8-feet, measured with tape on the floor . Instruct the participant to walk at normal gait using any
assistive devices. If possible, have them begin walking a few feet before starting mark , and continue walking a few feet past the 8-foot mark . Tester will start and stop watch at the distance marks.
Complete the walk twice.
T ime to nearest 10th second and code the best (lowest) time:
Walk1: ___ ___. ___ Walk2: ___ ___. ___ Assistive device used? No (0) . If yes, was it a: Cane (1), Walker (2), O ther (3)
Wa1ksec: ___ ___ .
___ 4-17
Assistdev: ___ 18
WALK SCORE: 1= 5.7 2= 4.1-5.6 3= 3.2-4.0 4= 3.1 Walkscore: ____ 19 C H A IR ST A NDS: Participant is asked to stand one time f rom a seated
position in an armless, straight-backed chair (such as a folding metal chair) with their arms folded across thei r chest.
If able, participant is asked to stand-up and sit-down 5 times as quickly as possible while being timed.
If not able to perform, then the test is complete.
T ime to nearest 10th
second: Chairsec: ___ ___. ___
___ ___. ___
20-23 CHAIR SCORE: 1= 16.7 2= 13.7-16.6 3= 11.2-13.6 4= 11.1 Chairscore: ____ 24 TOTAL SCORE: Add all 3 total scores, range is 0-12 SPPB: ___ ___ 25-26
applicable. SPPB: good function (score of 10 to 12); moderate function (score of 6 to 9); poor function (score of 0 to 5).

68
APPENDIX B – Three-Factor Eating Questionnaire (Revised 18-item)
63
APPE NDI C ES
Appendix A Three-Factor Eating Questionnaire Revised 18-Item
Three-Factor Eating Questionnaire: Exquestions will have four answers, such as al
Always Usually Rarely Never
1. When you see any of your favorite foods, do you find it very difficult to keep from eating, even if you have just finished a meal?
4 3 2 1
2. Do you deliberately take small helpings as a means of controlling your weight?
4 3 2 1
3. When you feel anxious, do you find yourself eating?
4 3 2 1
4. Sometimes when you start eating,
stop?
4 3 2 1
5. Being with someone who is eating often makes you hungry enough to eat also?
4 3 2 1
6. When you feel blue, do you often overeat?
4 3 2 1
7. When you see a real delicacy, do you often get so hungry that you have to eat right away?
4 3 2 1
8. Do you get so hungry that your stomach often seems like a bottomless pit?
4 3 2 1
9. Are you always hungry so it is hard for you to stop eating before you finish the food on your plate?
4 3 2 1
10. When you feel lonely, do you console yourself by eating?
4 3 2 1
11. Do you consciously hold back at meals in order not to gain weight?
4 3 2 1
12. Do you not eat some foods because they make you fat?
4 3 2 1
13. Are you always hungry enough to eat at any time?
4 3 2 1

69
64
14. How often do you feel hungry? Almost
always (4)
Often be-
tween meals
(3)
Some-times be-
tween meals
(2)
Only at meal times
(1)
15. How frequently do you avoid "stocking up" on tempting foods?
Almost always
(4)
Usually (3)
Seldom (2)
Almost never
(1) 16. How likely are you to consciously
eat less than you want? Very likely
(4)
Moder-ately likely
(3)
Slightly likely
(2)
Unlike-ly (1)
17. Do you go on eating binges though you are not hungry?
At least once a week (4)
Some-times
(3)
Rarely (2)
Never (1)
18. Do you feel you are restrained in your eating? Always restrained (constantly limiting food intake and
restrained, Rarely restrained, or Never restrained (eating whatever you want, whenever you want).
Always (4)
Usually (3)
Rarely (2)
Never (1)
19. The cognitive restraint scale is the sum of items 2, 11, 12, 15, 16, 18. 20. The uncontrolled eating scale is the sum of items 1, 4, 5, 7, 8, 9, 13, 14, and 17. 21. The emotional eating scale is the sum of items 3, 6, and 10.

70
APPENDIX C – US Household Food Security Survey Module questionnaire: Six-Item
Short Form
U.S. Household Food Security Survey Module: Six-Item Short Form Economic Research Service, USDA
September 2012 Revision Notes: The food security questions in the 6-item module are essentially unchanged from those in the original module first implemented in 1995 and described previously in this document. September 2012:
• Added coding specification for “How many days” for 30-day version of AD1a. July 2008:
• Wording of resource constraint in AD2 was corrected to, “…because there wasn’t enough money for food” to be consistent with the intention of the September 2006 revision.
January 2008: • Corrected user notes for coding AD1a.
September 2006: • Minor changes were introduced to standardize wording of the resource constraint in most
questions to read, “…because there wasn't enough money for food.” • Question numbers were changed to be consistent with those in the revised Household
Food Security Survey Module. • User notes following the questionnaire were revised to be consistent with current practice
and with new labels for ranges of food security and food insecurity introduced by USDA in 2006.
Overview: The six-item short form of the survey module and the associated Six-Item Food Security Scale were developed by researchers at the National Center for Health Statistics. Background: The six-item short form of the survey module and the associated Six-Item Food Security Scale were developed by researchers at the National Center for Health Statistics in collaboration with Abt Associates Inc. and documented in “The effectiveness of a short form of the household food security scale,” by S.J. Blumberg, K. Bialostosky, W.L. Hamilton, and R.R. Briefel (published by the American Journal of Public Health, vol. 89, pp. 1231-34, 1999). ERS conducted additional assessment of classification sensitivity, specificity, and bias relative to the 18-item scale. If respondent burden permits, use of the 18-item U.S. Household Food Security Survey Module or the 10-item U.S. Adult Food Security Survey Module is recommended. However, in surveys that cannot implement one of those measures, the six-item module may provide an acceptable substitute. It has been shown to identify food-insecure households and households with very low

71
food security with reasonably high specificity and sensitivity and minimal bias compared with the 18-item measure. It does not, however, directly ask about children’s food security, and does not measure the most severe range of adult food insecurity, in which children’s food intake is likely to be reduced.

72
[Begin Six-Item Food Security Module] Transition into Module : These next questions are about the food eaten in your household in the last 12 months, since (current month) of last year and whether you were able to afford the food you need. NOTE: If the placement of these items in the survey makes the transition/introductory sentence unnecessary, add the word “Now” to the beginning of question HH3: “Now I’m going to read you....” FILL INSTRUCTIONS: Select the appropriate fill from parenthetical choices depending on the number of persons and number of adults in the household. HH3. I’m going to read you several statements that people have made about their food
situation. For these statements, please tell me whether the statement was often true, sometimes true, or never true for (you/your household) in the last 12 months—that is, since last (name of current month).
The first statement is, “The food that (I/we) bought just didn’t last, and (I/we) didn’t have money to get more.” Was that often, sometimes, or never true for (you/your household) in the last 12 months?
[ ] Often true [ ] Sometimes true [ ] Never true [ ] DK or Refused
HH4. “(I/we) couldn’t afford to eat balanced meals.” Was that often, sometimes, or never true
for (you/your household) in the last 12 months? [ ] Often true [ ] Sometimes true [ ] Never true [ ] DK or Refused

73
AD1. In the last 12 months, since last (name of current month), did (you/you or other adults in your household) ever cut the size of your meals or skip meals because there wasn't enough money for food?
[ ] Yes [ ] No (Skip AD1a) [ ] DK (Skip AD1a)
AD1a. [IF YES ABOVE, ASK] How often did this happen—almost every month, some months
but not every month, or in only 1 or 2 months?
[ ] Almost every month [ ] Some months but not every month [ ] Only 1 or 2 months [ ] DK
AD2. In the last 12 months, did you ever eat less than you felt you should because there
wasn't enough money for food? [ ] Yes [ ] No [ ] DK
AD3. In the last 12 months, were you every hungry but didn't eat because there wasn't enough
money for food?
[ ] Yes [ ] No [ ] DK
[End of Six-Item Food Security Module]

74
User Notes
(1) Coding Responses and Assessing Households’ Food Security Status: Responses of “often” or “sometimes” on questions HH3 and HH4, and “yes” on AD1, AD2, and AD3 are coded as affirmative (yes). Responses of “almost every month” and “some months but not every month” on AD1a are coded as affirmative (yes). The sum of affirmative responses to the six questions in the module is the household’s raw score on the scale. Food security status is assigned as follows:
• Raw score 0-1—High or marginal food security (raw score 1 may be considered marginal food security, but a large proportion of households that would be measured as having marginal food security using the household or adult scale will have raw score zero on the six-item scale)
• Raw score 2-4—Low food security • Raw score 5-6—Very low food security
For some reporting purposes, the food security status of households with raw score 0-1 is described as food secure and the two categories “low food security” and “very low food security” in combination are referred to as food insecure. For statistical procedures that require an interval-‐level measure, the following scale scores, based on the Rasch measurement model may be used:
Number of affirmatives Scale score
0 NA
1 2.86
2 4.19
3 5.27
4 6.30
5 7.54
6 (evaluated at 5.5)
8.48
However, no interval-level score is defined for households that affirm no items. (They are food secure, but the extent to which their food security differs from households that affirm one item is not known.)

75
(2) Response Options: For interviewer-administered surveys, DK (“don’t know”) and “Refused” are blind responses—that is, they are not presented as response options but marked if volunteered. For self-administered surveys, “don’t know” is presented as a response option. (3) Screening: If it is important to minimize respondent burden, respondents may be screened after question AD1. Households that have responded “never” to HH3 and HH4 and “no” to AD1 may skip over the remaining questions and be assigned raw score zero. In pilot surveys intended to validate the module in a new cultural, linguistic, or survey context, however, screening should be avoided if possible and all questions should be administered to all respondents. (4) 30-Day Reference Period: The questionnaire items may be modified to a 30-day reference period by changing the “last 12-month” references to “last 30 days.” In this case, item AD1a must be changed to read as follows: AD1a. [IF YES ABOVE, ASK] In the last 30 days, how many days did this happen? ______ days [ ] DK Responses of 3 days or more are coded as “affirmative” responses. (5) Self Administration: The six-item module has been used successfully in mail-out, take-home, and on-site self-administered surveys. For self-administration, question AD1a may be presented in one of two ways:
• Indent AD1a below AD1 and direct the respondent to AD1a with an arrow from the “Yes” response box of AD1. In a parenthetical following the “No” response box of AD1, instruct the respondent to skip question AD1 and go to question AD2.
• Present the following response options to question AD1 and omit question AD1a: o Yes, almost every month o Yes, some months but not every month o Yes, only 1 or 2 months o No
In this case, either of the first two responses is scored as two affirmative responses, while “Yes, only 1 or 2 months” is scored as a single affirmative response.
The two approaches have been found to yield nearly equal results. The latter may be preferred because it usually reduces the proportion of respondents with missing information on how often this behavior occurred.

76
APPENDIX D – Table 3.8
Table 3.8. Associations of food insecurity1 and eating behaviors2: regression analyses models3 (p-values) 4
Food Insecurity Continuous Median split Highest tertile vs.
lowest two tertiles Highest quartile vs.
lowest three quartiles CR UE EE CR UE EE CR UE EE CR UE EE FI Summary Score
Model 1 0.00 0.04 0.70 0.02 0.04 0.99 0.01 0.08 0.60 0.00 0.32 0.93 Model 2 0.00 0.17 0.72 0.00 0.10 0.93 0.01 0.33 0.58 0.00 0.63 0.99 FS vs. LVLFS
Model 1 0.02 0.04 0.59 0.02 0.12 1.00 0.11 0.14 0.62 0.08 0.41 0.74 Model 2 0.06 0.13 0.84 0.01 0.22 0.79 0.11 0.24 0.48 0.10 0.57 0.73 FS and LFS vs. VLFS
Model 1 0.00 0.06 0.91 0.05 0.03 0.76 0.01 0.09 0.46 0.00 0.56 0.55 Model 2 0.00 0.17 0.99 0.01 0.06 0.95 0.00 0.37 0.42 0.00 0.95 0.48 FS vs. LFS vs. VLFS
Model 1 0.00 0.02 0.75 0.01 0.04 0.89 0.01 0.07 0.50 0.01 0.41 0.96 Model 2 0.00 0.09 0.90 0.00 0.08 0.83 0.01 0.22 0.39 0.01 0.68 0.95 N = 118 1Food insecurity (FI), 6 items, max =6, higher scores indicate higher food insecurity, 0-1 = food secure or FS, 2-4 = low food security or LFS, 2-6 = low and very low food security or LVLFS, 5-6 = very low food security or VLFS. In the various models the lower level of food insecurity = 0 and the higher level of food insecurity = 1. 2Eating behaviors: at the median split about one-half of the sample is below the median and one-half of the sample is above the median; for the tertiles, eating behaviors at the lowest two tertiles are compared to the top tertile of the sample; for the quartiles, eating behaviors at the lowest three quartiles are compared to the top quartile of the sample. 3Model 1 the dependent variable is eating behavior and independent variable is the specific measure of food insecurity. Model 2 the dependent variable is eating behavior and independent variable is the specific measure of food insecurity; model is controlled for age, gender, race, education, BMI, diabetes, hypertension, heart disease, and arthritis. 4Significance level at p ≤ 0.05. Statistically significant values are in bold.