Food Demand Survey Philippines: SFD Presentation of Results_Background to Preliminaries1
87
-
Upload
adam-baguio -
Category
Documents
-
view
215 -
download
0
Transcript of Food Demand Survey Philippines: SFD Presentation of Results_Background to Preliminaries1

7/21/2019 Food Demand Survey Philippines: SFD Presentation of Results_Background to Preliminaries1
http://slidepdf.com/reader/full/food-demand-survey-philippines-sfd-presentation-of-resultsbackground-to-preliminaries1 1/87
7/21/2019 Food Demand Survey Philippines: SFD Presentation of Results_Background to Preliminaries1
http://slidepdf.com/reader/full/food-demand-survey-philippines-sfd-presentation-of-resultsbackground-to-preliminaries1 2/87
www.bas.gov.ph Philippines’ Bureau of Agricultural Statistics
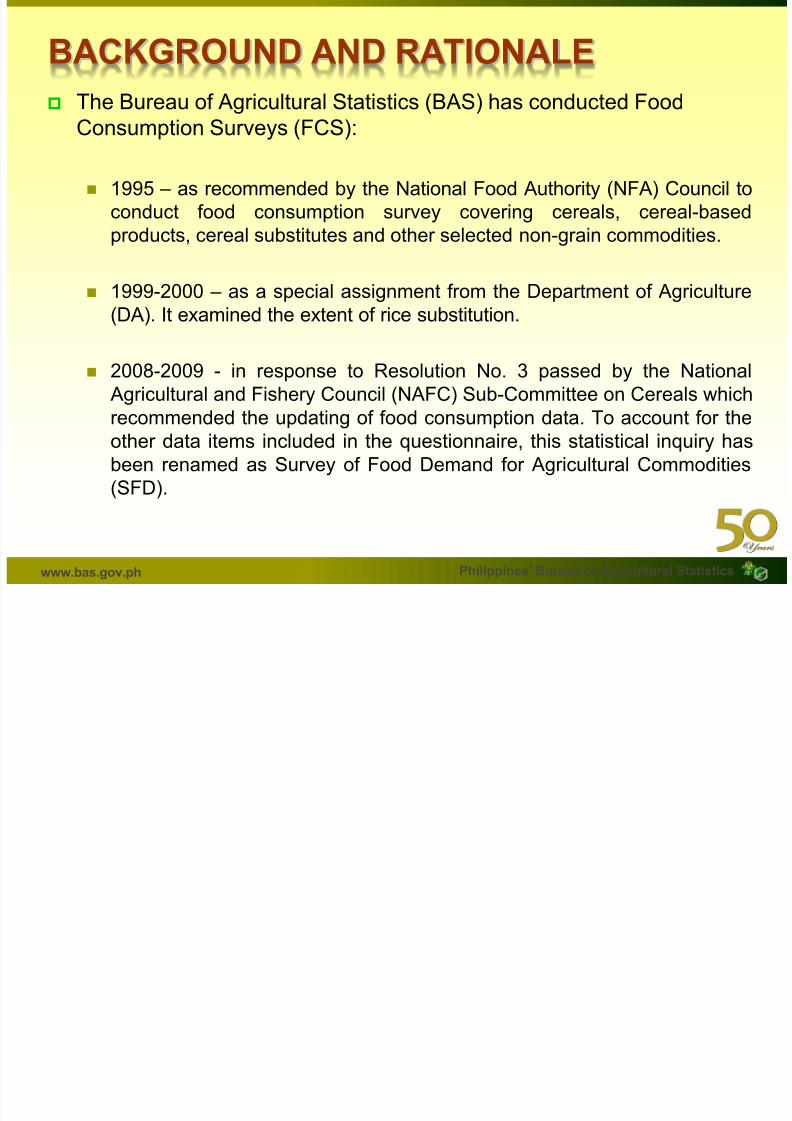
BACKGROUND AND RATIONALE
The Bureau of Agricultural Statistics (BAS) has conducted Food
Consumption Surveys (FCS):
1995 – as recommended by the National Food Authority (NFA) Council to
conduct food consumption survey covering cereals, cereal-based
products, cereal substitutes and other selected non-grain commodities.
1999-2000 – as a special assignment from the Department of Agriculture
(DA). It examined the extent of rice substitution.
2008-2009 - in response to Resolution No. 3 passed by the National
Agricultural and Fishery Council (NAFC) Sub-Committee on Cereals which
recommended the updating of food consumption data. To account for the
other data items included in the questionnaire, this statistical inquiry has
been renamed as Survey of Food Demand for Agricultural Commodities
(SFD).

7/21/2019 Food Demand Survey Philippines: SFD Presentation of Results_Background to Preliminaries1
http://slidepdf.com/reader/full/food-demand-survey-philippines-sfd-presentation-of-resultsbackground-to-preliminaries1 3/87
www.bas.gov.ph Philippines’ Bureau of Agricultural Statistics
BACKGROUND AND RATIONALE
Realizing the importance of data on per capita consumption as inputs
in measuring total food requirement of the country and as firm basisfor buffer stocking and making decision to import, the Resolution
further recommended the conduct of Food Consumption Surveys
focusing on rice at least every two (2) years for better monitoring of
per capita consumption. Thus, this survey on food consumption was
conducted in four (4) rounds in 2012.

7/21/2019 Food Demand Survey Philippines: SFD Presentation of Results_Background to Preliminaries1
http://slidepdf.com/reader/full/food-demand-survey-philippines-sfd-presentation-of-resultsbackground-to-preliminaries1 4/87
www.bas.gov.ph Philippines’ Bureau of Agricultural Statistics
OBJECTIVES
The general objective of the survey is to generate data on per capita
consumption of rice, corn, and other agricultural food commodities. Specifically, the survey aims to:
determine the present average per capita consumption of rice, corn, and otherbasic agricultural food items;
determine the consumption patterns as well as purchasing patterns of Filipinohouseholds;
study the shift in consumer’s preference including substitution of rice with other
food commodities; determine the quantity of rice and corn leftovers, wastage, and consumed by
animals/pet; and
analyze the relationship of demographic and socio-economic factors with foodconsumption patterns.

7/21/2019 Food Demand Survey Philippines: SFD Presentation of Results_Background to Preliminaries1
http://slidepdf.com/reader/full/food-demand-survey-philippines-sfd-presentation-of-resultsbackground-to-preliminaries1 5/87
www.bas.gov.ph Philippines’ Bureau of Agricultural Statistics
METHODOLOGY
Coverage
sample households in urban and rural barangays in 80 provinces,Zamboanga City, Davao City and the National Capital Region (NCR)
Household - a person or a group of persons, generally but notnecessarily bound by ties of kinship, who live together under the sameroof and eat together or share in common household food.

7/21/2019 Food Demand Survey Philippines: SFD Presentation of Results_Background to Preliminaries1
http://slidepdf.com/reader/full/food-demand-survey-philippines-sfd-presentation-of-resultsbackground-to-preliminaries1 6/87
www.bas.gov.ph Philippines’ Bureau of Agricultural Statistics
METHODOLOGY
Scope
Quantity of household’s food consumption, buying frequency and price perunit of food items consumed and number of eaters during the past seven days
Quantity of rice/corn leftovers, wastage and consumption by animals;
Extent of rice substitution; and
Demographic characteristics of households

7/21/2019 Food Demand Survey Philippines: SFD Presentation of Results_Background to Preliminaries1
http://slidepdf.com/reader/full/food-demand-survey-philippines-sfd-presentation-of-resultsbackground-to-preliminaries1 7/87www.bas.gov.ph Philippines’ Bureau of Agricultural Statistics
METHODOLOGY
Sampling Frame The list of barangays in the Philippine Standard Geographic Classification
(PSGC) as of September 2011, with corresponding information on 2007-PopCen-based urban-rural classification, estimated 2011 householdpopulation and number of households based on 2000 CPH and 2007 PopCenresults.
Sampling Design Two-stage sampling design Barangay as primary sampling unit
Household as secondary sampling unit

7/21/2019 Food Demand Survey Philippines: SFD Presentation of Results_Background to Preliminaries1
http://slidepdf.com/reader/full/food-demand-survey-philippines-sfd-presentation-of-resultsbackground-to-preliminaries1 8/87www.bas.gov.ph Philippines’ Bureau of Agricultural Statistics
METHODOLOGY
Sampling Design
For the 80 provinces and the Cities of Zamboanga and Davao, the domainwas the province/city and the urban-rural classification was the stratificationvariable.
Sixteen (16) sample barangays, which were proportionately allocated inthe strata, were selected using systematic sampling procedure.
For the NCR, the region served as the domain while the district was used asthe stratification variable.
Two sample barangays were selected from each city/municipality usingsystematic sampling procedure.

7/21/2019 Food Demand Survey Philippines: SFD Presentation of Results_Background to Preliminaries1
http://slidepdf.com/reader/full/food-demand-survey-philippines-sfd-presentation-of-resultsbackground-to-preliminaries1 9/87www.bas.gov.ph Philippines’ Bureau of Agricultural Statistics
METHODOLOGY
Sample Selection Selection of sample households in each sample barangay was done
during the first survey round (February 2012).
The sample households were selected and located through the rightcoverage procedure based on pre-assigned starting point (sp),random start (rs), and sampling interval (i).
All successfully enumerated households during that round werecovered in the succeeding rounds.

7/21/2019 Food Demand Survey Philippines: SFD Presentation of Results_Background to Preliminaries1
http://slidepdf.com/reader/full/food-demand-survey-philippines-sfd-presentation-of-resultsbackground-to-preliminaries1 10/87www.bas.gov.ph Philippines’ Bureau of Agricultural Statistics
METHODOLOGY
Pre-Survey Training
To have uniform understanding of the survey concepts and
procedures
Done in three (3) levels
1st Level – training of selected C.O. Staff 2nd Level – training of RASOs and PASOs
3rd Level – training of POC staff and CDCs

7/21/2019 Food Demand Survey Philippines: SFD Presentation of Results_Background to Preliminaries1
http://slidepdf.com/reader/full/food-demand-survey-philippines-sfd-presentation-of-resultsbackground-to-preliminaries1 11/87www.bas.gov.ph Philippines’ Bureau of Agricultural Statistics
METHODOLOGY
Data Collection Done by CDCs
Face-to-face interview
Use of a structured questionnaire (5 pages)
Reference Period
Seven days prior to the date of interview
When Conducted Mid-month of each quarter (February 2012, 2012, August 2012 and November
2012)

7/21/2019 Food Demand Survey Philippines: SFD Presentation of Results_Background to Preliminaries1
http://slidepdf.com/reader/full/food-demand-survey-philippines-sfd-presentation-of-resultsbackground-to-preliminaries1 12/87www.bas.gov.ph Philippines’ Bureau of Agricultural Statistics
METHODOLOGY
Estimation Procedure Food consumption was determined for each food item. Estimation of
household-level food consumption within and outside the householdcomprised of the ff components:
(A) - Food prepared at home and consumed at home byhousehold members
(B) - Delivered / take out food consumed at home by household
members (C) - Food prepared at home and consumed outside by household
members
(D) - Food prepared in food establishments and consumed outsideby household members

7/21/2019 Food Demand Survey Philippines: SFD Presentation of Results_Background to Preliminaries1
http://slidepdf.com/reader/full/food-demand-survey-philippines-sfd-presentation-of-resultsbackground-to-preliminaries1 13/87www.bas.gov.ph Philippines’ Bureau of Agricultural Statistics
METHODOLOGY
Estimation Procedure
Household-level Food Consumption
Formula (1)
Formula (2)

7/21/2019 Food Demand Survey Philippines: SFD Presentation of Results_Background to Preliminaries1
http://slidepdf.com/reader/full/food-demand-survey-philippines-sfd-presentation-of-resultsbackground-to-preliminaries1 14/87www.bas.gov.ph Philippines’ Bureau of Agricultural Statistics
METHODOLOGY
Estimation Procedure
Province/Domain-level Estimates
Formula (3)
Formula (4)

7/21/2019 Food Demand Survey Philippines: SFD Presentation of Results_Background to Preliminaries1
http://slidepdf.com/reader/full/food-demand-survey-philippines-sfd-presentation-of-resultsbackground-to-preliminaries1 15/87www.bas.gov.ph Philippines’ Bureau of Agricultural Statistics
METHODOLOGY
Estimation Procedure
Province/Domain-level Estimates
Formula (5)
Formula (6)

7/21/2019 Food Demand Survey Philippines: SFD Presentation of Results_Background to Preliminaries1
http://slidepdf.com/reader/full/food-demand-survey-philippines-sfd-presentation-of-resultsbackground-to-preliminaries1 16/87www.bas.gov.ph Philippines’ Bureau of Agricultural Statistics
DATA PROCESSING
Manual data processing
Editing and coding of survey returns
Done at POCs
Electronic data processing
Data encoding
Running of error-listing program and correction of errors Generation of per capita consumption table (unweighted) for
review of PASOs/RASOs
Done at POCs
Processing Software CSPro (Data Capture, Error-Listing, Output Tables) > ICTD
MS Excel (Output Tables) > AASID-SESS
7/21/2019 Food Demand Survey Philippines: SFD Presentation of Results_Background to Preliminaries1
http://slidepdf.com/reader/full/food-demand-survey-philippines-sfd-presentation-of-resultsbackground-to-preliminaries1 17/87www.bas.gov.ph Philippines’ Bureau of Agricultural Statistics
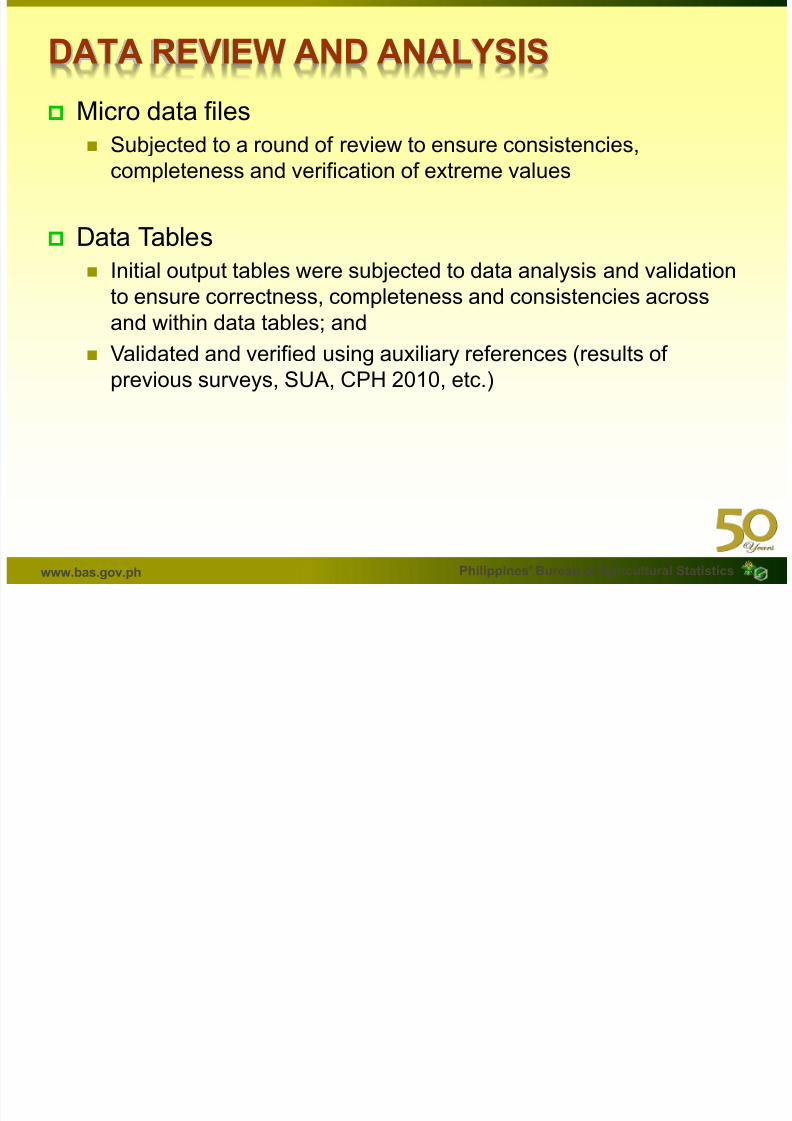
DATA REVIEW AND ANALYSIS
Micro data files
Subjected to a round of review to ensure consistencies,completeness and verification of extreme values
Data Tables
Initial output tables were subjected to data analysis and validationto ensure correctness, completeness and consistencies across
and within data tables; and
Validated and verified using auxiliary references (results of
previous surveys, SUA, CPH 2010, etc.)

7/21/2019 Food Demand Survey Philippines: SFD Presentation of Results_Background to Preliminaries1
http://slidepdf.com/reader/full/food-demand-survey-philippines-sfd-presentation-of-resultsbackground-to-preliminaries1 18/87www.bas.gov.ph Philippines’ Bureau of Agricultural Statistics
Target Actual Response
Rate Targe t Actual
Response
Rate Targe t Actual
Response
Rate Targe t Actual
Response
Rate
PHILIPPINES 13,560 13,558 99.99% 13,558 13,424 99.01% 13,584 13,441 98.95% 13,441 13,353 99.35%
NCR 600 598 99.67% 598 596 99.67% 596 587 98.49% 587 575 97.96%
CAR 960 960 100.00% 960 954 99.38% 954 944 98.95% 944 943 99.89%
ILOCOS REGION 640 640 100.00% 640 633 98.91% 633 614 97.00% 614 621 101.14%
CAGAYAN VALLEY 800 800 100.00% 800 791 98.88% 791 788 99.62% 788 783 99.37%
CENTRAL LUZON 1,120 1,120 100.00% 1,120 1,107 98.84% 1,107 1,085 98.01% 1,085 1,080 99.54%
CALABARZON 800 800 100.00% 800 786 98.25% 786 777 98.85% 777 765 98.46%
MIMAROPA 800 800 100.00% 800 795 99.38% 795 784 98.62% 784 777 99.11%
BICOL REGION 960 960 100.00% 960 949 98.85% 949 942 99.26% 942 930 98.73%
WESTERN VISAYAS 960 960 100.00% 960 958 99.79% 958 953 99.48% 953 950 99.69%
CENTRAL VISAYAS 640 640 100.00% 640 631 98.59% 631 627 99.37% 627 620 98.88%
EASTERN VISAYAS 960 960 100.00% 960 959 99.90% 959 957 99.79% 957 953 99.58%
ZAMBOANGA PENINSULA 640 640 100.00% 640 626 97.81% 626 613 97.92% 613 611 99.67%
NORTHERN MINDANAO 800 800 100.00% 800 797 99.63% 797 795 99.75% 795 794 99.87%
DAVAO REGION 800 800 100.00% 800 788 98.50% 788 781 99.11% 781 777 99.49%
SOCCSKSARGEN 640 640 100.00% 640 634 99.06% 634 617 97.32% 617 613 99.35%
CARAGA 800 800 100.00% 800 790 98.75% 790 787 99.62% 787 784 99.62%
ARMM 640 640 100.00% 640 630 98.44% 790 790 100.00% 790 777 98.35%
Region
February May August November
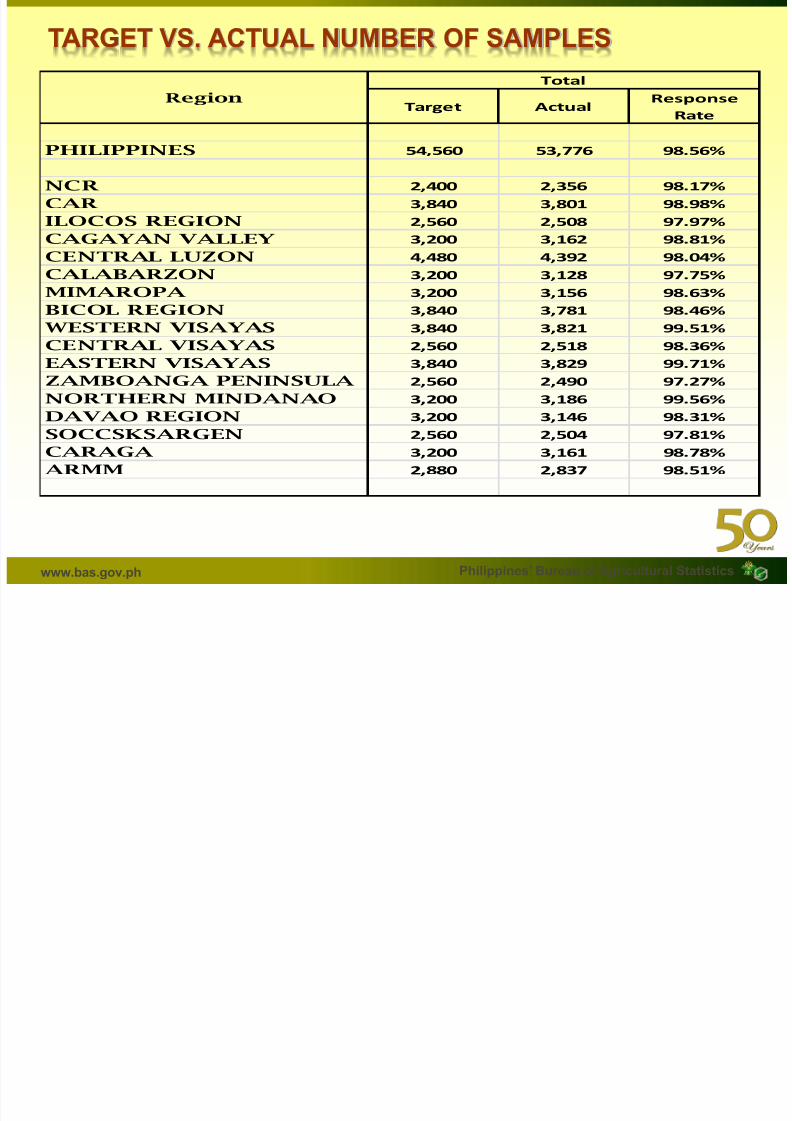
TARGET VS. ACTUAL NUMBER OF SAMPLES
7/21/2019 Food Demand Survey Philippines: SFD Presentation of Results_Background to Preliminaries1
http://slidepdf.com/reader/full/food-demand-survey-philippines-sfd-presentation-of-resultsbackground-to-preliminaries1 19/87www.bas.gov.ph Philippines’ Bureau of Agricultural Statistics
Target Actual Response
Rate
PHILIPPINES 54,560 53,776 98.56%
NCR 2,400 2,356 98.17%
CAR 3,840 3,801 98.98%
ILOCOS REGION 2,560 2,508 97.97%
CAGAYAN VALLEY 3,200 3,162 98.81%
CENTRAL LUZON 4,480 4,392 98.04%
CALABARZON 3,200 3,128 97.75%MIMAROPA 3,200 3,156 98.63%
BICOL REGION 3,840 3,781 98.46%
WESTERN VISAYAS 3,840 3,821 99.51%
CENTRAL VISAYAS 2,560 2,518 98.36%
EASTERN VISAYAS 3,840 3,829 99.71%
ZAMBOANGA PENINSULA 2,560 2,490 97.27%
NORTHERN MINDANAO 3,200 3,186 99.56%
DAVAO REGION 3,200 3,146 98.31%
SOCCSKSARGEN 2,560 2,504 97.81%
CARAGA 3,200 3,161 98.78%
ARMM 2,880 2,837 98.51%
Total
Region
TARGET VS. ACTUAL NUMBER OF SAMPLES

7/21/2019 Food Demand Survey Philippines: SFD Presentation of Results_Background to Preliminaries1
http://slidepdf.com/reader/full/food-demand-survey-philippines-sfd-presentation-of-resultsbackground-to-preliminaries1 20/87www.bas.gov.ph Philippines’ Bureau of Agricultural Statistics
HOUSEHOLD
CHARACTERISTICS

7/21/2019 Food Demand Survey Philippines: SFD Presentation of Results_Background to Preliminaries1
http://slidepdf.com/reader/full/food-demand-survey-philippines-sfd-presentation-of-resultsbackground-to-preliminaries1 21/87
www.bas.gov.ph Philippines’ Bureau of Agricultural Statistics
Table 1. Average household size and percentage distribution of household members
by sex and region, Philippines, 2012
Philippines 5.05 49.89 50.11
NCR 5.15 47.00 53.00
CAR 5.41 51.46 48.54
Ilocos Region 4.98 50.21 49.79
Cagayan Valley 4.76 49.81 50.19
Central Luzon 4.92 51.42 48.58
CALABARZON 4.73 50.71 49.29
MIMAROPA 4.98 48.56 51.44
Bicol Region 5.38 49.41 50.59
Western Visayas 4.94 50.73 49.27
Central Visayas 5.32 50.66 49.34
Eastern Visayas 4.86 51.24 48.76
Zamboanga Peninsula 5.06 50.70 49.30
Northern Mindanao 5.03 50.18 49.82Davao Region 4.81 50.80 49.20
SOCCSKSARGEN 4.88 49.92 50.08
Caraga 5.17 49.46 50.54
ARMM 6.64 47.91 52.09
in percent
RegionAverage
Household Size
Sex
Male Female

7/21/2019 Food Demand Survey Philippines: SFD Presentation of Results_Background to Preliminaries1
http://slidepdf.com/reader/full/food-demand-survey-philippines-sfd-presentation-of-resultsbackground-to-preliminaries1 22/87
www.bas.gov.ph Philippines’ Bureau of Agricultural Statistics
SFD 2012 VS. SFD 2008-2009

7/21/2019 Food Demand Survey Philippines: SFD Presentation of Results_Background to Preliminaries1
http://slidepdf.com/reader/full/food-demand-survey-philippines-sfd-presentation-of-resultsbackground-to-preliminaries1 23/87
www.bas.gov.ph Philippines’ Bureau of Agricultural Statistics
SFD 2012 VS. SFD 2008-2009

7/21/2019 Food Demand Survey Philippines: SFD Presentation of Results_Background to Preliminaries1
http://slidepdf.com/reader/full/food-demand-survey-philippines-sfd-presentation-of-resultsbackground-to-preliminaries1 24/87
www.bas.gov.ph Philippines’ Bureau of Agricultural Statistics
SFD 2012 VS. SFD 2008-2009
2012
In CAR,
51.46 % of its members
were males
In NCR,
53 % of its members
were females
2008-2009
In Northern Mindanao,
52.43 % of its members
were males
In Ilocos Region,
52.02 % of its members
were females
More male and female members were
accounted in the following regions:
More male and female members were
accounted in the following regions:

7/21/2019 Food Demand Survey Philippines: SFD Presentation of Results_Background to Preliminaries1
http://slidepdf.com/reader/full/food-demand-survey-philippines-sfd-presentation-of-resultsbackground-to-preliminaries1 25/87
www.bas.gov.ph Philippines’ Bureau of Agricultural Statistics
Table 2. Average age and percentage distribution of household members by age group and region, Philippines, 2012
Philippines 28 10.26 11.09 11.05 14.48 20.73 12.62 8.33 6.56 4.90
NCR 28 9.27 10.74 10.40 14.98 22.72 13.54 8.51 6.09 3.76
CAR 28 9.25 10.18 10.31 16.82 21.93 11.55 10.22 4.70 5.05
Ilocos Region 30 9.21 10.13 9.63 12.34 22.41 13.00 8.95 7.11 7.22
Cagayan Valley 28 9.67 9.93 10.98 13.82 21.47 13.34 10.00 5.97 4.82
Central Luzon 29 9.50 10.06 11.26 11.96 21.70 13.45 8.64 7.81 5.61
CALABARZON 27 10.56 10.98 9.67 14.92 22.36 13.20 8.23 6.62 3.47MIMAROPA 27 9.87 13.74 12.46 15.40 16.69 11.06 8.74 7.31 4.73
Bicol Region 26 10.66 12.16 12.81 15.38 17.62 12.38 8.53 5.71 4.75
Western Visayas 28 11.16 10.52 11.00 13.65 19.73 12.58 7.91 6.98 6.47
Cerntral Visayas 28 11.25 10.00 11.38 15.00 20.39 12.43 7.31 6.25 6.00
Eastern Visayas 28 10.16 12.99 12.69 14.52 17.66 10.87 7.74 7.07 6.31
Zamboanga Peninsula 27 10.92 11.46 11.33 15.68 17.13 13.58 9.19 6.05 4.67
Northern Mindanao 27 10.28 11.52 11.04 14.70 19.87 12.35 9.10 7.43 3.71
Davao Region 29 9.96 10.83 10.24 14.85 20.80 11.55 7.86 7.39 6.52SOCCSKSARGEN 27 11.81 11.01 10.87 13.64 22.12 11.99 8.18 5.62 4.75
Caraga 27 12.19 11.29 11.04 14.70 19.44 10.38 8.61 7.48 4.87
ARMM 23 10.28 14.55 13.79 17.47 20.28 11.60 5.50 4.33 2.21
56 - 65 Over 65Region
Average Age
(in years)
Age Group ( y e a r )
0 - 4 5 - 9 10 - 14 15 - 21 22 - 35 36 - 46 47 - 55

7/21/2019 Food Demand Survey Philippines: SFD Presentation of Results_Background to Preliminaries1
http://slidepdf.com/reader/full/food-demand-survey-philippines-sfd-presentation-of-resultsbackground-to-preliminaries1 26/87
www.bas.gov.ph Philippines’ Bureau of Agricultural Statistics
SFD 2012 VS. SFD 2008-2009
7/21/2019 Food Demand Survey Philippines: SFD Presentation of Results_Background to Preliminaries1
http://slidepdf.com/reader/full/food-demand-survey-philippines-sfd-presentation-of-resultsbackground-to-preliminaries1 27/87
www.bas.gov.ph Philippines’ Bureau of Agricultural Statistics
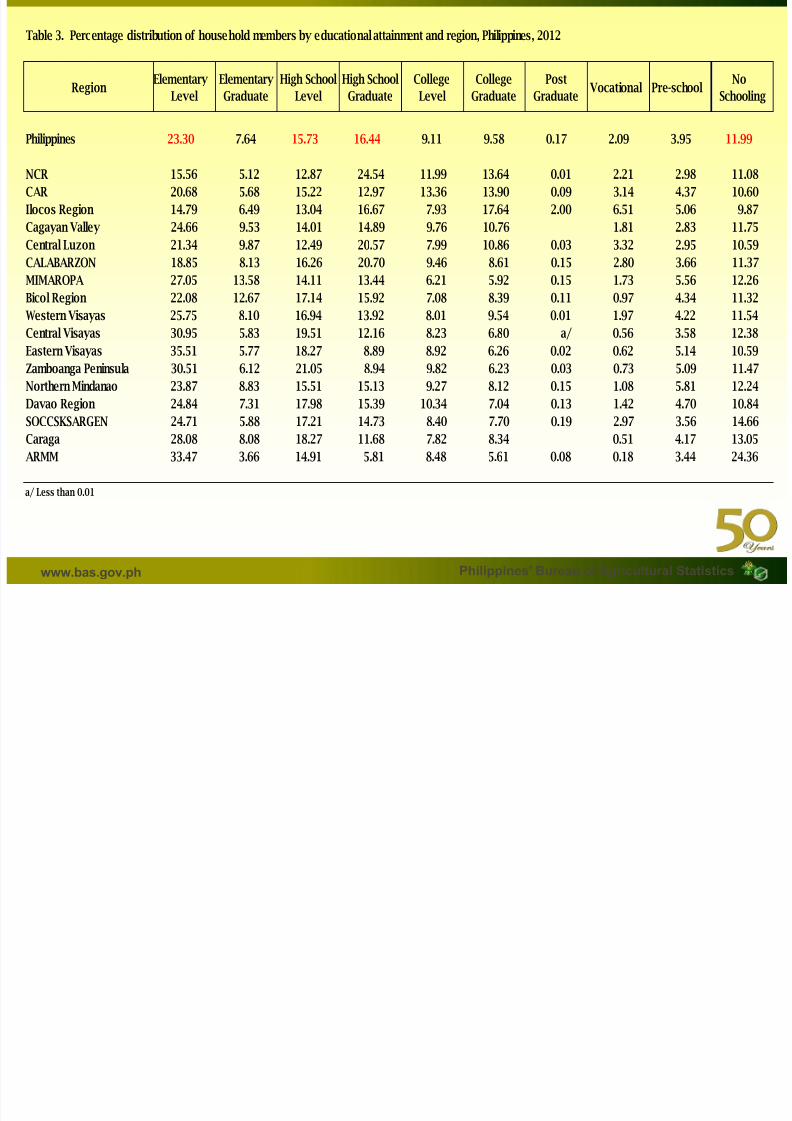
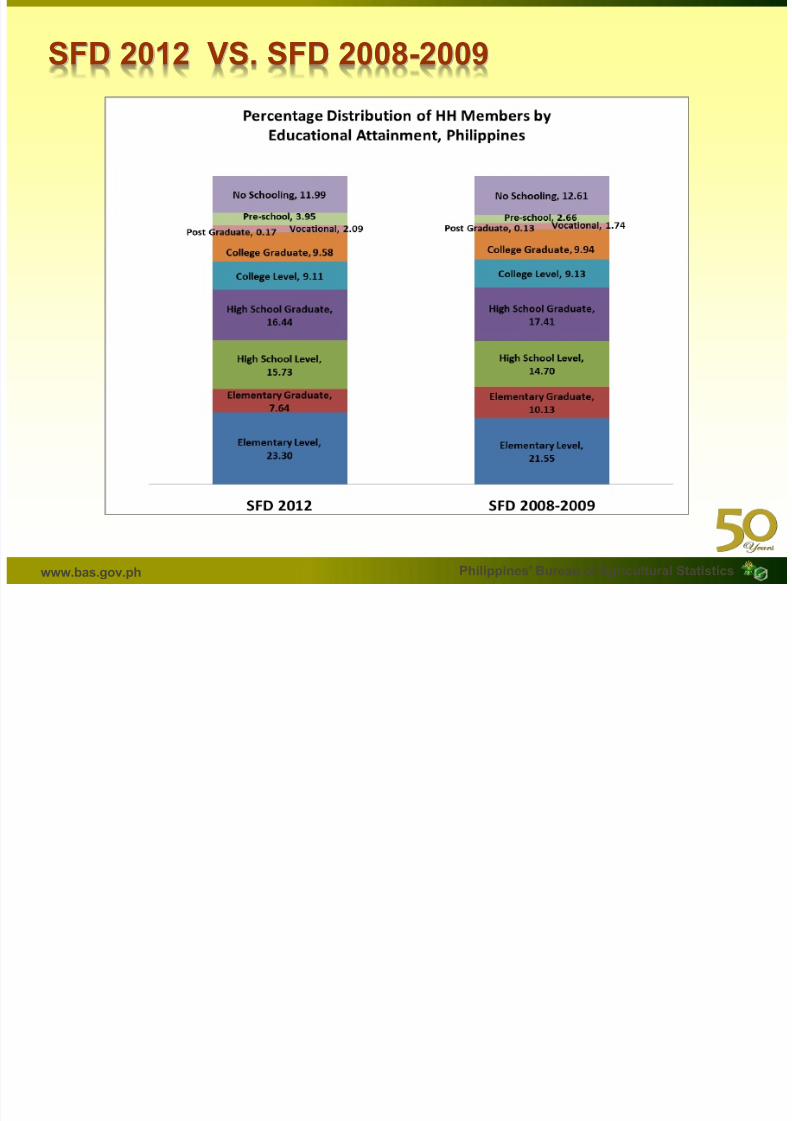
Table 3. Percentage distribution of household members by educational attainment and region, Philippines, 2012
Region Elementary
Level
Elementary
Graduate
High School
Level
High School
Graduate
College
Level
College
Graduate
Post
Graduate Vocational Pre-school
No
Schooling
Philippines 23.30 7.64 15.73 16.44 9.11 9.58 0.17 2.09 3.95 11.99
NCR 15.56 5.12 12.87 24.54 11.99 13.64 0.01 2.21 2.98 11.08
CAR 20.68 5.68 15.22 12.97 13.36 13.90 0.09 3.14 4.37 10.60
Ilocos Region 14.79 6.49 13.04 16.67 7.93 17.64 2.00 6.51 5.06 9.87
Cagayan Valley 24.66 9.53 14.01 14.89 9.76 10.76 1.81 2.83 11.75
Central Luzon 21.34 9.87 12.49 20.57 7.99 10.86 0.03 3.32 2.95 10.59
CALABARZON 18.85 8.13 16.26 20.70 9.46 8.61 0.15 2.80 3.66 11.37
MIMAROPA 27.05 13.58 14.11 13.44 6.21 5.92 0.15 1.73 5.56 12.26Bicol Region 22.08 12.67 17.14 15.92 7.08 8.39 0.11 0.97 4.34 11.32
Western Visayas 25.75 8.10 16.94 13.92 8.01 9.54 0.01 1.97 4.22 11.54
Central Visayas 30.95 5.83 19.51 12.16 8.23 6.80 a/ 0.56 3.58 12.38
Eastern Visayas 35.51 5.77 18.27 8.89 8.92 6.26 0.02 0.62 5.14 10.59
Zamboanga Peninsula 30.51 6.12 21.05 8.94 9.82 6.23 0.03 0.73 5.09 11.47
Northern Mindanao 23.87 8.83 15.51 15.13 9.27 8.12 0.15 1.08 5.81 12.24
Davao Region 24.84 7.31 17.98 15.39 10.34 7.04 0.13 1.42 4.70 10.84
SOCCSKSARGEN 24.71 5.88 17.21 14.73 8.40 7.70 0.19 2.97 3.56 14.66
Caraga 28.08 8.08 18.27 11.68 7.82 8.34 0.51 4.17 13.05
ARMM 33.47 3.66 14.91 5.81 8.48 5.61 0.08 0.18 3.44 24.36
a/ Less than 0.01
7/21/2019 Food Demand Survey Philippines: SFD Presentation of Results_Background to Preliminaries1
http://slidepdf.com/reader/full/food-demand-survey-philippines-sfd-presentation-of-resultsbackground-to-preliminaries1 28/87
www.bas.gov.ph Philippines’ Bureau of Agricultural Statistics
SFD 2012 VS. SFD 2008-2009

7/21/2019 Food Demand Survey Philippines: SFD Presentation of Results_Background to Preliminaries1
http://slidepdf.com/reader/full/food-demand-survey-philippines-sfd-presentation-of-resultsbackground-to-preliminaries1 29/87
www.bas.gov.ph Philippines’ Bureau of Agricultural Statistics
Table 4.1 Percentage of working household members by reference month
and region, Philippines, 2012
Philippines 34.69 34.58 34.97 35.61
NCR 32.98 33.04 33.81 34.90
CAR 40.97 40.48 41.07 41.53
Ilocos Region 36.69 37.14 36.15 37.96
Cagayan Valley 39.95 41.52 43.03 42.33
Central Luzon 34.85 34.10 33.68 35.87
CALABARZON 35.77 34.04 35.81 35.35
MIMAROPA 33.11 32.82 33.43 33.21
Bicol Region 31.98 32.35 32.48 32.63
Western Visayas 36.04 37.02 36.99 38.45
Central Visayas 34.19 33.62 34.71 35.10
Eastern Visayas 30.48 30.77 31.04 31.93
Zamboanga Peninsula 34.07 33.06 34.84 36.84
Northern Mindanao 36.48 37.00 37.85 37.72
Davao Region 36.84 38.40 38.78 38.34
SOCCSKSARGEN 37.42 36.80 37.18 37.77
Caraga 33.57 32.69 32.39 33.05
ARMM 26.33 27.64 26.39 25.38
NovemberMay AugustRegion February
7/21/2019 Food Demand Survey Philippines: SFD Presentation of Results_Background to Preliminaries1
http://slidepdf.com/reader/full/food-demand-survey-philippines-sfd-presentation-of-resultsbackground-to-preliminaries1 30/87
www.bas.gov.ph Philippines’ Bureau of Agricultural Statistics
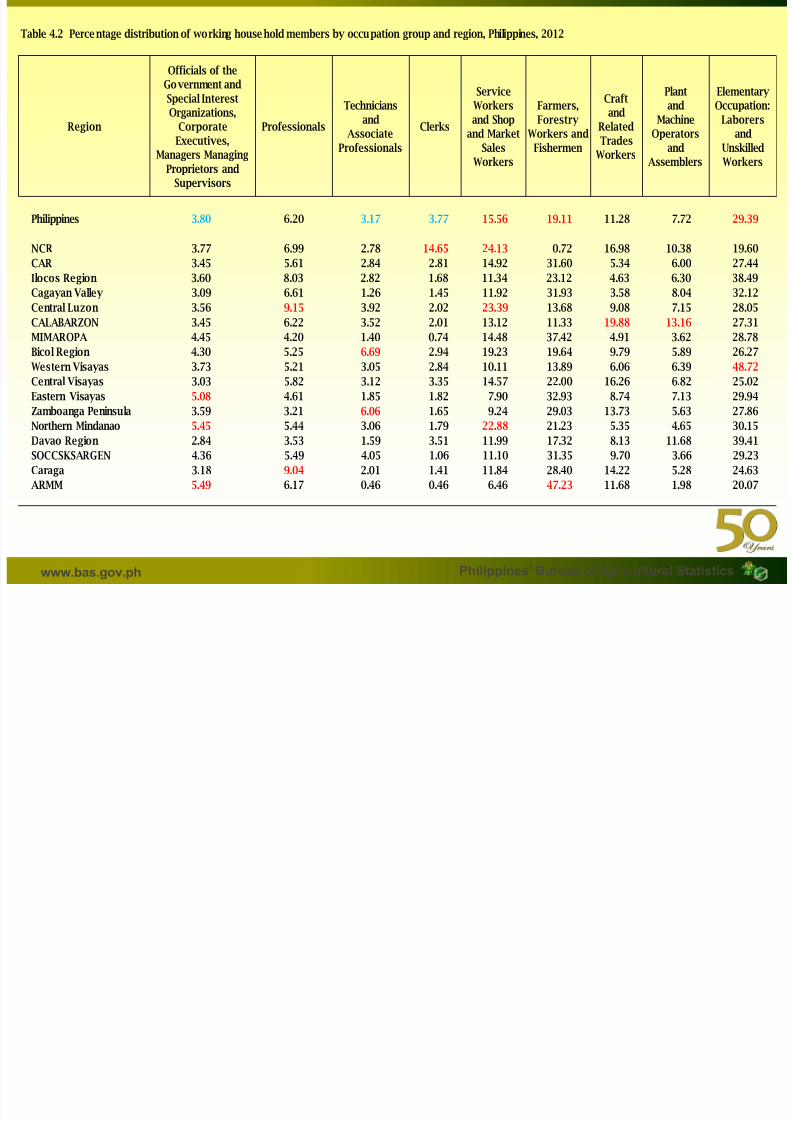
Table 4.2 Percentage distribution of working household members by occupation group and region, Philippines, 2012
Region
Officials of theGovernment and
Special InterestOrganizations,
Corporate
Executives,Managers Managing
Proprietors andSupervisors
Professionals
Technicians
andAssociate
Professionals
Clerks
ServiceWorkers
and Shopand Market
SalesWorkers
Farmers,
ForestryWorkers and
Fishermen
Craftand
Related
TradesWorkers
Plantand
MachineOperators
andAssemblers
ElementaryOccupation:
Laborersand
UnskilledWorkers
Philippines 3.80 6.20 3.17 3.77 15.56 19.11 11.28 7.72 29.39
NCR 3.77 6.99 2.78 14.65 24.13 0.72 16.98 10.38 19.60
CAR 3.45 5.61 2.84 2.81 14.92 31.60 5.34 6.00 27.44
Ilocos Region 3.60 8.03 2.82 1.68 11.34 23.12 4.63 6.30 38.49Cagayan Valley 3.09 6.61 1.26 1.45 11.92 31.93 3.58 8.04 32.12
Central Luzon 3.56 9.15 3.92 2.02 23.39 13.68 9.08 7.15 28.05
CALABARZON 3.45 6.22 3.52 2.01 13.12 11.33 19.88 13.16 27.31
MIMAROPA 4.45 4.20 1.40 0.74 14.48 37.42 4.91 3.62 28.78
Bicol Region 4.30 5.25 6.69 2.94 19.23 19.64 9.79 5.89 26.27
Western Visayas 3.73 5.21 3.05 2.84 10.11 13.89 6.06 6.39 48.72
Central Visayas 3.03 5.82 3.12 3.35 14.57 22.00 16.26 6.82 25.02
Eastern Visayas 5.08 4.61 1.85 1.82 7.90 32.93 8.74 7.13 29.94
Zamboanga Peninsula 3.59 3.21 6.06 1.65 9.24 29.03 13.73 5.63 27.86Northern Mindanao 5.45 5.44 3.06 1.79 22.88 21.23 5.35 4.65 30.15
Davao Region 2.84 3.53 1.59 3.51 11.99 17.32 8.13 11.68 39.41
SOCCSKSARGEN 4.36 5.49 4.05 1.06 11.10 31.35 9.70 3.66 29.23
Caraga 3.18 9.04 2.01 1.41 11.84 28.40 14.22 5.28 24.63
ARMM 5.49 6.17 0.46 0.46 6.46 47.23 11.68 1.98 20.07

7/21/2019 Food Demand Survey Philippines: SFD Presentation of Results_Background to Preliminaries1
http://slidepdf.com/reader/full/food-demand-survey-philippines-sfd-presentation-of-resultsbackground-to-preliminaries1 31/87
www.bas.gov.ph Philippines’ Bureau of Agricultural Statistics
SFD 2012 VS. SFD 2008-2009

7/21/2019 Food Demand Survey Philippines: SFD Presentation of Results_Background to Preliminaries1
http://slidepdf.com/reader/full/food-demand-survey-philippines-sfd-presentation-of-resultsbackground-to-preliminaries1 32/87
www.bas.gov.ph Philippines’ Bureau of Agricultural Statistics
Table 5. Percentage distribution of households by socio-economic class and region,
Philippines, 2012
Region
Philippines 2.16 25.38 56.33 16.12
NCR 1.61 32.58 59.86 5.96
CAR 4.68 37.93 46.66 10.72
Ilocos Region 6.03 44.04 47.12 2.81
Cagayan Valley 0.24 21.89 47.48 30.39
Central Luzon 3.25 34.35 50.55 11.84
CALABARZON 1.74 24.60 62.41 11.25MIMAROPA 1.31 23.60 50.03 25.06
Bicol Region 2.76 21.68 65.24 10.32
Western Visayas 1.84 19.96 47.46 30.74
Central Visayas 2.14 22.21 57.04 18.60
Eastern Visayas 0.84 13.62 61.64 23.89
Zamboanga Peninsula 2.09 19.48 55.62 22.81
Northern Mindanao 1.02 19.89 53.78 25.31
Davao Region 1.90 15.52 63.04 19.54
SOCCSKSARGEN 2.07 20.63 57.88 19.43
Caraga 2.59 20.91 56.97 19.52
ARMM 1.19 17.89 62.64 18.28
Class AB Class C Class D Class E

7/21/2019 Food Demand Survey Philippines: SFD Presentation of Results_Background to Preliminaries1
http://slidepdf.com/reader/full/food-demand-survey-philippines-sfd-presentation-of-resultsbackground-to-preliminaries1 33/87
www.bas.gov.ph Philippines’ Bureau of Agricultural Statistics
SFD 2012 VS. SFD 2008-2009

7/21/2019 Food Demand Survey Philippines: SFD Presentation of Results_Background to Preliminaries1
http://slidepdf.com/reader/full/food-demand-survey-philippines-sfd-presentation-of-resultsbackground-to-preliminaries1 34/87
www.bas.gov.ph Philippines’ Bureau of Agricultural Statistics
SFD 2012 VS. SFD 2008-2009
SFD 2012 SFD 2008-2009 SFD 2012 SFD 2008-2009 SFD 2012 SFD 2008-2009 SFD 2012 SFD 2008-2009
NCR 1.61 4.70 32.58 23.51 59.86 45.08 5.96 26.72
CAR 4.68 5.40 37.93 29.09 46.66 52.59 10.72 12.93
Ilocos Region 6.03 3.99 44.04 26.83 47.12 50.06 2.81 19.12
Cagayan Valley 0.24 1.69 21.89 20.46 47.48 54.05 30.39 23.81
Central Luzon 3.25 6.33 34.35 25.79 50.55 48.08 11.84 19.81
CALABARZON 1.74 4.83 24.60 20.78 62.41 60.24 11.25 14.14MIMAROPA 1.31 0.82 23.60 17.95 50.03 52.54 25.06 28.68
Bicol Region 2.76 2.00 21.68 23.05 65.24 45.20 10.32 29.76
Western Visayas 1.84 2.16 19.96 17.50 47.46 58.64 30.74 21.70
Central Visayas 2.14 0.55 22.21 13.56 57.04 45.57 18.60 40.32
Eastern Visayas 0.84 3.90 13.62 18.09 61.64 46.76 23.89 31.25
Zamboanga Peninsula 2.09 0.83 19.48 13.41 55.62 52.93 22.81 32.83
Northern Mindanao 1.02 0.89 19.89 20.03 53.78 52.06 25.31 27.01
Davao Region 1.90 5.93 15.52 14.99 63.04 52.87 19.54 26.21SOCCSKSARGEN 2.07 0.98 20.63 15.30 57.88 63.04 19.43 20.69
Caraga 2.59 1.79 20.91 11.82 56.97 59.81 19.52 26.58
ARMM 1.19 1.57 17.89 10.48 62.64 40.63 18.28 47.32
Class AB Class C Class D Class ERegion

7/21/2019 Food Demand Survey Philippines: SFD Presentation of Results_Background to Preliminaries1
http://slidepdf.com/reader/full/food-demand-survey-philippines-sfd-presentation-of-resultsbackground-to-preliminaries1 35/87
www.bas.gov.ph Philippines’ Bureau of Agricultural Statistics
Table 6. Percentage distribution of households by annual income group and region, Philippines, 2012
Region ≤ P80,000 P80,001 to
P135,000
P135,001 to
P500,000
P500,001 to
P1,000,000 >P1,000,001
Philippines 41.59 20.94 33.03 3.82 0.61
NCR 12.98 22.93 54.91 8.91 0.28
CAR 31.03 16.14 46.22 5.51 1.10
Ilocos Region 36.55 23.52 34.82 3.97 1.14
Cagayan Valley 38.84 26.08 30.92 3.54 0.61
Central Luzon 27.70 20.31 46.39 4.41 1.20
CALABARZON 35.45 21.93 37.89 3.92 0.82
MIMAROPA 61.19 18.29 18.25 1.90 0.36Bicol Region 53.94 20.83 20.82 3.41 1.00
Western Visayas 54.29 18.99 23.27 3.20 0.25
Central Visayas 49.31 21.31 27.35 1.42 0.61
Eastern Visayas 69.55 16.29 14.02 0.15 a/
Zamboanga Peninsula 57.53 22.64 18.31 1.47 0.04
Northern Mindanao 49.58 20.11 24.25 5.04 1.03
Davao Region 40.47 25.12 33.12 1.26 0.03
SOCCSKSARGEN 50.71 18.69 28.12 2.24 0.24Caraga 59.12 16.20 21.84 1.90 0.94
ARMM 70.98 16.46 10.09 1.84 0.62
a/ Less than 0.01

7/21/2019 Food Demand Survey Philippines: SFD Presentation of Results_Background to Preliminaries1
http://slidepdf.com/reader/full/food-demand-survey-philippines-sfd-presentation-of-resultsbackground-to-preliminaries1 36/87
www.bas.gov.ph Philippines’ Bureau of Agricultural Statistics
SFD 2012 VS. SFD 2008-2009

7/21/2019 Food Demand Survey Philippines: SFD Presentation of Results_Background to Preliminaries1
http://slidepdf.com/reader/full/food-demand-survey-philippines-sfd-presentation-of-resultsbackground-to-preliminaries1 37/87
www.bas.gov.ph Philippines’ Bureau of Agricultural Statistics
SFD 2012 VS. SFD 2008-2009
SFD 2012 SFD 2008-2009 SFD 2012 SFD 2008-2009 SFD 2012 SFD 2008-2009 SFD 2012 SFD 2008-2009 SFD 2012 SFD 2008-2009
NCR 12.98 19.15 22.93 28.45 54.91 49.21 8.91 3.13 0.28 0.06
CAR 31.03 44.00 16.14 17.73 46.22 35.07 5.51 3.14 1.10 0.05
Ilocos Region 36.55 43.20 23.52 21.59 34.82 32.62 3.97 2.44 1.14 0.15
Cagayan Valley 38.84 42.57 26.08 25.60 30.92 30.43 3.54 1.04 0.61 0.36
Central Luzon 27.70 32.06 20.31 21.22 46.39 40.92 4.41 3.82 1.20 1.99
CALABARZON 35.45 31.80 21.93 26.85 37.89 36.67 3.92 4.03 0.82 0.65
MIMAROPA 61.19 62.55 18.29 18.67 18.25 18.29 1.90 0.48 0.36 0.00
Bicol Region 53.94 60.94 20.83 20.82 20.82 16.65 3.41 1.49 1.00 0.11
Western Visayas 54.29 51.84 18.99 26.27 23.27 20.18 3.20 1.55 0.25 0.16
Central Visayas 49.31 62.75 21.31 19.32 27.35 17.38 1.42 0.55 0.61 0.00
Eastern Visayas 69.55 59.27 16.29 16.44 14.02 21.64 0.15 0.68 a/ 1.97
Zamboanga Peninsula 57.53 65.03 22.64 12.83 18.31 21.31 1.47 0.83 0.04 0.00
Northern Mindanao 49.58 58.72 20.11 20.41 24.25 19.98 5.04 0.70 1.03 0.19
Davao Region 40.47 50.98 25.12 15.43 33.12 27.66 1.26 5.93 0.03 0.00
SOCCSKSARGEN 50.71 53.88 18.69 22.04 28.12 23.62 2.24 0.47 0.24 0.00
Caraga 59.12 64.49 16.20 15.93 21.84 18.09 1.90 0.34 0.94 1.15
ARMM 70.98 63.55 16.46 19.24 10.09 15.64 1.84 1.40 0.62 0.17
a/ Less than 0.01
>P1,000,001Region
≤ P80,000 P80,001 to P135,000 P135,001 to P500,000 P500,001 to P1,000,000

7/21/2019 Food Demand Survey Philippines: SFD Presentation of Results_Background to Preliminaries1
http://slidepdf.com/reader/full/food-demand-survey-philippines-sfd-presentation-of-resultsbackground-to-preliminaries1 38/87
www.bas.gov.ph Philippines’ Bureau of Agricultural Statistics
TYPE AND SOURCE
OF FOOD EATEN ANDBUYING FREQUENCY

7/21/2019 Food Demand Survey Philippines: SFD Presentation of Results_Background to Preliminaries1
http://slidepdf.com/reader/full/food-demand-survey-philippines-sfd-presentation-of-resultsbackground-to-preliminaries1 39/87
www.bas.gov.ph Philippines’ Bureau of Agricultural Statistics
Table 7. Percentage of households by type of food eaten, Philippines, 2012
Commodity Percent Percent
Rice and Corn
Rice (plain) 96.37 97.25
Corn in cob (green ears) 8.86 10.95
Corn grits 7.54 7.54Shelled corn 1.01 1.70
Rootcrops
Camote 27.30 25.18
Cassava 13.11 15.48
Gabi 13.60 10.66
White Potato 15.26 11.53
SFD 2008-2009

7/21/2019 Food Demand Survey Philippines: SFD Presentation of Results_Background to Preliminaries1
http://slidepdf.com/reader/full/food-demand-survey-philippines-sfd-presentation-of-resultsbackground-to-preliminaries1 40/87
www.bas.gov.ph Philippines’ Bureau of Agricultural Statistics
Table 7. Percentage of households by type of food eaten, Philippines, 2012
Commodity Percent Percent
Vegetables, Legumes and Condiments
Ampalaya 42.06 43.94
Eggplant 55.57 55.69
Chayote 19.32 17.91
Go urd (upo) 10.60
Squash 43.27 37.31Okra 31.39 31.50
Carrots 13.07Cabbage 23.72 19.47
Pechay 24.86 20.06
Stringbeans 37.86 48.60
Habitchuelas 4.04 5.38
Mongo 22.74 24.60
Tomato 71.59 61.50Onion 86.31 80.06
Garlic 86.20 76.55
SFD 2008-2009

7/21/2019 Food Demand Survey Philippines: SFD Presentation of Results_Background to Preliminaries1
http://slidepdf.com/reader/full/food-demand-survey-philippines-sfd-presentation-of-resultsbackground-to-preliminaries1 41/87
www.bas.gov.ph Philippines’ Bureau of Agricultural Statistics
Table 7. Percentage of households by type of food eaten, Philippines, 2012
Commodity Percent Percent
Fruits
Banana (except saba) 56.75
Saba 25.51
Mango (all variety) 34.0739.72
(Mango - ripe)
Pineapple 8.03 9.38
Papaya (ripe) 12.20 12.25Calamansi 29.92
Livestock and Poultry Products
Pork 67.75 66.76
Beef 9.80 12.15
Carabeef 1.32 1.84
Chevon (goat) 0.76 0.47
Chicken 59.89 59.16
Duck 0.88Chicken Egg 80.90 76.10
Duck Egg 3.76
Fresh/ pasteurized milk 1.56 1.31
SFD 2008-2009
69.60(Banana - all variety)
7/21/2019 Food Demand Survey Philippines: SFD Presentation of Results_Background to Preliminaries1
http://slidepdf.com/reader/full/food-demand-survey-philippines-sfd-presentation-of-resultsbackground-to-preliminaries1 42/87
www.bas.gov.ph Philippines’ Bureau of Agricultural Statistics
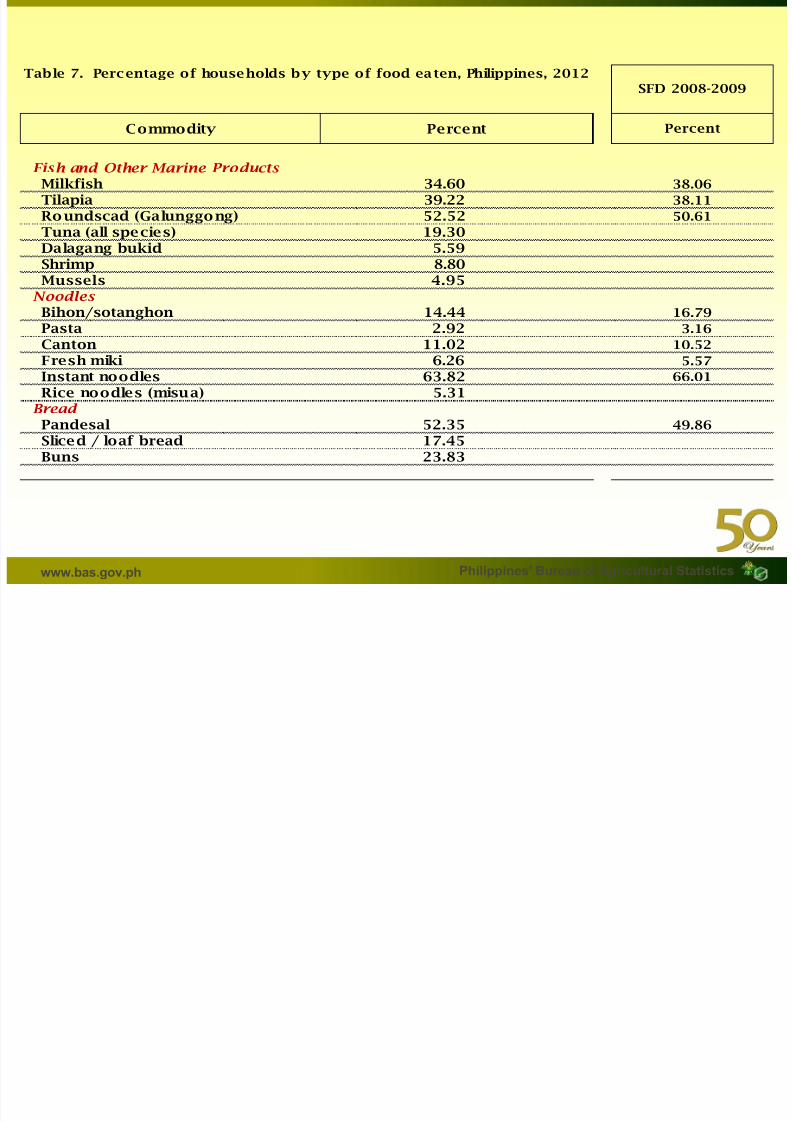
Table 7. Percentage of households by type of food ea ten, Philippines, 2012
Commodity Percent Percent
Fish and Other Marine Products
Milkfish 34.60 38.06
Tilapia 39.22 38.11
Roundscad (Galunggong) 52.52 50.61
Tuna (all species) 19.30Dalagang bukid 5.59Shrimp 8.80
Mussels 4.95Noodles
Bihon/sotanghon 14.44 16.79
Pasta 2.92 3.16
Canton 11.02 10.52
Fresh miki 6.26 5.57
Instant noodles 63.82 66.01
Rice noodles (misua) 5.31Bread
Pandesal 52.35 49.86
Sliced / loaf bread 17.45Buns 23.83
SFD 2008-2009

7/21/2019 Food Demand Survey Philippines: SFD Presentation of Results_Background to Preliminaries1
http://slidepdf.com/reader/full/food-demand-survey-philippines-sfd-presentation-of-resultsbackground-to-preliminaries1 43/87
www.bas.gov.ph Philippines’ Bureau of Agricultural Statistics
Table 8. Percentage of households by source of food eaten and commodity,
Philippines, 2012
Commodity Bought OwnProduced
Given
Rice and Corn
Rice (plain) 86.36 11.51 2.49 82.86 11.09 1.58
Corn in cob (green ears) 82.82 7.55 9.02 6.23 1.17 0.94
Corn grits 77.13 18.70 4.13 4.09 1.22 0.17Shelled corn 93.01 3.69 3.50 1.10 0.09 0.03
Rootcrops
Camote 71.85 16.76 11.17 14.16 5.51 2.72
Cassava 41.63 39.61 17.91 6.34 5.51 1.91
Gabi 56.69 32.81 10.50 5.59 3.74 0.85
White Potato 96.59 0.77 2.56 10.17 0.08 0.16
Bought OwnProduced
Received
2008-2009 SFD

7/21/2019 Food Demand Survey Philippines: SFD Presentation of Results_Background to Preliminaries1
http://slidepdf.com/reader/full/food-demand-survey-philippines-sfd-presentation-of-resultsbackground-to-preliminaries1 44/87
www.bas.gov.ph Philippines’ Bureau of Agricultural Statistics
Table 8. Percentage of households by source of food eaten and commodity,
Philippines, 2012
Commodity BoughtOwn
ProducedGiven
Vegetables, Legumes and Condiments
Ampalaya 88.49 7.20 4.19 32.80 3.89 1.53
Eggplant 83.62 11.69 4.39 43.33 7.08 2.36
Chayote 85.71 9.08 5.06 14.87 1.70 0.52
Gourd (upo) 72.34 14.21 12.72
Squash 83.81 9.49 6.48 26.39 3.63 2.15
Okra 79.33 15.29 5.38 19.33 5.58 1.77
Carrots 96.71 0.62 2.58
Cabbage 96.12 0.96 2.52 17.64 0.21 0.28
Pechay 90.58 6.69 2.63 16.78 1.14 0.45
Stringbeans 79.20 15.50 5.29 32.00 6.67 1.85
Habitchuelas 87.29 7.82 4.91 4.36 0.24 0.11
Mongo 93.56 3.01 3.28 21.24 0.86 0.44
Tomato 93.80 3.08 2.85 57.14 1.80 1.07
Onion 97.20 1.01 1.65 75.37 0.75 1.04Garlic 98.35 0.56 1.01 73.22 0.35 0.69
BoughtOwn
ProducedReceived
2008-2009 SFD
Table 8 Percentage of households by source of food eaten and commodity

7/21/2019 Food Demand Survey Philippines: SFD Presentation of Results_Background to Preliminaries1
http://slidepdf.com/reader/full/food-demand-survey-philippines-sfd-presentation-of-resultsbackground-to-preliminaries1 45/87
www.bas.gov.ph Philippines’ Bureau of Agricultural Statistics
Table 8. Percentage of households by source of food eaten and commodity,
Philippines, 2012
Commodity BoughtOwn
ProducedGiven
Fruits Banana (except saba) 79.21 14.35 6.30 46.95 12.19 4.58
Saba 43.02 39.82 17.19
Mango 87.53 4.22 7.39 15.85 1.78 1.88
Pineapple 78.63 8.89 12.24 4.53 1.21 0.88
Papaya (ripe) 32.49 49.71 17.20 3.45 5.48 1.83
Calamansi 74.03 16.26 9.20
Livestock and Poultry Products
Pork 97.06 0.39 2.46 62.18 0.42 1.22
Beef 95.31 0.41 4.18 11.12 0.03 0.25
Carabeef 92.64 1.25 6.11 1.63 0.01 0.10
Chevon (goat) 48.90 28.00 20.94 0.21 0.07 0.06
Chicken 88.47 9.17 2.45 47.95 6.84 0.84
Duck 32.90 60.24 6.86
Chicken Egg 93.92 5.59 0.57 69.44 4.77 0.35
Duck Egg 67.17 25.24 6.10
Fresh/ pasteurized milk 97.19 0.90 1.68 - 0.01 0.04
BoughtOwn
ProducedReceived
2008-2009 SFD
Table 8 Percentage of households by source of food eaten and commodity
7/21/2019 Food Demand Survey Philippines: SFD Presentation of Results_Background to Preliminaries1
http://slidepdf.com/reader/full/food-demand-survey-philippines-sfd-presentation-of-resultsbackground-to-preliminaries1 46/87
www.bas.gov.ph Philippines’ Bureau of Agricultural Statistics
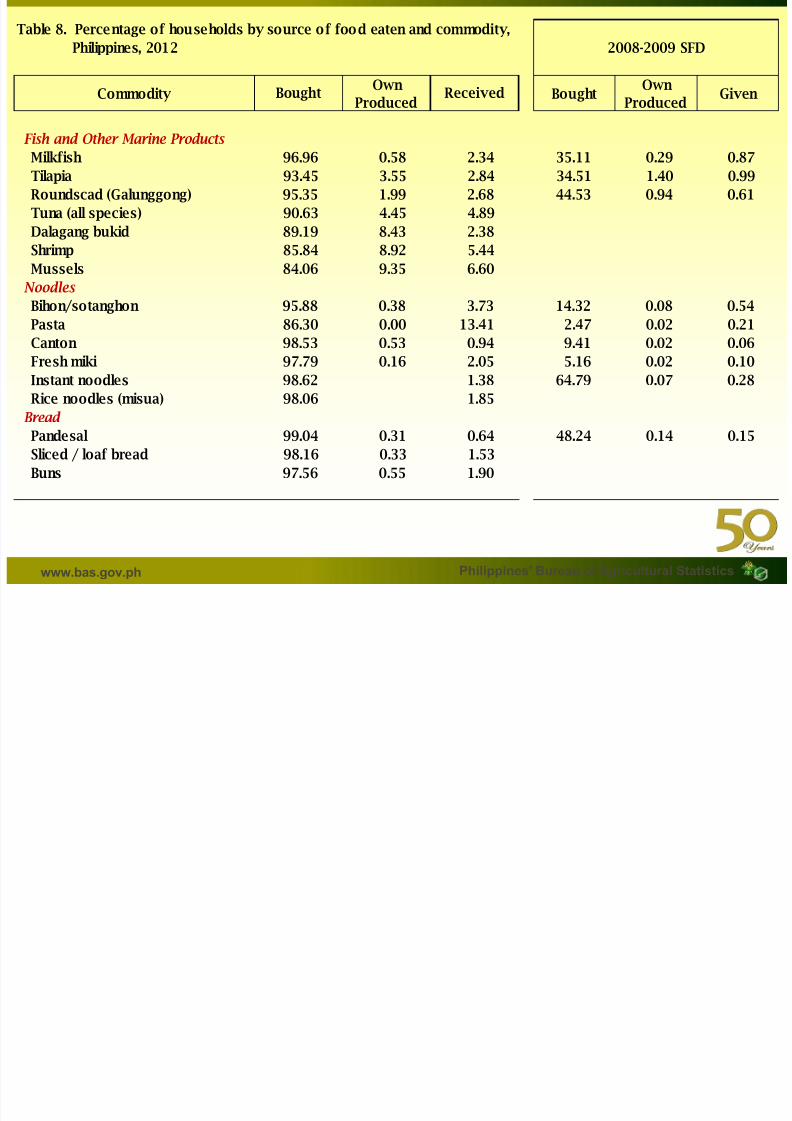
Table 8. Percentage of households by source of food eaten and commodity,
Philippines, 2012
Commodity BoughtOwn
ProducedGiven
Fish and Other Marine Products Milkfish 96.96 0.58 2.34 35.11 0.29 0.87
Tilapia 93.45 3.55 2.84 34.51 1.40 0.99
Roundscad (Galunggong) 95.35 1.99 2.68 44.53 0.94 0.61
Tuna (all species) 90.63 4.45 4.89
Dalagang bukid 89.19 8.43 2.38
Shrimp 85.84 8.92 5.44
Mussels 84.06 9.35 6.60
Noodles
Bihon/sotanghon 95.88 0.38 3.73 14.32 0.08 0.54
Pasta 86.30 0.00 13.41 2.47 0.02 0.21
Canton 98.53 0.53 0.94 9.41 0.02 0.06
Fresh miki 97.79 0.16 2.05 5.16 0.02 0.10
Instant noodles 98.62 1.38 64.79 0.07 0.28
Rice noodles (misua) 98.06 1.85
Bread Pandesal 99.04 0.31 0.64 48.24 0.14 0.15
Sliced / loaf bread 98.16 0.33 1.53
Buns 97.56 0.55 1.90
BoughtOwn
ProducedReceived
2008-2009 SFD
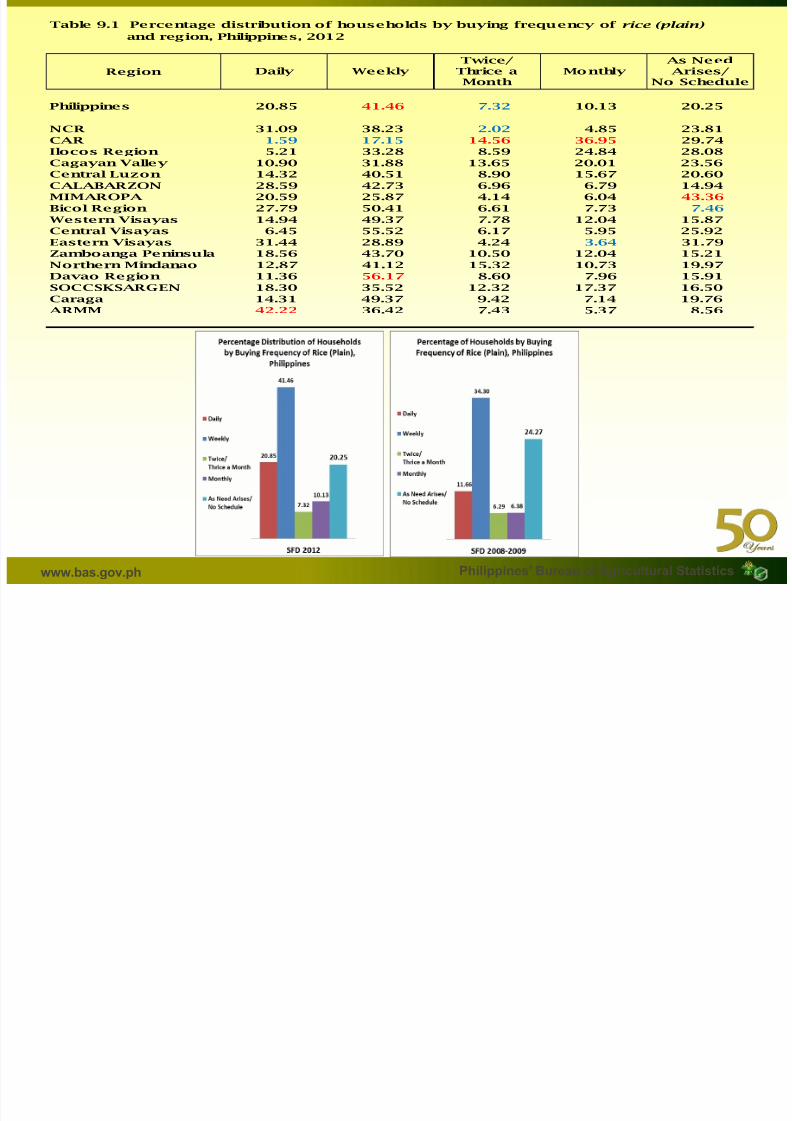
Table 9.1 Percentage distribution of households by buying frequency of rice (plain)
7/21/2019 Food Demand Survey Philippines: SFD Presentation of Results_Background to Preliminaries1
http://slidepdf.com/reader/full/food-demand-survey-philippines-sfd-presentation-of-resultsbackground-to-preliminaries1 47/87
www.bas.gov.ph Philippines’ Bureau of Agricultural Statistics
and region, Philippines, 2012
Region
Philippines 20.85 41.46 7.32 10.13 20.25
NCR 31.09 38.23 2.02 4.85 23.81
CAR 1.59 17.15 14.56 36.95 29.74Ilocos Region 5.21 33.28 8.59 24.84 28.08
Cagayan Valley 10.90 31.88 13.65 20.01 23.56
Central Luzon 14.32 40.51 8.90 15.67 20.60
CALABARZON 28.59 42.73 6.96 6.79 14.94
MIMAROPA 20.59 25.87 4.14 6.04 43.36
Bicol Region 27.79 50.41 6.61 7.73 7.46
Western Visayas 14.94 49.37 7.78 12.04 15.87
Central Visayas 6.45 55.52 6.17 5.95 25.92
Eastern Visayas 31.44 28.89 4.24 3.64 31.79
Zamboanga Peninsula 18.56 43.70 10.50 12.04 15.21
Northern Mindanao 12.87 41.12 15.32 10.73 19.97
Davao Region 11.36 56.17 8.60 7.96 15.91
SOCCSKSARGEN 18.30 35.52 12.32 17.37 16.50
Caraga 14.31 49.37 9.42 7.14 19.76
ARMM 42.22 36.42 7.43 5.37 8.56
Daily WeeklyTwice/
Thrice aMonth
MonthlyAs NeedArises/
No Schedule
Table 9.2 Percentage distribution of households by buying frequency of corn in cob
and region, Philippines, 2012

7/21/2019 Food Demand Survey Philippines: SFD Presentation of Results_Background to Preliminaries1
http://slidepdf.com/reader/full/food-demand-survey-philippines-sfd-presentation-of-resultsbackground-to-preliminaries1 48/87
www.bas.gov.ph Philippines’ Bureau of Agricultural Statistics
and region, Philippines, 2012
Region
Philippines 1.19 16.53 3.37 0.78 78.12
NCR 0.29 4.90 94.80
CAR 12.99 4.40 82.61
Ilocos Region 0.82 9.33 1.21 88.65Cagayan Valley 2.10 3.01 2.88 92.02
Central Luzon 1.97 41.37 2.71 1.45 52.51
CALABARZON 10.50 8.47 1.09 79.94
MIMAROPA 3.45 1.28 95.26
Bicol Region 33.48 66.52
Western Visayas 2.14 5.08 2.82 89.96
Central Visayas 5.74 94.26
Eastern Visayas 0.27 99.73
Zamboanga Peninsula 5.69 17.33 76.98
Northern Mindanao 6.90 93.10
Davao Region 9.02 90.98
SOCCSKSARGEN 14.87 6.23 11.35 67.56Caraga 26.50 73.50
ARMM 7.54 92.46
Daily WeeklyTwice/
Thrice aMonth
MonthlyAs NeedArises/
No Schedule
Table 9.3 Percentage distribution of households by buying frequency of corn grits
and region, Philippines, 2012

7/21/2019 Food Demand Survey Philippines: SFD Presentation of Results_Background to Preliminaries1
http://slidepdf.com/reader/full/food-demand-survey-philippines-sfd-presentation-of-resultsbackground-to-preliminaries1 49/87
www.bas.gov.ph Philippines’ Bureau of Agricultural Statistics
g pp
Region
Philippines 8.24 48.70 6.69 3.18 33.19
NCR 100.00
CAR 14.66 16.39 68.95
Ilocos Region 61.13 38.87Cagayan Valley 17.47 82.53Central Luzon
CALABARZON
MIMAROPA 32.44 67.56Bicol Region 100.00
Western Visayas 8.70 72.93 17.30 1.07Central Visayas 7.53 54.11 6.57 2.12 29.67
Eastern Visayas 23.24 5.25 71.50
Zamboanga Peninsula 9.38 44.46 5.56 9.47 31.14Northern Mindanao 6.12 44.83 10.95 1.60 36.49
Davao Region 8.06 46.39 6.27 1.03 38.25SOCCSKSARGEN 2.74 52.88 8.21 2.21 33.96
Caraga 17.23 40.98 6.44 1.49 33.86ARMM 12.21 64.39 23.40
Daily WeeklyTwice/
Thrice aMonth
MonthlyAs NeedArises/
No Schedule
Table 9.4 Percentage distribution of households by buying frequency of shelled corn
and region, Philippines, 2012

7/21/2019 Food Demand Survey Philippines: SFD Presentation of Results_Background to Preliminaries1
http://slidepdf.com/reader/full/food-demand-survey-philippines-sfd-presentation-of-resultsbackground-to-preliminaries1 50/87
www.bas.gov.ph Philippines’ Bureau of Agricultural Statistics
g pp
Region
Philippines 10.54 2.38 87.08
NCR 100.00
CAR 100.00
Ilocos Region 0.85 3.32 95.84Cagayan Valley 100.00
Central Luzon 36.45 3.67 59.88
CALABARZON 13.90 86.10
MIMAROPA 7.96 8.12 83.92
Bicol Region 4.06 95.94
Western Visayas 100.00
Central Visayas 14.22 85.78
Eastern Visayas
Zamboanga Peninsula 100.00
Northern Mindanao
Davao Region 100.00
SOCCSKSARGENCaraga 100.00
ARMM 14.50 85.50
Daily WeeklyTwice/
Thrice aMonth
MonthlyAs NeedArises/
No Schedule
Table 9.5 Percentage distribution of households by buying frequency of camote
and region, Philippines, 2012

7/21/2019 Food Demand Survey Philippines: SFD Presentation of Results_Background to Preliminaries1
http://slidepdf.com/reader/full/food-demand-survey-philippines-sfd-presentation-of-resultsbackground-to-preliminaries1 51/87
www.bas.gov.ph Philippines’ Bureau of Agricultural Statistics
g , pp ,
Region
Philippines 1.82 22.97 7.02 1.84 66.36
NCR 1.35 22.19 0.17 0.36 75.93
CAR 15.01 5.39 1.17 78.42Ilocos Region 1.23 15.73 6.23 2.99 73.82
Cagayan Valley 0.05 24.32 3.87 0.75 71.02
Central Luzon 1.21 36.22 8.23 4.71 49.63
CALABARZON 3.56 15.91 15.47 65.06
MIMAROPA 0.61 21.49 10.54 0.07 67.30
Bicol Region 0.55 33.28 5.84 1.32 59.01
Western Visayas 0.10 9.03 4.61 1.72 84.55
Central Visayas 4.95 26.98 5.71 62.36
Eastern Visayas 2.93 20.45 2.59 1.60 72.43
Zamboanga Peninsula 1.44 11.45 4.09 83.02
Northern Mindanao 6.08 19.29 7.15 2.28 65.20
Davao Region 24.40 75.60SOCCSKSARGEN 4.16 18.50 10.78 2.78 63.77
Caraga 1.27 26.77 17.40 10.37 44.19
ARMM 3.73 40.31 9.05 1.20 45.71
Daily WeeklyTwice/
Thrice aMonth
MonthlyAs NeedArises/
No Schedule
Table 9.6 Percentage distribution of households by buying frequency of cassava
and region, Philippines, 2012

7/21/2019 Food Demand Survey Philippines: SFD Presentation of Results_Background to Preliminaries1
http://slidepdf.com/reader/full/food-demand-survey-philippines-sfd-presentation-of-resultsbackground-to-preliminaries1 52/87
www.bas.gov.ph Philippines’ Bureau of Agricultural Statistics
g pp
Region
Philippines 6.11 21.13 7.33 1.28 64.14
NCR 5.37 94.63
CAR 20.56 79.44Ilocos Region 7.15 92.85
Cagayan Valley 8.46 7.09 84.45
Central Luzon 25.73 7.62 66.65
CALABARZON 2.64 10.51 7.40 79.45
MIMAROPA 29.36 36.46 34.18
Bicol Region 1.64 24.61 10.13 63.62
Western Visayas 5.93 4.84 3.15 86.08
Central Visayas 18.69 81.31
Eastern Visayas 1.97 12.92 3.93 81.17
Zamboanga Peninsula 23.59 76.41
Northern Mindanao 49.62 2.89 47.49
Davao Region 2.92 9.71 2.92 84.45SOCCSKSARGEN 32.52 15.53 3.54 48.42
Caraga 35.55 9.22 10.09 45.13
ARMM 30.75 41.77 7.03 20.45
Daily WeeklyTwice/ Thrice aMonth
MonthlyAs NeedArises/
No Schedule
Table 9.7 Percentage distribution of households by buying frequency of gabi
and region, Philippines, 2012

7/21/2019 Food Demand Survey Philippines: SFD Presentation of Results_Background to Preliminaries1
http://slidepdf.com/reader/full/food-demand-survey-philippines-sfd-presentation-of-resultsbackground-to-preliminaries1 53/87
www.bas.gov.ph Philippines’ Bureau of Agricultural Statistics
Region
Philippines 0.99 19.04 6.81 0.76 72.40
NCR 1.72 5.02 93.26
CAR 23.33 9.33 1.38 65.96
Ilocos Region 29.63 15.71 54.65
Cagayan Valley 31.45 4.84 0.26 63.44
Central Luzon 2.84 26.75 4.16 0.45 65.79
CALABARZON 12.24 7.02 80.74
MIMAROPA 1.43 10.93 87.63
Bicol Region 1.30 9.05 15.34 9.03 65.28
Western Visayas 3.75 10.31 85.93
Central Visayas 0.10 8.38 4.66 86.86
Eastern Visayas 20.29 2.69 3.86 73.16
Zamboanga Peninsula 3.37 27.54 4.89 64.20
Northern Mindanao 31.82 3.14 65.04
Davao Region 0.61 14.29 2.17 82.94SOCCSKSARGEN 9.49 36.58 3.84 50.09
Caraga 18.71 2.70 78.59
ARMM 4.98 49.17 2.87 42.98
Daily WeeklyTwice/ Thrice a
Month
MonthlyAs NeedArises/
No Schedule
Table 9.8 Percentage distribution of households by buying frequency of white potato
and region, Philippines, 2012

7/21/2019 Food Demand Survey Philippines: SFD Presentation of Results_Background to Preliminaries1
http://slidepdf.com/reader/full/food-demand-survey-philippines-sfd-presentation-of-resultsbackground-to-preliminaries1 54/87
www.bas.gov.ph Philippines’ Bureau of Agricultural Statistics
Region
Philippines 1.34 22.13 6.64 1.34 68.55
NCR 0.25 16.16 83.59
CAR 0.99 24.77 16.06 0.81 57.36
Ilocos Region 1.33 27.79 13.09 0.20 57.59
Cagayan Valley 0.11 20.26 2.85 0.89 75.90
Central Luzon 1.15 30.37 2.66 1.64 64.18
CALABARZON 2.08 20.52 16.29 3.13 57.99
MIMAROPA 12.62 87.38
Bicol Region 4.69 34.15 4.04 57.13
Western Visayas 6.88 5.23 3.34 84.54
Central Visayas 15.46 84.54
Eastern Visayas 50.00 50.00
Zamboanga Peninsula 8.72 91.28
Northern Mindanao 6.54 24.96 4.48 8.50 55.52
Davao Region 2.22 7.82 89.95SOCCSKSARGEN 4.60 11.62 7.17 2.89 73.74
Caraga 1.93 55.08 1.13 6.96 34.90
ARMM
Daily Weekly
Twice/
Thrice aMonth
Monthly
As Need
Arises/ No Schedule
Table 9.9 Percentage distribution of households by buying frequency of ampalaya
and region, Philippines, 2012

7/21/2019 Food Demand Survey Philippines: SFD Presentation of Results_Background to Preliminaries1
http://slidepdf.com/reader/full/food-demand-survey-philippines-sfd-presentation-of-resultsbackground-to-preliminaries1 55/87
www.bas.gov.ph Philippines’ Bureau of Agricultural Statistics
Region
Philippines 1.69 28.44 6.44 0.74 62.69
NCR 0.74 29.65 1.30 68.31
CAR 2.79 36.55 7.05 1.36 52.25
Ilocos Region 0.37 18.17 14.18 1.66 65.62Cagayan Valley 0.68 29.77 5.37 0.64 63.54
Central Luzon 2.00 41.81 11.09 0.94 44.17
CALABARZON 4.55 19.16 13.56 1.61 61.11
MIMAROPA 1.81 5.79 9.79 0.29 82.32
Bicol Region 1.30 43.74 3.93 0.37 50.66
Western Visayas 16.20 4.87 1.68 77.26
Central Visayas 1.67 30.26 3.28 64.79
Eastern Visayas 2.50 16.93 0.47 80.09
Zamboanga Peninsula 31.24 4.38 1.74 62.64
Northern Mindanao 0.04 41.84 3.77 0.20 54.14
Davao Region 0.44 17.78 1.80 0.11 79.87
SOCCSKSARGEN 3.46 25.06 4.86 0.70 65.92Caraga 2.67 43.13 7.98 1.11 45.13
ARMM 9.61 31.02 10.93 0.36 48.08
Daily WeeklyTwice/ Thrice aMonth
MonthlyAs NeedArises/
No Schedule
Table 9.10 Percentage distribution of households by buying frequency of eggplant
and region, Philippines, 2012

7/21/2019 Food Demand Survey Philippines: SFD Presentation of Results_Background to Preliminaries1
http://slidepdf.com/reader/full/food-demand-survey-philippines-sfd-presentation-of-resultsbackground-to-preliminaries1 56/87
www.bas.gov.ph Philippines’ Bureau of Agricultural Statistics
Region
Philippines 2.09 30.34 5.73 0.78 61.07
NCR 1.44 32.29 0.97 0.09 65.21
CAR 2.94 37.01 5.74 0.07 54.24
Ilocos Region 0.39 19.33 21.56 0.39 58.33Cagayan Valley 0.06 33.24 3.11 0.02 63.57
Central Luzon 2.87 37.97 7.26 1.44 50.45
CALABARZON 3.58 28.94 7.68 3.76 56.04
MIMAROPA 7.11 12.60 9.95 70.34
Bicol Region 2.30 48.08 2.16 0.11 47.35
Western Visayas 0.55 15.60 2.98 0.31 80.56
Central Visayas 0.04 34.94 1.39 63.63
Eastern Visayas 2.01 16.84 0.78 80.37
Zamboanga Peninsula 2.18 36.07 2.32 0.10 59.33
Northern Mindanao 0.42 37.15 6.01 1.13 55.28
Davao Region 0.77 27.12 1.54 0.44 70.12
SOCCSKSARGEN 5.84 22.35 6.33 0.61 64.87Caraga 1.57 48.02 5.66 1.04 43.70
ARMM 6.09 30.59 24.40 38.92
Daily WeeklyTwice/
Thrice aMonth
MonthlyAs NeedArises/
No Schedule
Table 9.11 Percentage distribution of households by buying frequency of chayote
and region, Philippines, 2012

7/21/2019 Food Demand Survey Philippines: SFD Presentation of Results_Background to Preliminaries1
http://slidepdf.com/reader/full/food-demand-survey-philippines-sfd-presentation-of-resultsbackground-to-preliminaries1 57/87
www.bas.gov.ph Philippines’ Bureau of Agricultural Statistics
Region
Philippines 1.00 28.26 4.07 1.01 65.66
NCR 1.01 26.46 0.23 1.80 70.50
CAR 1.17 28.01 15.66 55.15
Ilocos Region 7.51 3.48 0.42 88.60Cagayan Valley 0.27 23.99 2.29 0.91 72.54
Central Luzon 35.43 4.19 2.87 57.50
CALABARZON 1.14 29.59 10.44 0.45 58.38
MIMAROPA 2.16 26.27 71.56
Bicol Region 1.29 35.41 7.09 1.95 54.26
Western Visayas 4.37 3.03 2.19 90.41
Central Visayas 27.31 0.10 72.59
Eastern Visayas 0.54 5.88 0.21 93.37
Zamboanga Peninsula 22.94 0.98 76.08
Northern Mindanao 36.64 6.29 57.07
Davao Region 2.17 32.93 2.25 62.65
SOCCSKSARGEN 4.11 17.98 6.34 71.57Caraga 2.38 54.35 3.97 0.91 38.38
ARMM 4.30 23.28 25.08 47.33
Daily WeeklyTwice/
Thrice aMonth
MonthlyAs NeedArises/
No Schedule
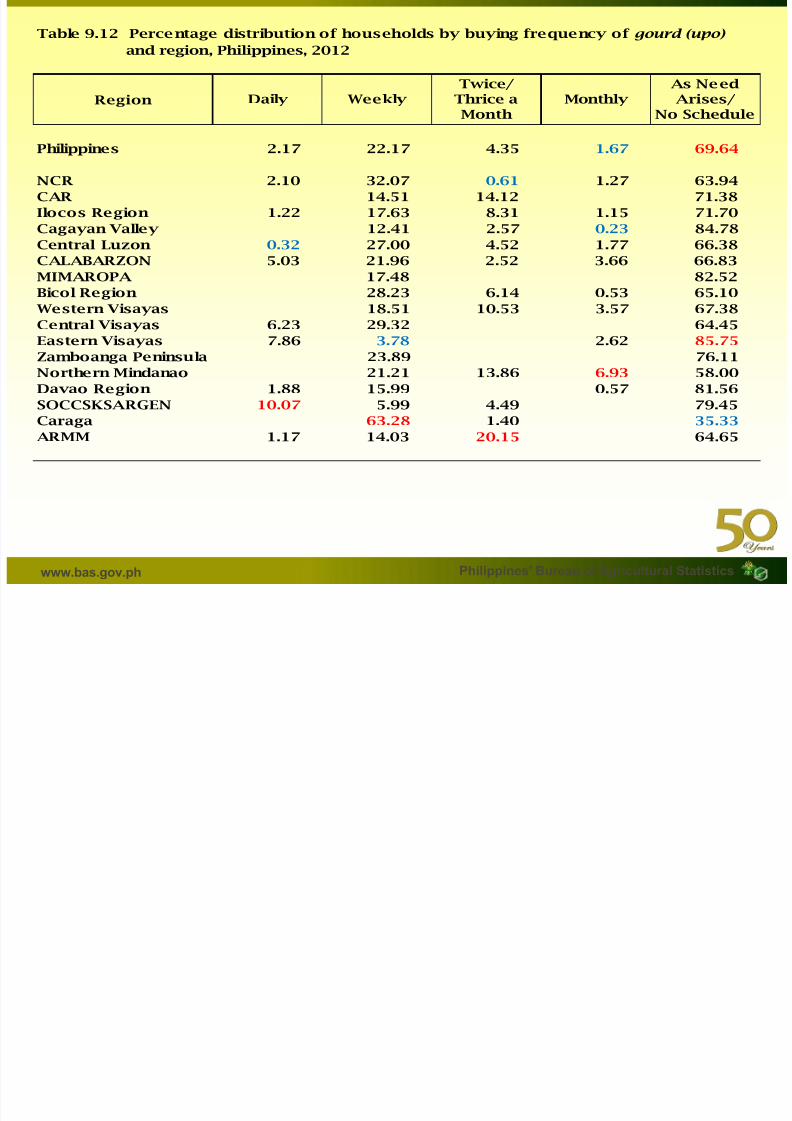
Table 9.12 Percentage distribution of households by buying frequency of gourd (upo)
7/21/2019 Food Demand Survey Philippines: SFD Presentation of Results_Background to Preliminaries1
http://slidepdf.com/reader/full/food-demand-survey-philippines-sfd-presentation-of-resultsbackground-to-preliminaries1 58/87
www.bas.gov.ph Philippines’ Bureau of Agricultural Statistics
and region, Philippines, 2012
Region
Philippines 2.17 22.17 4.35 1.67 69.64
NCR 2.10 32.07 0.61 1.27 63.94
CAR 14.51 14.12 71.38
Ilocos Region 1.22 17.63 8.31 1.15 71.70
Cagayan Valley 12.41 2.57 0.23 84.78
Central Luzon 0.32 27.00 4.52 1.77 66.38
CALABARZON 5.03 21.96 2.52 3.66 66.83
MIMAROPA 17.48 82.52Bicol Region 28.23 6.14 0.53 65.10
Western Visayas 18.51 10.53 3.57 67.38
Central Visayas 6.23 29.32 64.45
Eastern Visayas 7.86 3.78 2.62 85.75
Zamboanga Peninsula 23.89 76.11
Northern Mindanao 21.21 13.86 6.93 58.00
Davao Region 1.88 15.99 0.57 81.56
SOCCSKSARGEN 10.07 5.99 4.49 79.45
Caraga 63.28 1.40 35.33ARMM 1.17 14.03 20.15 64.65
Daily Weekly
Twice/
Thrice a
Month
Monthly
As Need
Arises/
No Schedule
Table 9.13 Percentage distribution of households by buying frequency of squash
and region, Philippines, 2012

7/21/2019 Food Demand Survey Philippines: SFD Presentation of Results_Background to Preliminaries1
http://slidepdf.com/reader/full/food-demand-survey-philippines-sfd-presentation-of-resultsbackground-to-preliminaries1 59/87
www.bas.gov.ph Philippines’ Bureau of Agricultural Statistics
Region
Philippines 2.09 27.10 4.18 0.87 65.77
NCR 0.21 25.24 1.06 0.13 73.36
CAR 4.05 33.71 5.46 0.51 56.27
Ilocos Region 0.26 18.84 8.10 0.28 72.52Cagayan Valley 1.08 27.99 6.18 0.41 64.34
Central Luzon 1.25 38.22 2.97 1.51 56.05
CALABARZON 5.25 14.90 5.57 0.83 73.46
MIMAROPA 2.48 8.25 4.85 4.69 79.73
Bicol Region 0.47 36.22 6.50 4.00 52.81
Western Visayas 0.82 16.91 4.29 0.38 77.60
Central Visayas 4.60 37.59 1.68 56.12
Eastern Visayas 3.49 17.29 0.35 78.86
Zamboanga Peninsula 0.56 39.43 2.22 0.10 57.68
Northern Mindanao 0.01 38.13 5.53 1.95 54.38
Davao Region 1.09 25.35 1.93 1.21 70.42
SOCCSKSARGEN 5.24 24.10 7.98 0.66 62.03Caraga 4.05 49.30 5.01 0.51 41.13
ARMM 4.09 25.48 20.09 1.10 49.24
Daily WeeklyTwice/
Thrice aMonth
MonthlyAs NeedArises/
No Schedule
Table 9.14 Percentage distribution of households by buying frequency of okra
and region, Philippines, 2012

7/21/2019 Food Demand Survey Philippines: SFD Presentation of Results_Background to Preliminaries1
http://slidepdf.com/reader/full/food-demand-survey-philippines-sfd-presentation-of-resultsbackground-to-preliminaries1 60/87
www.bas.gov.ph Philippines’ Bureau of Agricultural Statistics
Region
Philippines 2.01 28.23 4.71 0.29 64.76
NCR 0.49 25.38 1.32 0.17 72.65
CAR 4.73 42.23 3.54 0.99 48.51
Ilocos Region 24.70 9.11 0.55 65.64
Cagayan Valley 0.12 28.55 4.81 66.52
Central Luzon 4.42 48.77 5.51 1.28 40.01
CALABARZON 2.95 21.12 3.77 0.11 72.05
MIMAROPA 2.61 3.09 12.48 81.81
Bicol Region 39.70 13.16 47.14
Western Visayas 1.69 16.77 3.23 0.22 78.08
Central Visayas 4.10 26.00 1.66 68.24
Eastern Visayas 3.39 19.71 5.07 71.83
Zamboanga Peninsula 1.33 44.09 1.43 53.15
Northern Mindanao 0.02 36.39 6.44 0.46 56.69
Davao Region 0.78 18.03 1.62 0.12 79.46
SOCCSKSARGEN 8.19 25.94 5.42 60.45
Caraga 46.12 11.71 42.17ARMM 3.54 39.50 20.07 36.89
Daily Weekly
Twice/
Thrice a
Month
Monthly
As Need
Arises/
No Schedule
Table 9 15 Percentage distribution of households by buying frequency of carrots

7/21/2019 Food Demand Survey Philippines: SFD Presentation of Results_Background to Preliminaries1
http://slidepdf.com/reader/full/food-demand-survey-philippines-sfd-presentation-of-resultsbackground-to-preliminaries1 61/87
www.bas.gov.ph Philippines’ Bureau of Agricultural Statistics
Table 9.15 Percentage distribution of households by buying frequency of carrots
and region, Philippines, 2012
Region
Philippines 0.56 26.98 4.66 1.13 66.67
NCR 0.49 27.24 0.23 72.04
CAR 27.80 0.25 1.18 70.77
Ilocos Region 15.61 0.88 0.35 83.16
Cagayan Valley 10.04 6.69 1.28 81.98
Central Luzon 35.47 13.65 2.16 48.72
CALABARZON 0.66 18.06 6.25 2.07 72.96
MIMAROPA 46.05 3.64 50.30Bicol Region 0.17 31.79 7.82 1.20 59.02
Western Visayas 0.22 13.63 4.27 2.33 79.56
Central Visayas 32.90 5.05 1.94 60.10
Eastern Visayas 1.98 0.88 97.14
Zamboanga Peninsula 32.96 67.04
Northern Mindanao 51.82 3.52 44.66
Davao Region 2.81 22.59 7.18 0.91 66.52
SOCCSKSARGEN 5.19 8.82 7.77 2.09 76.13
Caraga 81.83 2.29 15.88ARMM 16.56 83.44
Daily WeeklyTwice/
Thrice aMonth
MonthlyAs NeedArises/
No Schedule
Table 9.16 Percentage distribution of households by buying frequency of cabbage
and region, Philippines, 2012

7/21/2019 Food Demand Survey Philippines: SFD Presentation of Results_Background to Preliminaries1
http://slidepdf.com/reader/full/food-demand-survey-philippines-sfd-presentation-of-resultsbackground-to-preliminaries1 62/87
www.bas.gov.ph Philippines’ Bureau of Agricultural Statistics
Region
Philippines 1.03 27.04 5.18 0.86 65.88
NCR 0.71 28.44 0.13 70.72
CAR 2.60 36.19 4.99 1.26 54.96
Ilocos Region 12.47 3.12 0.59 83.82
Cagayan Valley 23.24 2.66 0.02 74.08Central Luzon 0.09 38.20 9.46 1.13 51.13
CALABARZON 2.88 21.26 13.85 2.55 59.46
MIMAROPA 34.81 1.25 63.94
Bicol Region 0.10 26.01 6.44 0.45 67.00
Western Visayas 8.60 5.22 1.70 84.48
Central Visayas 3.42 36.30 2.08 58.20
Eastern Visayas 8.55 1.56 89.89
Zamboanga Peninsula 1.22 32.76 66.02
Northern Mindanao 0.04 31.76 8.80 59.40
Davao Region 0.28 24.74 3.80 2.21 68.97
SOCCSKSARGEN 3.07 6.66 6.91 83.35
Caraga 1.13 70.45 3.01 1.68 23.73
ARMM 13.14 18.00 68.85
Daily Weekly
Twice/
Thrice aMonth
Monthly
As Need
Arises/ No Schedule
Table 9.17 Percentage distribution of households by buying frequency of pechay
and region, Philippines, 2012

7/21/2019 Food Demand Survey Philippines: SFD Presentation of Results_Background to Preliminaries1
http://slidepdf.com/reader/full/food-demand-survey-philippines-sfd-presentation-of-resultsbackground-to-preliminaries1 63/87
www.bas.gov.ph Philippines’ Bureau of Agricultural Statistics
Region
Philippines 1.02 29.21 4.19 1.02 64.56
NCR 0.37 21.93 2.25 75.45
CAR 2.93 37.68 2.50 0.92 55.97
Ilocos Region 24.09 10.55 0.37 64.99Cagayan Valley 0.01 30.61 2.07 0.14 67.16
Central Luzon 0.23 40.93 4.81 0.57 53.46
CALABARZON 0.59 26.07 2.12 4.42 66.80
MIMAROPA 0.47 30.35 69.18
Bicol Region 1.49 30.06 2.40 66.05
Western Visayas 1.71 16.38 6.87 2.47 72.57
Central Visayas 32.14 2.53 65.34
Eastern Visayas 6.18 11.44 1.55 80.83
Zamboanga Peninsula 1.85 22.54 1.82 73.79
Northern Mindanao 38.77 6.85 54.38
Davao Region 31.58 2.62 0.52 65.28
SOCCSKSARGEN 2.36 20.11 12.95 0.51 64.07
Caraga 1.35 40.54 5.95 1.59 50.56
ARMM 12.83 35.55 10.44 41.18
Daily WeeklyTwice/
Thrice aMonth
MonthlyAs NeedArises/
No Schedule
Table 9.18 Percentage distribution of households by buying frequency of stringbeans
and region, Philippines, 2012

7/21/2019 Food Demand Survey Philippines: SFD Presentation of Results_Background to Preliminaries1
http://slidepdf.com/reader/full/food-demand-survey-philippines-sfd-presentation-of-resultsbackground-to-preliminaries1 64/87
www.bas.gov.ph Philippines’ Bureau of Agricultural Statistics
Region
Philippines 1.18 25.65 4.54 0.62 68.01
NCR 21.84 78.16
CAR 1.50 36.35 5.70 1.22 55.23
Ilocos Region 0.23 21.51 11.23 1.26 65.77Cagayan Valley 0.08 30.31 3.43 66.18
Central Luzon 0.84 34.95 4.31 1.57 58.33
CALABARZON 1.10 23.26 3.19 0.66 71.79
MIMAROPA 2.26 12.58 10.14 75.02
Bicol Region 0.54 34.68 4.02 1.59 59.18
Western Visayas 2.60 10.97 5.90 0.49 80.04
Central Visayas 1.62 28.25 4.17 0.10 65.86
Eastern Visayas 11.14 1.12 87.74
Zamboanga Peninsula 2.34 29.61 2.89 65.16
Northern Mindanao 2.04 32.63 5.31 0.59 59.43
Davao Region 0.43 22.62 2.24 0.37 74.35
SOCCSKSARGEN 2.21 24.53 7.18 1.40 64.68
Caraga 0.68 47.41 1.94 0.55 49.43
ARMM 5.89 27.43 16.42 50.26
Daily WeeklyTwice/
Thrice aMonth
MonthlyAs NeedArises/
No Schedule
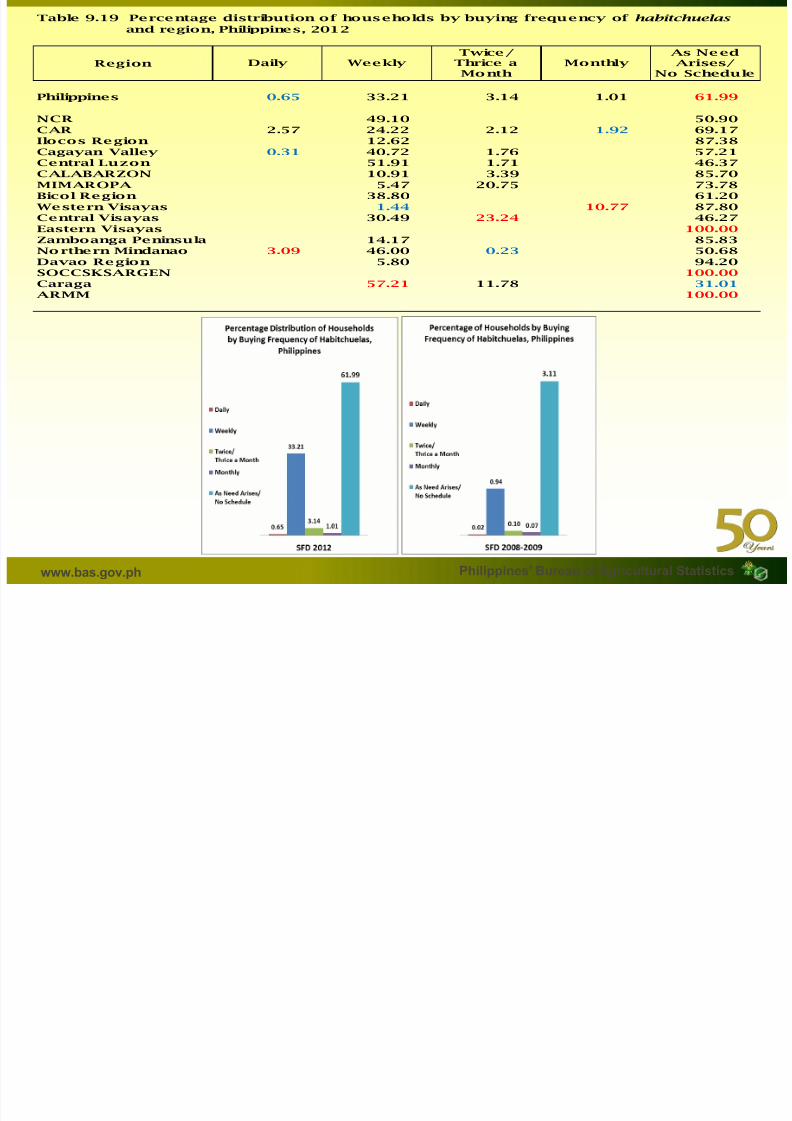
Table 9.19 Percentage distribution of households by buying frequency of habitchuelas
and region, Philippines, 2012
7/21/2019 Food Demand Survey Philippines: SFD Presentation of Results_Background to Preliminaries1
http://slidepdf.com/reader/full/food-demand-survey-philippines-sfd-presentation-of-resultsbackground-to-preliminaries1 65/87
www.bas.gov.ph Philippines’ Bureau of Agricultural Statistics
Region
Philippines 0.65 33.21 3.14 1.01 61.99
NCR 49.10 50.90
CAR 2.57 24.22 2.12 1.92 69.17Ilocos Region 12.62 87.38
Cagayan Valley 0.31 40.72 1.76 57.21Central Luzon 51.91 1.71 46.37
CALABARZON 10.91 3.39 85.70
MIMAROPA 5.47 20.75 73.78Bicol Region 38.80 61.20
Western Visayas 1.44 10.77 87.80Central Visayas 30.49 23.24 46.27
Eastern Visayas 100.00
Zamboanga Peninsula 14.17 85.83Northern Mindanao 3.09 46.00 0.23 50.68
Davao Region 5.80 94.20SOCCSKSARGEN 100.00
Caraga 57.21 11.78 31.01ARMM 100.00
Daily WeeklyTwice/
Thrice aMonth
MonthlyAs NeedArises/
No Schedule
Table 9.20 Percentage distribution of households by buying frequency of mongo
and region, Philippines, 2012

7/21/2019 Food Demand Survey Philippines: SFD Presentation of Results_Background to Preliminaries1
http://slidepdf.com/reader/full/food-demand-survey-philippines-sfd-presentation-of-resultsbackground-to-preliminaries1 66/87
www.bas.gov.ph Philippines’ Bureau of Agricultural Statistics
Region
Philippines 1.14 23.01 6.54 1.42 67.90 a/
NCR 0.76 28.33 0.57 0.63 69.71
CAR 1.37 12.76 9.32 2.77 73.79
Ilocos Region 8.15 22.99 0.27 68.60
Cagayan Valley 23.84 4.22 1.65 70.28 0.01Central Luzon 0.62 32.44 5.30 2.55 59.09
CALABARZON 2.65 22.99 8.58 4.22 61.57
MIMAROPA 1.46 9.93 20.48 68.13
Bicol Region 27.46 6.53 66.01
Western Visayas 0.26 13.84 3.43 1.86 80.61
Central Visayas 3.96 36.53 3.44 0.27 55.80
Eastern Visayas 5.67 2.74 91.59
Zamboanga Peninsula 20.91 2.62 3.27 73.21
Northern Mindanao 27.94 5.24 66.82
Davao Region 10.05 2.27 1.26 86.42
SOCCSKSARGEN 1.47 19.81 7.95 1.26 69.50
Caraga 41.54 6.05 0.40 52.00ARMM 5.63 17.41 9.95 1.81 65.20
a/ Less than 0.01
Twice a
WeekDaily Weekly
Twice/
Thrice a
Month
Monthly
As Need
Arises/
No Schedule
Table 9.21 Percentage distribution of households by buying frequency of tomato
and region, Philippines, 2012

7/21/2019 Food Demand Survey Philippines: SFD Presentation of Results_Background to Preliminaries1
http://slidepdf.com/reader/full/food-demand-survey-philippines-sfd-presentation-of-resultsbackground-to-preliminaries1 67/87
www.bas.gov.ph Philippines’ Bureau of Agricultural Statistics
Region
Philippines 5.27 41.21 4.56 0.99 47.96 a/
NCR 2.32 47.80 4.80 2.11 42.97
CAR 2.46 40.88 5.72 1.87 49.07
Ilocos Region 1.53 30.97 15.83 0.72 50.95Cagayan Valley 0.71 32.69 1.40 0.25 64.94 a/
Central Luzon 2.79 46.47 7.62 0.53 42.58
CALABARZON 8.35 35.62 3.51 1.79 50.73
MIMAROPA 0.99 19.91 3.23 75.86
Bicol Region 6.46 67.30 1.33 0.53 24.38
Western Visayas 5.21 44.17 1.94 0.69 47.99
Central Visayas 5.17 28.38 2.03 64.41
Eastern Visayas 3.02 25.76 2.18 0.65 68.39
Zamboanga Peninsula 5.78 49.40 3.00 0.82 40.99
Northern Mindanao 2.66 45.33 5.14 46.86
Davao Region 4.10 30.09 1.37 0.44 64.00
SOCCSKSARGEN 11.27 40.77 5.02 0.95 41.99Caraga 4.56 51.48 4.39 0.45 39.11
ARMM 32.66 31.14 4.11 0.49 31.60
a/ Less than 0.01
Twice aWeek
Daily Weekly
Twice/
Thrice aMonth
Monthly
As Need
Arises/No Schedule
Table 9.22 Percentage distribution of households by buying frequency of onion
and region, Philippines, 2012

7/21/2019 Food Demand Survey Philippines: SFD Presentation of Results_Background to Preliminaries1
http://slidepdf.com/reader/full/food-demand-survey-philippines-sfd-presentation-of-resultsbackground-to-preliminaries1 68/87
www.bas.gov.ph Philippines’ Bureau of Agricultural Statistics
Region
Philippines 5.20 42.78 4.74 1.54 45.75
NCR 2.26 47.22 5.87 2.08 42.57
CAR 4.37 44.96 4.28 6.32 40.06Ilocos Region 1.15 32.81 11.72 2.38 51.95
Cagayan Valley 1.84 34.22 6.87 5.56 51.51Central Luzon 2.05 44.44 6.51 1.56 45.44
CALABARZON 6.57 35.22 3.66 1.99 52.57
MIMAROPA 3.71 30.96 5.95 0.77 58.61Bicol Region 8.41 75.27 3.04 0.41 12.87
Western Visayas 4.52 43.00 2.57 1.33 48.58Central Visayas 3.93 35.98 2.78 0.02 57.29
Eastern Visayas 8.66 20.36 1.26 0.71 69.02
Zamboanga Peninsula 3.77 49.34 3.03 0.52 43.34Northern Mindanao 3.96 50.32 4.61 1.09 40.02
Davao Region 3.08 41.38 2.09 0.00 53.45SOCCSKSARGEN 11.80 43.22 5.86 1.52 37.60
Caraga 2.79 58.88 4.30 1.23 32.80ARMM 34.61 26.66 7.49 0.28 30.97
Daily WeeklyTwice/
Thrice aMonth
MonthlyAs NeedArises/
No Schedule
Table 9.23 Percentage distribution of households by buying frequency of garlic
and region, Philippines, 2012
Twice/ As Need

7/21/2019 Food Demand Survey Philippines: SFD Presentation of Results_Background to Preliminaries1
http://slidepdf.com/reader/full/food-demand-survey-philippines-sfd-presentation-of-resultsbackground-to-preliminaries1 69/87
www.bas.gov.ph Philippines’ Bureau of Agricultural Statistics
Region
Philippines 3.97 43.87 4.51 1.52 46.12
NCR 1.96 48.59 5.61 2.40 41.44CAR 3.83 49.19 5.49 3.38 38.10
Ilocos Region 1.22 33.03 8.05 0.56 57.13Cagayan Valley 2.31 32.87 6.50 3.76 54.56
Central Luzon 3.53 44.74 6.75 2.40 42.58CALABARZON 2.90 39.11 4.84 1.41 51.74MIMAROPA 3.01 35.02 1.76 1.39 58.81
Bicol Region 7.21 75.91 3.16 0.81 12.91Western Visayas 4.96 40.39 2.75 1.94 49.96
Central Visayas 2.11 40.73 1.44 0.77 54.96Eastern Visayas 7.02 20.70 1.66 0.45 70.18
Zamboanga Peninsula 2.13 49.55 3.11 0.99 44.23Northern Mindanao 2.58 50.25 4.31 0.60 42.27Davao Region 3.04 39.59 2.22 0.17 54.98
SOCCSKSARGEN 5.89 47.34 5.53 1.21 40.03Caraga 2.96 55.71 4.37 0.89 36.08
ARMM 26.89 29.31 7.24 1.10 35.46
Daily WeeklyTwice/ Thrice aMonth
MonthlyAs NeedArises/
No Schedule
7/21/2019 Food Demand Survey Philippines: SFD Presentation of Results_Background to Preliminaries1
http://slidepdf.com/reader/full/food-demand-survey-philippines-sfd-presentation-of-resultsbackground-to-preliminaries1 70/87
www.bas.gov.ph Philippines’ Bureau of Agricultural Statistics
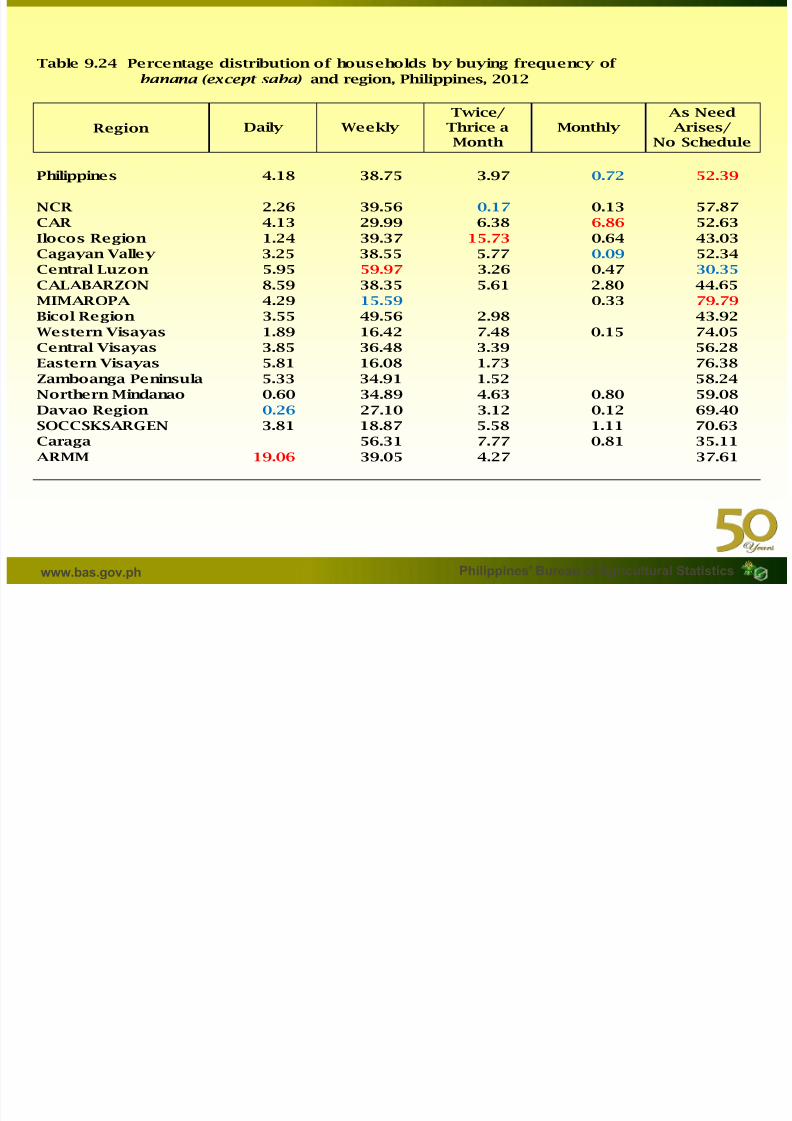
Table 9.24 Percentage distribution of households by buying frequency of
banana (except saba) and region, Philippines, 2012
Region
Philippines 4.18 38.75 3.97 0.72 52.39
NCR 2.26 39.56 0.17 0.13 57.87
CAR 4.13 29.99 6.38 6.86 52.63
Ilocos Region 1.24 39.37 15.73 0.64 43.03
Cagayan Valley 3.25 38.55 5.77 0.09 52.34
Central Luzon 5.95 59.97 3.26 0.47 30.35
CALABARZON 8.59 38.35 5.61 2.80 44.65MIMAROPA 4.29 15.59 0.33 79.79
Bicol Region 3.55 49.56 2.98 43.92
Western Visayas 1.89 16.42 7.48 0.15 74.05
Central Visayas 3.85 36.48 3.39 56.28
Eastern Visayas 5.81 16.08 1.73 76.38
Zamboanga Peninsula 5.33 34.91 1.52 58.24
Northern Mindanao 0.60 34.89 4.63 0.80 59.08
Davao Region 0.26 27.10 3.12 0.12 69.40
SOCCSKSARGEN 3.81 18.87 5.58 1.11 70.63Caraga 56.31 7.77 0.81 35.11
ARMM 19.06 39.05 4.27 37.61
Daily WeeklyTwice/Thrice a
Month
MonthlyAs NeedArises/
No Schedule
Table 9 25 Percentage distribution of households by buying frequency of saba

7/21/2019 Food Demand Survey Philippines: SFD Presentation of Results_Background to Preliminaries1
http://slidepdf.com/reader/full/food-demand-survey-philippines-sfd-presentation-of-resultsbackground-to-preliminaries1 71/87
www.bas.gov.ph Philippines’ Bureau of Agricultural Statistics
Table 9.25 Percentage distribution of households by buying frequency of saba
and region, Philippines, 2012
Region
Philippines 3.13 23.10 4.77 0.93 68.06
NCR 3.26 25.89 70.85
CAR 2.31 20.66 22.95 54.09
Ilocos Region 1.22 16.43 0.93 81.42
Cagayan Valley 1.59 25.78 4.46 68.18
Central Luzon 3.94 50.95 6.88 2.85 35.37
CALABARZON 4.53 22.46 6.69 66.32
MIMAROPA 0.60 11.60 6.95 80.86
Bicol Region 4.65 15.85 1.74 77.76
Western Visayas 0.40 9.78 2.25 0.35 87.21
Central Visayas 10.03 22.68 67.29
Eastern Visayas 3.83 12.87 83.31
Zamboanga Peninsula 3.64 26.62 4.62 65.12
Northern Mindanao 3.02 26.23 8.59 5.24 56.93
Davao Region 2.66 35.75 2.83 58.75
SOCCSKSARGEN 4.72 18.95 5.87 1.59 68.87Caraga 30.98 15.24 4.37 49.41
ARMM 18.96 11.40 3.26 66.38
Daily WeeklyTwice/Thrice aMonth
MonthlyAs NeedArises/
No Schedule
Table 9.26 Percentage distribution of households by buying frequency of mango
and region, Philippines, 2012
T i / A N d

7/21/2019 Food Demand Survey Philippines: SFD Presentation of Results_Background to Preliminaries1
http://slidepdf.com/reader/full/food-demand-survey-philippines-sfd-presentation-of-resultsbackground-to-preliminaries1 72/87
www.bas.gov.ph Philippines’ Bureau of Agricultural Statistics
Region
Philippines 2.17 30.73 5.84 3.20 58.06
NCR 1.75 36.83 0.46 0.25 60.71
CAR 0.26 12.79 4.24 0.56 82.15
Ilocos Region 14.65 17.05 0.17 68.12Cagayan Valley 6.87 2.72 1.53 88.88
Central Luzon 6.66 46.40 8.36 3.02 35.56
CALABARZON 0.98 27.08 12.72 14.01 45.21
MIMAROPA 9.04 1.45 89.51
Bicol Region 4.06 25.44 4.95 4.38 61.17
Western Visayas 0.13 13.71 0.27 1.75 84.14
Central Visayas 29.89 9.71 60.40
Eastern Visayas 0.71 13.43 1.89 83.97
Zamboanga Peninsula 26.86 3.35 69.79
Northern Mindanao 30.74 1.80 5.17 62.30
Davao Region 25.38 2.51 72.11
SOCCSKSARGEN 3.19 8.14 9.58 0.40 78.69
Caraga 3.61 42.29 7.98 7.87 38.25
ARMM 4.99 26.52 17.59 0.85 50.05
Daily WeeklyTwice/
Thrice aMonth
MonthlyAs NeedArises/
No Schedule
Table 9.27 Percentage distribution of households by buying frequency of pineapple
and region, Philippines, 2012
Twice/ As Need

7/21/2019 Food Demand Survey Philippines: SFD Presentation of Results_Background to Preliminaries1
http://slidepdf.com/reader/full/food-demand-survey-philippines-sfd-presentation-of-resultsbackground-to-preliminaries1 73/87
www.bas.gov.ph Philippines’ Bureau of Agricultural Statistics
Region
Philippines 0.92 14.90 3.79 2.66 77.73
NCR 1.23 15.43 0.98 0.27 82.09
CAR 2.93 97.07
Ilocos Region 100.00
Cagayan Valley 8.53 30.95 60.52Central Luzon 45.25 18.24 15.10 21.41
CALABARZON 4.97 0.33 94.70
MIMAROPA 100.00
Bicol Region 21.80 9.62 68.58
Western Visayas 11.14 3.36 85.50
Central Visayas 18.27 81.73
Eastern Visayas 100.00
Zamboanga Peninsula 5.80 32.97 2.93 58.31
Northern Mindanao 14.33 6.83 2.09 76.76
Davao Region 1.64 98.36
SOCCSKSARGEN 8.75 8.57 0.55 6.60 75.54
Caraga 39.57 16.93 0.50 43.00
ARMM 23.09 14.82 62.09
Daily WeeklyTwice/
Thrice aMonth
MonthlyAs NeedArises/
No Schedule
Table 9.28 Percentage distribution of households by buying frequency of papaya (ripe)
and region, Philippines, 2012
Twice/ As Need

7/21/2019 Food Demand Survey Philippines: SFD Presentation of Results_Background to Preliminaries1
http://slidepdf.com/reader/full/food-demand-survey-philippines-sfd-presentation-of-resultsbackground-to-preliminaries1 74/87
www.bas.gov.ph Philippines’ Bureau of Agricultural Statistics
Region
Philippines 3.32 30.69 8.55 2.79 54.65
NCR 1.80 27.68 3.27 67.25
CAR 3.92 13.75 7.43 74.89
Ilocos Region 54.84 45.16
Cagayan Valley 43.80 56.20Central Luzon 1.30 51.68 8.67 2.61 35.74
CALABARZON 5.70 14.19 7.38 18.04 54.69
MIMAROPA 40.32 59.68
Bicol Region 14.03 32.05 3.41 50.51
Western Visayas 23.92 3.35 72.72
Central Visayas 1.04 98.96
Eastern Visayas 100.00
Zamboanga Peninsula 29.85 70.15
Northern Mindanao 18.89 5.57 75.54
Davao Region 38.01 61.99
SOCCSKSARGEN 8.21 29.07 7.43 0.65 54.64
Caraga 1.19 46.19 12.22 6.54 33.86ARMM 7.19 37.02 30.38 25.41
Daily WeeklyTwice/ Thrice aMonth
MonthlyAs NeedArises/
No Schedule
Table 9.29 Percentage distribution of households by buying frequency of calamansi

7/21/2019 Food Demand Survey Philippines: SFD Presentation of Results_Background to Preliminaries1
http://slidepdf.com/reader/full/food-demand-survey-philippines-sfd-presentation-of-resultsbackground-to-preliminaries1 75/87
www.bas.gov.ph Philippines’ Bureau of Agricultural Statistics
g y y g q y
and region, Philippines, 2012
Region
Philippines 2.74 30.48 3.70 1.58 61.49
NCR 1.19 30.24 0.20 0.72 67.65
CAR 21.03 1.79 2.73 74.46
Ilocos Region 0.97 5.22 0.63 0.76 92.42
Cagayan Valley 3.00 14.57 3.73 2.72 75.98
Central Luzon 2.08 43.20 2.51 3.42 48.80
CALABARZON 5.59 25.84 8.90 59.68
MIMAROPA 1.30 18.09 5.58 2.48 72.55Bicol Region 4.16 54.04 4.79 1.10 35.90
Western Visayas 0.50 13.52 4.76 8.17 73.05
Central Visayas 1.00 8.41 0.11 90.48
Eastern Visayas 5.57 22.73 2.87 0.19 68.65
Zamboanga Peninsula 1.52 29.68 0.52 0.58 67.71
Northern Mindanao 0.76 42.70 6.61 49.93
Davao Region 3.21 21.02 9.91 1.81 64.05
SOCCSKSARGEN 0.25 24.04 9.34 3.76 62.60Caraga 4.25 50.86 0.52 1.23 43.14
ARMM 14.34 27.50 3.72 54.45
Daily WeeklyTwice/Thrice aMonth
MonthlyAs NeedArises/
No Schedule
Table 9.30 Percentage distribution of households by buying frequency of pork
and region, Philippines, 2012
Twice/ As Need

7/21/2019 Food Demand Survey Philippines: SFD Presentation of Results_Background to Preliminaries1
http://slidepdf.com/reader/full/food-demand-survey-philippines-sfd-presentation-of-resultsbackground-to-preliminaries1 76/87
www.bas.gov.ph Philippines’ Bureau of Agricultural Statistics
Region
Philippines 2.52 39.85 6.78 1.47 49.38
NCR 3.52 39.45 1.18 0.40 55.46
CAR 0.44 42.68 13.53 6.14 37.21
Ilocos Region 2.22 38.38 13.69 1.65 44.07
Cagayan Valley 1.76 39.62 5.20 0.97 52.45Central Luzon 2.84 53.50 10.42 1.14 32.09
CALABARZON 5.27 49.61 4.70 0.32 40.09
MIMAROPA 0.25 20.80 6.91 0.13 71.90
Bicol Region 1.84 45.44 4.61 2.49 45.61
Western Visayas 0.98 21.89 8.27 3.06 65.80
Central Visayas 0.92 37.34 10.86 1.06 49.83
Eastern Visayas 2.50 23.87 5.73 0.86 67.04
Zamboanga Peninsula 0.80 22.25 7.20 1.68 68.07
Northern Mindanao 0.93 47.45 4.53 3.14 43.95
Davao Region 36.63 5.99 1.73 55.65
SOCCSKSARGEN 1.70 24.67 11.06 2.11 60.46
Caraga 4.40 38.35 8.01 7.17 42.06
ARMM 12.00 12.00 76.00
Daily WeeklyTwice/
Thrice aMonth
MonthlyAs NeedArises/
No Schedule
Table 9.31 Percentage distribution of households by buying frequency of beef
and region, Philippines, 2012
Twice/ As Need

7/21/2019 Food Demand Survey Philippines: SFD Presentation of Results_Background to Preliminaries1
http://slidepdf.com/reader/full/food-demand-survey-philippines-sfd-presentation-of-resultsbackground-to-preliminaries1 77/87
www.bas.gov.ph Philippines’ Bureau of Agricultural Statistics
Region
Philippines 2.13 30.85 9.47 2.75 54.81
NCR 33.35 2.85 0.79 63.01
CAR 1.01 19.27 5.81 2.17 71.73
Ilocos Region 3.00 30.52 7.20 2.18 57.10
Cagayan Valley 0.11 18.27 4.88 2.32 74.41Central Luzon 5.92 39.52 22.30 2.02 30.25
CALABARZON 8.91 38.14 12.24 1.44 39.26
MIMAROPA 51.23 1.18 0.78 46.81
Bicol Region 47.14 5.44 1.46 45.96
Western Visayas 0.56 25.35 11.44 3.87 58.79
Central Visayas 35.58 0.56 63.85
Eastern Visayas 5.09 7.77 1.70 1.13 84.31
Zamboanga Peninsula 9.32 13.25 5.00 72.43
Northern Mindanao 45.80 6.49 4.09 43.62
Davao Region 2.92 6.75 10.79 79.54
SOCCSKSARGEN 2.27 24.97 12.47 5.12 55.16
Caraga 48.47 3.52 12.21 35.80ARMM 1.57 13.17 32.04 5.54 47.67
Daily WeeklyTwice/ Thrice aMonth
MonthlyAs NeedArises/
No Schedule
Table 9.32 Percentage distribution of households by buying frequency of carabeef
and region, Philippines, 2012
Twice/ As Need

7/21/2019 Food Demand Survey Philippines: SFD Presentation of Results_Background to Preliminaries1
http://slidepdf.com/reader/full/food-demand-survey-philippines-sfd-presentation-of-resultsbackground-to-preliminaries1 78/87
www.bas.gov.ph Philippines’ Bureau of Agricultural Statistics
Region
Philippines 22.94 13.11 4.48 59.47
NCR 100.00
CAR 100.00
Ilocos Region 19.51 53.87 8.27 18.34
Cagayan Valley 24.87 4.85 5.29 64.99Central Luzon 35.25 6.87 57.88
CALABARZON 9.50 2.22 88.28
MIMAROPA 32.79 67.21
Bicol Region 9.59 31.85 58.55
Western Visayas 31.93 27.76 10.58 29.73
Central Visayas 100.00
Eastern Visayas 23.90 11.90 64.20
Zamboanga Peninsula
Northern Mindanao 8.32 39.39 8.37 43.91
Davao Region 23.11 76.89
SOCCSKSARGEN 100.00
Caraga 68.91 31.09
ARMM 100.00
Daily Weekly/
Thrice aMonth
Monthly Arises/ No Schedule
Table 9.33 Percentage distribution of households by buying frequency of chevon (goat)
and region, Philippines, 2012
Twice/ As Need
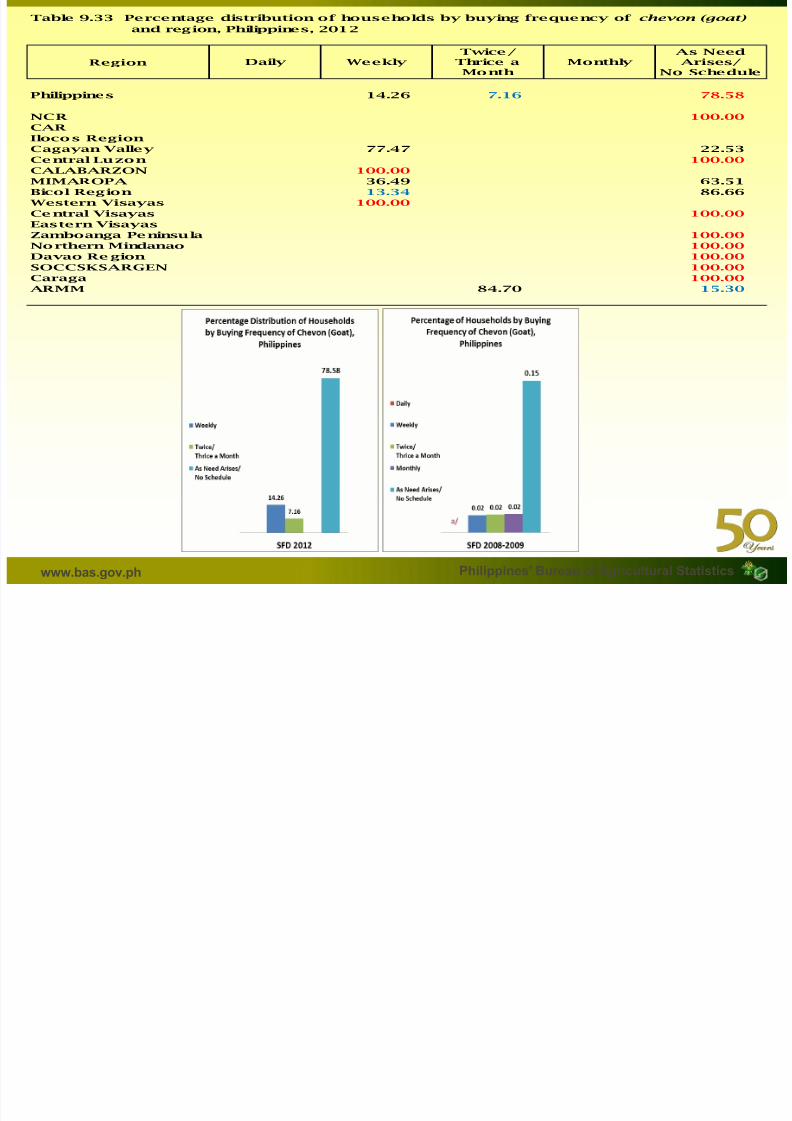
7/21/2019 Food Demand Survey Philippines: SFD Presentation of Results_Background to Preliminaries1
http://slidepdf.com/reader/full/food-demand-survey-philippines-sfd-presentation-of-resultsbackground-to-preliminaries1 79/87
www.bas.gov.ph Philippines’ Bureau of Agricultural Statistics
Region
Philippines 14.26 7.16 78.58
NCR 100.00
CAR
Ilocos Region
Cagayan Valley 77.47 22.53Central Luzon 100.00
CALABARZON 100.00
MIMAROPA 36.49 63.51
Bicol Region 13.34 86.66
Western Visayas 100.00
Central Visayas 100.00
Eastern Visayas
Zamboanga Peninsula 100.00
Northern Mindanao 100.00
Davao Region 100.00
SOCCSKSARGEN 100.00
Caraga 100.00
ARMM 84.70 15.30
Daily Weekly Thrice aMonth
Monthly Arises/ No Schedule
Table 9.34 Percentage distribution of households by buying frequency of chicken
and region, Philippines, 2012
Twice/ As Need

7/21/2019 Food Demand Survey Philippines: SFD Presentation of Results_Background to Preliminaries1
http://slidepdf.com/reader/full/food-demand-survey-philippines-sfd-presentation-of-resultsbackground-to-preliminaries1 80/87
www.bas.gov.ph Philippines’ Bureau of Agricultural Statistics
Region
Philippines 2.48 40.22 6.12 1.67 49.50
NCR 3.36 41.27 1.01 0.11 54.24
CAR 1.28 47.12 11.82 6.88 32.90Ilocos Region 2.02 39.60 16.69 2.89 38.81
Cagayan Valley 0.91 34.06 4.02 1.23 59.78Central Luzon 2.36 57.48 9.43 1.47 29.26CALABARZON 4.96 52.71 4.79 0.42 37.12
MIMAROPA 20.90 6.47 8.39 64.24Bicol Region 0.50 31.40 7.48 3.26 57.36Western Visayas 0.63 16.26 4.85 2.01 76.26Central Visayas 0.04 33.26 6.17 2.11 58.42Eastern Visayas 22.29 4.64 0.24 72.84
Zamboanga Peninsula 0.79 27.80 8.10 4.78 58.53Northern Mindanao 1.82 43.42 8.95 1.75 44.05Davao Region 0.27 29.09 4.55 2.72 63.36SOCCSKSARGEN 6.56 20.68 7.16 1.51 64.09Caraga 4.63 37.79 6.94 3.57 47.06
ARMM 0.60 12.99 23.95 8.13 54.33
Daily Weekly Thrice aMonth
Monthly Arises/ No Schedule
Table 9.35 Percentage distribution of households by buying frequency of duck

7/21/2019 Food Demand Survey Philippines: SFD Presentation of Results_Background to Preliminaries1
http://slidepdf.com/reader/full/food-demand-survey-philippines-sfd-presentation-of-resultsbackground-to-preliminaries1 81/87
www.bas.gov.ph Philippines’ Bureau of Agricultural Statistics
and region, Philippines, 2012
Region
Philippines 45.05 5.14 49.82
NCR 100.00
CAR
Ilocos Region
Cagayan Valley 84.40 15.60
Central Luzon 100.00
CALABARZON 83.95 16.05
MIMAROPA
Bicol Region 53.22 46.78
Western Visayas
Central Visayas
Eastern Visayas 100.00
Zamboanga Peninsula 100.00
Northern Mindanao 100.00
Davao Region
SOCCSKSARGEN 100.00
Caraga 100.00
ARMM
Daily WeeklyTwice/
Thrice aMonth
MonthlyAs NeedArises/
No Schedule
Table 9.36 Percentage distribution of households by buying frequency of chicken egg
and region, Philippines, 2012
R i Daily WeeklyTwice/ Thrice a Monthly
As NeedArises/
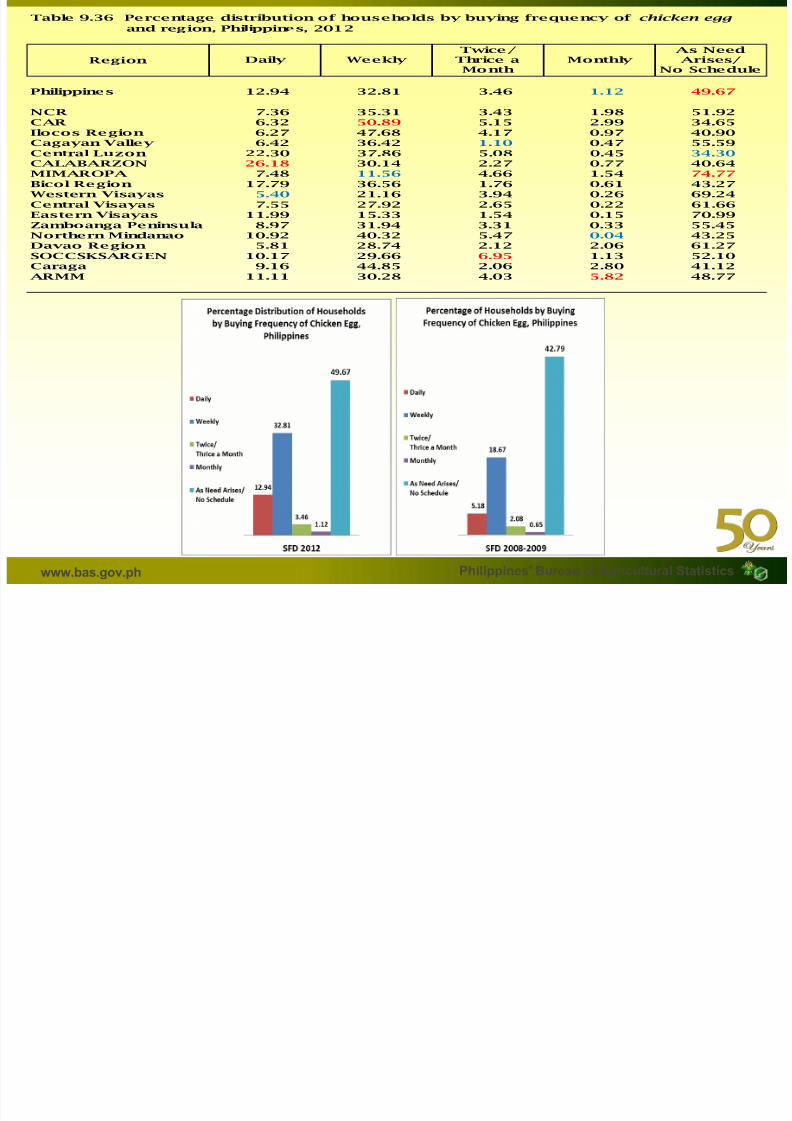
7/21/2019 Food Demand Survey Philippines: SFD Presentation of Results_Background to Preliminaries1
http://slidepdf.com/reader/full/food-demand-survey-philippines-sfd-presentation-of-resultsbackground-to-preliminaries1 82/87
www.bas.gov.ph Philippines’ Bureau of Agricultural Statistics
Region
Philippines 12.94 32.81 3.46 1.12 49.67
NCR 7.36 35.31 3.43 1.98 51.92CAR 6.32 50.89 5.15 2.99 34.65
Ilocos Region 6.27 47.68 4.17 0.97 40.90Cagayan Valley 6.42 36.42 1.10 0.47 55.59
Central Luzon 22.30 37.86 5.08 0.45 34.30CALABARZON 26.18 30.14 2.27 0.77 40.64MIMAROPA 7.48 11.56 4.66 1.54 74.77
Bicol Region 17.79 36.56 1.76 0.61 43.27Western Visayas 5.40 21.16 3.94 0.26 69.24
Central Visayas 7.55 27.92 2.65 0.22 61.66Eastern Visayas 11.99 15.33 1.54 0.15 70.99
Zamboanga Peninsula 8.97 31.94 3.31 0.33 55.45Northern Mindanao 10.92 40.32 5.47 0.04 43.25Davao Region 5.81 28.74 2.12 2.06 61.27
SOCCSKSARGEN 10.17 29.66 6.95 1.13 52.10Caraga 9.16 44.85 2.06 2.80 41.12
ARMM 11.11 30.28 4.03 5.82 48.77
Daily Weekly Thrice aMonth
Monthly Arises/ No Schedule
Table 9.37 Percentage distribution of households by buying frequency of duck egg

7/21/2019 Food Demand Survey Philippines: SFD Presentation of Results_Background to Preliminaries1
http://slidepdf.com/reader/full/food-demand-survey-philippines-sfd-presentation-of-resultsbackground-to-preliminaries1 83/87
www.bas.gov.ph Philippines’ Bureau of Agricultural Statistics
and region, Philippines, 2012
Region
Philippines 5.45 15.10 6.78 0.47 72.20
NCR 100.00
CAR 5.79 14.79 6.31 73.12
Ilocos Region
Cagayan Valley 7.96 43.06 48.97
Central Luzon 6.64 5.40 87.96
CALABARZON 13.57 32.42 54.01
MIMAROPA 3.42 11.82 84.77
Bicol Region 13.15 8.77 5.48 72.61Western Visayas 1.19 26.46 1.57 1.34 69.44
Central Visayas 100.00
Eastern Visayas 13.69 86.31
Zamboanga Peninsula 3.14 10.17 6.78 79.91
Northern Mindanao 62.61 0.86 0.72 35.81
Davao Region 100.00
SOCCSKSARGEN 7.80 17.71 15.23 59.26
Caraga 19.91 5.42 74.66
ARMM 11.79 8.86 79.36
Daily WeeklyTwice/
Thrice aMonth
MonthlyAs NeedArises/
No Schedule
Table 9.38 Percentage distribution of households by buying frequency of
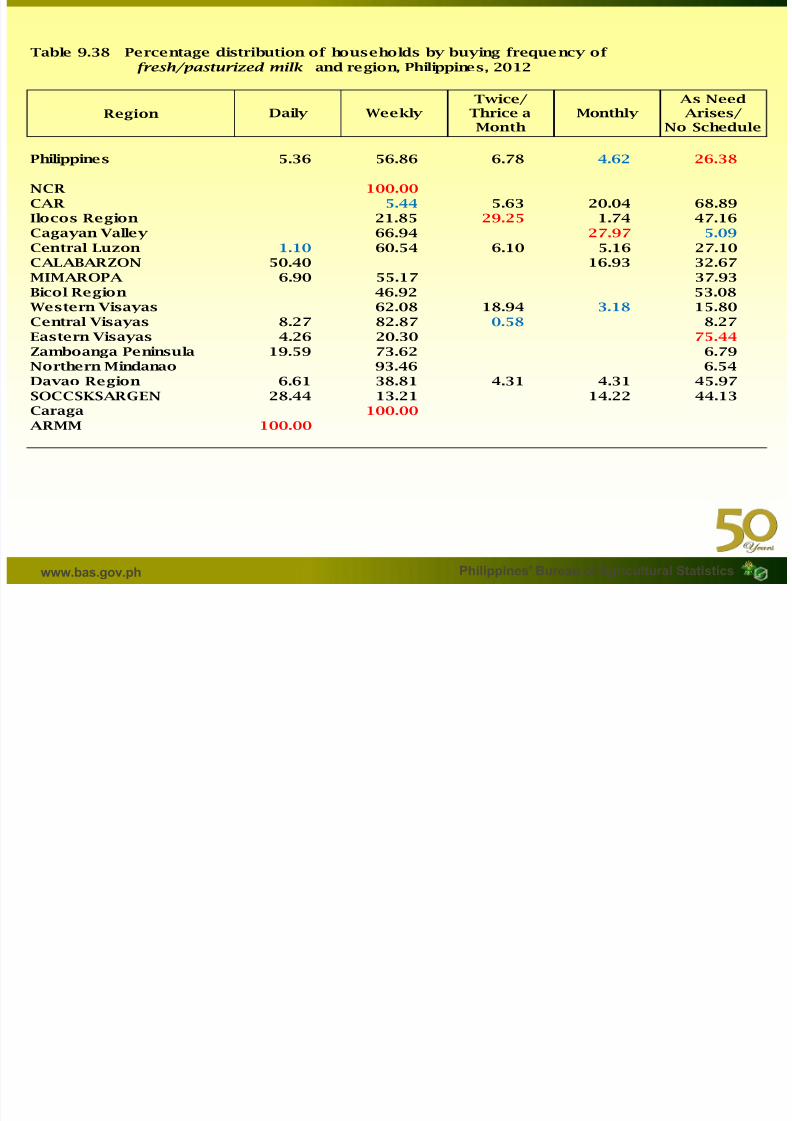
7/21/2019 Food Demand Survey Philippines: SFD Presentation of Results_Background to Preliminaries1
http://slidepdf.com/reader/full/food-demand-survey-philippines-sfd-presentation-of-resultsbackground-to-preliminaries1 84/87
www.bas.gov.ph Philippines’ Bureau of Agricultural Statistics
fresh/pasturized milk and region, Philippines, 2012
Region
Philippines 5.36 56.86 6.78 4.62 26.38
NCR 100.00
CAR 5.44 5.63 20.04 68.89
Ilocos Region 21.85 29.25 1.74 47.16
Cagayan Valley 66.94 27.97 5.09
Central Luzon 1.10 60.54 6.10 5.16 27.10
CALABARZON 50.40 16.93 32.67
MIMAROPA 6.90 55.17 37.93
Bicol Region 46.92 53.08Western Visayas 62.08 18.94 3.18 15.80
Central Visayas 8.27 82.87 0.58 8.27
Eastern Visayas 4.26 20.30 75.44
Zamboanga Peninsula 19.59 73.62 6.79
Northern Mindanao 93.46 6.54
Davao Region 6.61 38.81 4.31 4.31 45.97
SOCCSKSARGEN 28.44 13.21 14.22 44.13
Caraga 100.00
ARMM 100.00
Daily WeeklyTwice/
Thrice aMonth
MonthlyAs NeedArises/
No Schedule
Table 9.39 Percentage distribution of households by buying frequency of milkfish
and region, Philippines, 2012
Region Daily WeeklyTwice/
Thrice a MonthlyAs NeedArises/

7/21/2019 Food Demand Survey Philippines: SFD Presentation of Results_Background to Preliminaries1
http://slidepdf.com/reader/full/food-demand-survey-philippines-sfd-presentation-of-resultsbackground-to-preliminaries1 85/87
www.bas.gov.ph Philippines’ Bureau of Agricultural Statistics
Region
Philippines 2.04 37.20 5.65 1.11 54.01
NCR 0.77 43.30 1.50 0.17 54.26
CAR 36.22 12.78 9.15 41.85
Ilocos Region 1.02 32.86 14.06 0.74 51.32
Cagayan Valley 40.60 3.83 0.46 55.10
Central Luzon 4.48 56.87 5.93 3.16 29.57
CALABARZON 5.63 39.34 7.03 0.50 47.51
MIMAROPA 11.29 2.15 86.56
Bicol Region 4.79 40.16 55.05
Western Visayas 0.75 24.30 4.11 0.31 70.52
Central Visayas 13.44 11.31 75.25
Eastern Visayas 0.69 5.41 2.03 91.87
Zamboanga Peninsula 0.81 16.57 2.21 80.41
Northern Mindanao 2.10 37.35 2.93 1.64 55.99
Davao Region 0.29 14.91 6.76 0.15 77.89
SOCCSKSARGEN 3.04 28.42 4.89 2.13 61.51
Caraga 0.79 26.73 12.00 1.03 59.45
ARMM 5.27 39.99 16.94 37.80
Daily Weekly Thrice aMonth
Monthly Arises/ No Schedule
Table 9.40 Percentage distribution of households by buying frequency of tilapia
and region, Philippines, 2012
Region Daily WeeklyTwice/ Thrice a Monthly
As NeedArises/

7/21/2019 Food Demand Survey Philippines: SFD Presentation of Results_Background to Preliminaries1
http://slidepdf.com/reader/full/food-demand-survey-philippines-sfd-presentation-of-resultsbackground-to-preliminaries1 86/87
www.bas.gov.ph Philippines’ Bureau of Agricultural Statistics
Region
Philippines 2.30 39.52 5.66 1.15 51.36
NCR 0.39 42.39 1.56 0.14 55.51CAR 2.22 32.65 9.30 8.42 47.41
Ilocos Region 0.56 34.68 11.53 0.90 52.34Cagayan Valley 0.65 39.80 3.38 0.13 56.04
Central Luzon 4.72 53.26 7.63 1.89 32.51CALABARZON 1.89 37.94 6.61 1.39 52.18MIMAROPA 0.83 19.22 1.92 78.04
Bicol Region 2.97 47.91 7.46 0.28 41.37Western Visayas 0.79 24.85 3.90 70.46
Central Visayas 33.67 66.33Eastern Visayas 100.00
Zamboanga Peninsula 17.83 82.17Northern Mindanao 1.70 23.34 6.17 4.28 64.51Davao Region 21.10 2.87 76.03
SOCCSKSARGEN 7.38 21.18 5.25 1.25 64.95Caraga 22.48 8.49 2.99 66.03
ARMM 10.40 16.77 14.04 1.07 57.73
Daily Weekly Thrice aMonth
Monthly Arises/ No Schedule
7/21/2019 Food Demand Survey Philippines: SFD Presentation of Results_Background to Preliminaries1
http://slidepdf.com/reader/full/food-demand-survey-philippines-sfd-presentation-of-resultsbackground-to-preliminaries1 87/87
URL: www.bas.gov.ph
Email: [email protected]