FOOD AND BEVERAGE...food industry through offering world-class manufacturing services through its...
18
www.harriswilliams.com Investment banking services are provided by Harris Williams LLC, a registered broker-dealer and member of FINRA and SIPC, and Harris Williams Ltd, which is a private limited company incorporated under English law with its registered office at 5th Floor, 6 St. Andrew Street, London EC4A 3AE, UK, registered with the Registrar of Companies for England and Wales (registration number 07078852). Harris Williams Ltd is authorized and regulated by the Financial Conduct Authority. Harris Williams is a trade name under which Harris Williams LLC and Harris Williams Ltd conduct business. FOOD AND BEVERAGE INDUSTRY UPDATE │ JUNE 2019
Transcript of FOOD AND BEVERAGE...food industry through offering world-class manufacturing services through its...
www.harriswilliams.com
Investment banking services are provided by Harris Williams LLC, a registered broker-dealer and member of FINRA and SIPC, and Harris Williams Ltd, which is a private limited company incorporated under English lawwith its registered office at 5th Floor, 6 St. Andrew Street, London EC4A 3AE, UK, registered with the Registrar of Companies for England and Wales (registration number 07078852). Harris Williams Ltd is authorized andregulated by the Financial Conduct Authority. Harris Williams is a trade name under which Harris Williams LLC and Harris Williams Ltd conduct business.
FOOD AND BEVERAGE
INDUSTRY UPDATE │ JUNE 2019
PAGE |
www.harriswilliams.com
Group Overview
Harris Williams is a leading advisor to the food and beverage market. Our significant experience covers a broad range of end markets, industries, and business models. This particular report focuses on trends and metrics in the following areas:
Agribusiness
Bakery
Beverages
Branded and Private Label
Dairy
Distribution
Ingredients
Meat and Protein
Natural and Organic
Processing
Produce
Restaurant and Retail
Snacks
Contacts
Tim AlexanderManaging [email protected]+1 (612) 359-2716
Ryan BudlongManaging [email protected] +1 (415) 217-3409
Brant CashManaging [email protected]+1 (612) 359-2709
Ryan [email protected]+1 (612) 359-2703
Andy WarczakVice [email protected]+1 (612) 359-2714
Brant Wilczek
Vice President
+1 (612) 359-2732
Thomas DeMinico
Vice President
+1 (612) 359-2719
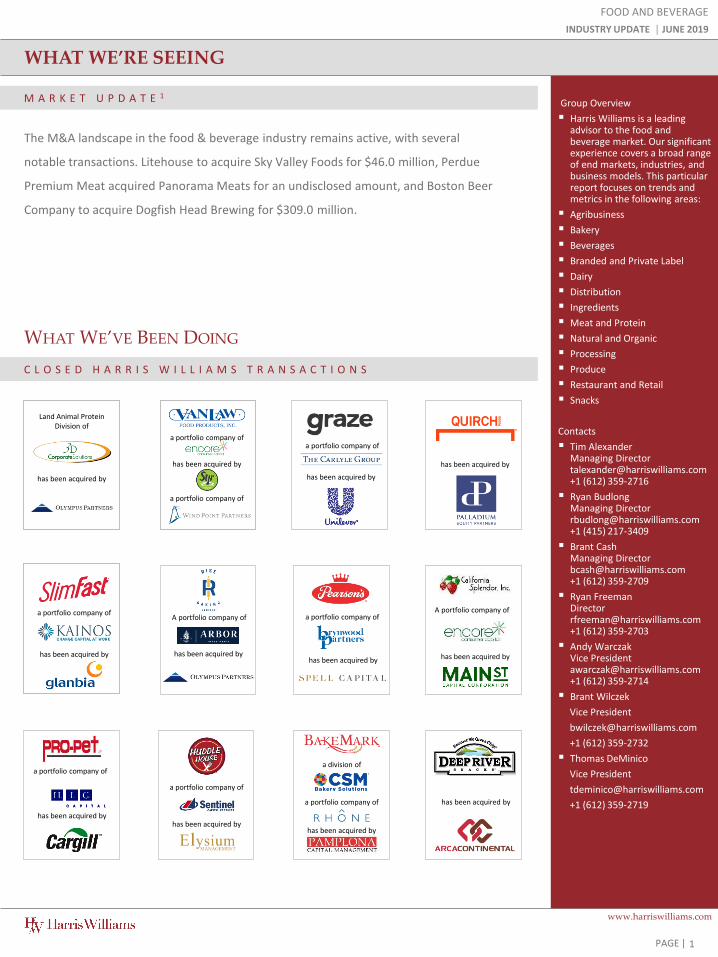
M A R K E T U P D A T E 1
The M&A landscape in the food & beverage industry remains active, with several
notable transactions. Litehouse to acquire Sky Valley Foods for $46.0 million, Perdue
Premium Meat acquired Panorama Meats for an undisclosed amount, and Boston Beer
Company to acquire Dogfish Head Brewing for $309.0 million.
WHAT WE’RE SEEING
FOOD AND BEVERAGE
INDUSTRY UPDATE │ JUNE 2019
WHAT WE’VE BEEN DOING
C L O S E D H A R R I S W I L L I A M S T R A N S A C T I O N S
a portfolio company of
has been acquired by
1
A portfolio company of
has been acquired by
a portfolio company of
has been acquired by
a portfolio company of
has been acquired by
has been acquired by
has been acquired by
a division of
a portfolio company of has been acquired by
A portfolio company of
has been acquired by
a portfolio company of
has been acquired by
a portfolio company ofa portfolio company ofa portfolio company of
has been acquired by
has been acquired by
a portfolio company of
a portfolio company of
has been acquired by
Land Animal Protein Division of
PAGE |
HARRIS WILLIAMS ADVISES 3D CORPORATE SOLUTIONS
2
FOOD AND BEVERAGE
INDUSTRY UPDATE │ JUNE 2019
VITAL SIGNS
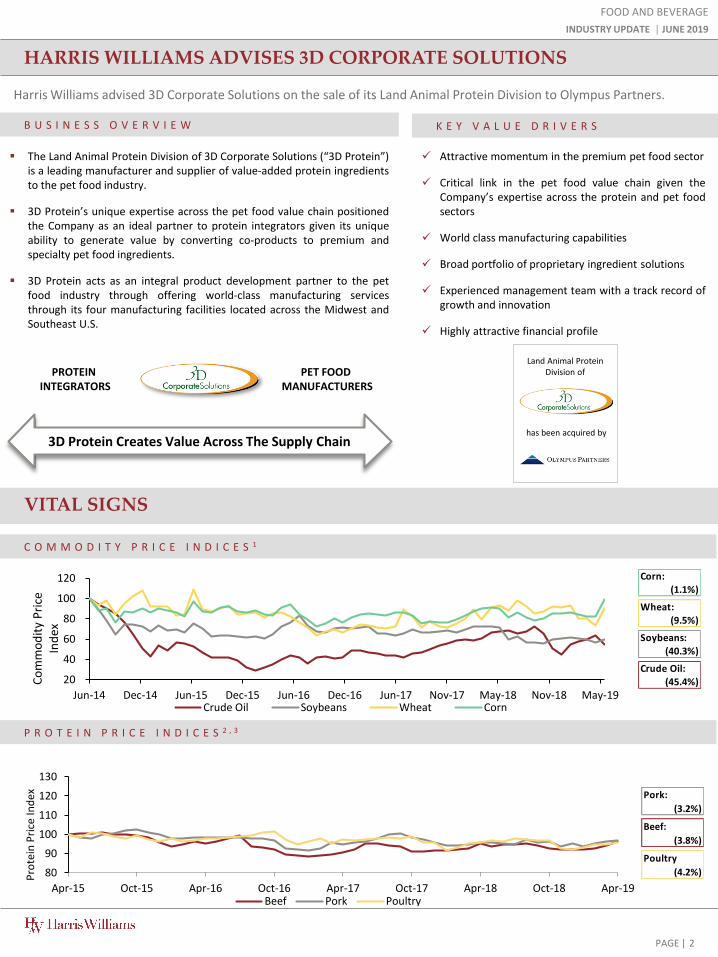
C O M M O D I T Y P R I C E I N D I C E S 1
P R O T E I N P R I C E I N D I C E S 2 , 3
20
40
60
80
100
120
Jun-14 Dec-14 Jun-15 Dec-15 Jun-16 Dec-16 Jun-17 Nov-17 May-18 Nov-18 May-19
Co
mm
od
ity
Pri
ce
Ind
ex
Crude Oil Soybeans Wheat Corn
80
90
100
110
120
130
Apr-15 Oct-15 Apr-16 Oct-16 Apr-17 Oct-17 Apr-18 Oct-18 Apr-19
Pro
tein
Pri
ce In
dex
Beef Pork Poultry
Corn:(1.1%)
Wheat:(9.5%)
Soybeans:
(40.3%)
Crude Oil:(45.4%)
Pork:
(3.2%)
Beef:
(3.8%)
Poultry
(4.2%)
B U S I N E S S O V E R V I E W K E Y V A L U E D R I V E R S
has been acquired by
Land Animal Protein Division of
Harris Williams advised 3D Corporate Solutions on the sale of its Land Animal Protein Division to Olympus Partners.
The Land Animal Protein Division of 3D Corporate Solutions (“3D Protein”)is a leading manufacturer and supplier of value-added protein ingredientsto the pet food industry.
3D Protein’s unique expertise across the pet food value chain positionedthe Company as an ideal partner to protein integrators given its uniqueability to generate value by converting co-products to premium andspecialty pet food ingredients.
3D Protein acts as an integral product development partner to the petfood industry through offering world-class manufacturing servicesthrough its four manufacturing facilities located across the Midwest andSoutheast U.S.
Attractive momentum in the premium pet food sector
Critical link in the pet food value chain given theCompany’s expertise across the protein and pet foodsectors
World class manufacturing capabilities
Broad portfolio of proprietary ingredient solutions
Experienced management team with a track record ofgrowth and innovation
Highly attractive financial profile
PROTEININTEGRATORS
PET FOOD MANUFACTURERS
3D Protein Creates Value Across The Supply Chain
PAGE |
VITAL SIGNS
3
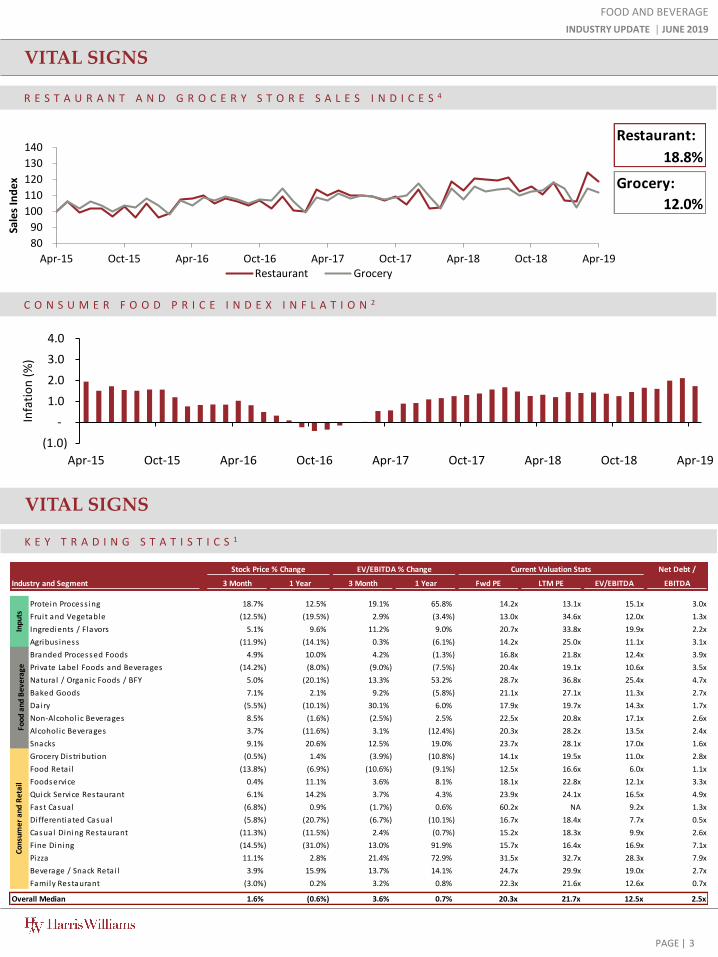
R E S T A U R A N T A N D G R O C E R Y S T O R E S A L E S I N D I C E S 4
C O N S U M E R F O O D P R I C E I N D E X I N F L A T I O N 2
FOOD AND BEVERAGE
INDUSTRY UPDATE │ JUNE 2019
VITAL SIGNS
K E Y T R A D I N G S T A T I S T I C S 1
(1.0)
-
1.0
2.0
3.0
4.0
Apr-15 Oct-15 Apr-16 Oct-16 Apr-17 Oct-17 Apr-18 Oct-18 Apr-19
Infa
tio
n (
%)
Restaurant:
18.8%
Grocery:
12.0%
80
90
100
110
120
130
140
Apr-15 Oct-15 Apr-16 Oct-16 Apr-17 Oct-17 Apr-18 Oct-18 Apr-19
Sale
s In
de
x
Restaurant Grocery
Net Debt /
3 Month 1 Year 3 Month 1 Year Fwd PE LTM PE EV/EBITDA EBITDA
Protein Process ing 18.7% 12.5% 19.1% 65.8% 14.2x 13.1x 15.1x 3.0x
Fruit and Vegetable (12.5%) (19.5%) 2.9% (3.4%) 13.0x 34.6x 12.0x 1.3x
Ingredients / Flavors 5.1% 9.6% 11.2% 9.0% 20.7x 33.8x 19.9x 2.2x
Agribus iness (11.9%) (14.1%) 0.3% (6.1%) 14.2x 25.0x 11.1x 3.1x
Branded Processed Foods 4.9% 10.0% 4.2% (1.3%) 16.8x 21.8x 12.4x 3.9x
Private Label Foods and Beverages (14.2%) (8.0%) (9.0%) (7.5%) 20.4x 19.1x 10.6x 3.5x
Natura l / Organic Foods / BFY 5.0% (20.1%) 13.3% 53.2% 28.7x 36.8x 25.4x 4.7x
Baked Goods 7.1% 2.1% 9.2% (5.8%) 21.1x 27.1x 11.3x 2.7x
Dairy (5.5%) (10.1%) 30.1% 6.0% 17.9x 19.7x 14.3x 1.7x
Non-Alcohol ic Beverages 8.5% (1.6%) (2.5%) 2.5% 22.5x 20.8x 17.1x 2.6x
Alcohol ic Beverages 3.7% (11.6%) 3.1% (12.4%) 20.3x 28.2x 13.5x 2.4x
Snacks 9.1% 20.6% 12.5% 19.0% 23.7x 28.1x 17.0x 1.6x
Grocery Dis tribution (0.5%) 1.4% (3.9%) (10.8%) 14.1x 19.5x 11.0x 2.8x
Food Retai l (13.8%) (6.9%) (10.6%) (9.1%) 12.5x 16.6x 6.0x 1.1x
Foodservice 0.4% 11.1% 3.6% 8.1% 18.1x 22.8x 12.1x 3.3x
Quick Service Restaurant 6.1% 14.2% 3.7% 4.3% 23.9x 24.1x 16.5x 4.9x
Fast Casual (6.8%) 0.9% (1.7%) 0.6% 60.2x NA 9.2x 1.3x
Differentiated Casual (5.8%) (20.7%) (6.7%) (10.1%) 16.7x 18.4x 7.7x 0.5x
Casual Dining Restaurant (11.3%) (11.5%) 2.4% (0.7%) 15.2x 18.3x 9.9x 2.6x
Fine Dining (14.5%) (31.0%) 13.0% 91.9% 15.7x 16.4x 16.9x 7.1x
Pizza 11.1% 2.8% 21.4% 72.9% 31.5x 32.7x 28.3x 7.9x
Beverage / Snack Retai l 3.9% 15.9% 13.7% 14.1% 24.7x 29.9x 19.0x 2.7x
Fami ly Restaurant (3.0%) 0.2% 3.2% 0.8% 22.3x 21.6x 12.6x 0.7x
Overall Median 1.6% (0.6%) 3.6% 0.7% 20.3x 21.7x 12.5x 2.5x
Cons
umer
and
Ret
ail
Industry and Segment
Stock Price % Change EV/EBITDA % Change Current Valuation Stats
Inpu
tsFo
od a
nd B
ever
age
PAGE |
PUBLIC EQUITY MARKET OVERVIEW
4
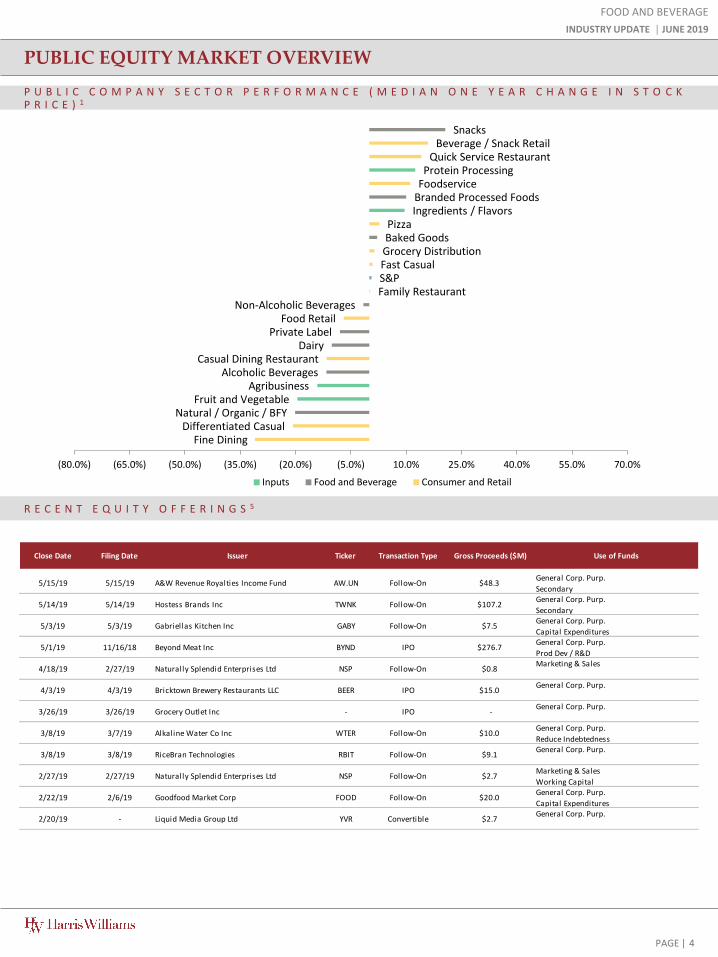
P U B L I C C O M P A N Y S E C T O R P E R F O R M A N C E ( M E D I A N O N E Y E A R C H A N G E I N S T O C K P R I C E ) 1
R E C E N T E Q U I T Y O F F E R I N G S 5
FOOD AND BEVERAGE
INDUSTRY UPDATE │ JUNE 2019
: Food and Bev Comparable Companies 4 1
Fine DiningDifferentiated Casual
Natural / Organic / BFYFruit and Vegetable
AgribusinessAlcoholic Beverages
Casual Dining RestaurantDairy
Private LabelFood Retail
Non-Alcoholic BeveragesFamily RestaurantS&PFast CasualGrocery DistributionBaked GoodsPizza
Ingredients / FlavorsBranded Processed FoodsFoodserviceProtein Processing
Quick Service RestaurantBeverage / Snack Retail
Snacks
(80.0%) (65.0%) (50.0%) (35.0%) (20.0%) (5.0%) 10.0% 25.0% 40.0% 55.0% 70.0%
Inputs Food and Beverage Consumer and Retail
Close Date Filing Date Issuer Ticker Transaction Type Gross Proceeds ($M) Use of Funds
5/15/19 5/15/19 A&W Revenue Royalties Income Fund AW.UN Follow-On $48.3General Corp. Purp.
Secondary
5/14/19 5/14/19 Hostess Brands Inc TWNK Follow-On $107.2General Corp. Purp.
Secondary
5/3/19 5/3/19 Gabriellas Kitchen Inc GABY Follow-On $7.5General Corp. Purp.
Capital Expenditures
5/1/19 11/16/18 Beyond Meat Inc BYND IPO $276.7General Corp. Purp.
Prod Dev / R&D
4/18/19 2/27/19 Naturally Splendid Enterprises Ltd NSP Follow-On $0.8Marketing & Sales
4/3/19 4/3/19 Bricktown Brewery Restaurants LLC BEER IPO $15.0General Corp. Purp.
3/26/19 3/26/19 Grocery Outlet Inc - IPO -General Corp. Purp.
3/8/19 3/7/19 Alkaline Water Co Inc WTER Follow-On $10.0General Corp. Purp.
Reduce Indebtedness
3/8/19 3/8/19 RiceBran Technologies RBIT Follow-On $9.1General Corp. Purp.
2/27/19 2/27/19 Naturally Splendid Enterprises Ltd NSP Follow-On $2.7Marketing & Sales
Working Capital
2/22/19 2/6/19 Goodfood Market Corp FOOD Follow-On $20.0General Corp. Purp.
Capital Expenditures
2/20/19 - Liquid Media Group Ltd YVR Convertible $2.7General Corp. Purp.
PAGE |
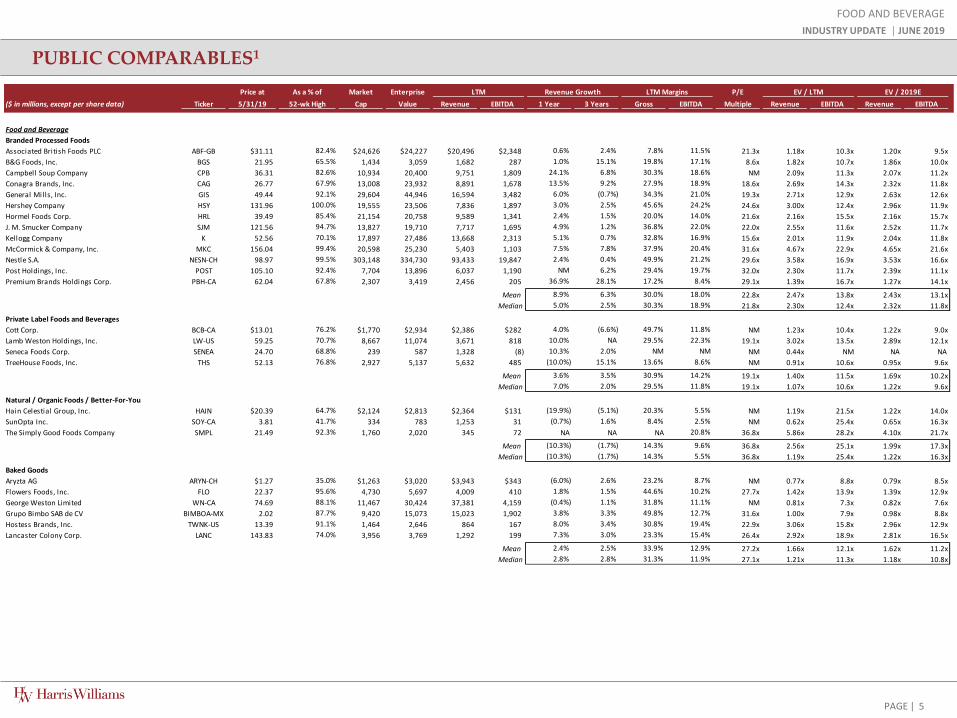
PUBLIC COMPARABLES1
FOOD AND BEVERAGE
INDUSTRY UPDATE │ JUNE 2019
5
Price at As a % of Market Enterprise P/E
($ in millions, except per share data) Ticker 5/31/19 52-wk High Cap Value Revenue EBITDA 1 Year 3 Years Gross EBITDA Multiple Revenue EBITDA Revenue EBITDA
Food and Beverage
Branded Processed Foods
Associated British Foods PLC ABF-GB $31.11 82.4% $24,626 $24,227 $20,496 $2,348 0.6% 2.4% 7.8% 11.5% 21.3x 1.18x 10.3x 1.20x 9.5x
B&G Foods, Inc. BGS 21.95 65.5% 1,434 3,059 1,682 287 1.0% 15.1% 19.8% 17.1% 8.6x 1.82x 10.7x 1.86x 10.0x
Campbell Soup Company CPB 36.31 82.6% 10,934 20,400 9,751 1,809 24.1% 6.8% 30.3% 18.6% NM 2.09x 11.3x 2.07x 11.2x
Conagra Brands, Inc. CAG 26.77 67.9% 13,008 23,932 8,891 1,678 13.5% 9.2% 27.9% 18.9% 18.6x 2.69x 14.3x 2.32x 11.8x
General Mills, Inc. GIS 49.44 92.1% 29,604 44,946 16,594 3,482 6.0% (0.7%) 34.3% 21.0% 19.3x 2.71x 12.9x 2.63x 12.6x
Hershey Company HSY 131.96 100.0% 19,555 23,506 7,836 1,897 3.0% 2.5% 45.6% 24.2% 24.6x 3.00x 12.4x 2.96x 11.9x
Hormel Foods Corp. HRL 39.49 85.4% 21,154 20,758 9,589 1,341 2.4% 1.5% 20.0% 14.0% 21.6x 2.16x 15.5x 2.16x 15.7x
J. M. Smucker Company SJM 121.56 94.7% 13,827 19,710 7,717 1,695 4.9% 1.2% 36.8% 22.0% 22.0x 2.55x 11.6x 2.52x 11.7x
Kellogg Company K 52.56 70.1% 17,897 27,486 13,668 2,313 5.1% 0.7% 32.8% 16.9% 15.6x 2.01x 11.9x 2.04x 11.8x
McCormick & Company, Inc. MKC 156.04 99.4% 20,598 25,230 5,403 1,103 7.5% 7.8% 37.9% 20.4% 31.6x 4.67x 22.9x 4.65x 21.6x
Nestle S.A. NESN-CH 98.97 99.5% 303,148 334,730 93,433 19,847 2.4% 0.4% 49.9% 21.2% 29.6x 3.58x 16.9x 3.53x 16.6x
Post Holdings, Inc. POST 105.10 92.4% 7,704 13,896 6,037 1,190 NM 6.2% 29.4% 19.7% 32.0x 2.30x 11.7x 2.39x 11.1x
Premium Brands Holdings Corp. PBH-CA 62.04 67.8% 2,307 3,419 2,456 205 36.9% 28.1% 17.2% 8.4% 29.1x 1.39x 16.7x 1.27x 14.1x
Mean 8.9% 6.3% 30.0% 18.0% 22.8x 2.47x 13.8x 2.43x 13.1x
Median 5.0% 2.5% 30.3% 18.9% 21.8x 2.30x 12.4x 2.32x 11.8x
Private Label Foods and Beverages
Cott Corp. BCB-CA $13.01 76.2% $1,770 $2,934 $2,386 $282 4.0% (6.6%) 49.7% 11.8% NM 1.23x 10.4x 1.22x 9.0x
Lamb Weston Holdings, Inc. LW-US 59.25 70.7% 8,667 11,074 3,671 818 10.0% NA 29.5% 22.3% 19.1x 3.02x 13.5x 2.89x 12.1x
Seneca Foods Corp. SENEA 24.70 68.8% 239 587 1,328 (8) 10.3% 2.0% NM NM NM 0.44x NM NA NA
TreeHouse Foods, Inc. THS 52.13 76.8% 2,927 5,137 5,632 485 (10.0%) 15.1% 13.6% 8.6% NM 0.91x 10.6x 0.95x 9.6x
Mean 3.6% 3.5% 30.9% 14.2% 19.1x 1.40x 11.5x 1.69x 10.2x
Median 7.0% 2.0% 29.5% 11.8% 19.1x 1.07x 10.6x 1.22x 9.6x
Natural / Organic Foods / Better-For-You
Hain Celestial Group, Inc. HAIN $20.39 64.7% $2,124 $2,813 $2,364 $131 (19.9%) (5.1%) 20.3% 5.5% NM 1.19x 21.5x 1.22x 14.0x
SunOpta Inc. SOY-CA 3.81 41.7% 334 783 1,253 31 (0.7%) 1.6% 8.4% 2.5% NM 0.62x 25.4x 0.65x 16.3x
The Simply Good Foods Company SMPL 21.49 92.3% 1,760 2,020 345 72 NA NA NA 20.8% 36.8x 5.86x 28.2x 4.10x 21.7x
Mean (10.3%) (1.7%) 14.3% 9.6% 36.8x 2.56x 25.1x 1.99x 17.3x
Median (10.3%) (1.7%) 14.3% 5.5% 36.8x 1.19x 25.4x 1.22x 16.3x
Baked Goods
Aryzta AG ARYN-CH $1.27 35.0% $1,263 $3,020 $3,943 $343 (6.0%) 2.6% 23.2% 8.7% NM 0.77x 8.8x 0.79x 8.5x
Flowers Foods, Inc. FLO 22.37 95.6% 4,730 5,697 4,009 410 1.8% 1.5% 44.6% 10.2% 27.7x 1.42x 13.9x 1.39x 12.9x
George Weston Limited WN-CA 74.69 88.1% 11,467 30,424 37,381 4,159 (0.4%) 1.1% 31.8% 11.1% NM 0.81x 7.3x 0.82x 7.6x
Grupo Bimbo SAB de CV BIMBOA-MX 2.02 87.7% 9,420 15,073 15,023 1,902 3.8% 3.3% 49.8% 12.7% 31.6x 1.00x 7.9x 0.98x 8.8x
Hostess Brands, Inc. TWNK-US 13.39 91.1% 1,464 2,646 864 167 8.0% 3.4% 30.8% 19.4% 22.9x 3.06x 15.8x 2.96x 12.9x
Lancaster Colony Corp. LANC 143.83 74.0% 3,956 3,769 1,292 199 7.3% 3.0% 23.3% 15.4% 26.4x 2.92x 18.9x 2.81x 16.5x
Mean 2.4% 2.5% 33.9% 12.9% 27.2x 1.66x 12.1x 1.62x 11.2x
Median 2.8% 2.8% 31.3% 11.9% 27.1x 1.21x 11.3x 1.18x 10.8x
LTM EV / LTM EV / 2019ERevenue Growth LTM Margins
PAGE |
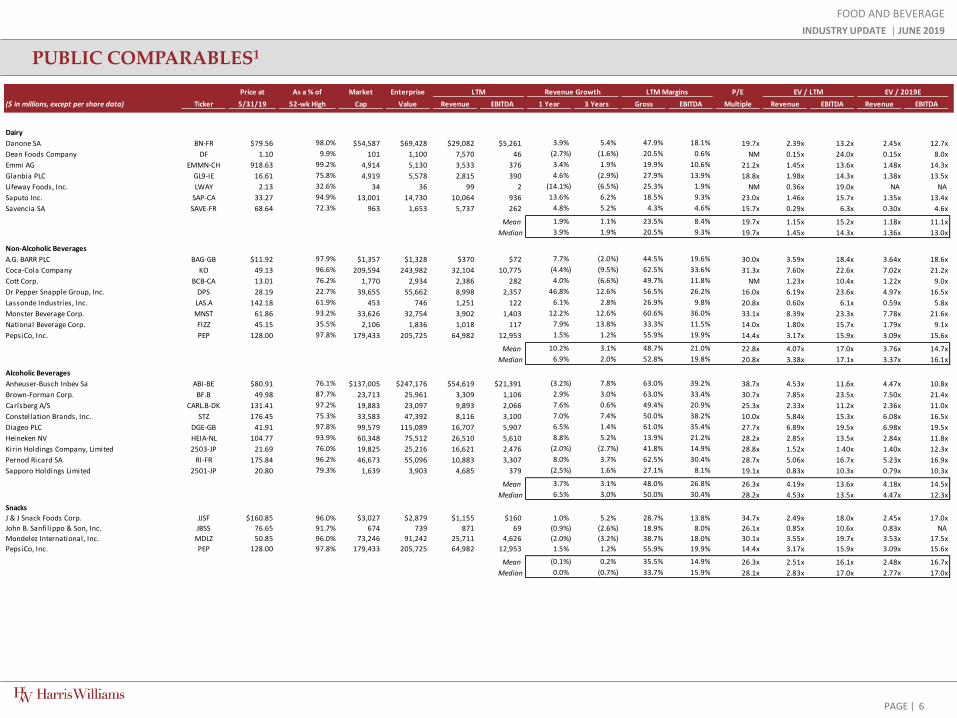
PUBLIC COMPARABLES1
6
FOOD AND BEVERAGE
INDUSTRY UPDATE │ JUNE 2019
Price at As a % of Market Enterprise P/E
($ in millions, except per share data) Ticker 5/31/19 52-wk High Cap Value Revenue EBITDA 1 Year 3 Years Gross EBITDA Multiple Revenue EBITDA Revenue EBITDA
Dairy
Danone SA BN-FR $79.56 98.0% $54,587 $69,428 $29,082 $5,261 3.9% 5.4% 47.9% 18.1% 19.7x 2.39x 13.2x 2.45x 12.7x
Dean Foods Company DF 1.10 9.9% 101 1,100 7,570 46 (2.7%) (1.6%) 20.5% 0.6% NM 0.15x 24.0x 0.15x 8.0x
Emmi AG EMMN-CH 918.63 99.2% 4,914 5,130 3,533 376 3.4% 1.9% 19.9% 10.6% 21.2x 1.45x 13.6x 1.48x 14.3x
Glanbia PLC GL9-IE 16.61 75.8% 4,919 5,578 2,815 390 4.6% (2.9%) 27.9% 13.9% 18.8x 1.98x 14.3x 1.38x 13.5x
Lifeway Foods, Inc. LWAY 2.13 32.6% 34 36 99 2 (14.1%) (6.5%) 25.3% 1.9% NM 0.36x 19.0x NA NA
Saputo Inc. SAP-CA 33.27 94.9% 13,001 14,730 10,064 936 13.6% 6.2% 18.5% 9.3% 23.0x 1.46x 15.7x 1.35x 13.4x
Savencia SA SAVE-FR 68.64 72.3% 963 1,653 5,737 262 4.8% 5.2% 4.3% 4.6% 15.7x 0.29x 6.3x 0.30x 4.6x
Mean 1.9% 1.1% 23.5% 8.4% 19.7x 1.15x 15.2x 1.18x 11.1x
Median 3.9% 1.9% 20.5% 9.3% 19.7x 1.45x 14.3x 1.36x 13.0x
Non-Alcoholic Beverages
A.G. BARR PLC BAG-GB $11.92 97.9% $1,357 $1,328 $370 $72 7.7% (2.0%) 44.5% 19.6% 30.0x 3.59x 18.4x 3.64x 18.6x
Coca-Cola Company KO 49.13 96.6% 209,594 243,982 32,104 10,775 (4.4%) (9.5%) 62.5% 33.6% 31.3x 7.60x 22.6x 7.02x 21.2x
Cott Corp. BCB-CA 13.01 76.2% 1,770 2,934 2,386 282 4.0% (6.6%) 49.7% 11.8% NM 1.23x 10.4x 1.22x 9.0x
Dr Pepper Snapple Group, Inc. DPS 28.19 22.7% 39,655 55,662 8,998 2,357 46.8% 12.6% 56.5% 26.2% 16.0x 6.19x 23.6x 4.97x 16.5x
Lassonde Industries, Inc. LAS.A 142.18 61.9% 453 746 1,251 122 6.1% 2.8% 26.9% 9.8% 20.8x 0.60x 6.1x 0.59x 5.8x
Monster Beverage Corp. MNST 61.86 93.2% 33,626 32,754 3,902 1,403 12.2% 12.6% 60.6% 36.0% 33.1x 8.39x 23.3x 7.78x 21.6x
National Beverage Corp. FIZZ 45.15 35.5% 2,106 1,836 1,018 117 7.9% 13.8% 33.3% 11.5% 14.0x 1.80x 15.7x 1.79x 9.1x
PepsiCo, Inc. PEP 128.00 97.8% 179,433 205,725 64,982 12,953 1.5% 1.2% 55.9% 19.9% 14.4x 3.17x 15.9x 3.09x 15.6x
Mean 10.2% 3.1% 48.7% 21.0% 22.8x 4.07x 17.0x 3.76x 14.7x
Median 6.9% 2.0% 52.8% 19.8% 20.8x 3.38x 17.1x 3.37x 16.1x
Alcoholic Beverages
Anheuser-Busch Inbev Sa ABI-BE $80.91 76.1% $137,005 $247,176 $54,619 $21,391 (3.2%) 7.8% 63.0% 39.2% 38.7x 4.53x 11.6x 4.47x 10.8x
Brown-Forman Corp. BF.B 49.98 87.7% 23,713 25,961 3,309 1,106 2.9% 3.0% 63.0% 33.4% 30.7x 7.85x 23.5x 7.50x 21.4x
Carlsberg A/S CARL.B-DK 131.41 97.2% 19,883 23,097 9,893 2,066 7.6% 0.6% 49.4% 20.9% 25.3x 2.33x 11.2x 2.36x 11.0x
Constellation Brands, Inc. STZ 176.45 75.3% 33,583 47,392 8,116 3,100 7.0% 7.4% 50.0% 38.2% 10.0x 5.84x 15.3x 6.08x 16.5x
Diageo PLC DGE-GB 41.91 97.8% 99,579 115,089 16,707 5,907 6.5% 1.4% 61.0% 35.4% 27.7x 6.89x 19.5x 6.98x 19.5x
Heineken NV HEIA-NL 104.77 93.9% 60,348 75,512 26,510 5,610 8.8% 5.2% 13.9% 21.2% 28.2x 2.85x 13.5x 2.84x 11.8x
Kirin Holdings Company, Limited 2503-JP 21.69 76.0% 19,825 25,216 16,621 2,476 (2.0%) (2.7%) 41.8% 14.9% 28.8x 1.52x 1.40x 1.40x 12.3x
Pernod Ricard SA RI-FR 175.84 96.2% 46,673 55,096 10,883 3,307 8.0% 3.7% 62.5% 30.4% 28.7x 5.06x 16.7x 5.23x 16.9x
Sapporo Holdings Limited 2501-JP 20.80 79.3% 1,639 3,903 4,685 379 (2.5%) 1.6% 27.1% 8.1% 19.1x 0.83x 10.3x 0.79x 10.3x
Mean 3.7% 3.1% 48.0% 26.8% 26.3x 4.19x 13.6x 4.18x 14.5x
Median 6.5% 3.0% 50.0% 30.4% 28.2x 4.53x 13.5x 4.47x 12.3x
Snacks
J & J Snack Foods Corp. JJSF $160.85 96.0% $3,027 $2,879 $1,155 $160 1.0% 5.2% 28.7% 13.8% 34.7x 2.49x 18.0x 2.45x 17.0x
John B. Sanfil ippo & Son, Inc. JBSS 76.65 91.7% 674 739 871 69 (0.9%) (2.6%) 18.9% 8.0% 26.1x 0.85x 10.6x 0.83x NA
Mondelez International, Inc. MDLZ 50.85 96.0% 73,246 91,242 25,711 4,626 (2.0%) (3.2%) 38.7% 18.0% 30.1x 3.55x 19.7x 3.53x 17.5x
PepsiCo, Inc. PEP 128.00 97.8% 179,433 205,725 64,982 12,953 1.5% 1.2% 55.9% 19.9% 14.4x 3.17x 15.9x 3.09x 15.6x
Mean (0.1%) 0.2% 35.5% 14.9% 26.3x 2.51x 16.1x 2.48x 16.7x
Median 0.0% (0.7%) 33.7% 15.9% 28.1x 2.83x 17.0x 2.77x 17.0x
LTM EV / LTMRevenue Growth LTM Margins EV / 2019E
PAGE |
PUBLIC COMPARABLES1
7
FOOD AND BEVERAGE
INDUSTRY UPDATE │ JUNE 2019
Price at As a % of Market Enterprise P/E
($ in millions, except per share data) Ticker 5/31/19 52-wk High Cap Value Revenue EBITDA 1 Year 3 Years Gross EBITDA Multiple Revenue EBITDA Revenue EBITDA
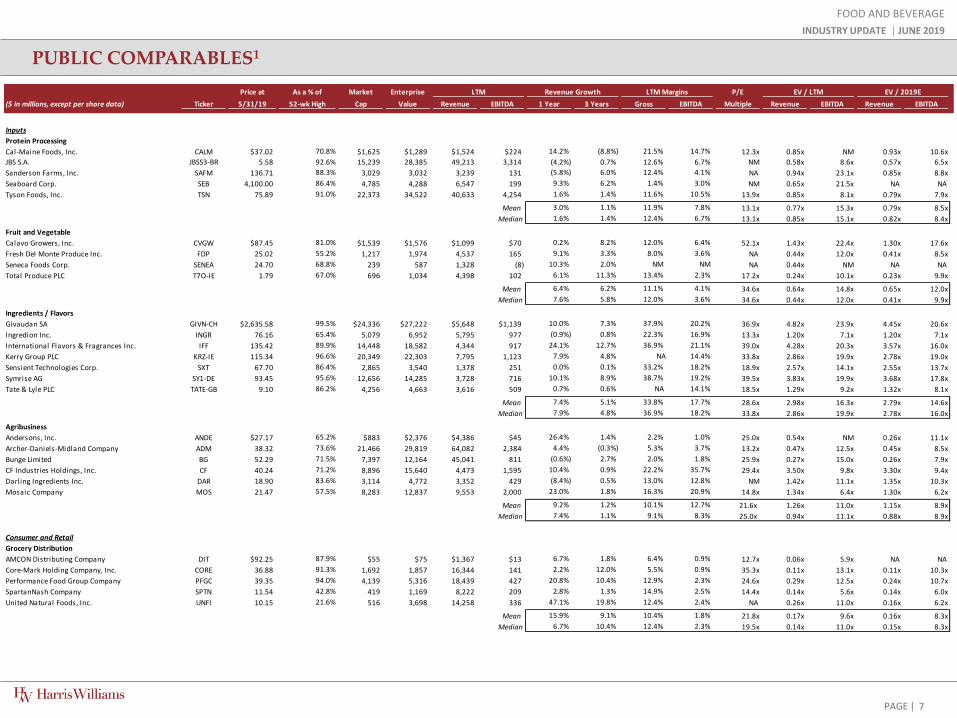
Inputs
Protein Processing
Cal-Maine Foods, Inc. CALM $37.02 70.8% $1,625 $1,289 $1,524 $224 14.2% (8.8%) 21.5% 14.7% 12.3x 0.85x NM 0.93x 10.6x
JBS S.A. JBSS3-BR 5.58 92.6% 15,239 28,385 49,213 3,314 (4.2%) 0.7% 12.6% 6.7% NM 0.58x 8.6x 0.57x 6.5x
Sanderson Farms, Inc. SAFM 136.71 88.3% 3,029 3,032 3,239 131 (5.8%) 6.0% 12.4% 4.1% NA 0.94x 23.1x 0.85x 8.8x
Seaboard Corp. SEB 4,100.00 86.4% 4,785 4,288 6,547 199 9.3% 6.2% 1.4% 3.0% NM 0.65x 21.5x NA NA
Tyson Foods, Inc. TSN 75.89 91.0% 22,373 34,522 40,633 4,254 1.6% 1.4% 11.6% 10.5% 13.9x 0.85x 8.1x 0.79x 7.9x
Mean 3.0% 1.1% 11.9% 7.8% 13.1x 0.77x 15.3x 0.79x 8.5x
Median 1.6% 1.4% 12.4% 6.7% 13.1x 0.85x 15.1x 0.82x 8.4x
Fruit and Vegetable
Calavo Growers, Inc. CVGW $87.45 81.0% $1,539 $1,576 $1,099 $70 0.2% 8.2% 12.0% 6.4% 52.1x 1.43x 22.4x 1.30x 17.6x
Fresh Del Monte Produce Inc. FDP 25.02 55.2% 1,217 1,974 4,537 165 9.1% 3.3% 8.0% 3.6% NA 0.44x 12.0x 0.41x 8.5x
Seneca Foods Corp. SENEA 24.70 68.8% 239 587 1,328 (8) 10.3% 2.0% NM NM NA 0.44x NM NA NA
Total Produce PLC T7O-IE 1.79 67.0% 696 1,034 4,398 102 6.1% 11.3% 13.4% 2.3% 17.2x 0.24x 10.1x 0.23x 9.9x
Mean 6.4% 6.2% 11.1% 4.1% 34.6x 0.64x 14.8x 0.65x 12.0x
Median 7.6% 5.8% 12.0% 3.6% 34.6x 0.44x 12.0x 0.41x 9.9x
Ingredients / Flavors
Givaudan SA GIVN-CH $2,635.58 99.5% $24,336 $27,222 $5,648 $1,139 10.0% 7.3% 37.9% 20.2% 36.9x 4.82x 23.9x 4.45x 20.6x
Ingredion Inc. INGR 76.16 65.4% 5,079 6,952 5,795 977 (0.9%) 0.8% 22.3% 16.9% 13.3x 1.20x 7.1x 1.20x 7.1x
International Flavors & Fragrances Inc. IFF 135.42 89.9% 14,448 18,582 4,344 917 24.1% 12.7% 36.9% 21.1% 39.0x 4.28x 20.3x 3.57x 16.0x
Kerry Group PLC KRZ-IE 115.34 96.6% 20,349 22,303 7,795 1,123 7.9% 4.8% NA 14.4% 33.8x 2.86x 19.9x 2.78x 19.0x
Sensient Technologies Corp. SXT 67.70 86.4% 2,865 3,540 1,378 251 0.0% 0.1% 33.2% 18.2% 18.9x 2.57x 14.1x 2.55x 13.7x
Symrise AG SY1-DE 93.45 95.6% 12,656 14,285 3,728 716 10.1% 8.9% 38.7% 19.2% 39.5x 3.83x 19.9x 3.68x 17.8x
Tate & Lyle PLC TATE-GB 9.10 86.2% 4,256 4,663 3,616 509 0.7% 0.6% NA 14.1% 18.5x 1.29x 9.2x 1.32x 8.1x
Mean 7.4% 5.1% 33.8% 17.7% 28.6x 2.98x 16.3x 2.79x 14.6x
Median 7.9% 4.8% 36.9% 18.2% 33.8x 2.86x 19.9x 2.78x 16.0x
Agribusiness
Andersons, Inc. ANDE $27.17 65.2% $883 $2,376 $4,386 $45 26.4% 1.4% 2.2% 1.0% 25.0x 0.54x NM 0.26x 11.1x
Archer-Daniels-Midland Company ADM 38.32 73.6% 21,466 29,819 64,082 2,384 4.4% (0.3%) 5.3% 3.7% 13.2x 0.47x 12.5x 0.45x 8.5x
Bunge Limited BG 52.29 71.5% 7,397 12,164 45,041 811 (0.6%) 2.7% 2.0% 1.8% 25.9x 0.27x 15.0x 0.26x 7.9x
CF Industries Holdings, Inc. CF 40.24 71.2% 8,896 15,640 4,473 1,595 10.4% 0.9% 22.2% 35.7% 29.4x 3.50x 9.8x 3.30x 9.4x
Darling Ingredients Inc. DAR 18.90 83.6% 3,114 4,772 3,352 429 (8.4%) 0.5% 13.0% 12.8% NM 1.42x 11.1x 1.35x 10.3x
Mosaic Company MOS 21.47 57.5% 8,283 12,837 9,553 2,000 23.0% 1.8% 16.3% 20.9% 14.8x 1.34x 6.4x 1.30x 6.2x
Mean 9.2% 1.2% 10.1% 12.7% 21.6x 1.26x 11.0x 1.15x 8.9x
Median 7.4% 1.1% 9.1% 8.3% 25.0x 0.94x 11.1x 0.88x 8.9x
Consumer and Retail
Grocery Distribution
AMCON Distributing Company DIT $92.25 87.9% $55 $75 $1,367 $13 6.7% 1.8% 6.4% 0.9% 12.7x 0.06x 5.9x NA NA
Core-Mark Holding Company, Inc. CORE 36.88 91.3% 1,692 1,857 16,344 141 2.2% 12.0% 5.5% 0.9% 35.3x 0.11x 13.1x 0.11x 10.3x
Performance Food Group Company PFGC 39.35 94.0% 4,139 5,316 18,439 427 20.8% 10.4% 12.9% 2.3% 24.6x 0.29x 12.5x 0.24x 10.7x
SpartanNash Company SPTN 11.54 42.8% 419 1,169 8,222 209 2.8% 1.3% 14.9% 2.5% 14.4x 0.14x 5.6x 0.14x 6.0x
United Natural Foods, Inc. UNFI 10.15 21.6% 516 3,698 14,258 336 47.1% 19.8% 12.4% 2.4% NA 0.26x 11.0x 0.16x 6.2x
Mean 15.9% 9.1% 10.4% 1.8% 21.8x 0.17x 9.6x 0.16x 8.3x
Median 6.7% 10.4% 12.4% 2.3% 19.5x 0.14x 11.0x 0.15x 8.3x
LTM Margins EV / 2019ELTM Revenue Growth EV / LTM
PAGE |
PUBLIC COMPARABLES1
8
FOOD AND BEVERAGE
INDUSTRY UPDATE │ JUNE 2019
Price at As a % of Market Enterprise P/E
($ in millions, except per share data) Ticker 5/31/19 52-wk High Cap Value Revenue EBITDA 1 Year 3 Years Gross EBITDA Multiple Revenue EBITDA Revenue EBITDA
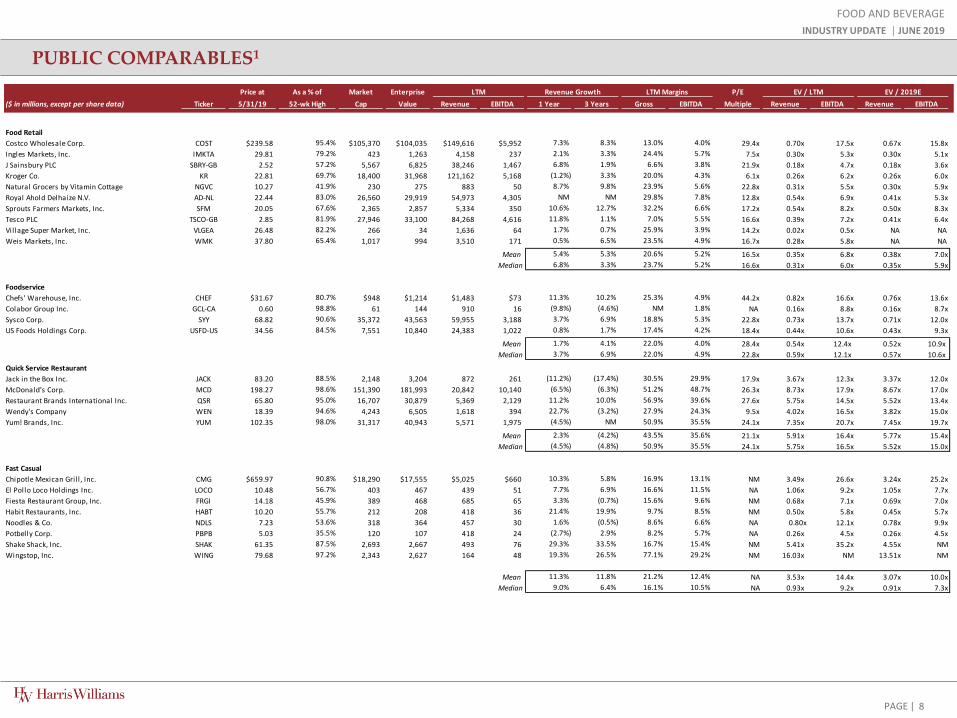
Food Retail
Costco Wholesale Corp. COST $239.58 95.4% $105,370 $104,035 $149,616 $5,952 7.3% 8.3% 13.0% 4.0% 29.4x 0.70x 17.5x 0.67x 15.8x
Ingles Markets, Inc. IMKTA 29.81 79.2% 423 1,263 4,158 237 2.1% 3.3% 24.4% 5.7% 7.5x 0.30x 5.3x 0.30x 5.1x
J Sainsbury PLC SBRY-GB 2.52 57.2% 5,567 6,825 38,246 1,467 6.8% 1.9% 6.6% 3.8% 21.9x 0.18x 4.7x 0.18x 3.6x
Kroger Co. KR 22.81 69.7% 18,400 31,968 121,162 5,168 (1.2%) 3.3% 20.0% 4.3% 6.1x 0.26x 6.2x 0.26x 6.0x
Natural Grocers by Vitamin Cottage NGVC 10.27 41.9% 230 275 883 50 8.7% 9.8% 23.9% 5.6% 22.8x 0.31x 5.5x 0.30x 5.9x
Royal Ahold Delhaize N.V. AD-NL 22.44 83.0% 26,560 29,919 54,973 4,305 NM NM 29.8% 7.8% 12.8x 0.54x 6.9x 0.41x 5.3x
Sprouts Farmers Markets, Inc. SFM 20.05 67.6% 2,365 2,857 5,334 350 10.6% 12.7% 32.2% 6.6% 17.2x 0.54x 8.2x 0.50x 8.3x
Tesco PLC TSCO-GB 2.85 81.9% 27,946 33,100 84,268 4,616 11.8% 1.1% 7.0% 5.5% 16.6x 0.39x 7.2x 0.41x 6.4x
Village Super Market, Inc. VLGEA 26.48 82.2% 266 34 1,636 64 1.7% 0.7% 25.9% 3.9% 14.2x 0.02x 0.5x NA NA
Weis Markets, Inc. WMK 37.80 65.4% 1,017 994 3,510 171 0.5% 6.5% 23.5% 4.9% 16.7x 0.28x 5.8x NA NA
Mean 5.4% 5.3% 20.6% 5.2% 16.5x 0.35x 6.8x 0.38x 7.0x
Median 6.8% 3.3% 23.7% 5.2% 16.6x 0.31x 6.0x 0.35x 5.9x
Foodservice
Chefs' Warehouse, Inc. CHEF $31.67 80.7% $948 $1,214 $1,483 $73 11.3% 10.2% 25.3% 4.9% 44.2x 0.82x 16.6x 0.76x 13.6x
Colabor Group Inc. GCL-CA 0.60 98.8% 61 144 910 16 (9.8%) (4.6%) NM 1.8% NA 0.16x 8.8x 0.16x 8.7x
Sysco Corp. SYY 68.82 90.6% 35,372 43,563 59,955 3,188 3.7% 6.9% 18.8% 5.3% 22.8x 0.73x 13.7x 0.71x 12.0x
US Foods Holdings Corp. USFD-US 34.56 84.5% 7,551 10,840 24,383 1,022 0.8% 1.7% 17.4% 4.2% 18.4x 0.44x 10.6x 0.43x 9.3x
Mean 1.7% 4.1% 22.0% 4.0% 28.4x 0.54x 12.4x 0.52x 10.9x
Median 3.7% 6.9% 22.0% 4.9% 22.8x 0.59x 12.1x 0.57x 10.6x
Quick Service Restaurant
Jack in the Box Inc. JACK 83.20 88.5% 2,148 3,204 872 261 (11.2%) (17.4%) 30.5% 29.9% 17.9x 3.67x 12.3x 3.37x 12.0x
McDonald's Corp. MCD 198.27 98.6% 151,390 181,993 20,842 10,140 (6.5%) (6.3%) 51.2% 48.7% 26.3x 8.73x 17.9x 8.67x 17.0x
Restaurant Brands International Inc. QSR 65.80 95.0% 16,707 30,879 5,369 2,129 11.2% 10.0% 56.9% 39.6% 27.6x 5.75x 14.5x 5.52x 13.4x
Wendy's Company WEN 18.39 94.6% 4,243 6,505 1,618 394 22.7% (3.2%) 27.9% 24.3% 9.5x 4.02x 16.5x 3.82x 15.0x
Yum! Brands, Inc. YUM 102.35 98.0% 31,317 40,943 5,571 1,975 (4.5%) NM 50.9% 35.5% 24.1x 7.35x 20.7x 7.45x 19.7x
Mean 2.3% (4.2%) 43.5% 35.6% 21.1x 5.91x 16.4x 5.77x 15.4x
Median (4.5%) (4.8%) 50.9% 35.5% 24.1x 5.75x 16.5x 5.52x 15.0x
Fast Casual
Chipotle Mexican Grill , Inc. CMG $659.97 90.8% $18,290 $17,555 $5,025 $660 10.3% 5.8% 16.9% 13.1% NM 3.49x 26.6x 3.24x 25.2x
El Pollo Loco Holdings Inc. LOCO 10.48 56.7% 403 467 439 51 7.7% 6.9% 16.6% 11.5% NA 1.06x 9.2x 1.05x 7.7x
Fiesta Restaurant Group, Inc. FRGI 14.18 45.9% 389 468 685 65 3.3% (0.7%) 15.6% 9.6% NM 0.68x 7.1x 0.69x 7.0x
Habit Restaurants, Inc. HABT 10.20 55.7% 212 208 418 36 21.4% 19.9% 9.7% 8.5% NM 0.50x 5.8x 0.45x 5.7x
Noodles & Co. NDLS 7.23 53.6% 318 364 457 30 1.6% (0.5%) 8.6% 6.6% NA 0.80x 12.1x 0.78x 9.9x
Potbelly Corp. PBPB 5.03 35.5% 120 107 418 24 (2.7%) 2.9% 8.2% 5.7% NA 0.26x 4.5x 0.26x 4.5x
Shake Shack, Inc. SHAK 61.35 87.5% 2,693 2,667 493 76 29.3% 33.5% 16.7% 15.4% NM 5.41x 35.2x 4.55x NM
Wingstop, Inc. WING 79.68 97.2% 2,343 2,627 164 48 19.3% 26.5% 77.1% 29.2% NM 16.03x NM 13.51x NM
Mean 11.3% 11.8% 21.2% 12.4% NA 3.53x 14.4x 3.07x 10.0x
Median 9.0% 6.4% 16.1% 10.5% NA 0.93x 9.2x 0.91x 7.3x
LTM Revenue Growth LTM Margins EV / LTM EV / 2019E
PAGE |
PUBLIC COMPARABLES1
9
FOOD AND BEVERAGE
INDUSTRY UPDATE │ JUNE 2019
Price at As a % of Market Enterprise P/E
($ in millions, except per share data) Ticker 5/31/19 52-wk High Cap Value Revenue EBITDA 1 Year 3 Years Gross EBITDA Multiple Revenue EBITDA Revenue EBITDA
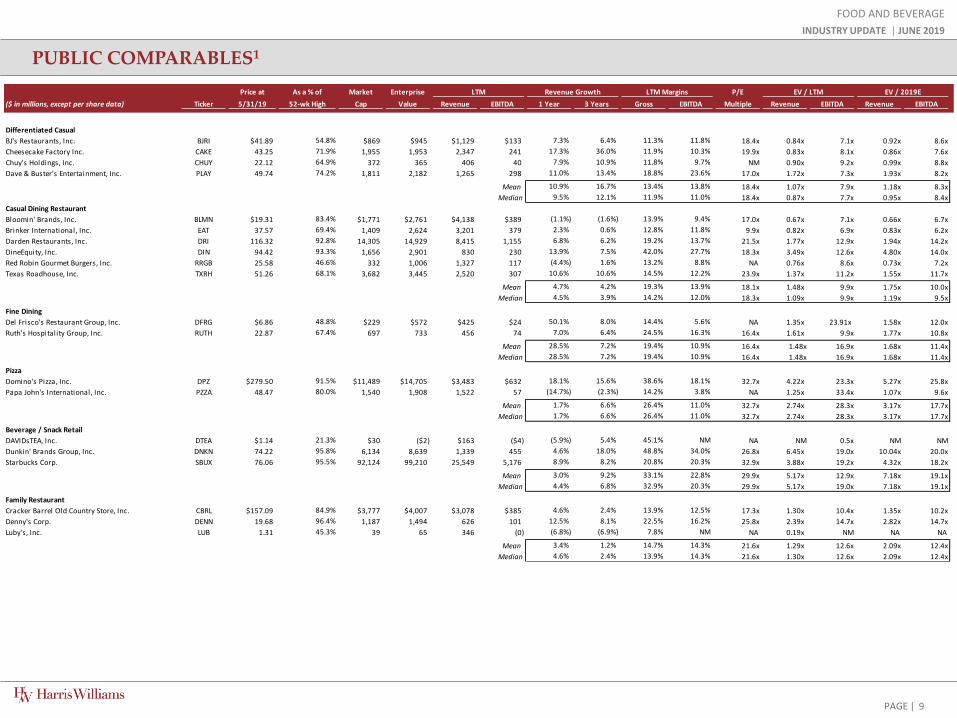
Differentiated Casual
BJ's Restaurants, Inc. BJRI $41.89 54.8% $869 $945 $1,129 $133 7.3% 6.4% 11.3% 11.8% 18.4x 0.84x 7.1x 0.92x 8.6x
Cheesecake Factory Inc. CAKE 43.25 71.9% 1,955 1,953 2,347 241 17.3% 36.0% 11.9% 10.3% 19.9x 0.83x 8.1x 0.86x 7.6x
Chuy's Holdings, Inc. CHUY 22.12 64.9% 372 365 406 40 7.9% 10.9% 11.8% 9.7% NM 0.90x 9.2x 0.99x 8.8x
Dave & Buster's Entertainment, Inc. PLAY 49.74 74.2% 1,811 2,182 1,265 298 11.0% 13.4% 18.8% 23.6% 17.0x 1.72x 7.3x 1.93x 8.2x
Mean 10.9% 16.7% 13.4% 13.8% 18.4x 1.07x 7.9x 1.18x 8.3x
Median 9.5% 12.1% 11.9% 11.0% 18.4x 0.87x 7.7x 0.95x 8.4x
Casual Dining Restaurant
Bloomin' Brands, Inc. BLMN $19.31 83.4% $1,771 $2,761 $4,138 $389 (1.1%) (1.6%) 13.9% 9.4% 17.0x 0.67x 7.1x 0.66x 6.7x
Brinker International, Inc. EAT 37.57 69.4% 1,409 2,624 3,201 379 2.3% 0.6% 12.8% 11.8% 9.9x 0.82x 6.9x 0.83x 6.2x
Darden Restaurants, Inc. DRI 116.32 92.8% 14,305 14,929 8,415 1,155 6.8% 6.2% 19.2% 13.7% 21.5x 1.77x 12.9x 1.94x 14.2x
DineEquity, Inc. DIN 94.42 93.3% 1,656 2,901 830 230 13.9% 7.5% 42.0% 27.7% 18.3x 3.49x 12.6x 4.80x 14.0x
Red Robin Gourmet Burgers, Inc. RRGB 25.58 46.6% 332 1,006 1,327 117 (4.4%) 1.6% 13.2% 8.8% NA 0.76x 8.6x 0.73x 7.2x
Texas Roadhouse, Inc. TXRH 51.26 68.1% 3,682 3,445 2,520 307 10.6% 10.6% 14.5% 12.2% 23.9x 1.37x 11.2x 1.55x 11.7x
Mean 4.7% 4.2% 19.3% 13.9% 18.1x 1.48x 9.9x 1.75x 10.0x
Median 4.5% 3.9% 14.2% 12.0% 18.3x 1.09x 9.9x 1.19x 9.5x
Fine Dining
Del Frisco's Restaurant Group, Inc. DFRG $6.86 48.8% $229 $572 $425 $24 50.1% 8.0% 14.4% 5.6% NA 1.35x 23.91x 1.58x 12.0x
Ruth's Hospitality Group, Inc. RUTH 22.87 67.4% 697 733 456 74 7.0% 6.4% 24.5% 16.3% 16.4x 1.61x 9.9x 1.77x 10.8x
Mean 28.5% 7.2% 19.4% 10.9% 16.4x 1.48x 16.9x 1.68x 11.4x
Median 28.5% 7.2% 19.4% 10.9% 16.4x 1.48x 16.9x 1.68x 11.4x
Pizza
Domino's Pizza, Inc. DPZ $279.50 91.5% $11,489 $14,705 $3,483 $632 18.1% 15.6% 38.6% 18.1% 32.7x 4.22x 23.3x 5.27x 25.8x
Papa John's International, Inc. PZZA 48.47 80.0% 1,540 1,908 1,522 57 (14.7%) (2.3%) 14.2% 3.8% NA 1.25x 33.4x 1.07x 9.6x
Mean 1.7% 6.6% 26.4% 11.0% 32.7x 2.74x 28.3x 3.17x 17.7x
Median 1.7% 6.6% 26.4% 11.0% 32.7x 2.74x 28.3x 3.17x 17.7x
Beverage / Snack Retail
DAVIDsTEA, Inc. DTEA $1.14 21.3% $30 ($2) $163 ($4) (5.9%) 5.4% 45.1% NM NA NM 0.5x NM NM
Dunkin' Brands Group, Inc. DNKN 74.22 95.8% 6,134 8,639 1,339 455 4.6% 18.0% 48.8% 34.0% 26.8x 6.45x 19.0x 10.04x 20.0x
Starbucks Corp. SBUX 76.06 95.5% 92,124 99,210 25,549 5,176 8.9% 8.2% 20.8% 20.3% 32.9x 3.88x 19.2x 4.32x 18.2x
Mean 3.0% 9.2% 33.1% 22.8% 29.9x 5.17x 12.9x 7.18x 19.1x
Median 4.4% 6.8% 32.9% 20.3% 29.9x 5.17x 19.0x 7.18x 19.1x
Family Restaurant
Cracker Barrel Old Country Store, Inc. CBRL $157.09 84.9% $3,777 $4,007 $3,078 $385 4.6% 2.4% 13.9% 12.5% 17.3x 1.30x 10.4x 1.35x 10.2x
Denny's Corp. DENN 19.68 96.4% 1,187 1,494 626 101 12.5% 8.1% 22.5% 16.2% 25.8x 2.39x 14.7x 2.82x 14.7x
Luby's, Inc. LUB 1.31 45.3% 39 65 346 (0) (6.8%) (6.9%) 7.8% NM NA 0.19x NM NA NA
Mean 3.4% 1.2% 14.7% 14.3% 21.6x 1.29x 12.6x 2.09x 12.4x
Median 4.6% 2.4% 13.9% 14.3% 21.6x 1.30x 12.6x 2.09x 12.4x
LTM Revenue Growth LTM Margins EV / LTM EV / 2019E
PAGE |
PUBLIC EQUITY MARKET OVERVIEW
10
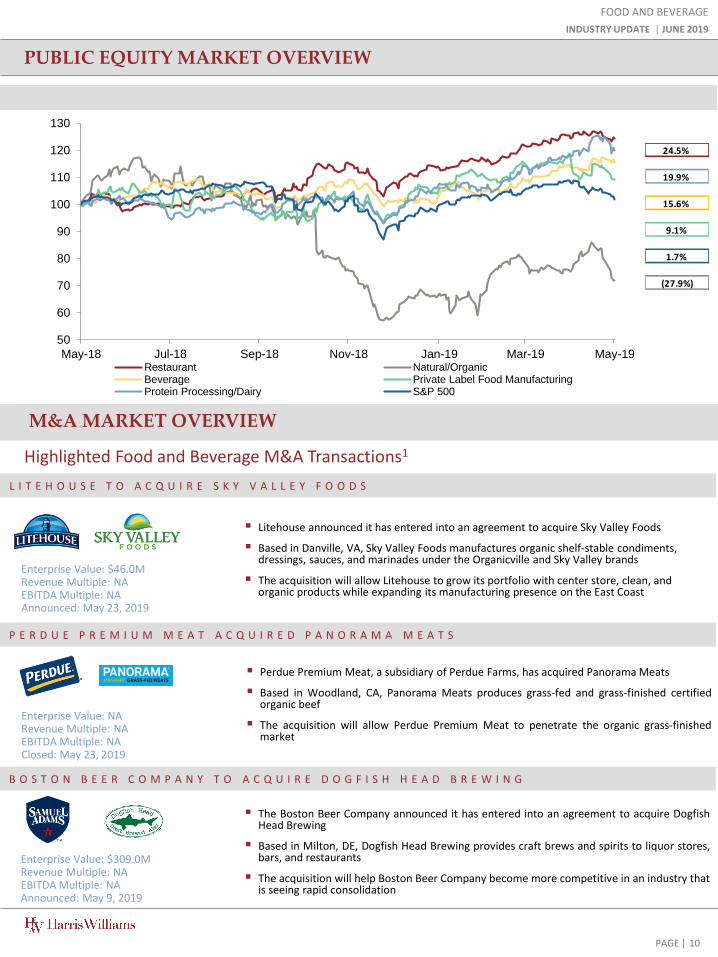
F O O D A N D B E V E R A G E I N D U S T R Y S T O C K P E R F O R M A N C E I N D E X 4
FOOD AND BEVERAGE
INDUSTRY UPDATE │ JUNE 2019
M&A MARKET OVERVIEW
F O O D A N D B E V E R A G E I N D U S T R Y S T O C K P E R F O R M A N C E I N D E X 4
Highlighted Food and Beverage M&A Transactions1
Litehouse announced it has entered into an agreement to acquire Sky Valley Foods
Based in Danville, VA, Sky Valley Foods manufactures organic shelf-stable condiments, dressings, sauces, and marinades under the Organicville and Sky Valley brands
The acquisition will allow Litehouse to grow its portfolio with center store, clean, and organic products while expanding its manufacturing presence on the East Coast
L I T E H O U S E T O A C Q U I R E S K Y V A L L E Y F O O D S
Enterprise Value: $46.0MRevenue Multiple: NA EBITDA Multiple: NAAnnounced: May 23, 2019
P E R D U E P R E M I U M M E A T A C Q U I R E D P A N O R A M A M E A T S
Perdue Premium Meat, a subsidiary of Perdue Farms, has acquired Panorama Meats
Based in Woodland, CA, Panorama Meats produces grass-fed and grass-finished certifiedorganic beef
The acquisition will allow Perdue Premium Meat to penetrate the organic grass-finishedmarket
Enterprise Value: NARevenue Multiple: NAEBITDA Multiple: NAClosed: May 23, 2019
B O S T O N B E E R C O M P A N Y T O A C Q U I R E D O G F I S H H E A D B R E W I N G
The Boston Beer Company announced it has entered into an agreement to acquire DogfishHead Brewing
Based in Milton, DE, Dogfish Head Brewing provides craft brews and spirits to liquor stores,bars, and restaurants
The acquisition will help Boston Beer Company become more competitive in an industry thatis seeing rapid consolidation
Enterprise Value: $309.0MRevenue Multiple: NAEBITDA Multiple: NAAnnounced: May 9, 2019
50
60
70
80
90
100
110
120
130
May-18 Jul-18 Sep-18 Nov-18 Jan-19 Mar-19 May-19Restaurant Natural/OrganicBeverage Private Label Food ManufacturingProtein Processing/Dairy S&P 500
24.5%
19.9%
15.6%
9.1%
1.7%
(27.9%)
PAGE |
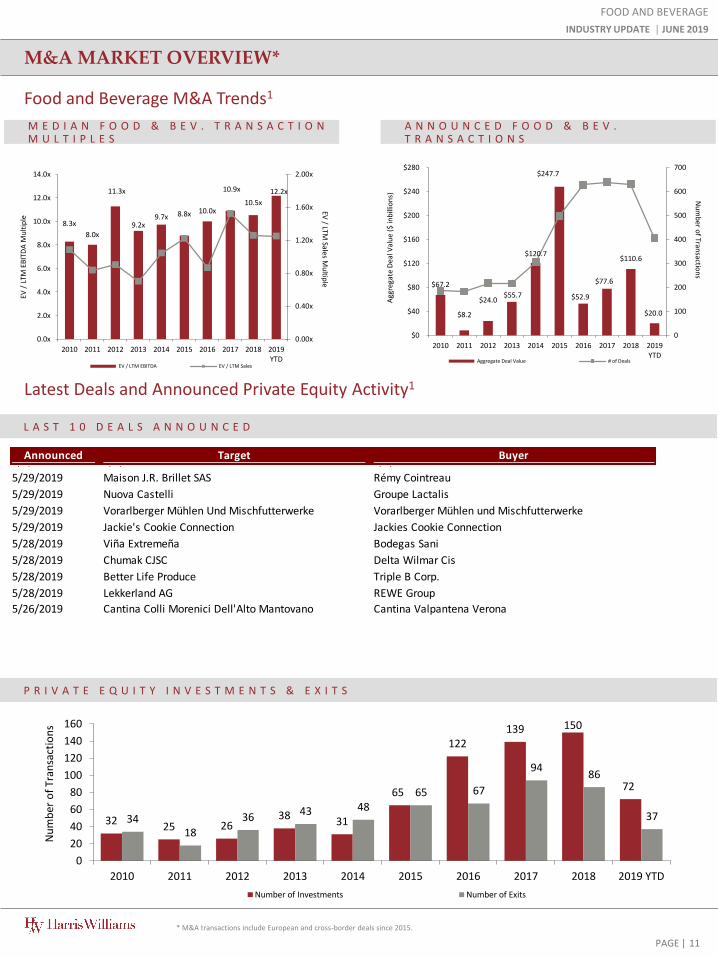
M&A MARKET OVERVIEW*
M E D I A N F O O D & B E V . T R A N S A C T I O N M U L T I P L E S
FOOD AND BEVERAGE
INDUSTRY UPDATE │ JUNE 2019
P R I V A T E E Q U I T Y I N V E S T M E N T S & E X I T S
L A S T 1 0 D E A L S A N N O U N C E D
Latest Deals and Announced Private Equity Activity1
Food and Beverage M&A Trends1
A N N O U N C E D F O O D & B E V . T R A N S A C T I O N S
* M&A transactions include European and cross-border deals since 2015.
11
8.3x
8.0x
11.3x
9.2x 9.7x 8.8x 10.0x
10.9x
10.5x
12.2x
0.00x
0.40x
0.80x
1.20x
1.60x
2.00x
0.0x
2.0x
4.0x
6.0x
8.0x
10.0x
12.0x
14.0x
2010 2011 2012 2013 2014 2015 2016 2017 2018 2019YTD
EV / LTM
Sales Mu
ltiple
EV /
LTM
EB
ITD
A M
ult
iple
EV / LTM EBITDA EV / LTM Sales
$67.2
$8.2
$24.0$55.7
$120.7
$247.7
$52.9
$77.6
$110.6
$20.0
0
100
200
300
400
500
600
700
$0
$40
$80
$120
$160
$200
$240
$280
2010 2011 2012 2013 2014 2015 2016 2017 2018 2019YTD
Nu
mb
er of Tran
saction
s
Agg
rega
te D
eal V
alu
e ($
inb
illio
ns)
Aggregate Deal Value # of Deals
3225 26
3831
65
122139 150
72
3418
3643 48
65 67
9486
37
0
20
40
60
80
100
120
140
160
2010 2011 2012 2013 2014 2015 2016 2017 2018 2019 YTD
Nu
mb
er o
f Tr
ansa
ctio
ns
Number of Investments Number of Exits
Announced Target Buyer1/0/1900 0 Cargill, Incorporated1/0/1900 1/0/1900 1/0/1900
5/29/2019 Maison J.R. Brillet SAS Rémy Cointreau
5/29/2019 Nuova Castelli Groupe Lactalis
5/29/2019 Vorarlberger Mühlen Und Mischfutterwerke Vorarlberger Mühlen und Mischfutterwerke
5/29/2019 Jackie's Cookie Connection Jackies Cookie Connection
5/28/2019 Viña Extremeña Bodegas Sani
5/28/2019 Chumak CJSC Delta Wilmar Cis
5/28/2019 Better Life Produce Triple B Corp.
5/28/2019 Lekkerland AG REWE Group
5/26/2019 Cantina Colli Morenici Dell'Alto Mantovano Cantina Valpantena Verona
PAGE |
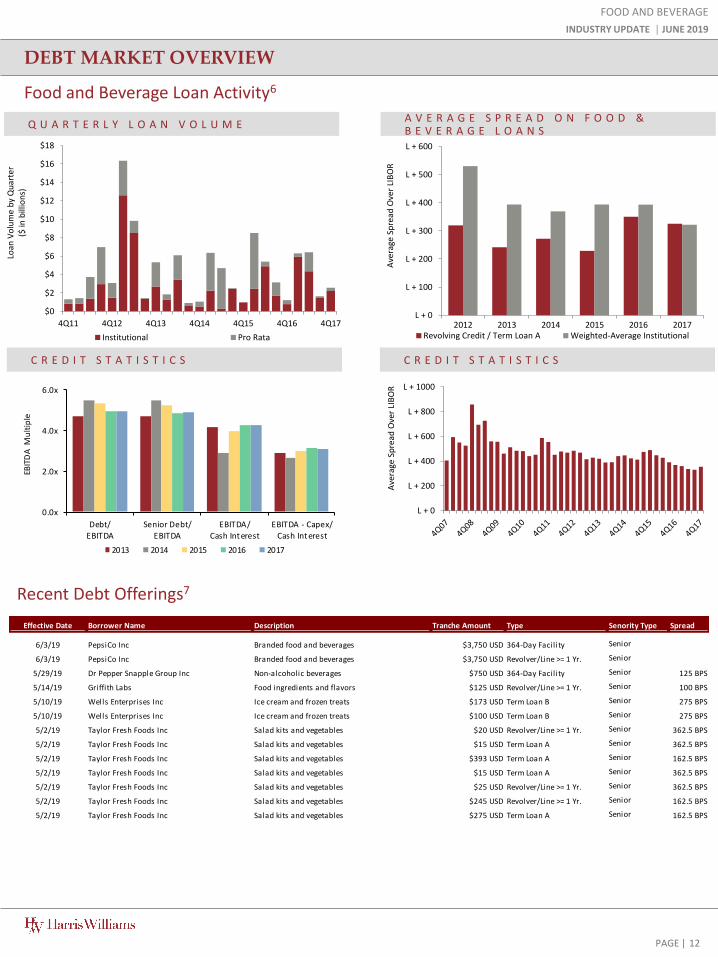
DEBT MARKET OVERVIEW
Q U A R T E R L Y L O A N V O L U M E
FOOD AND BEVERAGE
INDUSTRY UPDATE │ JUNE 2019
Food and Beverage Loan Activity6
A V E R A G E S P R E A D O N F O O D & B E V E R A G E L O A N S
C R E D I T S T A T I S T I C S C R E D I T S T A T I S T I C S
Recent Debt Offerings7
$0
$2
$4
$6
$8
$10
$12
$14
$16
$18
4Q11 4Q12 4Q13 4Q14 4Q15 4Q16 4Q17
Loan
Vo
lum
e b
y Q
uar
ter
($ in
bill
ion
s)
Institutional Pro Rata
L + 0
L + 100
L + 200
L + 300
L + 400
L + 500
L + 600
2012 2013 2014 2015 2016 2017
Ave
rage
Sp
read
Ove
r LI
BO
R
Revolving Credit / Term Loan A Weighted-Average Institutional
L + 0
L + 200
L + 400
L + 600
L + 800
L + 1000A
vera
ge S
pre
ad O
ver
LIB
OR
0.0x
2.0x
4.0x
6.0x
Debt/
EBITDA
Senior Debt/
EBITDA
EBITDA/
Cash Interest
EBITDA - Capex/
Cash Interest
EBIT
DA
Mu
ltip
le
2013 2014 2015 2016 2017
12
Effective Date Borrower Name Description Tranche Amount Type Senority Type Spread
6/3/19 PepsiCo Inc Branded food and beverages $3,750 USD 364-Day Facility Senior
6/3/19 PepsiCo Inc Branded food and beverages $3,750 USD Revolver/Line >= 1 Yr. Senior
5/29/19 Dr Pepper Snapple Group Inc Non-alcoholic beverages $750 USD 364-Day Facility Senior 125 BPS
5/14/19 Griffith Labs Food ingredients and flavors $125 USD Revolver/Line >= 1 Yr. Senior 100 BPS
5/10/19 Wells Enterprises Inc Ice cream and frozen treats $173 USD Term Loan B Senior 275 BPS
5/10/19 Wells Enterprises Inc Ice cream and frozen treats $100 USD Term Loan B Senior 275 BPS
5/2/19 Taylor Fresh Foods Inc Salad kits and vegetables $20 USD Revolver/Line >= 1 Yr. Senior 362.5 BPS
5/2/19 Taylor Fresh Foods Inc Salad kits and vegetables $15 USD Term Loan A Senior 362.5 BPS
5/2/19 Taylor Fresh Foods Inc Salad kits and vegetables $393 USD Term Loan A Senior 162.5 BPS
5/2/19 Taylor Fresh Foods Inc Salad kits and vegetables $15 USD Term Loan A Senior 362.5 BPS
5/2/19 Taylor Fresh Foods Inc Salad kits and vegetables $25 USD Revolver/Line >= 1 Yr. Senior 362.5 BPS
5/2/19 Taylor Fresh Foods Inc Salad kits and vegetables $245 USD Revolver/Line >= 1 Yr. Senior 162.5 BPS
5/2/19 Taylor Fresh Foods Inc Salad kits and vegetables $275 USD Term Loan A Senior 162.5 BPS
PAGE |
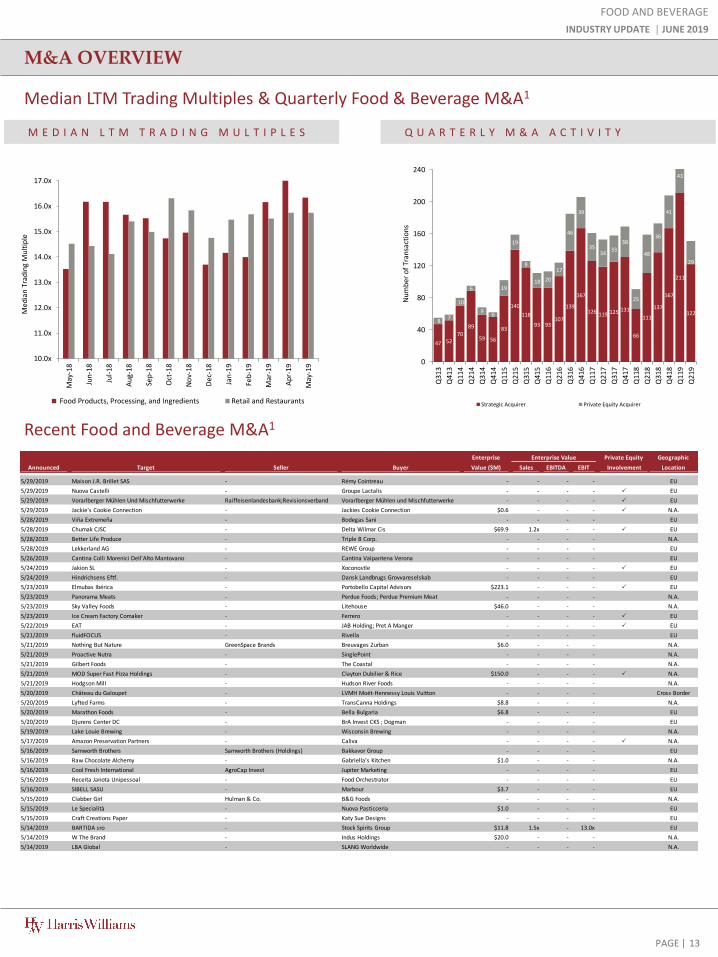
M&A OVERVIEW
M E D I A N L T M T R A D I N G M U L T I P L E S
FOOD AND BEVERAGE
INDUSTRY UPDATE │ JUNE 2019
Median LTM Trading Multiples & Quarterly Food & Beverage M&A1
Q U A R T E R L Y M & A A C T I V I T Y
Recent Food and Beverage M&A1
13
Enterprise Enterprise Value Private Equity Geographic
Announced Target Seller Buyer Value ($M) Sales EBITDA EBIT Involvement Location
5/29/2019 Maison J.R. Brillet SAS - Rémy Cointreau - - - - EU
5/29/2019 Nuova Castelli - Groupe Lactalis - - - - P EU
5/29/2019 Vorarlberger Mühlen Und Mischfutterwerke Raiffeisenlandesbank;Revisionsverband Vorarlberger Mühlen und Mischfutterwerke - - - - P EU
5/29/2019 Jackie's Cookie Connection - Jackies Cookie Connection $0.6 - - - P N.A.
5/28/2019 Viña Extremeña - Bodegas Sani - - - - EU
5/28/2019 Chumak CJSC - Delta Wilmar Cis $69.9 1.2x - - P EU
5/28/2019 Better Life Produce - Triple B Corp. - - - - N.A.
5/28/2019 Lekkerland AG - REWE Group - - - - EU
5/26/2019 Cantina Colli Morenici Dell'Alto Mantovano - Cantina Valpantena Verona - - - - EU
5/24/2019 Jakion SL - Xoconostle - - - - P EU
5/24/2019 Hindrichsens Eftf. - Dansk Landbrugs Grovvareselskab - - - - EU
5/23/2019 Elmubas Ibérica - Portobello Capital Advisors $223.1 - - - P EU
5/23/2019 Panorama Meats - Perdue Foods; Perdue Premium Meat - - - - N.A.
5/23/2019 Sky Valley Foods - Litehouse $46.0 - - - N.A.
5/23/2019 Ice Cream Factory Comaker - Ferrero - - - - P EU
5/22/2019 EAT - JAB Holding; Pret A Manger - - - - P EU
5/21/2019 fluidFOCUS - Rivella - - - - EU
5/21/2019 Nothing But Nature GreenSpace Brands Breuvages Zurban $6.0 - - - N.A.
5/21/2019 Proactive Nutra - SinglePoint - - - - N.A.
5/21/2019 Gilbert Foods - The Coastal - - - - N.A.
5/21/2019 MOD Super Fast Pizza Holdings - Clayton Dubilier & Rice $150.0 - - - P N.A.
5/21/2019 Hodgson Mill - Hudson River Foods - - - - N.A.
5/20/2019 Château du Galoupet - LVMH Moët-Hennessy Louis Vuitton - - - - Cross Border
5/20/2019 Lyfted Farms - TransCanna Holdings $8.8 - - - N.A.
5/20/2019 Marathon Foods - Bella Bulgaria $6.8 - - - EU
5/20/2019 Djurens Center DC - BrA Invest CKS ; Dogman - - - - EU
5/19/2019 Lake Louie Brewing - Wisconsin Brewing - - - - N.A.
5/17/2019 Amazon Preservation Partners - Caliva - - - - P N.A.
5/16/2019 Samworth Brothers Samworth Brothers (Holdings) Bakkavor Group - - - - EU
5/16/2019 Raw Chocolate Alchemy - Gabriella's Kitchen $1.0 - - - N.A.
5/16/2019 Cool Fresh International AgroCap Invest Jupiter Marketing - - - - EU
5/16/2019 Receita Janota Unipessoal - Food Orchestrator - - - - EU
5/16/2019 SIBELL SASU - Marbour $3.7 - - - EU
5/15/2019 Clabber Girl Hulman & Co. B&G Foods - - - - N.A.
5/15/2019 Le Specialità - Nuova Pasticceria $1.0 - - - EU
5/15/2019 Craft Creations Paper - Katy Sue Designs - - - - EU
5/14/2019 BARTIDA sro - Stock Spirits Group $11.8 1.5x - 13.0x EU
5/14/2019 W The Brand - Indus Holdings $20.0 - - - N.A.
5/14/2019 LBA Global - SLANG Worldwide - - - - N.A.
47 5270
89
59 56
83
140
118
93 93107
139
167
126 119 125 131
66
111
137
167
211
122
87
10
6
96
19
19
8
18 20
17
46
39
3534
33
38
25
48
36
41
43
29
0
40
80
120
160
200
240
Q31
3
Q41
3
Q11
4
Q21
4
Q31
4
Q41
4
Q11
5
Q21
5
Q31
5
Q41
5
Q11
6
Q21
6
Q31
6
Q41
6
Q11
7
Q21
7
Q31
7
Q41
7
Q11
8
Q21
8
Q31
8
Q41
8
Q11
9
Q21
9
Nu
mb
er o
f Tr
ansa
ctio
ns
Strategic Acquirer Private Equity Acquirer
10.0x
11.0x
12.0x
13.0x
14.0x
15.0x
16.0x
17.0x
May
-18
Jun
-18
Jul-
18
Au
g-18
Sep
-18
Oct
-18
No
v-18
Dec
-18
Jan
-19
Feb
-19
Mar
-19
Ap
r-19
May
-19
Med
ian
Tra
din
g M
ult
iple
Food Products, Processing, and Ingredients Retail and Restaurants
PAGE |
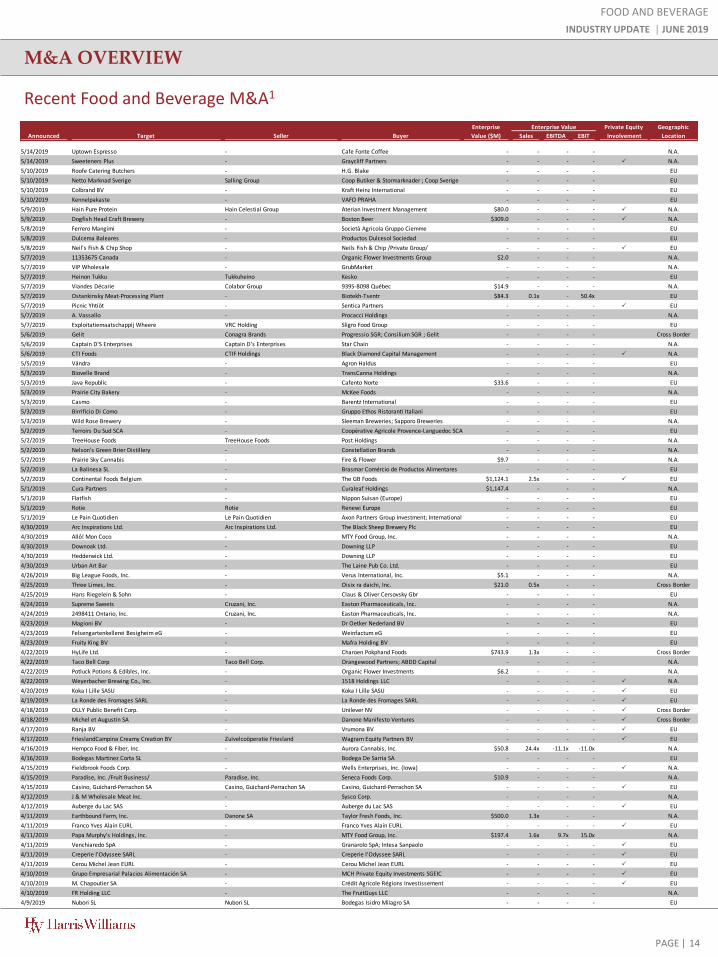
M&A OVERVIEW
FOOD AND BEVERAGE
INDUSTRY UPDATE │ JUNE 2019
Recent Food and Beverage M&A1
14
Enterprise Enterprise Value Private Equity Geographic
Announced Target Seller Buyer Value ($M) Sales EBITDA EBIT Involvement Location
5/14/2019 Uptown Espresso - Cafe Fonte Coffee - - - - N.A.
5/14/2019 Sweeteners Plus - Graycliff Partners - - - - P N.A.
5/10/2019 Roofe Catering Butchers - H.G. Blake - - - - EU
5/10/2019 Netto Marknad Sverige Salling Group Coop Butiker & Stormarknader ; Coop Sverige - - - - EU
5/10/2019 Colbrand BV - Kraft Heinz International - - - - EU
5/10/2019 Kennelpakaste - VAFO PRAHA - - - - EU
5/9/2019 Hain Pure Protein Hain Celestial Group Aterian Investment Management $80.0 - - - P N.A.
5/9/2019 Dogfish Head Craft Brewery - Boston Beer $309.0 - - - P N.A.
5/8/2019 Ferrero Mangimi - Società Agricola Gruppo Ciemme - - - - EU
5/8/2019 Dulcema Baleares - Productos Dulcesol Sociedad - - - - EU
5/8/2019 Neil's Fish & Chip Shop - Neils Fish & Chip /Private Group/ - - - - P EU
5/7/2019 11353675 Canada - Organic Flower Investments Group $2.0 - - - N.A.
5/7/2019 VIP Wholesale - GrubMarket - - - - N.A.
5/7/2019 Heinon Tukku Tukkuheino Kesko - - - - EU
5/7/2019 Viandes Décarie Colabor Group 9395-8098 Québec $14.9 - - - N.A.
5/7/2019 Ostankinsky Meat-Processing Plant - Biotekh-Tsentr $84.3 0.1x - 50.4x EU
5/7/2019 Picnic Yhtiöt - Sentica Partners - - - - P EU
5/7/2019 A. Vassallo - Procacci Holdings - - - - N.A.
5/7/2019 Exploitatiemaatschappij Wheere VRC Holding Sligro Food Group - - - - EU
5/6/2019 Gelit Conagra Brands Progressio SGR; Consilium SGR ; Gelit - - - - Cross Border
5/6/2019 Captain D'S Enterprises Captain D's Enterprises Star Chain - - - - N.A.
5/6/2019 CTI Foods CTIF Holdings Black Diamond Capital Management - - - - P N.A.
5/5/2019 Vändra - Agron Haldus - - - - EU
5/3/2019 Biovelle Brand - TransCanna Holdings - - - - N.A.
5/3/2019 Java Republic - Cafento Norte $33.6 - - - EU
5/3/2019 Prairie City Bakery - McKee Foods - - - - N.A.
5/3/2019 Casmo - Barentz International - - - - EU
5/3/2019 Birrificio Di Como - Gruppo Ethos Ristoranti Italiani - - - - EU
5/3/2019 Wild Rose Brewery - Sleeman Breweries; Sapporo Breweries - - - - N.A.
5/2/2019 Terroirs Du Sud SCA - Coopérative Agricole Provence-Languedoc SCA - - - - EU
5/2/2019 TreeHouse Foods TreeHouse Foods Post Holdings - - - - N.A.
5/2/2019 Nelson's Green Brier Distillery - Constellation Brands - - - - N.A.
5/2/2019 Prairie Sky Cannabis - Fire & Flower $9.7 - - - N.A.
5/2/2019 La Balinesa SL - Brasmar Comércio de Productos Alimentares - - - - EU
5/2/2019 Continental Foods Belgium - The GB Foods $1,124.1 2.5x - - P EU
5/1/2019 Cura Partners - Curaleaf Holdings $1,147.4 - - - N.A.
5/1/2019 Flatfish - Nippon Suisan (Europe) - - - - EU
5/1/2019 Rotie Rotie Renewi Europe - - - - EU
5/1/2019 Le Pain Quotidien Le Pain Quotidien Axon Partners Group Investment; International Group Services; Le Pain Quotidien- - - - EU
4/30/2019 Arc Inspirations Ltd. Arc Inspirations Ltd. The Black Sheep Brewery Plc - - - - EU
4/30/2019 Allô! Mon Coco - MTY Food Group, Inc. - - - - N.A.
4/30/2019 Downoak Ltd. - Downing LLP - - - - EU
4/30/2019 Hedderwick Ltd. - Downing LLP - - - - EU
4/30/2019 Urban Art Bar - The Laine Pub Co. Ltd. - - - - EU
4/26/2019 Big League Foods, Inc. - Verus International, Inc. $5.1 - - - N.A.
4/25/2019 Three Limes, Inc. - Oisix ra daichi, Inc. $21.0 0.5x - - Cross Border
4/25/2019 Hans Riegelein & Sohn - Claus & Oliver Cersovsky Gbr - - - - EU
4/24/2019 Supreme Sweets Cruzani, Inc. Easton Pharmaceuticals, Inc. - - - - N.A.
4/24/2019 2498411 Ontario, Inc. Cruzani, Inc. Easton Pharmaceuticals, Inc. - - - - N.A.
4/23/2019 Magioni BV - Dr Oetker Nederland BV - - - - EU
4/23/2019 Felsengartenkellerei Besigheim eG - Weinfactum eG - - - - EU
4/23/2019 Fruity King BV - Mafra Holding BV - - - - EU
4/22/2019 HyLife Ltd. - Charoen Pokphand Foods $743.9 1.3x - - Cross Border
4/22/2019 Taco Bell Corp Taco Bell Corp. Orangewood Partners; ABDD Capital - - - - N.A.
4/22/2019 Potluck Potions & Edibles, Inc. - Organic Flower Investments $6.2 - - - N.A.
4/22/2019 Weyerbacher Brewing Co., Inc. - 1518 Holdings LLC - - - - P N.A.
4/20/2019 Koka I Lille SASU - Koka I Lille SASU - - - - P EU
4/19/2019 La Ronde des Fromages SARL - La Ronde des Fromages SARL - - - - P EU
4/18/2019 OLLY Public Benefit Corp. - Unilever NV - - - - P Cross Border
4/18/2019 Michel et Augustin SA - Danone Manifesto Ventures - - - - P Cross Border
4/17/2019 Ranja BV - Vrumona BV - - - - P EU
4/17/2019 FrieslandCampina Creamy Creation BV Zuivelcoöperatie Friesland Wagram Equity Partners BV - - - - P EU
4/16/2019 Hempco Food & Fiber, Inc. - Aurora Cannabis, Inc. $50.8 24.4x -11.1x -11.0x N.A.
4/16/2019 Bodegas Martinez Corta SL - Bodega De Sarria SA - - - - EU
4/15/2019 Fieldbrook Foods Corp. - Wells Enterprises, Inc. (Iowa) - - - - P N.A.
4/15/2019 Paradise, Inc. /Fruit Business/ Paradise, Inc. Seneca Foods Corp. $10.9 - - - N.A.
4/15/2019 Casino, Guichard-Perrachon SA Casino, Guichard-Perrachon SA Casino, Guichard-Perrachon SA - - - - P EU
4/12/2019 J & M Wholesale Meat Inc. - Sysco Corp. - - - - N.A.
4/12/2019 Auberge du Lac SAS - Auberge du Lac SAS - - - - P EU
4/11/2019 Earthbound Farm, Inc. Danone SA Taylor Fresh Foods, Inc. $500.0 1.3x - - N.A.
4/11/2019 Franco Yves Alain EURL - Franco Yves Alain EURL - - - - P EU
4/11/2019 Papa Murphy's Holdings, Inc. - MTY Food Group, Inc. $197.4 1.6x 9.7x 15.0x N.A.
4/11/2019 Venchiaredo SpA - Granarolo SpA; Intesa Sanpaolo - - - - P EU
4/11/2019 Creperie l'Odyssee SARL - Creperie l'Odyssee SARL - - - - P EU
4/11/2019 Cerou Michel Jean EURL - Cerou Michel Jean EURL - - - - P EU
4/10/2019 Grupo Empresarial Palacios Alimentación SA - MCH Private Equity Investments SGEIC - - - - P EU
4/10/2019 M. Chapoutier SA - Crédit Agricole Régions Investissement - - - - P EU
4/10/2019 FR Holding LLC - The FruitGuys LLC - - - - N.A.
4/9/2019 Nubori SL Nubori SL Bodegas Isidro Milagro SA - - - - EU
PAGE |
FOOD AND BEVERAGE EARNINGS RELEASE CALENDAR
FOOD AND BEVERAGE
INDUSTRY UPDATE │ JUNE 2019
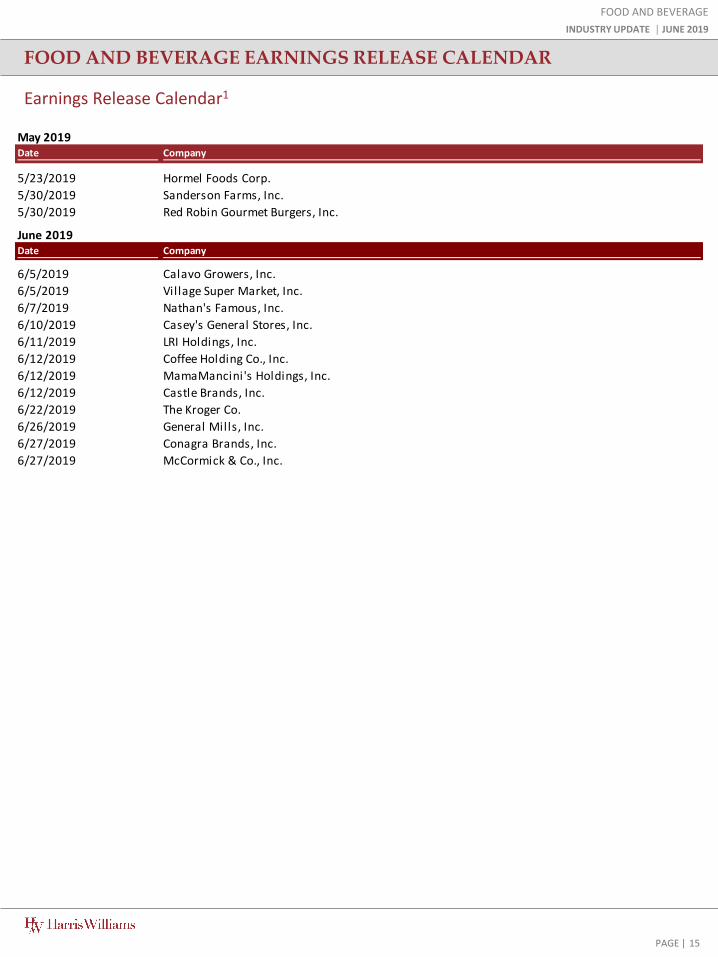
Earnings Release Calendar1
15
May 2019Date Company
5/23/2019 Hormel Foods Corp.
5/30/2019 Sanderson Farms, Inc.
5/30/2019 Red Robin Gourmet Burgers, Inc.
June 2019Date Company
6/5/2019 Calavo Growers, Inc.
6/5/2019 Village Super Market, Inc.
6/7/2019 Nathan's Famous, Inc.
6/10/2019 Casey's General Stores, Inc.
6/11/2019 LRI Holdings, Inc.
6/12/2019 Coffee Holding Co., Inc.
6/12/2019 MamaMancini's Holdings, Inc.
6/12/2019 Castle Brands, Inc.
6/22/2019 The Kroger Co.
6/26/2019 General Mills, Inc.
6/27/2019 Conagra Brands, Inc.
6/27/2019 McCormick & Co., Inc.

Energy, Power& Infrastructure
IndustrialsHealthcare & Life Sciences
Transportation & Logistics
Aerospace, Defense & Government
Services
Business Services
Building Products & Materials
Technology, Media & Telecom
Specialty Distribution
Consumer
PAGE |
HARRIS WILLIAMS OFFICE LOCATIONS
U N I T E D S T A T E S E U R O P E
B O S T O NOne International PlaceSuite 2620Boston, Massachusetts 02110Phone: +1 (617) 482-7501
C L E V E L A N D1900 East 9th Street20th FloorCleveland, Ohio 44114Phone: +1 (216) 689-2400
M I N N E A P O L I S222 South 9th StreetSuite 3350Minneapolis, Minnesota 55402Phone: +1 (612) 359-2700
R I C H M O N D ( H E A D Q U A R T E R S )1001 Haxall Point9th FloorRichmond, Virginia 23219Phone: +1 (804) 648-0072
S A N F R A N C I S C O575 Market Street31st FloorSan Francisco, California 94105Phone: +1 (415) 288-4260
W A S H I N G T O N , D . C . 800 17th St. NW2nd FloorWashington, D.C. 20006Phone: +1 202-207-2300
F R A N K F U R TBockenheimer Landstrasse 33-3560325 FrankfurtGermanyPhone: +49 069 3650638 00
L O N D O N63 Brook StreetLondon W1K 4HS, EnglandPhone: +44 (0) 20 7518 8900
Harris Williams has a broad range of industry expertise, which creates powerful opportunities. Our clients benefit from our deep-sector experience, integrated industry intelligence and collaboration across the firm, and our commitment to learning what makes them unique. For more information, visit our website at www.harriswilliams.com/industries.
FOOD AND BEVERAGE
INDUSTRY UPDATE │ JUNE 2019
16
PAGE |
HARRIS WILLIAMS
17
FOOD AND BEVERAGE
INDUSTRY UPDATE │ JUNE 2019
The information and views contained in this report were prepared by Harris Williams LLC (“Harris Williams”). It is not a research report, as such term is defined by applicable law and regulations, and is provided for informational purposes only. It is not to be construed as an offer to buy or sell or a solicitation of an offer to buy or sell any securities or financial instruments or to participate in any particular trading strategy. The information contained herein is believed by Harris Williams to be reliable but Harris Williams makes no representation as to the accuracy or completeness of such information. Harris Williams and/or its affiliates may be market makers or specialists in, act as advisers or lenders to, have positions in and effect transactions in securities of companies mentioned herein and also may provide, may have provided, or may seek to provide investment banking services for those companies. In addition, Harris Williams and/or its affiliates or their respective officers, directors and employees may hold long or short positions in the securities, options thereon or other related financial products of companies discussed herein. Opinions, estimates and projections in this report constitute Harris Williams’ judgment and are subject to change without notice. The securities and financial instruments discussed in this report may not be suitable for all investors and investors must make their own investment decisions using their own independent advisors as they believe necessary and based upon their specific financial situations and investment objectives. Also, past performance is not necessarily indicative of future results. No part of this material may be copied or duplicated in any form or by any means, or redistributed, without Harris Williams’ prior written consent.
Harris Williams LLC is a registered broker-dealer and member of FINRA and SIPC. Harris Williams & Co. Ltd is a private limited company incorporated under English law with its registered office at 5th Floor, 6 St. Andrew Street, London EC4A 3AE, UK, registered with the Registrar of Companies for England and Wales (registration number 07078852). Harris Williams & Co. Ltd is authorized and regulated by the Financial Conduct Authority. Harris Williams & Co. Corporate Finance Advisors GmbH is registered in the commercial register of the local court of Frankfurt am Main, Germany, under HRB 107540. The registered address is Bockenheimer Landstrasse 33-35, 60325 Frankfurt am Main, Germany (email address: [email protected]). Geschäftsführer/Directors: Jeffery H. Perkins, Paul Poggi. (VAT No. awaited). Harris Williams is a trade name under which Harris Williams LLC, Harris Williams & Co. Ltd and Harris Williams & Co. Corporate Finance Advisors GmbH conduct business.
D I S C L O S U R E S
S O U R C E S
1. Factset
2. U.S. Bureau of Labor Statistics
3. Unweighted Average
4. US Census Bureau
5. Thomson Financial
6. S&P
7. Reuters