
Fomc 19941115 g Bpt 119941109
43
Prefatory Note The attached document represents the most complete and accurate version available based on original copies culled from the files of the FOMC Secretariat at the Board of Governors of the Federal Reserve System. This electronic document was created through a comprehensive digitization process which included identifying the best- preserved paper copies, scanning those copies, 1 and then making the scanned versions text-searchable. 2 Though a stringent quality assurance process was employed, some imperfections may remain. Please note that this document may contain occasional gaps in the text. These gaps are the result of a redaction process that removed information obtained on a confidential basis. All redacted passages are exempt from disclosure under applicable provisions of the Freedom of Information Act. 1 In some cases, original copies needed to be photocopied before being scanned into electronic format. All scanned images were deskewed (to remove the effects of printer- and scanner-introduced tilting) and lightly cleaned (to remove dark spots caused by staple holes, hole punches, and other blemishes caused after initial printing). 2 A two-step process was used. An advanced optimal character recognition computer program (OCR) first created electronic text from the document image. Where the OCR results were inconclusive, staff checked and corrected the text as necessary. Please note that the numbers and text in charts and tables were not reliably recognized by the OCR process and were not checked or corrected by staff.
-
Upload
fraser-federal-reserve-archive -
Category
Documents
-
view
213 -
download
0
Transcript of Fomc 19941115 g Bpt 119941109

Prefatory Note
The attached document represents the most complete and accurate version available based on original copies culled from the files of the FOMC Secretariat at the Board of Governors of the Federal Reserve System. This electronic document was created through a comprehensive digitization process which included identifying the best-preserved paper copies, scanning those copies,1 and then making the scanned versions text-searchable.2 Though a stringent quality assurance process was employed, some imperfections may remain.
Please note that this document may contain occasional gaps in the text. These gaps are the result of a redaction process that removed information obtained on a confidential basis. All redacted passages are exempt from disclosure under applicable provisions of the Freedom of Information Act.
1 In some cases, original copies needed to be photocopied before being scanned into electronic format. All scanned images were deskewed (to remove the effects of printer- and scanner-introduced tilting) and lightly cleaned (to remove dark spots caused by staple holes, hole punches, and other blemishes caused after initial printing). 2 A two-step process was used. An advanced optimal character recognition computer program (OCR) first created electronic text from the document image. Where the OCR results were inconclusive, staff checked and corrected the text as necessary. Please note that the numbers and text in charts and tables were not reliably recognized by the OCR process and were not checked or corrected by staff.

Strictly Confidential (FR) Class II FOMC
November 9, 1994
SUMMARY AND OUTLOOK
Prepared for the Federal Open Market Committeeby the staff of the Board of Governors of the Federal Reserve System

DOMESTIC NONFINANCIAL DEVELOPMENTS
Overview
Economic activity has continued to grow at an impressive clip
in recent months. Indeed, the strength of October's labor market
report suggests the distinct possibility of an acceleration in
output this quarter, in contrast to our prior forecast of a slight
moderation. Domestic final demand has held up well in the face of
higher interest rates, while the tightening of supplies and
favorable sales trends appear to be buoying business demand for
inventory. Contributing to the resiliency of the economy is the
more aggressive lending posture of banks and other intermediaries,
which has tended to offset some of the financial restraint that
might otherwise have been expected to be associated with a
tightening of monetary policy. In addition, the further
depreciation of the dollar and a brisker recovery abroad portend
somewhat more external impetus to domestic production than we
anticipated in the September Greenbook.
With the unemployment rate at 5-3/4 percent and the use of
industrial capacity near 85 percent, the economy is now past the
point of full, noninflationary utilization of productive resources.
Because this development is recent, its inflationary consequences
have yet to surface fully. The recent acceleration in average
hourly earnings hints at some firming in wages, but, at least
through September, overall compensation increases were moderated by
favorable developments on the benefits side. With unit labor costs
still increasing only slowly, and probably falling in manufacturing,
price increases for final goods and services have remained
relatively subdued to date. However, firms increasingly report that
they are expecting to pass through some of the large increase in
materials costs that they have experienced in the past year, and

I-2
these pressures are reflected in our forecast of some pickup in core
CPI inflation in the next several months.
Moreover, we believe that this near-term spurt in price
increases could easily evolve into a deterioration in the ongoing
trend of inflation unless the pace of economic expansion slows
decidedly in the next few quarters. Although we would expect a
damping influence from a slowing of inventory accumulation even
under current financial conditions, our judgment is that restoring
sustainable levels of resource utilization will also require some
additional restraint on domestic final demand. Consequently, we
have based our projection on the assumption of an appreciable
further tightening of money market conditions.
Under this assumption, growth of aggregate demand is projected
to slow markedly through mid-1995, and real GDP expansion is
expected to remain well below the pace of potential output growth
into early 1996. The easing of pressures on resources--and the
reversal of the "speed effects" associated with the recent rapid
pace of expansion--are expected to rein in the incipient
acceleration of inflation. On balance, real GDP is projected to
increase just 1-1/2 percent in 1995 and 2-1/4 percent in 1996, and
consumer price inflation is expected to end the period not much
above the 3 percent pace that we have experienced over the past
year.
Key Assumptions
In recent weeks, long-term interest rates have moved a little
higher than was anticipated in the last Greenbook--a development
entirely consistent with the surprises in the economic news. Given
the impressive resiliency of demand, we have raised our interest
rate path slightly (in nominal and real terms) in this forecast.
But, while short-term rates are assumed to increase appreciably over

I-3
the next several months, we think it probable that such a tightening
will not exact much of a toll from bond prices. More likely, the
yield curve will flatten substantially as market participants become
convinced that aggregate demand is softening enough to curb
inflationary pressures. We are projecting that nominal long term
rates will drop significantly below current levels by 1996.
Fiscal policy is assumed to remain generally restrictive.
After a blip in defense outlays in the third quarter, defense
spending should resume its contraction. Although the outcome of the
congressional election promises to produce active debate about
fiscal policies, we do not foresee any major alteration in the
direction of the federal budget within the projection horizon and
continue to assume a path for federal outlays consistent with the
constraints imposed by OBRA-93. The unified budget deficit, which
ended FY1994 at $203 billion, is projected at $188 billion in FY1995
and $205 billion in FY1996.
The recent weakness of the dollar on exchange markets was not
foreseen in the last Greenbook, and the current projection
anticipates that the dollar will firm a bit from the recent level
over the medium term and then remain unchanged--at a level nearly
2 percent lower, on a trade-weighted basis, than in the September
forecast. We expect the dollar to be buttressed initially by the
near-term policy tightening and later by a pattern of economic
developments that bolsters confidence in our willingness and ability
to control inflation, even if interest rates do not rise as far as
the markets seem to be anticipating. In addition, incoming
information on economic activity abroad has prompted another small
upward revision to our forecast of foreign GDP growth. On an
export-weighted basis, foreign GDP is expected to rise at just under
a 4 percent annual rate through the end of the projection period.

I-4
Oil markets have firmed somewhat earlier than we had previously
anticipated, and the spot price of WTI is now near the $18.50 per
barrel level, where we expect it to hold for the remainder of the
projection period.
Recent Developments and the Outlook for the Current Quarter
We are projecting that real GDP will grow at about a 4 percent
annual rate in the current quarter. At this stage, the available
information on activity consists principally of the October labor
market report and a few data on output in the industrial sector.
The low level of initial claims for unemployment insurance points to
sustained growth of payrolls into November. Even if the jump in the
average workweek in October is reversed, aggregate hours of private
production workers appear headed for a quarterly increase of
5 percent or more (annual rate). However, we are anticipating that
labor productivity will change little, after spurting in the third
quarter.
The data on hours worked in manufacturing and the available
physical output indicators point to a big increase in factory
production this quarter. Purchasing managers and other industry
contacts generally report strong order flows, with capacity limiting
production in some instances. Motor vehicle producers have recently
had some difficulty getting assemblies up to the levels that they
need in order to allow dealers to restock models in short supply;
nonetheless, they remain optimistic that production of light
vehicles will ramp up from the recent pace of less than 12 million
units (annual rate) to a 12-3/4 million unit rate in November and
December. All told, the motor vehicle sector should contribute
almost 1 percentage point to growth of factory output this quarter
and almost 1/2 percentage point to GDP growth.

I-5
The strength of production and hiring in recent months appears
to reflect an assessment by businesses that final demand will remain
buoyant through year-end, and we share that view: We are projecting
that production gains this quarter will be more than absorbed by
final sales. Although we expect inventory accumulation to be less
than in the third quarter, we believe that tighter supplies and a
desire to assume that stocks are sufficient to satisfy rising demand
will encourage businesses to maintain a relatively high rate of
inventory investment for a while longer.
Real personal consumption expenditures are projected to post a
relatively robust gain--roughly 4-1/2 percent--in the current
quarter. The recent labor market report points to a large increase
in wage and salary income, and consumer attitudes--including
opinions about buying conditions and the willingness to use credit
and savings--remain generally favorable. Sales of light vehicles in
October were well above the average for the third quarter, and
improving supplies of popular models should help sustain strong
sales in the near term.
Growth of business fixed investment is expected to remain rapid
this quarter. Orders for nondefense capital goods have continued to
trend up smartly, with strong demand for a broad range of industrial
machinery as well as acceleration in bookings for computers.
1. Based on the current-cost data on manufacturing and wholesaletrade inventories for September, the BEA's estimated change innonfarm stocks in the third quarter appears to have been roughly $12billion (annual rate) too high. That is, the change in nonfarmstocks last quarter may have been around $45 billion (annual rate),down from the second-quarter pace of almost $52 billion.
Because our forecast provides our best estimate of growth of realGDP, we have "artificially" added $12 billion to our projections ofthe level of inventory investment so that the quarterly changes ininventory investment will accurately reflect our best guess of theircontribution to overall growth.
Although we now believe that inventory investment was lower thanBEA estimated in the third quarter, incoming data have pointed to apartially offsetting upward revision to final sales, principallybusiness fixed investment. On balance, we think that third-quarterGDP growth will remain a touch above 3 percent.
I-6
Permits for nonresidential construction have risen markedly in
recent months, and we expect that spending in this area will
increase noticeably this quarter.
Housing activity should slip, however, owing to the effects of
higher mortgage rates. Although the Michigan SRC consumer survey
shows households' perceptions of homebuying conditions to be
relatively favorable as of October, homebuilders and others report
signs of weakening demand. We are projecting that single-family
starts, which were 1.22 million units (annual rate) in the third
quarter, will average 1.15 million units this quarter.
As for the remaining components of expenditure, we are
expecting that real net exports will reverse a portion of the third-
quarter decline. In the government sector, federal purchases are
expected to turn back down, but this should be offset by another
moderate increase in state and local purchases.
For inflation, we are projecting that the CPI excluding food
and energy will rise at a 3-1/2 percent annual rate this quarter, or
about 0.3 percent per month, which is slightly above the recent
pace. The firming in prices is expected to be most noticeable for
consumer goods; for these items, some modest price effects from
strong demand, rising production costs, and higher import prices are
anticipated to show through. Nonetheless, owing to favorable
developments for food and energy prices, the overall CPI is expected
to rise 3 percent.
The Outlook for the Economy in 1995 and 1996
Growth of real GDP is projected to slow sharply over the next
three quarters, reflecting a slackening of the pace of both final
sales and inventory investment. Owing to the higher level of real
interest rates than previously assumed, economic growth does not
return to a pace matching that of potential output until the latter

I-7
part of 1996. The unemployment rate is projected to rise next year
and to edge above the NAIRU in 1996; with goods output decelerating
and capacity expanding a bit faster, the factory utilization rate is
projected to drop appreciably by 1996. Although we are showing some
acceleration in core inflation in the near term, the easing of
pressure on productive resources is projected to return the trend in
CPI inflation to about 3 percent in 1996.
STAFF REAL GDP PROJECTION(Percent change, annual rate)
1994 1995Q3 Q4 Q1 Q2 H2 1996
Real GDP 3.4 4.1 2.5 1.4 1.2 2.2Previous 2.8 1.9 1.7 1.9 2.3
Final sales 3.1 4.8 2.4 2.2 1.8 2.2Previous 3.7 2.1 2.0 2.2 2.3
Real PCE 3.0 4.3 2.5 2.2 1.6 1.9Previous 2.9 2.5 1.8 1.9 2.1
Substantial uncertainties attach to any forecast, and recent
developments have underscored two key areas of concern as we attempt
to gauge the cyclical forces in the economy. The first is the
difficulty in assessing the extent and timing with which various
sectors of final demand will respond to movements in interest rates;
in the current instance, we need also to cope with an unusual
pattern of financial developments in the period of monetary
tightening, including a depreciating dollar and easing credit
supplies. The second area of concern is the difficulty in judging
how fast businesses will seek to gear down their accumulation of
inventories; gauging desired levels of stocks is always a tricky
affair. While we believe that a pattern of activity at least
roughly along the lines we are describing is the most probable, we
recognize that many other scenarios are possible: These range from

I-8
a quicker softening in demand, which obviates further money market
tightening and approximates the proverbial soft landing, to more
persistent momentum in growth, which necessitates greater policy
tightening than we have assumed and looks somewhat more like the
traditional inflationary boom-bust cycle. At this point, we would
view the probability distribution as skewed slightly toward the
latter.
Inventory investment. The pace of inventory investment over
the past two quarters--which has raised nonfarm stocks at around a
5 percent annual rate--is clearly unsustainable. Nonetheless, with
firms now seemingly optimistic about sales prospects and reportedly
more concerned about the availability or cost of supplies, we do not
think that the rate of accumulation will drop precipitously.
Certainly, auto dealers would like to operate with somewhat higher
stocks, and, in other sectors, until capacity pressures ease some, a
broad range of firms is likely to want some cushion--even while
retaining longer-range plans for implementing more streamlined,
just-in-time production and distribution systems.
Our forecast shows nonfarm inventory building running at about
the current pace into early 1995. As final demand begins to
decelerate perceptibly, the move to adjust orders and production
probably will come fairly quickly. The sluggishness of sales will
likely work against the immediate achievement of desired stock
levels, however, and inventory investment is thus projected to be a
significant negative contributor to GDP growth over the last three
quarters of 1995 (to the tune of a bit more than 1/2 percentage
point). In 1996, inventory investment is expected to be an
essentially neutral factor in output growth.
Consumer spending. Beginning early in 1995, slower jobs gains
and income growth, along with rising interest rates, are projected

I-9
to generate a marked deceleration in consumer spending. The
sharpest slowing occurs in the demand for durables. After rising
7-3/4 percent during 1994, real outlays on durables are projected to
increase just over 1 percent, on average, in 1995 and then to grow
moderately faster in 1996. We are forecasting that households will
begin to forgo purchases of new motor vehicles early next year, with
sales dipping below 15 million units (annual rate) by mid year;
sales then firm a bit in 1996, to around a 15-1/4 million unit rate.
Households are also anticipated to take a breather after the recent
steep run-up in purchases of home goods; in addition to the
influences of income and financing, the decline in housing activity
is expected to result in slower spending on furniture and
appliances. For nondurables and services--where spending tends to
track trends in income more closely--the projected deceleration is
more modest in 1995 than in the case of durables, and growth remains
moderate in 1996.
The personal saving rate rises noticeably over the next two
years. This pattern reflects the moderation of demands for durable
goods after a period in which some pent-up demands were satisfied,
as well as a response to the rise in real interest rates and in
debt-service burdens.
Residential investment. We now expect that interest rates on
fixed-rate mortgages will continue to edge up through early next
year; although they are likely to drop back noticeably by 1996,
rates are projected to remain higher in real terms than we had
previously anticipated. Moreover, adjustable rate financing, which
has recently been seen as an attractive alternative to fixed-rate
loans, will become more costly as money market conditions tighten.
Against that backdrop, we are expecting to see single-family housing
starts decline considerably in the coming months, reaching a low of

I-10
1.05 million units (annual rate) in the third quarter of next year.
After mortgage interest rates turn back down, homebuilding is
anticipated to firm gradually, with single-family starts reaching
1.13 million units by the end of 1996. It is noteworthy, however,
that even at the forecasted lows in 1995, single-family starts
remain well above the pace of the early 1990s, when cash-flow
affordability was less favorable.
In the multifamily sector, we have retained a very slight
upward tilt to the projected level of starts over the next two
years. Although the rental vacancy rate remains relatively high on
a national basis, market conditions have improved sufficiently in
some locales to support new construction. Financing is anticipated
to remain available to qualified developers.
Business fixed investment. Owing to the recent strength in
sales and profits, business investment will likely carry greater
momentum into 1995 than we previously thought it would. However,
given the less favorable financial environment and the sharper
deceleration in economic activity that we now are projecting for
next year, the slowing in capital spending over the course of 1995
is greater than in our previous projection. Real spending on
business equipment is projected grow at a 12 percent annual rate in
the first quarter of next year, but then is expected to drop to a
3-1/2 percent pace by year-end. As output growth picks up in 1996,
demand for equipment should also begin to expand a bit faster.
While the growth in equipment spending this year has been fairly
broadly based, the growth during the next two years is anticipated
to come almost entirely from a continued appreciable expansion of
real computer purchases. Declining computer prices are likely to
keep the user cost of such capital low even while interest rates
substantially exceed the rate of general inflation.
Our projection of outlays for nonresidential structures remains
roughly the same as in the previous Greenbook: Over the next year,
we expect the expansion of industrial and commercial facilities to
contribute importantly to an improved pace of outlays for
nonresidential building; overall, real spending is projected to rise
6-1/2 percent during 1995. But with economic activity expanding
only slowly, nonresidential construction is expected to slow again
in 1996, rising only about 4 percent.
Net exports. The changes in the outlook for the dollar, for
growth abroad, and for domestic demand have combined to move the
forecasted contribution of real net exports more clearly in a
positive direction. After having subtracted an estimated
2/3 percentage point from growth of real GDP in 1994, real net
exports contribute marginally to growth in both 1995 and 1996. (A
full discussion of this sector is contained in the International
Developments section.)
Government purchases. The ongoing contraction in real federal
government purchases was interrupted last quarter by a surge in
defense outlays and a smaller uptick in nondefense spending. About
$2 billion of our $7-1/2 billion "surprise" relative to the last
Greenbook reflects military spending for operations in Haiti. A
similar one-time expenditure is expected this quarter as a result of
the military buildup in the Persian Gulf, and a small amount of
additional spending for both operations will temper the decline in
purchases in the first quarter of 1995. The remainder of last
quarter's surprise is assumed to represent the bunching of
deliveries that will spill over into this quarter as well. We
expect that, after these transitory boosts to defense outlays are
behind us, there will be a steep decline in federal purchases during
the first half of 1995, moving the level of spending back on trend.

I-12
The contraction in defense outlays is then expected to taper off,
with declines of 6-1/4 percent in the second half of next year and
4-1/2 percent in 1996. Nondefense purchases are projected to fall
at just over a 1 percent rate, on average, during the projection
period.
Real state and local government purchases are expected to rise
at an annual rate of 2-1/2 percent during the next two years. This
moderate growth path represents a balancing of rising pressures for
public services and infrastructure improvements against voter
preferences for tax reduction. We are forecasting a continued
modest expansion of state and local employment and moderate growth
in outlays for structures.
Labor markets. Growth in labor demand is expected to slow
gradually in 1995, with the average workweek dropping back somewhat
and monthly payroll employment gains receding to less than 100,000
during the second and third quarters. As a result, by year-end the
unemployment rate is projected to move back up to 6.1 percent--our
current point estimate of the NAIRU. With output growth still
running shy of potential in 1996, employment growth should pick up
only modestly and the unemployment rate is projected to drift up
further to 6-1/4 percent. Uncertainties associated with the
introduction of the new household survey continue to make
interpretation of the labor force data especially difficult. We are
assuming that, with a fairly tight labor market, the participation
rate will rise gradually from here.
Businesses will likely act fairly promptly to reduce growth in
their payrolls as production and sales decelerate. However, the
pace of activity is expected to be sufficiently sluggish from mid-
to late-1995 that firms will be unable to avoid a period in which
labor productivity growth falls well short of its underlying,

I-13
cyclically adjusted trend, which we estimate to be about 1.4 percent
per annum. The growth of output per hour is projected to recede to
less than 1 percent (annual rate) in the second half of next year.
Assuming businesses will remain cautious as economic activity picks
up in 1996, labor productivity is likely to accelerate somewhat.
STAFF LABOR MARKET PROJECTION 1
(Percent change, at annual rates, except as noted)
1994 1995Q4 HI H2 1996
Nonfarm payroll employment 2.4 1.5 .8 1.1Previous 2.3 1.0 1.2 1.3
Output per hour. nonfarm business -.1 1.6 .7 1.3Previous .7 1.1 1.0 1.4
Civilian unemployment rate 5.7 5.8 6.1 6.3Previous 6.0 6.2 6.3 6.3
1. Percent changes are from final quarter of previous period tofinal quarter of period indicated.
2. Average for final quarter of period.
Wages and prices. Because resource utilization currently is
tighter than we previously anticipated, we are now forecasting a
more noticeable upturn in wage and price inflation for early
1995.2 With labor markets assumed to remain tight in the near
term, the trend in ECI compensation is projected to accelerate from
3.3 percent over the twelve months ended in September to
3-3/4 percent by the middle of next year. In particular, wage
increases are likely to break above the 3 percent trend that has
been apparent in the ECI for the past several years; by the second
quarter of 1995, the year-over-year change in ECI wages and salaries
is projected to be about 3-1/2 percent. We are anticipating that
trends in benefit costs will be little changed, with health
2. The projection incorporates the changes in CPI measurementthat are discussed in the Appendix to the Nonfinancial Developmentssection of Part 2. All told, the effect of the changes is to lowerCPI inflation by about 0.1 percentage point per year.

I-14
insurance cost increases remaining relatively moderate and pension
fund contributions continuing to rise substantially.
STAFF INFLATION PROJECTION(Percent change, annual rate)
1994 1995Q4 Q1 Q2 H2 1996
CPI 3.1 3.7 3.3 3.0 2.9Previous 3.3 3.7 3.2 3.1 3.0
Excl. food and energy 3.5 3.8 3.6 3.2 3.1Previous 3.6 3.5 3.2 3.2 3.1
ECI 3.6 3.8 3.8 3.7 3.6Previous 2.7 3.6 3.6 3.6 3.5
The projected rise in the core CPI over the first half of 1995
is now 3-3/4 percent, which will boost the year-over-year change
from 3 percent as of this September to 3-1/2 percent in mid-1995.
The acceleration is expected to occur largely, if not entirely, in
the goods component of the index. That pickup in inflation is
expected to be the result of the combined influence of several
factors, which overlap and whose effects cannot be readily
separated: the pressures from higher costs of materials on the
pricing of finished goods; the effect that the speed with which
production and sales have firmed recently is expected to have on
materials costs and price markups; and the direct and indirect
effect of rising prices of non-oil imports. By the first quarter of
1995, the CPI for consumer goods (excluding food and energy) is
projected to be rising at a 3-3/4 percent annual rate, up from less
than a 2 percent rate over the first three quarters of this year.
The CPI for energy, which has fluctuated widely in recent
quarters, is anticipated to swing up sharply again in the first
quarter of 1995. In particular, higher prices of crude oil and the
switch to reformulated gasoline should lead to a substantial rise in

I-15
retail prices of petroleum products. Energy prices are expected to
rise relatively moderately thereafter, restrained by the assumed
stability in world oil prices. Food prices are projected to rise at
a moderate rate throughout the projection.
In the second half of 1995, we expect that the impetus to
inflation from tight resource utilization will have begun to ease; a
small output gap is assumed to open in 1996. Thus, we expect that
an unwinding of "speed effects" along with the emergence of a small
margin of slack will slow the core CPI noticeably. At the same
time, a stable dollar should reduce the rate of increase in prices
of imported goods to a pace below that of domestic goods. All told,
by 1996, the trend in the core CPI is projected to be back down to
just over 3 percent. Because of the moderate pace of food and
energy prices, overall CPI inflation is projected to run a shade
below the core rate.

Strictly Confidential (FR)
Class II FOMCSTAFF PROJECTIONS OF CHANGES IN GDP PRICES, AND UNEMPLOYMENT
(Percent annual rate) November 9, 1994
ANNUAL
1992219932
1994
19951996
QUARTERLY
1993 Ql2
Q22
Q32Q42
1994 Q12Q22
Q32
Q4
1995 Q1Q2Q3
Q4
1996 Q1Q2
Q3Q4
TWO-QUARTER3
1993 Q22
Q42
1994 Q22
Q4
1995 Q2Q4
1996 Q2
Q4
FOUR-QUARTER4
1992 Q42
1993 Q42
1994 Q41995 Q4
1996 Q4
5.2 5.2 2 3 2 35.4 5,4 3 1 3 1
59 6.1 38 39
4 9 5.1 2 3 25
45 43 21 18
4 4 4 4 1 2 1. 24.2 4 2 2 4 2 4
3 8 3 8 2.7 2 77 7 7 7 6 3 6.3
6 1 6 1 3 3 3.3
6 9 7 2 3,8 4 148 52 30 34
56 61 28 41
4 9 5.7 19 2 54 0 4.2 17 1.4
43 36 18 1 04 4 3.8 2 0 1.5
4 8 4 5 2 2 1.8
4 7 4 6 2 3 2.2
4 6 47 2 3 2.3
46 48 23 24
4.3 4 3 1.8 1.8 3 3 3.3 3 1 3 1 -. 3 -3
5.7 5 7 4 5 4 5 2.2 2 2 2 4 2.4 -. 5 - 5
6 5 6 3 6 3 7 3.0 3 0 2 4 24 -.3 - 3
5 2 5 7 2 9 3.8 2 9 2.8 3 6 3.3 -. 2 - 5
4 4 4.9 1.8 1.9 3 2 3.4 34 3.5 2 1
43 3.7 1.9 1 2 2.8 2.9 3 0 3 0 1 .3
4 7 46 2 3 2.0 3.0 3,0 3 0 2.9 .0 1
4 6 4 8 2.3 2.4 2.8 2.9 3.0 2 9 0 .1
6.4 6.4 3.7 3,7 3 2 3 2 3.1 3 1 3 3
5 0 5.0 3.1 3 1 2.8 2.8 2.7 2 7 -8 -8
5.9 6 2 3.3 3 8 3.0 29 30 2.9 -5 -. 8
4.4 4.3 1 8 1.5 3.0 3.1 3 2 3.3 .3 .4
4 7 4 7 23 2.2 2.9 2 9 3.0 2.9 0 2
1 For all urban consumers.
2 Actual
3 Percent change from two quarters earlier; for unemployment rate, change in percentage points.
4. Percent change from four quarters earlier; for unemployment rate, change in percentage points

Strictly Confidential (FR) REAL GROSS DOMESTIC PRODUCT AND RELATED ITEMS, ANNUAL VALUESClass II FOMC (Seasonally adjusted annual rate) November 9, 1994
Projected
Item Unit1 1988 1989 1990 1991 1992 1993 1994 1995 1996
EXPENDITURES
Nominal GDP Bill 4900. 4 5250 8 5546 1 5724 8 6020 2 6343 3 6729 4 7074 3 7379 9Real GDP Bill 87$ 4718 6 4838.0 4897 3 4867 6 4979 3 5134 5 5337 1 5471 8 5570 5
Real GDP change 3 3 1 6 2 3 3 7 3 1 3 8 1.5 2 2Gross domestic purchases 2 5 9 - 4 - 1 4 1 3 9 4 3 14 2 1Final sales 4 2 1.5 1 2 - 4 3 8 3 0 2 9 2.1 2 2Private dom. final purch 4 2 5 - 1 - 8 5 1 5 0 4 2 2 4 2 4
Personal cons expend 4 2 12 7 0 4 2 3 0 3 3 1,9 1.9Durables 8 5 - 5 - 8 -1 3 9 6 9 0 7 6 1 1 2 3Nondurables 3 2 1 2 - 1 -1 6 3 2 1.3 2 7 1 6 1 5Services 3 7 1 7 1 7 1 2 3 5 2 5 2 5 2 4 2.1
Business fixed invest. 5 5 - 4 7 -6 2 6 7 16.0 10.3 7,0 4 3Producers' dur. equip 9 1 -1 7 2 9 -3 2 11 0 21.3 12.9 7 1 4.4Nonres structures -1 2 2 3 -3 9 -12 4 -3.4 1 6 2.1 6 5 3 9
Res structures 9 -7 7 -15 2 7 17 0 8.1 1,1 -4 9 3 0
Exports 13 5 11 3 6 7 81 5.0 5.8 8 3 8 6 9.1Imports 3 6 2.6 4 4.0 8,6 12,4 11 9 6 2 7 2
Government purchases 2 2.0 3.3 - 8 7 -1 0 -. 1 -. 7 5Federal -3 4 - 6 2.8 -3 2 .8 -6.9 -3,4 -6.3 -3 2
Defense -3 2 -1 5 1 5 -7 0 -1 3 -9 0 -4 5 -8 8 -4 5State and local 2 9 4 0 3 6 8 .6 3.0 1.9 2 5 2.5
Change in bus. invent. Bill 878 19 9 29.8 5 7 -1 1 2 5 15 3 51.5 43 0 28 4Nonfarm 26 9 29.9 3 2 -1.3 -2 0 18 5 44 3 39 4 26 1
Net exports -104 0 -73 7 -54 7 -19,5 -32.3 -73 9 -112 1 -110 3 -100 6
Nominal GDP % change 7 7 6 0 4 7 3.5 6 4 5 0 6 2 4 3 4 7
EMPLOYMENT AND PRODUCTION
onfarm payroll employ Millions 105 2 107,9 109.4 108 3 108 6 110.5 113 4 115 5 116 7
,nemployment rate 5 5 5 3 5.5 6.7 7 4 6 8 6 1 5 9 6 2
Industrial prod index 4 change 3 2 - 1 - 2 - 3 3 2 4 2 6 4 1 9 2 6Capacity util. rate-mfg 4 83.6 83.1 81.1 77 8 78 6 80 6 83 7 84 4 83 4
Housing starts Millions 1.49 1 38 1 19 1 01 1.20 1,29 1.42 1,35 1.41
Light Motor Vehicle Sales 15.43 14 53 13 85 12 31 12 80 13 89 15,10 15.13 15 25
Auto sales in U.S. 10,63 9.91 9 50 8.39 8 35 8 72 9.24 9.17 9 28North American prod. 7.54 7 08 6 90 6 14 6.26 6.75 7 25 7 34 7 53
Other 3.10 2.83 2.60 2.25 2 10 1 97 1 99 1.83 1 75
INCOME AND SAVING
Nominal GNP Bill $ 4908.2 5266,8 5567 8 5740.8 6025.8 6347 8 6722 1 7050 1 7347 7
Nominal GNP % change 7 8 61 4 9 3.2 6 1 5.0 6 0 4 1 4 6
Nominal personal income 7 1 6 5 6 5 3 7 8 1 2.8 6 6 5 4 5.2
Real disposable income 3 2 1.1 1.1 9 5 0 5 3 8 2 0 2.2
Personal saving rate t 4 4 4.0 4.2 5.0 5 5 4 1 4 0 4 2 46
corp profits, IVA&CCAdj t change 10.2 -6.3 2.3 8 8 9 6 23 4 3.9 -3.1 6.0
Profit share of GNP % 7.4 6.9 6.8 6.8 6.7 7.7 8 1 7 8 7 6
Federal surpl./def. Bill. $ -136.6 -122.3 -163.5 -202 9 -282.7 -241 4 -162.8 -162.8 -189,5
State/local surpl /def. 38.4 44.8 25 1 17.0 24.8 26 3 26 8 29.2 32 5
Ex social ins. funds -18.4 -17.5 -35.6 -46 5 -41.6 -40.0 -38.8 -35.3 -31 6
PRICES AND COSTS
GDP implicit deflator % change 4.2 4.4 4.5 3 3 2 6 1.8 2.4 2 7 2 4
GDP fixed-wt. price index 4.2 4.4 4 6 3 6 3 2 2 8 2.9 3.1 2.9
Gross domestic purchasesfixed-wt. price index 4 1 4.4 5.2 2.9 3 2 2 5 3.0 3 1 2 8
CPI 4 3 4,6 6.3 3.0 3 1 2 7 2.9 3 3 2 9
Ex. food and energy 4.5 4.4 5.3 4 4 3 5 3.1 3.1 3.4 3 1
ECI, hourly compensation2
4 8 4 8 4.6 4.4 3 5 3.6 3,3 3 7 3.6
onfarm business sector
Output per hour 5 -1.4 .4 2.3 3.2 1.8 8 1 2 13
Compensation per hour 3 8 3.1 6 2 4 7 5.1 24 3.3 3 8 3.7
Unit labor cost 3 3 4 6 5 7 2 3 1 9 6 2.5 2 6 2.4
1 Percent changes are from fourth quarter to fourth quarter 2. Private-industry workers.

Strictly Confidential (FR) REAL GROSS DOMESTIC PRODUCT AND RELATED ITEMS, QUARTERLY VALUESClass II FOMC (Seasonally adjusted annual rate except as noted) November 9 1994
1992 1993 1994
Item Unit Q1 Q2 Q3 Q4 Q1 Q2 Q3 Q4 Q1 Q2
EXPENDITURES
Nominal GDP Bill $ 5896 8 5971.3 6043 6 6169 3 6235 9 6299 9 6359 2 6478.1 6574 7 6689 9Real GDP Bill 87$ 4918 5 4947 5 4990 5 5060 7 5075.3 5105.4 5139.4 5218.0 5261 1 5314 1
Real GDP % change 3 1 2.4 3 5 5 7 1 2 2.4 2 7 6.3 3 3 4 1Gross domestic purchases 3.2 3.7 3 9 5 7 2.7 3 3 4 0 5 8 5.0 4 6Final sales 4.8 1.5 3 5 5 6 2 24 3.2 6 4 2.2 1 5Private dom. final purch 5 7 4 2 3 9 6 7 3 5 3.7 5.3 7.4 5.8 2 7
Personal cons expend. 5 8 1 7 3 9 5 6 1.6 2.6 3.9 4 0 4 7 1 3Durables 15 5 4 10 0 13.2 3.2 9 8 7 7 15 5 8 8 4Nondurables 4 2 - 7 2.7 6 9 -1 6 1.6 2.8 2.4 3 8 2 2Services 4 5 3 4 3 2 3 0 3 1 14 3 6 2 0 4 0 1 1
Business fixed invest. - 1 15 0 5,0 7 5 15.1 15 6 12 2 21 1 10 9 9 2Producers' dur equip. -1.3 22 7 11.0 12 9 20 0 21 6 16 2 27 5 18 6 6 1Nonres structures 2.9 -1 6 -8 9 -5 5 2 5 3 5 3 3 -11 8 20.6
Res structures 22.4 22 7 8 23 8 5 3 -7 6 9 4 28 2 10 0 7 0
Exports 6.1 1.5 5.3 7 2 -1 0 7 7 -3 2 21.7 -3 5 16 6Imports 6 6 13 0 8.4 6 5 11 6 14 9 7 4 16.0 9 5 18 9
Government purchases 1.5 -3 0 3 4 9 -5 9 1.2 1.1 - 1 -4 9 -1. 2Federal -1 3 -4 8 8 6 11 -15.4 -3.6 -3 0 -5 0 -10 3 -7 9
Defense -7.2 -5 1 11.5 -3 3 -20 0 -2 2 -9 2 -3 6 -16 0 -4 1State and local 3.3 -1 8 .1 .8 .9 4.4 3.7 2.9 -1.4 2.9
Change in bus invent. Bill 87$ -6 3 4 2 5 2 6.6 18.5 18.9 13 0 10 8 25 4 59 2Nonfarm -14 3 -1 9 1 8 6.3 19.7 22.8 20.9 10.7 22 1 51 7
Net exports -17 9 -34 1 -38 9 -38.5 -57 6 -69.3 -86.3 -82.2 -104.0 -111 8
Nominal GDP % change 7 1 5 2 4 9 8 6 4 4 4 2 3 8 7 7 6 1 7 2
-MPLOYMENT AND PRODUCTION
onfarm payroll employ Millions 108.1 108.4 108.7 109 1 109 7 110 3 110 8 111.4 112 0 113 0
Unemployment ratel 1 7 3 7.5 7.5 7 3 7 0 7.0 6.7 6 5 6 6 6 2
Industrial prod index % change .3 5 6 6 6 4 5 2 2.3 2.8 6 7 8 3 5 4
Capacity util rate-mfg 1 % 77 9 78.7 78.5 79.4 80.1 80.3 80 3 81.5 82 5 83 3
Housing starts Millions 1 24 1.15 1.19 1.24 1.15 1.24 1 31 1.48 1.37 1,44Light Motor Vehicle Sales 12 46 12.81 12.71 13.22 13 23 14 11 13.69 14 53 15.45 14 75
Auto sales in U.S 8.33 8 41 8 24 8 43 8.32 8.93 8.65 8.97 9 45 9 15
North American prod. 6.12 6.25 6.25 6 40 6.36 6.87 6.68 7.08 7 44 7 16
Other 2.21 2 16 1.99 2.03 1.96 2.07 1.97 1.89 2.00 1.99
INCOME AND SAVING
Nominal GNP Bill $ 5907.7 5979.1 6049.4 6167 0 6243.9 6303 3 6367 8 6476 2 6574 0 6682 5
Nominal GNP I change 6.8 4 9 4.8 8.0 5.1 3.9 4 2 7 0 6 2 6 8
Nominal personal income 8.2 5 6 3.7 15 3 -5.8 8.6 2.4 6 7 5 3 7 7
Real disposable income 5.9 2.1 1 7 10.6 -7.4 4.7 8 4 3 3 4 3.5
Personal saving ratel % 5.3 5 5 5 0 6.2 4.0 4 6 3.9 4.0 3 6 4.1
Corp profits, IVA&ccAdj % change 18.8 5 -40.0 101.1 9.6 30.7 18.4 37.0 -17 9 33 6
Profit share of GNP1
7 0 6 9 6.0 7.0 7 1 7.5 7.7 8 2 7.7 8.2
Federal govt. surpl./def Bill $ -279.9 -284.8 -293 9 -272 1 -283 5 -237 0 -224.9 -220.1 -176 2 -145.1
State/local surpl./def 19 9 25.9 20.4 33.1 21 6 25 3 23 9 34 5 25 2 27 0
Ex social ins funds -45.7 -40.5 -46.3 -33.8 -44.7 -41.1 -42.4 -31 7 -40 7 -38.9
PRICES AND COSTS
GDP implicit deflator % change 3 8 2 7 1.3 2 7 3.3 1.6 1.0 1.3 2.9 2 9
GDP fixed-wt. price index 3.9 3 3 2.7 2.8 4.2 2.4 2.0 2.4 3.1 2 9Gross domestic purchases
fixed-wt price index 3.6 3 4 3.2 2.5 3 3 2.6 1.6 2.4 2.5 3 2CPI 2.6 35 2.9 3 5 2.8 3.1 2.0 3.1 1 9 2.8
Ex. food and energy 3.7 3 6 3.0 3 6 3 5 3.5 2 4 2.9 2 6 3 4
,I, hourly compensation2 3.6 3.2 3 2 3.5 3 9 3.8 3.4 3.4 2 7 3 7
onfarm business sectorOutput per hour 4.2 1 9 2.8 3.8 -2 0 .4 4 0 4 9 2 9 -2.1
Compensation per hour 5 7 4 6 5.8 4.5 2.1 2.4 2.8 2.4 6 1 7
Unit labor cost 1.4 2 6 2 9 6 4.1 20 -1.2 -2.4 3 1 2.9
2 Private-industry workers1 Not at an annual rate

Strictly Confidential (FR)Class II FOC
REAL GROSS DOMESTIC PRODUCT AND RELATED ITEMS, QUARTERLY VALUES(Seasonally adjusted, annual rate except as noted) November 9, 1994
Item
EXPENDITURES
Nominal GDPReal GDP
Real GDPGross domestic purchasesFinal sales
Private dom. final purch.
Personal cons expend.DurablesNondurablesServices
Business fixed invest.Producers' dur equipNonres. structures
Res structures
ExportsImports
Government purchasesFederalDefense
State and local
Change in bus. invent.Nonfarm
Net exports
Nominal GDP
EMPLOYMENT AND PRODUCTION
Nonfarm payroll employ.Unemployment ratel
Industrial prod indexCapacity util rate-mfg1
Housing startsLight Motor Vehicle SalesAuto sales in U.S.
North American prodOther
INCOME AND SAVING
Nominal GNPNominal GNPNominal personal incomeReal disposable incomePersonal saving rate
1
corp profits, IVA&CCAdjProfit share of GNP
1
Federal govt. surpl./defState/local surpl /def
Ex social ins funds
PRICES AND COSTS
GDP implicit deflatorGDP fixed-wt. price index
Gross domestic purchases
fixed-wt. price indexCPI
Ex food and energy
OPI, hourly compensation2
Nonnfarm business sectorOutput per hourCompensation per hourUnit labor cost
Units
Bill $Bill 87$
% change
Bill 87$
% change
Millions
% change
Millions
Bill. $% change
% change
Bill. $
% change
____ ____ ____ ___ _ J ____ _ .
I IProjected
1994 1995
Q3 Q4 01
6775.95359 2
3 4
3 93 130
3 07 92 1
2 1
7 011 0-5.4-7.2
9.812 1
5 99 88 63 8
64 556 0
-118.3
5.2
113 960
6.084 1
1,4814 64
9 097 092.01
6768.95.3492.74.0
6 78 2
-154.326 5
-38.8
1 62 7
323.62.8
3 3
272.9
1
6876.95413 8
4 13 84 85 3
4 313 7
2 727
14 216 1
8 1-4 4
11.47 5
2-4 1-4 8
2.7
57 047 5
-114 4
61
114 657
5.884.9
1 4115 559.277.311.97
6862 85 78.65.84.3
-. 581
-175.628.5
-36 7
2.03.0
3.23 13.5
3.6
- 13 83 9
6972.15446 7
2 5242 43 2
2 52 02.12.8
10 911.87 5-6 6
9 07.5
-1 8-9 0
-12 52 5
57.350.8
-114 1
5.7
115 257
3785 0
1.3715.349.307 302.00
6955.85.5
68224 3
48.0
-160.130.1
-34.8
3 13 7
3 83 73 8
3 8
204 12 1
7054
-1
Q2 Q3 Q4 01
44 2 7106 8 7174 265 0 5477 9 5497 7
14 1.0 1 512 7 122.2 1.7 1.92.6 1.7 1 9
22 14 1721 -17 2 01.5 15 132 7 2.2 2 0
S1 53 398.5 5 0 3 46 4 6 3 5.8-7 2 -4 2 -1 2
9 0 8.2 8.16.8 5.4 5.3
-1.0 -.1 2-7 1 -4 8 -4.210 1 -6 7 -5 72.5 2.5 2 6
46 7 37 3 30 843 2 35.3 28 512 4 -109.1 -105 7
42 3.6 3.8
115.5 115 6 115 95.8 60 6 1
19 9 1284 7 84 2 83 8
1.34 1 33 1.3515 30 14 89 14 99
9 30 9 00 9 087 40 7 30 7 351.90 1 70 1.73
701
-15
3-3
8,8 7082 4 7143.43.7 3.7 3 54.9 4 1 5.8
9 1.7 3.14.0 4 1 4.4
5.9 3 -7.17., 7.7 7.5
i22 -155 7 -183.10 1 28 8 27 7145 -35 5 -36 5
7253 65522 8
1 81 62222
18221 42 0
4 14 14 030
8.865
4
-3 6-4 72.5
26. 624 3
-103 3
4.5
116.262
1.983 5
1 3815 139.207 451 75
7223 04 56.1
3 34.7
2.87.5
-194 229.0
-35 1
Q2 03 Q4
7335 95553 5
2 22 02 32 3
1 92 2152 0
4 24 33 93 8
9 26.6
3-3 9-5 32 4
26 724 4
-100 2
4 6
116 562
2683 4
1 4015 219 257 50
1 75
7302.14 54.81.04 5
487.5
-182 030 4
-33.6
7421.15585 9
2.32 22 22 4
2 02.21.522
4 44 53.92 8
9 17 6
5-3 2-4 3
2.4
28 926 5
-99 3
4 7
116 962
2 883 4
1.4215 29
9 307 551 75
7391.65 04 3194 5
11.17 6
-180 734 4
-29 6
2.8 2.6 2.4 2.6 2.3 2 33.1 2.9 2.8 3.1 2.8 2.9
3.1 2.9 2 7 3 1 2.7 2,83.3 3.1 2 9 2,9 2.9 2.93.6 3.2 3 1 3 1 3 1 3 1
3.8 3.7 3,7 3.7 3 7 3.6
7509 05619 7
24242325
21251.52 3
4 64 83 925
9 282
9-2.3-3.72.5
31 529 1
-99 4
4 8
117 26 3
3083 4
1.4315 37
9 357 601 75
7473 94.55.6264 6
5,57.6
-201 036 0
-28 0
2.3
2.9
2.82.93 1
3 6
1.43.6
2 1
2. Private-industry workers.
i1994
1 Not at an annual rate.
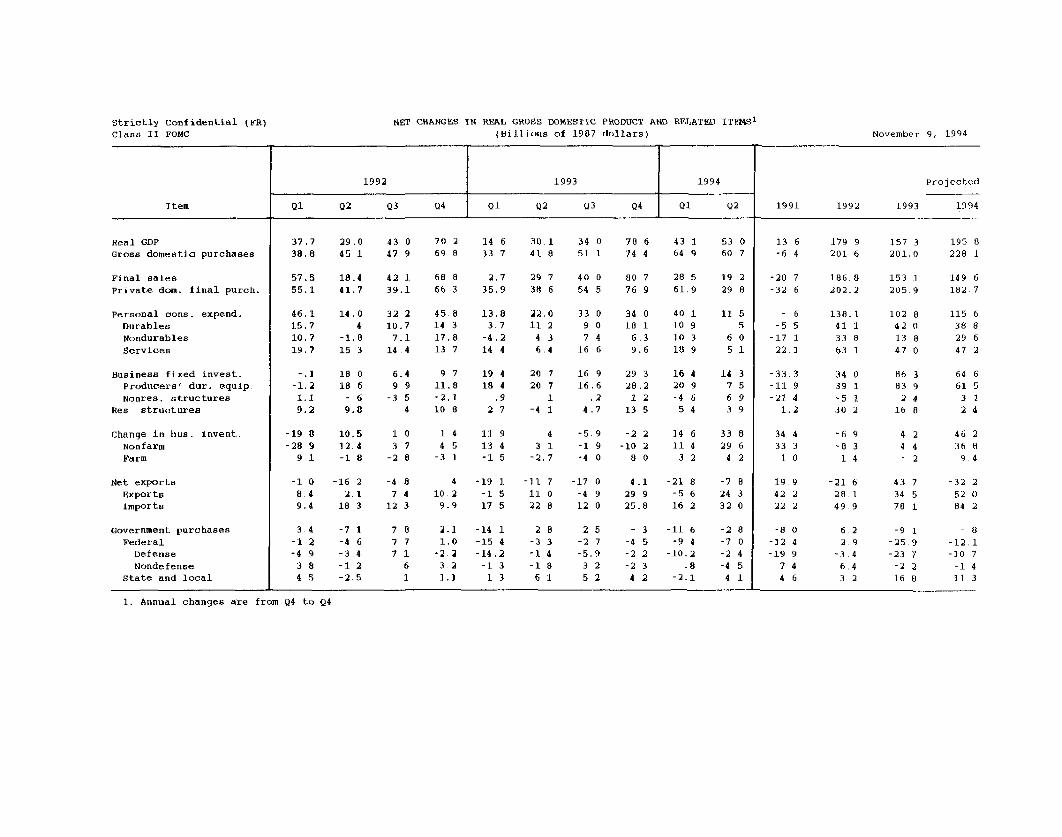
NET CHANGES IN REAL GROSS DOMESTIC PRODUCT AND RELATED ITEMS1
(Billions of 1987 dollars)
1992 1993
Item Q1 Q2 Q3 Q4 Q1 Q2 Q3 Q4
Real GDP
Gross domestic purchases
Final sales
Private dom. final purch.
Personal cons. expend.DurablesNondurables
Services
Business fixed invest.Producers' dur. equip.
Nonrea. structuresRes structures
Change in bus. invent.NonfarmFarm
Net exportsExportsImports
Government purchasesFederal
DefenseNondefense
State and local
37.7 29 038.8 45 1
43 0 70 2 14 6 30 1 34 0 78 6 43 1 53 0
47 9 69 8 33 7 41 8 51 1 74 4 64 9 60 7
57.5 18.4 42 1 68 8 2.7 29 7 40 0 80 7 28 5 19 2
55.1 41.7 39.1 66 3 35.9 38 6 54 5 76 9 61 9 29 8
46.1 14.0 32 2 45 8 13.8 22.0 33 0 34 0 4015.7 4 10.7 14 3 3.7 11 2 9 0 18 1 1010.7 -1.8 7.1 17.8 -4.2 4 3 7 4 6 3 1019.7 15 3 14 4 13 7 14 4 6 .4 16 6 9.6 18
9 7 19 411.8 18 4-2.1 .910 8 2 7
-. 1 18 0 6.4-1.2 18 6 9 91.1 - 6 -3 59.2 9.8 4
10.5 1
12.4 3
-1.8 -2
-1 0 -16 2 -4 8 4 -198 4 2.1 7 4 10 2 -1
9.4 18 3 12 3 9.9 17
-7 1-4 6-3 4-1 2-2.5
-14 1-15 4-14.2
-1 31 3
20 720 7
1-4 1
11 55
6 05 1
16 9 2916.6 28
.2 14.7 13
4 -5.9 -2
3 1 -1 9 -10-2.7 -4 0 8
-11 711 022 8
28-3 3-1 4-1,8
6 1
-17 0 4.1 -21
-4 9 29 9 -512 0 25.8 16
-11, 6
-9 4-10.2
.8-2.1
November 9, 1994
Projected
1991 1992 1993 1994
13 6 179 9 157 3 195 8-6 4 201 6 201,0 228 1
-20 7 186 8 153 1 149 6-32 6 202.2 205,9 182 7
-33 3-11 9-21 4
1.2
138.141 133 863 1
34 039 1-5 130 2
4 2 464 4 36- 2 9
21 6 4328. 1 3449.9 78
6.2 -92 9 -25
-3 4 -236,4 -23 2 16
- 8
-12. 1-10 7
-1 411 3
1. Annual changes are from Q4 to Q4
Strictly Confidential (FR)Class II FOMC
--

Strictly Confidential (FR)Class II FOMC
Item
Real GDPGross domestic purchases
Final sales
Private dom. final purch.
Personal cons. expend.Durables
NondurablesServices
Business fixed investProducers' dur. equip.Nonres. structures
Res. structures
Change in bus. invent.NonfarmFarm
Net exports
ExportsImports
Government purchasesFederal
DefenseNondefense
State and local
NET CHANGES IN REAL GROSS DOMESTIC PRODUCT AND RELATED ITEMS1
(Billions of 1987 dollars) November 9, 1994
Projected
1995 1996 Projected
01 02 Q3 Q4 Q1 Q2 Q3 04 1993 1994 1995 1996
45.1 54 6 32.9 18.3 12 9 19 8 25 1 30 8 32 3 33 851.7 50.8 32.5 16 6 9 7 16 3 22 7 27.7 31 4 33.9
39.8 62.1 32 5 29.0 22 3 26 3 29 2 30 7 30 1 31.333 1 57 9 36 3 29.6 19 4 22.3 25 9 27 0 28 0 29 4
26.1 37.9 22.1 - 19 8 1210.0 17.4 2.8 2.8 -25.8 7 5 5.9 4 1 4
10.2 13 0 13.4 12.9 10
16 0 1628 33,5 39.6 9
11.3 22 6 18 1 13 9 9.4 7.013.4 19.7 15.3 11 5 7 0 4 8-2.1 2 9 2.8 2 4 2 4 2 3-4 3 -2.6 -3 9 -4 1 -2 4 -. 7
5 3 -7 5 4 -10.74.3 -8.5 3 4 -7 71.0 1 0 -3 0 -3 0
-9.4-7.9-1 5
-6 5 3 9 4 1 7 3.2 315 3 18 0 14.7 15 1 14.0 1421.9 14 1 14 4 13 4 10.8 10
13 27 94.73.05,4
17 2 18 3 193.0 3.1 34 2 43 4
10 0 11 0 11
7 8 81 862 65 716 16 12.1 1.5 1.
2 3 2.52 2 2 5
1 0
9 - 116.9 17 416 0 17 6
-2 3-6.0-5.8-. 2
3 7
157 3 195 8 83 9 122 0201 0 228 1 75 1 115 7
153 1 149 6 110 1 121 2205.9 182 7 107 7 110 3
102.842 013 8
47 0
86 383 92,4
16 8
4 24 4- 2
-43.734 578 1
64.6 48 461 5 38.6
31 992 4 -11.0
-26 2-19 0-7 2
1 Annual changes are from 04 to Q4.

Strictly Confidential (FR)Class II FOMC
STAFF PROJECTIONS OF FEDERAL SECTOR ACCOUNTS AND RELATED ITEMS(Billions of dollars except as noted) November 9, 1994
Fiscal year 1994 1995 1996
Item 1993a
1994a
1995 1996 Q1a
Q2a
Q 3b Q4 Q1 Q2 Q3 Q4 Q1 Q2 Q3 Q4
UNIFIED BUDGET Not seasonally adjusted
Receipts1
1153 1257 1342 1407 289 363 318 304 294 411 333 317 302 435 352 325Outlays1 1409 1461 1530 1612 348 363 372 380 391 376 384 402 407 403 400 424Surplus/deficit
1 -255 -203 -188 -205 -59 0 -53 -75 -97 35 -50 -84 -105 33 -48 99
On-budget -301 -259 -252 -267 -66 -33 -55 -83 -107 -5 -57 -90 -113 -7 -57 -103Off-budget 46 56 64 63 8 33 2 8 9 40 7 6 9 39 9 5
Surplus excludingdeposit insurance
2 -283 -210 -205 -217 -65 3 -57 -78 -103 32 -56 -86 -109 31 -53 98
Means of financingBorrowing 249 185 202 212 51 8 37 61 86 11 44 66 88 15 43 69Cash decrease 6 17 -24 0 5 -6 15 8 13 -45 0 25 20 -45 0 25Other
3 0 1 11 -8 2 -2 1 7 -1 -1 6 -7 -3 -3 5 5
Cash operating balance,end of period 53 36 60 60 45 51 36 28 15 60 60 35 15 60 60 35
NIPA FEDERAL SECTOR Seasonally adjusted, annual rate
Receipts 1242 1355 1451 1514 1338 1381 1388 1414 1449 1470 1473 1483 1501 1530 1542 1561Expenditures 1497 1529 1612 1699 1514 1526 1543 1589 1609 1622 1629 1666 1696 1712 1722 1762Purchases 447 439 437 429 438 435 443 443 441 434 431 429 431 429 428 427Defense 307 295 290 280 292 292 298 297 293 287 284 281 282 279 278 277Nondefense 140 144 147 149 146 144 145 146 148 147 148 148 150 150 150 151
Other expenditures 1049 1090 1175 1270 1076 1091 1100 1147 1168 1187 1198 1237 1265 1283 1295 1335Surplus/deficit -254 -174 -161 -185 -176 -145 -154 -175 -160 -152 -156 -183 -194 -182 -181 201
FISCAL INDICATORS4
High-employment (HEB)surplus/deficit -210 -163 -176 -182 -158 -141 -159 -192 -179 -168 -164 -186 -190 -176 -174 -194
Change in HEB, percentof potential GDP - 1 - 7 2 .1 - 6 - 3 3 5 - 2 - 2 - 1 3 1 - 2 0 3
Fiscal impetus (FI),percent, cal year -4 1 -6 9 -6 1 -5 -4 2 -4.3 3 1 -1 6 -3.1 -2 5 - 5 - 8 -2 3 -1 7 1 - 4
1 Excluding health reform, OMB's July 1994 deficit estimates are $220 billion in FY94, $167 billion in FY95, and $179 billion in FY96 CBO'sAugust 1994 deficit estimates of the budget are $202 billion in FY94, $162 billion in FY95, and $176 billion in FY96 Budget receipts, outlays, andsurplus/deficit include corresponding social security (OASDI) categories The OASDI surplus is excluded from the on-budget deficit and shownseparately as off-budget, as classified under current law The Postal Service deficit is included in off-budget outlays beginning in FY90
2 OMB's July 1994 deficit estimates, excluding deposit insurance spending, are $224 billion in FY94, $185 billion in FY95, and $187 billion in FY96CBO's August 1994 deficit estimates, excluding deposit insurance spending, are $207 billion in FY94, $180 billion in FY95, and $188 billion in FY96
3 Other means of financing are checks issued less checks paid, accrued items, and changes in other financial assets and liabilities
4 HEB is the NIPA measure in current dollars, with cyclically sensitive receipts and outlays adjusted to the level of potential output generatedby 2 3 percent real growth and an associated unemployment rate of 6 percent. Quarterly figures for change in HEB and FI are not at annual ratesChange in HEB, as a percent of nominal potential GDP, is reversed in sign FI is the weighted difference of discretionary changes in federalspending and taxes (in 1987 dollars), scaled by real federal purchases For change in HEB and FI, negative values indicate restraint
a--Actualb--Preliminary

DOMESTIC FINANCIAL DEVELOPMENTS
Recent Developments
Since the September FOMC meeting, market interest rates have
moved up appreciably--as much as 1/2 percentage point--in response
to strong economic indicators and evidence of potential inflationary
pressures. Market participants have revised up their trajectory for
System tightening; futures quotes have built in an increase of 100
basis points in the federal funds rate by year-end, and further
moves are expected early next year. However, major indexes of stock
prices have changed little on net, as reports of stronger-than-
expected corporate earnings have apparently offset the depressing
effect of rising nominal interest rates.
The markets have essentially ignored the monetary aggregates.
M2 edged down for the third straight month in October and is now at
the bottom end of its 1994 growth range of 1 to 5 percent. The
weakness in M2 has continued to reflect declines in household liquid
deposits and savings accounts, as the rates paid on these accounts
still have risen very little this year. In contrast, interest rates
on small CDs and retail money funds have kept pace with market rates
of late, tempering the substitution out of M2. M3 rose at an annual
rate of 3-1/2 percent in October, boosted by a rebound in
institution-only money funds and by continued issuance of large time
deposits. Since the fourth quarter of 1993, M3 has increased at an
annual rate of 1 percent, leaving the aggregate in the lower portion
of its target range.
Bank credit expanded at an annual rate of 3 percent in October,
an increase similar to those posted in August and September. As has
been the pattern for some time, holdings of securities shrank last
month; although some of the October decline resulted from marking to
market, outright net sales provided funds to support further robust
1-23

I-24
growth in bank lending. Consumer loans have continued to be
particularly strong, rising at an annual rate of 18 percent in
October. Business lending has also remained brisk in recent months,
reflecting strong demand and a continued easing of terms. Real
estate lending at banks grew moderately in October, after large
gains in August and September.
Total net borrowing by nonfinancial businesses has picked up
somewhat in recent months, even though public bond issuance has
remained sluggish. The robust increase in bank borrowing has been
accompanied by a jump in issuance of commercial paper since mid-
September, most of which apparently has been merger-related. The
volume of large merger deals completed this year is already more
than double the total for 1993, and the elevated pace of activity
shows no sign of abating. Net equity issuance turned negative in
the third quarter, and likely has remained so, because of the slow
pace of gross stock offerings and a fair amount of merger-related
equity retirement.
Total consumer credit expanded vigorously again in September,
consistent with the strength in household purchases of motor
vehicles and other durable goods. Moreover, the bank data cited
above suggest that overall lending to consumers posted another
robust rise in October. Home mortgage lending appears to have
continued increasing at least moderately. The effect of the
monetary tightening to date has apparently been blunted by the
growing initial discounts that banks and thrifts have offered on
ARMs. In September, ARMs accounted for 46 percent of mortgage
originations, the highest share in more than five years. Besides
engaging in intense price competition, banks and thrifts have been
easing downpayment requirements to attract borrowers.

I-25
In the municipal securities market, gross issuance of long-term
tax-exempt debt has remained sluggish, with the volume of offerings
in September and October more than 50 percent below levels of a year
earlier. In addition, issuance of short-term debt has weakened from
its brisk summer pace. The limited issuance, together with heavy
retirements, implies that the outstanding stock of tax-exempt debt
continued to decline through October. This reduced supply held down
tax-exempt yields relative to Treasury rates through mid-October,
but the yield ratio has jumped since then, in large part because of
heavy net sales by mutual funds.
Treasury borrowing in the current quarter has picked up with
the seasonal rise in the deficit. The mix of offerings this quarter
will be distinctly skewed toward short maturities, with the Treasury
relying on bills for nearly 60 percent of its net cash borrowing.
In the agency market, both Fannie Mae and Freddie Mac have continued
to borrow heavily to finance an aggressive expansion of their
mortgage portfolios; the spread between rates on mortgage-backed
securities and their own issues makes this a profitable strategy.
Outlook
The staff's economic and financial projections are based on the
assumption that the System will further boost short-term interest
rates in coming months in an effort to hold down inflation. Given
the surprising momentum in economic activity, this projection builds
in a more substantial tightening of policy than did the September
projection. Because the market has already priced a significant
tightening into the rate structure, we believe that longer-term
rates will rise far less than short rates in the near term.
Moreover, we expect that long rates will decline appreciably once
economic activity moderates and inflation fears recede.

I-26
Both M2 and M3 are expected to accelerate slightly in 1995,
despite the slower growth in nominal GDP. 1 In our projection,
the opportunity costs of holding M2 and M3 assets rise less next
year than they did in 1994. reducing the restraint on money growth
from changes in interest rates. Even so, the velocities of M2 and
M3 should grow considerably again next year. In 1996, we expect M2
velocity to decelerate further, boosting the growth of M2, as
deposit rates continue to close the gap with market rates. Because
the pickup in deposits should reduce the need for wholesale funding,
we expect M3 growth in 1996 to hold at about the 1995 pace.
Total debt of the domestic nonfinancial sectors is projected to
increase about 5 percent in both 1995 and 1996, little different
from the moderate debt growth this year. Nonfederal borrowing is
projected to rise at an annual rate of 5 percent this quarter and
then to decelerate with the assumed moderation in economic activity.
The growth of federal debt is expected to be unusually rapid in the
first quarter of 1995, in part because the payments associated with
an expansion of the earned income tax credit will boost the
Treasury's cash needs. For 1995 as a whole, we project federal debt
to grow about 6 percent, with the same increase expected for 1996.
In the household sector, growth in consumer credit will likely
remain very strong through year-end, but then should moderate with
the much slower growth of spending on durable goods and the rise in
repayments on existing loans. Home mortgage debt is projected to
increase about 5-1/2 percent in 1995 and 1996, similar to the rise
this year but about 1 percentage point below the increases in 1992
and 1993. The outlook for growth in mortgage debt is consistent
with our expectation that single-family housing activity--both new
1. In 1995, we project that nominal GDP will increase4-1/4 percent, down 2 percentage points from the advance nowexpected for 1994.

I-27
construction and sales of existing homes -will remain below current
levels throughout the forecast period. The debt-to-income ratio and
debt service burden of the household sector are anticipated to rise
somewhat over the forecast period. Delinquency rates could move
higher, and although we do not expect a deterioration in credit
quality that would prompt a major shift in lenders' attitudes, it
would not be surprising to see rate spreads on consumer loans widen
a bit and the promotion of credit cards abate.
The recent pickup in nonfinancial business borrowing is
expected to persist into early next year, fueled by strong inventory
investment and by merger activity. But the growth of nonfinancial
business debt should slow thereafter. Net equity retirements are
expected to diminish over the course of 1995, an important factor
restraining the growth of business debt. In the near term, the
unfavorable tone of the bond market suggests that firms will
continue to rely heavily on bank loans, commercial paper, and other
sources of short-term funding. However, by the second half of next
year, we expect that business borrowing will tilt more toward bond
issuance in response to a decline in long-term rates' this shift in
the financing mix should continue in 1996. The swing toward more
liberal terms and standards at banks and other lenders seems likely
to end--and perhaps to reverse somewhat--as rising rates and softer
business conditions raise concerns about credit quality.
In the state and local sector, slow growth of debt is expected
to resume by mid-1995 after the unprecedented net run-off that has
occurred this year and likely will continue for a few more quarters.
Retirements will remain heavy over the forecast period, as debt that
has been refunded in advance becomes callable. However, we expect
new issuance to pick up with the anticipated downturn in long-term
rates and the need to finance continuing fiscal deficits.

Confidential FR Class IINovember 9, 1994
CHANGE IN DEBT OF THE DOMES TIC NONFINANCIAL SECTORS1
(Percent)
--------------------- Nonfederal---------------------
----- Households------ ------- MEMO-----State and Private
Federal Home Cons. local financial NominalTotal 2 govt. Total Total mtg. credit Business govt. assets GDP
Year
1982 9.8 19.7 7.4 5.5 4.7 4.4 8.8 9.3 10.1 3.21983 11.9 18.9 10.1 11.8 10.8 12.6 8.7 9.7 12.5 11.01984 14.6 16.9 13.9 13.0 11.7 18.7 15.6 9.1 12.8 9.11985 15.5 16.5 15.2 15.3 13.2 15.8 12.1 31.6 12.4 7.01986 12.3 13.6 11.9 12.0 14.3 9.6 12.2 9.8 7.3 4.7
1987 9.4 8.0 9.8 11.4 14.9 5.0 7.9 12.1 8 1 8 01988 8.9 8.0 9..2 10.5 12.7 7.2 8.7 6.0 8.6 7.71989 7.8 7.0 8.1 9.2 10.8 6.2 6.9 9.3 5.8 6.01990 6.3 11.0 5.0 6.5 7.9 2.0 3.4 5.7 4.7 4.71991 4.4 11.1 2.4 4.7 6.5 -1.8 -1.0 7 4 -1 0 3 5
1992 4.8 10.9 2.8 5.8 6.7 0.7 -0.1 1.8 0 7 6.41993 5.4 8.3 4.3 7.3 6.4 8.0 0.6 6.4 -0.7 5.01994 4.8 4.7 4.8 7.2 5.6 12.2 4.4 -3.8 4.4 6.21995 5.0 5.9 4.7 6.1 5.6 9.4 4.1 0.3 1.0 4.31996 4.9 5.8 4.6 6.0 5.6 7.9 3.5 1.9 1.0 4.7
Quarter (seasonally adjusted annual rates)
1993:1 4.2 7.8 2.9 4.4 4.2 2.7 -0.3 8.7 -3.1 4.42 6.4 10.7 4.8 6.8 6.7 6.0 1.0 11.3 1.4 4 23 5.0 5.4 4.9 9.1 8.1 9.3 0.3 4.5 -2 3 3 84 5.5 8.4 4.5 8.3 6.2 13.2 1.2 0.6 1.4 7.7
1994:1 5.3 6.3 5.0 7 3 6 2 8.6 3.9 -1.1 9.2 6 12 3.9 3.6 4.0 6.2 3.6 13.4 4.0 -5.5 4.5 7 23 4.6 3.9 4.9 7.6 6.3 13.9 4.4 -5.2 1.9 5.24 4.9 4.6 5.0 7.1 5.9 11.0 4 8 -3.7 1.7 6.1
1995:1 6.2 10.1 4.7 6.0 5.6 10.2 4.5 -0.8 1.5 5.72 4.3 3.8 4.5 5.8 5.5 9.4 4.1 -0.1 0.6 4.23 4.5 4.4 4.6 6.0 5.5 8.7 3.8 0.8 0.7 3.64 4.7 5.0 4.6 5.8 5.4 8.1 3.8 1.3 1.0 3 8
1. Data after 1994:2 are staff projections. Year-to-year changes in nominal GDP are measured from thefourth quarter of the preceding year to the fourth quarter of the year indicated; other changes aremeasured from end of preceding period to end of period indicated.
2. On a quarterly average basis, total debt growth was 5.2 percent in 1993, and it is projected to be5.0 percent in 1994 and 1995, and 4.9 in 1996.
2.6.3 FOF

Confidential FR Class IINovember 9, 1994
FLOW OF FUNDS PROJECTIONS: HIGHLIGHTS1
(Billions of dollars)
Calendar year ----------- 1994 ----------- ----------- 1995-----------1993 1994 1995 1996 Q1 Q2 Q3 Q4 Q1 Q2 Q3 Q4
----------- Seasonally Adjusted Annual Rates-----------Net funds raised by domesticnonfinancial sectors1 Total 651.4 571.3 633.7 659.1 657.2 501.7 538.9 587.3 758.6 561.9 594.2 620.12 Net equity issuance 20.9 -20.9 -15.8 -8.0 -2.8 10.4 -48.0 -43.0 -39.0 -8.0 -8.0 -8.03 Net debt issuance 630.5 592.1 649.4 667.1 660.0 491.3 586.9 630.3 797.6 569.9 602.2 628.1
Borrowing sectorsNonfinancial business
4 Financing gap 2 28.8 71.9 125.4 122.3 22.1 75.3 91 2 98.8 119.6 129.2 125.6 127.25 Net equity issuance 20.9 -20.9 -15.8 -8.0 -2.8 10.4 -48.0 -43.0 -39.0 -8.0 -8.0 -8.06 Credit market borrowing 21.1 162.5 160.2 143.6 145.1 152.5 168.1 184.5 174.4 162.4 150.5 153.6
Households7 Net borrowing, of which: 293.8 310.7 278.8 290.8 315.7 269.7 335.4 322.0 278.0 272.7 284.5 279.88 Home mortgages 179.7 166.9 176.5 186.8 182.8 109.7 192.1 183.0 174.7 176.1 177.4 177.89 Consumer credit 64.4 106.1 91.7 84.2 74.4 118.7 127.0 104.2 99.2 94.2 89.2 84.210 Debt/DPI (percent)3 88.5 89.8 90.4 91.1 90.5 90.4 90.8 90 6 90.6 91.0 91.3 91.3
State and local governments11 Net borrowing 59.5 -37.8 3.0 17.8 -11.3 -53.8 -50.8 -35.2 -7.2 -1 2 7.8 12.812 Current surplus4 -45.5 -29.9 -27.4 -24.8 -29.1 -36.3 -25.6 -28.5 -25.7 -26.2 -28.0 -29.6
U.S.government13 Net borrowing 256.1 156.6 207.4 215.0 210.5 122.9 134.1 159.0 352.4 136.0 159.4 181.914 Net borrowing;quarterly, nsa 256.1 156.6 207.4 215.0 51.2 7.7 37.1 60.7 85.7 11.2 44.1 66.415 Unified deficit;quarterly, nsa 226.3 187.0 197.4 219.2 58.6 -0.3 53.5 75.2 97.5 -34.6 50.1 84.3
Funds supplied by16 depository institutions 140.4 206.4 198.6 188.8 203.4 155.0 233.1 234.1 207.9 197.6 199.1 189.8
MEMO: (percent of GDP)17 Dom. nonfinancial debt 3 189.7 188.0 187.6 188.7 190.4 188.9 188.7 188.2 188.5 188.6 189.1 189 518 Dom. nonfinancial borrowing 9.9 8.8 9.2 9.0 10.0 7.3 8.7 9.2 11.4 8.1 8.5 8 819 U.S. government5 4.0 2.3 2.9 2.9 3.2 1.8 2.0 2.3 5.1 1.9 2.2 2 520 Private 5.9 6.5 6.2 6.1 6.8 5.5 6.7 6.9 6.4 6.2 6,2 6.2
Data after 1994:2 are staff projections.For corporations: Excess of capital expenditures over U.S. internal funds.Annuals are average debt levels in the year (computed as the average of year-end debt positions)NIPA surplus, net of retirement funds.Excludes government-insured mortgage pool securities
divided by nominal GDP
2.6.4 FOF

INTERNATIONAL DEVELOPMENTS
Recent Developments
Since the September FOMC meeting, the weighted-average foreign
exchange value of the dollar in terms of the other G-10 currencies
has declined nearly 1 percent on balance. The dollar declined 1-1/4
percent against the mark and 3/4 percent against the yen. During
the intermeeting period, the dollar initially fluctuated narrowly
but then fell in mid-October, in part because the Kohl victory in
the German election contributed to mark appreciation. The dollar
remained weak in light of data indicating continuing strength in the
U.S. economy, suggesting the risk of emerging inflation, and of
additional difficulties in U.S./Japan trade talks. On November 2,
the dollar reached a new post-war low in terms of the yen and a two-
year low against the mark; the Desk intervened to purchase marks and
yen on that day and again on the following day. Over the two days,
the Desk purchased $1.3 billion against marks and the same amount
against yen, split evenly between the System and the Treasury.
Since November 2, the dollar has appreciated nearly 1-1/2 percent on
balance, with much of the increase coming after the U.S. election.
Long-term interest rates in the major foreign industrial
countries showed mixed changes while rates in the United States rose
about 30 basis points. German and French long-term rates changed
little, on balance, whereas rates in Japan rose about 20 basis
points and those in the United Kingdom fell 30 basis points. Three-
month rates abroad were also somewhat mixed, with Canadian and U.K.
rates up about 20 basis points and French and Japanese rates little-
changed. U.S. Treasury bill rates increased 60 basis points.
The Bank of Japan accounted for $3-
1/2 billion. The Desk intervened only on November 2 and 3.
I-30

I-31
Economic activity in the major foreign countries continued to
be robust in the third quarter. In western Germany, initial data
for industrial production show a moderate gain for the third
quarter. Expected upward revision to the September figure should
raise third-quarter growth to about 4 percent at an annual rate.
German manufacturing orders rose further in the third quarter, but
at a somewhat less rapid pace than in the previous quarter. In
France, the strong pace of economic growth in the second quarter
appears to have continued into the third. Industrial production
expanded further in July and August, as did consumption of
manufactured products. U.K. industrial production rose strongly in
September, and third-quarter GDP rose nearly 3 percent. Surveys of
business attitudes remain favorable. Canadian industrial
production, shipments, and orders increased sharply in August.
Employment continued to rise through the third quarter, then dipped
slightly in October, and the unemployment rate fell again in
October. Consumer and business surveys indicated very positive
sentiment in the third quarter. Recovery in Japan is still not
firmly established, but economic activity in the third quarter
appears to have strengthened, following a second-quarter decline.
Industrial production and new car registrations rose in the third
quarter, and orders for new machinery rebounded strongly in July and
August.
Consumer price inflation remains low in the major foreign
industrial countries, with the most recent data showing 12-month
inflation of underlying consumer prices at 2 percent or less in
Japan, France, the United Kingdom, and Canada.
The U.S. nominal trade deficit in goods and services narrowed
in August. Nevertheless, for July and August combined, the trade
deficit was substantially larger than it was in the second quarter.

I-32
Exports of goods rebounded in August, with sales of automotive
products to Canada particularly strong. Exports of machinery and
consumer goods rose moderately, and agricultural exports recovered
sharply. Imports of goods rose further in August, with automotive
trade with Canada again a factor. The quantity of oil imports
remained strong in July and August, somewhat above the second
quarter pace, largely as a result of higher consumption.
Preliminary data for September suggest that oil imports declined
slightly as an easing of consumption more than offset rebuilding of
stocks.
Prices of U.S. non-oil imports and nonagricultural exports each
rose 0.3 percent in September. For the third quarter as a whole,
non-oil import prices rose 5.3 percent at an annual rate, reflecting
the exceptionally rapid rise in prices for food, feed, and beverages
(largely coffee) as well as the strong increase in prices of
industrial materials. Nonagricultural export prices rose 4.4
percent, annual rate, in the third quarter, led by prices for
industrial supplies. While agricultural export prices rose in
September, they declined again on average in the third quarter,
reflecting the bountiful harvest. The price of imported oil rose
only slightly in August, after sizable increases each month since
April, and then fell in September as OPEC production increased. For
the third quarter, the price of imported oil should average about
$16.30 per barrel, approximately $1.65 per barrel more than in the
second quarter. Spot oil prices have firmed in recent weeks.
Outlook
The staff projects that real GDP in foreign industrial and
developing countries will increase at an annual rate of about 4
percent rate over the forecast period, somewhat above the rate
projected in the previous Greenbook and significantly stronger than

I-33
the forecast for the United States in 1995 and 1996 The dollar is
projected to rise slightly from recent levels and then remain about
unchanged. As a result of these developments and the decline in the
dollar that has already occurred since the start of this year, real
exports of goods and services are forecast to grow somewhat faster
than real imports through 1996. Consequently, real net exports are
projected to narrow slightly over the forecast period.
The dollar. We project that the foreign exchange value of the
dollar in terms of the other G-10 currencies will move up a bit from
recent levels through mid-1995, in association with the assumed rise
in U.S. interest rates, and then remain about unchanged. This
projected path is somewhat lower than that assumed in the September
Greenbook, reflecting the decline in the dollar over the
intermeeting period. A possible risk to this projection is that the
recent weakness of the dollar might persist; alternatively, market
participants might react particularly strongly and favorably as
inflation risks are seen to diminish, resulting in a stronger dollar
than we have incorporated in the Greenbook forecast. Our projection
is that the CPI-adjusted value of the dollar in terms of the
currencies of key developing countries will show a moderate
depreciation on average through the end of the forecast period,
little changed from the September Greenbook.
Foreign G-7 countries. Real GDP growth in the foreign G-7
countries (weighted by U.S. exports) is projected to average
3-3/4 percent in the current quarter and then to remain at about
3-1/2 percent through 1995 and 1996. This forecast has been revised
slightly upward from that in the September Greenbook because of
positive changes for France, Canada, and Italy.
In Germany, real output growth in the near term is expected to
be above 3 percent, annual rate, and then to average about 3 percent
I-34
over the remainder of the forecast period. The income tax surcharge
scheduled to take effect in January is likely to slow consumption
growth next year. In France, continued strength in domestic demand
is expected to sustain growth in the near term and to contribute to
some further strengthening--to about 3-1/2 percent, annual rate--in
1995 and 1996. In the United Kingdom, the rate of real output
growth is expected to trend down from about 3-1/4 percent in the
near term to 2-3/4 percent in 1996 as prospective monetary
tightening has an effect. In part in response to the projected
slowing in the U.S. economy, output growth in Canada is forecast to
slow from 5 percent in 1994 to 4-1/4 percent in 1995 and then to
slow a bit more in 1996. The strength of the recovery of real GDP
growth in Japan is still uncertain. We expect growth to increase
over the forecast period from the current annual rate of about 2
percent to 3-1/4 percent in 1996.
Consumer price inflation in the foreign G-7 countries is
projected to remain low but to rise over the forecast period as the
continued stronger activity reduces the amount of slack in those
economies. On average, inflation in these six countries (weighted
by U.S. import shares) is projected to increase from about 1 percent
this year to nearly 2 percent in 1995 and 1996. This forecast
reflects upward revisions to projected inflation in western Germany,
Canada, and Italy and a slight downward revision for Japan.
The staff forecast incorporates the assumption that foreign
short-term interest rates on average will soon move up as most
central banks abroad react to the stronger activity in their
respective economies; short-term rates on average are expected to
move up about 70 basis points over the forecast period. This
assumed path for short-term interest rates is somewhat above that in
the previous Greenbook.

I-35
As in the United States, foreign long-term rates, on average,
are expected to decline somewhat from current levels by the end of
the forecast period, in light of the general tightening of monetary
conditions and the persistence of favorable inflation performance.
Other countries. The real GDP of developing countries that are
major U.S. trading partners (weighted by bilateral nonagricultural
export shares) is forecast to increase about 5-1/2 percent per year
over 1994-96. The external sectors of Asian developing countries
should benefit from the strengthening recovery in the foreign
industrial countries and from the appreciation of the yen. In Latin
America, a progressive dismantling of trade barriers, large-scale
privatization efforts, and strong domestic and foreign investment
spending should facilitate growth in 1994-96.
The aggregate growth outlook for developing countries is
basically unchanged since the last Greenbook, despite modest upward
revisions to the growth forecasts for Brazil and Argentina. The
upward revision to Brazil's forecast reflects improved prospects for
achieving substantive economic reform in the wake of Cardoso's
victory in the October presidential election. The growth forecast
for Argentina was revised upward to reflect faster-than-expected
growth in investment spending that should allow for a continued
rapid expansion of output in 1995-96.
U.S. real net exports. Real net exports of goods and services
are expected to narrow slightly over the forecast period from the
rate observed in the third quarter of this year.
Rapid growth of real merchandise exports will be sustained by
the strong pace of foreign output growth and the lagged effects of
the decline in the dollar since the beginning of the year. Growth
of computer exports is expected to continue at nearly the rapid pace
of the third quarter through the end of the forecast period. Other

I-36
nonagricultural exports are projected to grow about 6-1/4 percent in
1995-96. The level of agricultural exports is projected to change
little over the forecast period.
TRADE QUANTITIES(percent change from end of previous period, saar)
------ Projection------1993 1994 1995 1996
Hl Q3 Q4Merchandise exports
Total 6.1 7.2 14.6 12.4 9.4 10.3
Agricultural -5.3 -8.0 44.3 0.3 -1.0 1.6Computers 23.1 14.8 36.4 31.1 28.6 26.3Other nonag. 4.5 7.3 7.6 9.8 6.0 6.5
Merchandise importsTotal 13.1 16.8 13.8 8.3 6.8 7.8
Oil 10.0 7.7 23.8 -27.2 5.3 1.9Computers 38.3 27.7 22.7 26.3 25.1 21.6Other non-oil 9.3 15.7 10.8 9.7 2.7 4.6
* NIPA basis, 1987 dollars.
Growth of non-oil imports other than computers is expected to
remain near 10 percent this quarter, to slow significantly to about
3 percent in 1995, and to strengthen in 1996. This deceleration
reflects the projected slower U.S. GDP growth next year, the lagged
effects of higher import price inflation in the near term, and the
unwinding of a number of transitory factors that boosted imports in
the second and third quarters. We expect the quantity of oil
imports to fall in the current quarter as stocks are drawn down to
more normal levels. Increased winter consumption should be met by
slightly higher domestic production and stock draws. In 1995,
imports of oil are projected to remain on an upward trend as U.S.
oil consumption continues to increase in line with economic
activity.
Oil prices. The fourth quarter assumption for the oil import
unit value has been revised upward by nearly 80 cents to $15.82,
owing to several developments: the massing of Iraqi troops on the

I-37
Kuwaiti border and an oil workers' strike in Brazil early in the
quarter and the rupture of the Houston pipeline more recently. By
the second quarter of 1995, the oil import unit value should return
to our long-run view of $16.00 per barrel, consistent with continued
global economic expansion, seasonally higher oil demand, and an
anticipated rollover in OPEC's production quota through early 1995.
Beyond the first quarter of 1995, we project WTI and the oil import
price to be flat at $18.50 and $16.00 per barrel, respectively. We
assume that Iraqi oil exports will return to world markets in 1996,
permitting further increases in world oil demand to be met readily
by increased supply.
SELECTED PRICE INDICATORS(percent change from end of previous period except as noted, ar)
------ Projection-----1993 1994 1995 1996
H1 Q3 Q4
PPI (export. wts.) 0.9 2.9 5.6 3.9 3.4 2.2Nonag. exports* 0.7 3.2 5.7 4.1 3.0 1.8Non-oil imports* 1.3 2.1 5.8 7.2 3.1 1.5Oil imports(Q4 level, $/bl.) 14.09 14.67 16.30 15.82 16.00 16.00
* Excluding computers.
Prices of non-oil imports and exports. The prices of non-oil
imports excluding computers are expected to accelerate further
during the current quarter from their rapid third-quarter rate of
increase. The substantial increases in non-oil commodity prices on
world markets and the lagged effect of the decline in the dollar
since early this year will exert upward pressure on import price
inflation in the near term that then will wane in mid-1995. Import
prices are expected to decelerate to about a 1-1/2 percent rate of
increase in 1996. In the near term, prices of U.S. nonagricultural
exports reflect the sharp increases in materials prices. For
1995-96, increases in nonagricultural export prices are expected to
fall in line with the slowing of U.S. producer price inflation.

I-38
Nominal trade and current account balances. The trade deficit
on goods and services is projected to narrow somewhat through 1996
as the deficit on merchandise trade improves slightly and the
surplus on net service receipts increases. The deficit on net
investment income is projected to widen, reflecting the path of
interest rates and rising net indebtedness. We expect that, as a
result of these developments, the current account deficit will
average about $175 billion in 1995 and 1996, or 2.5 percent of GDP.

November 9, 1994
STRICTLY CONFIDENTIAL - FRCLASS II FOMC
REAL GDP AND CONSUMER PRICES, SELECTED COUNTRIES, 1992-96(Percent change from fourth quarter to fourth quarter)
Projection
Measure and country 1992 1993 1994 1995 1996
REAL GDP
Canada 0.5 3.2 5.0 4.3 3.8France 0.6 -0.5 3.3 3.4 3.6Germany 1.0 0.0 3.3 3.0 3.2
W. Germany 0.3 -0.5 2.8 2.5 2.6Italy -0.6 0.4 3.5 3.1 3.1Japan -0.3 -0.1 1.6 2.8 3.3United Kingdom 0.3 2.6 3.6 3.1 2.7
Average, weighted by 1987-89 GDP 0.1 0.6 2.9 3.1 3.3
Average, weighted by share ofU.S. nonagricultural exports
Total foreign 1.6 2.7 4.1 3.9 4.0Foreign G-7 0.3 1.8 3.8 3.6 3.5Developing countries 3.9 4.7 5.2 5.1 5.3
CONSUMER PRICES
Canada 1.8 1.8 0.1 2.2 2.3France 1.8 2.1 1.7 1.5 1.5Western Germany 3.7 3.7 2.8 2.3 2.5Italy 4.8 4.1 3.6 4.2 4.0Japan 0.9 1.2 0.7 0.8 0.7United Kingdom 3.1 1.6 2.7 3.8 3.9
Average, weighted by 1987-89 GDP 2.4 2.2 1.8 2.2 2.2
Average, weighted by share ofU.S. non-oil imports 1.9 1.9 1.1 1.8 1.9

StrictLY Confidential (FR) Class II FOMC
U.S. INTERNATIONAL TRANSACTIONS IN GOODS, SERVICES, AND THE CURRENT ACCOUNT
(Billions of dollars, seasonally adjusted annual rates)(Billions of dollars, seasonally adjusted annual rates)
NIPA Real Net Exportsof Goods & Services (87$)
Exports of G&SGoods
AgriculturalComputersOther Goods
Services
Imports of G&SGoods
OilComputersOther Goods
Services
Memo:(Percent change 1/)Exports of G&S
AgriculturalComputersOther GoodsServices
Imports of G&SOilComputersOther GoodsServices
Current Account Balance
Goods & Serv (BOP), netGoods (BOP), netServices (BOP), net
Investment Income, netDirect, netPortfolio, net
1992
Q1 Q2 Q3 Q4
-17.9 -34.1 -38.9 -38.5
571.0416.038.947.1
330.0154.9
588.8489.547.251.2
391.199.3
6.113.424.43.15.9
6.60.9
53.52.47.2
573.1421.538.452.3
330.8151.6
607.1509.751.657.5
400.697.4
1.5-5.052.01.0
-8.3
13.042.859.110.1-7.4
580.5427.440.556.2
330.7153.1
619.4521.753.164.7
403.997.7
5.323.733.3-0.14.0
8.412.160.33.31.2
590.7441.1
41.360.1
339.8149.6
629.3530.2
52.868.4
409.099.0
7.28.1
30.811.5-8.8
6.5-2.224.95.15.4
-33.4 -66.2 -74.4 -97.5
-15.5-72.3
56.8
9.750.8
-41.1
-41.5 -51.1 -53.4-97.3 -109.4 -105.355.8 58.3 52.0
6.551.0
-44.5
4.947.1
-42.2
-2.942.0-44.9
1993
Q1 02 Q3 Q4
1994 ANNUAL
Q1 Q2 1991 1992 1993
-57.6 -69.3 -86.3 -82.2 -104.0 -111.8
589.2433.939.160.9
333.9155.3
646.8546.6
53.473.3
419.9100.1
-1.0-19.7
5.4-6.816.1
11.64.6
31.911.14.5
600.2443.3
39.362.9
341.1156.9
669.6567.457.780.0
429 7102.2
7.72.1
13.88.94.2
14.936.341.99.78.7
595.3438.536.968.5
333.1156.7
681.6577.156.787.8
432.6104.5
-3.2-22.3
40.7-9.1-0.5
7.4-6.845.12.79.3
625.2468.139.174.0
355.1157.1
707.4599.958.194.6
447.2107.6
21.726.136.229.21.0
16.010.234.814.212.4
619.6464.4
36.676.9
350.9155.2
723.6615.256.599.7
458.9108.5
-3.5-23 216.6-4.6-4.8
9.5-10.623.410.93.4
643.9484.637.579.3
367.8159.2
755.6648.360.3
106.9481.0107 .4
16.610.213.120.710.7
18 .929.732 220 7-4.0
-79.4 -102.4 -111.4 -122.3 -129.3 -147.9
-57.7 -76.3 -89.0 -79.9-116.8 -134.9 -145.9 -132.7
59.1 58.6 56.9 52.8
7.454.6
-47.2
2.750.8
-48.1
8.155.9
-47.8
-2.448.4-50.8
-97.3 -108.0-147.8 -167.1
50.5 59.0
-3.245.9-49.1
-10.043.0
-53.0
-19.5 -32.3 -73.9
542.6397.1
35.541.4320.2145.5
562.1464.4
49.241.6
373.797.7
8.110.926.77.24.7
4.08.3
45.62.9
-6.2
578.8426.539.853.9
332.8152.3
611.1512.851.260.5
401.298 3
5.09.5
34.83.8
-2.0
8.612.148.75.21.4
602 5445 938.666.6
340.8156 5
676.3572 8
56 583.9
432.4103.6
5.8-5.323.14.55.0
12.410.038.39.38.7
-6.9 -67.9 -103.9
-28.5-74.1
45.6
14.855.4-40.5
-40 4 -75.7-96 1 -132.655 7 56.8
4.5 4.047.7 52.4-43.2, -48.5
Unilateral Transfers, net -27.7 -31.1 -28.2 -41.2 -29.1 -28.8 -30.5 -40.1---------------------------------------------------------
-28.7 -29.9 6.7 -32.0 -32.1
1/ Percent change (AR) from previous period; percent changes for annual data are calculated Q4/Q4.

Strictly Confidential (FR) Class II-FOMC
OUTLOOK FOR U.S. INTERNATIONAL TRANSACTIONS IN GOODS, SERVICES, AND THE CURRENT ACCOUNT
(Billions of dollars, seasonally adjusted annual rates)(Billions of dollars, seasonally adjusted annual rates)
Projection
NIPA Real Net Exportsof Goods & Services (87$)
Exports of G&SGoods
AgriculturalComputersOther Goods
Services
Imports of G&SGoods
OilComputersOther Goods
Services
Memo:(Percent change 1/)Exports of G&S
AgriculturalComputersOther GoodsServices
Imports of G&SOilComputersOther GoodsServices
Current Account Balance
Goods & Serv (BOP), netGoods (BOP), netServices (BOP), net
Investment Income, netDirect, netPortfolio, net
1994
Q3 Q4
-118.3 -114.4
659.2501.441.185.7374.6157.8
777.5669.663.6
112.5493.5108.0
9.844.336.47.6-3.5
12.123.822.710.82.3
677.2516.341.191.7
383.4160.9
791.6683.058.7119.3505.0108.7
11.40.3
31.19.88.2
7.5-27.226.39.72.6
-165.7 -183.3
-125.1 -127.5-180.5 -186.355.3 58.8
-9.544.5
-54.0
-15.347.7
-63.0
1995
Q1 Q2 Q3 Q4
-114.1 -112.4 -109.1 -105.7
691.9528.741.398.1
389.3163.3
806 0696.6
58.6127.0511.0109.5
9.01.5
31.16.25.9
7.5-1.028.74.82.9
707.1541.4
41.4105.0395.0165.7
819.4709.260.7
134.6513.9110.3
9.00.7
31.16.16.1
6.814.926.32.33.1
721.1553.141.1
111.3400.7168.0
830.2719.461.5
142.0515.9110.9
8.2-2.526.35.95,7
5.45.3
23.91.62.3
735.2565.0
40.7118.0406.3170.2
840.9729.5
61.9149.1518.5111.5
8.1-3.626.35.75.3
5.32.6
21.52.02.2
1996
Projection
ANNUAL
Q1 Q2 Q3 Q4 1994 1995 1996
-103.3 -100.2
751.0578.640.9125.1412 7172.3
854.2742.162.9
156.6522.5112.3
8.81.5
26.36.45.1
6.57.1
21.63.12.7
767.7593.141.0
132.6419.5174.6
868.0755.062.6164.4528.0113.1
9.21.5
26.36.85.4
6.6-2.121.64.22.8
-99.3 -99.4 -112.1 -110.3 -100.6
784.7607.941.2
140.5426.2176.8
884.0770.162.7
172.6534.8114.0
9.11.6
26.36.55.1
7.60.5
21.65.23.4
802.1623.141.4
148.9432.8179.0
901.6786.663.0
181.3542.3115.1
9 21.6
26.36.45.0
8.22.4
21.65.73.7
650.0491.739.183.4
369.2158.3
762.1654.059.8
109.6484.6108.1
8.35.2
23.98.02.4
11.91.1
26.112.91.0
713.8547.0
41.1108.1397.8166.8
824.2713.7
60.7138.2514.8110.6
8.6-1.028.66.05.8
6.25.3
25.12.72.6
776.4600.741 1
136,8422.8175.7
876.9763 462 8
168.7531 9113.6
9 11.6
26.36.55.1
7.21.9
21.64 63 2
-178.0 -182.8 -175.7 -185.9 -172.5 -170.3 -163.0 -175.5 -156.5 -180.6 -170.4
-128.6 -124.3 -118.2 -113.0-189.9 -188.5 -185.5 -183.0
61.3 64.2 67.3 70.0
-17.548.5
-66 0
-26.548.1
-74.6
-25.549.2
-74.7
-31.950.8
-82.7
-108.3 -103.0 -99.9 -97.8-180.8 -178.1 -177.4 -177.772.6 75.1 77 5 79.8
-31.851.9-83.7
-34.953.8
-88.6
-30.655.8
-86.5
-36.257.6
-93.8
-114.5 -121.0 -102.2-170.4 -186.7 -178.5
55.9 65.7 76 3
-9.545.3
-54.8
-25.349.2
-74.5
-33 454.8
-88.1
Unilateral Transfers, net -31.0 -40.5 -32.0 -32.0 -32.0 -41.0 -32.5 -32.5 -32.5 -41.5 -32.5 -34.2 -34,8
1/ Percent change (AR) from previous period; percent changes for annual data are calculated Q4/Q4.