Fomc 19940706 g Bpt 119940629
47
Prefatory Note The attached document represents the most complete and accurate version available based on original copies culled from the files of the FOMC Secretariat at the Board of Governors of the Federal Reserve System. This electronic document was created through a comprehensive digitization process which included identifying the best- preserved paper copies, scanning those copies, 1 and then making the scanned versions text-searchable. 2 Though a stringent quality assurance process was employed, some imperfections may remain. Please note that this document may contain occasional gaps in the text. These gaps are the result of a redaction process that removed information obtained on a confidential basis. All redacted passages are exempt from disclosure under applicable provisions of the Freedom of Information Act. 1 In some cases, original copies needed to be photocopied before being scanned into electronic format. All scanned images were deskewed (to remove the effects of printer- and scanner-introduced tilting) and lightly cleaned (to remove dark spots caused by staple holes, hole punches, and other blemishes caused after initial printing). 2 A two-step process was used. An advanced optimal character recognition computer program (OCR) first created electronic text from the document image. Where the OCR results were inconclusive, staff checked and corrected the text as necessary. Please note that the numbers and text in charts and tables were not reliably recognized by the OCR process and were not checked or corrected by staff.
-
Upload
fraser-federal-reserve-archive -
Category
Documents
-
view
212 -
download
0
Transcript of Fomc 19940706 g Bpt 119940629
Prefatory Note
The attached document represents the most complete and accurate version available based on original copies culled from the files of the FOMC Secretariat at the Board of Governors of the Federal Reserve System. This electronic document was created through a comprehensive digitization process which included identifying the best-preserved paper copies, scanning those copies,1 and then making the scanned versions text-searchable.2 Though a stringent quality assurance process was employed, some imperfections may remain.
Please note that this document may contain occasional gaps in the text. These gaps are the result of a redaction process that removed information obtained on a confidential basis. All redacted passages are exempt from disclosure under applicable provisions of the Freedom of Information Act.
1 In some cases, original copies needed to be photocopied before being scanned into electronic format. All scanned images were deskewed (to remove the effects of printer- and scanner-introduced tilting) and lightly cleaned (to remove dark spots caused by staple holes, hole punches, and other blemishes caused after initial printing). 2 A two-step process was used. An advanced optimal character recognition computer program (OCR) first created electronic text from the document image. Where the OCR results were inconclusive, staff checked and corrected the text as necessary. Please note that the numbers and text in charts and tables were not reliably recognized by the OCR process and were not checked or corrected by staff.

Strictly Confidential (FR) Class II FOMC
June 29, 1994
SUMMARY AND OUTLOOK
Prepared for the Federal Open Market Committee
By the staff of the Board of Governors of the Federal Reserve System
DOMESTIC NONFINANCIAL DEVELOPMENTS
Overview
Pooling divergent labor market and expenditure indicators, we
are estimating that real GDP has risen somewhere around 3-1/2
percent, at an annual rate, in the quarter now ending. This would
put the first-half increase in activity in line with our projection
in the last Greenbook, and our forecast for coming quarters has not
changed materially, either: real GDP growth is projected to slow in
the second half of this year and to average 2-1/3 percent (annual
rate) over the next six quarters. Underlying this forecast is an
assumption,that monetary policy will be tightened further,
preventing any substantial rise in stock and bond prices before
1995.
A key factor in the development of the forecast was our
judgment that the economy is operating essentially at capacity. We
have revised downward our point estimate of the "non-accelerating
inflation rate of unemployment" (NAIRU) from 6-1/2 percent to
6-1/4 percent. This change follows a thorough review of econometric
estimates of the NAIRU and reflects updated analysis of the
difference between the old and new versions of the Current
Population Survey. The published unemployment rate fell to
6 percent in May, and, even allowing for some seasonal adjustment
problems that may have overstated the decline, these data and other
evidence suggest that the labor market now has tightened to the
point where further significant declines in joblessness likely would
tend to produce more inflationary pressure. Similarly, the rate of
capacity utilization in manufacturing is considerably above its
long-run average, and producers increasingly report a sense that a
measure of pricing leverage has been restored. Rising commodity
prices, including that for crude oil, and the recent depreciation of
I-2
the dollar also suggest a near-term inflationary risk. However,
with the projected moderation in aggregate demand growth, core
inflation--as measured by the CPI excluding food and energy--is
forecast to run just a shade over 3 percent through next year, a
little above the pace of the past twelve months.
Key Assumptions
We are now assuming a larger increase in the federal funds rate
over the coming months than we anticipated in our last projection.
In part, this reflects our assessment of the inflationary
implications of recent exchange market developments; in addition,
though, we have interpreted the bond rally that followed the
System's May tightening actions as confirming our prior judgment
that there is room for a substantial diminution of "liquidity
premia" in the term structure. Maintenance of adequate overall
financial restraint thus seems likely to require at least some
further tightening of money market conditions. As short rates
stabilize, and as growth in economic activity moderates and
inflation remains subdued, we do anticipate some decline in bond
yields and rise in stock prices during 1995.
Given a more realistic view by investors of the risk-return
characteristics of mutual funds, shifts into those funds are
expected to remain considerably below the pace of 1993. However.
slowing nominal income growth and further increases in short-term
interest rates should restrain growth of the broad monetary
aggregates in the second half of 1994 and in 1995. The velocities
of M2 and M3 are projected to continue rising, though at somewhat
reduced rates. M2 and M3 are expected to come in around the lower
ends of their current 1994 target ranges and to accelerate slightly
next year.
I-3
The staff's fiscal policy assumptions are unchanged from the
May Greenbook. Discretionary spending is expected to hold at, or a
bit below, the OBRA-93 caps in both FY1994 and FY1995, and we do not
anticipate enactment of any major new initiatives. It is possible
that some health-care legislation will be passed this year or next,
but its fiscal effects are likely to be negligible for some time
(especially given PAYGO constraints). As a result, fiscal policy
continues to exert a moderate degree of restraint on economic
activity over the forecast period. The unified budget deficit is
projected to fall to $205 billion in FY1994 and $199 billion in
FY1995: both figures are lower than in the May Greenbook, reflecting
the influence of the higher level of nominal income on tax receipts
and mounting evidence that outlays for health, Medicaid, and several
discretionary accounts will come in below earlier projections.
Since the last meeting of the FOMC, the trade-weighted foreign
exchange value of the dollar in terms of other G-10 currencies has
fallen 4 percent. We are anticipating no major changes from the
current level through the end of 1995. Meanwhile, the latest data
suggest a strengthening of economic activity abroad, and we have
raised our projection of growth in foreign real GDP this year
somewhat, to 3-1/4 percent on an export-weighted basis. We still
expect foreign economies to grow 3-1/2 percent in 1995. Crude oil
prices have risen since the time of the last Greenbook, reflecting a
strengthening in world oil demand and some OPEC production
restraint. We now project the spot price of West Texas intermediate
(WTI) to average $18.60 per barrel in the third quarter--$1.35
higher than in the May Greenbook. The price is expected to ease
slightly to $18.50 in the fourth quarter and to remain at that level
in 1995--an upward revision of $1 per barrel from the last forecast.
I-4
The Outlook for the Second Quarter
As noted above, the signals about economic growth in the second
quarter are quite mixed. In the labor market, although the gain in
payrolls (on a strike-adjusted basis) was modest in May, it came on
the heels of sizable advances earlier; the recent behavior of
initial claims for unemployment insurance suggests that healthy
growth in employment has continued in June. Importantly, average
workweeks were exceptionally long in April and May, so that
aggregate hours of private production workers could well increase
6 percent or more, at an annual rate, in the second quarter.
Obviously, this would imply another very large increase in GDP.
unless there has been a decline in productivity. Such a decline,
however, would not be surprising in the wake of the surge late last
year,
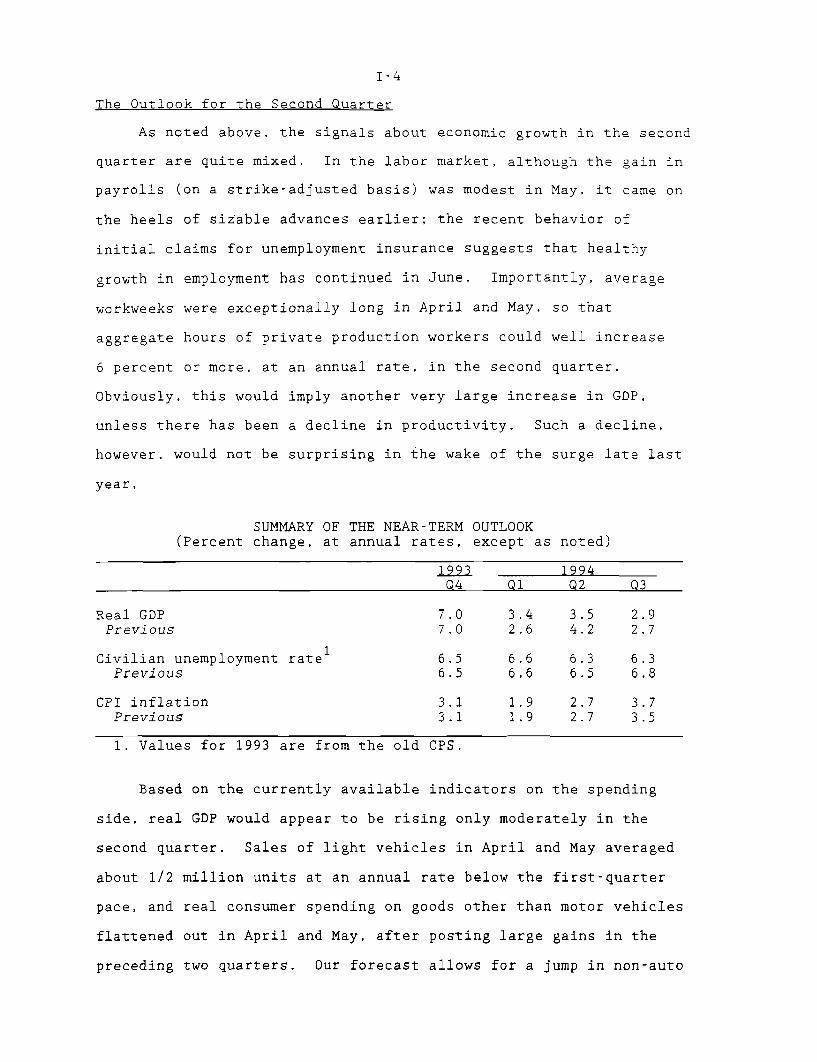
SUMMARY OF THE NEAR-TERM OUTLOOK(Percent change, at annual rates, except as noted)
1993 1994Q4 Q1 Q2 Q3
Real GDP 7.0 3.4 3.5 2.9Previous 7.0 2.6 4.2 2.7
Civilian unemployment ratel 6.5 6.6 6.3 6.3Previous 6.5 6.6 6.5 6.8
CPI inflation 3.1 1.9 2.7 3.7Previous 3.1 1.9 2.7 3.5
1. Values for 1993 are from the old CPS.
Based on the currently available indicators on the spending
side, real GDP would appear to be rising only moderately in the
second quarter. Sales of light vehicles in April and May averaged
about 1/2 million units at an annual rate below the first-quarter
pace, and real consumer spending on goods other than motor vehicles
flattened out in April and May, after posting large gains in the
preceding two quarters. Our forecast allows for a jump in non-auto
I-5
retail sales in June or upward revisions to prior months--to help
narrow the apparent gap between the labor market and expenditure
data. As a result, we are projecting that real PCE will grow at
around a 1-3/4 percent annual rate in the second quarter, versus
4-1/2 percent in the first quarter. In broad terms, this pattern is
consistent with our expectation that spending would not continue to
outstrip income growth as it had been doing since 1992.
Residential investment is expected to record a moderate
increase in the current quarter. Single-family housing starts moved
lower in April and May, after a weather-related rebound in March.
This slowdown likely extended into June: Consumer perceptions of
homebuying conditions have deteriorated further, builders report a
tailing off in new home sales, and mortgage loan applications have
drifted lower. In contrast, multifamily starts strengthened
considerably in April and May, evidently boosted by a tightening in
some local markets and improved availability of financing. Overall,
housing starts are projected to rise to 1.47 million units in the
second quarter--close to the pace in the final quarter of 1993.
Real business fixed investment is projected to rise at a
15-1/4 percent annual rate this quarter, as equipment spending posts
another double-digit advance and nonresidential construction
rebounds from the weather-depressed level of the first quarter. On
the equipment side, shipments of nondefense capital goods excluding
aircraft posted solid gains in April and May, paced by further
increases in computer shipments and healthy gains for other types of
capital goods. Nonresidential construction in April moved above its
fourth-quarter level.
Nonfarm inventory investment is expected to contribute
appreciably to GDP growth in the second quarter. In the motor
vehicle sector, the pace of inventory investment likely has slowed,
I-6
reflecting the pressure of demand on constrained production.
Outside of motor vehicles, however, the increase in stocks in April
was considerable, and we have assumed still larger increases for
May and June--again with an eye to narrowing the input-expenditure
data gap.
With regard to inflation, we are anticipating a CPI increase of
about 0.3 percent in June, bringing the second-quarter average to
2-3/4 percent (annual rate). Food prices ticked up a bit in May and
are expected to register increases in the near term that are close
to general inflation trends. Energy prices declined in May, but
we expect increases in the coming months as the result of the recent
rise in crude oil prices. Excluding food and energy, the CPI was up
0.3 percent in May and is projected to rise by a similar amount in
June. To date, the subdued trend in unit labor costs has overridden
any pressure on finished goods prices from rising materials costs.
Although reports of labor shortages are becoming more frequent, they
are not widespread and wage trends remain stable. Average hourly
earnings rose 1/2 percent in May, but the twelve-month change was
2.7 percent--little different from the pace of the past couple of
years.
The Longer-Run Outlook for the Economy
Growth in real GDP is projected to slow from an estimated
average pace of about 3-1/4 percent over the past six quarters to
2-1/3 percent over the next six. The deceleration in domestic
demand is still sharper, under the assumed monetary restraint, while
the depreciation of the dollar and pickup in foreign growth bring a
halt to the decline of real net exports by late 1995. The path of
the unemployment rate jumps off from a lower level this quarter than
in the May forecast, but with growth averaging a touch below the
potential pace, we anticipate a small uptick in the unemployment
I-7
rate in 1995. We have raised our forecast of core inflation
slightly--to 3.1 percent in both 1994 and 1995--owing to the near
exhaustion of slack and the passthrough of larger projected
increases in oil and other import prices.
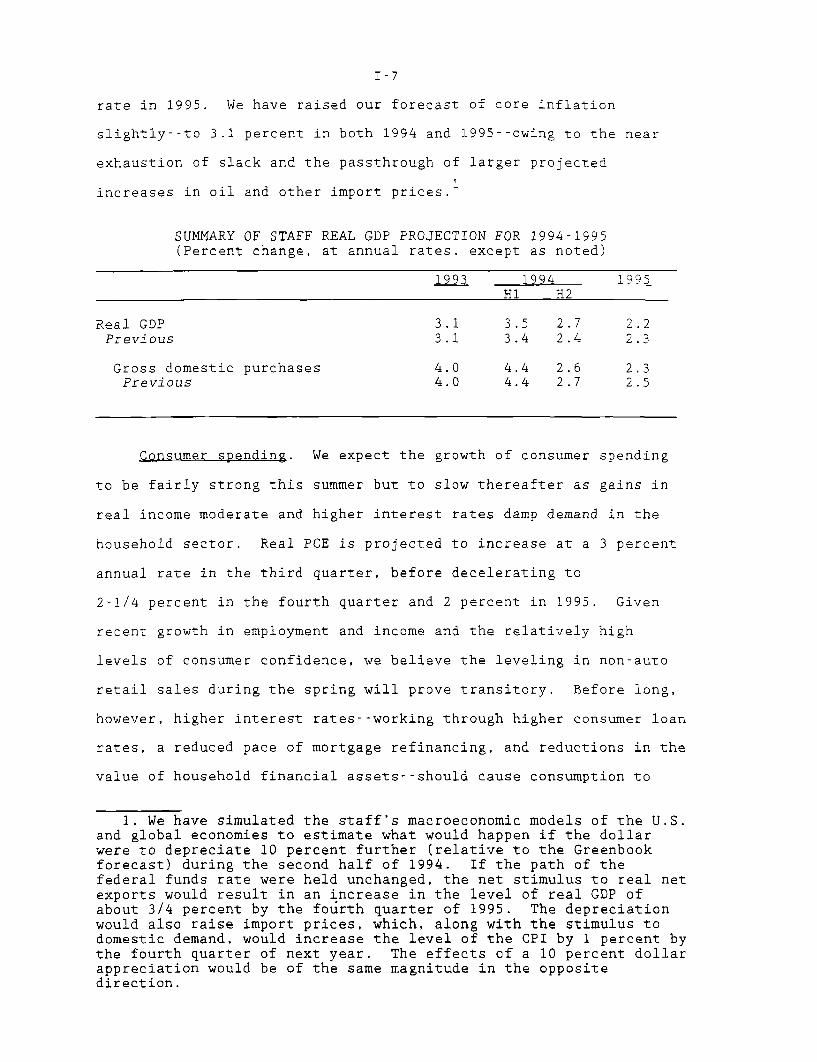
SUMMARY OF STAFF REAL GDP PROJECTION FOR 1994-1995(Percent change, at annual rates, except as noted)
1993 1994 1995HI H2
Real GDP 3.1 3.5 2.7 2.2Previous 3.1 3.4 2.4 2.3
Gross domestic purchases 4.0 4.4 2.6 2.3Previous 4.0 4.4 2.7 2.5
Consumer spending. We expect the growth of consumer spending
to be fairly strong this summer but to slow thereafter as gains in
real income moderate and higher interest rates damp demand in the
household sector. Real PCE is projected to increase at a 3 percent
annual rate in the third quarter, before decelerating to
2-1/4 percent in the fourth quarter and 2 percent in 1995. Given
recent growth in employment and income and the relatively high
levels of consumer confidence, we believe the leveling in non-auto
retail sales during the spring will prove transitory. Before long,
however, higher interest rates--working through higher consumer loan
rates, a reduced pace of mortgage refinancing, and reductions in the
value of household financial assets--should cause consumption to
1. We have simulated the staff's macroeconomic models of the U.S.and global economies to estimate what would happen if the dollarwere to depreciate 10 percent further (relative to the Greenbookforecast) during the second half of 1994. If the path of thefederal funds rate were held unchanged, the net stimulus to real netexports would result in an increase in the level of real GDP ofabout 3/4 percent by the fourth quarter of 1995. The depreciationwould also raise import prices, which, along with the stimulus todomestic demand, would increase the level of the CPI by 1 percent bythe fourth quarter of next year. The effects of a 10 percent dollarappreciation would be of the same magnitude in the oppositedirection.
I-8
slow. In such an environment, we expect the personal saving rate to
tilt upward, as greater uncertainty about the economic environment
and the desire to rebuild weakened financial positions cause
households to hold the growth of spending below gains in incomes.
"Discretionary" expenditures will bear the brunt of the
projected slowdown in consumer spending. But we are projecting only
a flattening of durables goods purchases, not a recessionary
decline. Pent-up demand for motor vehicles probably will buoy
sales, though higher finance charges are expected to help hold
volumes well below some of the rosier industry forecasts. Sales of
furniture and appliances and some other household goods are likely
to suffer with the projected slackening in housing transactions.
Residential investment. The outlook for residential
construction activity is little changed from the May Greenbook.
Housing starts slow to an annual rate of 1.38 million units in the
third quarter and edge lower through early 1995 before turning
upward as mortgage rates ease. Despite the sizable increases in
interest rates on longer-term fixed-rate loans since last fall,
single-family homes remain highly affordable by the standards of the
past twenty years; moreover, an increasing proportion of borrowers
have opted for ARMS, to take advantage of the relatively low initial
rates. Consequently, single-family starts in 1994 and 1995 are
projected to remain close to the 1993 level.
In the multifamily sector, we expect starts to fall off a bit
from their strong second-quarter pace and then to trend gradually
upward over the remainder of the projection period. Although the
projected higher level of activity would be the best in several
years, it would still be low by historical standards; thus
vacancy rates should fall, bolstering returns on income properties
and sustaining investor interest.
I-9
Business fixed investment. After increasing 15 percent in
1993, real BFI is projected to grow 10 percent this year and another
7-1/4 percent in 1995. Investment growth will be damped by the
projected deceleration in economic activity, higher financing costs,
and a growing shortfall of internal funds relative to capital
outlays. The slowing is projected to be concentrated in the
equipment category, where spending has been soaring. Indeed, the
projected slackening in demand for PDE might have been greater were
it not for our assumption that prices will continue to fall rapidly
for computers and communications equipment upon which businesses are
relying to achieve operational efficiencies and improvements in
product/service quality.
Following the weather-related rebound in the second quarter,
real investment in nonresidential structures is forecast to increase
at about a 6 percent annual rate through next year. Construction
permits are trending upward, and the fundamentals in this sector
generally seem to be improving--with the notable exception of
electric utilities. The need to eliminate capacity bottlenecks is
stimulating some industrial construction, while investment in
commercial facilities, such as warehouses and shopping centers,
appears to be quite strong. As in the residential sector, credit is
readily available from depository institutions, and REIT investment
also is helping to support activity. The construction of office
buildings is expected to drift lower this year, but with vacancy
rates moving downward, an upturn is expected to commence in 1995.
Business inventories. Despite the strength in economic
activity over the past couple of years, businesses have shown no
desire to raise their stocks relative to sales. Inventory-shipments
ratios in manufacturing have moved lower despite the fact that more
inputs are reported to be in short supply and order lead times have
I-10
lengthened. Companies continue to seek just-in-time production and
distribution to reduce working capital tied up in stocks--and we
foresee no change in these patterns over the projection period.
Indeed, higher real carrying costs and greater concerns about future
sales in an environment of a tightening of monetary conditions will
further encourage firms to keep their stocks lean. As a result,
nonfarm inventory investment has an essentially neutral influence on
real GDP in our projection for coming quarters.
Government purchases. Real federal purchases are projected to
decline 3-1/4 percent in 1994 and 1995. Defense spending fell
almost 10 percent (annual rate) in the first quarter, to a level
below that implied by the trend in appropriations; not surprisingly,
recent monthly Treasury statements indicate that the decline has
slowed, and we are looking for an overall decline of 6 percent this
year and 5 percent in 1995. Real nondefense spending surged in the
first quarter and is projected to retrace only a small part of that
increase in the second quarter. Thereafter, caps on discretionary
spending, reflected mainly in reductions in federal employment,
prevent further growth in this category.
Real state and local purchases are expected to increase
3 percent at an annual rate in the second quarter, owing, in part,
to a pickup in construction after weather-related disruptions in the
first quarter. Over the remainder of the forecast period, state and
local purchases are projected to grow at about a 2-1/2 percent
annual pace. The sector's deficit on operating and capital
accounts, is expected to narrow but still is projected to amount to
$44 billion in 1995.
Net exports. The deficit on real net exports is projected to
increase at a slower pace than in the May Greenbook, reflecting the
lower value of the dollar in this forecast and the somewhat faster
I-11
recovery in economic activity abroad. Real merchandise exports are
project to grow 4-3/4 percent this year and 8-1/2 percent in 1995.
In contrast, the higher cost of imported goods and the slowdown in
U.S. economic activity are projected to cause the growth of real
merchandise imports to slow from the double-digit pace of the past
two years to 9-1/4 percent in 1994 and 8 percent in 1995. (A
complete discussion of these developments is contained in the
International Developments section.)
STAFF LABOR MARKET PROJECTIONS(Percent change, Q4 TO Q4, except as noted)
1993 1994 1995
Output per hour, nonfarm business 1.7 .9 1.1Previous 2.0 .9 1.2
Nonfarm payroll employment 2.0 2.2 1.4Previous 1.8 2.3 1.3
Civilian unemployment ratel 6.5 6.3 6.4Previous 6.5 6.6 6.6
1. Average for the fourth quarter. Values for 1993 are from theold CPS.
Labor markets. Employment growth is projected to remain fairly
brisk in the very near term, but to slow appreciably over the
forecast period, in line with economic activity. Businesses are
expected to remain focused on boosting efficiency. However, the
easiest gains presumably have been made after several years of
downsizing and "re-engineering," and the pool of well-qualified
workers is shrinking; thus, it likely will be more difficult to
match the productivity gains achieved in earlier phases of the
expansion. As a result, we are projecting that labor productivity
will rise about 1 percent per year in 1994 and 1995, somewhat less
than the staff's estimate of the current trend in productivity
growth (roughly 1-1/2 percent). We expect the average workweek to
fall back in June from its extraordinary May level, but to remain on
I-12
the high side of recent norms--reflecting continued efforts to
minimize hiring and benefit costs. On balance, we are projecting
gains in payroll employment of 2-1/2 million in 1994 and 1-1/2
million in 1995.
The unemployment rate is expected to rebound in June, leaving
the average for the second quarter at 6-1/4 percent; we are
projecting the unemployment rate to remain at about that level
through 1994 but to edge up in 1995. The sharp decline in the
unemployment rate over the first half of this year raises a number
of difficult questions that have important implications for our
inflation forecast. Our current projection of 3-1/2 percent real
GDP growth in the first half of 1994 is the same as in the January
Greenbook, yet the unemployment rate, with adjustments for our past
and present assumptions regarding the distortions from the new CPS,
is roughly 1/2 percentage point lower than we projected at that
time. There are a number of possible explanations for this.
Obviously, as discussed above, we may be greatly underestimating
growth in the second quarter, which would help to put our output-
unemployment (Okun's law) relationship back on track. The increase
in real GDP in 1993 also could have been stronger than BEA currently
is estimating, and the lagged effects of this additional output
growth may have pulled the unemployment rate down this year.
Putting aside questions about the growth in output, the
surprisingly large decline in the unemployment rate in the first six
months of 1994 also suggests the possibility of an offsetting upward
movement in the period ahead. By our reckoning, labor productivity
has been flat, on net, thus far in 1994, and were it to pick up
sharply, there would be less hiring and probably higher
unemployment, given our GDP path. Growth in the labor force also
has been surprisingly slow this year. The labor force participation
I-13
rate inched down between January and May, extending a pattern of
several years duration now of surprising sluggishness. On the
continuing assumption that this is largely a cyclical phenomenon.
our forecast assumes that the participation rate will begin to
increase again in the second half of this year and continue moving
back toward the longer-term trend during 1995.2 If, instead, the
weakness really is evidence of a new flatter trend, our forecast of
higher participation rates poses a potentially serious downside risk
to our projection of the unemployment rate--and to our assumed pace
of potential output growth. At this juncture, it is our assessment
that the risk of a shortfall in labor force participation may be
greater than that of a sudden re-acceleration of labor productivity.
However, both possibilities loom as significant risks in the outlook
for labor market pressures.
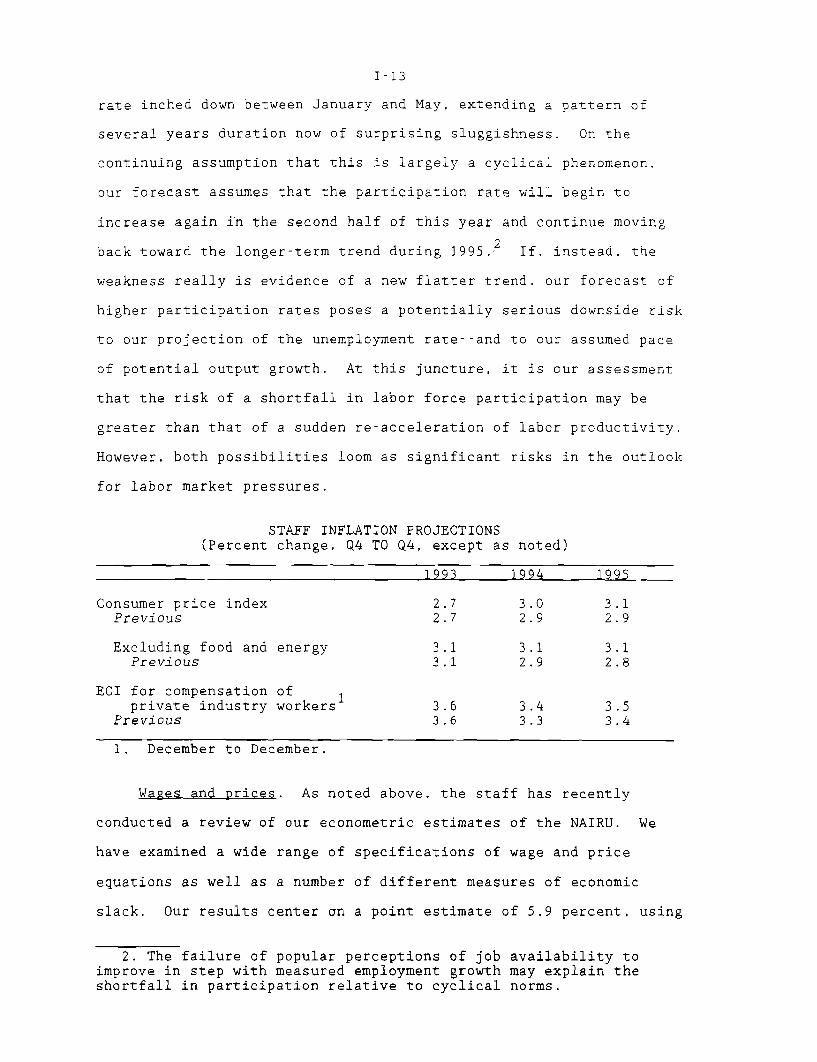
STAFF INFLATION PROJECTIONS(Percent change, Q4 TO Q4, except a
1993
s noted)
1994 1995
Consumer price index 2.7 3.0 3.1Previous 2.7 2.9 2.9
Excluding food and energy 3.1 3.1 3.1Previous 3.1 2.9 2.8
ECI for compensation ofprivate industry workers 3.6 3.4 3.5
Previous 3.6 3.3 3.4
1. December to December.
Wages and prices. As noted above, the staff has recently
conducted a review of our econometric estimates of the NAIRU. We
have examined a wide range of specifications of wage and price
equations as well as a number of different measures of economic
slack. Our results center on a point estimate of 5.9 percent, using
2. The failure of popular perceptions of job availability toimprove in step with measured employment growth may explain theshortfall in participation relative to cyclical norms.
I-14
data prior to the CPS revision; taking into account the statistical
uncertainty associated with this estimate, a reasonable range for
the NAIRU would run from 5-1/2 percent to 6-1/2 percent. We also
have reviewed the adjustment needed to bridge the gap between the
old and new labor market surveys. Based on our own work and on
consultations with the BLS, we have lowered our working assumptions
of the adjustment factor from 1/2 percentage point to 1/3
percentage point.3 As a result of this revision to the
adjustment factor, we have lowered our NAIRU estimate to
6-1/4 percent.
With unemployment projected to remain close to the NAIRU,
growth in ECI hourly compensation is projected at about
3-1/2 percent in both 1994 and 1995. Increases in the cost of
employer-provided benefits are expected to continue outstripping the
growth of wages and salaries, reflecting premium increases for
health insurance that exceed general inflation and stepped-up
contributions by companies to underfunded pension plans. Indeed,
two large cash payments by General Motors to its pension plan show
up as temporary boosts to the growth of hourly compensation in the
third quarters of 1994 and 1995.
Turning to the price projection, consumer food prices are
projected to rise at a 3-3/4 percent annual rate in the second half
of this year, before moderating to a 2-3/4 percent pace in 1995.
The temporary pickup reflects expected increases in the prices of
fresh vegetables over the near term as well as the runup in coffee
prices on world markets. Meat prices are expected to fall sharply
in the next couple of months, but to recover a little towards year-
end. Consumer energy prices are projected to be up sharply for the
next three quarters, reflecting the path of crude oil prices.
3. This includes the effect of the introduction of new CPSand population "controls" derived from the 1990 census.
I-15
Higher energy costs have a direct effect on the CPI through higher
prices of refined petroleum products and competing energy products.
They also have an indirect effect on the CPI as higher production
and transportation costs are reflected in the prices of non-energy
goods and services. The indirect effect occurs with a lag and in
the staff projection has its greatest effect on the CPI later this
year and in early 1995.
Were it not for the energy and exchange rate "shocks" in this
forecast, our projection of resource utilization rates would have
been consistent with core inflation continuing in 1994 and 1995 at a
pace slightly below 3 percent. However, in the absence of
meaningful slack in the economy, the depreciation of the dollar and
the passthrough of higher energy costs to the prices of other goods
and services likely will put some modest upward pressure on core
inflation. We expect year-to-year increases in the CPI excluding
food and energy to move up from the 2-3/4 percent rate in May to
3.1 percent by the end of 1994; core inflation remains at that pace
in 1995. Factoring in the influence of food and energy prices, we
are projecting the CPI to rise 3 percent this year and 3.1 percent
in 1995, after increasing 2.7 percent in 1993.
Note: It has not been possible to incorporate revised GDP data
for the first quarter in the detailed tables that follow. No
changes are anticipated in growth rates for the forecasted period,
but incorporation of the revised first-quarter figures will affect
various entries for levels and annual growth.
Strictly Confidential (FR)
Class II FOMC
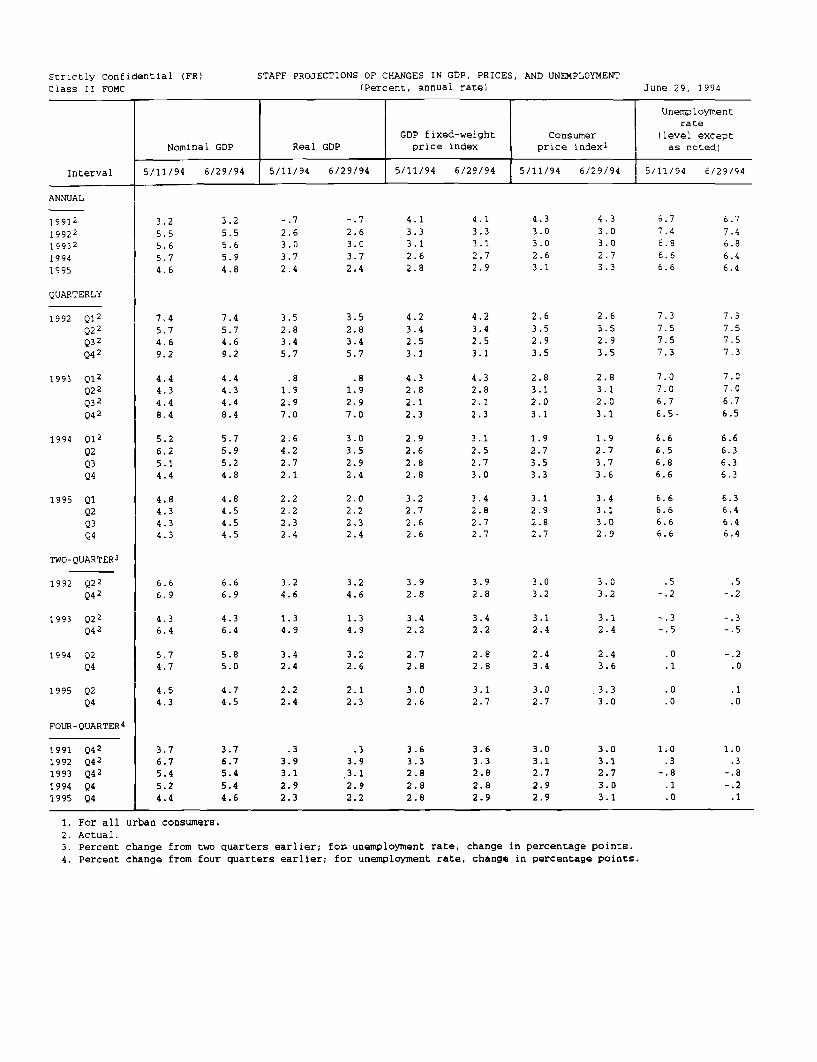
STAFF PROJECTIONS OF CHANGES IN GDP, PRICES, AND UNEMPLOYMENT(Percent, annual rate) June 29, 1994
Unemploymentrate
GDP fixed-weight Consumer (level exceptNominal GDP Real GDP price index price index1 as noted)
Interval 5/11/94 6/29/94 5/11/94 6/29/94 5/11/94 6/29/94 5/11/94 6/29/94 5/11/94 6/29/94
ANNUAL
19912199221993219941995
QUARTERLY
1992 Q12Q2
2
Q32
Q42
1993 Q12Q22
Q32Q42
1994 Q12
Q2Q3Q4
1995 Q1Q2Q3Q4
3.25.55.65.74.6
7.45.74.69.2
4.44.34.48.4
5.26.25.14.4
4.84.34.34.3
TWO-QUARTER3
1992 Q22
Q42
1993 Q22Q4
2
1994 Q2Q4
1995 Q2Q4
FOUR-QUARTER4
1991 Q421992 Q421993 Q421994 Q41995 Q4
6.6 6.6 3.2 3.2 3.9 3.9 3.0 3.0 .5
6.9 6.9 4.6 4.6 2.8 2.8 3.2 3.2 -.2
4.3 4.36.4 6.4
5.7 5.84.7 5.0
4.5 4.74.3 4.5
1.3 1.3 3.4 3.4 3.1 3.1 -.3 -.34.9 4.9 2.2 2.2 2.4 2.4 -.5 -.5
3.4 3.2 2.7 2.8 2.4 2.4 .0 -.22.4 2.6 2.8 2.8 3.4 3.6 .1 .0
2.2 2.1 3.0 3.1 3.0 3.32.4 2.3 2.6 2.7 2.7 3.0
For all urban consumers.Actual.Percent change from two quarters earlier; for unemployment rate, change in percentage points.
4. Percent change from four quarters earlier; for unemployment rate, change in percentage points.
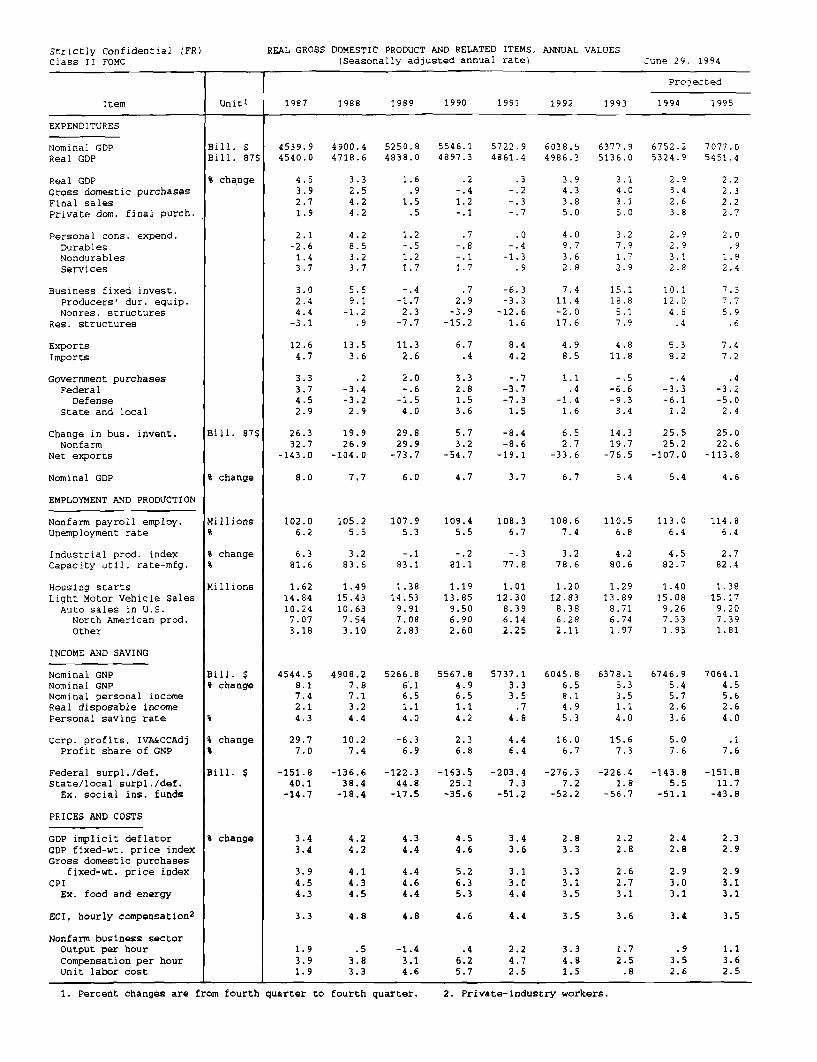
Strictly Confidential (FR)Class II FOMC
REAL GROSS DOMESTIC PRODUCT AND RELATED ITEMS,(Seasonally adjusted annual rate)
ANNUAL VALUES
June 29, 1994
Projected
Item Unit1 1987 1988 1989 1990 1991 1992 1993 1994 1995
EXPENDITURES
Nominal GDPReal GDP
Real GDPGross domestic purchasesFinal salesPrivate dom. final purch.
Personal cons. expend.DurablesNondurablesServices
Business fixed invest.Producers' dur. equip.Nonres. structures
Res. structures
ExportsImports
Government purchasesFederal
DefenseState and local
Change in bus. invent.Nonfarm
Net exports
Nominal GDP
EMPLOYMENT AND PRODUCTION
Nonfarm payroll employ.Unemployment rate
Industrial prod. indexCapacity util. rate-mfg.
Housing startsLight Motor Vehicle Sales
Auto sales in U.S.North American prod.Other
INCOME AND SAVING
Nominal GNPNominal GNPNominal personal incomeReal disposable incomePersonal saving rate
Corp. profits, IVA&CCAdjProfit share of GNP
Federal surpl./def.State/local surpl./def.
Ex. social ins. funds
PRICES AND COSTS
GDP implicit deflatorGDP fixed-wt. price indexGross domestic purchases
fixed-wt. price indexCPI
Ex. food and energy
ECI, hourly compensation2
Nonfarm business sectorOutput per hourCompensation per hourunit labor cost
Bill. $Bill. 87$
% change
Bill. 87$
% change
Millions%
% change%
Millions
Bill. $% change
%
% change%
Bill. $
% change
-J--....-----.-.------.. 4
1. Percent changes are from fourth quarter to fourth quarter. 2. Private-industry workers.
4539.94540.0
4.53.92.71.9
2.1-2.61.43.7
3.02.44.4
-3.1
4900.44718.6
3.32.54.24.2
4.28.53.23.7
5.59.1
-1.2.9
5250.84838.0
1.6.9
1.5.5
1.2-. 51.21.7
-. 4-1.72.3-7.7
5546.14897.3
.2-. 4
1.2-. 1
.7-. 8
-. 1
1.7
.72.9-3.9
-15.2
12.6 13.5 11.3 6.74.7 3.6 2.6 .4
3.3 .2 2.0 3.33.7 -3.4 -.6 2.84.5 -3.2 -1.5 1.52.9 2.9 4.0 3.6
26.3 19.9 29.8 5.732.7 26.9 29.9 3.2
-143.0 -104.0 -73.7 -54.7
8.0 7.7 6.0 4.7
102.0
6.2
6.381.6
1.6214.8410.247.073.18
4544.58.17.42.14.3
29.77.0
-151.840.1
-14.7
3.43.4
3.94.54.3
3.3
1.93.91.9
105.25.5
3.283.6
1.4915.4310.637.543.10
4908.27.87.13.24.4
10.27.4
-136.638.4
-18.4
4.24.2
4.14.34.5
4.8
107.95.3
-.183.1
1.3814.539.917.082.83
5266.86. 16.51.14.0
-6.36.9
-122.344.8
-17.5
4.34.4
4.44.64.4
4.8
.5 -1.43.8 3.13.3 4.6
109.45.5
-. 2
81.1
1.1913.85
9.506.902.60
5567.84.96.51.14.2
2.36.8
-163.525.1
-35.6
4.54.6
5.26.35.3
4.6
.46.25.7
5722.94861.4
.3-. 2-. 3
-. 7
.0-.4-1.3
.9
-6.3-3.3
-12.61.6
8.44.2
-. 7-3.7-7.31.5
-8.4-8.6
-19.1
3.7
108.36.7
-. 3
77.8
1.0112.308.396.142.25
5737.13.33.5.7
4.8
4.46.4
-203.47.3
-51.2
3.43.6
3.13.04.4
4.4
2.24.72.5
6038.54986.3
3.94.33.85.0
4.09.73.62.8
7.411.4-2.017.6
4.98.5
1.1.4
-1.41.6
6.52.7
-33.6
6.7
108.67.4
3.278.6
1.2012.83
8.386.282.11
6045.86.58.14.95.3
16.06.7
-276.37.2
-52.2
2.83.3
3.33.13.5
3.5
3.34.81.5
6377.95136.0
3.14.03.15.0
3.27.91.7
2.9
15.118.85.17.9
6752.25324.9
2.93.42.63.8
2.92.93.12.8
10.112.04.6.4
4.8 5.311.8 8.2
-. 5 -. 4-6.6 -3.3-9.3 -6.13.4 1.2
14.3 25.519.7 25.2
-76.5 -107.0
5.4 5.4
110.56.8
4.280.6
1.2913.89
8.716.741.97
6378.15.33.51.14.0
15.67.3
-226.41.8
-56.7
2.22.8
2.62.73.1
3.6
1.72.5.8
113.06.4
4.582.7
1.4015.08
9.267.331.93
6746.95.45.72.63.6
5.07.6
-143.85.5
-51.1
2.42.8
2.93.03.1
3.4
.93.52.6
7077.05451.4
2.22.32.22.7
2.0.9
1.82.4
7.37.75.9
.6
7.47.2
.4-3.2-5.02.4
25.022.6
-113.8
4.6
114.86.4
2.782.4
1.3815.179.207.391.81
7064.14.55.62.64.0
.17.6
-151.811.7
-43.8
2.32.9
2.93.13.1
3.5
1.13.62.5
1. Percent changes are from fourth quarter to fourth quarter. 2. Private-industry workers.
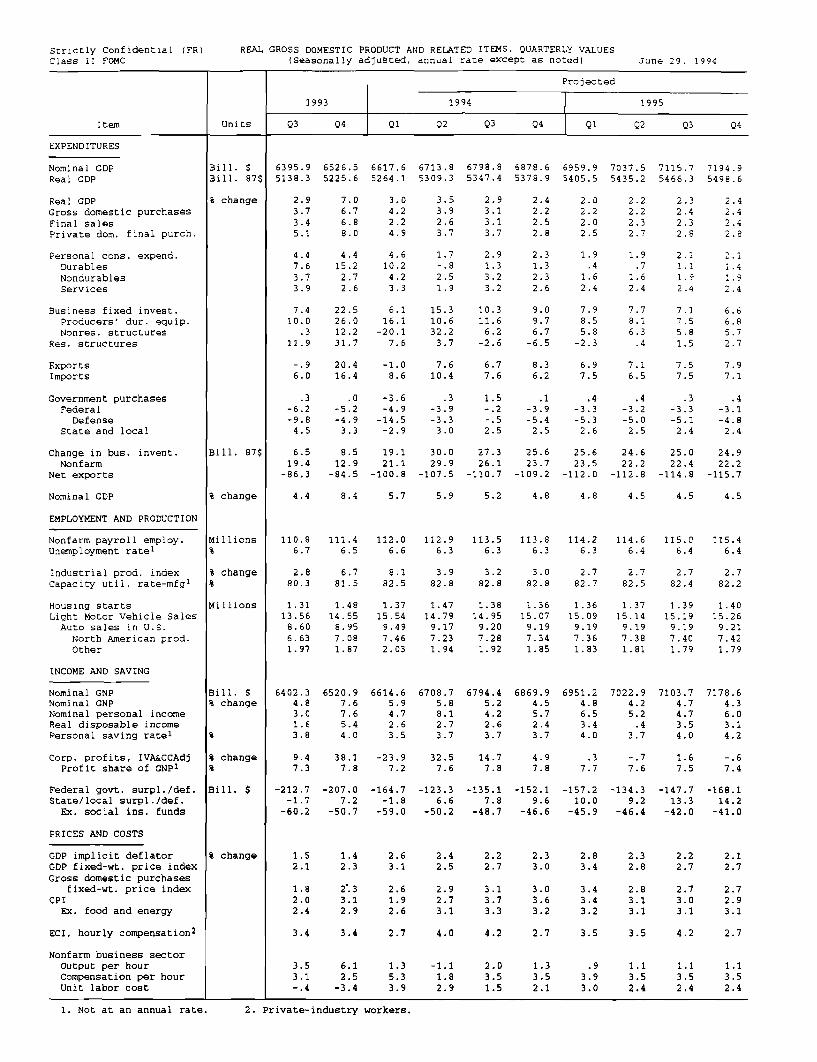
Strictly Confidential (FR) REAL GROSS DOMESTIC PRODUCT AND RELATED ITEMS, QUARTERLY VALUESClass II FOMC (Seasonally adjusted, annual rate except as noted) June 29, 1994
Projected
1993 1994 1995
Item Units Q3 Q4 Q1 Q2 Q3 Q4 Q1 Q2 Q3 Q4
EXPENDITURES
Nominal GDP Bill. $ 6395.9 6526.5 6617.6 6713.8 6798.8 6878.6 6959.9 7037.5 7115.7 7194.9Real GDP Bill. 87$ 5138.3 5225.6 5264.1 5309.3 5347.4 5378.9 5405.5 5435.2 5466.3 5498.6
Real GDP % change 2.9 7.0 3.0 3.5 2.9 2.4 2.0 2.2 2.3 2.4Gross domestic purchases 3.7 6.7 4.2 3.9 3.1 2.2 2.2 2.2 2.4 2.4Final sales 3.4 6.8 2.2 2.6 3.1 2.5 2.0 2.3 2.3 2.4Private dom. final purch. 5.1 8.0 4.9 3.7 3.7 2.8 2.5 2.7 2.8 2.8
Personal cons. expend. 4.4 4.4 4.6 1.7 2.9 2.3 1.9 1.9 2.1 2.1Durables 7.6 15.2 10.2 -.8 1.3 1.3 .4 .7 1.1 1.4Nondurables 3.7 2.7 4.2 2.5 3.2 2.3 1.6 1.6 1.9 1.9Services 3.9 2.6 3.3 1.9 3.2 2.6 2.4 2.4 2.4 2.4
Business fixed invest. 7.4 22.5 6.1 15.3 10.3 9.0 7.9 7.7 7.1 6.6Producers' dur. equip. 10.0 26.0 16.1 10.6 11.6 9.7 8.5 8.1 7.5 6.8Nonres. structures .3 12.2 -20.1 32.2 6.2 6.7 5.8 6.3 5.8 5.7
Res. structures 11.9 31.7 7.6 3.7 -2.6 -6.5 -2.3 .4 1.5 2.7
Exports -.9 20.4 -1.0 7.6 6.7 8.3 6.9 7.1 7.5 7.9Imports 6.0 16.4 8.6 10.4 7.6 6.2 7.5 6.5 7.5 7.1
Government purchases .3 .0 -3.6 .3 1.5 .1 .4 .4 .3 .4Federal -6.2 -5.2 -4.9 -3.9 -.2 -3.9 -3.3 -3.2 -3.3 -3.1
Defense -9.8 -4.9 -14.5 -3.3 -.5 -5.4 -5.3 -5.0 -5.1 -4.8State and local 4.5 3.3 -2.9 3.0 2.5 2.5 2.6 2.5 2.4 2.4
Change in bus. invent. Bill. 87$ 6.5 8.5 19.1 30.0 27.3 25.6 25.6 24.6 25.0 24.9Nonfarm 19.4 12.9 21.1 29.9 26.1 23.7 23.5 22.2 22.4 22.2
Net exports -86.3 -84.5 -100.8 -107.5 -110.7 -109.2 -112.0 -112.8 -114.8 -115.7
Nominal GDP % change 4.4 8.4 5.7 5.9 5.2 4.8 4.8 4.5 4.5 4.5
EMPLOYMENT AND PRODUCTION
Nonfarm payroll employ. Millions 110.8 111.4 112.0 112.9 113.5 113.8 114.2 114.6 115.0 115.4Unemployment rate1 % 6.7 6.5 6.6 6.3 6.3 6.3 6.3 6.4 6.4 6.4
Industrial prod. index % change 2.8 6.7 8.1 3.9 3.2 3.0 2.7 2.7 2.7 2.7Capacity util. rate-mfg1 % 80.3 81.5 82.5 82.8 82.8 82.8 82.7 82.5 82.4 82.2
Housing starts Millions 1.31 1.48 1.37 1.47 1.38 1.36 1.36 1.37 1.39 1.40Light Motor vehicle Sales 13.56 14.55 15.54 14.79 14.95 15.07 15.09 15.14 15.19 15.26Auto sales in U.S. 8.60 8.95 9.49 9.17 9.20 9.19 9.19 9.19 9.19 9.21
North American prod. 6.63 7.08 7.46 7.23 7.28 7.34 7.36 7.38 7.40 7.42Other 1.97 1.87 2.03 1.94 1.92 1.85 1.83 1.81 1.79 1.79
INCOME AND SAVING
Nominal GNP Bill. % 6402.3 6520.9 6614.6 6708.7 6794.4 6869.9 6951.2 7022.9 7103.7 7178.6Nominal GNP % change 4.8 7.6 5.9 5.8 5.2 4.5 4.8 4.2 4.7 4.3Nominal personal income 3.0 7.6 4.7 8.1 4.2 5.7 6.5 5.2 4.7 6.0Real disposable income 1.6 5.4 2.6 2.7 2.6 2.4 3.4 .4 3.5 3.1Personal saving rate1 % 3.8 4.0 3.5 3.7 3.7 3.7 4.0 3.7 4.0 4.2
Corp. profits, IVA&CCAdj % change 9.4 38.1 -23.9 32.5 14.7 4.9 .3 -.7 1.6 -.6Profit share of GNP1 % 7.3 7.8 7.2 7.6 7.8 7.8 7.7 7.6 7.5 7.4
Federal govt. surpl./def. Bill. $ -212.7 -207.0 -164.7 -123.3 -135.1 -152.1 -157.2 -134.3 -147.7 -168.1State/local surpl./def. -1.7 7.2 -1.8 6.6 7.8 9.6 10.0 9.2 13.3 14.2
Ex. social ins. funds -60.2 -50.7 -59.0 -50.2 -48.7 -46.6 -45.9 -46.4 -42.0 -41.0
PRICES AND COSTS
GDP implicit deflator % change 1.5 1.4 2.6 2.4 2.2 2.3 2.8 2.3 2.2 2.1GDP fixed-wt. price index 2.1 2.3 3.1 2.5 2.7 3.0 3.4 2.8 2.7 2.7Gross domestic purchases
fixed-wt. price index 1.8 2.3 2.6 2.9 3.1 3.0 3.4 2.8 2.7 2.7CPI 2.0 3.1 1.9 2.7 3.7 3.6 3.4 3.1 3.0 2.9
Ex. food and energy 2.4 2.9 2.6 3.1 3.3 3.2 3.2 3.1 3.1 3.1
ECI, hourly compensation2
3.4 3.4 2.7 4.0 4.2 2.7 3.5 3.5 4.2 2.7
Nonfarm business sectorOutput per hour 3.5 6.1 1.3 -1.1 2.0 1.3 .9 1.1 1.1 1.1Compensation per hour 3.1 2.5 5.3 1.8 3.5 3.5 3.9 3.5 3.5 3.5Unit labor cost -.4 -3.4 3.9 2.9 1.5 2.1 3.0 2.4 2.4 2.4
1. Not at an annual rate. 2. Private-industry workers.
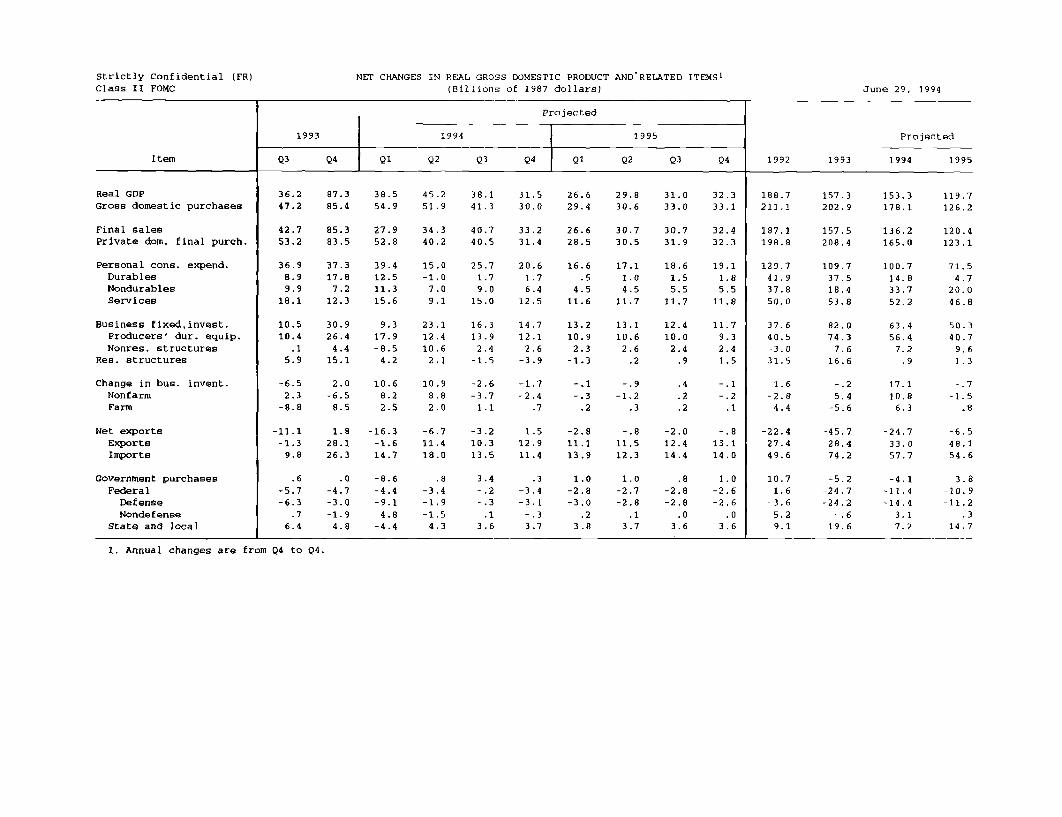
Strictly Confidential (FR)Class II FOMC
NET CHANGES IN REAL GROSS DOMESTIC PRODUCT(Billions of 1987 dollars)
AND RELATED ITEMS1
June 29, 1994
Item
Real GDPGross domestic purchases
Final salesPrivate dom. final purch.
Personal cons. expend.DurablesNondurablesServices
Business fixed.invest.Producers' dur. equip.Nonres. structures
Res. structures
Change in bus. invent.NonfarmFarm
Net exportsExportsImports
Government purchasesFederalDefenseNondefense
State and local
Projected
1993
Q3 Q4
1994
Q2 Q3 Q4
1995
Q2 Q3 Q4
36.2 87.3 38.5 45.2 38.1 31.5 26.6 29.8 31.0 32.347.2 85.4 54.9 51.9 41.3 30.0 29.4 30.6 33.0 33.1
42.7 85.3 27.9 34.3 40.7 33.2 26.6 30.7 30.7 32.453.2 83.5 52.8 40.2 40.5 31.4 28.5 30.5 31.9 32.3
36.9 37.3 39.4 15.0 25.7 20.6 16.6 17.1 18.6 19.18.9 17.8 12.5 -1.0 1.7 1.7 .5 1.0 1.5 1.89.9 7.2 11.3 7.0 9.0 6.4 4.5 4.5 5.5 5.518.1 12.3 15.6 9.1 15.0 12.5 11.6 11.7 11.7 11.8
10.5 30.9 9.3 23.1 16.3 14.7 13.2 13.1 12.4 11.710.4 26.4 17.9 12.4 13.9 12.1 10.9 10.6 10.0 9.3
.1 4.4 -8.5 10.6 2.4 2.6 2.3 2.6 2.4 2.45.9 15.1 4.2 2.1 -1.5 -3.9 -1.3 .2 .9 1.5
-6.5 2.0 10.6 10.9 -2.6 -1.7 -.1 -.9 .4 -.12.3 -6.5 8.2 8.8 -3.7 -2.4 -. 3 -1.2 .2 -.2-8.8 8.5 2.5 2.0 1.1 .7 .2 .3 .2 .1
-11.1 1.8 -16.3 -6.7 -3.2 1.5 -2.8 -.8 -2.0 -.8-1.3 28.1 -1.6 11.4 10.3 12.9 11.1 11.5 12.4 13.19.8 26.3 14.7 18.0 13.5 11.4 13.9 12.3 14.4 14.0
-8.6-4.4-9.1
4.8-4.4
.8-3.4-1.9-1.5
4.3
1.0-2.8-3.0
.23.8
1.0-2.7-2.8
.13.7
.8-2.8-2.8
.03.6
1.0-2.6-2.6
.03.6
1992 1993
Projected
1994 1995
188.7 157.3 153.3 119.7211.1 202.9 178.1 126.2
187.1 157.5 136.2 120.4198.8 208.4 165.0 123.1
129.741.937.850.0
37.640.5-3.031.5
1.6-2.8
4.4
109.737.518.453.8
82.074.3
7.616.6
100.714.833.752.2
63.456.47.2
.9
-. 2 17.15.4 10.8
-5.6 6.3
71.54.7
20.046.8
50.340.7
9.61.3
-.7
-1.5.8
-22.4 -45.7 -24.7 -6.527.4 28.4 33.0 48.149.6 74.2 57.7 54.6
10.71.6
-3.65.29.1
-5.2-24.7-24.2
-.619.6
-4.1-11.4-14.4
3.17.2
1. Annual changes are from Q4 to Q4.
Strictly Confidential (FR)Class II FOMC
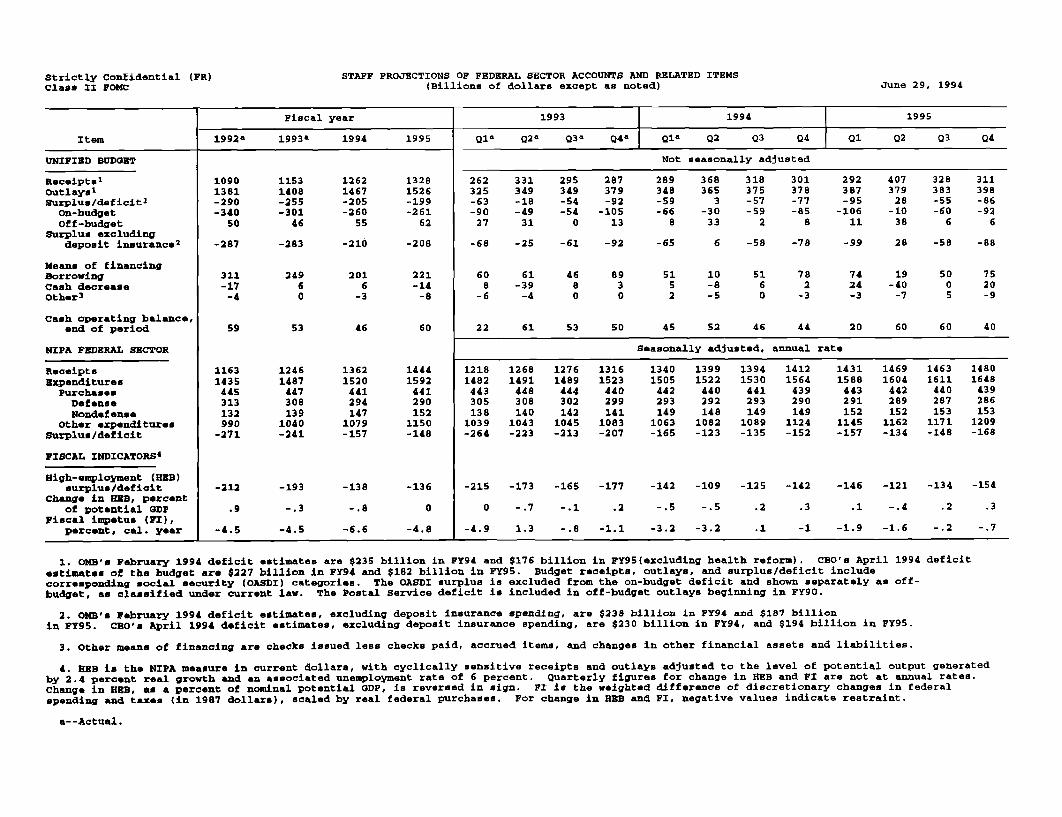
STAFF PROJECTIONS OF FEDERAL SECTOR ACCOUNTS AND RELATED ITEMS(Billions of dollars except as noted) June 29, 1994
Fiscal year 1993 1994 1995
Item 1992a
1993a
1994 1995 Q1a Q2a Q3a
Q4a
Q1a
Q2 Q3 Q4 Q1 Q2 Q3 04
UNIFIED BUDGET Not seasonally adjusted
Receipts1 1090 1153 1262 1328 262 331 295 287 289 368 318 301 292 407 328 311Outlays1 1381 1408 1467 1526 325 349 349 379 348 365 375 378 387 379 383 398Surplus/deficit
1 -290 -255 -205 -199 -63 -18 -54 -92 -59 3 -57 -77 -95 28 -55 -86
On-budget -340 -301 -260 -261 -90 -49 -54 -105 -66 -30 -59 -85 -106 -10 -60 -92
Off-budget 50 46 55 62 27 31 0 13 8 33 2 8 11 38 6 6Surplus excluding
deposit insurance2
-287 -283 -210 -208 -68 -25 -61 -92 -65 6 -58 -78 -99 28 -58 -88
Means of financingBorrowing 311 249 201 221 60 61 46 89 51 10 51 78 74 19 50 75
Cash decrease -17 6 6 -14 8 -39 8 3 5 -8 6 2 24 -40 0 20
Other3
-4 0 -3 -8 -6 -4 0 0 2 -5 0 -3 -3 -7 5 -9
Cash operating balance,end of period 59 53 46 60 22 61 53 50 45 52 46 44 20 60 60 40
NIPA FEDERAL SECTOR Seasonally adjusted, annual rate
Receipts 1163 1246 1362 1444 1218 1268 1276 1316 1340 1399 1394 1412 1431 1469 1463 1480
Expenditures 1435 1487 1520 1592 1482 1491 1489 1523 1505 1522 1530 1564 1588 1604 1611 1648
Purchases 445 447 441 441 443 448 444 440 442 440 441 439 443 442 440 439
Defense 313 308 294 290 305 308 302 299 293 292 293 290 291 289 287 286Nondefense 132 139 147 152 138 140 142 141 149 148 149 149 152 152 153 153
Other expenditures 990 1040 1079 1150 1039 1043 1045 1083 1063 1082 1089 1124 1145 1162 1171 1209Surplus/deficit -271 -241 -157 -148 -264 -223 -213 -207 -165 -123 -135 -152 -157 -134 -148 -168
FISCAL INDICATORS4
High-employment (HEB)surplus/deficit -212 -193 -138 -136 -215 -173 -165 -177 -142 -109 -125 -142 -146 -121 -134 -154
Change in HEB, percentof potential GDP .9 -. 3 -.8 0 0 -.7 -.1 .2 -. 5 -. 5 .2 .3 .1 -.4 .2 .3
Fiscal impetus (FI),percent, cal. year -4.5 -4.5 -6.6 -4.8 -4.9 1.3 -.8 -1.1 -3.2 -3.2 .1 -1 -1.9 -1.6 -.2 -.7
1. OMB's February 1994 deficit estimates are $235 billion in FY94 and $176 billion in FY95(excluding health reform). CBO's April 1994 deficitestimates of the budget are $227 billion in FY94 and $182 billion in FY95. Budget receipts, outlays, and surplus/deficit includecorresponding social security (OASDI) categories. The OASDI surplus is excluded from the on-budget deficit and shown separately as off-budget, as classified under current law. The Postal Service deficit is included in off-budget outlays beginning in FY90.
2. OMB's February 1994 deficit estimates, excluding deposit insurance spending, are $238 billion in FY94 and $187 billionin FY95. CBO's April 1994 deficit estimates, excluding deposit insurance spending, are $230 billion in FY94, and $194 billion in FY95.
3. Other means of financing are checks issued less checks paid, accrued items, and changes in other financial assets and liabilities.
4. HEB is the NIPA measure in current dollars, with cyclically sensitive receipts and outlays adjusted to the level of potential output generatedby 2.4 percent real growth and an associated unemployment rate of 6 percent. Quarterly figures for change in HEB and FI are not at annual rates.Change in HEB, as a percent of nominal potential GDP, is reversed in sign. FI is the weighted difference of discretionary changes in federalspending and taxes (in 1987 dollars), scaled by real federal purchases. For change in HEB and FI, negative values indicate restraint.
a--Actual.
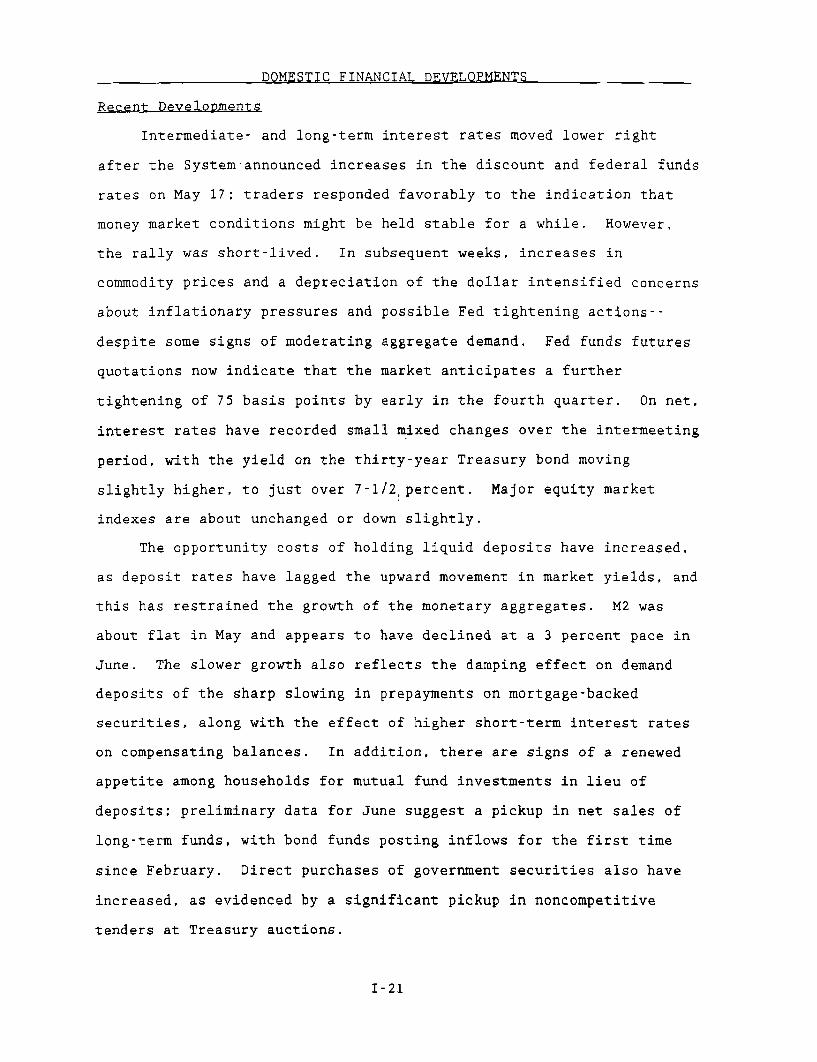
DOMESTIC FINANCIAL DEVELOPMENTS
Recent Developments
Intermediate- and long-term interest rates moved lower right
after the System announced increases in the discount and federal funds
rates on May 17; traders responded favorably to the indication that
money market conditions might be held stable for a while. However,
the rally was short-lived. In subsequent weeks, increases in
commodity prices and a depreciation of the dollar intensified concerns
about inflationary pressures and possible Fed tightening actions--
despite some signs of moderating aggregate demand. Fed funds futures
quotations now indicate that the market anticipates a further
tightening of 75 basis points by early in the fourth quarter. On net,
interest rates have recorded small mixed changes over the intermeeting
period, with the yield on the thirty-year Treasury bond moving
slightly higher, to just over 7-1/2 percent. Major equity market
indexes are about unchanged or down slightly.
The opportunity costs of holding liquid deposits have increased,
as deposit rates have lagged the upward movement in market yields, and
this has restrained the growth of the monetary aggregates. M2 was
about flat in May and appears to have declined at a 3 percent pace in
June. The slower growth also reflects the damping effect on demand
deposits of the sharp slowing in prepayments on mortgage-backed
securities, along with the effect of higher short-term interest rates
on compensating balances. In addition, there are signs of a renewed
appetite among households for mutual fund investments in lieu of
deposits; preliminary data for June suggest a pickup in net sales of
long-term funds, with bond funds posting inflows for the first time
since February. Direct purchases of government securities also have
increased, as evidenced by a significant pickup in noncompetitive
tenders at Treasury auctions.
I-21
I-22
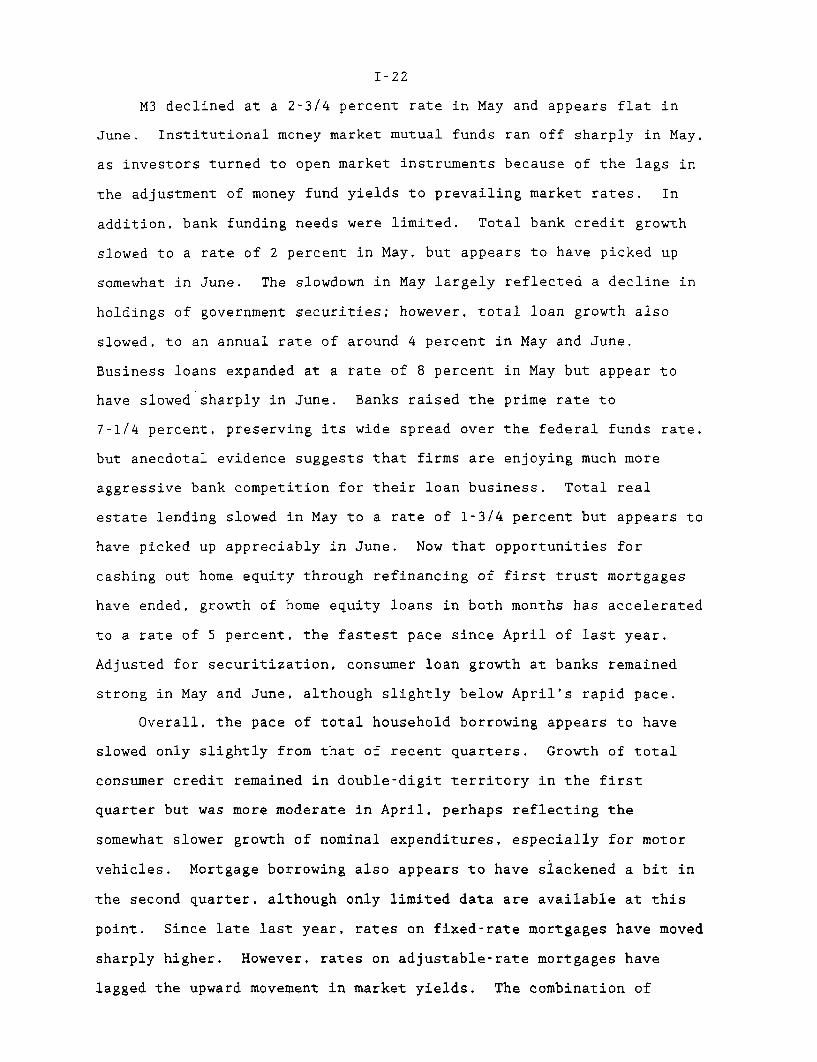
M3 declined at a 2-3/4 percent rate in May and appears flat in
June. Institutional money market mutual funds ran off sharply in May,
as investors turned to open market instruments because of the lags in
the adjustment of money fund yields to prevailing market rates. In
addition, bank funding needs were limited. Total bank credit growth
slowed to a rate of 2 percent in May, but appears to have picked up
somewhat in June. The slowdown in May largely reflected a decline in
holdings of government securities; however, total loan growth also
slowed, to an annual rate of around 4 percent in May and June.
Business loans expanded at a rate of 8 percent in May but appear to
have slowed sharply in June. Banks raised the prime rate to
7-1/4 percent, preserving its wide spread over the federal funds rate,
but anecdotal evidence suggests that firms are enjoying much more
aggressive bank competition for their loan business. Total real
estate lending slowed in May to a rate of 1-3/4 percent but appears to
have picked up appreciably in June. Now that opportunities for
cashing out home equity through refinancing of first trust mortgages
have ended, growth of home equity loans in both months has accelerated
to a rate of 5 percent, the fastest pace since April of last year.
Adjusted for securitization, consumer loan growth at banks remained
strong in May and June, although slightly below April's rapid pace.
Overall, the pace of total household borrowing appears to have
slowed only slightly from that of recent quarters. Growth of total
consumer credit remained in double-digit territory in the first
quarter but was more moderate in April, perhaps reflecting the
somewhat slower growth of nominal expenditures, especially for motor
vehicles. Mortgage borrowing also appears to have slackened a bit in
the second quarter, although only limited data are available at this
point. Since late last year, rates on fixed-rate mortgages have moved
sharply higher. However, rates on adjustable-rate mortgages have
lagged the upward movement in market yields. The combination of
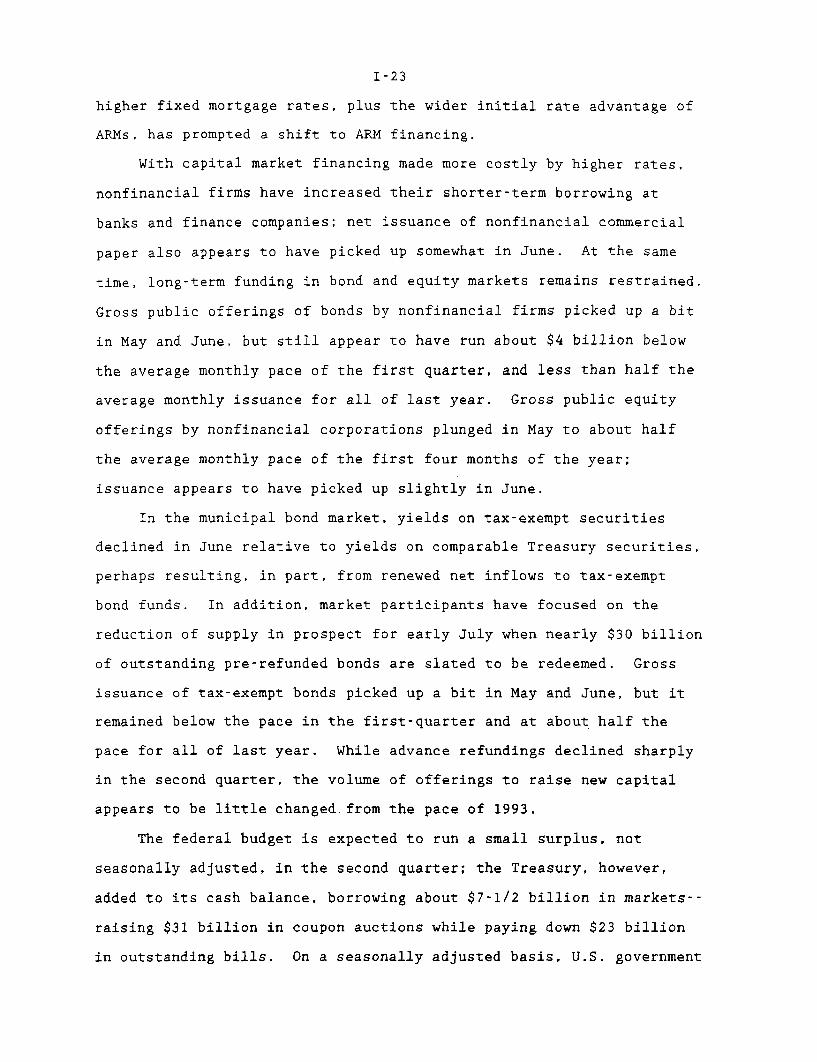
I-23
higher fixed mortgage rates, plus the wider initial rate advantage of
ARMs, has prompted a shift to ARM financing.
With capital market financing made more costly by higher rates,
nonfinancial firms have increased their shorter-term borrowing at
banks and finance companies; net issuance of nonfinancial commercial
paper also appears to have picked up somewhat in June. At the same
time, long-term funding in bond and equity markets remains restrained.
Gross public offerings of bonds by nonfinancial firms picked up a bit
in May and June, but still appear to have run about $4 billion below
the average monthly pace of the first quarter, and less than half the
average monthly issuance for all of last year. Gross public equity
offerings by nonfinancial corporations plunged in May to about half
the average monthly pace of the first four months of the year;
issuance appears to have picked up slightly in June.
In the municipal bond market, yields on tax-exempt securities
declined in June relative to yields on comparable Treasury securities,
perhaps resulting, in part, from renewed net inflows to tax-exempt
bond funds. In addition, market participants have focused on the
reduction of supply in prospect for early July when nearly $30 billion
of outstanding pre-refunded bonds are slated to be redeemed. Gross
issuance of tax-exempt bonds picked up a bit in May and June, but it
remained below the pace in the first-quarter and at about half the
pace for all of last year. While advance refundings declined sharply
in the second quarter, the volume of offerings to raise new capital
appears to be little changed.from the pace of 1993.
The federal budget is expected to run a small surplus, not
seasonally adjusted, in the second quarter; the Treasury, however,
added to its cash balance, borrowing about $7-1/2 billion in markets--
raising $31 billion in coupon auctions while paying down $23 billion
in outstanding bills. On a seasonally adjusted basis, U.S. government
I-24
debt growth slowed to a 4-1/4 percent annual rate in the second
quarter.
Outlook
The backup in long-term bond yields since late last year is
beginning to impose a substantial degree of restraint on aggregate
demand. However, the staff projection anticipates significant further
increases in short-term rates by early 1995, as the System seeks to
hold down inflation. We believe the term structure of interest rates
currently includes both an allowance for a sizable rise in short rates
over the next couple of years, and also an ample "liquidity premium"
that reflects uncertainties about economic and policy prospects as
well as a measure of sheer trepidation in the wake of recent large
trading losses. We project that the yield curve will flatten
considerably over the projection period, as market participants are
persuaded that the Fed's tightening actions will be sufficient to head
off any buildup of inflationary pressures.
In this context, total debt growth of the domestic nonfinancial
sectors is expected to average about 5 percent in both 1994 and 1995.
An increase in borrowing by the nonfederal sectors in 1994 is expected
to be offset by a slowing this year in the demands by the federal
sector, reflecting continued fiscal restraint and cyclical
improvements in the budget. In 1995. debt growth of the nonfederal
sectors should slow somewhat as a result of a small decline in the
rate of household borrowing and a decrease in debt growth in the state
and local government sector, whereas the pace of federal government
borrowing should increase.
Capital expenditures by nonfinancial businesses are expected to
continue moving higher over the projection period, although the rate
of increase is expected to slow from the pace of the first half of
1994. Higher interest costs, coupled with the effects of decelerating
activity on profit margins, will slow the growth of internally
I-25
generated funds and contribute to a widening financing gap in 1994 and
1995. Even so, business debt should grow at a very modest pace
compared with previous expansions. Firms are likely to continue their
higher level of short- and intermediate-term borrowing, including at
banks and finance companies, until bond markets firm, as projected, in
1995. Net equity issuance in both 1994 and 1995 is expected to remain
at less than half last year's pace, with mergers and repurchases
leading to the retirement of a sizable volume of shares.
Total household sector borrowing should ease slightly in the
second half of the year and slow somewhat further in 1995. Household
debt is expected to grow about 6-1/2 percent in 1994 and near
6 percent in 1995. In response to higher mortgage interest rates,
construction and sales of homes, while continuing at a healthy rate,
are projected to fall off a bit over the next few quarters. Aggregate
mortgage borrowing, however, may be buoyed to a degree by renewed
growth of home equity loans. Total consumer credit growth is expected
to moderate, a change consistent with a somewhat slower rate of growth
of nominal expenditures on durable goods but also reflecting higher
levels of repayments on the debt assumed in recent quarters. With
household debt growing a bit faster than nominal income, but with
average interest rates on the total stock of debt probably declining
slightly as higher cost debt is paid off, scheduled household debt
service payments are projected to rise only a little relative to
disposable income through 1995.
The growth of state and local government debt is expected to slow
to just under 5 percent in 1994 and to continue declining to about
4 percent in 1995. The slower growth of debt reflects narrowing
budget deficits at the state and local levels and continued paydowns
of pre-refunded obligations.
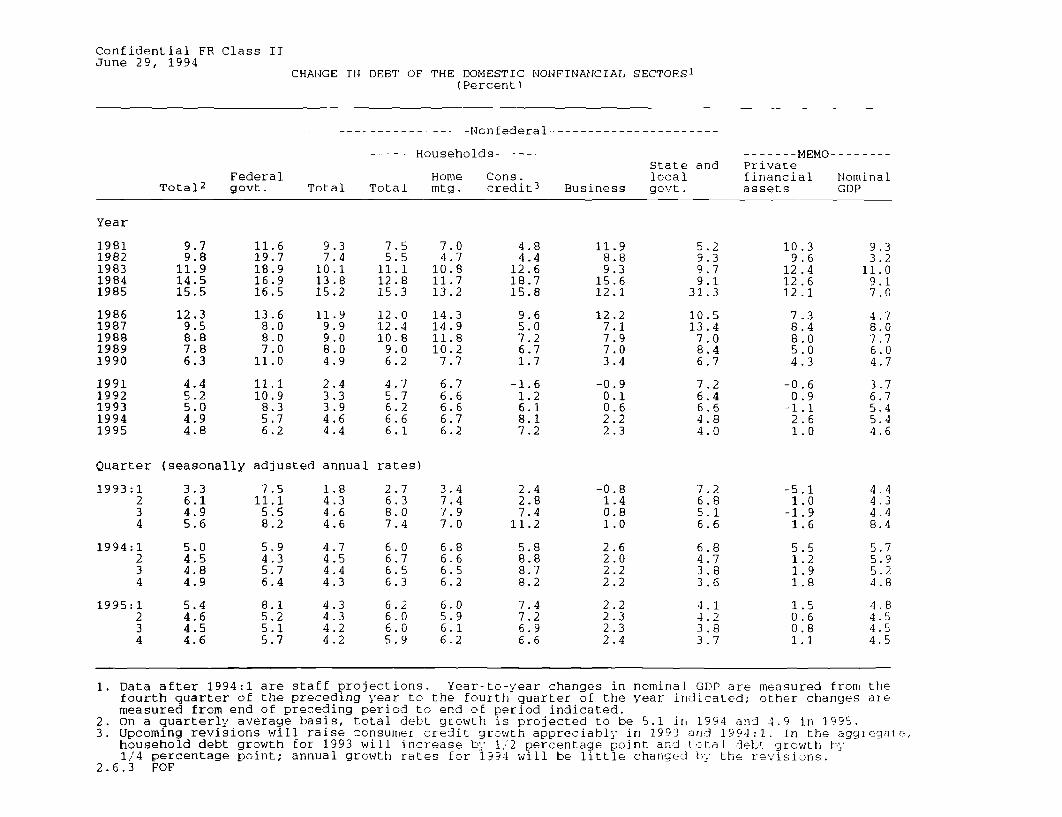
Confidential FR Class IIJune 29, 1994
CHANGE IN DEBT OF THE DOMESTIC NONFINANCIAL SECTORS 1
(Percent)
----- ------- Nonfederal-
------ Households------
FederalTotal 2 govt.
Home Cons.Total Total mtg. credit 3
9.37.4
10.113.815.2
11.99.99.08.04.9
2.43.33.94.64.4
7.55.5
11.112.815.3
12.012.410.8
9.06.2
4.75.76.26.66.1
7.04.7
10.811.713.2
14.314.911.810.2
7.7
6.76.66.66.76.2
4.84.4
12.618.715.8
9.65.07.26.71.7
-1.61.26.18.17.2
State andlocal
Business govt.
11.98.89.3
15.612.1
12.27.17.97.03.4
-0.90.10.62.22.3
5.29.39.79.1
31.3
10.513.4
7.08.46.7
7.26.46.64.84.0
------- MEMO--------Privatefinancial Nominalassets GDP
10.39.6
12 .412.612.1
7.38.48.05.04.3
-0.60.9
-1.12.61.0
9.33.2
11.09.17.0
4.78.07.76.04.7
3.76.75.45.44.6
Quarter (seasonally adjusted annual rates)
7.511.1
5.58.2
5.94.35.76.4
8.15.25.15.7
2.7 3.46.3 7.48.0 7.97.4 7.0
6.0 6.86.7 6.66.5 6.56.3 6.2
6.2 6.06.0 5.96.0 6.15.9 6.2
2.42.87.4
11.2
5.88.88.78.2
7.47.26.96.6
-0.81.40.81.0
2.62.02.22.2
2.22.32.32.4
-5.11.0
-1.91.6
5.51.21.91.8
1.50.60.81.1
1. Data after 1994:1 are staff projections. Year-to-year changes in nominal GDP are measured from thefourth quarter of the preceding year to the fourth quarter of the year indicated; other changes aremeasured from end of preceding period to end of period indicated.
2. On a quarterly average basis, total debt growth is projected to be 5.1 in 1994 and 4.9 in 1995.3. Upcoming revisions will raise consumer credit growth appreciably in 1993 and 1994:1. In the aggregate,
household debt growth for 1993 will increase by 1/2 percentage point and total debt growth by1/4 percentage point; annual growth rates for 1994 will be little changed by the revisions.
2.6.3 FOF
Year
19811982198319841985
19861987198819891990
19911992199319941995
9.79.8
11.914.515.5
12.39.58.87.86.3
4.45.25.04.94.8
11.619.718.916.916.5
13.68.08.07.0
11.0
11.110.9
8.35.76.2
1993:1234
1994:1234
1995:1234
Confidential FR Class IIJune 29, 1994
FLOW OF FUNDS PROJECTIONS: HIGHLIGHTS1
(Billions of dollars)
Calendar year1993
1993 1994 1995 Q4--------- 1994-----------Ql Q2 Q3 Q4
--------- 1995-----------Q1 Q2 Q3 Q4
Net funds raised by domesticnonfinancial sectors1 Total
2 Net equity issuance3 Net debt issuance
Borrowing sectorsNonfinancial business
4 Financing gap 2
5 Net equity issuance6 Credit market borrowing
Households7 Net borrowing, of which:8 Home mortgages9 Consumer credit
10 Debt/DPI (percent)3
State and local governments11 Net borrowing12 Current surplus 4
U.S.government13 Net borrowing14 Net borrowing;quarterly, nsa15 Unified deficit;quarterly, nsa
Funds supplied by16 depository institutions
----------- Seasonally Adjusted Annual Rates-
615.222.9
592.3
18.222.923.0
247.8181.449.087.2
612.310.3
602.1
61.910.383.7
277.5196.569.688.0
635.78.0
627.7
95.08.0
89.0
276.7194.4
67.088.6
712.729.5
683.2
9.929.538.3
306.5200.993.387.9
622.02.0
620.0
16.92.0
96.7
255.2200.8
49.588.4
572.512.0
560.5
77.112.074.5
289.3198.0
77.088.5
619.617.0
602.6
76.117.081.0
285.7196.077.088.7
635.210.0
625.2
77.510.082.5
279.8191.0
75.088.9
703.68.0
695.6
85.58.0
85.4
278.5187.1
69.088.8
605.38.0
597.3
93.08.0
87.4
274.8189.1
68.089.4
602.78.0
594.7
98.08.0
88.5
277.2197.166.089.4
631.38.0
623.3
103.48.0
94.6
276.1204.2
65.089.4
65.4 51.1 44.2 68.8 72.2 50.6 41.8 39.8 45.0 47.0 42.5 42.5-57.4 -51.3 -47.4 -58.0 -51.9 -51.8 -51.7 -49.9 -48.3 -49.6 -46.0 -45.6
256.1256.1226.3
189.8189.8190.1
217.8217.8207.6
269.689.292.1
195.951.258.6
146.19.8
-3.1
194.150.857.4
223.178.077.2
286.673.895.1
188.119.1
-28.3
186.549.854.6
210.275.186.2
129.9 180.3 164.1 176.2 179.7 187.6 169.0 184.9 174.7 163.2 159.8 158.6
(percent of GDP)Dom. nonfinancial debt 3
Dom. nonfinancial borrowingU.S. government 5
Private
Data after 1994:1 are staff projections.For corporations: Excess of capital expenditures over U.S. internal funds.Annuals are average debt levels in the year (computed as the average of year-end debt positions)NIPA surplus, net of retirement funds.Excludes government-insured mortgage pool securities.
divided by nominal GDP
2.6.4 FOF
MEMO:17181920
188.99.34.05.3
187.38.92.86.1
187.48.93.15.8
189.210.5
4.16.3
188.99.43.06.4
188.38.32.26.2
188.28.92.96.0
188.29.13.25.8
188.610.04.15.9
188.68.52.75.8
188.68.42.65.7
188.78.72.95.7
INTERNATIONAL DEVELOPMENTS
Recent Developments
Since the May 17 FOMC meeting, the weighted-average foreign
exchange value of the dollar in terms of the other G-10 currencies
has declined 4 percent on balance. Over the intermeeting period,
the dollar's weighted-average value showed little net change until
mid-June but has declined sharply since then. Downward pressure on
the dollar appears to be largely a response to evidence of an
improved economic outlook in Continental Europe and Japan, with an
associated adjustment in expectations about policy-related interest
rates and actual long-term rates. In addition, there have been
heightened concerns about possible future increases in U.S.
inflation, sparked by tightening U.S. labor market conditions.
Over the intermeeting period, the dollar declined 5-1/4 percent
against the yen, on balance. Early in the period, favorable
developments in U.S.-Japanese trade negotiations provided some
support for the dollar, but by early June, negotiations again seemed
to be stalled. Political instability in Japan also contributed to
the dollar's weakness against the yen as the Japanese government
appeared unable to take measures to counter the yen's rise. Against
the mark, the dollar has also declined about 5 percent since the May
FOMC. The mark's strength appears largely to reflect the
perception that the Bundesbank is unlikely to make further
reductions in official interest rates.
Long-term interest rates in all major foreign industrial
countries have continued to move higher since the May FOMC meeting,
as economic indicators have supported the view that recovery abroad
is taking hold. Long-term (ten-year) rates have risen about 40
basis points in Japan and Germany, and about 125 basis points in
I-28
I-29
Italy, where a recent court ruling threatens to increase the
government budget deficit even more. By comparison, ten-year rates
in the United States have risen only 25 basis points. Foreign
short-term interest rates have changed little over the period,
except in Italy and Canada. Italian rates have risen 75 basis
points as the lira has weakened relative to the other EMS
currencies. The Bank of Canada's actions have raised the three-
month rate 30 basis points, on balance, in response to the
depreciation of about 1/2 percent in the Canadian dollar in terms of
the U.S. dollar; market concerns about the upcoming Quebec election
and about large government deficits have fueled the downward
pressure on the Canadian dollar.
On June 24, when the dollar began to fall further against the
mark, the Desk joined numerous other central banks in concerted
intervention . In his public statement,
Secretary Bentsen described the concerted intervention as reflecting
a "shared concern about recent developments in financial markets."
The dollar did not respond positively to the intervention operation,
actually declining a bit further against the mark over the course of
the day. On balance, the dollar has fallen slightly more since the
intervention.
The Desk
purchased $1,560 million, $610 million against yen and $950 million
against marks, all on June 24, split evenly between the System and
the Treasury.
During the first quarter, economic activity expanded in all the
major foreign industrial countries, in many cases at an unexpectedly
strong rate; indicators suggest that growth is continuing in the
I-30
second quarter, although at a slower pace in some countries. In
Japan, industrial production fell in April and May but has remained
above its first-quarter average rate. The Bank of Japan's May
survey of business sentiment registered its first increase since
1989. In western Germany, industrial production and manufacturing
orders rose in April whereas retail sales slumped. In the United
Kingdom, activity appears to be holding up. Industrial production
surged in April. Retail sales through May slowed less than
expected, despite the large tax increases, including a broadening of
the VAT, that took effect at the beginning of April. In Canada,
where first-quarter GDP growth was particularly vigorous, retail
sales edged off in April. Employment grew further, on balance, in
April and May, and the unemployment rate improved slightly in May.
Although the pace of activity is strengthening in the major
foreign industrial countries, considerable slack remains. As a
result, inflation rates continue to be low and, in most cases, have
fallen from rates earlier in the year.
In April, the U.S. nominal trade deficit for goods and services
was $8.4 billion, seasonally adjusted, larger than it was in March
but about equal to the first-quarter average. For the first four
months of 1994, the deficit was $98 billion at an annual rate,
significantly larger than it had been in the fourth quarter of last
year. Exports of goods and services in April were 3 percent less
than they had been in March, when they had surged. Imports of goods
and services were about the same in April as in March. So far this
year, capital goods and non-oil industrial supplies have been the
most rapidly growing categories of imports. In the first quarter,
the U.S. current account deficit widened $5 billion (SAAR), to $128
billion.
I-31
In May, prices of U.S. non-oil imports rose slightly for the
third consecutive month; for April-May combined, prices increased at
a 2.2 percent annual rate. Prices of nonagricultural exports also
increased slightly in May; and for April-May combined, prices also
rose 2.2 percent at an annual rate, the same as in the first
quarter. Prices of imported oil rose almost $1 per barrel in April
and rose further in May, consistent with the pickup in spot and
futures prices that began in late March. Currently, the spot price
for West Texas Intermediate (WTI) is $19.15 per barrel, about $1.25
higher than at the time of the May Greenbook. The increase in oil
prices appears to have resulted from stronger economic activity
abroad, some production disruptions in the North Sea and Yemen, and
relatively flat OPEC production.
Outlook
The staff projects that the growth rate of real GDP in foreign
industrial and developing countries will rise to 3-1/4 percent
during the second half of this year and then to 3-1/2 percent next
year, well above the projected rate of U.S. growth. We project that
the dollar will remain about unchanged from recent levels. As a
consequence, and against the background of the greater
responsiveness of U.S. imports to domestic income expansion than is
the case for the responsiveness of U.S. exports to foreign income,
we expect real exports of goods and services to grow only slightly
faster than real imports over the forecast period. With imports
currently substantially exceeding exports, the projected growth
rates imply that real net exports of goods and services will decline
somewhat further, subtracting less than 1/4 percentage point from
the annual rate of growth of real GDP during the second half of this
year and in 1995.
I-32
The dollar. We project that the foreign exchange value of the
dollar in terms of the other G-10 currencies will remain near its
current level throughout the forecast period. This level is down
about 3 percent from that in the May Greenbook. We assume that
foreign long-term interest rates will decline roughly the same
amount as U.S. long-term interest rates, as some of the uncertainty
in financial markets dissipates. We recognize that there is some
upside risk to our outlook for the dollar if recent increases in
foreign long-term interest rates unwind to a greater extent.
However, in light of recent exchange market trends, a significant
downside risk exits as well. Against the currencies of key
developing countries, we expect the CPI-adjusted value of the dollar
to show a further moderate depreciation on average through the end
of the forecast period.
Foreign industrial countries. Real GDP growth in the G-6
countries (weighted by U.S. exports) is projected to strengthen over
the forecast period and to average about 3 percent during the next
six quarters. For 1994, the growth outlook for Japan, Germany,
France, and Canada has been raised since the May Greenbook.
Real GDP growth in Japan is expected to slow somewhat in the
near term from the very rapid first-quarter pace and then to rise
over the forecast period to 2-3/4 percent next year. German output
growth, stimulated by rising exports, is projected to rise a bit
from the recent rate during the second half of this year and to
average about 2-1/2 percent, annual rate, during the remaining six
quarters of the forecast period. In the United Kingdom, with
investment growth remaining strong, output is expected to expand at
nearly 2-3/4 percent in 1994 and to increase slightly faster in
1995. Output growth in Canada is projected to slow a bit from the
I-33
recent high rate of over 4 percent, but still to average more than
3-1/2 percent, annual rate, through the end of 1995.
Consumer price inflation in the G-6 countries is projected to
to remain quite low over the forecast period.1 Canadian inflation
has been revised down since the May Greenbook and is projected to be
near zero during 1994. Average inflation for the G-6 countries is
forecast to be about 1 percent (weighted by U.S. imports) in 1994
and to rise slightly to 1-1/2 percent in 1995.
Through the middle of next year, the forecast incorporates the
assumption of essentially no change on average in short-term
interest rates in the foreign industrial countries; short-term rates
are expected to move up slightly at the end of the forecast period
in response to the higher projected pace of economic activity abroad
by then. Some additional small declines assumed in the near term
for the Continental European economies are offset by small increases
expected in Japan and the United Kingdom. The assumed path for
foreign short-term rates is little changed from that in the May
Greenbook except for rates near the end of the forecast period,
which are now assumed to be somewhat higher than had been the case
because of the higher projected pace of foreign economic activity.
The path for foreign long-term rates has been moved up in
response to recent increases in rates, but on average, long-term
rates are still expected to decline moderately over the forecast
period.
Developing countries. Real GDP in the developing countries
that are major U.S. trading partners is forecast (using bilateral
nonagricultural-export weights) to grow around 4-1/2 percent in 1994
and to increase to 4-3/4 percent in 1995.
1. G-6 consumer price inflation continues to be forecast using westGerman prices.
I-34
Since the last Greenbook, the forecast for developing country
GDP growth has been revised upward in 1994 by almost 1/2 percentage
point. The growth forecasts for 1994 for Korea and Singapore have
been increased about 1-1/4 and 1 percentage point, respectively.
These changes reflect stronger-than-anticipated growth during the
first quarter of 1994 for these countries and an upward revision to
our forecast of their external demand associated with a stronger
forecast of industrial country growth. The forecast for growth in
Brazil has also been raised 2 percentage points in 1994 and 1
percentage point in 1995. These revisions reflect stronger-than-
anticipated first-quarter growth and the implementation of a
currency reform plan that is expected to induce a temporary spurt in
growth in 1994-95.
U.S. real net exports. Real net exports of goods and services
are expected to decline, but at a slower pace than has been the
case, under the influence of stronger foreign growth, a lower
dollar, and slower growth of U.S. real GDP. Real net exports are
projected to weaken about $8 billion over the final three quarters
of this year but only $6 billion over the four quarters of next
year.
The quantity of merchandise exports is projected to strengthen
at the end of 1994 and into 1995 in response to the faster pace of
activity abroad and the lower dollar. Exports of computers are
expected to have risen a bit less strongly this quarter, but to
return to rapid growth in the second half of this year and in 1995.
Other nonagricultural exports are projected to have rebounded in
this quarter from the first-quarter drop and then to grow at an
average rate of almost 4-1/2 percent over the remaining six quarters
of the forecast period. Agricultural exports are projected to fall
I-35
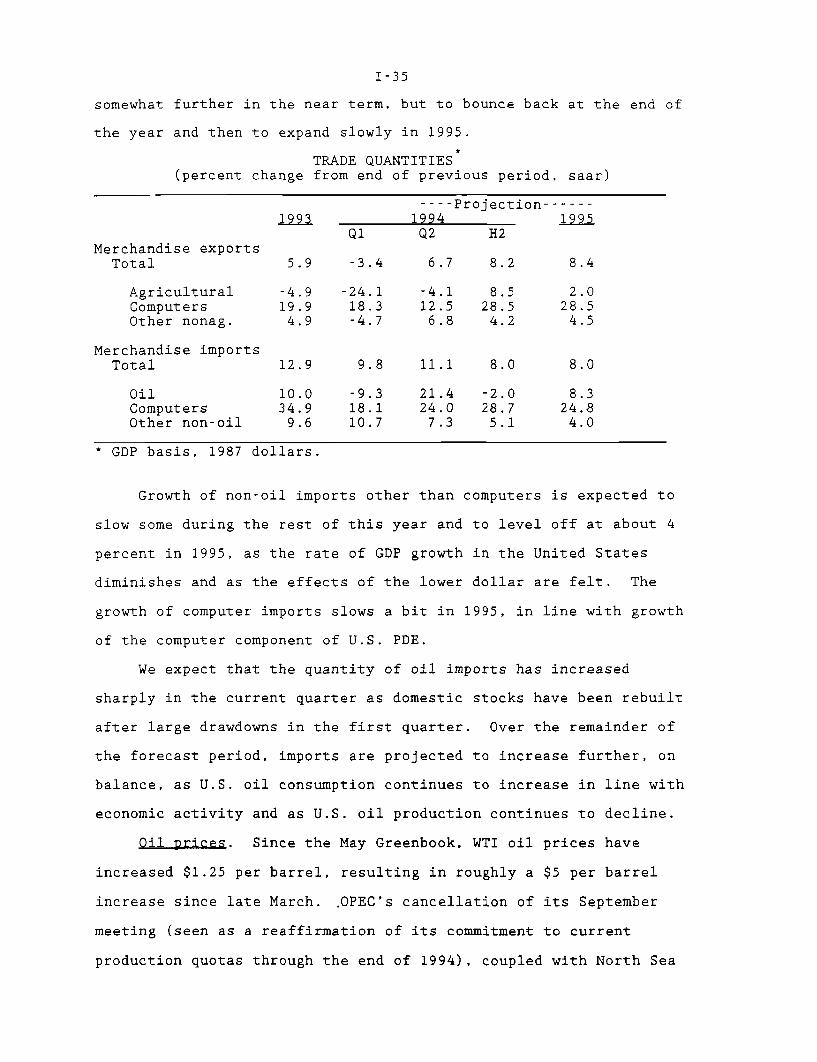
somewhat further in the near term, but to bounce back at the end of
the year and then to expand slowly in 1995.
TRADE QUANTITIES(percent change from end of previous period, saar)
----Projection------1993 1994 1995
Q1 Q2 H2Merchandise exports
Total 5.9 -3.4 6.7 8.2 8.4
Agricultural -4.9 -24.1 -4.1 8.5 2.0Computers 19.9 18.3 12.5 28.5 28.5Other nonag. 4.9 -4.7 6.8 4.2 4.5
Merchandise importsTotal 12.9
Oil 10.0Computers 34.9Other non-oil 9.6
* GDP basis, 1987 dollars.
9.8
-9.318.110.7
11.1
21.424.07.3
8.0
-2.028.75.1
8.0
8.324.84.0
Growth of non-oil imports other than computers is expected to
slow some during the rest of this year and to level off at about 4
percent in 1995, as the rate of GDP growth in the United States
diminishes and as the effects of the lower dollar are felt. The
growth of computer imports slows a bit in 1995, in line with growth
of the computer component of U.S. PDE.
We expect that the quantity of oil imports has increased
sharply in the current quarter as domestic stocks have been rebuilt
after large drawdowns in the first quarter. Over the remainder of
the forecast period, imports are projected to increase further, on
balance, as U.S. oil consumption continues to increase in line with
economic activity and as U.S. oil production continues to decline.
Oil prices. Since the May Greenbook, WTI oil prices have
increased $1.25 per barrel, resulting in roughly a $5 per barrel
increase since late March. OPEC's cancellation of its September
meeting (seen as a reaffirmation of its commitment to current
production quotas through the end of 1994), coupled with North Sea
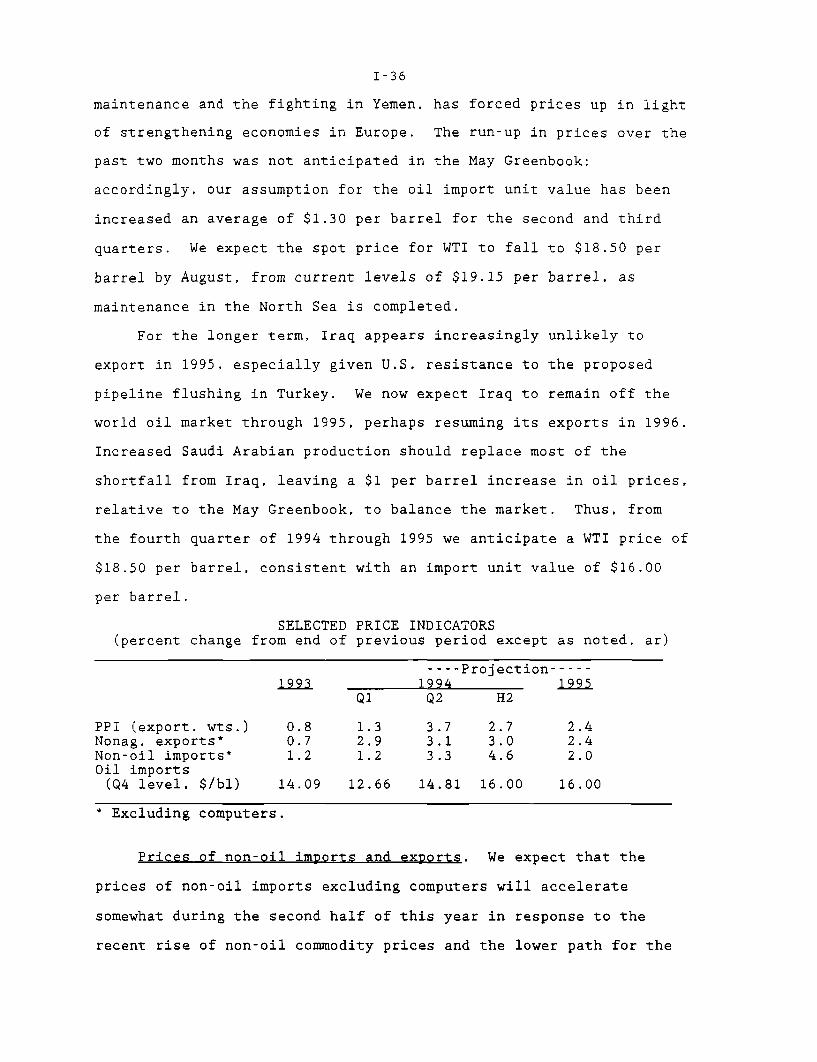
I-36
maintenance and the fighting in Yemen, has forced prices up in light
of strengthening economies in Europe. The run-up in prices over the
past two months was not anticipated in the May Greenbook;
accordingly, our assumption for the oil import unit value has been
increased an average of $1.30 per barrel for the second and third
quarters. We expect the spot price for WTI to fall to $18.50 per
barrel by August, from current levels of $19.15 per barrel, as
maintenance in the North Sea is completed.
For the longer term, Iraq appears increasingly unlikely to
export in 1995, especially given U.S. resistance to the proposed
pipeline flushing in Turkey. We now expect Iraq to remain off the
world oil market through 1995, perhaps resuming its exports in 1996.
Increased Saudi Arabian production should replace most of the
shortfall from Iraq, leaving a $1 per barrel increase in oil prices,
relative to the May Greenbook, to balance the market. Thus, from
the fourth quarter of 1994 through 1995 we anticipate a WTI price of
$18.50 per barrel, consistent with an import unit value of $16.00
per barrel.
SELECTED PRICE INDICATORS(percent change from end of previous period except as noted, ar)
---- Projection-----
1993 1994 1995Q1 Q2 H2
PPI (export. wts.) 0.8 1.3 3.7 2.7 2.4Nonag. exports* 0.7 2.9 3.1 3.0 2.4Non-oil imports* 1.2 1.2 3.3 4.6 2.0Oil imports(Q4 level. $/bl) 14.09 12.66 14.81 16.00 16.00
* Excluding computers.
Prices of non-oil imports and exports. We expect that the
prices of non-oil imports excluding computers will accelerate
somewhat during the second half of this year in response to the
recent rise of non-oil commodity prices and the lower path for the
I-37
dollar. Next year, the rise in these prices will fall back to about
2 percent. Prices of U.S. nonagricultural exports are expected to
move with U.S. producer prices, increasing about 2-1/2 percent on
average over the forecast period.
Nominal trade and current account balances. The merchandise
trade deficit is projected to increase from $164 billion (AR) in the
current quarter to $178 billion by the end of 1994 and to edge up
further in 1995. Net service receipts will continue to expand, from
an annual rate of about $55 billion this quarter to almost $70
billion by the end of 1995. Investment income payments are expected
to exceed investment income receipts by an increasing margin over
the forecast period, with the deficit on net investment income
reaching $15 billion by the end of 1995, reflecting higher interest
rates and rising net indebtedness. As a result of these
developments, we expect that the current account deficit will rise
to about $170 billion by the end of 1995, 2.4 percent of GDP.
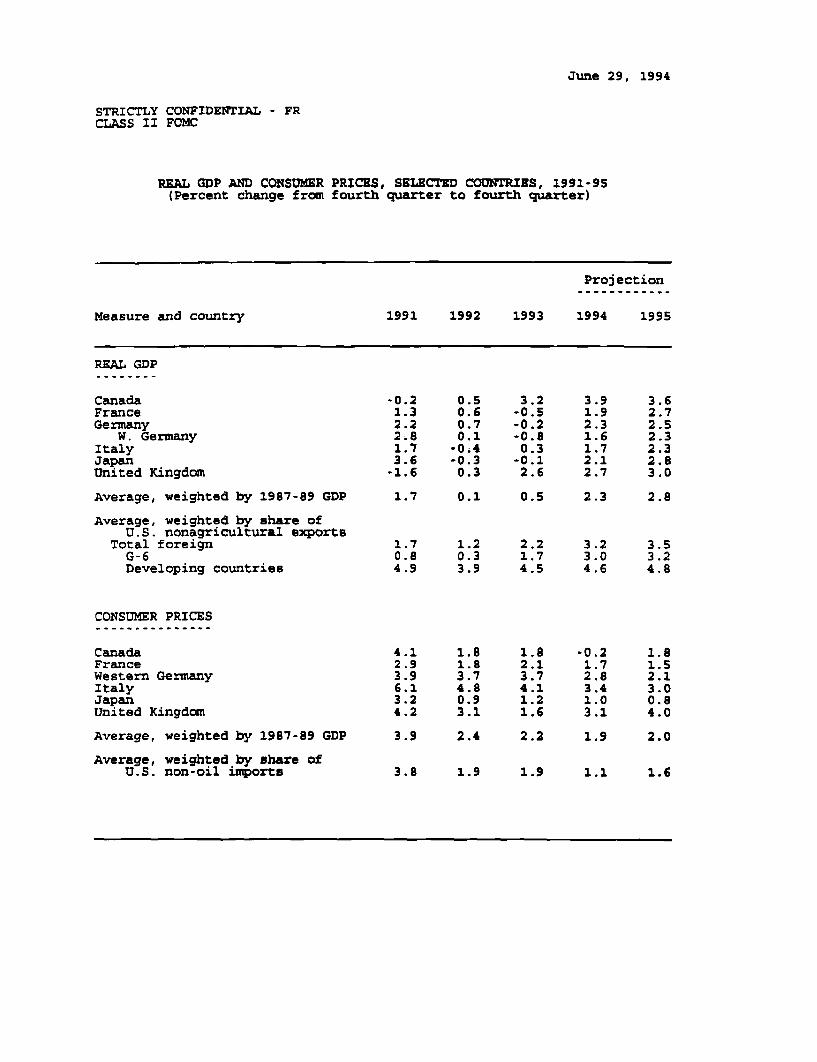
June 29, 1994
STRICTLY CONFIDENTIAL - FRCLASS II FOMC
REAL GDP AND CONSUMER PRICES, SELECTED COUNTRIES, 1991-95(Percent change from fourth quarter to fourth quarter)
Projection------------
Measure and country 1991 1992 1993 1994 1995
REAL GDP
Canada -0.2 0.5 3.2 3.9 3.6France 1.3 0.6 -0.5 1.9 2.7Germany 2.2 0.7 -0.2 2.3 2.5
W. Germany 2.8 0.1 -0.8 1.6 2.3Italy 1.7 -0.4 0.3 1.7 2.3Japan 3.6 -0.3 -0.1 2.1 2.8United Kingdom -1.6 0.3 2.6 2.7 3.0
Average, weighted by 1987-89 GDP 1.7 0.1 0.5 2.3 2.8
Average, weighted by share ofU.S. nonagricultural exports
Total foreign 1.7 1.2 2.2 3.2 3.5G-6 0.8 0.3 1.7 3.0 3.2Developing countries 4.9 3.9 4.5 4.6 4.8
CONSUMER PRICES
Canada 4.1 1.8 1.8 -0.2 1.8France 2.9 1.8 2.1 1.7 1.5Western Germany 3.9 3.7 3.7 2.8 2.1Italy 6.1 4.8 4.1 3.4 3.0Japan 3.2 0.9 1.2 1.0 0.8United Kingdom 4.2 3.1 1.6 3.1 4.0
Average, weighted by 1987-89 GDP 3.9 2.4 2.2 1.9 2.0
Average, weighted by share ofU.S. non-oil imports 3.8 1.9 1.9 1.1 1.6
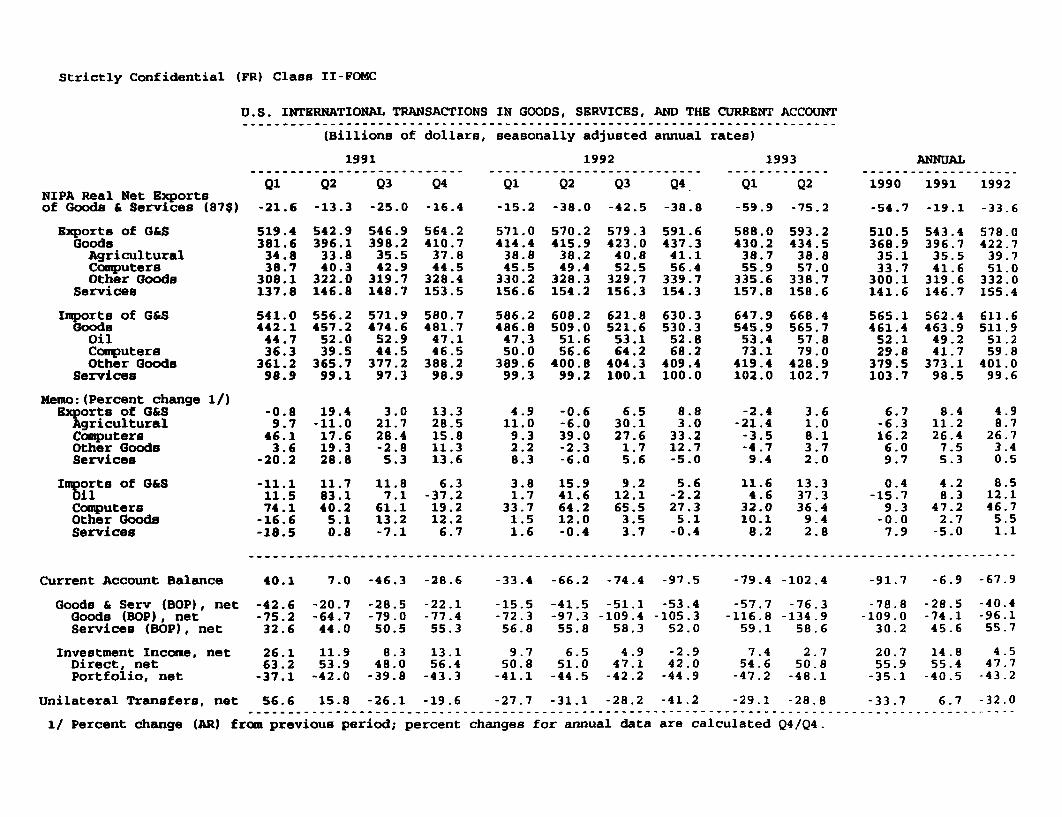
Strictly Confidential (FR) Class II-FOMC
U.S. INTERNATIONAL TRANSACTIONS IN GOODS, SERVICES, AND THE CURRENT ACCOUNT
(Billions of dollars, seasonally adjusted annual rates)
NIPA Real Net Exportsof Goods & Services (87$)
Exports of G&SGoodsAgriculturalComputersOther Goods
Services
Imports of G&SGoods
OilComputersOther Goods
Services
Memo:(Percent change 1/)Exports of G&SAgriculturalComputersOther GoodsServices
Imports of G&SOilComputersOther GoodsServices
Current Account Balance
Goods & Serv (BOP), netGoods (BOP), netServices (BOP), net
Investment Income, netDirect, netPortfolio, net
Unilateral Transfers, net
1991
Q1 Q2 Q3 Q4Q1 Q2 Q3 Q4
-21.6
519.4381.634.838.7
308.1137.8
541.0442.1
44.736.3
361.298.9
-0.89.7
46.13.6
-20.2
-11.111.574.1
-16.6-18.5
40.1
-42.6-75.232.6
26.163.2
-37.1
56.6
-13.3
542.9396.1
33.840.3
322.0146.8
556.2457.2
52.039.5
365.799.1
19.4-11.017.619.328.8
11.783.140.2
5.10.8
7.0
-20.7-64.744.0
11.953.9
-42.0
-25.0
546.9398.235.542.9
319.7148.7
571.9474.6
52.944.5
377.297.3
3.021.728.4-2.8
5.3
11.87.1
61.113.2-7.1
-46.3
-28.5-79.050.5
8.348.0
-39.8
-16.4
564.2410.737.844.5
328.4153.5
580.7481.7
47.146.5
388.298.9
13.328.515.811.313.6
6.3-37.2
19.212.26.7
-28.6
-22.1-77.455.3
13.156.4
-43.3
1992
Q1 Q2 Q3 Q4Q1 Q2 Q3 Q4
-15.2
571.0414.438.845.5
330.2156.6
586.2486.8
47.350.0
389.699.3
4.911.0
9.32.28.3
3.81.7
33.71.51.6
-33.4
-15.5-72.356.8
9.750.8
-41.1
-38.0
570.2415.9
38.249.4
328.3154.2
608.2509.0
51.656.6
400.899.2
-0.6-6.039.0-2.3-6.0
15.941.664.212.0-0.4
-66.2
-41.5-97.355.8
6.551.0
-44.5
-42.5
579.3423.040.852.5
329.7156.3
621.8521.653.164.2
404.3100.1
6.530.127.61.75.6
9.212.165.53.53.7
-38.8
591.6437.3
41.156.4
339.7154.3
630.3530.3
52.868.2
409.4100.0
8.83.0
33.212.7-5.0
5.6-2.227.35.1
-0.4
-74.4 -97.5
-51.1 -53.4-109.4 -105.358.3 52.0
4.9 -2.947.1 42.0-42.2 -44.9
15.8 -26.1 -19.6 -27.7 -31.1 -28.2 -41.2
1993 ANNUAL- - - - - - - - - - - - -. - . - - - - - - - - - - - - - - - - - -
Q1 Q2
-59.9 -75.2
588.0 593.2430.2 434.538.7 38.855.9 57.0
335.6 338.7157.8 158.6
647.9 668.4545.9 565.753.4 57.873.1 79.0
419.4 428.9102.0 102.7
-2.4 3.6-21.4 1.0-3.5 8.1-4.7 3.79.4 2.0
11.6 13.34.6 37.3
32.0 36.410.1 9.48.2 2.8
-79.4 -102.4
-57.7 -76.3-116.8 -134.959.1 58.6
7.4 2.754.6 50.8-47.2 -48.1
-29.1 -28.8
1990 1991 1992
-54.7
510.5368.9
35.133.7
300.1141.6
565.1461.4
52.129.8
379.5103.7
6.7-6.316.26.09.7
0.4-15.7
9.3-0.07.9
-91.7
-78.8-109.0
30.2
20.755.9
-35.1
-19.1
543.4396.7
35.541.6
319.6146.7
562.4463.949.241.7
373.198.5
8.411.226.47.55.3
4.28.3
47.22.7-5.0
-6.9
-28.5-74.145.6
14.855.4-40.5
-33.6
578.0422.7
39.751.0
332.0155.4
611.6511.951.259.8
401.099.6
4.98.7
26.73.40.5
8.512.146.75.51.1
-67.9
-40.4-96.155.7
4.547.7-43.2
-33.7 6.7 -32.0
1/ Percent change (AR) from previous period; percent changes for annual data are calculated Q4/Q4.
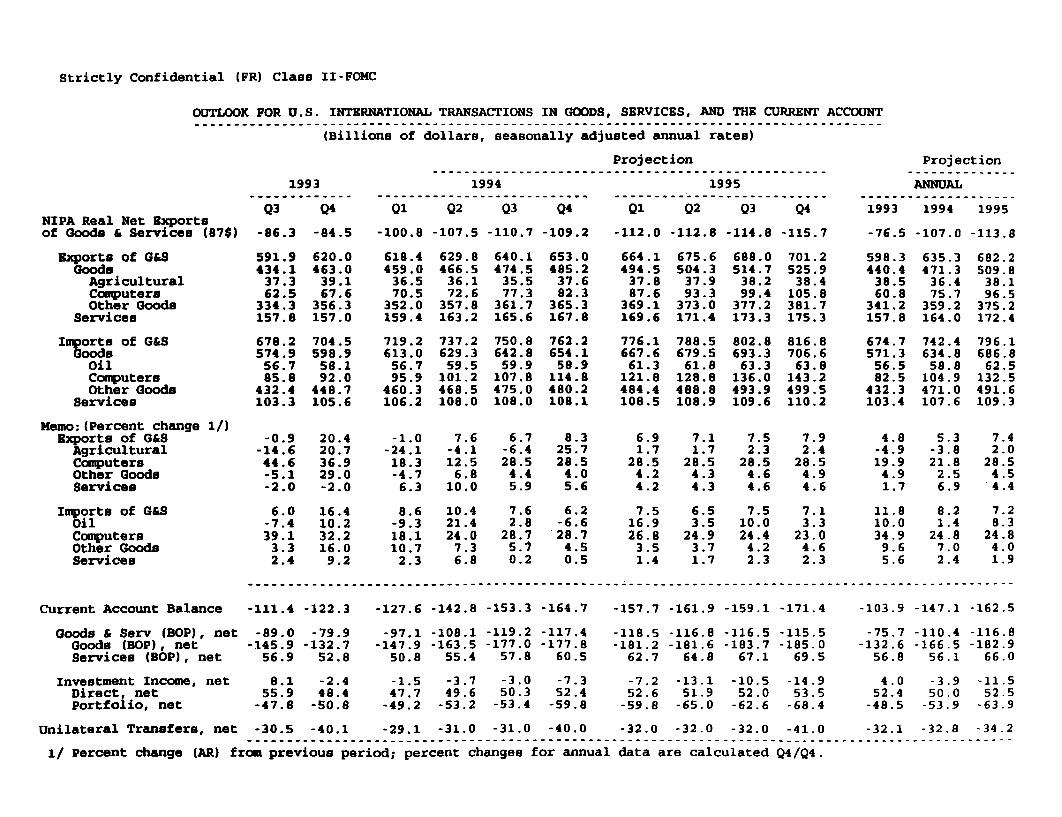
Strictly Confidential (FR) Class II-FOMC
OUTLOOK FOR U.S. INTERNATIONAL TRANSACTIONS IN GOODS, SERVICES, AND THE CURRENT ACCOUNT
(Billions of dollars, seasonally adjusted annual rates)(Billions of dollars, seasonally adjusted annual rates)
Projection
NIPA Real Net Exportsof Goods & Services (87$)
Exports of G&SGoodsAgriculturalComputersOther Goods
Services
Imports of G&SGoods
OilComputersOther Goods
Services
Memo:(Percent change 1/)Exports of G&S
AgriculturalComputersOther GoodsServices
Imports of G&SOilComputersOther GoodsServices
Current Account Balance
Goods & Serv (BOP), netGoods (BOP), netServices (BOP), net
Investment Income, netDirect, netPortfolio, net
1993
Q3 Q4
-86.3 -84.5
591.9434.1
37.362.5
334.3157.8
678.2574.9
56.785.8
432.4103.3
-0.9-14.644.6-5.1-2.0
6.0-7.439.1
3.32.4
620.0463.0
39.167.6
356.3157.0
704.5598.9
58.192.0
448.7105.6
20.420.736.929.0-2.0
16.410.232.216.0
9.2
-111.4 -122.3
-89.0-145.9
56.9
8.155.9
-47.8
-79.9-132.7
52.8
-2.448.4
-50.8
1994
Q1 Q2 Q3 Q4
-100.8 -107.5 -110.7 -109.2
618.4459.0
36.570.5
352.0159.4
719.2613.056.795.9
460.3106.2
-1.0-24.118.3-4.7
6.3
8.6-9.318.110.72.3
629.8466.536.172.6
357.8163.2
737.2629.359.5
101.2468.5108.0
7.6-4.112.5
6.810.0
10.421.424.07.36.8
640.1474.5
35.577.3
361.7165.6
750.8642.859.9
107.8475.0108.0
6.7-6.428.5
4.45.9
7.62.8
28.75.70.2
653.0485.2
37.682.3
365.3167.8
762.2654.1
58.9114.8480.2108.1
8.325.728.54.05.6
6.2-6.628.74.50.5
-127.6 -142.8 -153.3 -164.7
-97.1-147.9
50.8
-1.547.7
-49.2
-108.1-163.5
55.4
-3.749.6
-53.2
-119.2-177.0
57.8
-3.050.3-53.4
-117.4-177.8
60.5
-7.352.4-59.8
1995
Q1 Q2 Q3 Q4
-112.0 -112.8 -114.8 -115.7
664.1494.5
37.887.6
369.1169.6
776.1667.6
61.3121.8484.4108.5
6.91.7
28.54.24.2
7.516.926.8
3.51.4
675.6504.337.993.3
373.0171.4
788.5679.561.8
128.8488.8108.9
7.11.7
28.54.34.3
6.53.5
24.93.71.7
688.0514.7
38.299.4
377.2173.3
802.8693.363.3
136.0493.9109.6
7.52.3
28.54.64.6
7.510.024.4
4.22.3
701.2525.9
38.4105.8381.7175.3
816.8706.663.8
143.2499.5110.2
7.92.4
28.54.94.6
7.13.3
23.04.62.3
-157.7 -161.9 -159.1 -171.4
-118.5-181.262.7
-7.252.6
-59.8
-116.8-181.6
64.8
-13.151.9-65.0
-116.5-183.7
67.1
-10.552.0
-62.6
-115.5-185.0
69.5
-14.953.5
-68.4
Projection
ANNUAL
1993 1994 1995
-76.5 -107.0 -113.8
598.3440.4
38.560.8
341.2157.8
674.7571.3
56.582.5
432.3103.4
4.8-4.919.94.91.7
11.810.034.99.65.6
635.3471.3
36.475.7
359.2164.0
742.4634.858.8
104.9471.0107.6
5.3-3.821.82.56.9
8.21.4
24.87.02.4
682.2509.8
38.196.5
375.2172.4
796.1686.8
62.5132.5491.6109.3
7.42.0
28.54.54.4
7.28.3
24.84.01.9
-103.9 -147.1 -162.5
-75.7-132.6
56.8
4.052.4
-48.5
-110.4-166.5
56.1
-3.950.0
-53.9
-116.8-182.9
66.0
-11.552.5
-63.9
Unilateral Transfers, net -30.5 -40.1 -29.1 -31.0 -31.0 -40.0 -32.0 -32.0 -32.0 -41.0 -32.1 -32.8 -34.2
1/ Percent change (AR) from previous period; percent changes for annual data are calculated Q4/Q4.
BOARD OF GOVERNORSOF THE
: FEDERAL RESERVE SYSTEMWASHINGTON DC 20551
DIVISION OF RESEARCH AND STATISTICS
June 30, 1994
STRICTLY CONFIDENTIAL (FR)CLASS II - FOMC
TO: Federal Open Market Committee
FROM: Michael J. Prell
Attached are updated versions of the detailed tables of
Part I of the Greenbook. We have mechanically updated those
items that were affected by the revised GDP data for the first
quarter of 1994.
Enclosures
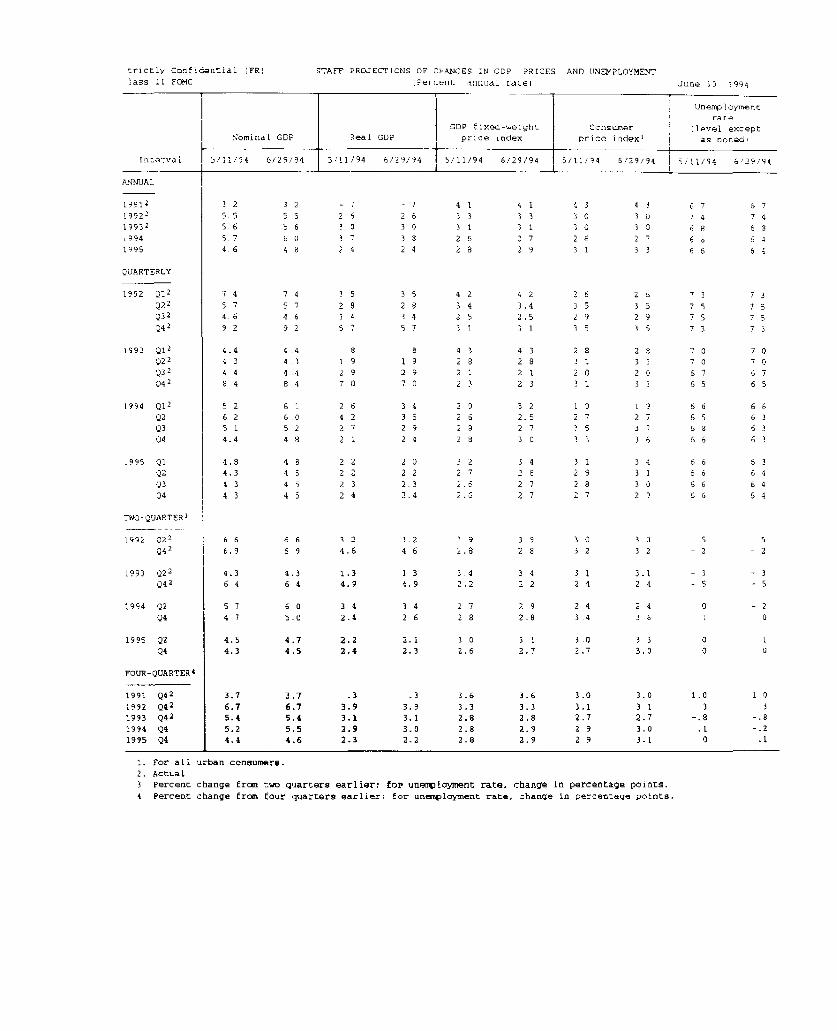
Strictly Confidential (FR)
Class II FOMC
ANNUAL
1991219922
19932
19941995
STAFF PROJECTIONS OF CHANCES IN GDP PRICES, AND UNEMPLOYMENTPercent annual race)
QUARTERLY
1992 Q12
Q22
Q32
Q42
1993 Q12
Q22
Q32
Q42
1994 Q12Q2Q3
Q4
.995 Q1
Q2Q03
Q4
TWO-QUARTER3
1992 Q22Q42
1993 Q22Q42
1994 Q2
Q4
1995 Q2Q4
FOUR-QUARTER4
1991 Q42
1992 Q42
1993 Q42
1994 Q41995 04
4.8 48 22 2 0 3 2 34 31 34 66 6 34.3 4 5 2 2 22 2 7 2 8 29 3 1 6 6 4
4 3 4 5 2 3 2.3 2.6 2 7 2 8 3 0 6 6 6 4
4 3 4 5 2 4 2.4 2.6 2 7 2 7 2 9 5 65 4
66 66 32 32 39 39 30 30 5 56.9 6 9 4.6 4 6 2.8 2 8 3 2 3 2 -2 - 2
4.3 4.3 1.3 1 3 3 4 3 4 31 3.1 3 3
6 4 6.4 4.9 4.9 2.2 2 2 2 4 2 4 -5 - 5
57 60 34 34 27 29 24 24 0 -2
4 7 5.0 2.4 2 6 2 8 2-8 3 4 3 0
4.5 4.7 2.2 2.1 3 0 3 1 3 0 3 3 0 14.3 4,5 2.4 2.3 2.6 2.7 2.7 3.0 0 0
3.7 3.7 .3 .3 3.6 3.6 3.0 3.0 1.0 1 06.7 6.7 3.9 3.9 3.3 3.3 3.1 3 1 3 i5.4 5.4 3.1 3.1 2.8 2.8 2.7 2.7 -.8 -.85.2 5.5 2.9 3.0 2.8 2.9 2 9 3.0 .1 -.24.4 4.6 2.3 2.2 2.8 2.9 2 9 3.1 0 .1
1. For all urban consumers.2. Actual3 Percent change from two quarters earlier: for unemployment rate, change in percentage points.4 Percent change from four quarters earlier; for unemployment rate, change in percentage points.
June 30 1994
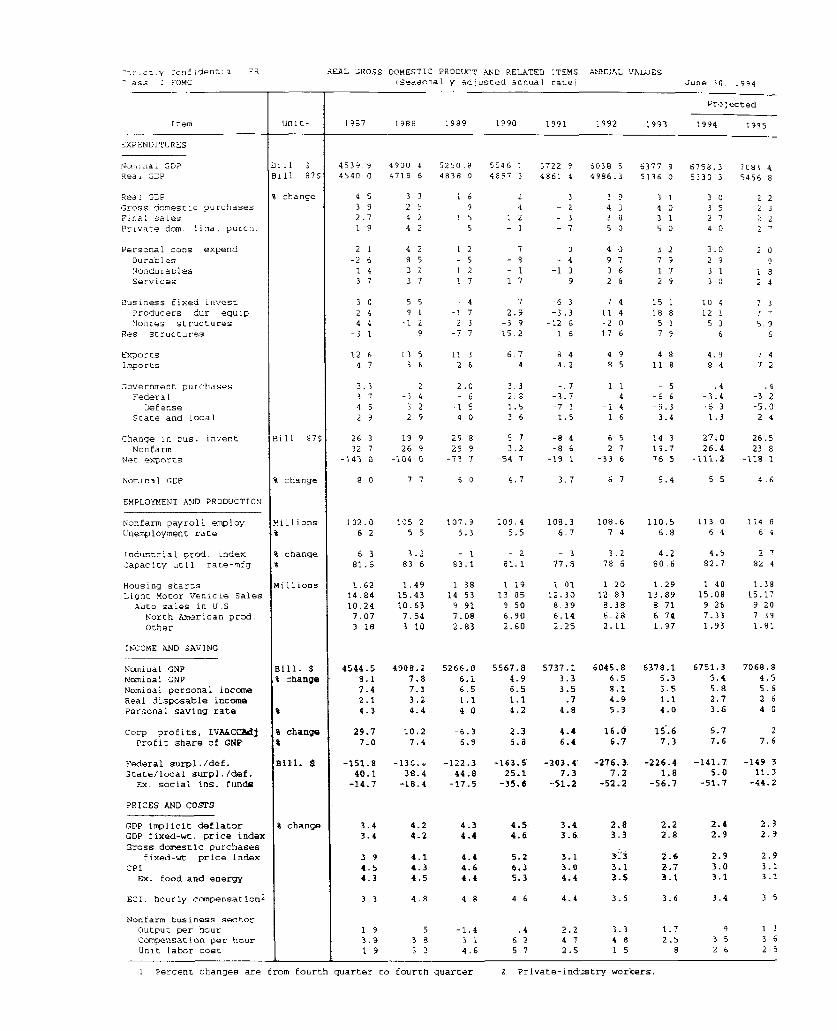
Stricly Confidential FRClass II FOMC
Item
EXPENDITURES
Nonminal GDPReal GDP
Real GDP
Gross domestic purchasesFinal sales
Private dom. final purch.
Personal cons expend
DurablesNondurablesServices
Business fixed invest
Producers dur equipNonres structures
Res structures
ExportsImports
Government purchasesFederal
DefenseState and local
Change in bus. invent
NonfarmNet exports
Nominal GDP
EMPLOYMENT AND PRODUCTION
Nonfarm payroll employUnemployment rate
Industrial prod. indexCapacity util rate-mfg
Housing startsLight Motor Vehicle SalesAuto sales in U.S
North American prod.Other
INCOME AND SAVING
Nominal GNPNominal GNP
Nominal personal incomeReal disposable incomePersonal saving rate
Corp profits, IVA&CCAdjProfit share of GNP
Federal surpl./def.State/local surpl./def.
Ex. social ins. funds
PRICES AND COSTS
GDP implicit deflatorGDP fixed-wt price indexGross domestic purchases
fixed-wt price indexCPI
Ex. food and energy
ECI, hourly compensation2
Nonfarm business sectorOutput per hourCompensation per hourUnit labor cost
REAL GROSS DOMESTIC PRODUCT AND RELATED ITEMS(Seasonally adjusted annual rate)
un it
BillBill 875
8 change
Bill 975
% change
Millions%
% change
Millions
Bill. $% change
% change
Bill. S
4 change
1987 1988
4539 94540 0
4 53 92.7
1 9
2 1
-2 61 43 7
3 02 4
4 4-3 1
12 &4 7
3. 33 7
4 52 9
26 3
32 7-143 0
8 0
102.06 2
6 381.6
1.6214.8410.247.073 18
4544.5
8.17.42.14.3
29.77.0
-151.8
40.1-14.7
3.43.4
3 94.54.3
3.3
1 93.91 9
4 2
8 53 23 7
5 5
9 1-1 2
9
13 53 6
2-3 4
3 22 9
19 926 9
-104 0
7 7
105 2
5 5
3.283 6
1 .4915.4310.637.54
3 10
4908.27.87.13.24.4
10.27.4
-136..38.4
-18.4
4.24-2
4.14.34.5
4.8
53S3
ANNUAL VALUES
Projected
1989 1990 1991 1992 1993 1994 1995
5250 a4838 0
1 69
1 5
5
1 2- 51 21 7
- 4-I 72 3
-7 7
11 32
2.0- 6
-1 5
4 0
29 829 9
-73 7
6 0
107.95.3
83.1
1 3814 539 917.08
2.83
5266.85.16.5
1.14 0
-6.3
6.9
-122.344.8
-17.5
4.34.4
4.44.64.4
4 8
-1.43 1
4.6
5546 1
4897 3
2
412- 1
7-4
7
2.9-3 9
15.2
67
4
3 32 81.5
36
5 73.2
-54 7
4,7
109 4
5.5
- 281.1
1 1913 859 50
6.902.60
5567.84.96.5
1.14.2
2.36.8
-163.525.1
-35.6
5722 9486. 4
3- 2
- 3- 7
-4-1 3
9
-6 3-3.3
-12 61 6
8 44 2
-7
-3.7-7 31.5
-8 4-8 6
-19 1
3.7
108.3
6.7
- 377.8
1 01
12.308.396.142.25
5737.13.33.5.7
4.8
4.46.4
-203.47.3
-51.2
6038 54986.3
3 94 335 0
4 0
9 73 62 8
7 4
11 4-2 017 6
4 98 5
1 14
-1 41 6
6 52 7
-33 6
6 7
108.67 4
3.278 6
1 2012 838.386.282.11
6045.86.58.1
4.95.3
16.06.7
-276.3.7.2
-52.2
4.5 3.4 2.84.6 3.6 3.3
5.2 3.1 3.36.3 3.0 3.15.3 4.4 3.5
4 6 4.4 3.5
6377 95136 0
3 14 03 15 0
327917
29
15 118 8
5 179
4811 8
- 5-6 6
-9.33.4
14 319.776.5
5.4
110.5
6.8
4.280.6
1.2913.89
8 716 741.97
6378.15.33.51.1
15.67.3
-226.41.8
-56.7
2.22.8
2.6
2.73.1
3.6
1.72.5
8
1 eren cane ae ro futhqurtr ofort qare 2Prvae-nusrywokes
June 30, 994
6758.35330 3
3 03 52 74 0
3.0
2 93 13 0
10 4
12 15 36
4.98 4
.4-3.4-6 31.3
27.026.4
-111.2
5. 5
113. 064
4.582.7
1 4015.08
9 267.331.93
6751.35.45.82.73.6
5.77.6
-141.75.0
-51.7
2.42.9
2.93.03.1
3.4
93 52 6
7083 45456 8
2 22 32 22 '
2 0
1 82 4
7 375.9
6
7 47 2
.4-3 2-5.024
26.523 8
-118 1
46
114 86 4
2 782 4
1.3815.17
9 207 391.81
7068.8
4.55.6
2 64 0
27.6
-149.311.3
-44.2
2.32.9
2.9
3.13.1
3 5
1 13 62 5
1 1
1 Percent changes are from fourth quarter to fourth quarter 2 Private-industry workers.
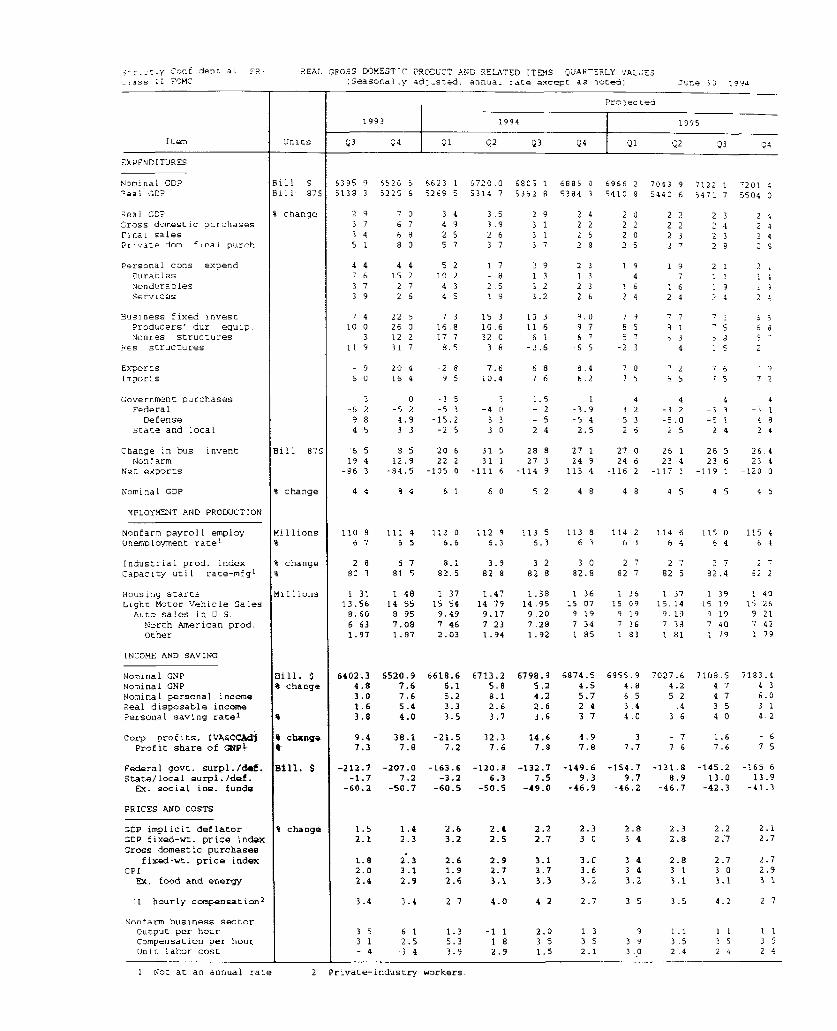
Strictly Confidential (FR) REAL GROSS DOMESTIC PRODUCT AND RELATED ITEMS QUARTERLY VALUESClass II FOMC (Seasonally adjusted, annual rate except as noted) June 30, 1994
Projected
1993 1994 1995
Item Units Q3 Q4 Q1 Q2 Q3 Q4 Q1 Q2 Q3 Q4
EXPENDITURES
Nominal GDP Bill $ 6395 9 6526 5 6623 1 6720 0 6805 1 6885 0 6966 2 7043 9 7122 1 7201 4Real CDP Bill 87$ 5139 3 5225 6 5269 5 5314 7
5352 8 5394 3 5410 8 5440 6 5471 7 5504 0
Real GDP % change 2 9 7 0 3 4 3 5 2 9 2 4 2 0 2 2 2 3 2 4Cross domestic purchases 3 7 6 7 4 9 3 9 3 1 2 2 2 2 2 2 2 4 2 4Final sales 3 4 6 8 2 5 2 6 3 1 2 5 2 0 2 3 2 3 2 4Private dom final purch 5 1 8 0 5 7 3 7 3 7 2 8 2 5 2 7 2 B 2 S
Personal cons expend 4 4 4 4 5 2 1 7 2 9 2 3 1 9 1 9 2 1 2 .DuraDles 7 6 15 2 10 2 - 8 1 3 1 3 4 7 1 ! 1 4Nondurables 3 7 2 7 4 3 2 5 3 2 2 3 1 6 1 6 9 1 9ServiCes 3 9 2 6 4 5 i 9 3.2 2 6 2 4 2 4 2 4 2 4
Business fixed invest 7 4 22 5 7 3 15 3 10 3 9.0 7 9 7 7 7 1 6 5Producers' dur equip. 10 0 26 0 16.8 10 6 11 6 9 7 8 S 9 1 " S 6 8Nonres structures 3 12 2 17 7 32 0 6 1 6
7 5 7 6 3 5 5 "
Res structures 11 9 31 7 3.5 3 8 -2.6 6 5 -2 3 4 1 5 2
Exports - 9 20 4 -2 9 7.6 6 88 4 7 0 7 2 7 6
Imports 6 0 16 4 9 5 10.4 7 6 6 2 7 5 6 5 7 5 7 2
Government purchases 3 0 -3 5 3 1.5 1 4 4 4 4Federal -6 2 -5.2 -5 3 -4 0 - 2 -3.9 3 2 -3 2 -3 3 -3 1Defense 9 8 4.9 -15.2 3 3 - 5 -5 4 -5 3 -5.0 -5 1 4 8
stact and local 4 5 3 3 -2 5 3 0 2 4 2.5 2 6 2 5 2 4 2 4
Change in bus invent Bill 87$ 6 5 8 5 20 6 31 5 28 8 27 1 27 0 26 1 26 5 26.4Nonfarm 19 4 12.9 22 2 31 1 27 3 24 9 24 6 23 4 23 6 23 4
Net exports -86 3 -84.5 -105 0 -111 6 -114 9 113 4 -116 2 -117 1 -119 1 -120 0
Nominal GDP % change 4 4 8 4 6 1 6 0 5 2 4 8 4 8 4 5 4 5 4 5
MPLOYMENT AND PRODUCTION
Nonfarm payroll employ Millions 110 8 111 4 112 0 112 9 113 5 113 8 114 2 114 5 0 115 4Unemployment race
1 % 6 7 6 5 6.6 6.3 6.3 6 3 6 3 6 4 6 4 6 4
Industrial prod. index % change 2 8 6 7 8.1 3.9 3 2 3 0 2 7 2 7 2 7 2 "Capacity util rate-mfgt % 80 3 81 5 82.5 82 8 82 8 82.8 82 7 82 5 82.4 82 2
Housing starts Millions 1 31 1 48 1.37 1.47 1.38 1 36 1 36 1 37 1 39 1 40Light Motor Vehicle Sales 13.56 14 55 15 54 14 79 14 95 15 07 15 09 15 14 15 19 15 26Auto sales in U S 8.60 8 95 9.49 9.17 9 20 9 19 9 19 9 19 9 19 9 21
North American prod 6 63 7.08 7.46 7 23 7.28 7 34 7 36 7 39 7 40 7 42Other 1.97 1.87 2.03 1.94 1.92 1 85 1 83 I 81 1 79 3 79
INCOME AND SAVING
Nominal GNP Bill. $ 6402,3 6520.9 6618.6 6713.2 6798.9 6874.5 6955.9 7027.6 7108,5 7183.4Nominal GNP % change 4.8 7.6 6.1 S.8 5 2 4.5 4.8 4.2 4 7 4 3Nominal personal income 3.0 7.6 5.2 8.1 4.2 5.7 6 5 5 2 4 7 6.0Real disposable income 1.6 5.4 3.3 2.6 2.6 2 4 3 4 .4 3 5 3 1Personal saving rate
1 % 3.8 4.0 3.5 3.7 3.6 3 7 4 0 3 6 4 0 4.2
corp profits, IVA&CCAd % change 9.4 38.1 -21.5 32.3 14.6 4.9 3 - 7 1.6 - 6Profit share of GUP1 0 7.3 7.8 7.2 7.6 7.8 7.8 7.7 7 6 7,6 7 5
Federal govt. surpl./df. Bill. $ -212.7 -207.0 -163.6 -120.8 -132.7 -149.6 -154.7 -131.8 -145.2 -165 6State/local surpl./def. -1.7 7.2 -3.2 6.3 7.5 9,3 9.7 8.9 13.0 13-9
Ex. social ins. funds -60.2 -50.7 -60.5 -50.5 -49.0 -46.9 -46.2 -46.7 -42.3 -41.3
PRICES AND COSTS
GDP implicit deflator 4 change 1.5 1.4 2.6 2.4 2.2 2.3 2.8 2.3 2.2 2.1CDP tixed-wt. price index 2.1 2.3 3-2 2.5 2,7 3 0 3 4 2.8 2.7 2.7Cross domestic purchases
fixed-wt. price index 1.8 2.3 2.6 2.9 3.1 3.0 3 4 2.8 2.7 2.7CPI 2.0 3.1 1.9 2.7 3.7 3.6 3 4 3 1 3 0 2.9
Ex. food and energy 2.4 2.9 2.6 3.1 3.3 3.2 3.2 3.1 3.1 3 1
'I hourly compensation2
3.4 3-4 2 7 4.0 4 2 2.7 3 5 3-5 4-2 2 7
Nonfarm business sectorOutput per hour 3 5 6 1 1-3 -1 1 2.0 1 3 9 1.1 1 1 1 1Compensation per hour 3 1 2.5 5.3 1 8 3 5 3 5 3 9 3 .5 3 5 3 5Unit labor cost - 4 3 4 3.9 2.9 1.5 2.1 3.0 2 4 2 4 2 4
1 Not at an annual rate 2 Private-industry workers
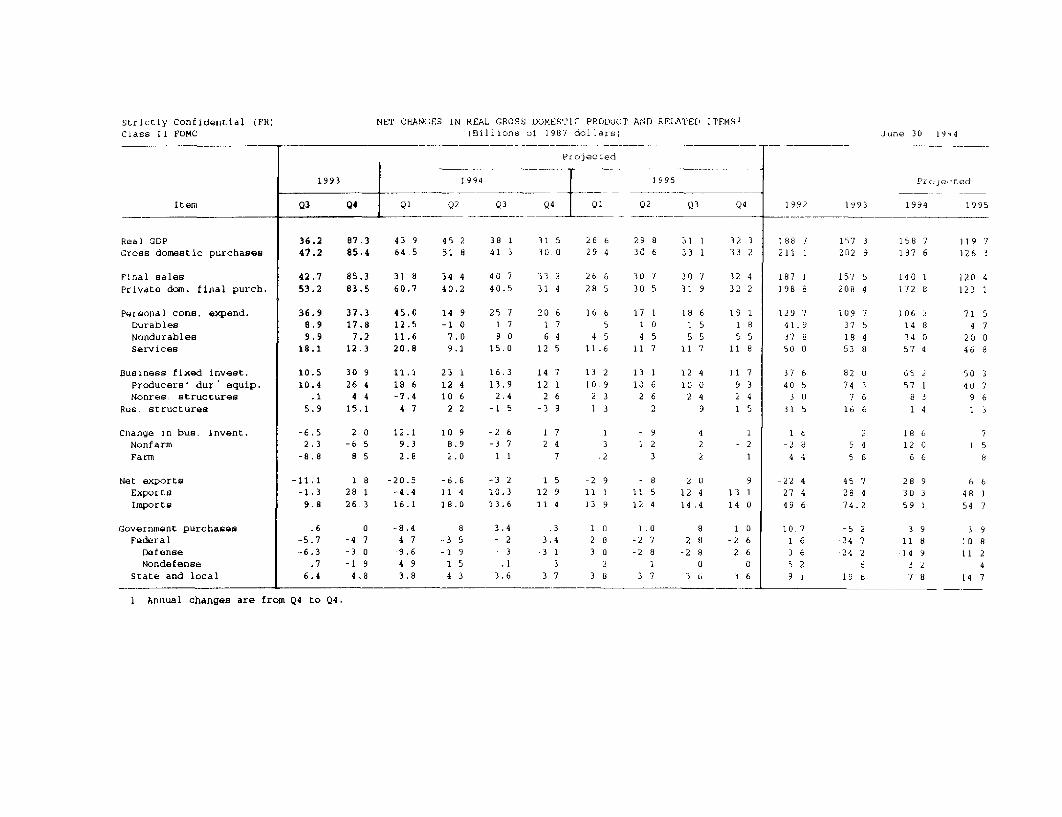
Strictly Confidential (FR)Class II FOMC
NET CHANGES IN REAL GROSS DOMESTIC PRODUCT AND RELATED ITEMS1
(Billions of 1987 dollars) June 30 194
Item
Real GDPGross domestic purchases
Final sales
Private dom. final purch.
Personal cons. expend.DurablesNondurablesServices
Business fixed invest.Producers' dur equip.Nonres. structures
Res structures
Change in bus. Invent.NonfarmFarm
Net exportsExportsImports
Government purchasesFederalDefenseNondefense
State and local
Projected
1993 1994
Q3 Q4 Q1 Q2 Q3 Q4 Q1
1995
Q2 Q3 Q4
36.2 87.3 43 9 45 2 38 1 31 5 26 6 29 8 31 1 32 3
47.2 85,4 64 5 51 8 41 3 30.0 29 4 30 6 33 1 33 2
42.753.2
85,3 31 8 34 4 40 7 33 2 26 6 30 7 30 7 32 4
83.5 60.7 40.2 40.5 31 4 28 5 30 5 31 9 32 2
36.9 37,3 45.0 14 9 25 7 208.9 17.8 12.5 -1 0 1 7 19.9 7.2 11.6 7.0 9 0 6
18.1 12.3 20.8 9.1 15.0 12
10.5 30 9 11.1 2310.4 26 4 18 6 12
.1 4 4 -7.4 105.9 15.1 4 7 2
-6.5 22.3 -6-8.8 8
11.1 1
-1.3 289.8 26
.6-5.7-6.3
.76.4
16 6 175 1
4 5 411.6 11
16.3 14
13.9 122.4 2
-1 5 -3
12.1 10 9 -2 69.3 8.9 -3 72.8 2.0 1 1
-20.5-4.416.1
-8.44 7-9.64 93.8
-6.6 -3 2 111 4 10.3 1218.0 13,6 11
8-3 5-1 9
1 54 3
91 2
3
- 8 211 5 1212 4 14
9
13 1
14 0
1.0-2 7-2 8
13 7
Pr je Icred
1992 1993 1994 1995
188 7 157 3 158 7 119 7211 1 202 9 187 6 126 3
187 1 157 5 140 1 120 4198 8 208 4 172 8 123 1
129 741.937 8
50 0
45 7 2828 4 3074.2 59
3 910 811 2
414 7
1 Annual changes are from Q4 to Q4.