Fomc 19901113 g Bpt 219901107
115
Prefatory Note The attached document represents the most complete and accurate version available based on original copies culled from the files of the FOMC Secretariat at the Board of Governors of the Federal Reserve System. This electronic document was created through a comprehensive digitization process which included identifying the best- preserved paper copies, scanning those copies, 1 and then making the scanned versions text-searchable. 2 Though a stringent quality assurance process was employed, some imperfections may remain. Please note that this document may contain occasional gaps in the text. These gaps are the result of a redaction process that removed information obtained on a confidential basis. All redacted passages are exempt from disclosure under applicable provisions of the Freedom of Information Act. 1 In some cases, original copies needed to be photocopied before being scanned into electronic format. All scanned images were deskewed (to remove the effects of printer- and scanner-introduced tilting) and lightly cleaned (to remove dark spots caused by staple holes, hole punches, and other blemishes caused after initial printing). 2 A two-step process was used. An advanced optimal character recognition computer program (OCR) first created electronic text from the document image. Where the OCR results were inconclusive, staff checked and corrected the text as necessary. Please note that the numbers and text in charts and tables were not reliably recognized by the OCR process and were not checked or corrected by staff.
-
Upload
fraser-federal-reserve-archive -
Category
Documents
-
view
215 -
download
0
Transcript of Fomc 19901113 g Bpt 219901107

Prefatory Note
The attached document represents the most complete and accurate version available based on original copies culled from the files of the FOMC Secretariat at the Board of Governors of the Federal Reserve System. This electronic document was created through a comprehensive digitization process which included identifying the best-preserved paper copies, scanning those copies,1 and then making the scanned versions text-searchable.2 Though a stringent quality assurance process was employed, some imperfections may remain.
Please note that this document may contain occasional gaps in the text. These gaps are the result of a redaction process that removed information obtained on a confidential basis. All redacted passages are exempt from disclosure under applicable provisions of the Freedom of Information Act.
1 In some cases, original copies needed to be photocopied before being scanned into electronic format. All scanned images were deskewed (to remove the effects of printer- and scanner-introduced tilting) and lightly cleaned (to remove dark spots caused by staple holes, hole punches, and other blemishes caused after initial printing). 2 A two-step process was used. An advanced optimal character recognition computer program (OCR) first created electronic text from the document image. Where the OCR results were inconclusive, staff checked and corrected the text as necessary. Please note that the numbers and text in charts and tables were not reliably recognized by the OCR process and were not checked or corrected by staff.
Confidential (FR) Class III FOMC
November 7, 1990
RECENT DEVELOPMENTS
Prepared for the Federal Open Market Committee
By the staff of the Board of Governors of the Federal Reserve System

TABLE OF CONTENTS
Section Page
DOMESTIC NONFINANCIAL DEVELOPMENTS IIEmployment and unemployment......................................... 1Labor costs.......... ....... ...... ................................. 5Industrial production and capacity utilization................... 9Personal income and consumption ................................ 13Autos and light trucks ............................................ 17Housing markets ....... ....................... .............. ....... 19Business fixed investment................................ ......... 23Business inventories.............................................. 27Federal government sector.................... .......... ........... 30State and local government sector ................................ 37Prices............................................................ 39Recession probabilities........................................... 45
TablesChanges in employment.................................... ......... 2Unemployment and labor force participation rates.................. 2Employment cost index....................... ..... .................. 6Employment cost index: Private industry workers................... 6Average hourly earnings........................................... 7Negotiated wage rate changes under major
collective bargaining settlements............................ 8Size distribution of first-year wage rate adjustments
in major collective bargaining settlements.................... 8Growth in selected components of industrial production............ 10Percent change in orders for manufactured goods................... 10Capacity utilization in industry.................................. 12Personal income................................................... 15Real personal comsumption expenditures.............................. 15Sales of automobiles and light trucks............................. 16Private housing activity.................. ................. ........ 18Median price of existing homes sold
in selected metropolitan statistical areas.................... 20Business capital spending indicators.............................. 22Changes in manufacturing and trade inventories..................... 28Inventories relative to sales.................................... 28FY1991 budget package--changes from OMB baseline.................. 32Federal government outlays and receipts ........................... 34Recent changes in consumer prices................................. 38Recent changes in producer prices.................................. 38
ChartsOther labor market indicators..................................... 4Unemployment insurance ......................... .................... 4Consumer attitudes and real DPI ........ .... ..................... 14Real DPI.......................................................... 14Private housing starts............................................ 18Recent data on orders and shipments................................ 24Nonresidential construction and selected indicators................ 26Ratio of inventories to sales..................................... 29State general fund spending..................................... 36Daily spot and posted prices of West Texas Intermediate........... 42Commodity price measures........................... ............... 43Probability of a recession........................................ 44

DOMESTIC FINANCIAL DEVELOPMENTS IIIMonetary aggregates and bank credit............................... 3Nonfinancial business finance..................................... 9Financial firms.................................... ............... 13Treasury and sponsored agency financing........................... 19Municipal securities.............................................. 20Mortgage markets.................................................. 24Consumer installment credit ....................................... 27
TablesMonetary aggregates............................................... 2Commercial bank credit and short- and intermediate-term
business credit............................................... 4Gross offerings of securities by U.S. corporations................ 8Treasury and agency financing ................................... 18Gross offerings of municipal securities........................... 21Long-term municipal debt rating actions: 1984-1990:Q3 ............. 22Mortgage-backed security issuance................................. 25Consumer credit................................................... . 26Consumer interest rates ........................................... 26
ChartsGrowth of total loans at large banks............................. 6Moody's rating changes for corporate bonds........................ 10Quarterly dividend actions ........................................ 10Spread between Baa and Aaa corporate bonds........................ 12Asset-backed volume and yield spreads............................. 14Relative willingness of banks to make consumer loans............... 28Consumer loan interest rates at banks............................ 30Spread between consumer rates and Treasury yield.................. 30
INTERNATIONAL DEVELOPMENTS IVU.S. merchandise trade............................................ 1Prices of imports and exports........................... ........ 6U.S. international financial transactions........................... 6Foreign exchange markets ........................ .................. 10Developments in foreign industrial countries....................... 13Developments in East European economies........................... 23Economic situation in major developing countries.................. 25
TablesU.S. merchandise trade: Monthly data.............................. 1U.S. merchandise trade: Quarterly data............................ 2Major trade categories............................................ 3Oil imports....................................................... 4Import and export price measures.................................. 5Summary of U.S. international transactions........................ 7International banking data........................................ 9Major industrial countries
Real GNP and industrial production.............................. 14Consumer and wholesale prices............. ......................... 15Trade and current account balances.............................. 16
ChartWeighted average exchange value of the dollar....................... 11

DOMESTIC NONFINANCIALDEVELOPMENTS

DOMESTIC NONFINANCIAL DEVELOPMENTS
Incoming data since the last FOMC meeting have shown a noticeable
weakening in the economy. The downturn in activity is most evident in the
October labor market news and in the preliminary information on industrial
production, the principal data available on fourth-quarter output. A
substantial decline in real disposable income and plunging consumer
sentiment point to a likely deterioration in consumer demand; motor vehicle
sales dropped back in October to a pace somewhat below the average for the
year to date. Contracts and orders suggest weakness in business investment,
and housing activity has been soft.
Indicators of inflationary pressures have been mixed of late. The
consumer and producer price indexes have skyrocketed in the past couple of
months because of surges in energy prices. Prices of industrial materials
have declined noticeably overall, however, and recent wage data suggest
stability, if not some easing, in labor cost trends.
Employment and Unemployment
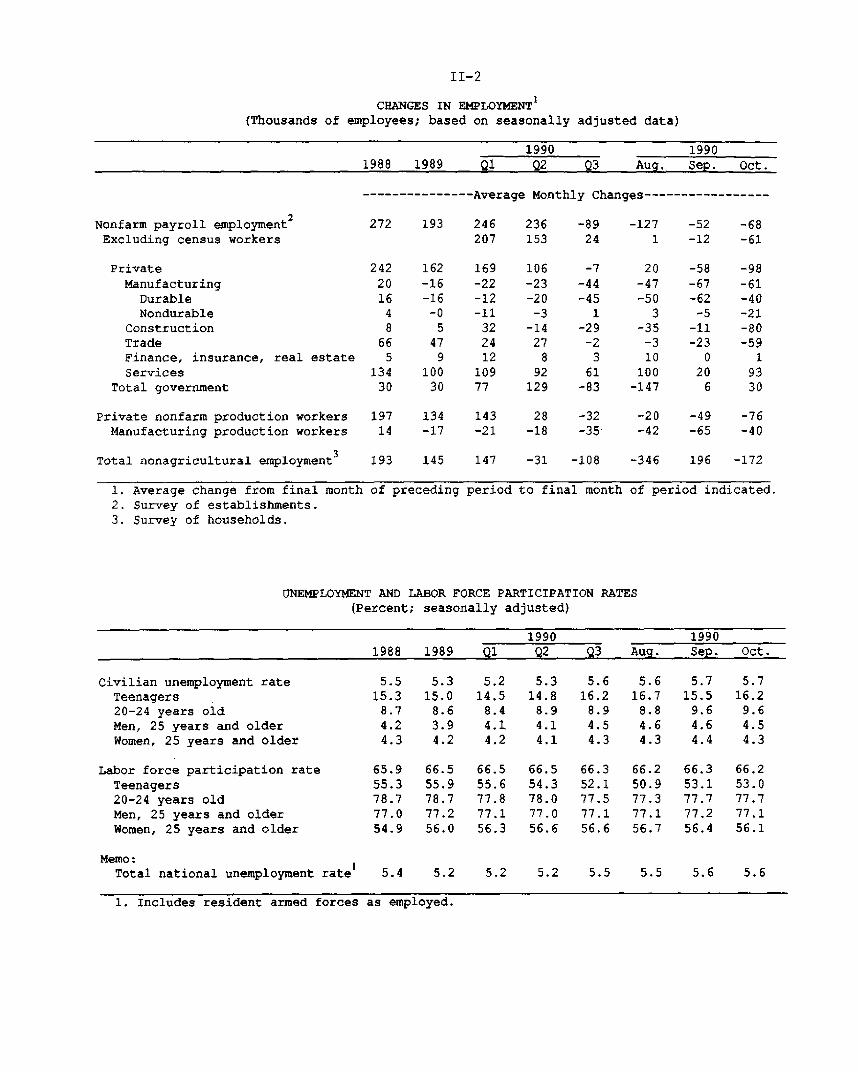
Data for October indicate increasing softness in the labor market.
Private nonfarm employment dropped 98,000 after falling 58,000 in
September. 1 Moreover, with extraordinarily sharp cutbacks in average
workweeks in October, aggregate hours of production or nonsupervisory
workers fell 1.6 percent. The civilian unemployment rate was unchanged at
5.7 percent as of the October 13 survey reference week, but initial claims
1. Census layoffs, which totaled an estimated 40,000 in September and7,000 in October, are nearly complete, and we expect future labor marketreports to be largely free from this effect.
II-1
II-2
CHANGES IN EMPLOYMENT 1
(Thousands of employees; based on seasonally adjusted data)
1990 19901988 1989 Q1 Q2 Q3 Aug. Sep. Oct.
---------------Average Monthly Changes----------------
Nonfarm payroll employment2 272 193 246 236 -89 -127 -52 -68Excluding census workers 207 153 24 1 -12 -61
Private 242 162 169 106 -7 20 -58 -98Manufacturing 20 -16 -22 -23 -44 -47 -67 -61
Durable 16 -16 -12 -20 -45 -50 -62 -40Nondurable 4 -0 -11 -3 1 3 -5 -21
Construction 8 5 32 -14 -29 -35 -11 -80Trade 66 47 24 27 -2 -3 -23 -59Finance, insurance, real estate 5 9 12 8 3 10 0 1Services 134 100 109 92 61 100 20 93
Total government 30 30 77 129 -83 -147 6 30
Private nonfarm production workers 197 134 143 28 -32 -20 -49 -76Manufacturing production workers 14 -17 -21 -18 -35 -42 -65 -40
Total nonagricultural employment3 193 145 147 -31 -108 -346 196 -172
1. Average change from final month of preceding period to final month of period indicated.2. Survey of establishments.3. Survey of households.
UNEMPLOYMENT AND LABOR FORCE PARTICIPATION RATES(Percent; seasonally adjusted)
1990 19901988 1989 Ql Q2 Q3 Aug. Sep. Oct.
Civilian unemployment rate 5.5 5.3 5.2 5.3 5.6 5.6 5.7 5.7Teenagers 15.3 15.0 14.5 14.8 16.2 16.7 15.5 16.220-24 years old 8.7 8.6 8.4 8.9 8.9 8.8 9.6 9.6Men, 25 years and older 4.2 3.9 4.1 4.1 4.5 4.6 4.6 4.5Women, 25 years and older 4.3 4.2 4.2 4.1 4.3 4.3 4.4 4.3
Labor force participation rate 65.9 66.5 66.5 66.5 66.3 66.2 66.3 66.2Teenagers 55.3 55.9 55.6 54.3 52.1 50.9 53.1 53.020-24 years old 78.7 78.7 77.8 78.0 77.5 77.3 77.7 77.7Men, 25 years and older 77.0 77.2 77.1 77.0 77.1 77.1 77.2 77.1Women, 25 years and older 54.9 56.0 56.3 56.6 56.6 56.7 56.4 56.1
Memo:Total national unemployment rate 5.4 5.2 5.2 5.2 5.5 5.5 5.6 5.6
1. Includes resident armed forces as employed.

II-3
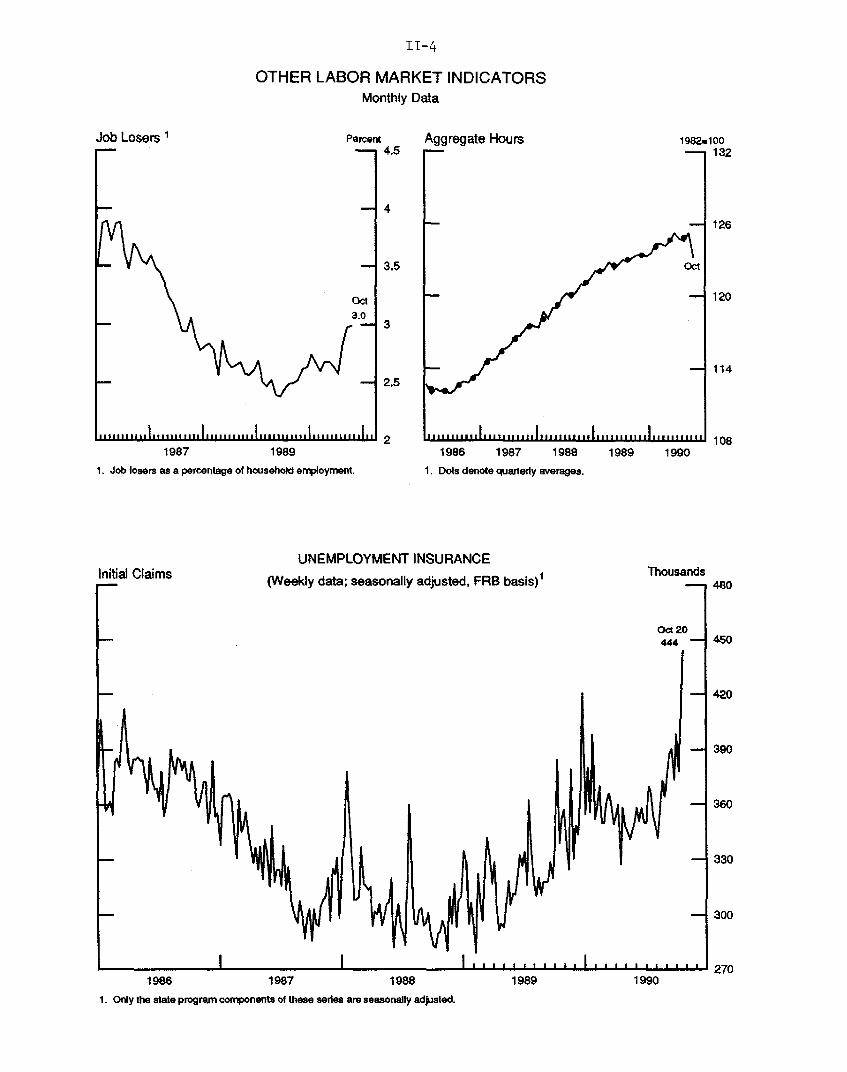
for unemployment insurance moved up quite sharply to more than 440,000 in
the week ended October 20 from a September average of about 390,000.
The recent employment losses have been widespread across industries;
indeed, the diffusion index of employment change over a three-month span in
356 private industries was below the 50 percent mark in the past two months.
The manufacturing and construction industries, in particular, suffered
further sizable declines in jobs in October: Factories shed another 60,000
workers, and employment in contract construction plunged 80,000. The
weakness in the goods-producing sector continued to filter through to
wholesalers, where employment declined for a fourth consecutive month. In
addition, retailers cut nearly 50,000 jobs last month, and employment in
business services declined, after several months of little change. The only
two areas in which jobs expanded noticeably in recent months were health
services and education.
In the household survey, total nonagricultural employment was down
173,000 in October, more than the average monthly decline over the preceding
three months. As a result of these declines, the employment-population
ratio has dropped 0.6 percentage point since June, after hovering around the
63.0 percent mark for more than a year. Over the same period, the number of
job losers as a percentage of total employment has risen sharply.
The drop in employment last month translated into an equivalent decline
in the labor force, as unemployment was little changed in October. After
trending upward for most of this expansion, the labor force participation
rate leveled off over the past year and has fallen markedly since early this
summer. In October, the participation rate stood at 66.2 percent,
0.3 percentage point below its second-quarter level. Declines in
II-4
OTHER LABOR MARKET INDICATORSMonthly Data
Job Losers 1 Percent
1987 1989
1. Job losers as a percentage of household employment.
UNEMPL(Initial Claims
r(Weekly data; s
Aggregate Hours
1986 1987 1988
1. Dots denote quarterly averages.
3YMENT INSURANCE
easonally adjusted, FRB basis) 1
1982=100-- 132
1989 1990
Thousands
444 450
1986 1987 1988 1989 1990
1. Only the state program components of these series are seasonally adjusted.
II-5
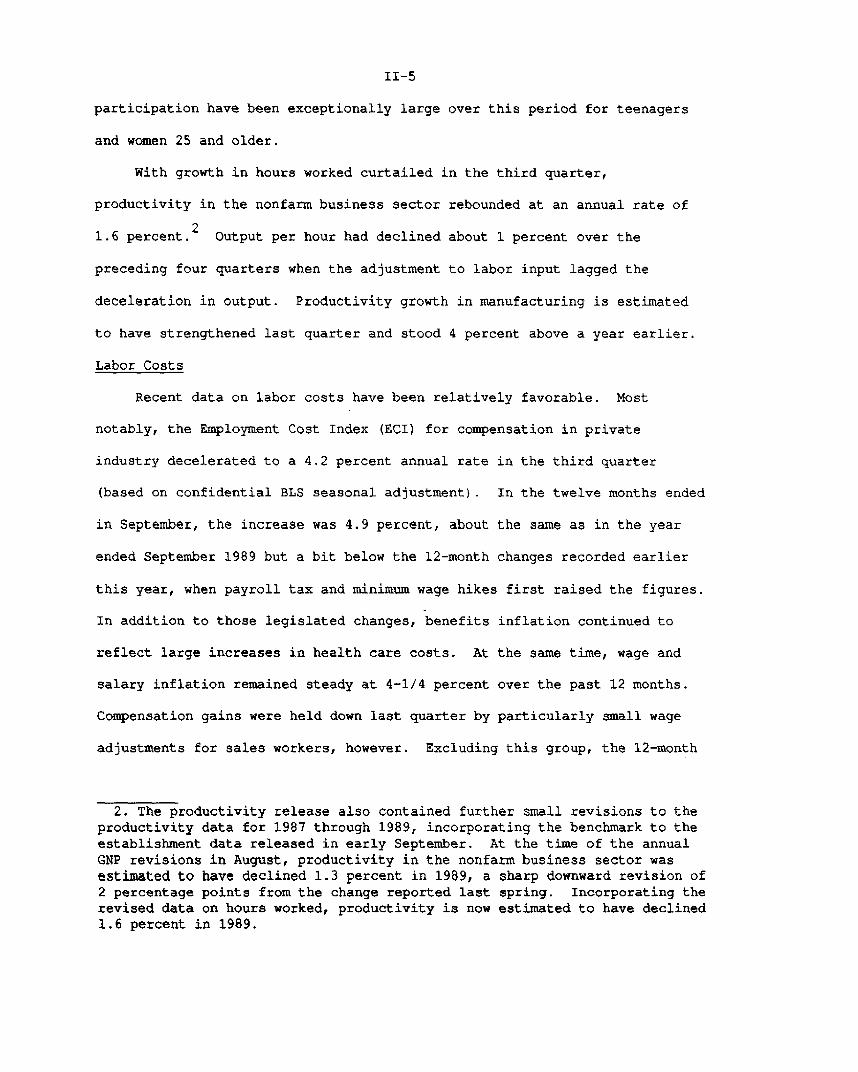
participation have been exceptionally large over this period for teenagers
and women 25 and older.
With growth in hours worked curtailed in the third quarter,
productivity in the nonfarm business sector rebounded at an annual rate of
21.6 percent. Output per hour had declined about 1 percent over the
preceding four quarters when the adjustment to labor input lagged the
deceleration in output. Productivity growth in manufacturing is estimated
to have strengthened last quarter and stood 4 percent above a year earlier.
Labor Costs
Recent data on labor costs have been relatively favorable. Most
notably, the Employment Cost Index (ECI) for compensation in private
industry decelerated to a 4.2 percent annual rate in the third quarter
(based on confidential BLS seasonal adjustment). In the twelve months ended
in September, the increase was 4.9 percent, about the same as in the year
ended September 1989 but a bit below the 12-month changes recorded earlier
this year, when payroll tax and minimum wage hikes first raised the figures.
In addition to those legislated changes, benefits inflation continued to
reflect large increases in health care costs. At the same time, wage and
salary inflation remained steady at 4-1/4 percent over the past 12 months.
Compensation gains were held down last quarter by particularly small wage
adjustments for sales workers, however. Excluding this group, the 12-month
2. The productivity release also contained further small revisions to theproductivity data for 1987 through 1989, incorporating the benchmark to theestablishment data released in early September. At the time of the annualGNP revisions in August, productivity in the nonfarm business sector wasestimated to have declined 1.3 percent in 1989, a sharp downward revision of2 percentage points from the change reported last spring. Incorporating therevised data on hours worked, productivity is now estimated to have declined1.6 percent in 1989.

II-6
EMPLOYMENT COST INDEX(Percent change from preceding period at compound annual rates;
based on seasonally adjusted data)
1989June Sep. Dec.
1990March June Sep.
Total compensation costs:
Private industry workers
By industry:Goods-producingService-producing
By occupation:White-collarBlue-collarService workers
By bargaining status:UnionNonunion
Memo:Wages and salariesBenefits
4.9 4.9 4.8
4.1 5.3 4.45.4 4.9 4.4
4.9 5.3 5.24.9 4.5 3.24.1 4.1 5.2
4.1 3.6 3.64.9 5.7 4.0
4.1 4.1 4.47.1 6.6 5.2
5.6 5.5 4.2
6.0 5.1 4.65.2 5.9 3.9
5.6 5.9 4.26.4 4.7 3.54.8 5.1 3.5
6.0 3.1 3.96.8 5.5 4.2
4.0 5.1 3.110.1 5.4 6.1
1. Changes are from final month of preceding period to final month ofperiod indicated. Percent changes are seasonally adjusted by the BLS.
EMPLOYMENT COST INDEX(Private industry workers; 12-month percent changes)
1988 1989 1990
Sep. Sep. Dec. March June Sep.
Total compensation costs:
Private industry workers 4.4 4.8 4.8 5.2 5.2 4.9Excluding sales workers 4.5 4.4 4.5 4.9 5.1 5.0
By industry:Goods-producing 4.5 4.1 4.3 5.1 5.2 5.0Service-producing 4.5 5.3 5.1 5.1 5.2 4.8
By occupation:White-collar 4.5 5.4 5.2 5.3 5.5 5.2Blue-collar 4.5 4.1 4.1 4.8 4.7 4.5Service workers 4.6 4.1 4.4 4.7 4.9 4.5
By bargaining status:Union 4.4 3.3 3.7 4.3 4.1 4.2Nonunion 4.6 5.3 5.1 5.4 5.5 5.1
Memo:Wages and salaries 3.7 4.3 4.1 4.2 4.5 4.2Benefits 6.8 6.0 6.1 7.2 6.9 6.8

II-7
change in compensation remained at 5 percent, 1/2 percentage point above the
12-month change recorded in September 1989.
By occupation, compensation for white-collar, blue-collar, and service
workers all showed hints of deceleration in the latest ECI report--although
quite tentative ones, given the variability of the figures. The same is
true of the broad industry groupings--that is, goods-producing and service-
producing. In the case of service-producing industries, the 12-month change
in September was a bit below that recorded in September 1989, reflecting the
weakness in sales workers' pay. In contrast, in goods-producing industries,
the 12-month change in compensation remained considerably higher than a year
earlier, despite heavy layoffs.
Average hourly earnings of production or nonsupervisory workers were
unchanged in October. As a result, the year-over-year change in this
indicator of wage trends dropped to 3.7 percent, after having been fairly
stable at around 4 percent over the first nine months of the year.
Manufacturing wages, which appeared to accelerate over the first half of the
year, have slowed, on average, since midyear, but remain 4 percent above a
year earlier.
AVERAGE HOURLY EARNINGS(Percentage change; based on seasonally adjusted data)
1990 1990 Oct. 1989 to1989 Q1 Q2 Q3 Sept. Oct. Oct. 1990
--Annual rate-- -Monthly rate-
Total private nonfarm 4.0 3.3 4.7 4.3 .4 .0 3.7
Manufacturing 2.6 2.5 5.8 3.8 .3 .5 4.0
1. Changes over periods longer than one month are based on quarterlyaverages.

II-8
NEGOTIATED WAGE RATE CHANGESUNDER MAJOR COLLECTIVE BARGAINING SETTLEMENTS 1
(Percent change)
1990Same parties Firstunder prior nine
1987 1988 1989 settlements months
All industriesFirst-year adjustments 2.2 2.5 4.0 2.3 3.9Average over life of contract 2.1 2.4 3.3 2.1 3.3
Workers affected (in thousands) 2037 1799 1847 - 1569
1. Contracts covering 1,000 or more workers; estimates exclude lump-sumpayments and potential gains under cost-of-living clauses.
SIZE DISTRIBUTION OF FIRST-YEAR WAGE RATE ADJUSTMENTS INMAJOR COLLECTIVE BARGAINING SETTLEMENTS
(Percent)
1986 1987 1988 1989 1990 1
Decreases 9 4 2 1 0No wage change 21 23 20 8 50 to 4 percent 51 50 51 45 584 to 6 percent 14 17 24 28 306 percent and over 4 5 4 18 8
Mean adjustment 1.2 2.2 2.5 4.0 3.9
Number of workers 2486 2037 1799 1847 1569(in thousands)
1. Over the first nine months.

II-9
During the first nine months of 1990, wage adjustments in major union
settlements were larger than in agreements they replaced, but were no bigger
than new settlements during 1989. Negotiated wage settlements averaged 3.9
percent in the first contract year and 3.3 percent annually over the life of
the contract (exclusive of lump-sum payments and COLAs). While these first-
year wage settlements were on average similar to those in 1989, the
dispersion of adjustments narrowed in 1990, with fewer workers receiving
either very large gains or having their wages held constant or cut. About
88 percent received wage gains between 0 and 6 percent, up from 73 percent
in 1989.
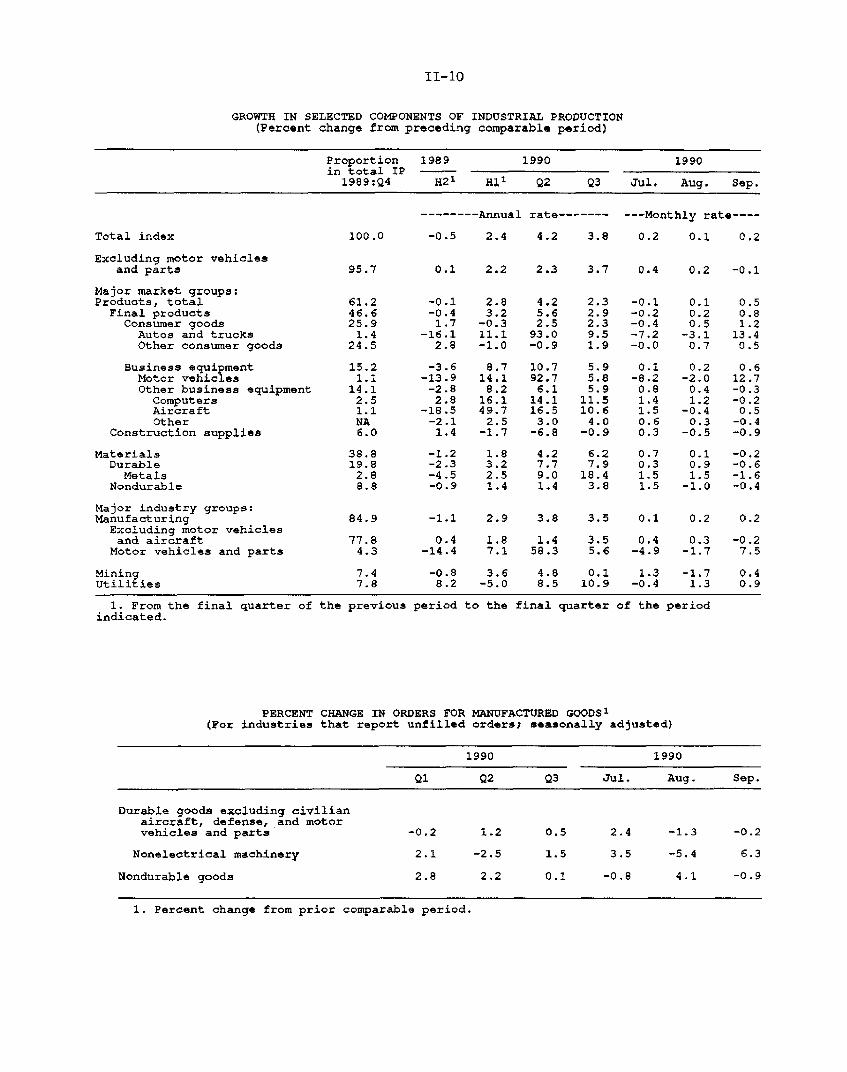
Industrial Production and Capacity Utilization
After rising 0.2 percent per month, on average, from June to September,
the index of industrial production evidently declined substantially in
October. Motor vehicle assemblies dropped from 11.5 million units in
September (annual rate; FRB seasonals) to 10.8 million units, directly
reducing October IP growth 0.2 percentage point. Based on other weekly
physical product data, steel production and electricity generation are
expected to reverse their recent strength. Moreover, declines in production
worker hours were widespread in October, and especially deep in industries
that tend to be related to construction and home goods: lumber; stone, clay,
and glass; furniture; and fabricated metals. Significant reductions in
factory labor input also occurred in textiles, apparel, and petroleum
products.
Prospects for the remainder of the fourth quarter also look weak. As
the staff had expected, motor vehicle manufacturers have cut their assembly
schedules for November and December; planned output for these months is now
II-10
GROWTH IN SELECTED COMPONENTS OF INDUSTRIAL PRODUCTION(Percent change from preceding comparable period)
Proportion 1989 1990 1990in total IP -
1989:Q4 H2 1 HI 1 Q2 Q3 Jul. Aug. Sep.
--------Annual rate------- --- Monthly rate----
Total index 100.0 -0.5 2.4 4.2 3.8 0.2 0.1 0.2
Excluding motor vehiclesand parts 95.7 0.1 2.2 2.3 3.7 0.4 0.2 -0.1
Major market groups:Products, total 61.2 -0.1 2.8 4.2 2.3 -0.1 0.1 0.5
Final products 46.6 -0.4 3.2 5.6 2.9 -0.2 0.2 0.8Consumer goods 25.9 1.7 -0.3 2.5 2.3 -0.4 0.5 1.2Autos and trucks 1.4 -16.1 11.1 93.0 9.5 -7.2 -3.1 13.4Other consumer goods 24.5 2.8 -1.0 -0.9 1.9 -0.0 0.7 0.5
Business equipment 15.2 -3.6 8.7 10.7 5.9 0.1 0.2 0.6Motor vehicles 1.1 -13.9 14.1 92.7 5.8 -8.2 -2.0 12.7Other business equipment 14.1 -2.8 8.2 6.1 5.9 0.8 0.4 -0.3
Computers 2.5 2.8 16.1 14.1 11.5 1.4 1.2 -0.2Aircraft 1.1 -18.5 49.7 16.5 10.6 1.5 -0.4 0.5Other NA -2.1 2.5 3.0 4.0 0.6 0.3 -0.4
Construction supplies 6.0 1.4 -1.7 -6.8 -0.9 0.3 -0.5 -0.9
Materials 38.8 -1.2 1.8 4.2 6.2 0.7 0.1 -0.2Durable 19.8 -2.3 3.2 7.7 7.9 0.3 0.9 -0.6Metals 2.8 -4.5 2.5 9.0 18.4 1.5 1.5 -1.6
Nondurable 8.8 -0.9 1.4 1.4 3.8 1.5 -1.0 -0.4
Major industry groups:Manufacturing 84.9 -1.1 2.9 3.8 3.5 0.1 0.2 0.2
Excluding motor vehiclesand aircraft 77.8 0.4 1.8 1.4 3.5 0.4 0.3 -0.2Motor vehicles and parts 4.3 -14.4 7.1 58.3 5.6 -4.9 -1.7 7.5
Mining 7.4 -0.8 3.6 4.8 0.1 1.3 -1.7 0.4Utilities 7.8 8.2 -5.0 8.5 10.9 -0.4 1.3 0.9
1. From the final quarter of the previous periodindicated.
to the final quarter of the period
PERCENT CHANGE IN ORDERS FOR MANUFACTURED GOODS 1
(For industries that report unfilled orders; seasonally adjusted)
1990 1990
Q1 Q2 Q3 Jul. Aug. Sep.
Durable goods excluding civilianaircraft, defense, and motorvehicles and parts -0.2 1.2 0.5 2.4 -1.3 -0.2
Nonelectrical machinery 2.1 -2.5 1.5 3.5 -5.4 6.3
Nondurable goods 2.8 2.2 0.1 -0.8 4.1 -0.9
1. Percent change from prior comparable period.

II-11
at a 9.9 million unit annual rate (FRB seasonals). The reductions are
largely attributable to the decision by General Motors to idle 14 assembly
plants for up to four weeks. The reduction in planned assemblies through
year-end, including its likely effect on the manufacture of parts and
upstream supplies, will reduce total industrial output 1/2 percentage point
between October and December.
The timing of the downshift in motor vehicle production is an important
factor in the apparent break in the trend of industrial production in
October. Elsewhere, declines had appeared in September, with marked
turnarounds in those sectors that had registered strong growth through the
summer, including the production of a variety of capital goods and
materials. At the same time, output of construction supplies continued on
its downward trend, as did defense and space equipment production.
Reflecting the steady pace of total industrial output through
the summer, capacity utilization remained about flat at 83.6 percent in the
third quarter. Nonetheless, utilization in manufacturing was about
2 percentage points below the peak reached in January 1989. The lumber,
pulp and paper, chemicals (both primary and advanced producers),
instruments, and motor vehicles industries were the farthest below their
past peaks, while petroleum products was above its 1988-89 high.
In addition to the temporary shutdowns announced by General Motors,
the company also announced the permanent closing of four facilities that had
previously been idle, some for as long as three years. These plants
represent approximately 5 percent of domestic auto and light truck capacity,
as measured in terms of unit production, and are currently counted in the FR
capacity index for autos and light trucks. These reductions will be

II-12
CAPACITY UTILIZATION IN INDUSTRY(Percent of capacity; seasonally adjusted)
1967-89 1978-79 1988-89 1989 1990
Avg. Righ High Q4 Qi Q2 Q3
Total industry
Manufacturing
82.2 87.3 85.0 83.5 83.1 83.4 83.6
81.5 87.3 85.1 82.9 82.6 82.8 82.8
Primary processingTextile mill productsLumber and products
Pulp and paper
Primary processing chemicals1
Petroleum products
Stone, clay and glass
Primary metals
Iron and steelNonferrous metals
Fabricated metal products
Advanced processingFurniture and fixtures
Advanced processing chemicals 2
Nonelectrical machineryElectrical machineryMotor vehicles and parts
Autos and light trucksAerospace and miscellaneous
transport equipmentInstruments
MiningCoal mining
UtilitiesElectric utilities
82.386.082.792.282.985.1
78.379.8
79.4
80.877.7
81.182.7
77.2
81.3
80.476.7
na
89.790.587.698.289.889.587.0
102.4110.4
90.5
83.9
86.3
86.682.492.189.493.092.2
89.091.291.297.7
91.790.386.4
91.6
92.0
95.0
85.1
83.688.3
83.283.5
83.185.583.6
85.986.985.7
93.588.488.384.183.079.5
88.582.0
81.6
84.878.7
81.2
81.075.1
71.1
75.3 80.5 86.2 80.6 83.6 84.6 84.0
83.1 92.5 83.9 80.1 79.5 78.4 78.3
87.3 95.2 87.2 86.7 87.6 88.9 89.287.3 95.6 94.4 88.3 92.7 92.0 92.9
86.8 88.3 92.3 88.0 83.9 85.3 87.389.0 88.3 96.2 92.6 89.5 91.3 93.0
1. Primary processing chemicals includes industrial organic andsynthetic materials, plastics resins and fertilizers.
2. Advanced processing chemicals includes drugs and toiletries,
incrganic chemicals,
soaps and detergents,
paints and allied products, pesticides, and other miscellaneous chemical products.
85.7
87.2
85.3
91.988.0
90.8
84.1
83.4
81.2
86.980.9
81.4
84.578.9
82.1
80.9
69.0
63.1
85.1
87.9
82.5
92.086.987.5
81.7
84.3
81.4
88.881.2
81.8
86.378.4
82.7
80.8
76.9
73.5
85.887.1
80.8
92.886.3
91.0
81.6
88.2
86.7
90.482.0
81.6
86.078.6
83.1
80.177.3
75.0
II-13
incorporated in the published figures when revisions to 1990 capacity
estimates are released next February.
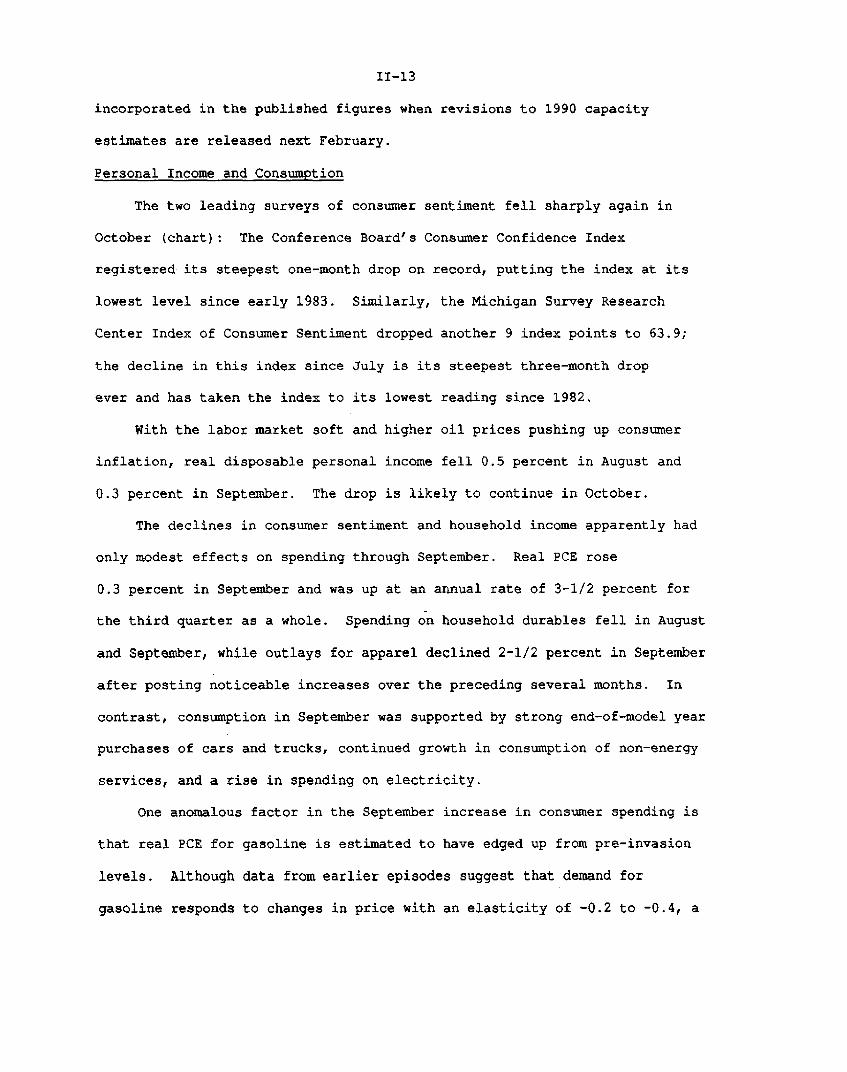
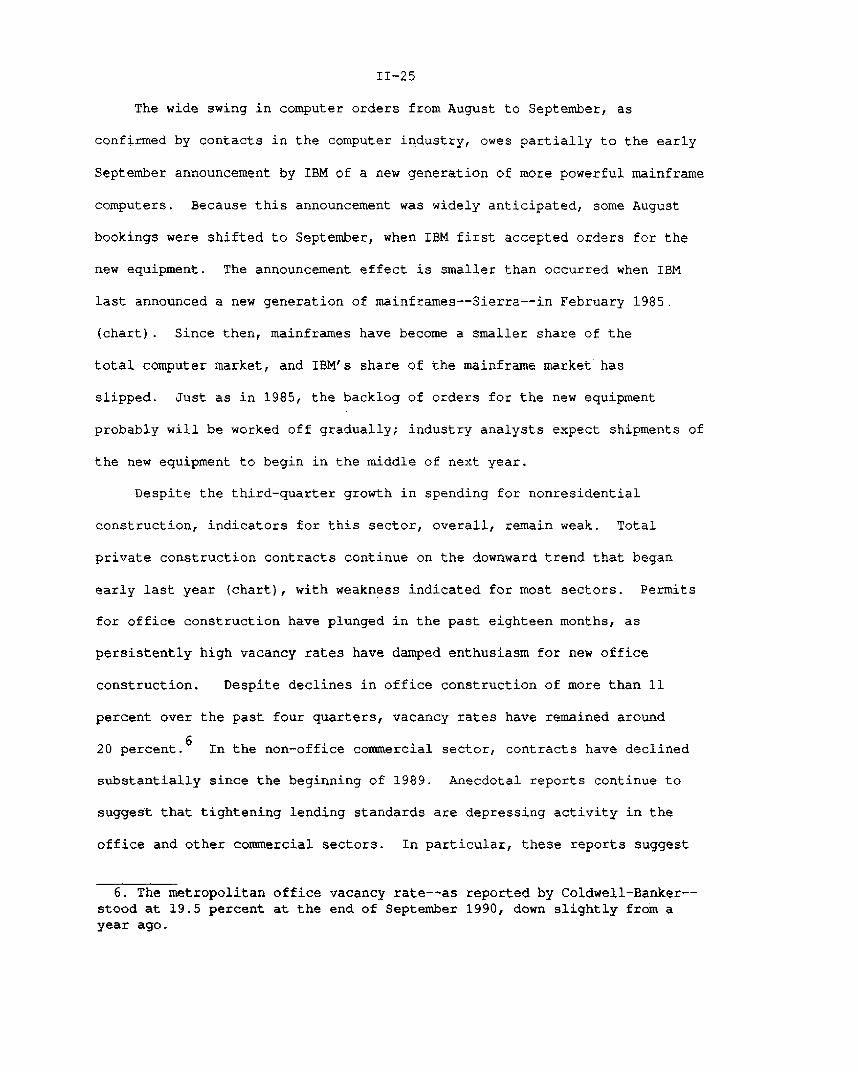
Personal Income and Consumption
The two leading surveys of consumer sentiment fell sharply again in
October (chart): The Conference Board's Consumer Confidence Index
registered its steepest one-month drop on record, putting the index at its
lowest level since early 1983. Similarly, the Michigan Survey Research
Center Index of Consumer Sentiment dropped another 9 index points to 63.9;
the decline in this index since July is its steepest three-month drop
ever and has taken the index to its lowest reading since 1982.
With the labor market soft and higher oil prices pushing up consumer
inflation, real disposable personal income fell 0.5 percent in August and
0.3 percent in September. The drop is likely to continue in October.
The declines in consumer sentiment and household income apparently had
only modest effects on spending through September. Real PCE rose
0.3 percent in September and was up at an annual rate of 3-1/2 percent for
the third quarter as a whole. Spending on household durables fell in August
and September, while outlays for apparel declined 2-1/2 percent in September
after posting noticeable increases over the preceding several months. In
contrast, consumption in September was supported by strong end-of-model year
purchases of cars and trucks, continued growth in consumption of non-energy
services, and a rise in spending on electricity.
One anomalous factor in the September increase in consumer spending is
that real PCE for gasoline is estimated to have edged up from pre-invasion
levels. Although data from earlier episodes suggest that demand for
gasoline responds to changes in price with an elasticity of -0.2 to -0.4, a

II-14
Consumer Attitudes and Real DPI
Index-- 130
Conference Board Index of Consumer Confidence
L IA - 110
VI - 100- ,] iI \
90
TI \ Michigan Survey Research Center Index of Consumer Sentiment 80
J. 70
60
S 50
I I I L I 401980 1981 1982 1983 1984 1985 1986 1987 1988 1989 1990
Real DPIPercent change, annual rate
12
10
8-6
4
2
+
-2
4
- -6
I I I I I I I1980 1981 1982 1983 1984 1985 1986 1987 1988 1989 1990
The base of the Michigan Index Is February 1966: the base of the Conference Board Index is the annual average for 1985. Bothindexes ae an average of five equally-weighted questions that relate to current and expected economic condillons. However, the
II-15
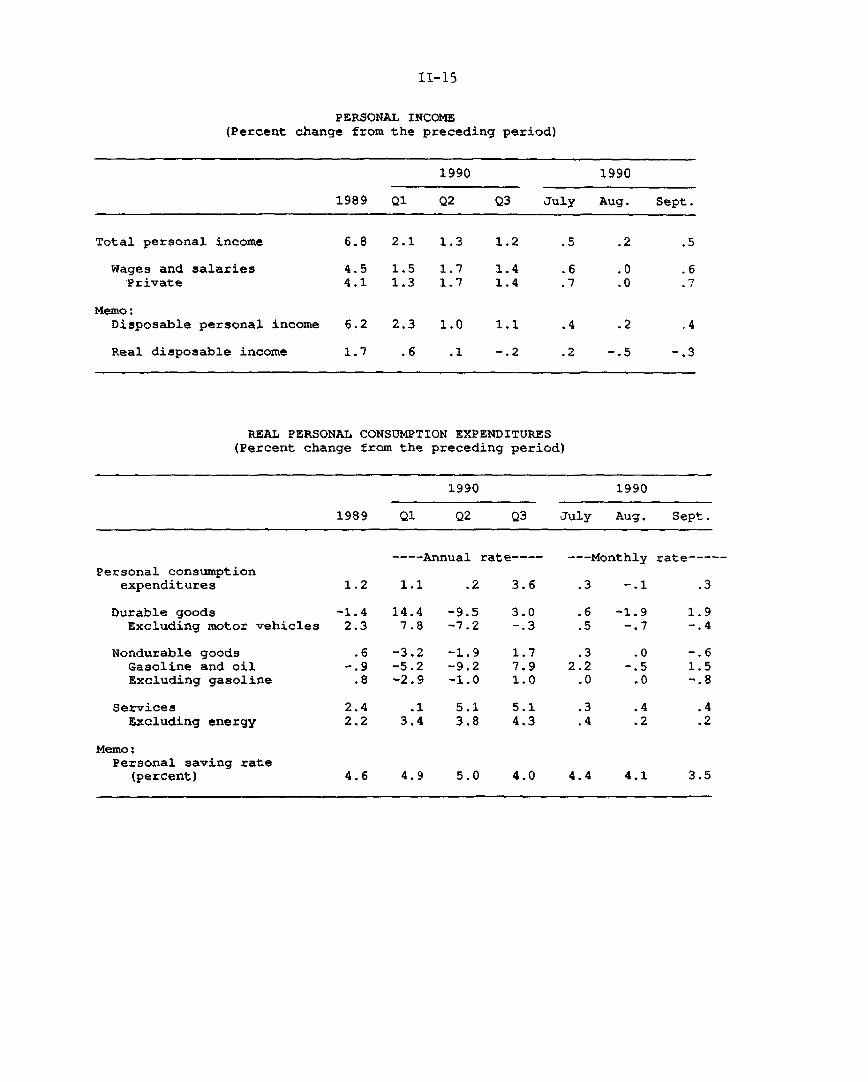
PERSONAL INCOME(Percent change from the preceding period)
1990 1990
1989 Q1 Q2 Q3 July Aug. Sept.
Total personal income 6.8 2.1 1.3 1.2 .5 .2 .5
Wages and salaries 4.5 1.5 1.7 1.4 .6 .0 .6Private 4.1 1.3 1.7 1.4 .7 .0 .7
Memo:Disposable personal income 6.2 2.3 1.0 1.1 .4 .2 .4
Real disposable income 1.7 .6 .1 -.2 .2 -.5 -.3
REAL PERSONAL CONSUMPTION EXPENDITURES(Percent change from the preceding period)
1990 1990
1989 Q1 Q2 Q3 July Aug. Sept.
Personal consumptionexpenditures
Durable goodsExcluding motor vehicles
Nondurable goodsGasoline and oilExcluding gasoline
ServicesExcluding energy
Memo:Personal saving rate
(percent)
---- Annual rate----
1.2 1.1
-1.4 14.42.3 7.8
.6 -3.2-. 9 -5.2
.8 -2.9
.2 3.6
-9.5 3.0-7.2 -. 3
-1.9-9.2-1.0
---Monthly rate-----
.3 -.1
.6 -1.9.5 -. 7
1.7 .3 .07.9 2.2 -.51.0 .0 .0
1.9-. 4
-. 61.5-.8
.1 5.1 5.13.4 3.8 4.3
4.6 4.9 5.0 4.0 4.4 4.1 3.5

II-16
SALES OF AUTOMOBILES AND LIGHT TRUCKS 1
(Millions of units at an annual rate; BEA seasonals)
1990 1990
1988 1989 Q1 Q2 Q3 Aug. Sep. Oct.
Autos and light trucks 15.44 14.51 14.40 13.97 14.18 13.76 14.47 13.53Autos 10.64 9.90 9.81 9.54 9.72 9.42 10.06 9.31Light trucks 4.80 4.61 4.59 4.43 4.47 4.34 4.41 4.23
Domestic total2 11.74 11.19 11.17 10.77 11.30 10.83 11.67 10.69Autos 7.54 7.08 7.02 6.80 7.21 6.91 7.60 6.91Light trucks 4.20 4.11 4.14 3.98 4.09 3.92 4.07 3.78
Import total 3.70 3.33 3.23 3.19 2.88 2.92 2.80 2.84Autos 3.10 2.82 2.78 2.74 2.51 2.51 2.46 2.39Light trucks 0.60 0.50 0.45 0.45 0.38 0.42 0.34 0.45
Note: Data on sales of trucks and imported autos for the current monthare preliminary and subject to revision.1. Components may not add to totals due to rounding.2. Includes vehicles produced in Canada and Mexico and vehicles made in
U.S. plants of foreign manufacturers.

II-17
short-term boost to the volume of gasoline purchases may have been provided
by gasoline stations or motorists seeking to increase their holdings of
gasoline in anticipation of further price increases or possible product
shortages. This explanation suggests that the recent strength in
gasoline demand may be temporary; if so, data for future months should show
some declines as the traditional response to higher prices emerges.
With consumption growth outpacing income growth, the personal saving
rate fell to 3.5 percent in September, the lowest monthly reading since
January 1988. Given the weak performance of stock and house prices as
well as the deterioration in consumer sentiment, the saving rate might have
been expected to move in the other direction. But households apparently
have resisted, at least initially, making major changes in their real
spending patterns in response to the sudden runup in their energy bills.
Autos and Light Trucks
Total sales of autos and light trucks averaged 13-1/2 million units
(annual rate) in October compared with an average sales pace of just over
14 million units during the first nine months of the year. Sales of light
trucks, particularly domestic models, weakened noticeably in October;
apparently, sales of vans and other less energy-efficient trucks have been
hurt by the rise in gasoline prices. Sales of imported cars also were down
again last month. In contrast, sales of domestic autos were surprisingly
well maintained at a 6.9 million unit rate in October. Although this sales
3. The BEA estimates the gasoline component of real PCE from data on thevolume of gasoline deliveries to retail outlets, which will include anybuilding or liquidation of gasoline inventories held at gasoline stations.The BEA does not adjust the Department of Energy data for gasoline consumedby business.

PRIVATE HOUSING ACTIVITY(Seasonally adjusted annual rates; millions of units)
1989 1990 1990
Annual Q1 Q2 Q3P July r Aug.r SepP
All unitsPermits 1.34 1.42 1.09 1.05 1.08 1.05 1.01Starts 1.38 1.45 1.20 1.14 1.15 1.14 1.14
Single-family unitsPermits .93 .96 .80 .76 .78 .76 .73Starts 1.00 1.08 .90 .86 .88 .84 .88
SalesNew homes .65 .59 .54 .53 .55 .54 .50Existing homes 3.44 3.44 3.32 3.35 3.33 3.50 3.22
Multifamily unitsPermits .41 .47 .29 .29 .30 .29 .27Starts .37 .37 .31 .28 .28 .30 .26
Vacancy rate l
Rental units 9.3 9.4 8.5 9.5 n.a. n.a. n.a.Owned units 7.1 7.6 7.9 6.6 n.a. n.a. n.a.
1. Percent. Owned units consist mainly of condominiums. All vacancyrate
Pdata are revised.Preliminary. r Revised estimates. n.a. Not available.
PRIVATE HOUSING STARTS(Seasonally adjusted annual rate)
Millions of units
1981 1982 1983 1984 1985 1986 1987 1988 1989 1990

II-19
rate is markedly lower than the elevated pace a month earlier, it is little
4different than the rate that prevailed earlier in the year.
Incentive programs, which have been in place since the late spring,
still seem to be playing an important role in supporting sales of motor
vehicles. For instance, when Ford attempted in September to reduce sales
incentives, its sales dropped off sharply, and the company subsequently
reinstituted its discounts. At the same time, the incentive programs
sponsored by General Motors and Chrysler have remained in place. 5
As of the end of October, auto dealers were not holding excessive
inventories, overall, relative to the recent sales rate. Nonetheless,
dealers reportedly have been quite cautious in placing orders, and that
caution was a factor in the recent decision by GM to pare assembly schedules
over the next few months. The company apparently is hoping to prevent the
type of large inventory run-up that historically has plagued the company
during periods of general economic weakening.
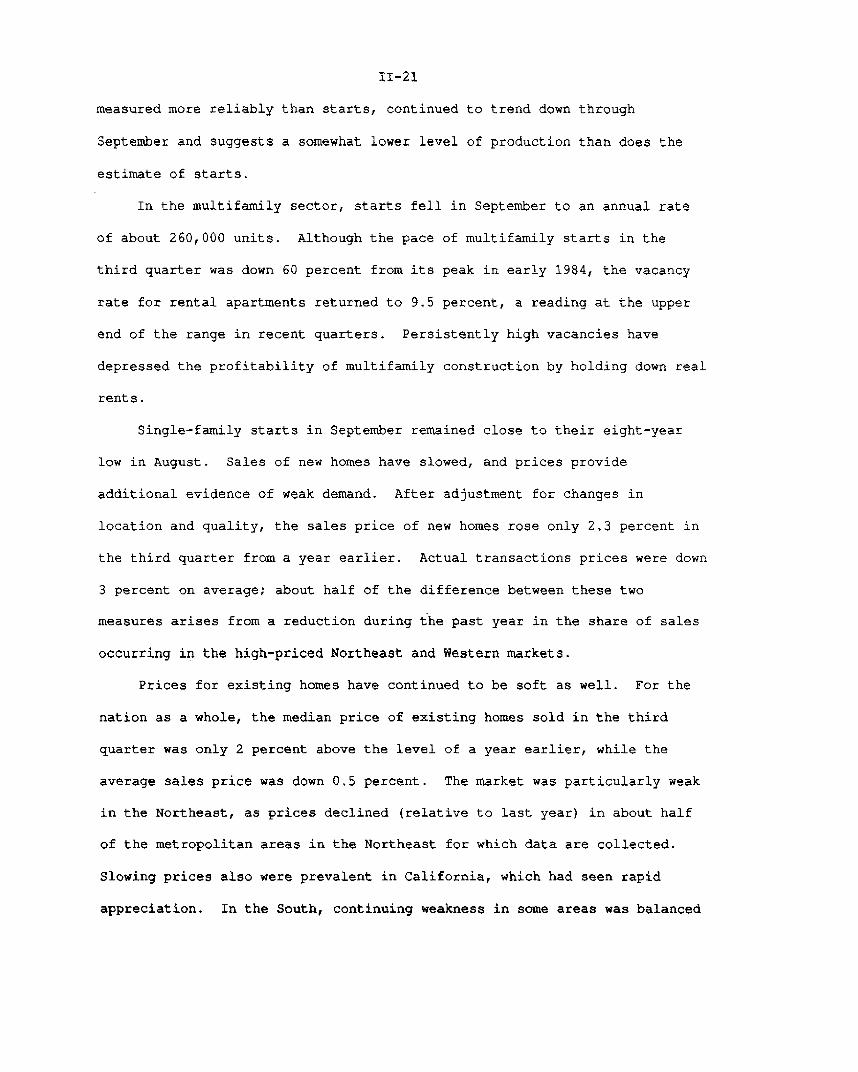
Housing Markets
Residential construction activity remained weak in September. Total
private housing starts were about unchanged at a 1.14 million unit annual
rate, the lowest monthly reading since August 1982. Starts of multifamily
units fell in September, but a rise in single-family starts interrupted the
decline of the preceding six months. Issuance of building permits, which is
4. The most important of the transitory factors that contributed to theSeptember surge was the over-compensation by BEA in its adjustment of itsseasonal factor for the lack of new clearance sales. A second factor wasthat manufacturers apparently were successful in shifting forward fleetsales, which typically occur in the fourth quarter.5. Ford has reinstated a $1,500 customer cash rebate on 1990 Lincoln Town
Car, Continental, and Mark VII. It also has increased its customer rebatefrom $500 to $750 on 1991 Taurus, Thunderbird, Sable, Cougar, and GrandMarquis, and to $1,000 on Ford Ranger trucks.

II-20
MEDIAN PRICE OF EXISTING HOMES SOLD IN SELECTED METROPOLITAN STATISTICAL AREAS(Percent change from a year earlier)
1989 19901988 1989 Q4 Q1 Q2 Q3
SouthAtlanta n.a. n.a. 5.6 6.2 3.3 2.5
Dallas .0 1.8 6.0 .0 -.4 -4.2
Houston -6.2 7.9 10.2 12.4 3.9 1.8
Jacksonsville 4.0 2.4 4.3 7.0 7.7 4.2
Memphis 1.7 2.4 6.2 1.2 .1 0.8
New Orleans n.a. -3.4 1.8 -1.0 -3.2 -5.5
Oklahoma City -9.8 -4.8 .7 -3.3 3.4 -0.9
Washington, D.C. 16.0 9.0 12.7 .7 7.4 3.4
NortheastBoston 2.3 .4 .4 .6 -5.4 -4.0
Buffalo 15.7 10.5 12.2 12.5 8.1 3.5
Hartford 6.5 -1.0 -. 5 -5.1 -3.5 -5.4
New York City .2 -. 3 -. 3 -4.4 -6.2 -3.8
Philadelphia 5.6 1.5 6.2 -1.0 10.9 10.7
Providence 7.6 -.3 -3.5 -1.4 -.3 -1.7
WestDenver -8,0 4.5 9.1 8.9 4.6 -.8
Los Angeles 21.5 19.3 13.6 8.0 -.5 -4.7
Phoenix -1.1 -1.5 -2.6 4.8 2.2 11.7
Portland .3 8.9 12.5 12.2 15.8 14.6
Salt Lake City -2.5 2.5 1.8 2.2 -1.0 1.0
San Francisco 24.1 22,4 12.1 7.5 -1.1 -3.1
Seattle 7.4 29.7 37.2 36.5 35.3 24.9
MidwestChicago 8.9 8.2 11.1 12.8 11.0 9.5
Cincinnati 5.5 8.8 6.6 6.7 6.3 5.3
Cleveland 1.6 8.7 7.1 11.1 7.0 7.7
Detroit 11.4 .8 .3 6.5 6.6 3.1
Indianapolis 5.8 7.7 8.4 7,7 16.1 4.1
Kansas City 1.0 1.6 2.3 .1 .8 9.4
Minneapolis 5.8 2.4 1.3 2,2 3.8 .5
St. Louis 5.1 -1.5 1.6 .8 8.9 5.6
n.a.--not availableSource: National Association of Realtors
II-21
measured more reliably than starts, continued to trend down through
September and suggests a somewhat lower level of production than does the
estimate of starts.
In the multifamily sector, starts fell in September to an annual rate
of about 260,000 units. Although the pace of multifamily starts in the
third quarter was down 60 percent from its peak in early 1984, the vacancy
rate for rental apartments returned to 9.5 percent, a reading at the upper
end of the range in recent quarters. Persistently high vacancies have
depressed the profitability of multifamily construction by holding down real
rents.
Single-family starts in September remained close to their eight-year
low in August. Sales of new homes have slowed, and prices provide
additional evidence of weak demand. After adjustment for changes in
location and quality, the sales price of new homes rose only 2.3 percent in
the third quarter from a year earlier. Actual transactions prices were down
3 percent on average; about half of the difference between these two
measures arises from a reduction during the past year in the share of sales
occurring in the high-priced Northeast and Western markets.
Prices for existing homes have continued to be soft as well. For the
nation as a whole, the median price of existing homes sold in the third
quarter was only 2 percent above the level of a year earlier, while the
average sales price was down 0.5 percent. The market was particularly weak
in the Northeast, as prices declined (relative to last year) in about half
of the metropolitan areas in the Northeast for which data are collected.
Slowing prices also were prevalent in California, which had seen rapid
appreciation. In the South, continuing weakness in some areas was balanced
II-22
BUSINESS CAPITAL SPENDING INDICATORS(Percentage change from preceding comparable periods;
based on seasonally adjusted data)
1990 1990
Q1 Q2 Q3 July Aug. Sept.
Producers' durable equipment
Shipments of nondefense capital goods 4.8 -.9 1.1 -4.2 4.6 -.3Excluding aircraft and parts 2.8 -1.5 -.7 -4.4 4.0 .1
Office and computing 4.0 -1.0 -1.6 -8.0 3.7 3.9All other categories 2.5 -1.6 --5 -3.5 4.1 -.7
Weighted PDE shipments 1 2.4 -1.4 .0 -2.4 2.9 -.1
Shipments of complete aircraft2 124,8 -14.3 n.a. -10.1 23.0 n.a.
Sales of heavy-weight trucks -.1 -5.9 6.4 10.5 -8.1 -1.9
Orders of nondefense capital goods -3.3 -5.8 5.0 10.1 -10.0 7.0Excluding aircraft and parts .5 -1.4 .7 2.7 -3.4 3.1Office and computing 1.8 -1.2 5.0 10.7 -15.4 26.1All other categories .3 -1.5 -.4 .9 -.3 -2.0
Weighted PDE orders i .1 -.7 .4 1.6 -2.1 2.2
Nonresidential structures
Construction put-in-place 1.0 -.5 1.2 3.3 -3.6 -1.6Office -4.0 -3.8 1.6 .3 -3.6 .1Other commercial -1.5 -3.5 -2.9 1.5 -2.5 -7.6Public utilities 2.2 -.5 .0 -.2 .1 1.1Industrial 8.2 .7 3.1 16.0 -14.1 -.6All other 2.5 4.9 4.6 2.6 -.4 -.5
Rotary drilling rigs in use 2.3 21.6 -6.0 -4.3 -8.5 .9
Footage drilled 3 -1.1 -1.2 n.a. .1 3.1 n.a.
1. Computed as the weighted sum of 25 individual equipment series(excluding aircraft) from the Census M-3 report with weights equal tothe fraction of final business spending for each type of equipment.
2. From the Current Industrial Report (CIR) titled Civil Aircraftand Aircraft Engines. Seasonally adjusted with BEA seasonal factors.To estimate PDE spending for aircraft, BEA uses the aircraft shipmentsshown in that report, not the corresponding Census M-3 series. The CIRdoes not provide information on aircraft orders.
3. From Department of Energy. Not seasonally adjusted.n.a. Not available.

II-23
by robust increases in others, while fairly brisk increases continued
throughout most of the Midwest.
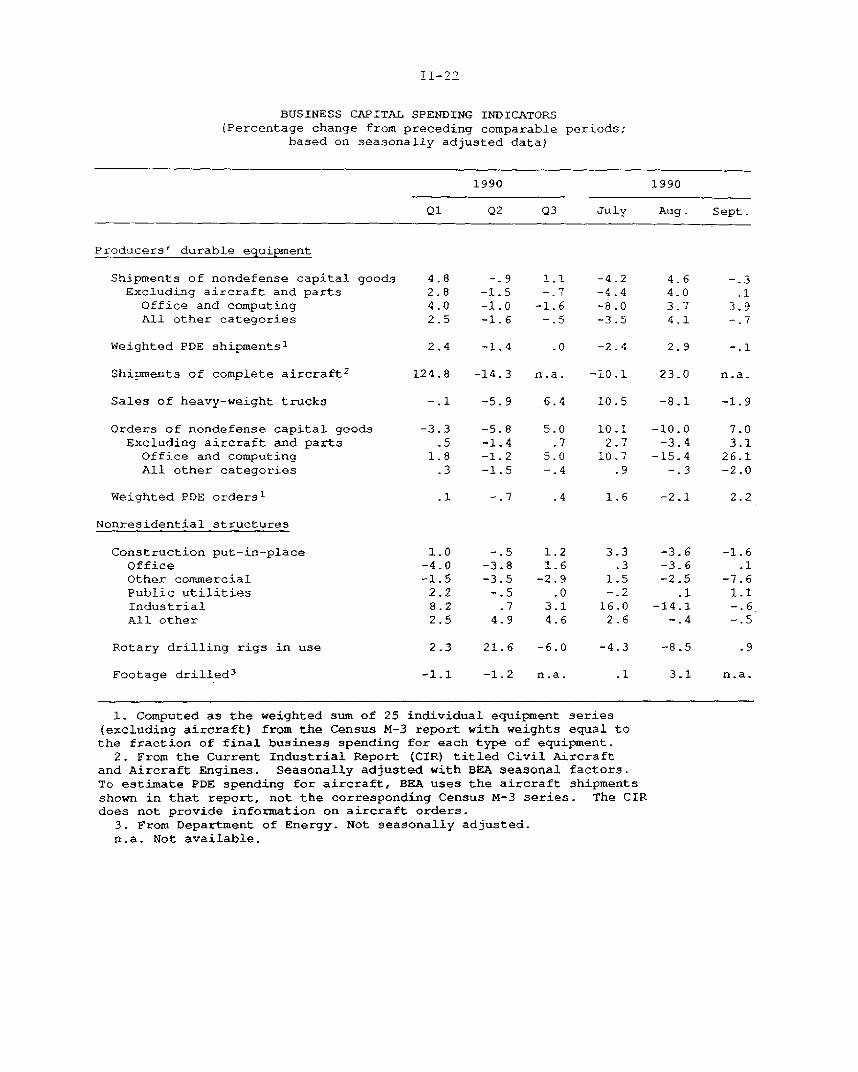
Business Fixed Investment
Real business fixed investment rebounded strongly in the third quarter,
but the pickup likely reflected special factors rather than a fundamental
strengthening of demand. Most of the gain was the result of a bulge in
shipments of aircraft to domestic carriers and in business purchases of
motor vehicles, which brought the overall rise in real equipment spending to
8-1/4 percent (annual rate). At the same time, however, real spending for
computers grew just 1/2 percent, the smallest increase since the end of
1988. Real outlays for nonresidential structures were estimated by the BEA
to have advanced at 5 percent last quarter, after a 9 percent drop in the
second quarter. The September data for construction put-in-place, released
after BEA's advance estimate of GNP, imply about a $1 billion downward
revision to real nonresidential structures in the third quarter, lowering
the increase to less than 2 percent (annual rate). Given the overall signs
of weakness in construction, this rise seems rather anomalous and is likely
to be reversed.
Looking ahead, recent orders for nondefense capital goods are
consistent with near-term declines in equipment spending. Although orders
outside the aircraft group rose 3.1 percent in September (not at an annual
rate) and 0.7 percent for the third quarter as a whole, a pickup in computer
orders more than accounts for these increases. Excluding both aircraft and
computers, orders have trended down since the beginning of the year (chart),
and point to a decline in current-quarter shipments of equipment.

II-24
RECENT DATA ON ORDERS AND SHIPMENTS(three-month moving average)
Office and Computing Equipment
- Orders- --- Shipments
1985 1986 1987 1988
Other Nondefense Capital Goods (exd. aircraft and computers)
Orders----- Shipments
1989 1990
Billions of dollars
September
.1
I I I I Ii i 1t 111tiIlii •I l111111989 19901987 19881985 1986
II-25
The wide swing in computer orders from August to September, as
confirmed by contacts in the computer industry, owes partially to the early
September announcement by IBM of a new generation of more powerful mainframe
computers. Because this announcement was widely anticipated, some August
bookings were shifted to September, when IBM first accepted orders for the
new equipment. The announcement effect is smaller than occurred when IBM
last announced a new generation of mainframes--Sierra--in February 1985
(chart). Since then, mainframes have become a smaller share of the
total computer market, and IBM's share of the mainframe market has
slipped. Just as in 1985, the backlog of orders for the new equipment
probably will be worked off gradually; industry analysts expect shipments of
the new equipment to begin in the middle of next year.
Despite the third-quarter growth in spending for nonresidential
construction, indicators for this sector, overall, remain weak. Total
private construction contracts continue on the downward trend that began
early last year (chart), with weakness indicated for most sectors. Permits
for office construction have plunged in the past eighteen months, as
persistently high vacancy rates have damped enthusiasm for new office
construction. Despite declines in office construction of more than 11
percent over the past four quarters, vacancy rates have remained around
20 percent. 6 In the non-office commercial sector, contracts have declined
substantially since the beginning of 1989. Anecdotal reports continue to
suggest that tightening lending standards are depressing activity in the
office and other commercial sectors. In particular, these reports suggest
6. The metropolitan office vacancy rate--as reported by Coldwell-Banker--stood at 19.5 percent at the end of September 1990, down slightly from ayear ago.

II-26
NONRESIDENTIAL CONSTRUCTION AND SELECTED INDICATORS*(Index, Dec. 1982 = 100, ratio scale)
Total Building
Construction (C)------ Permits (P), Contracts (CN), or
New commitments (NC)
1980 1982 1984 1986 1988 1990
Office
rOther Commercial
(P)I II I
JJLLLWW1984 1986 1988 1990
Industrial
(NC) -,
I I 1 1 1 / 1 ->
(C)
1984 1986 1988 1990
Institutional
1984 1986 1988 1990 1984 1986 1988 1990
Six-month moving averae for al serles shown. For contracts, total only incudes private, whie indlvrual sectors include pdvate and public.New comritments am the sum of pemts and contracts.
I.

II-27
that insurance companies--following thrifts and banks--now are beginning to
cut back on real estate lending. Although industrial construction has been
an area of strength in the last two years, new commitments for industrial
construction also have trended down since early last year. Given the lags
involved, this decline has not yet generated corresponding decreases in
industrial construction.
Oil and gas drilling activity has been about flat despite the
increase in oil prices since the summer. Although rigs in use increased
1 percent in September, they declined more than 4 percent in the first four
weeks of October. Apparently, uncertainty among drillers about the long-run
price of oil--as well as shortages of skilled labor--have deterred any rapid
expansion of drilling activity.
Business Inventories
Businesses have continued to keep a tight rein on their inventories in
the current environment of slowing demand. Outside of petroleum-related
businesses, available third-quarter data show that inventory-sales ratios in
major sectors have either remained flat or continued their moderate
downtrends (chart).
In manufacturing, inventory investment remained modest through late
summer. Excluding the petroleum refining industry, factory stocks rose only
$8 billion (current cost) at an annual rate in August and September,
compared with a $29.5 billion buildup in July. In current-cost terms,
inventories held by petroleum refineries rose at an annual rate of
$11.7 billion in August and September. Much of this current-cost increase,
however, reflects higher petroleum prices since the Iraqi invasion of
Kuwait. Inventories of transportation equipment, which had contributed

II-28
CHANGES IN MANUFACTURING AND TRADE INVENTORIES(Billions of dollars at annual rates;based on seasonally adjusted data)
1990 1990
Q1 Q2 Q3 July Aug. Sept.
Current-cost basis:
Total -7.0 11.2 n.a. 68.2 56.4 n.a.
Total excluding retail auto 9.1 9.8 n.a. 50.6 14.7 n.a.Manufacturing 2.7 -4.2 23.3 31.1 12.2 26.8Wholesale 2.2 7.6 10.1 14.5 6.4 9.3Retail -11.8 7.8 n.a. 22.6 37.8 n.a.Automotive -16.1 1.4 n.a. 17.6 41.7 n.a.Excluding auto 4.3 6.5 n.a. 5.0 -3.9 n.a.
Constant-dollar basis:
Total -25.0 6.2 n.a. 42.7 -9.8 n.a.Total excluding retail auto -2.4 3.3 n.a. 35.8 -13.8 n.a.Manufacturing 1.7 -2.6 n.a. 22.1 -6.8 n.a.
Wholesale -1.1 1.2 n.a. 11.4 2.5 n.a.Retail -25.6 7.6 n.a. 9.2 -5.5 n.a.
Automotive -22.6 2.8 n.a. 6.9 4.1 n.a.Excluding auto -3.0 4.8 n.a. 2.3 -9.6 n.a.
INVENTORIES RELATIVE TO SALES 1
(Months supply; based on seasonally adjusted data)
1990 1990
Q1 Q2 Q3 July Aug. Sept.
Range in
preceding 12 months:2
Low High
Current-cost basis:
Total 1.46 1.51 1.48 1.48 n.a. 1.48 1.46 n.a.
Total excluding retail auto 1.43 1.49 1.46 1.45 n.a. 1.46 1.43 n.a.
Manufacturing 1.52 1.65 1.60 1.56 1.55 1.57 1.52 1.54
Wholesale 1.24 1.27 1.25 1.25 1.26 1.26 1.24 1.27
Retail 1.55 1.62 1.55 1.58 n.a. 1.57 1.60 n.a.
Automotive 1.81 2.12 1.84 1.92 n.a. 1.93 2.12 n.a.
Excluding auto 1.46 1.50 1.48 1.49 n.a. 1.48 1.47 n.a.
Constant-dollar basis:
Total 1.42 1.46 1.44 1.43 n.a. 1.44 1.42 n.a.
Total excluding retail auto 1.39 1.45 1.42 1.41 n.a. 1.42 1.39 n.a.
Manufacturing 1.44 1.54 1.50 1.47 n.a. 1.48 1.44 n.a.
Wholesale 1.26 1.29 1.28 1.27 n.a. 1.28 1.26 n.a.
Retail 1.51 1.58 1.51 1.55 n.a. 1.54 1.56 n.a.
Automotive 1.72 2.04 1.73 1.82 n.a. 1.81 1.90 n.a.
Excluding auto 1.44 1.49 1.46 1.48 n.a. 1.47 1.47 n.a.
1. Ratio of end of period inventories to average monthly sales for the period.
2. Highs and lows are specific to each series and are not necessarily
coincidential. Range is for the 12-month period preceding the latest month for

II-29
RATIO OF INVENTORIES TO SALES(Current-cost data)
Manufacturing RaRatio
2.1
1.9
R
Total
1.7
ept.
Excluding transportation equipment %" 1.5s,
1.3I I I I I I I I i I I L 1.31979 1981 1983 1985 1987 1989
WholesaleRatio
1.5
-1.4
1979 1981 1983 1985 1987 1989
RetailRatio- 1.7
Total Aug.
Excluding autoS. - 1.4
1983 1985 19871979 1981 1989

II-30
significantly to the volatility in manufacturing inventories in earlier
months, showed small net declines in August and September.
In the trade sector, inventory changes at businesses other than retail
auto dealers and wholesale petroleum distributors also have been moderate.
The nonpetroleum wholesale inventory accumulation in the third quarter, a
net change of $8 billion at an annual rate, was concentrated in machinery,
but was about the same as the pace in the second quarter. Nonauto retail
stocks as a whole showed little net accumulation in July and August, after
buildups that averaged $6.5 billion at an annual rate from April to June.
At retail establishments that carry largely discretionary consumption goods
(general merchandise, apparel, and furniture and appliances), no excessive
inventory buildups were reported through August. The stock-sales ratios for
stores in the G.A.F. grouping remained well within the range observed over
the past three years. Anecdotal evidence suggests that in recent months,
although most retailers considered their current inventory levels
satisfactory, some had begun to trim their stocks because of deteriorating
consumer confidence and the uncertain sales outlook.
Federal Government Sector
The FY1991 reconciliation bill was signed on November 5 and implements
major elements of the FY1991 budget that were negotiated by Congress and the
administration. The bill calls for changes to tax laws and to mandatory
spending rules, substantial revisions to the Gramm-Rudman-Hollings law, and
increases in the debt limit to $4.073 trillion, a level that the Treasury
estimates will be sufficient until May 1993. FY1991 appropriations bills
that are consistent with the discretionary spending caps of the Budget
Resolution also have been passed and signed by the President. This

II-31
legislation contains about the same amount of savings as the September 30
Budget Summit agreement. However, it relies less on cuts in Medicare
outlays and gasoline tax increases; instead it raised the wage ceiling for
Medicare contributions further and contained larger increases in personal
income taxes. Other elements of the bill closely parallel the Budget Summit
agreement. 7
Cuts in budget outlays, mainly in the 1993 to 1995 period, account for
more than two-thirds of the deficit-reducing actions included in the
October 27 package; these cuts total $22 billion in FY1991 and cumulate to
$345 billion over five years, measured relative to the OMB baseline.
Discretionary spending programs will be reduced $10 billion in FY1991 and a
total of $182 billion over five years. Between FY1991 and FY1993, the cuts
in discretionary spending all are slated to come from national defense; in
FY1994 and FY1995, the reductions can be made in any type of discretionary
spending. If those cuts also were made exclusively in defense, real defense
spending would fall about 4 percent per year while nondefense discretionary
spending would grow at the rate of inflation. Cuts in entitlements and
other mandatory spending programs along with user fee increases amount to
$10 billion in FY1991 and $98 billion over the five years covered by the
accord. By restraining the growth of federal debt, the deficit-reduction
7. As before, the budget does not include the cost of Operation DesertShield, which will be funded separately through a supplemental spendingbill. In September, OMB estimated that Operation Desert Shield would addabout $6 billion to FY1991 outlays, assuming no hostilities. (It is unclearwhether the estimate includes increases in force levels that have recentlybeen discussed in the press.)8. After FY1993, even larger cuts in defense could fund some discretionary
nondefense spending increases in FY1994 and FY1995.

II-32
FY1991 BUDGET PACKAGE--CHANGES FROM OMB BASELINE1
(Billions of dollars, fiscal years)
TotalCategory 1991 1992 1993 1994 1995 1991-95
Outlays 22 46 68 96 115 345Defense 10 23 35Nondefense discretionary 0 0 0 53 62 182International 0 0 0Mandatory and fees 10 17 20 24 27 98Interest 2 7 12 18 26 64
Receipts 2 18 30 28 32 31 139Personal 3 7 2 5 4 22Corporate 2 1 1 1 0 4Social insurance 3 9 9 10 10 41Excise 10 13 15 15 16 69Other 0 0 1 1 1 2
Deficit reduction 40 76 96 128 146 484
OMB September baseline deficit 295 309 228 116 84Post-policy deficits--consolidated 255 233 132 -12 -62--excluding deposit insurance 158 153 113 42 -17
1. Based on preliminary estimates by OMB. Excludes IRS enforcement initiative($3 billion in FY1991 and $9 billion over five years).
2. Stabilization payroll deposit rules increases personal income taxes$1 billion in FY1991 and $2 billion in FY1992 and reduces them $3 billion in FY1993.

II-33
package reduces expected net interest outlays $64 billion over the five
years.
Net receipts are expected to increase $18 billion in FY1991 and
$139 billion over five years. Excise taxes account for about half of the
increase. Personal income taxes are increased $22 billion over five years;
$40 billion of tax increases on upper income groups is partially offset by
an expansion of low income tax credits estimated to be worth $18 billion.
The boost to payroll taxes is estimated at $3 billion in FY1991; it grows to
$9 billion in FY1992 as the full-year effects are felt.
The Gramm-Rudman-Hollings revisions establish three distinct sequester
mechanisms. First, the revised law establishes caps for discretionary
spending. For FY1992 and FY1993 there are separate caps for domestic,
international, and defense discretionary spending; in FY1994 and 1995 there
is a single cap for total discretionary spending. If new legislation drives
spending above the discretionary caps, all programs within the category will
be cut equally to meet the target. The caps are to be adjusted for changes
in economic and technical assumptions. Second, mandatory spending and taxes
are put on a pay-as-you-go basis, under which any increase in entitlements
or decrease in revenues must be balanced by other spending reductions or
revenue increases. Third, in FY1994 and FY1995 violation of the deficit
target may trigger a sequester. This sequester would be across the board as
specified in the earlier Gramm-Rudman-Hollings rules. The deficit targets
for all years will be adjusted for economic and technical assumptions in
FY1992 and FY1993 and may be adjusted similarly in FY1994 and FY1995 at the
Administration's option.
II-34
FEDERAL GOVERNMENT OUTLAYS AND RECEIPTS(Billions of dollars,
except where otherwise noted)
Net PercentFY1989 FY1990 change change
OutlaysDeposit insurance
Outlays, excludingdeposit insuranceNational defenseNet interestSocial SecurityMedicare and healthIncome securityAgricultureOther
ReceiptsPersonal income taxesSocial insurancecontributions
Corporate income taxesOther
Deficit(+)
1144.022.1
1121.9303.6169.1232.5133.4136.0
16.9130.4
1251.958.3
1193.6299.3183.8248.6155.8148.3
12.0145.8
990.7 1031.5445.7 466.9
359.4103.3
82.3
153.3
380.093.591.1
220.4
Details made not add due to rounding.
107.936.2
71.7-4.314.716.122.412.3-4.915.4
40.821.2
20.6-9.8
8.8
67.1
9.4163.8
6.4-1.4
8.76.9
16.89.0
-29.011.8
4.14.8
5.7-9.510.7
43.8

II-35
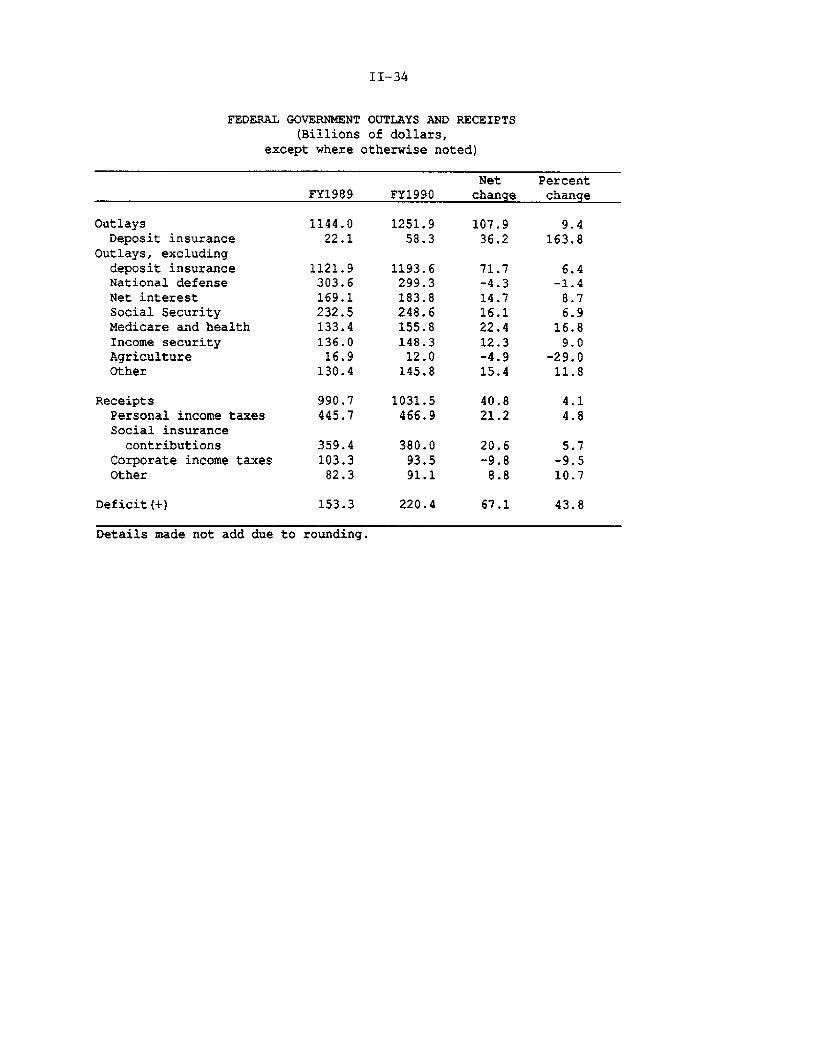
In September, the federal government recorded a $21 billion budget
surplus, bringing the deficit for FY1990 to $220 billion, essentially
matching the record deficit in FY1986 and $67 billion higher than the FY1989
deficit. About half of the increase in the deficit can be attributed to
higher deposit insurance outlays, which, on net, totaled $58 billion in
FY1990 compared with $22 billion a year earlier. Outside of deposit
insurance, the principal areas of outlay growth were net interest payments
and the major entitlement programs--social security, Medicare, income
security (federal employee retirement programs and low income programs), and
health (largely Medicaid)--that are driven by larger caseloads, cost-of-
living adjustments, and rising health care costs.
Defense and agriculture were the two primary areas in which spending
declined. National defense spending edged down $4 billion in FY1990 from
its peak in FY1989, and in real terms declined significantly. According to
a statement issued by the Administration, Operation Desert Shield added
$1.2 billion to defense spending; however, this was more than offset by a
moratorium on military construction and delays in other spending.
Agriculture spending came in at $12 billion, the lowest total since 1981.
Receipts were $1,031 billion, only 4 percent above a year earlier. A
major factor of the slow growth in receipts was the decline in corporate
profits tax collections from $103 billion in FY1989 to $93 billion in
FY1990. Also, personal income tax receipts grew only 4-3/4 percent, in part
because the unusually strong final payments on 1988 liabilities did not
recur. Social insurance taxes grew 5-3/4 percent, reflecting in part the
final increase (scheduled in the 1983 Social Security Amendments) in the
social security tax rate to 15.3 percent.

II-36
STATE GENERAL(Percent Change,
FUND SPENDINGFiscal Year 1990)
E l planned
3 actual
Total Education Education Medicaid CorrectionsK-12 Higher
Source: Naional Conference of State Legilatures. The Indvdual categodes shawn hererepresent about 50 percent of all geneal fund spending.

II-37
On an NIA basis, real federal government purchases of goods and
services, excluding CCC, were about unchanged in the third quarter.
Operation Desert Shield has had mixed effects on purchases because the
increased spending for this operation has been accompanied by reduced
spending in less critical areas. Defense purchases in the third quarter
were reduced by sales of defense inventories to Saudi Arabia, which boosted
net exports by an equal amount. The slight drop in nondefense purchases
reflects, among other things, the layoff of temporary census workers.
State and Local Government Sector
Real purchases by state and local governments rose at a 2.5 percent
annual rate in the third quarter, after a 0.6 percent drop during the
spring. The rise in the third quarter reflected a 7.0 percent jump (monthly
rate) in real construction spending in August, the largest monthly increase
in more than a year and a half. More recent data, available after the NIA
publication date, confirm the rise in August but show a slightly larger
decline in September than that assumed by BEA. State and local employment
continued to expand during the third quarter, but at a slower rate than
during the first half of the year. The rise in purchases was nearly matched
by an increase in indirect business tax collections, owing largely to a hike
in the general sales tax in New Jersey in July; the deficit of operating and
capital accounts is estimated to have edged down to about $28 billion.
Budgetary shortfalls are likely to continue to be widespread in fiscal
1991. Reports from many states indicate that revenues are coming in below
projections. In Massachusetts, receipts so far are not only below
projection but also below actual collections last year. A few states are
responding by cutting back outlays, but most appear to be deferring action
II-38
RECENT CHANGES IN CONSUMER PRICES
(Percentage change; based on seasonally adjusted data) 1
Relative 1990 1990importanceDec. 1989 1988 1989 Q1 Q2 Q3 Aug. Sept.
------ Annual rate----- -Monthly rate-
All items 2 100.0 4.4 4.6 8.5 3.5 7.9 .8 .8Food 16.3 5.2 5.6 11.4 2.1 3.7 .3 .2Energy 7.4 .5 5.1 14.8 -2.0 42.7 4.3 5.6All items less food
and energy 76.3 4.7 4.4 7.5 3.9 5.7 .5 .3Commodities 25.2 4.0 2.7 7.8 .7 2.9 .0 .4Services 51.1 5.0 5.3 7.2 5.5 7.2 .8 .3
Memorandum:
CPI-W3 100.0 4.4 4.5 8.3 3.2 8.0 .8 .8
Changes are from final monthOfficial index for all urbanIndex for urban wage earners
of preceding period toconsumers.and clerical workers.
final month of period indicated.
RECENT CHANGES IN PRODUCER PRICES(Percentage change; based on seasonally adjusted data)
1
Relative 1990 1990importanceDec. 1989 1988 1989 Q1 Q2 Q3 Aug. Sept.
------ Annual rate----- -Monthly rate-
Finished goods 100.0 4.0 4.9 7.1 .3 11.7 1.3 1.6Consumer foods 25.9 5.7 5.2 10.6 -2.9 -. 3 .8 -. 9Consumer energy 9.2 -3.6 9.5 24.7 -14.3 137.4 9.5 13.8Other finished goods 64.9 4.3 4.2 3.6 3.9 3.5 .3 .6
Consumer goods 39.5 4.8 4.4 3.5 5.1 2.5 .2 .6
Capital equipment 25.4 3.6 3.8 4.0 1.7 6.0 .3 .8
Intermediate materials2 94.9 5.3 2.5 2.5 -1.1 14.2 1.5 1.9
Excluding food and energy 82.5 7.2 .9 1.0 .7 4.0 .3 .6
Crude food materials 41.9 14.2 2.8 9.1 -11.5 -6.6 -.9 -1.8
Crude energy 40.5 -9.5 17.9 .5 -38.9 293.7 25.5 12.4
Other crude materials 17.5 7.5 -3.6 4.0 10.9 10.9 1.8 -.1
1. Changes are from final month of preceding
2. Excludes materials for food manufacturingperiod to final month of period indicated.and animal feeds.

II-39
until after the elections. On the expenditure side, general fund outlays
are projected to rise 6.4 percent during fiscal 1991, according to the
National Conference of State Legislatures. The same advance was forecast
last year when actual spending increased about 9.5 percent (chart).
Continuing pressure for expansion of education, corrections, and health
services could result in unplanned spending again this year.
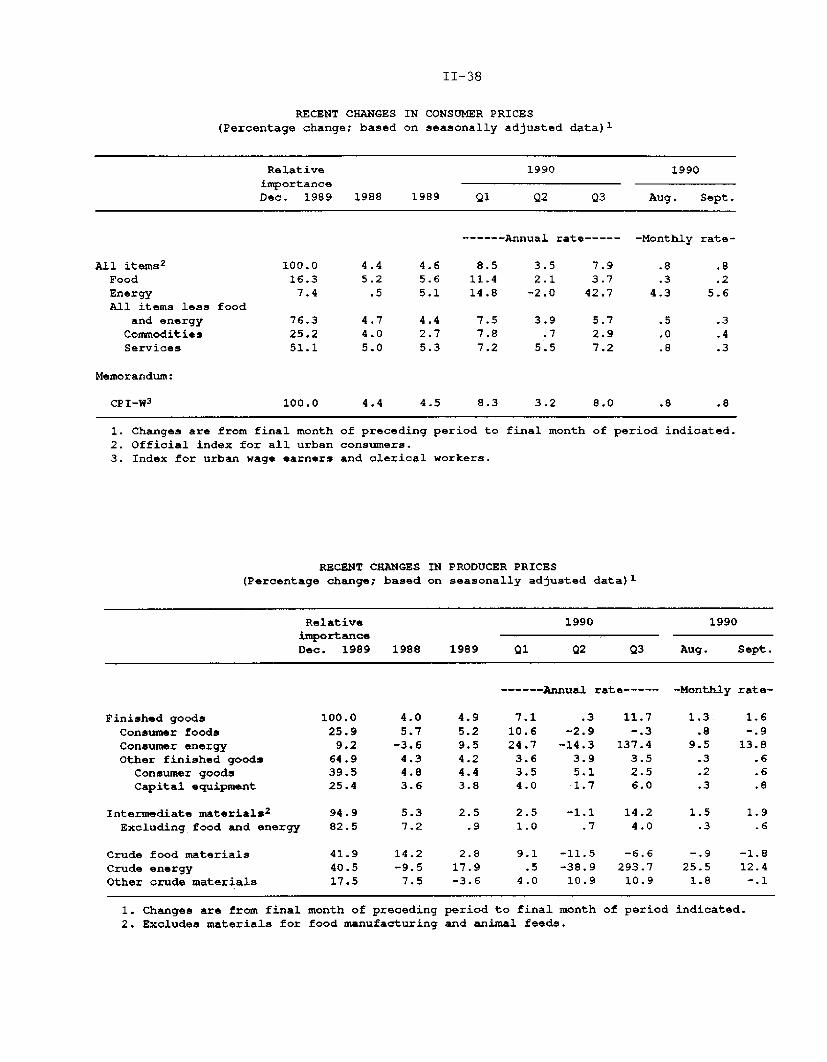
Prices
Climbing petroleum costs continued to boost producer and retail prices
in September. The CPI rose 0.8 percent in September, the same as in August,
while the PPI for finished goods was up 1.6 percent, even more than in the
preceding month.
Outside the food and energy areas, the CPI rose 0.3 percent in
September. The increase in nonenergy service prices moved back down to
0.3 percent, after three months of large increases. This easing mainly
reflected a slowdown in two components that had posted sizable jumps in
earlier months: owners' equivalent rent and lodging while out of town. At
the same time, some spillover effects of the climb in crude oil prices began
to show up, as airfares and other public intercity transport costs increased
about 2 percent. The CPI for nonfood, nonenergy commodities rose
0.4 percent in September, as the index for apparel jumped 0.8 percent. The
pickup for apparel reflected the sampling of higher priced fall and winter
clothing and followed four months in which marked discounting of spring and
summer lines had led to declines in this component. The CPI for apparel
commodities was 5-1/2 percent above its level of a year earlier. Over the
first nine months of this year, the CPI excluding food and energy items has

II-40
risen at an annual rate of 5-3/4 percent, more than a percentage point above
the pace during 1989.
At the producer level, about half of the 0.6 percent increase in
September in the PPI for finished goods less food and energy occurred
because discounts for motor vehicles were not increased in September at the
end of the model year; manufacturers already had introduced price incentives
earlier in the model year. Excluding motor vehicles, this PPI series was up
0.3 percent, about the average monthly pace earlier in the year. As
expected, the spillover effects of higher crude oil prices began to boost
prices at the intermediate stage of processing. The PPI for intermediate
materials (less food and energy) jumped 0.6 percent in September, the
largest increase since early 1989, mainly because of sharply higher prices
for petrochemicals and plastics.
Food. Increases in food prices at the consumer level slowed further in
September, to a monthly rise of only 0.2 percent. Nonetheless, the level
of food prices remained about 5-1/2 percent above that of a year earlier, in
the range that has persisted for more than two years. In part, this
elevated year-over-year pace reflects upward pressures from nonfarm costs,
which account for the major part of the consumer food bill and cause the
prices of many foods to follow trends similar to that of inflation in
general. Additional pressures have come from cutbacks in the supplies of
some livestock products this year; pork production, in particular, has
turned down, and the output of beef also has been sluggish. Upward
pressures on the prices of cattle and hogs still were much in evidence in
October and are likely to show up in the near-term PPI and CPI reports;

II-41
dairy prices seem to be easing, however, after large increases over the past
two years.
Energy. Both consumer and producer prices for energy posted record
monthly increases in September, 5.6 percent and 13.8 percent respectively.
At the producer level, the gasoline component jumped 20.6 percent, even
faster than the preceding month's record-breaking pace. However, the PPI
for natural gas increased only 1.3 percent, restrained by plentiful
supplies. The margin between crude oil prices and retail gasoline prices
narrowed in August and September, as refiners boosted gasoline production
and inventories returned to normal levels.
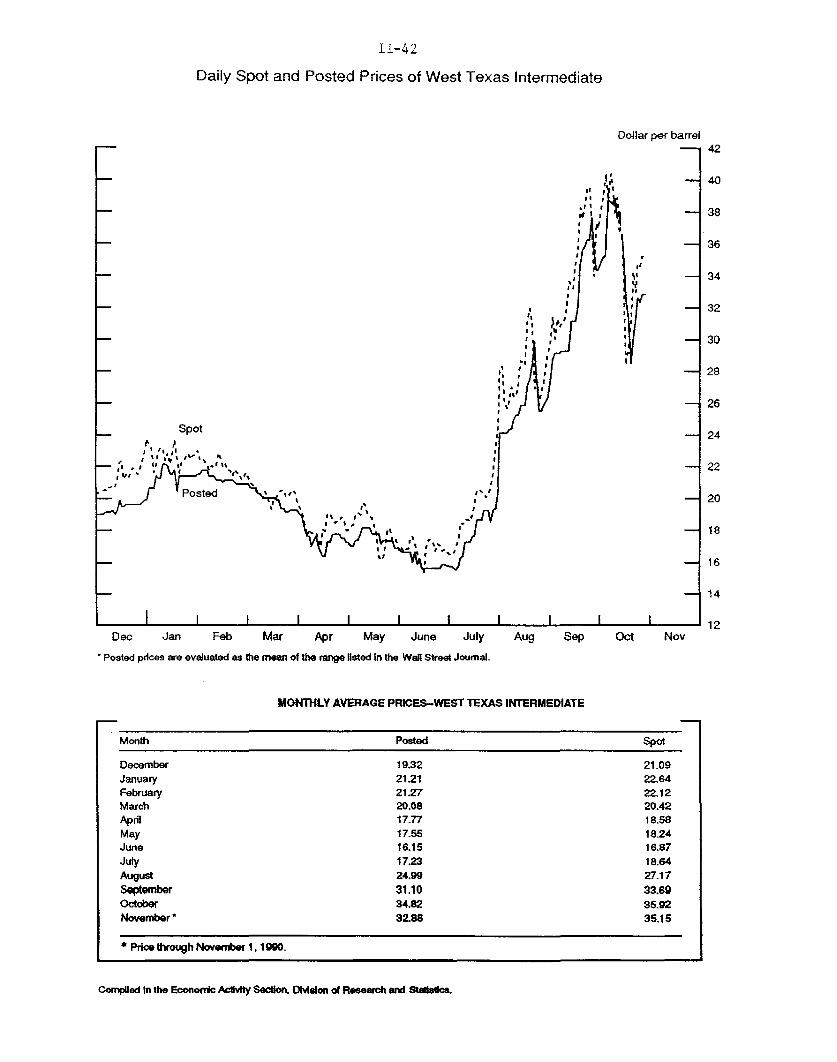
In October, spot crude oil prices gyrated wildly, ranging from a high
of $40 per barrel on October 11 to a low of $28 on October 22, with prices
at roughly $35 by the end of the month. On average, however, crude prices
were $3 to $4 per barrel higher than in September. Survey data suggest that
retail gasoline prices rose about 10 cents per gallon (seasonally adjusted)
in October, matching the crude price increase. Early November survey
estimates indicate a much smaller increase in retail gasoline prices, and a
slight decline in wholesale gasoline prices.
As noted above, U.S. gasoline demand, possibly because of anticipatory
stockpiling, has remained surprisingly resilient since the invasion. This
continued strength may have caught refiners by surprise, as gasoline
inventories fell to the bottom of their normal operating range in October.
Recent survey evidence suggests that world oil demand in the fourth quarter
is weakening. The market apparently anticipates some increase in gasoline
supplies over the remainder of the year; gasoline futures prices for
December delivery are well below prices for November delivery. However,
II-42
Daily Spot and Posted Prices of West Texas Intermediate
Dollar per barrel
Spot
Dec Jan Feb Mar Apr May June July Aug Sep Oct Nov
SPosted prices are evaluated as the mean of the range isted In the WaR Street Journal.
MONTHLY AVERAGE PRICES-WEST TEXAS INTERMEDIATE
SMonth Posted Spot
DecemberJanuaryFebruaryMarch
19.3221.2121.2720.0817.7717.5516.1517.2324.9931.1034.8232.88
* Price through November 1. 1990.
August
SeptemberOctoberNovember
Compiled In the Economic Actvity Section, DMslon of Research and Stalstscs.
21.0922.6422.1220.4218.5818.2416.8718.6427.1733.6935.9235.15

II-43
COMMODITY PRICE MEASURES *
- Journal of Commerce Index, total- - • Journal of Commerce Index, metals
Ratio scale, Index(1980=100)
1990
CRB Spot Industrials
Ratio scale, index(1967=100)
CRB industrials
Ratio scale, Index(1967=100)
CRB Futures
* Weekly data, Tueedays; Journal of Commerce data monthly before 195 Dotted lines ndicate week oflast Greenbook.
CRB Futures

II-44
Probability of a Recession*
GENERATED FROM COMMERCE LEADING INDEX
0.7
September
.62
-0.35
01989 1990
i Ii i t ii I
S-i i i: 1 t 1 1 0.
..:.: :I [ ...I 1: 0.6
1 899 11 0 1 94 198j 10.4
i I ir 1 -:-A
S.i.: ::i.: o0.4' il? iiii - o.40
f
1968 1972 1976 1980 1984 1988GENERATED FROM NBER LEADING INDEX
S11989
i 1 1 0.4
II
1971 1975 1979 1983 1987 1991
-Each probAfllty represents the likelihood that a recession wil begin duing the next sfx months.

II-45
consumers may not see a corresponding decline at the retail level because
the new federal deficit-reduction package mandates a 5-cent increase in
gasoline taxes, effective December 1.
Commodity prices. Prices in spot markets have retreated significantly
in recent weeks for most industrial metals. Both the CRB spot price index
for industrials and the metals component of the Journal of Commerce
industrial price index have dropped back markedly since the week of the last
Greenbook (chart), consistent, it would seem, with the signs of accumulating
weakness that have been apparent in other recent indicators.
Recession Probabilities
The latest readings on recession-probability measures based on indexes
of leading economic indicators are mixed. The measure based on the Commerce
Department's September index of leading economic indicators puts the
probability of a recession starting in the next six months at 62 percent
(chart). The sudden jump in the August and September reading on the
recession probability is largely attributable to declines in the stock
market and in the Michigan survey index of consumer expectations; however,
manufacturers' unfilled orders, unemployment initial claims, and building
permits have made substantial negative contributions to the underlying
index.10
The most recent reading on the National Bureau of Economic Research
(NBER) measure, which includes September nonfinancial data as well as
October readings on exchange rates and interest rates, shows only a
9. The Journal of Commerce index total also has been affected by the sharpswings in the price of crude oil.10. The relevant data for October on most of these indicators have shown
further weakness.

II-46
6 percent recession probability. Researchers at the NBER also have
constructed an alternative version of their experimental leading index that
excludes financial variables. Based on this alternative index, the
probability of a recession beginning in the next six months is 29 percent.

DOMESTIC FINANCIALDEVELOPMENTS

III-T-1 1SELECTED FINANCIAL MARKET QUOTATIONS
(percent)-- -- -- - -- -- - -- -- -- - -- -- - -- -- - -- -- -- - -- -- - -- -- - -- -- -- - -- -- - -- -- -
1989
March Dechighs lows
Short-term rates
Federal funds2
Treasury bills-3-month6-month1-year
Comercial paper1-month3-month
Large negotiable CDs3
1-month3-month6-month
Eurodollar deposits 4
1-month3-month
Bank prime rate
9.85
9.099.119.05
10.0510.15
10.0710.3210.08
10.1910.50
1990
Aug FOMChighs Oct 2
Change from:~-------- -------- ------ ----- ------ -----
Dec 89 Aug 90 FOCNov 6 lows highs Oct 2
-------- ------
8.45 8.21 8.21 8.00 -.45 -.21 -.21
7.537.297.11
7.597.517.45
7.187.187.10
7.087.066.89
-. 45-. 23-. 22
-. 51-. 45-.56
-.10-.12-. 21
8.51 8.10 8.05 7.88 -.63 -.22 -.178.22 8.05 7.95 7.86 -.36 -.19 -.09
8.528.228.01
8.148.188.25
8.008.008.01
7.927.967.95
-. 60-. 26-. 06
-.22-. 22-.30
-.08-.04-.06
8.38 8.13 8.00 7.94 -.44 -.19 -.068.25 8.19 8.00 7.94 -.31 -.25 -.06
11.50 10.50 10.00 10.00 10.00 -.50 .00
Intermediate- and long-term rates
U.S. Treasury (constant maturity)3-year 9.88
10-year 9.5330-year 9.31
Municipal revenu5(Bond Buyer) 7.95
Corporate--A utilityrecently offered 10.47
7.697.777.83
8.509.059.17
8.108.698.84
7.808.528.64
7.28 7.80 7.81 7.55
9.29 10.50 10.16 10.08
.11 -. 70.75 -. 53.81 -. 53
-.30-.17-. 20
Bome mortgage rates 6
S&L fixed-rateS&L ARM, 1-yr.
11.229.31
9.69 10.29 10.22 10.13 .44 -.16 -.098.34 8.39 8.28 8.15 -. 19 -. 24 -. 13
1989 1990 Percent change from:
Record Lows FOtC Record 1989 FOMChighs Date Jan 3 Oct 2 Nov 6 highs lows Oct 2
Stock prices
Dow-Jones Industrial 299.75 7/16/90 2144.64 2505.20 2485.15 -17.15 15.88 -.80NYSE Composite 201.13 7/16/90 154.98 172.59 170.21 -15.37 9.83 -1.38AMX Composite 397.03 10/10/89 305.24 309.63 292.15 -26.42 -4.29 -5.65NASDAQ (OTC) 485.73 10/9/89 378.56 356.39 340.53 -29.81 -10.05 -4.45Wilshire 3523.47 10/9/89 2718.59 2963.70 2907.21 -17.49 6.94 -1.91
1/ One-day quotes except as noted.2/ Average for two-week reserve maintenance period closest to
date shown. Last observation is average to date for themaintenance period ending November 14, 1990.
3/ Seconday market.4/ Bid rates for Eurodollar
deposits at 11 a.m. London time.5/ Based on one-day Thursday quotes
and futures market index changes.6/ Quotes for week ending
Friday closest to date shown.
.27 -. 25 -.26
.79 -. 42 -. 08

Selected Interest Rates *(percent)
1989 1990
Federal Funds
3-month Treasury Bill
1i 1 L I10/2 11/6
-- 12
Primary Mortgage
(wkly)
Corporate Bond
(weey)
30-year reasury Bond
(daII y)
I I I I10/2 11/6
Short-Term Daily
1989 1990
- Fday wek* through Nov• e 2, WedMnsdy weeks through Octotr 31.

DOMESTIC FINANCIAL DEVELOPMENTS
Yields on Treasury and investment-grade securities have declined
moderately since the October 2 FOMC meeting. Passage of the deficit-
reduction program, and a subsequent quarter-point easing in the federal
funds rate, and weak economic indicators have helped push these rates down.
Outside the highest-quality sectors, however, evidence of financial stress
has become increasingly visible in the rate structure. Yield spreads over
Treasuries have increased noticeably across a broad front, not only
encompassing nonfinancial corporate bonds and bank-related securities, but
also spreading to finance companies, insurance companies, asset-backed
securities, and financially strapped municipalities.
Several medium-grade companies have encountered investor resistance to
offerings of commercial paper with maturities carrying over the approaching
year-end statement date and have been forced to draw on backup lines of
credit at banks. In the third quarter, the number of firms reducing or
omitting dividends rose, the volume of defaults on corporate bonds so far in
1990 topped previous full-year records, and downgradings of corporate and
municipal debt increased further. Disappointing reports of third-quarter
earnings have depressed stock prices in general; large declines have been
posted for banks, thrift institutions, and insurance companies.
Growth in M2 slowed in October to a 1 percent annual rate, which moved
M2 further below the midpoint of its target range. Demand deposits dropped
sharply, and growth of most of the retail components of M2 slowed. Bank
credit showed little change, which, along with shrinkage in the thrift
III-1

III-2
MONETARY AGGREGATES(based on seasonally adjusted data unless otherwise noted)
Growth1990 1990 1990 1990 1990 Q4 89-
19891 Q2 Q3 Aug Sep Oct pe Oct 90pe
------------ Percent change at annual rates-----------------
3.5 4.3 10.42.8 3.1 6.50.8 1.5 4.5
------------ Percent change at annual rates----------
Selected components
4. M1-A
5. Currency6. Demand deposits
0.4 1.6 7.0 14.8 12.4
9.2 11.6 14.8-4.7 2.9 14.0
7. Other checkable deposits
8. M2 minus M12
7.1 -0.4
5.9
9. Overnight RPs and Eurodollars, NSA10. General purpose and broker/dealer money
market mutual fund shares11. Commercial banks12. Savings deposits plus MMDAs
3
13. Small time deposits14. Thrift institutions15. Savings deposits plus MMDAs
3
16. Small time deposits
17. M3 minus M24
18. Large time deposits19. At commercial banks, net
5
20. At thrift institutions21. Institution-only money market
mutual fund shares22. Term RPs, NSA23. Term Eurodollars, NSA
MEMORANDA:
24. Managed liabilities at commercialbanks (25+26)
25. Large time deposits, gross26. Nondeposit funds27. Net due to related foreign
institutions28. Other
7
29. U.S. government deposits at commercialbanks
a
16.18.2
2.5 4.9
2.6 2.7 5.3
-8.6 -2.0
29.77.5
-1.7
19.0-0.2-9.35.8
-0.710.3
8.612.1-4.61.4
-8.0
7.4 -17.1 -11.6
12.811.4
7.515.4
-10.3-5.5
-13.3
32.17.58.36.8
-3.6-2.7-3.9
22.66.94.69.5-6.1-3.8-7.5
-1.3 -7.3 -5.1 -4.0 -19.1
4.2 -10.3 -8.7 -14.59.9 -2.8 -0.7 -9.9
-7.8 -30.1 -31.7 -28.4
17.1-14.7-21.9
11.55.0
-22.4
22.0 56.23.3 23.5
-0.6 29.8
-16.5
-13.3-26.3
22.1-41.2
0.0
-3 41 40 1½
Levels- bil. $
Sep 90
-1 529.7
12 241.5-13 279.9
-7 293.1
3 2495.1
44 82.2
11 340.114 1148.3
3 572.624 575.8
-15 924.9
-12 350.3-18 574.6
-7 774.0
516.9392.0124.9
116.195.666.1
----- Average monthly change in billions of dollars---
6.0 -1.8 1.2 -2.3 -6.92.6 -1.5 -2.3 -3.1 -5.23.5 -0.2 3.5 0.8 -1.7
0.2 -0.93.3 0.6
-0.3 0.4
1.5 -0.1 2.52.0 0.9 -4.3
2.6 18.4 -5.0
727.0445.7281.3
8 19.22 262.0
-6 28.2
1. Amounts shown are from fourth quarter to fourth quarter.2. Nontransactions M2 is seasonally adjusted as a whole.3. Commercial bank savings deposits excluding MODAs grew during September and October at rates of 4.9
percent and 7 percent, respectively. At thrift institutions, savings deposits excluding MMDAs grewduring September and October at rates of -6.5 percent and -12 percent, respectively.
4. The non-M2 component of M3 is seasonally adjusted as a whole.5. Net of large denomination time deposits held by money market mutual funds and thrift institutions.6. Dollar amounts shown under memoranda are calculated on an end-month-of-quarter basis.7. Consists of borrowing from other than commercial banks in the form of federal funds purchased, securities
sold under agreements to repurchase, and other liabilities for borrowed money (including borrowing from theFederal Reserve and unaffiliated foreign banks, loan RPs and other minor items). Data are partially estimated.
8. Consists of Treasury demand deposits and note balances at commercial banks.pe - preliminary estimate
1. Ml2. M23. H3

III-3
industry, kept M3 unchanged in October and in the lower portion of its
annual range. Some of the weakness in bank credit reflects heavy
securitization of consumer receivables, motivated by desires to boost
capital-asset ratios. Business loans also remained weak, and survey data
indicate that banks have continued to tighten their lending terms for
business borrowers in recent months.
Borrowing by nonfinancial businesses has been moderate of late, in both
short- and long-term categories. Equity offerings have been light, but with
takeovers and share repurchases less prevalent, net equity retirements have
remained below the pace of recent years.
Residential mortgage growth evidently remained slow through the third
quarter, reflecting continued weakness in the housing market, and spreads on
conventional mortgages have stayed narrow. Lenders apparently remain
willing to extend credit to the household sector, as evidenced by a pickup
in consumer installment credit in the third quarter, although recent survey
information suggests that banks have become somewhat less enthusiastic about
making consumer loans.
Monetary Aggregates and Bank Credit
The monetary aggregates were weak in October: M1 fell and the broader
aggregates posted little or no growth. The weakness occurred despite a
narrowing of the spread between market rates and deposit rates. Money fund
inflows, which had lifted M2 and M3 in August and September when investors
reacted to turmoil in the financial markets, continued at double-digit
rates. Nonetheless, the contraction of the thrift industry--with a number
of large RTC resolutions taking place around quarter-end--and efforts by
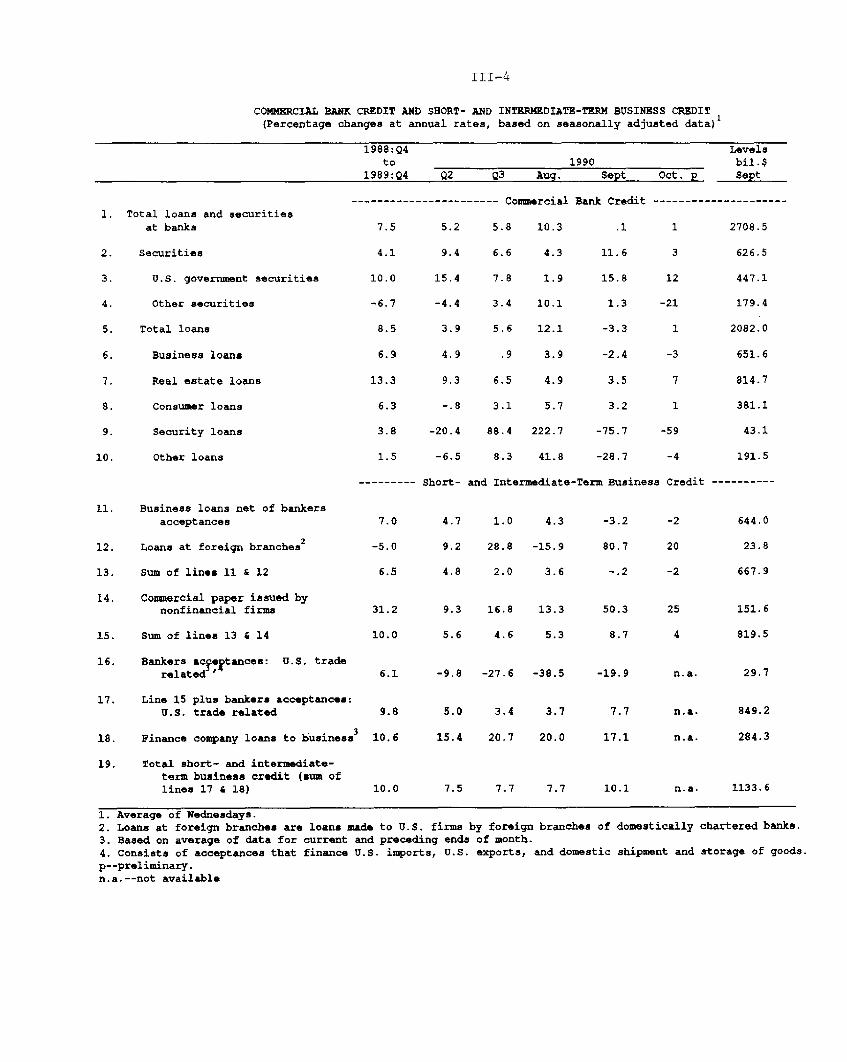
III-4
COMMERCIAL BANK CREDIT AND SHORT- AND INTERMEDIATE-TERM BUSINESS CREDIT(Percentage changes at annual rates, based on seasonally adjusted data)
1988:Q4to
1989:Q4 Q2 Q3 Aug.
1. Total loans and securitiesat banks
2. Securities
3. U.S. government securities
4. Other securities
5. Total loans
6. Business loans
7. Real estate loans
8. Consumer loans
9. Security loans
.0. Other loans
7.5 5.2
4.1 9.4
10.0 15.4
-6.7 -4.4
8.5 3.9
6.9 4.9
13.3 9.3
6.3 -. 8
3.8 -20.4
1.5 -6.5
--------- Short-
1990
----- Commercial Ban]
5.8 10.3
6.6 4.3
7.8 1.9
3.4 10,1
5.6 12.1
.9 3.9
6.5 4.9
3.1 5.7
88.4 222.7
8.3 41.8
and Intermediate-Ten
Levelsbil.$
Sept Oct. p Sept
k Credit ---------------------
.1 1 2708.5
11.6 3 626.5
15.8 12 447.1
1.3 -21 179.4
-3.3 1 2082.0
-2.4 -3 651.6
3.5 7 814.7
3.2 1 381.1
-75.7 -59 43.1
-28.7 -4 191.5
m Business Credit----------
11. Business loans net of bankersacceptances
12. Loans at foreign branches2
13. Sum of lines 11 & 12
14. Commercial paper issued bynonfinancial firms
15. Sum of lines 13 S 14
16. Bankers acseptances: U.S. traderelated
•
17. Line 15 plus bankers acceptances:U.S. trade related
18. Finance company loans to business3
19. Total short- and intermediate-term business credit (sum oflines 17 4 18)
7.0
-5.0
6.5
31.2
10.0
1.0
28.8
2.0
4.3
-15.9
3.6
9.3 16.8 13.3
5.6 4.6 5.3
-3.2
80.7
-. 2
50.3
8.7
6.1 -9.8 -27.6 -38.5 -19.9
9.8
10.6
10.0
5.0 3.4 3.7
15.4 20.7 20.0
7.5 7.7 7.7
7.7
17.1
10.1
-2
20
-2
25
4
n.a.
n.a.
n.a.
644.0
23.8
667.9
151.6
819.5
29.7
849.2
284.3
n.a. 1133.6
1. Average of Wednesdays.2. Loans at foreign branches are loans made to U.S. firms by foreign branches of domestically chartered banks.
3. Based on average of data for current and preceding ends of month.4. Consists of acceptances that finance U.S. imports, U.S. exports, and domestic shipment and storage of goods.
p--preliminary.n.a.--not available

III-5
commercial banks to retrench has restrained the growth of depository credit
and the monetary aggregates last month.
Ml declined at a 3 percent annual rate in October, as a reduction in
transaction balances more than offset continued robust currency expansion.
Demand deposits, whose growth had been boosted in recent months by special
factors, dropped sharply, and OCDs also fell.
The decline in Ml, along with continued weakness in nontransaction
retail deposits and a slowing of inflows into money funds, held M2 growth to
a 1 percent rate in October. The disparity between deposit growth at banks
and thrifts widened, as the RTC concluded several large resolutions around
quarter-end. These transfers of core deposits from thrift institutions to
banks may have depressed overall deposit growth in light of banks' current
reluctance to expand their balance sheets and consequently to bid
aggressively for funds.
With the thrift industry shrinking and banks expanding at a very
subdued pace, M3 was about unchanged in October. The sluggishness of M3 was
partly a result of late-quarter activities of the RTC. The decline of M3 at
the end of the third quarter was amplified by the reduced availability of
funds from investors concerned about bank creditworthiness. In addition,
many commercial banks sought to shrink their balance sheets in anticipation
both of the phase-in of risk-based capital standards and of the higher FDIC
assessments next year, which will be based on average deposits outstanding
at the ends of the third and fourth quarters of this year.
Overall bank credit was little changed again last month. Growth in
recent months has been damped by the behavior of the less well capitalized
segment of the banking industry. Large commercial banks with capital of

III-6
Growth of Total Loans at Large Banks
Grouped by the Ratio of Qualifying Capital to Risk-Weighted AssetsRate of change from year ago week Percent
S18
S14
P , -, Capital-asset ratios below 8 percent
t \- l ,s \ u -a ,
Capital-asset ratios equal to or above 8 percent
I 1 I I I I I I I I I I I 1I 1• I I
Adjusted for breaks In sedies. 18 1990

III-7
less than 8 percent of risk-weighted assets have sharply reduced loan growth
this year; indeed, recent readings show total loans at this group of banks
below year-ago levels. By contrast, total loan growth has slowed only
slightly at larger banks with a risk-based capital ratio of 8 percent or
more on June 30, 1990 (chart).
Each of the major categories of loans remained weak last month.
Security loans, which had boosted bank credit during the summer, ran off in
September and October, reflecting both quarter-end downsizing and the drop
in Treasury tax and loan accounts after the recent spate of RTC resolutions.
Consumer loans were little changed last month; adjusted for securitization,
however, these loans grew at about a 6 percent rate. Real estate lending
grew moderately, with much of the 7 percent increase reflecting home equity
loan growth and transfers of thrift mortgage assets to commercial banks as a
result of RTC resolutions.
Business loans contracted again last month; declines at large banks
offset increases at foreign-related institutions. A survey, taken in late
October, of senior loan officers at large commercial banks indicated that
banks have continued to tighten terms for business customers, including
shortening credit lines, raising fees and spreads, and imposing more
restrictive loan covenants. Close to half of the domestic banks and more
than two-thirds of agencies and branches of foreign banks reported some
degree of firming since the August survey. In recent years, expansion of
business loans at foreign-related institutions has outpaced that of overall
business loans, but this trend was broken in the third quarter when growth
at foreign-related institutions abruptly halted. In part, this year's
slowdown reflects a change in the behavior of U.S. offices of Japanese

III-8
GROSS OFFERINGS OF SECURITIES BY U.S. CORPORATIONS(Monthly rates, not seasonally adjusted, billions of dollars)
1987 1988 1989 1990
Year Year Year Q1 Q2 Q3P Sept. p Oct
Corporate securities - totall 24.09 22.39 19.83 16.99 23.55 16.01 13.74 18.25Public offerings in U.S. 21.90 20.37 17.77 15.10 20.70 13.73 11.83 16.50
Stocks--total 4.45 3.53 2.69 3.00 2.32 1.16 .43 1.00Nonfinancial 2.32 1.14 1.09 1.55 1.29 .73 .21 .60
Utility .57 .24 .29 .41 .38 .26 .04 .30Industrial 1.75 .90 .80 1.14 .91 .47 .17 .30
Financial 2.12 2.39 1.60 1.45 1.03 .43 .22 .40
Bonds--total1 17.45 16.84 15.08 12.10 18.38 12.57 11.40 15.50Nonfinancial 6.56 6.17 6.26 3.83 6.81 3.29 3.40 4.30
Utility 2.02 1.80 1.78 1.22 2.37 1.43 1.80 1.30Industrial 4.54 4.37 4.48 2.61 4.44 1.86 1.60 3.00
Financial 3 10.89 10.67 8.81 8.27 11.57 9.28 8.00 11.20By quality
Aaa and Aa 3.28 2.73 3.30 2.68 3.78 2.58 1.77 2.80A and Baa 5.20 5.50 5.66 4.33 8.36 4.73 4.31 4.95Less than Baa 2.77 2.59 2.39 .17 .24 .08 .00 .15No rating (or unknown) .07 .04 .04 .00 .08 .00 .00 .0
Memo items:Equity-based bonds .87 .28 .52 .05 .88 .34 .26 .15Mortgage-backed bonds 5.19 4.72 1.67 1.64 2.95 2.65 2.70 2.60Other asset-backed .94 1.26 2.02 3.28 2.97 2.53 2.62 5.00Variable-rate notes 1.90 1.19 1.03 1.45 .29 .45 .55 .60
Bonds sold abroad - total 2.03 1.93 1.90 1.62 2.43 2.13 1.90 1.70Nonfinancial .94 .73 .48 .38 .58 .50 .90 .25Financial 1.09 1.20 1.42 1.24 1.85 1.63 1.00 1.45
Stocks sold abroad - total .16 .09 .16 .27 .42 .15 .01 .05Nonfinancial .12 .08 .12 .10 .15 .10 .01 .03Financial .04 .01 .04 .17 .27 .05 .00 .02
1. Securities issued in the private placement market are not included.Total reflects gross proceeds rather than par value of original discount bonds.
2. Excludes equity issues associated with equity-for-equity swaps thatrestructurings. Such swaps totaled $20.4 billion in 1999.3. Bonds categorized according to Moody's bond ratings, or to Standard
unrated by Moody's. Excludes mortgage-backed and asset-backed bonds.4. Includes bonds convertible into equity and bonds with warrants that
holder to purchase equity in the future.p--preliminary.
have occured in
and Poors' if
entitle the

III-9
banks, which, until recently, had been aggressively increasing their share
of credit extended by foreign-related institutions. U.S. offices of
Japanese banks now account for approximately three-quarters of the total
credit extended by weekly reporting foreign-related institutions and for a
somewhat larger share of the business loans.
Nonfinancial Business Finance
Total borrowing by nonfinancial corporations remained subdued in
October. Business loans at commercial banks contracted again, falling at
about the same rate as in September. Gross public bond issuance was up from
the third quarter's depressed level; however, most issues had short- to
intermediate-term maturities, and only one firm has sold junk bonds in the
public market since August. After growing rapidly in August and September
when firms avoided longer-term financing, outstandings of commercial paper
have been about unchanged since the end of the third quarter. 2
While highly rated corporations have had little difficulty in placing
commercial paper, medium-grade companies encountered significant investor
resistance at quarter-end, which caused rates on medium-grade paper to rise
roughly 8 basis points above those on high-grade paper. Despite the passing
of quarter-end window-dressing pressure, spreads have widened since the
statement date, as investors continue to be wary of paper carrying less than
the top rating. Within the medium-grade (A2/P2) sector, tiering has become
1. Under the Basle agreement, Japanese banks are allowed to count 45
percent of the unrealized capital gains on their equity holdings toward
their tier 2 capital requirements. The decline in the Japanese stock market
has eroded these gains considerably in recent months.
2. As shown in the table, commercial paper posted a 25 percent annualized
growth rate in October, but this growth reflects the use of monthly averages
of weekly data.

III-10
Moody's Rating Changes for Corporate BondsNumber of rating changes
STotal net downgrades
J ]Net downgrades-financial firms
- N Net downgrades-nonfinancal firms
1986 1988 1990Nine months ended September
Quarterly Dividend Actions(Seasonally adjusted)
Number of actions
1978 1981 1984
1400
1200
1000
800
600
400
200
1972 1975 1987 1990

III-11
slightly more pronounced, the rate spreads between the lowest- and highest-
regarded issuers having widened to 20 basis points, about 5 basis points
more than in midsummer. Some medium-grade issuers have found it difficult
to place paper, especially with maturities that extend beyond year-end, and
have turned to bank back-up lines. Moreover, investors reportedly have
become more selective in their purchases of paper backed by letters of
credit issued by Japanese banks, amid concern about the strength of those
institutions.
Several other indicators point to financial stress in the corporate
sector. In the third quarter, the number of debt downgrades far exceeded
the number of upgrades, although the difference between the two was a bit
narrower than the average for the first half of the year. The difference
for the first nine months of this year already had surpassed 1989's record
(top panel of chart). Gross downgrades in the third quarter, as in the
first half of the year, were concentrated in financial institutions and in
industrial firms with ratings below investment grade. In addition, the
number of corporations reducing, omitting, or deferring dividends remained
high during the third quarter, while the number raising dividends continued
downward (lower panel of chart). Further, Moody's Investors Service
reported that corporations have defaulted on $12.3 billion of public long-
term debt through September, compared with $11.8 billion for all of 1989.
Amid signs of corporate stress, bond yield spreads widened further in
October. The yield spread between A-rated utilities and the 30-year
Treasury bond moved up 12 basis points, and the spread between Baa and Aaa
bonds increased about 20 basis points to 130 basis points; this was the
widest spread in nearly four years (chart), though it was narrower than that

III-12
Spread Between Baa and Aaa Corporate Bonds
Basis pointsS300
250
200
150
100
- 50
17 1973 17 I 79 1982II I I i 1 981970 1973 1976 1979 1982 1985 1988

III-13
in the early 1980s. Furthermore, prices of junk bonds continued their long
slide, and liquidity in the market deteriorated further.
In equity markets, major price indexes declined between 1 and 6 percent
over the intermeeting period, with the largest drops registered by smaller
companies. Mutual fund investors appeared to become less bearish in
September: transfers from equity and bond funds to money funds were sharply
reduced from the heavy flows in August. Reports from fund officials
indicate that transfers from mutual funds probably moderated further in
October, but withdrawals from junk bond funds likely continued.
Responding to the decline in the stock market since the onset of the
Persian Gulf crisis, offerings of new domestic shares have been rare
recently. Offerings in October, although somewhat stronger than the $426
million in September, fell far below the pace of earlier in the year. With
a paucity of new merger announcements thus far in the fourth quarter, net
equity retirements are expected to drop from the third-quarter pace.
However, share repurchases may continue to produce some offset to the
reduction in merger activity.
Financial Firms
Further signs of stress in financial institutions emerged during the
intermeeting period, as investor concern about potential losses on real
estate loans and HLT portfolios spread from depository institutions to other
sectors of the financial system. In the banking system, third-quarter
earnings for most money center and regional banks reflected large provisions
for loan losses in commercial real estate portfolios and some evidence of
deterioration in loans to highly leveraged corporations. In these
circumstances, Chemical followed Chase Manhattan's lead in cutting its

III-14
ASSET-BACKED VOLUME AND YIELD SPREADS
Basis points Billions of dollars120 -- -
E Total Asset-Backed Issuance Monthly average
SBy Depository Institutions- 6.5
£100
5.5
3-year CARDS yield less 3-year Treasury yield
5
80 -3-year AA Financial yield less 3-year Treasury yield 4.5
\ 1
60 - - 3.5
3
- 2.5
40
2
1.5
20 -
1
0.5
o0 I1Q0G7 1jOR 1 OR 1990IOucr
III-15
dividend, and dividend cuts by other bank holding companies are widely
anticipated.
Share prices of money center and regional banks have declined about 3
percent since the October FOMC meeting, so that their cumulative slides for
the year are now about 40 percent. Banks perceived to be experiencing
financial difficulties have encountered investor resistance in raising
funds. These difficulties are highlighted by the 650 basis point premium
Citicorp was required to pay on its auction-rate preferred stock relative to
two higher-rated bank holding companies, and by the continued run off of
commercial paper at lower-rated companies. Further, institutional investors
probably were unwilling to hold obligations of certain banking companies
over the quarterly statement date, and some foreign banks and official
institutions reportedly are reluctant to enter into swaps with a number of
U.S. bank swap dealers.
Longer-term financing by banks remained dormant: no banks issued
equity and only one sold longer-term bonds in the public market during the
intermeeting period. To meet capital requirements, banks have instead
turned aggressively to securitization to downsize their balance sheets
(chart). As a result of the record volume of asset-backed securities issued
through the first ten months of 1990 and in anticipation of heavy volume
before year-end, spreads on securities backed by credit card receivables
have widened about 35 basis points relative to Treasury securities and have
reached unprecedented levels.
Finance companies also have come under close market scrutiny. Yield
spreads on notes of finance companies increased in October, partly because
these securities are close substitutes for asset-backed securities, whose

III-16
duration is also typically less than five years. The widening of spreads,
particularly for A-rated issues with intermediate maturities, also reflects
investor concern that a number of finance companies could be subject to the
same asset-quality problems as commercial banks. For example, press reports
suggesting that General Electric Capital Corporation's large commercial real
estate and HLT portfolios could be vulnerable to recession was associated
with a further widening of spreads. Nevertheless, available data indicate
that business lending by finance companies remained strong through
September. Paced by rapid growth in wholesale automobile and equipment
leasing, business receivables grew at a 17 percent annual rate in September,
so that the average growth rate for the year is 14 percent. With this
year's rapid growth, the share of short- and intermediate-term business
credit (bank and finance company loans, plus nonfinancial commercial paper
and bankers acceptances) accounted for by finance companies has risen to 25
percent, up from 23-3/4 percent at year-end 1989.
Announcements by two insurance firms of sizable loan loss provisions
and writedowns on mortgage lending and real estate portfolios heightened
concern for the insurance industry. Over the past decade, life insurance
companies, facing greater resistance to the traditional whole-life policies
and stiffer competition from deregulated deposits, have bid more
aggressively for funds through Guaranteed Investment Contracts and
annuities. To generate revenues to cover promised returns, some companies
have turned to riskier assets, particularly commercial real estate lending
and junk bonds. With the spreading decline in commercial real estate values
and the deterioration of the junk bond market, stock prices for full-line
insurers have fallen 12 percent on average since the October meeting; the

III-17
cumulative losses for the year are now about 38 percent. Further, yield
spreads on long-term bonds of insurance companies have increased by at least
60 basis points in the past two months. In addition, the proportion of
securities in the portfolios of U.S. insurance companies considered below
investment grade, and thus subject to higher capital reserves, could
increase substantially under new rating categories outlined by the National
Association of Insurance Commissioners. Some analysts have expressed
concern that the reclassification will force insurers to reduce holdings of
lower-rated bonds; such reductions could worsen downward pressure on junk
bond prices and limit credit availability to medium-sized firms in the
private placement market.
Securities firms have continued to suffer from excess capacity, the
slowdown in merger activity, an overhang of bridge loans, and intense
competition in investment banking. Stock prices of publicly traded firms
have declined 5 percent since the October FOMC meeting and about 17 percent
since the beginning of the year. Earnings at the five largest publicly
traded firms declined substantially from the second quarter; trading profits
partially offset a decline in revenues from domestic investment banking at
one of these firms and a restructuring charge at another. In the wake of
the Drexel bankruptcy and the tightening of bank credit, securities firms
are seeking to extend the maturities of their funding lines and to broaden
their investor bases.
Finally, losses at "nonintervened" thrift institutions widened in the
second quarter, as a softening in real estate markets led to higher loan-
loss provisions. According to earnings reports of publicly traded
institutions, the performance of the thrift industry appears to have

III-18
TREASURY AND AGENCY FINANCING 1
(Total for period; billions of dollars)
Q2 Q3 Q4P
1990
Oct.e Nov. Dec.
Treasury financing
Total surplus/deficit (-)
Means of financing deficit:
Net cash borrowingfrom the public
Marketable borrowings/repayments (-)
BillsCoupons
Nonmarketable
Decrease in the cashbalance
Memo: Cash balanceat end of period
Other3
Federally sponsored creditagencies, net cashborrowing
-12.0 -57.8 -103.0 -39.9 -44.2 -18.9
41.0 69.0 85.1 33.7
32.7.5
32.28.3
64.529.035.64.5
79.741.438.3
5.4
-16.2 -5.5 15.2
28.718.010.74.9
4.8
34.6 40.2 24.9 35.4
-12.8 -5.6
2.5 -1.9
FHLBsFHLMCFNMAFarm Credit BanksFAC
SLMAFICOREFCORP
-6.7-3.1
.9
.9
.11.0
.05.0
5.0 5.01. Data reported on a not seasonally2. Includes proceeds from securities
adjusted, payment basis.issued by federal agencies under special
financing authorities and the face value of zero-coupon bonds issued to REFCORP(the discount from face value is offset in other means of finance).
3. Includes checks issued less checks paid, accrued items and othertransactions.
4. Excludes mortgage pass-through securities issued by FNMA and FHLMC.e--staff estimate.p--projected.
Note: Details may not add to totals due to rounding.
40.6
40.225.314.9
.4
12.9
22.5
-9.3
10.8
10.7
-1.912.6
.1
-2.4
24.9
10.5
-8.54.91.1-. 3
.31.4
.03.5
5.0--
--
m--

III-19
deteriorated further in the third quarter, in part reflecting an increase in
problem loans of California institutions. Thrift stock prices, which
declined 18 percent over intermeeting period, have fallen 40 percent since
the beginning of the year.
Treasury and Sponsored-Agency Financing
The federal deficit is projected to swell to $103 billion in the fourth
quarter, from $58 billion in the third, despite the absence of change in
projected RTC-related outlays. This increase, largely a seasonal
phenomenon, is expected to be financed by a sizable decline in the cash
balance and by $80 billion of marketable borrowing, to be split about evenly
between coupons and bills. The auctions of three-month, six-month, and one-
year bills are expected to raise almost $30 billion, with another $12
billion coming from cash management bills. Thus far in the quarter, the
gross sizes of the weekly bill auctions have been increased from $18.4
billion to $20.0 billion, while coupon issues have been increased by as much
as $1 billion.
The $3.195 trillion temporary debt ceiling was extended four times in
October before being raised to more than $4 trillion in the deficit-
reduction bill. During this period, the Treasury postponed several auctions
because of uncertainty over whether room existed under the debt ceiling to
settle them. Although the Treasury subsequently was able to hold the
auctions, it had to scale back the gross sizes so that no new cash was
raised. The uncertainty over the auction schedule does not appear to have
affected Treasury borrowing costs.
Subject to congressional approval, the RTC estimates that it will
utilize $62 billion to fund resolutions during the fourth quarter of this
III-20
year and the first quarter of next year, including $23 billion of loss funds
and $39 billion of working capital borrowed from the Federal Financing Bank.
Of the loss funds, $11 billion would come from Treasury appropriations and
$12 billion from the sale of REFCORP bonds. Although the Congress adjourned
without providing additional funding, the RTC has announced that it will
exploit a drafting error in FIRREA that will allow it to raise as much as
$18.8 billion of additional funds and thus continue operations into early
1991. 3
In the market for GSE debt, spreads have remained narrow as overall
issuance has continued light, in large part because of the Federal Home Loan
Bank System's ongoing paydown. REFCORP issued $5 billion of thirty-year
bonds in October, priced at a spread of 29-1/2 basis points above the
Treasury yield curve, down from the 38 basis points for the previous issue
in July. This latest sale brings REFCORP's outstanding debt to $23 billion,
and leaves it with $7 billion in remaining borrowing authority.
Municipal Securities
Gross issuance of long-term municipal securities slowed substantially
from September's $15 billion pace to an estimated $9 billion in October.
The bulge in September largely reflected a surge in mortgage revenue bonds
that was prompted by the expected expiration of their tax-exempt status.
The September 30, 1990, expiration date subsequently was extended in the
final budget bill to December 31, 1991. Yields have fallen recently from
the 1990 highs reached in early October, though apparently not enough to
3. FIRREA places limits on the negative net worth of the RTC. In the
past, the RTC included the original $18.8 billion Treasury contribution from1989 when computing its net worth--reflecting the spirit but not the letterof the law. Omitting the Treasury contribution from the net worthcalculation eases the net worth constraint.
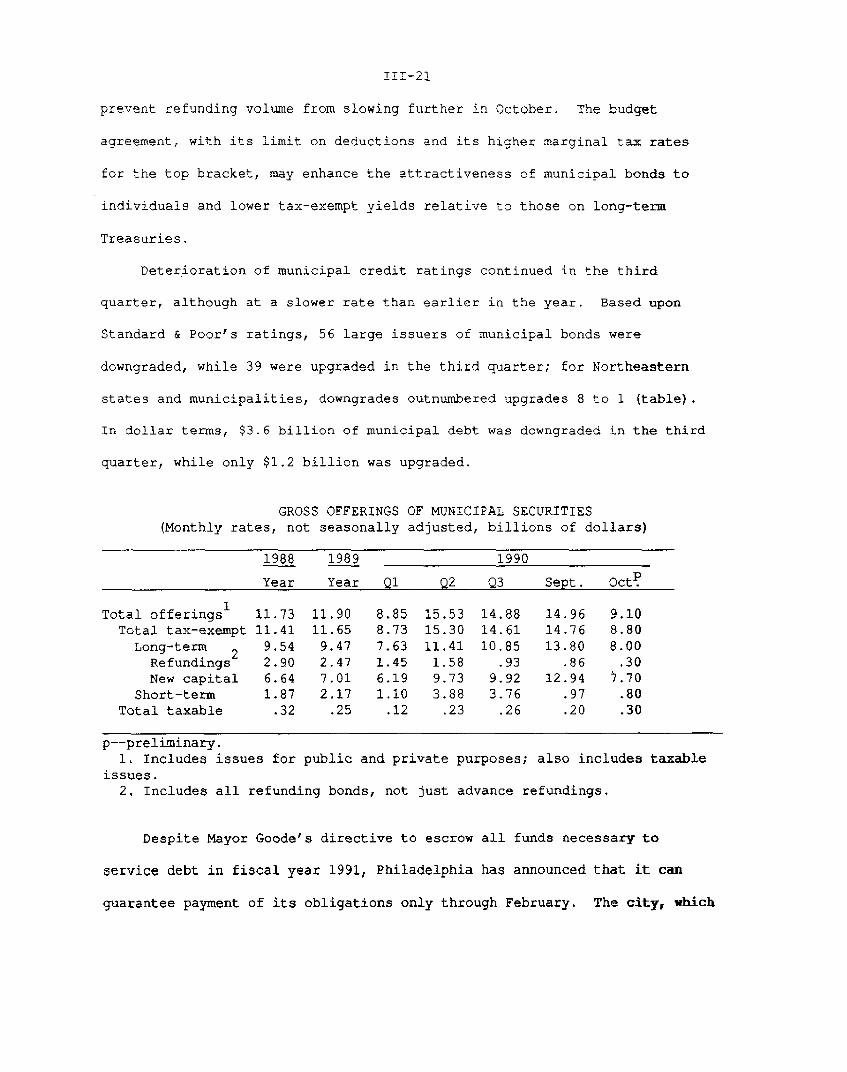
III-21
prevent refunding volume from slowing further in October. The budget
agreement, with its limit on deductions and its higher marginal tax rates
for the top bracket, may enhance the attractiveness of municipal bonds to
individuals and lower tax-exempt yields relative to those on long-term
Treasuries.
Deterioration of municipal credit ratings continued in the third
quarter, although at a slower rate than earlier in the year. Based upon
Standard & Poor's ratings, 56 large issuers of municipal bonds were
downgraded, while 39 were upgraded in the third quarter; for Northeastern
states and municipalities, downgrades outnumbered upgrades 8 to 1 (table).
In dollar terms, $3.6 billion of municipal debt was downgraded in the third
quarter, while only $1.2 billion was upgraded.
GROSS OFFERINGS OF MUNICIPAL SECURITIES(Monthly rates, not seasonally adjusted, billions of dollars)
1988 1989 1990
Year Year Q1 Q2 Q3 Sept. Oct P
Total offerings 1 11.73 11.90 8.85 15.53 14.88 14.96 9.10Total tax-exempt 11.41 11.65 8.73 15.30 14.61 14.76 8.80Long-term 9.54 9.47 7.63 11.41 10.85 13.80 8.00
Refundings 2.90 2.47 1.45 1.58 .93 .86 .30New capital 6.64 7.01 6.19 9.73 9.92 12.94 7.70
Short-term 1.87 2.17 1.10 3.88 3.76 .97 .80Total taxable .32 .25 .12 .23 .26 .20 .30
p--preliminary.1. Includes issues for public and private purposes; also includes taxable
issues.2. Includes all refunding bonds, not just advance refundings.
Despite Mayor Goode's directive to escrow all funds necessary to
service debt in fiscal year 1991, Philadelphia has announced that it can
guarantee payment of its obligations only through February. The city, which

III-22
Long-Term Municipal Debt Rating Actions: 1984-1990:Q3Number of Rating Revisions by Region
1984 1985 1986 1987 1988 1989 1990-H1 1990-Q3
WestUpDown
SouthwestUpDown
NorthwestUpDown
MidwestUpDown
SoutheastUpDown
NortheastUpDown
TotalUpDown
189 2062 30
363 155 114 165294 268 185 143
Source: Standard and Poor's Credit Week.
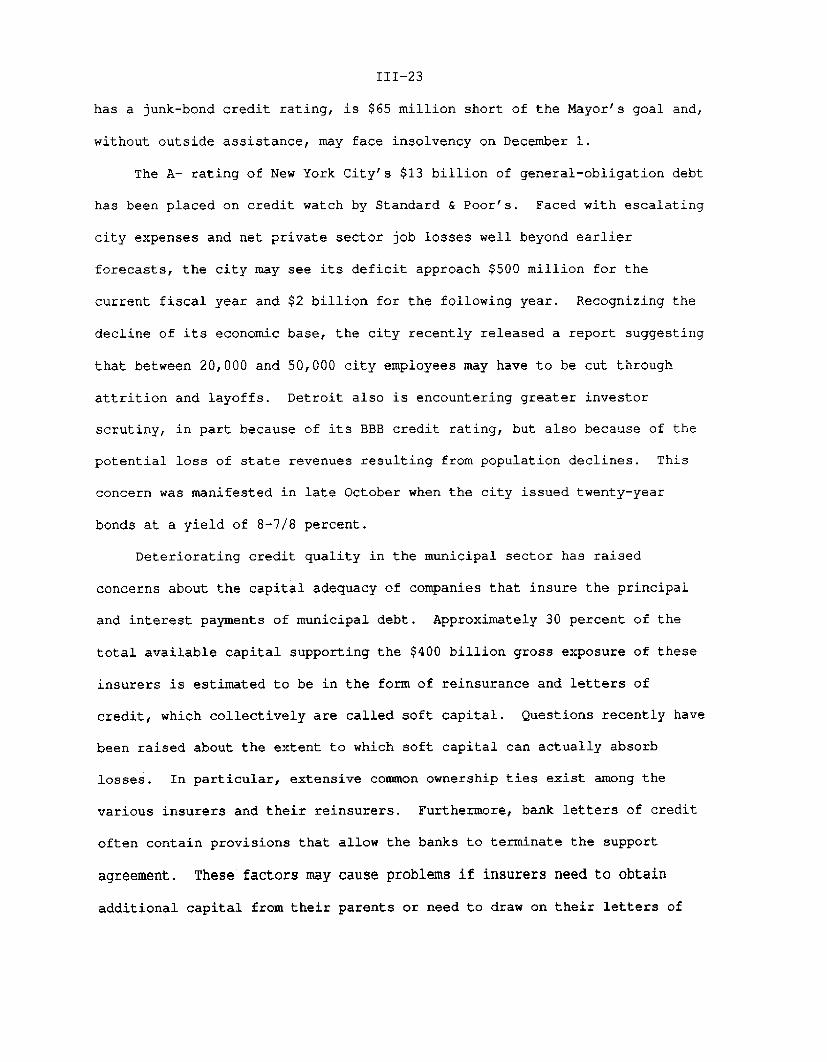
III-23
has a junk-bond credit rating, is $65 million short of the Mayor's goal and,
without outside assistance, may face insolvency on December 1.
The A- rating of New York City's $13 billion of general-obligation debt
has been placed on credit watch by Standard & Poor's. Faced with escalating
city expenses and net private sector job losses well beyond earlier
forecasts, the city may see its deficit approach $500 million for the
current fiscal year and $2 billion for the following year. Recognizing the
decline of its economic base, the city recently released a report suggesting
that between 20,000 and 50,000 city employees may have to be cut through
attrition and layoffs. Detroit also is encountering greater investor
scrutiny, in part because of its BBB credit rating, but also because of the
potential loss of state revenues resulting from population declines. This
concern was manifested in late October when the city issued twenty-year
bonds at a yield of 8-7/8 percent.
Deteriorating credit quality in the municipal sector has raised
concerns about the capital adequacy of companies that insure the principal
and interest payments of municipal debt. Approximately 30 percent of the
total available capital supporting the $400 billion gross exposure of these
insurers is estimated to be in the form of reinsurance and letters of
credit, which collectively are called soft capital. Questions recently have
been raised about the extent to which soft capital can actually absorb
losses. In particular, extensive common ownership ties exist among the
various insurers and their reinsurers. Furthermore, bank letters of credit
often contain provisions that allow the banks to terminate the support
agreement. These factors may cause problems if insurers need to obtain
additional capital from their parents or need to draw on their letters of

III-24
credit. In 1990, more than 70 percent of municipal debt has received credit
support from a municipal guarantor or a letter of credit.
Mortgage Markets
Net mortgage lending appears to have picked up little in the third
quarter from the sharply lower second-quarter pace; this weakness reflects
continued weak demand for financing in housing and commercial real estate
markets as well as more stringent credit standards and regulatory
constraints at lenders. As SAIF-insured thrift institutions apparently
continued to divest mortgage assets, growth in real estate loans at
commercial banks slowed to a 6-1/2 percent annual rate in the third quarter,
but picked up a bit in October.
Issuance of federally related pass-through securities remained strong
through the third quarter with a seasonally adjusted monthly average volume
of $17.2 billion (table). Over the same period, the steepening yield curve
prompted record CMO issuance, providing a strong bid for pass-through
collateral. Since the October FOMC meeting, CMO demand has dropped relative
to pass-through supply, contributing to some widening in spreads of pass-
throughs relative to Treasuries. Spreads between primary mortgage rates and
comparable Treasury security yields have widened about 10 basis points over
the intermeeting period, but they remain fairly narrow by historical
standards.
In the ARM sector, commitment rates on loans indexed to the one-year
Treasury bill have fallen about 10 basis points on average, compared with a
4. Moody's has placed Sumitomo Bank, Ltd. under review for possibledowngrade from its present Aaa rating. If the downgrade were to go through,it would affect $5.3 billion of long-term municipal debt currently backedby the bank's letters of credit.

III-25
decline of 13 basis points in the index itself. As a result of this
decline, the initial rate spread now favors ARMs by about 2 percentage
points, close to the spread at which the ARM share of new mortgage
originations historically has begun to rise. In recent months, ARMs have
accounted for less than one-third of new conventional mortgage loans, well
below the peak share of 70 percent reached in December 1987.
MORTGAGE-BACKED(Monthly averages, billions
SECURITY ISSUANCEof dollars, NSA unless noted)
Federally relatedpass-through securities Multiclass securities
Total Total ARM- Privat? FNMA FHLMC Agency
(SA) (NSA) backed Total issues REMICs REMICS strips
1988 12.4 12.5 2.4 6.9 4.2 .9 1.2 .61989 16.8 16.7 2.6 8.1 1.4 3.1 3.2 .3
1989-Q1 15.9 13.6 3.1 6.6 2.5 1.2 2.5 .4Q2 13.5 14.1 2.8 5.2 .6 2.4 2.1 .1Q3 15.9 17.6 2.5 9.8 1.2 3.6 4.4 .5Q4 21.6 21.6 2.2 10.7 1.2 5.2 4.0 .4
1990-Q1 23.3 19.9 1.4 11.3 1.6 5.0 3.8 .9Q2 17.9 18.6 2.2 11.1 2.9 4.7 3.0 .4Q3 p 17.2 19.0 1.6 11.7 2.3 6.6 2.3 .6
1990-Apr. 18.3 18.1 1.9 9.1 2.4 4.5 2.2 .0May 18.4 18.1 2.5 12.6 4.6 5.0 3.0 .0June r 17.0 19.6 2.2 11.5 1.8 4.7 3.8 1.3July r 14.7 16.7 0.5 10.9 1.4 6.7 2.8 .0Aug. r 19.2 20.6 1.6 11.9 3.7 4.4 2.4 1.4Sep. p 17.6 19.6 2.8 12.4 1.9 8.6 1.6 .3Oct. p n.a. n.a. n.a. n.a. 2.3 5.6 n.a. n.a.
1. Excludes pass-through securities with senior/subordinated structures.r--revised p--preliminary n.a.--not available.
Federally supported multifamily mortgage programs continue to
experience difficulties. FHLMC, which had tightened requirements for its
multifamily mortgage programs in January, recently announced that it was

III-26
CONSUMER CREDIT(Seasonally adjusted)
Memo:Percent change Net change Outstandings(at annual rate) (billions of (billions of
dollars) dollars)1990 1990 1990 1990
1988 1989' Q2 Q3P Augq Sept Aug. Sept? Septp
Total installment 8.9 5.5 2.3 6.0 5.0 4.9 3.06 3.00 735.4
Installment,excluding auto 10.3 8.6 7.4 11.4 12.4 7.6 4.57 2.84 449.9
Selected typesAuto 7.0 1.3 -5.2 -2.4 -6.1 .7 -1.51 .16 285.4Revolving 13.7 14.2 12.1 15.4 13.3 10.7 2.36 1.90 216.4All other 7.6 4.2 3.2 7.8 11.5 4.8 2.21 .93 233.5
Memorpndum:Total 7.3 5.0 1.5 3.3 3.8 2.0 2.49 1.33 792.0
1. Growth rates are adjusted for discontinuity in data between December 1988 andJanuary 1989.2. Installment plus noninstallment.r--revised. p--preliminary.Note: Details may not add to totals due to rounding.
CONSUMER INTEREST RATES(Annual percentage rate)
19901987 1988 1989 May June July Aug. Sept.
At commercial banksNew cars (48 mo.) 10.46 10.86 12.07 11.82 ... ... 11.80 ...Personal (24 mo.) 14.23 14.68 15.44 15.41 ... ... 15.46 ..Credit cards 17.92 17.79 18.02 18.14 ... .. 18.18 ...
2
At auto finance cos.New cars 10.73 12.60 12.62 12.23 12.58 12.68 12.62 12.34Used cars 14.61 15.11 16.18 16.03 16.00 15.96 15.98 16.03
1. Average of "most common" rate charged for specified type and maturity during thefirst week of the mid-month of each quarter.2. Average rate for all loans of each type made during the month regardless of
maturity.

III-27
suspending indefinitely its new program for buying mortgages on apartment
buildings; it cited its dissatisfaction with the level of delinquencies and
losses on the existing multifamily portfolio. FHLMC reports that
approximately $400 million of its $11 billion multifamily portfolio was at
least 60 days delinquent or in foreclosure as of August 31, 1990. The
largest concentration of multifamily exposure was reported to be in New York
City and Atlanta. FHLMC officials report that multifamily mortgages
accounted for 3.4 percent of the corporation's $322 billion holdings of
residential mortgage loans as of September 30, 1990. Losses to be charged
to reserves for the third quarter for all residential loans totaled $124
million, $81 million of which were from the multifamily portfolio.
Separately, FNMA also announced that it was tightening requirements for
its multifamily mortgage program. The new standards raise the reserves that
apartment projects must carry and lower the maximum acceptable loan-to-value
ratio.
Consumer Installment Credit
Growth in consumer installment credit picked up in the third quarter to
a seasonally adjusted annual rate of 6 percent from just over 2 percent in
the first half of the year. The auto credit component contracted for the
quarter and is down slightly for the year as a whole. Revolving credit, on
the other hand, continued a long-standing pattern of double-digit increases,
accelerating to a 15 percent annual rate in the third quarter. Growth in
the large "all other" component also quickened, continuing a rebound from
the contraction in the first quarter.
The robust expansion of revolving debt has persisted despite
sluggishness in nonauto consumer spending. Conceivably, rather than
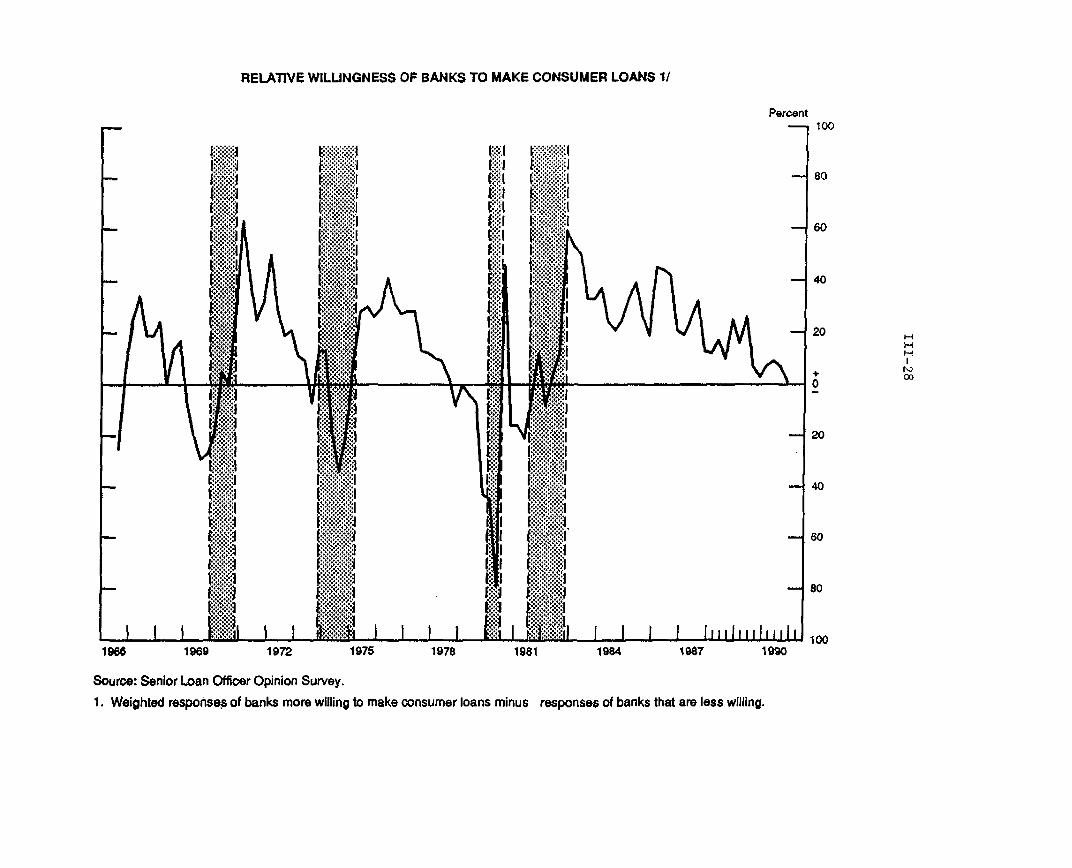
RELATIVE WILLINGNESS OF BANKS TO MAKE CONSUMER LOANS 1/
Percent
1966 1969 1972 1975 1978 1981 1984 1987 1990
Source: Senior Loan Officer Opinion Survey.
1. Weighted responses of banks more willing to make consumer loans minus responses of banks that are less willing.
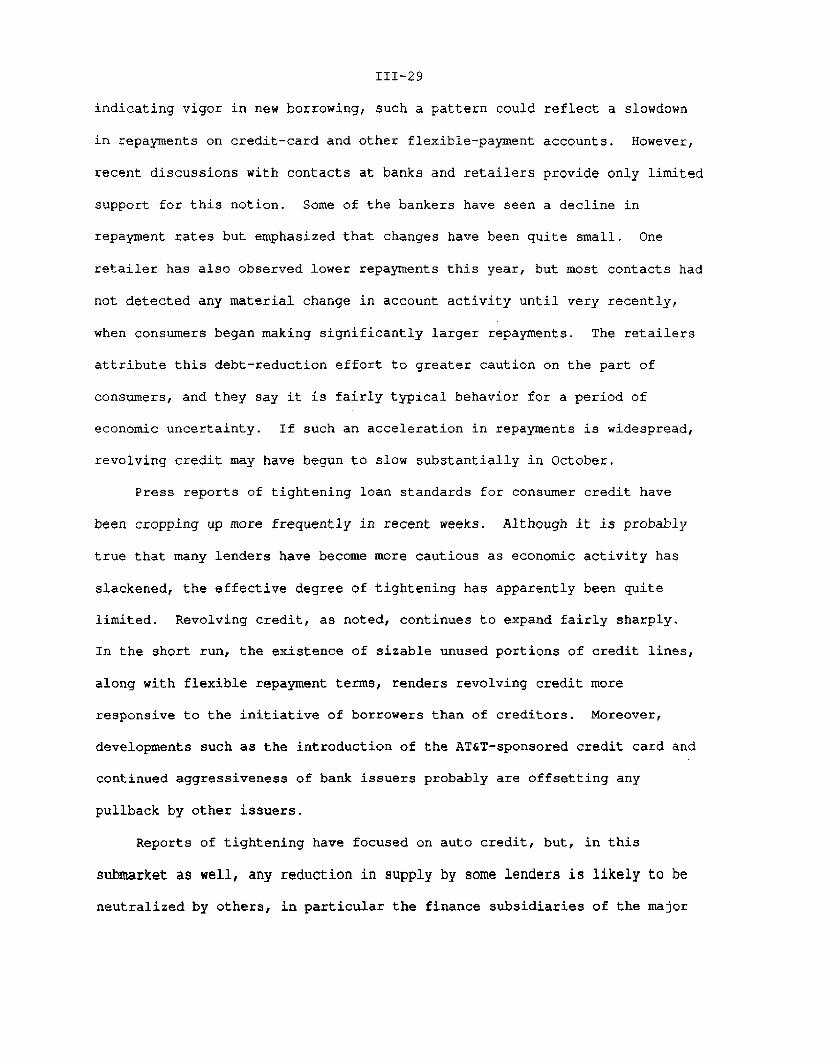
III-29
indicating vigor in new borrowing, such a pattern could reflect a slowdown
in repayments on credit-card and other flexible-payment accounts. However,
recent discussions with contacts at banks and retailers provide only limited
support for this notion. Some of the bankers have seen a decline in
repayment rates but emphasized that changes have been quite small. One
retailer has also observed lower repayments this year, but most contacts had
not detected any material change in account activity until very recently,
when consumers began making significantly larger repayments. The retailers
attribute this debt-reduction effort to greater caution on the part of
consumers, and they say it is fairly typical behavior for a period of
economic uncertainty. If such an acceleration in repayments is widespread,
revolving credit may have begun to slow substantially in October.
Press reports of tightening loan standards for consumer credit have
been cropping up more frequently in recent weeks. Although it is probably
true that many lenders have become more cautious as economic activity has
slackened, the effective degree of tightening has apparently been quite
limited. Revolving credit, as noted, continues to expand fairly sharply.
In the short run, the existence of sizable unused portions of credit lines,
along with flexible repayment terms, renders revolving credit more
responsive to the initiative of borrowers than of creditors. Moreover,
developments such as the introduction of the AT&T-sponsored credit card and
continued aggressiveness of bank issuers probably are offsetting any
pullback by other issuers.
Reports of tightening have focused on auto credit, but, in this
submarket as well, any reduction in supply by some lenders is likely to be
neutralized by others, in particular the finance subsidiaries of the major

III-30
CONSUMER LOAN INTEREST RATES AT BANKS
Percent
Mid-month of quarter
Personal Loans (24 mo.)
New
1972 1975 1978 1981 1984 1987 1990
SPREAD BETWEEN CONSUMER RATES AND TREASURY YIELD
Percentage Points
Mid-month of quarter
19901972 1975 1978 1981 1984 1987
Spread is calculated at the rate on 24-month personal loans at banks lessthe yield on 2-year Treasury securities.

III-31
auto manufacturers. A primary function of these "captives" is to support
the sales efforts of their parent companies by serving as a "lender of last
resort" when banks or other institutions retreat from the market. 5
Personal cash loans, frequently unsecured, would seem to be vulnerable to
tightening, but the "all other" category, of which personal loans are a
major component, has shown some resurgence lately.
Overall, there is little significant evidence in the flow data of
tightening, and survey data do not convey a notable firming of lending
standards although the most recent surveys suggest a slight reduction in
banks' enthusiasm for making consumer loans. In the October Senior Loan
Officer Opinion Survey, the large majority described their banks'
willingness to make consumer loans as virtually unchanged from three months
earlier, whereas in previous surveys a number of respondents had indicated a
greater willingness to make such loans (chart). In addition, consumer
interest rates have shown little tendency to rise this year, either
absolutely or relative to Treasury securities of comparable maturity, as
they might be expected to do if lending practices had tightened
significantly (chart).
5. During the 1980-81 period, for instance, when market interest rates
were exceptionally high but most auto loan rates were capped under tight
state usury ceilings, banks shifted resources sharply away from auto loans.
Auto loans outstanding at banks declined $9.3 billion during the period,while car loans at finance companies (dominated by the captives) rose $16.5
billion. The finance company share of total auto lending rose from just
under 20 percent at the end of 1979 to 33 percent at the end of 1981.6. Consumer interest rates are collected from banks at 3-month intervals.
The next observations will be for the week beginning November 4.

INTERNATIONAL DEVELOPMENTS

INTERNATIONAL DEVELOPMENTS
U.S. Merchandise Trade
Preliminary data for August indicate that the deficit in U.S.
merchandise trade was little changed at $9.3 billion (seasonally adjusted,
Census basis) from a revised deficit in July of $9.1 billion. The small
widening of the deficit in August reflected a sharp increase in the value of
oil imports that was largely offset by gains in exports.
The value of oil imports in August was 21 percent higher than in July.
The quantity imported declined 10 percent from the strong levels of the
preceding three months, but the price of imported oil rose $5 per barrel or
more than 30 percent between July and August.
U.S. MERCHANDISE TRADE: MONTHLY DATA(Billions of dollars, seasonally adjusted, Census customs basis)
Exports ImportsTotal Ag. Nonag. Total Oil Non-oil Balance
(nsa)1990-Jan 31.4 3.6 27.8 41.6 5.9 35.7 -10.2
Feb 31.6 3.4 28.2 38.7 4.7 34.0 -7.1Mar 33.3 3.7 29.6 41.6 4.7 36.9 -8.4
Apr 32.1 3.3 28.8 39.4 3.8 35.6 -7.3May 32.8 3.3 29.5 40.5 4.3 36.2 -7.8Jun 34.2 3.6 30.6 39.6 3.7 35.9 -5.3
Jul r 32.1 3.1 29.0 41.2 4.0 37.2 -9.1Aug p 32.6 3.4 29.2 42.0 4.8 37.2 -9.3
r--revised p--preliminarySource: U.S. Department of Commerce, Bureau of the Census.
For July and August combined, on an estimated balance of payments
basis, the merchandise trade deficit widened from its second-quarter rate,
as sluggish exports were coupled with growing imports (see table on the next
page). Rapid growth in the value of exports in the first quarter of the
year has not been sustained. Declines in exports of capital goods and
IV-1

IV-2
automotive products in July-August were partly offset by increases in
industrial supplies and consumer goods. The decline in capital goods was
largely the result of a drop in the volatile category of aircraft exports.
U.S. Merchandise TradeBillions of dollars, SAAR, BOP-basis
ExportsTotal Agric Nonagric
1987 250 30 2211988 320 38 2821989 360 41 319
1989-1 353 43 3102 364 43 3223 357 40 3184 367 41 326
1990-1 385 44 3412 387 41 346
Jul-Auge 386 40 346
Percent Change (not AR)Jul-Aug/Q2 -0.3 -2.4 0.0Jul-Aug/Q3-89 8.1 0.0 8.8
e--estimatedSource: U.S. Department of Commerce,
Total
410447475
465477477482
490477503
ImportsOil Non-oil
42 36740 40751 424
44 42254 42353 42453 429
62 42848 42954 449
TradeBalance
-160-127-115
-112-113-119-115
-105-90
-117
5.5 12.5 4.75.5 1.9 5.9
Bureau of Economic Analysis.
The increase in the value of imports in July-August was not limited to
oil, as the value of non-oil imports in July-August was higher than the
average of recent quarters. Part of the increase in value, especially in
August, was from an increase in prices that was associated, in part, with
the recent decline in the foreign exchange value of the dollar. The
increase in the quantity of non-oil imports in July-August was in line with
the increase in domestic demand in the third quarter; the rise was
especially noticeable for imports of automotive products, consumer goods,
and capital goods. The quantity of automotive imports rose in August from
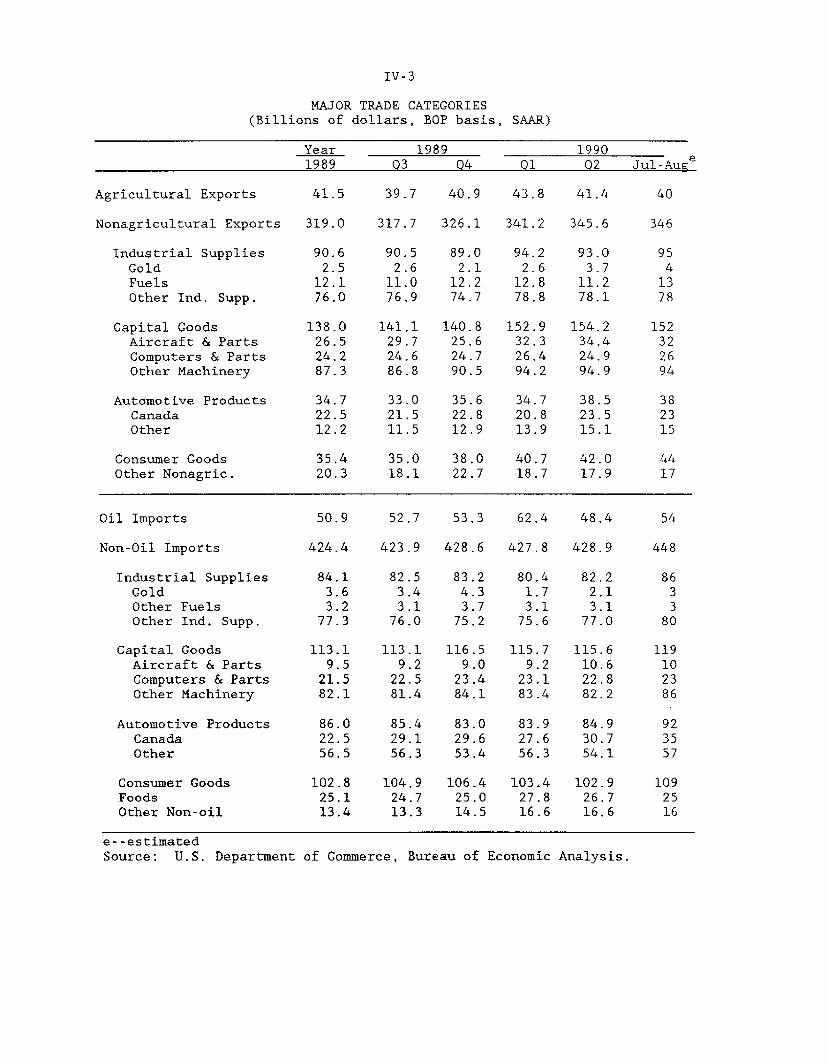
IV-3
MAJOR TRADE CATEGORIES(Billions of dollars, BOP basis, SAAR)
Year 1989 19901989 Q3 Q4 Q1 02 Jul-Aug e
Agricultural Exports 41.5 39.7 40.9 43.8 41.4 40
Nonagricultural Exports 319.0 317.7 326.1 341.2 345.6 346
Industrial Supplies 90.6 90.5 89.0 94.2 93.0 95Gold 2.5 2.6 2.1 2.6 3.7 4Fuels 12.1 11.0 12.2 12.8 11.2 13Other Ind. Supp. 76.0 76.9 74.7 78.8 78.1 78
Capital Goods 138.0 141.1 140.8 152.9 154.2 152Aircraft & Parts 26.5 29.7 25.6 32.3 34.4 32Computers & Parts 24.2 24.6 24.7 26.4 24.9 26Other Machinery 87.3 86.8 90.5 94.2 94.9 94
Automotive Products 34.7 33.0 35.6 34.7 38.5 38Canada 22.5 21.5 22.8 20.8 23.5 23Other 12.2 11.5 12.9 13.9 15.1 15
Consumer Goods 35.4 35.0 38.0 40.7 42.0 44Other Nonagric. 20.3 18.1 22.7 18.7 17.9 17
Oil Imports 50.9 52.7 53.3 62.4 48.4 54
Non-Oil Imports 424.4 423.9 428.6 427.8 428.9 448
Industrial Supplies 84.1 82.5 83.2 80.4 82.2 86Gold 3.6 3.4 4.3 1.7 2.1 3Other Fuels 3.2 3.1 3.7 3.1 3.1 3Other Ind. Supp. 77.3 76.0 75.2 75.6 77.0 80
Capital Goods 113.1 113.1 116.5 115.7 115.6 119Aircraft & Parts 9.5 9.2 9.0 9.2 10.6 10Computers & Parts 21.5 22.5 23.4 23.1 22.8 23Other Machinery 82.1 81.4 84.1 83.4 82.2 86
Automotive Products 86.0 85.4 83.0 83.9 84.9 92Canada 22.5 29.1 29.6 27.6 30.7 35Other 56.5 56.3 53.4 56.3 54.1 57
Consumer Goods 102.8 104.9 106.4 103.4 102.9 109Foods 25.1 24.7 25.0 27.8 26.7 25Other Non-oil 13.4 13.3 14.5 16.6 16.6 16
e--estimatedSource: U.S. Department of Commerce, Bureau of Economic Analysis.

IV-4
already strong July levels (largely from Japan) and may reflect anticipation
of a new model year; such seasonal movements in Japanese shipments in the
past were muted by binding export quotas. Japanese shipments of passenger
cars to the United States were 14 percent less in the April-August period
(the first five months of the voluntary export agreement year) than last
year.
The price of imported oil increased by almost $5 per barrel in August,
responding to the sharp increase in posted and spot prices as in previous
oil market disruptions. Allowing for shipping lags, posted and spot prices
suggest that the price of imported oil should approach $27 in September and
$32 in October.
The quantity of oil imported fell in August despite an increase in oil
consumption that was explained by "end-use" or secondary and tertiary
stockbuilding that is recorded as consumption. All else equal, a decline in
imports and an increase in consumption would imply a relatively large
drawdown in primary stocks. In contrast, weekly Department of Energy (DOE)
data for August indicates an increase in the quantity of oil imported and a
small decline in primary stocks. It is often the case that the weekly DOE
data on imports are revised in the direction of the trade data, suggesting,
again all else equal, that the small DOE decline in primary stocks may
become a larger decline upon revision.
OIL IMPORTS(BOP basis, value at annual rates)
1989 1990 Months
Q3 04 Q1 Q2 May Jun Jul Aug
Value (Bil. $) 52.69 53.29 62.37 48.39 52.32 45.90 49.31 59.10
Price ($/BBL) 16.75 17.67 19.47 15.81 15.76 14.92 14.76 19.69
Quantity (mb/d) 8.55 8.20 8.90 8.41 8.93 8.54 8.98 8.07

IV-5
IMPORT AND EXPORT PRICE MEASURES(percentage change from previous period, annual rate)
Quarters1990
01 02 03(annual rates)
Months1990
Aug Sep(monthly rates)
- BLS Prices - - -Imports, Total
Foods, Feeds, Bev.Industrial Supplies
Ind Supp Ex Oil*Capital GoodsAutomotive ProductsConsumer Goods
Memo:OilNon-oil
Exports. TotalFoods, Feeds, Bev.Industrial SuppliesCapital GoodsAutomotive ProductsConsumer Goods
Memo:AgriculturalNonagricultural
Fixed-WeightImports, Total
OilNon-oil
Exports, Total
Ag.
Nonag.
DeflatorsImports, Total
OilNon-oil
Exports, TotalAg.Nonag.
7.06.7
16.7-0.4
4.51.03.7
54.32.5
1.7-5.32.32.82.73.1
-3.82.6
3.711.5
-0.4-2.29.1
-0.36.9
-6.82.2
-20.1-3.5-0.9-5.10.9
3.3 -47.23.8 -1.8
1.83.30.04.11.86.3
1.45.7
-2.02.61.82.0
28.96.2
114.66.67.44.13.0
664.95.4
3.6-14.914.62.22.22.0
-1.1 7.1 -14.92.1 0.4 7.6
3.00.89.40.00.70.80.3
3.60.9
11.21.91.00.10.6
31.0 28.10.5 0.9
0.1-4.31.50.30.00.0
0.6-0.22.1-0.10.40.3
-4.1 -0.10.8 0.9
- Prices in the GNP Accounts -
4.019.81.7
1.2-4.02.3
2.319.8
-0.2
-0.2-4.00.2
10.148.2
4.9
-12.3-56.7-2.3
3.8 1.52.7 10.74.1 -0.2
5.448.2
2.8
-0.62.7-1.2
-8.7-56.6-1.1
17.6
165.83.6
1.9-12.0
4.9
13.5164.7
1.2
4.7 -2.210.7 -12.04.4 -1.1
*Not for publication.
Year1990-Q31989-03
f
IV-6
Prices of Imports and Exports
Prices of U.S. imports rose very sharply during the third quarter
following a decline in the second quarter, according to data released by
BLS. This was the largest quarterly increase in the BLS index since its
inception in 1982. The jump in total import prices was attributable
primarily to the rise in oil prices. However, prices of non-oil imports
rose 5.4 percent (annual rate) over the third quarter, the largest quarterly
increase in two years. While the rise was spread among all major trade
categories, the strongest increases in prices of non-oil imports were for
capital goods and industrial supplies; the depreciation of the dollar
contributed to the upward movement of import prices.
Prices of exports increased 3.6 percent (annual rate) in the third
quarter. Declines in prices of agricultural exports were offset by
increases in prices of other exports (especially petroleum-based chemicals
and fuels).
U.S. International Financial Transactions
In August, as in July, recorded net capital inflows were significantly
larger than estimates of the current account deficit for these months. (See
the Summary of U.S. International Transactions table.) If this trend is not
reversed by September data, a significant negative statistical discrepancy
will be recorded for the third quarter, partially offsetting the positive
discrepancy of $48 billion recorded for the first half of 1990. The
negative statistical discrepancy in July and August occurred while the
exchange value of the dollar was declining by about 5 percent on a weighted-
average basis.
Large net capital inflows were registered by banks and foreign
official holders in August (lines 1 and 4 of the Summary of U.S.
International Transactions Table); these flows more than offset the moderate
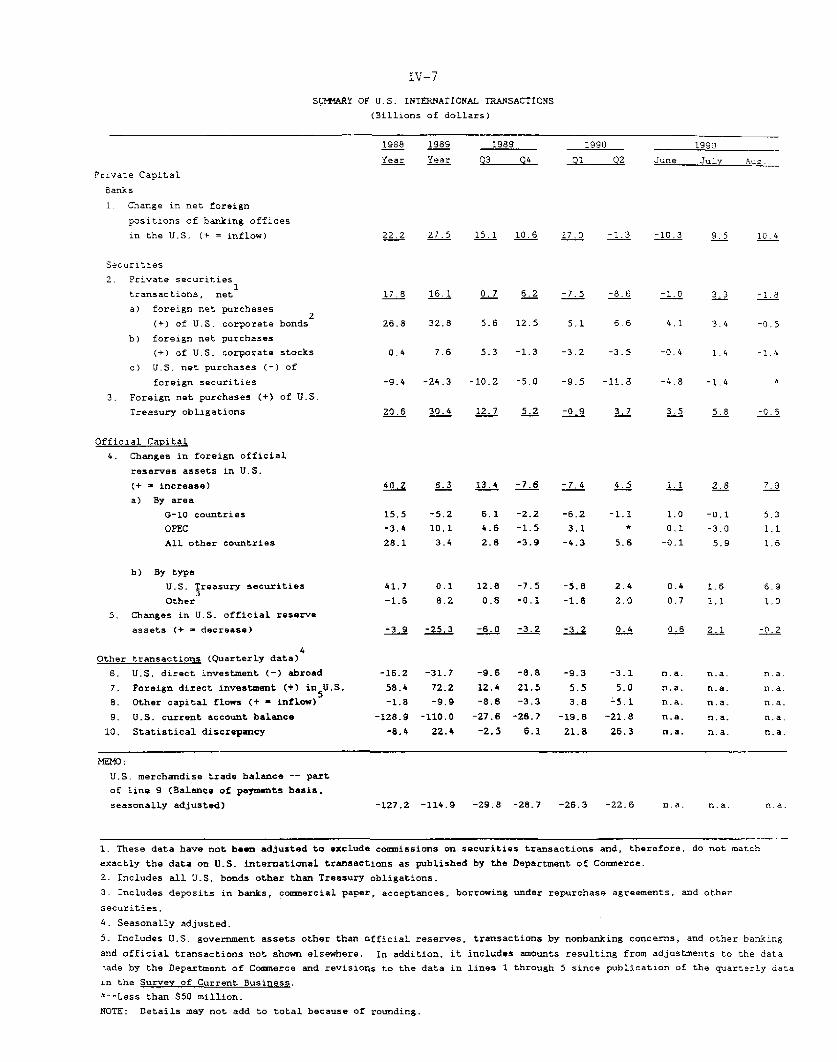
IV-7
SUMMARY OF U.S. INTERNATIONAL TRANSACTIONS
(Billions of dollars)
1988 1989 1989 1990 1990
Year Year Q3 04 01 02 June July Aug.Private Capital
Banks
1. Change in net foreign
positions of banking offices
in the U.S. (+ = inflow)
Securities
2. Private securities1
transactions, net
a) foreign net purchases2
(+) of U.S. corporate bonds
b) foreign net purchases
(+) of U.S. corporate stocks
c) U.S. net purchases (-) of
foreign securities
3. Foreign net purchases (+) of U.S.
Treasury obligations
Official Capital
4. Changes in foreign official
reserves assets in U.S.
(+ = increase)
a) By area
G-10 countries
OPEC
All other countries
b) By type
U.S. Treasury securities3
Other
5, Changes in U.S. official reserve
assets (+ - decrease)
4Other transactions (Quarterly data)
S. U.S. direct investment (-) abroad
7. Foreign direct investment (+) in U.S.
8. Other capital flows (+ - inflow)
9. U.S. current account balance
10, Statistical discrepancy
22.2 27.5 15.1 10.6 17.0 -1.3 -10.3 9.5 10.4
17 8 16.1 0.7 6.2 -7.5 -8.6 -1.0 3.3 -1.8
26.8 32.8 5.6 12.5 5.1 6.6 4.1 3.4 -0.5
0.4 7.6 5.3 -1.3 -3.2 -3.5 -0.4 1.4 -1.4
-9.4 -24.3 -10.2 -5.0 -9.5 -11.8 -4.8 -1.4
20.6 30.4 12.7 5.2 -0.9 3.7 3 5 5.8 -0.6
40.2 8.3 13.4 -7.6 -7.4 4.5 1.1 2.8 7.9
15.5 -5.2 6.1 -2.2 -6.2 -1.1 1.0 -0.1 5.3
-3.4 10.1 4.6 -1.5 3.1 * 0.1 -3.0 1.1
28.1 3.4 2.8 -3.9 -4.3 5.6 -0.1 5.9 1.6
41.7 0.1 12.8 -7.5 -5.8 2.4 0.4 1.6 6.9
-1.6 8.2 0.6 -0.1 -1.6 2.0 0.7 1.1 1.0
-3.9 -25.3 -6.0 -3.2 -3.2 0.4 0.6 2.1 -0 2
-16.2
58.4
-1.8
-128.9
-8.4
-31.7
72.2
-9.9
-110.0
22.4
-9.6
12.4
-8.6
-27.6
-2.5
-8.8
21.5
-3.3
-26.7
6.1
-9.3
5.5
3.8
-19.8
21.8
-3.1
5.0
-5.1
-21.8
26.3
MEMO;
U.S. merchandise trade balance -- part
of Line 9 (Balance of payments basis,
seasonally adjusted) -127.2 -114.9 -29.8 -28,7 -26.3 -22.6 n.a. n.a. n.a.
1. These data have not been adjusted to exclude consissions on securities transactions and, therefore, do not match
exactly the data on U.S. international transactions as published by the Department of Conmerce.
2. Includes all U.S. bonds other than Treasury obligations.
3. Includes deposits in banks, commercial paper, acceptances, borrowing under repurchase agreements, and other
securities.
4. Seasonally adjusted.
5. Includes U.S. government assets other than official reserves, transactions by nonbanking concerns, and other banking
and official transactions not shown elsewhere. In addition, it includes amounts resulting from adjustments to the data
lade by the Department of Commerce and revisions to the data in lines I through 5 since publication of the quarterly data
in the Survey of Current Business.
*--Less than $50 million.
NOTE: Details may not add to total because of rounding.
IV-8
net outflows associated with transactions in private securities and U.S.
Treasury obligations (lines 2 and 3).
For the second straight month banks reported very large net capital
inflows on a month-end basis (line 1), totaling almost $20 billion for July
and August. Most of this total was the result of transactions with own
offices outside the United States. However, daily data reported to the
Federal Reserve on banks' net claims on their own foreign offices and IBFs
indicate that the month-end data are distorted by special factors. Monthly
averages of the daily data show only small net inflows between June and
August, with more substantial inflows on average in September (line 1 of the
International Banking Data table).
Foreign official holdings in the United States increased by $8 billion
in August (line 4 of the Summary table). The increases were broadly based,
with the holdings of the G-10 countries rising by over $5 billion.
Partial
information from FRBNY indicates continued increases in September for G-10
reserves held in the United States.
In August, net capital outflows occurred in all categories of
transactions with respect to private securities and Treasury obligations
(lines 2 and 3). However, the outflow in each category was small to
moderate, and only partly reversed the sizeable net inflows in July. The
small net foreign sales of corporate and U.S. government agency bonds (line
2a) reflected the sharp decline in the volume of new bond issues in August;
data on new issues of U.S. corporate bonds for September and October show no
revival in the market as a whole, and only a small increase in the value of
new offerings sold in the Euromarkets. There was a resumption of net sales

INTERNATIONAL BANKING DATA
(Billions of dollars)
1988 1989 1990
Dec. Mar. June Sept. Dec. Mar. June July Aug. Sept.
1, Net Claims of U.S. Banking
Offices (excluding IBFS) on Own
Foreign Offices and IBFS -4.9 -2.9 -3.9 -6.4 -5.5 -11.7 -11.0 -10.3 -12.6 -15.3
(a) U.S.-chartered banks 21.6 20.4 19.2 14.9 19.2 12.2 7.2 7.4 4.9 5.7
(b) Foreign-chartered banks -26.5 -23.3 -23.1 -21.3 -24.7 -23.9 -18.2 -17.7 -17.5 -21.1
2. Credit Extended to U.S.
Nonbank Residents by Foreign
Branches of U.S. Banks 21.2 24.0 26.0 21.6 20.7 21.8 22.2 22.3 23.0 24.0
3, Eurodollar Holdings of
U.S. Nonbank Residents 1/ 145,3 144.8 131.5 130.3 123.5 110.6 106,5 104.5 106.1 108.5
1. Includes term and overnight Eurodollars held by money market mutual funds. Note: These data differ in coverage and
timing from the overall banking data incorporated in the international transactions accounts. Line 1 is an average of
daily data reported to the Federal Reserve by U.S. banking offices. Line 2 is an average of daily data. Line 3 is an
average of daily data for the overnight component and an average of Wednesday data for the term component.

IV-10
by foreigners of U.S. corporate stocks after July's net inflow ($1.4
billion, line 2b). Net transactions in foreign stocks and bonds by U.S.
residents were virtually zero in August (line 2c).
Private foreigners sold net $0.6 billion of U.S. Treasury securities
in August (line 3). Substantial net sales were recorded by the United
Kingdom, but the World Bank and Japanese residents made large net purchases,
$1.6 billion and $2.1 billion, respectively.
Foreign Exchange Markets
The weighted-average foreign-exchange value of the dollar, in terms of
the other G-10 currencies, has declined more than 4 percent since the
October 2 FOMC meeting, as shown in the accompanying chart. The dollar was
weakened by the long budget stalemate, a slight easing in U.S. monetary
policy, and further signs of weakness in the U.S. economy and in the U.S.
financial system. Nevertheless, the dollar continued to derive some safe-
haven support from developments in the Middle East. The dollar declined
more against the yen (nearly 7 percent) than against the mark (more than 4
percent).
Over the intermeeting period, the yield on the Japanese bellwether
government bond declined 35 basis points, while Tokyo stock prices rose 2-
1/2 percent, on balance, probably reflecting the easing of oil prices and a
pause in Japanese monetary tightening. However, by the end of the period,
the Bank of Japan had nudged the call money rate up 25 basis points.
German stock prices declined about 3 percent, on balance, while the
bellwether bond yield edged off slightly. The German call money rate
remained near or just above the 8 percent Lombard rate, until the Bundesbank
raised the Lombard rate to 8-1/2 percent on November 1. The Bundesbank
claimed that the move was largely technical, to restore the gap between the
Lombard rate and market rates and to reduce the extremely large Lombard

IV-11
WEIGHTED AVERAGE EXCHANGE VALUE OF THE U.S. DOLLARMarch 1973= 100
- 92Daily FOMC
Oct. 2
- -90
7 88
- 86
- 84
- 82
tt ill ill 1 OIllll lli l 111 11111111 soAugust September October November

IV-12
borrowing that has occurred since German monetary union in July. The
Bundesbank also switched to a fixed-rate RP tender at 8 percent, the same as
the minimum accepted rate on the previous flexible-rate tender. Although
the Bundesbank noted that the Lombard rate increase was not intended to lead
to a general rise in German interest rates at this time, German three-month
interest rates responded by rising 20 basis points, and the call money rate
temporarily rose to the new Lombard rate before the Bundesbank injected
short-term liquidity.
The Bundesbank's move was followed by a 1/4 point increase in Dutch
and Belgian official interest rates, but other European central banks did
not follow. In fact, just the day before the Bundesbank's action, the Bank
of France had taken the second of two small steps to ease monetary policy.
First, it had cut reserve requirements on time and savings accounts on
October 16, prompting major French banks to lower their lending rates by 10
to 20 basis points. Later, on October 31, the Bank of France cut its key
money market intervention rate 1/4 point to 9-1/4 percent, citing the
franc's recent strength in the EMS and slow growth in French monetary
aggregates. Following the changes in official rates by Germany and others,
the franc eased about 1/4 percent against the mark to just below its EMS
central rate with the mark.
On October 8, sterling joined the Exchange Rate Mechanism of the EMS,
with allowable deviations of 6 percent from its central rate with other EMS
currencies. At the same time, the Bank of England lowered its official
lending rate by 1 percent. Sterling initially strengthened somewhat and
traded above its EMS central rate, but subsequently weakened amid rumors of
a further cut in U.K. interest rates, and amid political difficulties for
the Thatcher government, including the resignation of Deputy Prime Minister
Howe over Mrs. Thatcher's opposition to European monetary union.
IV-13
Developments in Foreign Industrial Countries
Economic performance in major foreign industrial countries continues
to diverge. Canada and the United Kingdom appear to have entered
recessions. Economic activity in continental Europe has been more robust,
particularly in Western Germany where recent monthly indicators suggest an
acceleration of activity. It appears that the demand stimulus generated by
German economic and monetary union is spilling-over to other European
countries. In Japan, recent monthly indicators suggest some slowing at the
end of the third quarter, but the pace of activity for the quarter as a
whole appears strong.
Inflation has accelerated in most foreign industrial countries,
largely reflecting the recent increases in oil prices. There is little
evidence to date that recent changes in oil prices are causing prices for
other products or wages to accelerate.
On November 1 the Bundesbank raised its Lombard rate by 1/2 percentage
point to 8.5 percent. The Dutch and Belgian Central banks followed with
small increases in their official rates. The Bank of France had lowered its
intervention rate just prior to the Bundesbank's action. The only other

REAL GNP AND INDUSTRIAL PRODUCTION IN MAJOR INDUSTRIAL COUNTRIES(Percentage change from previous period, seasonally adjusted) 1
Q4/Q4 Q4/Q41988 1989
Canada
GDPIP
France
GDPIP
Germany
GNPIP
Italy
GDPIP
Japan
GNPIP
United Kingdom
GDPIP
United States
GNPIP
3.1 2.91.5 -. 4
3.5 3.44.6 2.8
3.4 3.24.0 4.8
3.7 3.07.5 3.3
5.1 4.87.6 4.2
3.8 1.52.5 .3
3.5 1.84.5 1.1
1989
Q4
1990Q1 02 Q3Q1 Q2 Q3
.6 .5 -. 4 n.a.-.8 -1.8 .2 n.a.
.7 .6 .2 n.a.-. 6 -. 2 1.6 n.a.
1.0 3.6 -.9.7 2.4 -. 7
n.a.3.1
.7 .6 -.2 n.a.2.1 -2.3 -1.2 n.a.
.8 2.7 .9 n.a.
.7 .9 1.9 2.4
.4 .9 .3-.0 -. 2 1.9
n.a.n.a.
.1 .4 .1 .4
.0 .2 1.0 .9
1990
May June July Aug. Sept.
x x x X X.5 .3 .6 -1.0 n.a.
.3 .4 2.1 .0 n.a.
2.8 .0 1.5 .7 .5
-2.0 1.0 n.a. n.a. n.a.
2.5 -.2 1.8 .3 -.9
-.9 1.9 -3.4 -.5 n.a.
.5 .6 .2 .1 .2
Latest 3 monthsfrom year ago 2
1.4-2.0
2.11.9
1.91.2
7.56.0
2.3.9
1.12.2
1. Asterisk indicates that monthly data are not available.2. For quarterly data, latest quarter from year ago.

CONSUMER AND WHOLESALE PRICES IN MAJOR INDUSTRIAL COUNTRIES(Percentage change from previous period) 1
Q4/Q4 Q4/Q41988 1989
1989 1990 1990------------------ -------------------- --------------------------- Latest 3 monthsQ2 Q3 Q4 Q1 Q2 Q3 July Aug. Sept. Oct. from year ago
Canada
CPIWPI
France
CPIWPI
Germany
CPIWPI
Italy
CPIWPI
Japan
CPIWPI
United Kingdom
CPIWPI
United States
CPI (SA)WPI (SA)
4.1 5.23.7 .7
1.7 1.4.3 -. 2
.7 1.4-. 4 .6
.7 .8-. 7 -1.0
1.6 3.12.2 4.3
5.2 6.6n.a. n.a.
1.5 2.9-1.4 3.7
6.5 7.64.9 5.2
4.3 4.63.4 4.9
.6 1.1
.3 -. 3
.9 1.1
.3 n.a.
.9 1.0-. 2 n.a.
.5 .4
.6 .2
1.7 1.0 1.8 1.6 1.2 1.41.7 .0 2.5 2.1 -.1 n.a.
.1 .9
.8 -. 3
.5n.a.
.1n.a.
.3n.a.
n.a.n.a.
.3 .6 .5 n.a.X K X X
.3 .4 .7
.8 .3 n.a.
.4 .7
.0 4.0
.4 1.2
.4 .8
2.9 .9 2.0 1.8 4.7 1.61.2 1.2 1.2 1.6 2.1 .9
.7 1.0 2.0
.0 1.2 2.3.9 1.6
-.2 1.4
.6n.a.
.8n.a.
.2 .8 1.1
.3 .2 n.a.
.1 1.0.2 .3
.4-. 1
.9 n.a.
.4 n.a.
.8 .8 n.a.1.3 1.6 n.a.
4.2.2
3.4-2.2
-i
3.0.9
6.36.8
3.0.9
10.46.0
5.54.8
indicates that monthly data are not available.
--
1. Asterisk
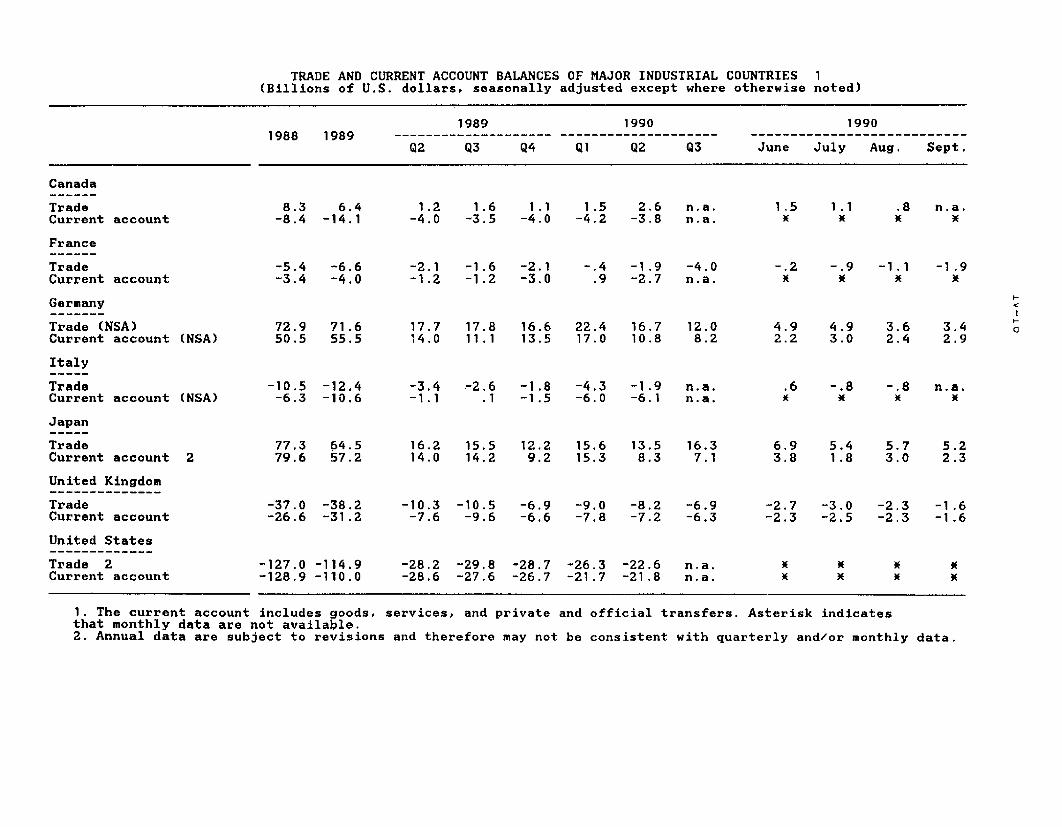
TRADE AND CURRENT ACCOUNT BALANCES OF MAJOR INDUSTRIAL COUNTRIES 1(Billions of U.S. dollars, seasonally adjusted except where otherwise noted)
1988 19891989 1990
Q2 03 04 Q1 Q2 Q3Q2 Q3 Q4 Q1 Q2 Q3
1990
June July Aug. Sept.June July Aug. Sept.
Canada
TradeCurrent account
France
TradeCurrent account
Germany
Trade (NSA)Current account (NSA)
Italy
TradeCurrent account (NSA)
Japan
TradeCurrent account
United Kingdom
TradeCurrent account
United States
Trade 2Current account
8.3 6.4-8.4 -14.1
-5.4 -6.6-3.4 -4.0
72.9 71.650.5 55.5
-10.5 -12.4-6.3 -10.6
77.3 64.579.6 57.2
-37.0 -38.2-26.6 -31.2
-127.0 -114.9-128.9 -110.0
1.2 1.6 1.1 1.5 2.6 n.a.-4.0 -3.5 -4.0 -4.2 -3.8 n.a.
-2.1 -1.6 -2.1-1.2 -1.2 -3.0
-.4 -1.9 -4.0.9 -2.7 n.a.
17.7 17.8 16.6 22.4 16.7 12.014.0 11.1 13.5 17.0 10.8 8.2
-3.4 -2.6 -1.8 -4.3 -1.9 n.a.-1.1 .1 -1.5 -6.0 -6.1 n.a.
16.2 15.5 12.2 15.6 13.5 16.314.0 14.2 9.2 15.3 8.3 7.1
-10.3 -10.5 -6.9 -9.0 -8.2 -6.9-7.6 -9.6 -6.6 -7.8 -7.2 -6,3
-28.2 -29.8 -28.7 -26.3 -22.6 n.a.-28.6 -27.6 -26.7 -21.7 -21.8 n.a.
1.5 1.1N x
.8 n.a.N N
-.2 -.9 -1.1 -1.9
4.9 4.9 3.6 3.42.2 3.0 2.4 2.9
.6 -.8 -. 8 n.a.
6.9 5.4 5.7 5.23.8 1.8 3.0 2.3
-2.7 -3.0 -2.3 -1.6-2.3 -2.5 -2.3 -1.6
* n N
1. The current account includes goods, services, and private and official transfers. Asterisk indicatesthat monthly data are not available.2. Annual data are subject to revisions and therefore may not be consistent with quarterly and/or monthly data.

IV-17
major policy change in recent weeks was the United Kingdom's entry into the
Exchange Rate Mechanism (ERM) of the EMS on October 8.
The process of economic reform and restructuring in Eastern Europe is
progressing unevenly. Poland and Hungary are struggling to meet IMF
performance criteria, and aggregate economic activity in the region
continues to decline. Hard-currency trade for these countries appears to be
developing well, but the full impact on external balance of changes in oil
markets and in trade within CMEA has not yet been felt.
Individual Country Notes. The pace of activity in Japan appears to
have remained generally strong in the third quarter, although some
indicators showed weakness near the end of the quarter. Industrial
production (s.a.) in the third quarter was 2.4 percent above its average
level in the second quarter, and 6 percent above a year earlier. New
machinery orders (s.a.) declined in August, but remained a strong 20.8
percent above their level of a year earlier. Retail sales (s.a.) declined
for the second consecutive month in August, but recorded a strong 12-month
increase of 7.9 percent. New passenger car registrations (s.a.) declined in
September, falling below their level of a year earlier for the first time in
a year and a half. Housing starts (s.a.) declined for the third consecutive
month in August and were slightly below their level 12 months earlier.
Labor-market conditions remained extremely tight. The unemployment
rate (s.a.) edged up to 2.2 percent in September, but remained only slightly
above the 2 percent level of March, which was the lowest since June 1980.
The ratio of job offers to applicants (s.a.) also remained unchanged in
August (at 1.45), just below its June 1990 peak of 1.47, the highest level
reached since February 1974.
Appreciation of the yen appears to have largely offset the
inflationary impact of higher oil prices. Although consumer prices in the

IV-18
Tokyo area (n.s.a.) increased by 1.1 percent in October, most of this
increase appears to have been due to seasonal factors. The 12-month
increase in consumer prices increased only slightly to 3.1 percent.
Wholesale prices (n.s.a.) increased overall by only 0.2 percent in September
and their 12-month rate of increase declined to 0.9 percent from 1.1 percent
the previous month. Wholesale prices of domestically produced goods
increased by 0.5 percent in September, and import prices rose 3.8 percent,
while export prices fell by 3.3 percent.
The current account surplus (s.a.) fell slightly in September to $2.3
billion. However, the cumulative current account surplus through the first
three quarters of the year, at $40.9 billion (a.r.), was $24 billion below
the surplus rate in the corresponding period last year.
Economic performance in Eastern and Western Germany continues to
diverge. In Western Germany, industrial production (s.a.) increased 13
(a.r.) percent in the third quarter to 5.6 percent above the same period in
1989. Although the volume of new orders for West German manufactured goods
(s.a.) fell 1.1 percent in September they were still 7.7 percent above year-
earlier levels after sharp increases in July and August. Most of the
increase in the volume new orders came in domestic orders, which were 11.7
percent above year-earlier levels in September, while foreign orders were up
only 1.3 percent from a year ago. The volume of West German retail sales
(s.a.) in August was up 10.3 percent on a year/year basis. West German
unemployment (s.a.) fell 0.1 percent in October to to 6.9 percent, after
falling 0.2 percent in September. Shipments to Eastern Germany have been an
important source of demand for Western Germany. In July and August,
shipments to Eastern Germany were up 187 percent over the same period in
1989, and the surplus of shipments to Eastern Germany over shipments from

IV-19
Eastern Germany is expected to increase West German GNP by about 3/4 of a
percent in the third quarter.
After collapsing in July, economic activity in Eastern Germany fell
further in August. Industrial production (n.s.a.) fell to 51 percent of its
year-earlier level in August, down from 42 percent in July. Retail sales
(n.s.a.) in August were 45 percent below their level in the same month of
1989, down 1 percent from July. Official East German unemployment (n.s.a.)
was 6.1 percent in October, up from 5 percent in September. The number of
workers engaged in government subsidized "short-time" work (n.s.a.) was
unchanged in October at 20 percent of the labor force. Recent surveys of
managers in Eastern Germany indicate that manufacturing output is expected
to stabilize at current levels over the next 3 months to 6 months.
West German consumer prices (n.s.a.) increased 0.4 percent and 0.7
percent in September and October, respectively, due almost entirely to
increases in energy prices. On a year/year basis consumer price inflation
has increased from 2.4 percent in July to 3.3 percent in October. Import
prices (n.s.a.) increased 2.4 percent in September due almost exclusively to
increases in oil prices, but they remain below year-earlier levels.
The combined German trade balance (n.s.a.) was $48 billion (a.r.) in
the third quarter. This compares with a West German trade balance of $71
billion (a.r.) for the third quarter of 1989.
West German M3 increased rapidly in August and September, but for the
year to date monetary growth remains moderate. Compared with the fourth
quarter of 1989, West German M3 (s.a.) grew at an annual rate of 5 percent
through September, up from 3.8 percent through July, but within the
Bundesbank's 4 to 6 percent target range.
The Bundesbank raised its Lombard rate by 1/2 a percentage point to
8.5 percent on November 1. The Bundesbank said that it did not want to

IV-20
increase market interest rates at this time. Rather, the change in the
Lombard rate was intended to reduce excessive Lombard borrowing that had
emerged since the establishment of a Germany monetary union on July 1. The
Bundesbank's first securities repurchase auction following the change in the
Lombard rate, held on November 7, was a so-called "volume tender" with a
fixed rate of 8 percent.
The third supplemental budget for 1990, passed in late October,
envisions a Federal deficit in 1990 of DM 67 billion, or 2.8 percent of
projected GNP. This compares with a West German deficit of DM 15 billion in
1989, that is, 0.7 percent of GNP. Additional expenditures related to
unification account for almost the entire increase of the expected deficit.
The ruling Christian Democratic coalition fared well in recent
elections in the five new states of Eastern Germany and in Bavaria. It now
appears likely that Chancellor Kohl's coalition government will win the
all-German Federal election scheduled for December 2.
Recent data indicate a firming of economic activity in France,
following slow second-quarter growth. GDP (s.a.) growth was only 0.7
percent (a.r.) in the second quarter, after a rise of 2.5 percent in the
first quarter. The slowing of GDP in the second quarter was primarily due
to reduced investment spending and poor export performance. More recently,
industrial production (s.a.) for July and August (reported as a single
observation) rose 2.3 percent compared with the average for May and June.
Inflation picked up in August and September.
Consumer prices (n.s.a.) rose 0.5 percent in September and 0.6 percent
in August, after an average monthly increase of 0.2 percent during the
previous year. In both August and September, energy prices accounted for
the bulk of increases in inflation.

IV-21
The French trade deficit has deteriorated recently. The September
deficit (s.a.) was $1.9 billion, compared with $1.1 billion in August and a
total of $6.3 billion for the first nine months of the year. Both an
increase in the energy import bill and a decrease in exports contributed to
the larger deficit. In spite of the deterioration in France's total trade
balance, and a significant deterioration against the European community as a
whole, France's trade deficit with Western Germany (s.a.) narrowed in
September relative to both the previous month and the same month in 1989.
Second-quarter GDP (s.a.) in Italy declined 0.8 percent (a.r.) from
the previous quarter, to a level 1.9 percent above that of a year earlier,
due to a sharp fall in inventories and a small decline in investment.
Strength in other components of aggregate demand suggest that this slowdown
may prove temporary. Consumption growth was relatively stable at 2 percent
(a.r.), while exports grew 16 percent (a.r.). Industrial production (n.s.a)
rose in July and August to 2.3 and 1.5 percent, respectively, from levels a
year earlier, also suggesting continued strength.
In October, consumer prices (n.s.a.) were 6.2 percent above
year-earlier levels, roughly the same as in September and August. The trade
balance (n.s.a.) registered its third consecutive surplus in August. The
cumulative 8-month trade deficit for 1990 is 30 percent below that of a year
earlier, due, in part, to a 14 percent increase in exports to Germany.
The cabinet approved budget changes that will reduce the projected
1991 fiscal deficit by 3 percent of GDP. The package includes equal amounts
of spending cuts and tax increases with a small contribution from the sale
of state properties. If these changes are adopted, the deficit will fall to
roughly 9-1/2 percent of projected GDP, compared with 11.2 percent in 1989.
Recent data indicate that the United Kingdom entered a recession in
the third quarter; industrial production (s.a.) declined 0.5 percent in

IV-22
August after falling 3.4 percent in July. In the latest three months, total
industrial output was 0.9 percent below the previous 3-month period while
manufacturing output was 1.2 percent below the previous period. The volume
of retail sales (s.a.) rose 0.6 percent in September to a level 0.3 percent
above a year ago. Retail sales volume in the third quarter was 0.9 percent
below that of the previous quarter.
Inflation has continued to worsen. Year-over-year consumer price
inflation (n.s.a.) rose to 10.9 percent in September. Excluding mortgage
interest rates and the poll tax, consumer prices rose 1 percent in September
bringing the underlying rate of inflation to 8.3 percent. Wages have
continued to accelerate; in August, the 12-month increase of average
earnings was 10.9 percent.
The current account improved significantly in September, as imports
continued to decline and exports rose. For the year through September,
however, the cumulative current account deficit (s.a.) was $28.2 billion
(a.r.), down only slightly from 1989's record deficit.
On October 8, Britain joined the exchange rate mechanism (ERM) of the
EMS, with a central rate of 2.95 DM/ and deviation margins of 6 percent.
The government also lowered its money market dealing rates by 100 basis
points at the same time.
Canadian real GDP (s.a.) dropped 1.6 percent (a.r.) in the second
quarter, as consumption and investment expenditures fell broadly. Finance
Minister Wilson has indicated that GDP also fell in the third quarter.
Almost all indicators of activity and demand have been negative. Retail
trade (s.a.) declined 0.2 percent and manufacturers' new orders (s.a.) fell
1.1 percent in August. Industrial production (s.a.) fell 1 percent, and new
motor vehicle sales (s.a.) dropped 3 percent in August. The unemployment
rate (s.a.) increased 0.5 percent in August and 0.1 percent in September

IV-23
to 8.4 percent. Bankruptcies were also up sharply in September from a
year ago.
The deceleration in year-over-year inflation recorded during the past
12 months has stalled. The consumer price index (n.s.a.) rose 0.3 percent
in September, as fuel prices rose 1.7 percent. Year-over-year inflation
remained for the third consecutive month at 4.2 percent (4.1 percent
excluding food and energy).
Developments in East European Economies
Poland failed to meet IMF performance criteria on growth of the wage
bill and of domestic credit in the third-quarter review of its $725 million
stand-by arrangement. Credit to the agricultural and housing sectors,
particularly through loans at subsidized interest rates, were key problem
areas.
In September, the 12-month decline in industrial sales by state-owned
firms was 24 percent. However, private sector sales were up 25 percent in
the first half-year compared with the same period last year. The general
price index (n.s.a.) increased 4.6 percent in September after rising only
1.8 percent in August. The National Bank of Poland raised interest rates in
October to 3 percent per month (about 43 percent on an annual basis).
Poland's 1990 hard-currency trade surplus was $3.4 billion through
September, compared with $0.7 billion for all of 1989. As of the end of
September, Poland's international reserves had more than doubled to $5.4
billion since the beginning of the year. Presidential elections are
scheduled for November 25. The two major candidates are Solidarity leader
Lech Walesa and Prime Minister Tadeusz Mazowiecki.
Industrial production in Hungary contracted about 10 percent in the
first eight months of 1990. In a continuing effort to keep the budget

IV-24
deficit within IMF guidelines, newly enacted fiscal measures are designed to
reduce outlays by more than 2 percent of GDP.
Twelve-month consumer price inflation was 26 percent in August.
Continued reductions in subsidies and price increases for oil products will
likely push the rate for 1990 as a whole to over 30 percent. After
demonstrators blocked roads to protest the 65 percent increase in gasoline
prices in October the price increase was cut to 35 percent.
Hungary achieved a hard currency trade surplus of $628 million in the
first eight months of 1990, compared with $537 million for all of 1989.
This performance occurred despite a drought-induced drop in agricultural
exports.
Gross industrial output (n.s.a.) in the Czech and Slovak Federal
Republic fell 3.7 percent in the first eight months of 1990 compared with a
year earlier. September figures for unemployment suggest about 30,000
unemployed, less than 1 percent of the work force.
Inflation may reach 10 percent this year although comprehensive price
controls are still the norm in the CSFR. Gasoline prices were increased by
more than 30 percent in October. The State Bank increased the discount rate
from 5 to 7 percent in September after increasing it from 4 to 5 percent in
August.
Total trade (n.s.a.) fell 5.9 percent in the first half of 1990,
despite a near 15 percent increase in exports to non-CMEA countries. CSFR
authorities estimate the potential loss in export revenues on contracts
canceled after German unification at about $375-$500 million. The koruna
exchange rate was devalued by about 35 percent against the dollar in October
to 24 Koruna/$.
IV-25
Economic Situation in Major Developing Countries
Argentina's inflation rate declined in October, mainly due to reduced
monetary growth and an increase in the demand for money. After some delay,
the country was also successful in arranging the sale of its telephone
system, with the transfer to the buyers to take place on November 8.
Brazil's debt restructuring proposal offered to commercial bank creditors in
early October was rejected by the banks. IMF Executive Board consideration
of the $2 billion stand-by arrangement for Brazil has been delayed until
Brazil makes adequate progress in negotiations with commercial bank
creditors. Mexican financial markets became less volatile in October, with
a decline in the Treasury bill rate and an increase in stock prices. On
October 10, the rights to convert $2.5 billion in external debt into
approved investments were auctioned at a 52 percent discount to 29
successful bidders. Venezuela continued to move forward with its debt
reduction package, and on October 18 implemented an arrangement to buy back
$1.4 billion (face value) of public sector debt at a 55 percent discount.
Individual country notes. In Argentina, consumer price inflation fell
to 7.7 percent in October, after rising slightly to 15.7 percent (monthly
basis) in September from 15.3 percent in August. There were marked public
sector price hikes at the beginning of September, as well as increases in
monetary growth during the month due to purchases of foreign exchange by the
central bank. Moreover, the operational (i.e., cash) fiscal balance is
believed to have turned negative in September after having been in surplus
during the previous months of 1990.
Notwithstanding these adverse developments, inflation declined in
October because of a reduction in monetary growth, an improvement in the
fiscal situation, and a rebound in the demand for money. An increase in the
IV-26
value-added tax from 13 percent to 15.6 percent, which was announced in mid-
October, should enhance progress toward fiscal adjustment in the coming
months. However, the deepening financial problems of the provincial
governments may pose a threat to this progress.
On October 4, the consortium of Bell Atlantic and Manufacturers
Hanover withdrew its bid to purchase the northern half of the country's
telephone system, ENTEL. The offer to purchase these operations was then
made to, and accepted by, a consortium consisting of STET (an Italian
telephone company), France Cable et Radio, Perez Companc (an Argentine
industrial conglomerate), and J.P. Morgan. The transfer of the company,
which was scheduled for October 8, has been moved back to November 8. The
consortium that won the original bid for the southern half of Argentina's
telephone system, Telefonica de Espana and Citibank, will also complete its
purchase on November 8.
Brazil's IMF stand-by arrangement of SDR 1,449 million (about $2
billion) has not yet been scheduled for Executive Board consideration,
pending the results of Brazil's negotiations with commercial bank creditors.
Progress has been extremely slow. On October 10-12, the Brazilian
government presented its debt restructuring proposal to the Bank Advisory
Committee (BAC) and indicated that Brazil's domestic fiscal situation limits
the payments that it can make to external creditors. The government also
considers bank debt to be subordinate to the debt owed to international
financial institutions and bilateral official creditors.
Brazil's proposal consisted of three options for the restructuring of
term bank debt owed by the public sector: 1) a 45-year zero coupon bearer
bond with annual redemptions limited to Brazil's "capacity to pay," and with
an option for larger redemptions if real GDP growth and international
reserves exceed certain levels; 2) a low-interest, 25-year bullet maturity

IV-27
bond with interest rates rising to 7 percent per annum by the year 2000; and
3) a 15-year very low-interest bullet maturity "exit" bond. The BAC
immediately rejected the proposal. Representatives from the creditor banks
were in Brazil during the last full week of October to obtain more
information on the data underlying Brazil's proposal.
The government has postponed the sale of Petroquisa, the first
enterprise scheduled to be privatized. The company holds interests in the
petrochemical, steel and shipping industries. The delay appears to be due
to a disagreement concerning the budgetary impact from selling the
Petroquisa shares as a block, as opposed to selling the shares of a
particular group of firms. There is also some concern that sales of a block
of shares would create a private sector monopoly since anti-trust
enforcement in Brazil is weak.
Consumer prices rose 14.2 percent in October. Monthly consumer price
inflation had remained about 12 to 13 percent since July. Economic activity
through August remained weak compared with last year's levels, and since
September appears to have deteriorated significantly. Industrial output in
August was 8 percent lower than a year earlier. Real interest rates were 10
percent per month in September, reflecting tight monetary policies plus
investors' reluctance to hold assets with the banking system. The high real
interest rates, a decline in sales, and adverse conditions in certain
commodity markets have contributed to a rise in the number of corporations
seeking protection from creditors since early September.
Brazil's trade surplus for the first nine months of this year was $9.2
billion, down 30 percent from the $13.1 billion surplus in the same period a
year earlier.
In Mexico, the financial markets were less volatile after late
September, as fears of rising inflation due to the Gulf crisis abated. The

IV-28
28-day Treasury bill rate, which had increased by 100 basis points from mid-
August to late September, fell throughout October. At the October 29
auction, it was 26.5 percent, 350 basis points below the September 25 level.
The Mexico City stock market index, which had fallen by 23 percent from late
July to late September, recovered in October and was 16 percent higher on
November 5 than on September 28--the previous low. In September, the CPI
was 1.4 percent higher than in August and 28.7 percent higher than in
September 1989.
On October 31, international reserves including gold, were $8.4
billion, up $1.3 billion since July 31, when they were last reported. The
increase reflects the rise in oil prices, as well as continuing inflows of
private capital. The latter included the downpayments of 5 percent required
to be made in foreign exchange by the successful bidders, whether Mexican or
foreign, in the debt-equity swap auction held October 10 pursuant to the
bank financing agreement completed last March. The auction covered debt
with a face value of $2.5 billion. Seventy-two bids totalling $3.6 billion
were submitted, and 29 were accepted at a 52 percent discount. As the swap
rights are exercised over the next 18 months and the debt is reduced, the
corresponding collateral provided by Mexico under the bank agreement will be
released and an equivalent amount will be added to Mexican reserves.
Recently published data show that Mexico had a $300 million
merchandise trade deficit in July, the third straight monthly deficit, and
that the cumulative trade surplus for January-July was only $121 million.
In these seven months, imports were about 19 percent higher than in the same
period of 1989, while exports were only about 4 percent higher. If Mexico's
oil export prices average $26.75 per barrel over the last five months of the
year, after averaging $13.75 over the first seven months, and if other trade

IV-29
trends continue with little change, Mexico may end the year with a trade
surplus of about $750 million, compared with one of $2.4 billion in 1989.
The debt reduction package for Venezuela continues to move forward as
scheduled. Banks holding $19,540 million, or about 99 percent of the
medium-term public sector external debt to commercial banks, have selected
one of the five options offered. Only 36 banks, including several Kuwaiti
institutions holding about $200 million of debt, have not selected an
option. The breakdown by option stands at $1,411 million for the buyback,
$1,792 million for principal reduction, $7,420 million for permanent
interest reduction, $2,917 million for temporary interest reduction, and
$6,000 million for the new money option.
The buyback operation, structured as a bond swap, was implemented on
October 18. The holders of $1,411 million (face value) of medium- and long-
term Venezuelan public sector debt exchanged their claims for $635 million
worth of 90-day U.S. Treasury bills, the holders thus receiving about 44
cents on the dollar at the time. Operations to implement the remaining
options are to be carried out by the end of the year.
Inflows of financial capital due to optimism generated by increased
oil export revenues and some slackening of inflation led to upward pressure
on the bolivar in August and September. As the Venezuelan central bank
resisted the appreciation, the monetary base rose substantially. The
increased liquidity led to a reduction in the yield on three-month central
bank bills from 42 percent per annum in August to 17 percent in early
October. As interest rates fell, capital reflows abated, allowing the
central bank to boost the yield on its bills to 20 percent by the end of
October. The exchange rate, which has fluctuated in a range of 46 to 50
bolivars per dollar since early this year, presently stands at about 49
bolivars per dollar.