FOM-RIJNHUIZEN CONTRIBUTIONS TO IAEA TECHNICAL …
56
SEPTEMBER 1989 ^Yj^W-'tfceJk-» Nrt^.wV_ S*\- [ FOM-RIJNHUIZEN CONTRIBUTIONS TO IAEA TECHNICAL COMMITTEE MEETING ON ECE AND ECRH, SEVENTH JOINT WORKSHOP ON ECE AND ECRH (EC-7), HEFEI, P.R. CHINA, 8-11 MAY 1989 RIJNHUIZEN REPORT 89-186 Tliis work was performed as pan of the research programme of the association agreement of Euratom and the 'Stichting voor Fundamenteel Onderzoek dor Materie' (POM) with finanaal support trom the 'Medorlandso Organisatie voor Wetenschappelijk Onderzoek' (NWO) and Euratom.
Transcript of FOM-RIJNHUIZEN CONTRIBUTIONS TO IAEA TECHNICAL …

SEPTEMBER 1989
^ Y j ^ W - ' t f c e J k - » N r t ^ . w V _ S * \ - [
FOM-RIJNHUIZEN CONTRIBUTIONS TO IAEA TECHNICAL COMMITTEE MEETING ON ECE AND ECRH, SEVENTH JOINT WORKSHOP ON ECE AND ECRH (EC-7),
HEFEI, P.R. CHINA, 8-11 MAY 1989
RIJNHUIZEN REPORT 89-186
Tliis work was performed as pan of the research programme of the association agreement of Euratom and the 'Stichting voor Fundamenteel Onderzoek dor Materie' (POM) with finanaal support trom the 'Medorlandso Organisatie voor Wetenschappelijk Onderzoek' (NWO) and Euratom.
FOM-RIJNHUIZEN CONTRIBUTIONS TO IAEA TECHNICAL COMMITTEE MEETING ON ECE AND ECRH, SEVENTH JOINT WORKSHOP ON ECE AND ECRH (EC-7),
HEFEI. P.R. CHINA, 8-11 MAY 1989
RIJNHUIZEN REPORT 89-186

C O N T E N T S
page
1. Measurements on Waveguide Components for ECRH on RTF, 1 AG A. Verhoeven. H. Duit, P. Manintveld, R.W. Polman, A. Yildirim
2. A Polarizing Minor for Electron Cyclotron Resonance Heating on RTP; 10 F.MA. Smits
3. Electron Cyclotron Heating of High Density JET H-Mode Discharges; 19 E. Westerhof. R.W. Polman. TJ. Schep '
4. Electron Cyclotron Current Drive and m=2 Mode Stabilization in NET; 32 G. Guruzzi. TJ. Schep, E. Westerhof
5. A Doublre-Hetenxfyne ECE Radiometer for the Measurement of Small Temperature Fluctuations on RTP 46 M. Verreck. C.AJ. Hugenholtz

1
MEASUREMENTS ON WAVEGUIDE COMPONENTS FORECRHONRTP
A.G.A. Verhoeven, H. Duit, P. Manintveld,
R.W. Polman, A. Yildirim
FOM-Instituut voor Plasmafysica Rijnhuizen, Associatie EURATOM-FOM,
P.O. Box 1207, 3430 BE Nieuwegein, The Netherlands.
/ Summary
A design is presented of the transmission-line system for Electron Cyclotron Resonance
Heating of the Rijnhuizen Tokamak Project (RTP). The rf power, produced by three 60 GHz,
200 kW gyrotrons, will be conducted to the tokamak by means of overmoded waveguides.
The power of the first gyrotron will be launched into the RTP plasma from die low magnetic
field side in the equatorial plane. It will be radiated perpendicular to the plasma in the O-mode;
the power that is not absorbed on the first pass is reflected on a mode-converting mirror. The
power of the second and third gyrotron will be launched from the high field side (HFS)
through top ports and will couple to the X-mode. Here the angles of incidence with respect to
the plasma will be variable to obtain almost full single-pass absorption and heating of the
selected flux surfaces.
The required elliptical polarization for the top-launched waves will be obtained by means of a
waveguide polarizer. This polarizer has a circular cross-section at both ends and a gradual
squeeze in between. Measurements were made to analyse the efficiency and mode purity.
The ends of the top launchers are curved HE] i waveguides. Antenna patterns for the launcher
bends were measured. The efficiency and the mode content of several components of the
waveguides were measured using a k-spectrometer.
2 The ECRH system on RTP
The RTP ECRH facility will use three 60 GHz Varian gyrotrons. Each of the gyrotrons can
deliver more than 200 kW of microwave power for pulses up to 100 ms1. This facility was
used on the TFR tokamak in France and was moved to Rijnhuizen. The output power of each
gyrotron is controlled by switching on the anode voltage in two steps. This enables very tast
rise times2. Modulation of the ECRH power by feedback control3 using diagnostic signals
from the plasma is under investigation.

2
The main parameters of the RTP tokamak, formerly in operation in Grenoble as Petula, are: a
major radius of 0.72 m, a minor radius up to 0.18 m and a toroidal magnetic field up to 2.5 T.
First ECRH experiments on RTP are scheduled for the end of 1989.
3 Transmission lines
The power will be launched into the RTP plasma both from the low magnetic field side through
pons in the equatorial plane and from the high field side through top ports4. Two top launchers
and two outside launchers are envisaged, see Fig. 1. Since three gyrotrons are available, the
outside launcher I and the top launcher II will be connected permanently to a gyrotron.
Depending on the experimental programme, the third gyrotron will be connected either to
inside launcher Ilia or to outside launcher Hlb. The three transmission lines are similar from
gyrotron up to TEni - TEn converter inclusive. After the converter the diameter of line I is
tapered up from 27.8 to 63.5 mm to match for the single-disc BeO vacuum window. In trans
mission lines II and III, the TEoi - TEn converters are followed by the elliptic waveguide
polarizers, the TEn - HEn converters and 90°HEii bends.
if ^sr^o=«ii t^i
•IKptic T c . _
polarizer c o n v ( ! r I e r
. A f W r i - . ^ , . .
•MpttC T C ue I t , , -MS:,,
polarizer converter
-C 3 =
Ovarii window
•tfjutlabl* foe u* ling
„ - - \ : / ^ L-A w «•emir* \ V I"/ ^̂ -+r \ window w»ve guide \ ! / \ plawnaX
antenna x . ~ i taper rood» X-mod»
b«lll>W*L
arc detector
* magnpi g y r o f i n 80 GWl j ? 0 0 kW
100 m»
gyrotron mounf
loeusiing 1/ mirror» - »
'' . \ ••/}
Fig. 1 The transmission lines for ECRH on RTP.

3
4 Launchers
The launcher in pon I is an open-ended smooth waveguide with a diameter of 63.S mm radi
ating the Ordinary (O) mode (E//B). At the opposite torus wall a grooved mirror will be
mounted to reflect the unabsorbed power in the Extraordinary (X) mode ( E1B). A smooth
mirror or an absorber material are also being considered as alternatives. The same approach will
be used for launcher Illb.
However, here the waveguide wall has to
be corrugated to prevent decomposition of
the HEn mode. The top launcher consists of a bent corrugated waveguide with an inner diameter of 27.8 mm. A quartz window will be mounted at the end of the bend. A parabolic mirror will direct and focus the microwave beam. Different flux surfaces in the plasma can be reached by adjustment of the mirror (see Fig. 2).
5 Single-pass absorption
Single-pass absorption is calculated for
waves propagating in fundamental O- or
X-mode (B = 2.14 T), or in 2nd harmonic
X-mode (B = 1.07 T)5. For fundamental
O-mode in a 1 keV RTP-size plasma with
central resonance, the single-pass
absorbed power fraction is up to 0.65.
Higher absorption (> 0.95) occurs for high Te (> 3 keV). The cut-off density of the waves is
Bco = 4.471019 m 3.
Second harmonic X-mode shows almost complete absorption (> 0.99) for a 1 keV plasma,
br' the cut-off density is halved to 2.23-1019 nr3. First harmonic X-mode shows better
absorption in an extended density range: up to 8.9-1019 nr3.
However, the power must be launched obliquely to the magnetic field from the high Meld side
to reach the gyroresonance regions directly.
A high single-pass absorption for n« = 1 - 8-1019 nr3 is found for various magnetic fields and
a wide range of injection angles.
Figure 3 shows the absorbed power fraction as a function of the central density for three
values of the toroidal field. Comparison with fundamental O-mode and 2nd harmonic X-mode
launching shows the superior properties of the HFS fundamental X-mode injection scheme for
RTP.
The launching antennae. Top: poioidal cross-section. Bottom: toroidal cross-section.

4
f
A
- r f ! 1 ! 1 [ 1 !
—
1 . 0 ~/"1 $ , . 1 X W -
0 . 8 -jZY. -
0 . 6
0 . 4 _
0 . 2
i I
1 -
n n i I 1 i ; i i 1 * L
n0 (10
6 8 10
)
Fig. 3. Single-pass absorption as a function of the central density. High field side launch IX: X-mode, fundamental frequency. 9 = 125°, $ = -45°, where $ is the angle between the projection of the beam on the equatorial plane and the major radius, and 8 is the angle between the beam and the vertical direction. o: central resonance -: resonance at -a/2 +: resonance at +a/Z. Low field side launch. lO: Omode, perpendicular, fundamental frequency. 2X: X-mode,. perpendicular, 2nd harmonic.
6 Elliptical polarization
For optimum oblique X-mode HFS launch, adjustable elliptical polarization of the waves is
required. The required elliptical polarization is given as a function of the toroidal launch angles
in Fig. 4. Calculated is with resonance in the center of the plasma and a plasma density of
2xl01 8 nr3 in the region of the mirror.
In our Institute two ways of obtaining an
elliptically polarized wave are studied: a. Waveguide polarizer Elliptical polarization is made by a waveguide polarizer. b. Polarizing grooved mirror An elliptical polarized wave is produced by the reflection of a linearly polarized wave on a grooved metal plate. The ellipticity of the reflected wave is a function of the angle of incidence, of the groove dimensions and of the polarization direction of the incident wave. Calculations and measurements are presented in a separate paper 6 .
U)
Ui
t 0 . 4 -
0 . 2
0 . 0 30 60 90
angle in toroidal direction (deg.3
Fig. 4. Required elliptical polarization as a function of the launch angle.
7 Elliptical waveguide polarizer
Elliptical polarization can be made by a waveguide polarizer7. This polarizer principally
consists of a circular waveguide which is gradually squeezed to an ellipse in the middle. At
both ends the cross-section is circular. The squeeze as a function of the distance is a sine
square. A fl/2 phase difference between the field components perpendicular and parallel to the
squeeze direction after passing through the polarizer is obtained. This approach is described by
5
J.L. Doane8 from Princeton. Our polarizer was developed in cooperation with M. Thumm
from 1PF Stuttgart9.
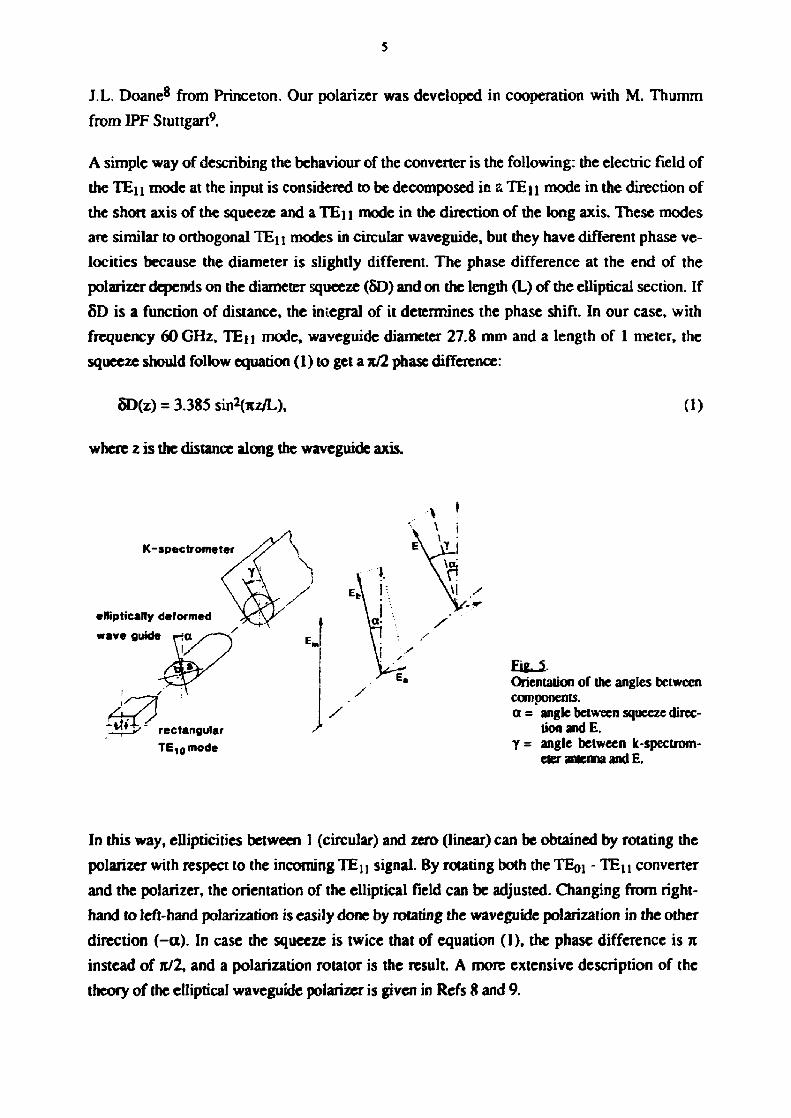
A simple way of describing the behaviour of the converter is the following: the electric field of
the TEii mode at the input is considered to be decomposed ic a TEn mode in the direction of
the short axis of the squeeze and a TEi i mode in the direction of the long axis. These modes
are similar to orthogonal TEn modes in circular waveguide, but they have different phase ve
locities because the diameter is slightly different. The phase difference at the end of the
polarizer depends on the diameter squeeze (5D) and on the length (L) of the elliptical section. If
5D is a function of distance, the integral of it determines the phase shift. In our case, with
frequency 60 GHz, TEn mode, waveguide diameter 27.8 mm and a length of 1 meter, the
squeeze should follow equation (1) to get a TC/2 phase difference:
5D(z) = 3.385 sin2(icz/L), (1)
where z is the distance along the waveguide axis.
•(-spectrometer
elliptically deformed
wave guide
_>-' rectangular
TE10mode
S
Orientation of the angles between components. ot= angle between squeeze direc
tion and E. Y = angle between k-spectrom-
eter antenna and E.
In this way, ellipticities between 1 (circular) and zero (linear) can be obtained by rotating the
polarizer with respect to the incoming TEj i signal. By rotating both the TEQI - TEj i convener
and the polarizer, the orientation of the elliptical field can be adjusted. Changing from right-
hand to left-hand polarization is easily done by rotating the waveguide polarization in the other
direction (-a). In case the squeeze is twice that of equation (1), the phase difference is TC
instead of it/2, and a polarization rotator is the result. A more extensive description of the
theory of the elliptical waveguide polarizer is given in Refs 8 and 9.

6
8 Measurements on the waveguide polarizer
Measurements were performed by means of the k-spectrometer by fixing the antenna at the angle for the TEn mode peak (6.05 degrees) and rotating the spectrometer around the waveguide axis10. The total power in unwanted modes (< 0.1%) could easily be measured without changing the circuit. More details on the measuring circuit are given in the next paragraph.
Using the geometric set-up given in Fig. 5 an equation can be derived which expresses the dependence of the antenna signal as a function of the angles a and y. The power is proportional to:
.2 %
0 . 0 * 10 20 30 40 50 60 70 80 90
position of polarizer a Cdeg.)
Fig. 6. Ellipticity (E/Emax) as a function of polarizer angle. m • =*£, calculated Q t = IE/2, measured • 0 = 0.8-H/2, calculated O 4 = 0.8-7T/2, measured
P~ E- [cosa-cos(a-Y) + sina-sin(a-Y)-cos<M2 + [sina-sin(a-y)-sin<t>]2, in
(2)
where:
P = measured power in the k-spectrometer, and
<|> = phase difference between Ea and E^ at the end of the elliptical waveguide.
fraojuancymetor
GuoMBCiaJor SO 6Hz
isolator
adaptor
mm parabofcanMnna
mechanic arm V
i s o a P r tempcontrol
wsrwouicte under tost
attenuator TE10 « T E 0 1
(9 mm -*• 27 A mm)
(TE°o-TE°0,)
GunrHfoda 60.16 GHz
Fig. 7. Mode purity measurements with the k-spectromcter.
In Fig. 6 the ellipticity is given as a function of the polarizer angle for two different squeezes.
For an exact circular polarization, the phase difference has to be exactly ic/2. The squeeze

7
might partly be in the inelastic deformation regime of the waveguide material. Therefore
squeezing the waveguide was performed in steps and the microwave properties of the polarizer
were measured between steps. One for a phase difference of 0.8 7C/2 and one for a phase
difference of fl/2.
9 Measurements on waveguide components
Some of the components of the transmission lines that connect the gyrotrons with the RTP
tokamak have been used before during the FOM campaign on the TFR tokzmak in France. At
that time there was no k-spectrometer available to measure the mode content inside the
waveguides.
The components were manufactured by Thomson-CSF except for the arc detectors, waveguide
polarizer and compensator, which have been made in our Institute.
8
4
9 0
- 4
L.
A
- 8
- 1 2
- 1 6
- 2 0 - 2 2 - 2 4
0 10 20 30 40 50 60
*• ft (deg.)
Fig. 8. Mode content of the TE02-TE01 converter.
The results of the mode purity measurements with the k-spectrometer are given in TABLE 1.
For each component the total percentage of the power in unwanted modes is listed. Further
more the spurious modes with the highest power fractions are given.
The specifications of the manufacturer are given in the last column. Measured figures were
higher than specified for each component, in case figures were available.
The compensator was made in our Institute in an attempt to improve the existing bellows,
which we suspected to produce too high a percentage of unwanted modes. This appeared tc be
true indeed for elongations over 10 mm, but for short elongations we could measure as low as
0.1 % in unwanted modes. The compensator has only a slightly higher percentage (0.3 %) of
unwanted modes but has a maximum elongation of only 1 mm. An advantage of this
compensator is that, since it consists of two gliding concentric parts, alignment is a lot easier.

Table 1
8
Mode purity measurements
Waveguide component Total percentage of unwanted modes
including r
indicated by manufacturer
Bellows TE02 63.5 mm 1.9% 0.9% TE01 0.4%TE!2 Taper TE02 63.5-27.8 mm 0.9% 0.7% TE01 0.1% Converter TEOI-TE02 5.2 % 3.2% TE01 1.7%TEo3 2.0% Bellows TE01 27.8 mm 0.1% 0.1%TEi2 Compensator TE01 27.8 mm 0.3% 0.2% TE12 Converter TEoi-TEn 4.8% 2.3%TEoi 1.2%TE4i 4.0% Taper TEll 27.8-63.5 mm 0.5% 0.5% TE2i 0.1%
Arulekctor TE02 27.8 mm 1.7% 1.0%TEQI
DC Break TE01 27.8 mm 0.3% 0.1%TEi2 Waveguide polarizer 0.1% 0.1%TE2i
10 Measurements on the HFS launcher bend
The prototype 55° HEn launcher bend is 59 cm long and has a sine square contour as pro
posed by M. Thumm. After electroforming a straight corrugated copper waveguide in our
Institute, the first antenna pattern (Fig. 9, curve 1) was measured. Compared with the ideal
Gauss-curve (Fig. 9. thick line) a substantial amount of power (in the order of 10 %) was
measured in wrong mode. Placing the complete straight waveguide in a very accurately fitting
housing decreased the percentage of unwanted modes substantially (~ 1%). After placing the
waveguide in the closely fitting 55° bend, again antenna patterns were measured. With both
E 1 bend (curve 3) and E // bend (curve 4) a slight increase of wrong modes was measured.
All curves are normalized in amplitude and angle.
Measurements on the effect of the bend on the elliptical polarization are foreseen in the near
future.
11 Conclusions
It is clear from our measurements that it is very well possible to obtain elliptical polarization of
TE11 mode ECRH power by using the waveguide elliptical polarizer. AH required ellipticities
can be produced, introducing only a very low percentage of unwanted modes. The orientation
of the elliptical field can be adjusted by rotating both the TEni-TEn converter and the
polarizer.
Mode purity measurements on some of the waveguide components showed a higher than ex
pected fraction of the power in unwanted modes. Antenna patterns of the HEi 1 bend showed
that a precise constructed narrow guidance improved the mode purity substantially.

9
-3d -2ef -rf O tf 2e 3tf
Fig. 9. Antenna-patterns for 55° HEn bend. 1. Straight corrugated copper waveguide. 2. Straight in precisely guiding cage. 3. Bend (E ± plane of bend) 4. Bend (E // plane of bend) All curves are normalized in amplitude and angle.
Acknowledgements
We thank M. Thumm for the calculations on elliptical deformation of the waveguide. This
work was performed under the Euratom-FOM association agreement with financial support
from NWO and Euratom.
References [1] A.G.A. Verhoeven et ai, Proc. EC-5, 5th Int. Workshop on EC and ECH, San Diego,
Cal. (1985) p. 303. [2] A.G.A. Verhoeven et al., Proc. 11th Symp. on Fusion Engineering, Austin, Texas
(1985) p. 724. [3] A.G.A. Verhoeven, Proc. 14th Symp. on Fusion Technology, Avignon (1986) Vol. I,
p. 75. [4] P. Manintveld, A.G.A. Verhoeven, Proc. 7th APS Top. Conf. on Appl. of RF Power
to Plasmas, Kissimmee, Florida (1987) p. 25. [5] R.W. Polman et al, Proc. 16th Eur. Conf. on Controlled Fusion and Plasma Phys.,
Venice (1989) Vol. in, p.l 139. [6] F.M.A. Smits, this conference [7] P. Manintveld and A.G.A. Verhoeven, Proc. 15th Symp. on Fusion Technology,
Utrecht (1988) p. 81. [8] J.L. Doane, Int. J. Electron. 61 (1986) 1109. [9] M. Thumm and H. Kumric, 12th Int. Conf. on Infrared and Millimetre Waves, Lake
Buena Vista, Florida (1987). [10] W. Kasparek and G.A. Muller, Int. J. Electron, 61 (1988) 5.
10
A POLARIZING MIRROR FOR ELECTRON CYCLOTRON RESONANCE HEATING ON RTP
F.M.A. Smits
FOM-Instituut voor Plasmafysica Rijnhuizen, Associatie EURATOM-FOM,
P.O. Box 1207, 3430 BE Nieuwegein, The Netherlands
Abstract
A means of producing a wide range of elliptical polarizations of an electromagnetic wave by
using a rotatable corrugated mirror at arbitrary total reflection angles and a variable polarization
direction of the linearly polarized incident wave is presented. For the description of the
reflection process, TM- and TE-like modes are defined. The phase shift between them
determines the range of elliptical polarizations that can be achieved at given angles of incidence.
The phase shift has been calculated for mirrors with rectangular grooves. A method has been
developed to determine the phase shift from measurements on the reflected field. Experimental
results are in good agreement with theory. The polarization method has been implemented for
use on RTP, the Rijnhuizen Tokamak Project, and the mirror dimensions have been optimized
for this purpose.
Introduction
RTP (Ro = 0.72 m, a = 0.18 - 0.16 m, B0 < 2.5 T) is dedicated to the detailed investigation of
transport phenomena in tokamak plasmas. Electron Cyclotron Resonance Heating (ECRH)
experiments are planned with three 60 GHz, 200 kW, 100 ms Varian gyrotrons. Electron
cyclotron waves will be launched in the first harmonic X-mode from the high field side and in
the O-mode from the low field side. The X-mode waves will be launched from a focussing
mirror at a wide range of poloidal and toroidal angles [1]. The focussing mirror assures a good
localization of the power deposition (±2 cm). For optimum oblique X-mode launch, adjustable
elliptical polarization of the waves is required. Reflection of a linearly polarized wave on a
grooved mirror to obtain elliptical polarization has been used already on DITE and DIII-D.
However, the launching angles in RTP are arbitrary, and therefore a detailed analysis of the
reflection process is required. As a first step, a flat mirror has been used, and a plane wave is
assumed wh;.ch is representative for the center of the beam.

11
Fig. 1. The spherical and rectangular coordinates and the incident and reflected fields.
Method
The geometry of the reflection setup is given in Fig. 1. A nearly Gaussian, linearly polarized
beam is launched from a 27.8 mm diameter corrugated waveguide operating in the HEn mode
onto a corrugated mirror. The y-axis is chosen along the grooves, the x-axis is perpendicular to
the grooves in the plane of the mirror, and z is chosen perpendicular into the mirror surface.
The spherical coordinates 6 and <f> are defined in the usual manner, kj and kr are the incident and
reflected wave vector, respectively. E^ and Eg are the electric field components in <J> and 9
direction. Subscripts i denote incident, while subscripts r denote reflected. The orientation of
the incident electric field is determined by y . The elliptical polarization of the reflected wave is
characterized by the Poincaré angles a and (3. (3 determines the ellipticity of the wave and the
orientation (left-hand or right-hand), while a gives the rotation angle of the ellipse. The
ellipticity tg (5 of the X-mode wave is determined by the angle between kr and the magnetic field
B0 [2], The launching geometry and the choice of the launching angles of the electron cyclotron
wave give the rotation angle a. The choice of the launching angles also fixes the total reflection
angle 29. Typical values for RTP are: 22" < 9 < 46". The groove parameters (width, period
and depth) are fixed. The free variables are the orientation of the grooves in the plane of the
mirror (angle <(>), and the polarization direction of the incident wave (angle y). y can be
changed by rotating the TE0]-TEj| converter in the transmission line. Afterwards, the TEn
mode is convened into the HEn mode. The mirror is a polarization sensitive reflector for
which one field component penetrates into the grooves while the other is reflected at the
surface. If the groove depth is adjusted such that the phase shift between the components is
90", any ellipticity can be achieved by adjusting y and <J>. For a given ellipticity, two solutions

12
for Y and 0 are possible. Rotations of 180* in \y or <J> are not considered as different solutions.
For phase shifts not equal to 90', ellipticities near 1 (circular polarization) can not be achieved.
Analysis
At arbitrary angles of incidence, the ordinary TE- and TM-modes are coupled upon reflection
on a grooved mirror. It has been shown by Altschuler and Goldstone [3] that the diffraction
problem of a plane electromagnetic wave by an infinitely conducting structure which is uniform
in one direction can be decomposed into two independent scalar problems by decomposing the
incident electromagnetic field into two infinite orthonormal sets of so-called E-type and H-type
modes. These modes renmin decoupled upon reflection. I will refer to them as TE-like and TM-
like modes, respectively, since they reduce to the familiar TE- and TM-modes when the plane
of incidence is perpendicular to the grooves. The TE-like and TM-Iike modes are determined
from the conditions Hy = 0 and Ey = 0, respectively [4]. If the groove period p obeys p < XI (1
+ sin 8 cos <{J), where X is the wavelength, only the zeroth order vacuum mode is propagating
[5]. In the far field description, higher order modes can therefore be incorporated in the zeroth
order mode reflection coefficients. Further references to the TE- or TM-like mode will only
concern the zerom order mode. The fact that they are decoupled is expressed by the following
reflection matrix for the electric field of the TE- and TM-like mode:
PTE
^ J
fr™ o ^
o r TM
V
/ i ;TM\
- I E (1)
A l )
The exp i(tot - k-r) dependence has been dropped for simplicity. The reflection coefficients r ™
and lfTE are functions of the groove dimensions and of the angles of incidence 9 and <(>. We will
now express the fields of the TE- and TM-like modes in terms of the electric field components
in spherical coordinates. A straightforward, but laborious treatment has been given by Hanfling
et al. [6], The following derivation is more elegant and provides a better physical
understanding. The TM-like mode component of the incident field satisfies Ey = 0. In spherical
coordinates this yields:
Ey = cos 9 sin <{> Ee + cos ty E^ = 0. (2)
The radial field coordinate is zero since the wave is transverse. We define a new variable ^ by
tg$ = tg<|>-cos9, (3)

13
where £ lies in the same quadrant as <j> for cos 0 positive, and -£ lies in the same quadrant as <J>
for cos 8 negative. Then Eq. (2) can be written as:
sin £ EQ + cos 2; E^ = 0. (4)
This is satisfied if we define the electric field of the TM-like mode as:
• T M . pTM 0 TM^pTMf c o s ^
- s in^J ' = E = E' (5)
e ™ is the unit vector in TM-direction.The first vector component denotes the 0 coordinate, and
the second gives the $ coordinate. The radial coordinate is left out since it is always zero. The
same reasoning can be followed for the magnetic field of the TE-like mode.
Using ET6 = - (k x H1"6) / coe , one can define the electric field of the TE-like mode as:
E T E = E T E e T E = ETE (sint," (6)
eT E is the unit vector in TE-direction. Combining (5) and (6) yields for arbitrary polarizations:
/ C TM \
:TE
'cos ^ -sin 4'
sin ^ cos % j
(**'
S (7)
This holds for the incident field and for the reflected field, where £r = -^ since 8r = n - %
Fig. 2. Drawing of the unit vectors e. Indices i and r arc left out for brevity. The reflected TE- and TM-like modes are parallel and perpendicular to the (kr,y)-plane. The incident TE- and TM-like modes are defined in the same way but with respect to the (kj.y)-plane. The spherical unit vectors eg and CA are parallel and perpendicular to the (k,z)-plane respectively, for both the incident and the reflected wave.
/(kr,y)-plane
k {k,,y)-plane
plane, parallel to the (x. y) -plane
14
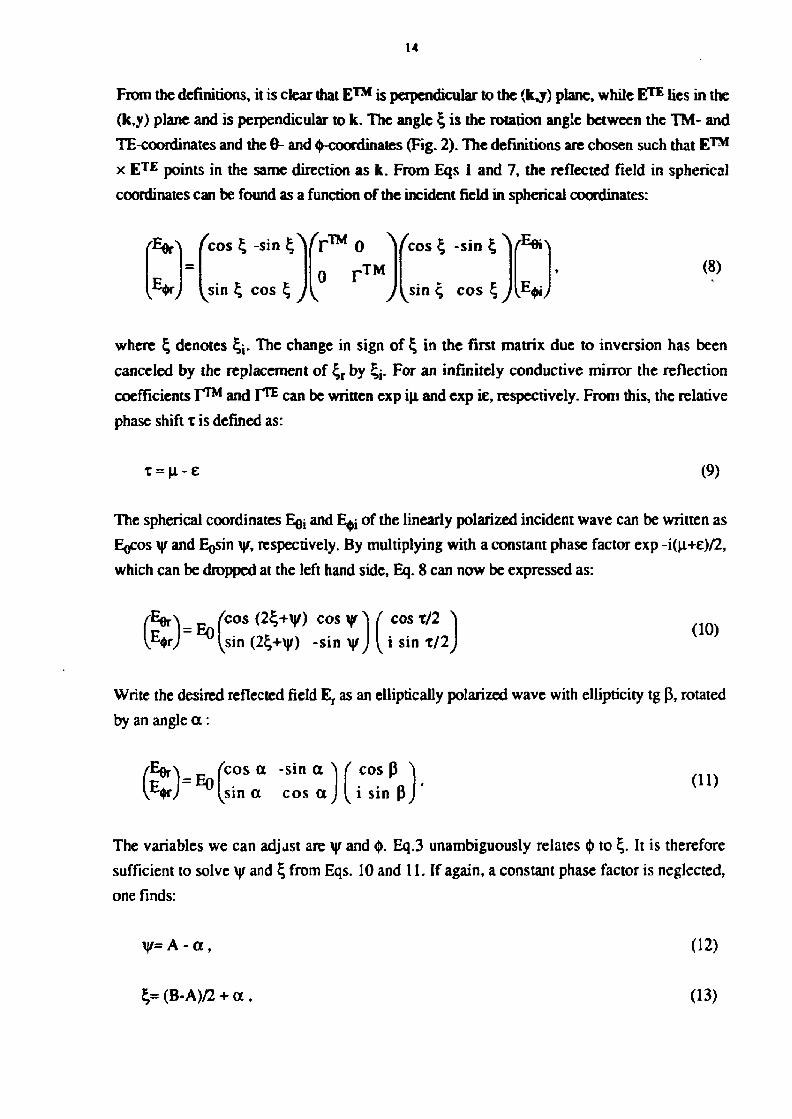
From the definitions, it is clear that E™ is perpendicular to the (kjr) plane, while E?E lies in the
(k,y) plane and is perpendicular to k. The angle £ is the rotation angle between the TM- and
TE-coordinates and the 6- and (^-coordinates (Fig. 2). The definitions are chosen such that E™
x ETE points in the same direction as k. From Eqs 1 and 7, the reflected field in spherical
coordinates can be found as a function of the incident field in spherical coordinates:
'EfoA /cos £ -sin !p
^¥J \̂ sin ^ cos £ >
rr™ 0 V c o s % -sin \ Y E e i^
o r ™ ^ J\smc, cos %) \£w
(8)
where 2; denotes £j. The change in sign of s in the first matrix due to inversion has been
canceled by the replacement of £r by £,-. For an infinitely conductive mirror the reflection
coefficients r ™ and P ^ can be written cxp iu. and exp ie, respectively. From this, the relative
phase shift x is defined as:
T = U,-£ (9)
The spherical coordinates Eg, and E*; of the linearly polarized incident wave can be written as
Eocos y and Eosin y, respectively. By multiplying with a constant phase factor exp -i((4.+e)/2,
which can be dropped at the left hand side, Eq. 8 can now be expressed as:
(SH 'cos ( 2 ^ + Y ) cos v >
sin (2£+\|/) -sin \|f (10)
Write the desired reflected field Er as an elliptically polarized wave with ellipticity tg p\ rotated
by an angle a :
« 0 ,
V*yJ ^ I si net 'cos a -sin a >
cos a
cos P N
i sin P> 01)
The variables we can adj jst are y and <)>. Eq.3 unambiguously relates <}> to £. It is therefore
sufficient to solve y and £ from Eqs. 10 and 11. If again, a constant phase factor is neglected,
one finds:
\f= A - a,
\= (B-A)/2 + a t
(12)
(13)
15
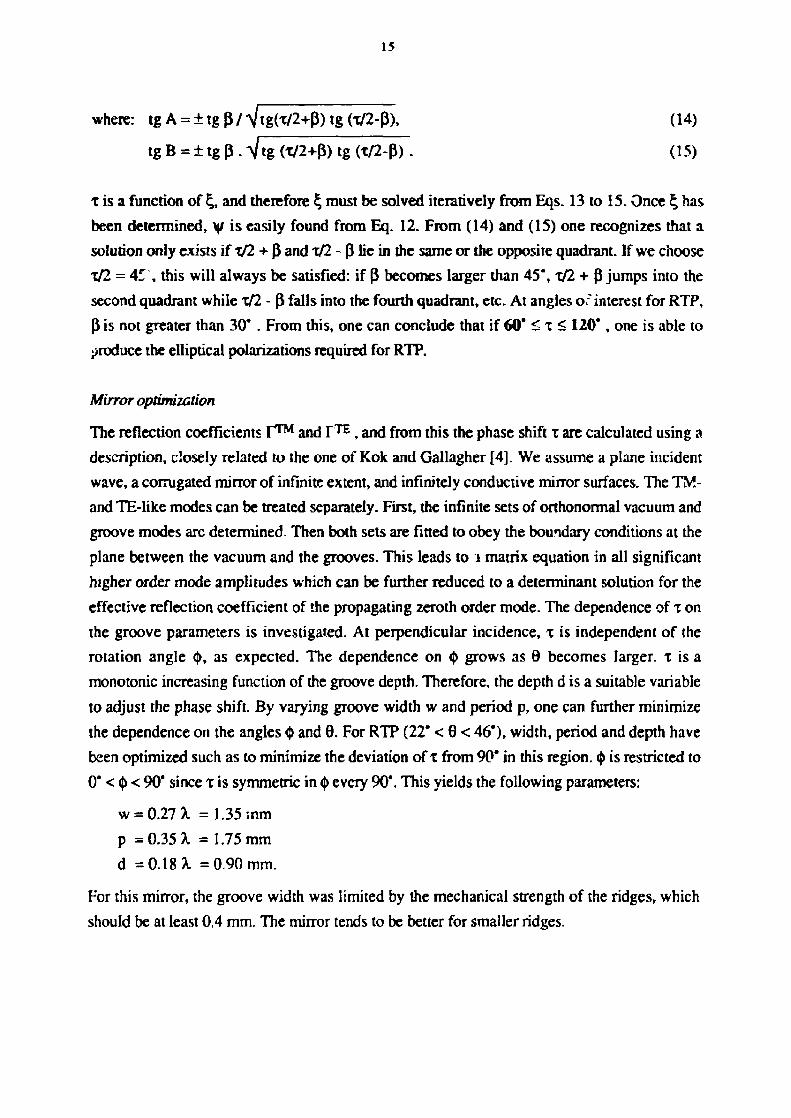
where: tg A = ± tg 3 / V*g(T/2+3) tg (t/2-3), (14)
tg B = ± tg p . V tg (t/2+p) tg (T/2-P) . (15)
t is a function of £, and therefore £ must be solved iteratively from Eqs. 13 to 15. Once £ has
been determined, \|/ is easily found from Eq. 12. From (14) and (15) one recognizes that a
solution only exists if x/2 + 3 and t/2 - 3 lie in the same or the opposite quadrant. If we choose
x/2 = 45 , this will always be satisfied: if 3 becomes larger than 45*, t/2 + 3 jumps into the
second quadrant while x/2 - 3 falls into the fourth quadrant, etc. At angles o; interest for RTP,
3 is not greater than 30* . From this, one can conclude that if 60" <x< 120", one is able to
produce the elliptical polarizations required for RTP.
Mirror optimization
The reflection coefficients r ™ and Y'1^, and from this the phase shift x are calculated using a
description, closely related to the one of Kok and Gallagher [4]. We assume a plane incident
wave, a corrugated minor of infinite extent, and infinitely conductive mirror surfaces. The TM-
and TE-Iike modes can be treated separately. First, the infinite sets of orthonormal vacuum and
groove modes arc determined. Then both sets are fitted to obey the boundary conditions at the
plane between the vacuum and the grooves. This leads to I matrix equation in all significant
higher order mode amplitudes which can be further reduced to a determinant solution for the
effective reflection coefficient of the propagating zeroth order mode. The dependence of x on
the groove parameters is investigated. At perpendicular incidence, x is independent of the
rotation angle <]>, as expected. The dependence on <J) grows as 9 becomes larger, t is a
monotonie increasing function of the groove depth. Therefore, the depth d is a suitable variable
to adjust the phase shift. By varying groove width w and period p, one can further minimize
the dependence on the angles $ and 8. For RTP (22* < 0 < 46'), width, period and depth have
been optimized such as to minimize the deviation of t from 90" in this region. $ is restricted to
0" <<><90" since xis symmetric in <J>every 90*. This yields the following parameters:
w = 0.27X = 1.35 mm
p =0.35 X - 1.75 mm
d =0.18X =0.90 mm.
For this mirror, the groove width was limited by the mechanical strength of the ridges, which
should be at least 0,4 mm. The mirror tends to be better for smaller ridges.

16
Measurements
In the measurement setup, a nearly Gaussian linearly polarized beam is produced by a tumable
launching structure which can adjust the polarization direction of the incident wave (angle y).
The mirror is placed just behind the Fresnel diffraction region of the waveguide to minimize
spurious coupling and to validate the plane wave approximation in the center of the beam. The
diameter is chosen large enough to avoid diffraction at the edge. A device has been constructed
to adjust the reflection angles 0 and 6 of the mirror, and to hold the receiver at the center of the
reflected beam. The receiver measures Eg and E^ simultaneously (Fig. 3). A corrugated circular
hom antenna receives boch components at die same time on the same place. The onhomode
attenuator isolator
E); u oscilloscope
F vT 3dBc oj—. outputs v ^
scala horn antenna
Ks>=©^ phase isolator shifter
Fig. 3. Receiver setup.
transducer separates the field components, and the local oscillator combined with a mixer for
each channel downconverts both signals to IF frequencies, while the phase is maintained. The
phase shifter and attenuator are inserted for calibration purposes, and isolators are inserted to
prevent residual power, which is reflected from the mixers, to cause cross talk on the other
channel. An oscilloscope operating in XY-mode directly visualizes the polarization of the
incoming wave. The phase shift x can be measured as follows: Choose \y = - £ - 45% then the
matrix in Eq. (10) reduces to a simple rotation matrix of angle t, - 45*. The vector in Eq. (10)
then determines the ellipticity tg x/2 . If we now visualize the ellipse on the oscilloscope, and
then measure the main axes C and D of the ellipse, t is obviously determined from:
T = 2tan-,(C/D) (16)
Despite the isolators, the measurement setup suffered from some cross talk between the
signals. An analysis has been made of the influence on the results, and a correction has been
performed after the cross talk parameters were determined experirr tally.

17
Results
• "O
120 -
105 -
Although t is symmetrie in 0 every 90*. measurements were performed for 0* < ^ < 180" to
check for experimental asymmetries. 6 has been chosen to be 25", 35*. and 45*. The groove
width, period and depth were chesen as above. The results are given in Fig. 4. The graph
shows that x is in the range required for RTP. Good agreement is observed for all angles of
incidence. It is well known from high power experiments that rectangular grooved minors
suffer from arc breakdown [7J.
Therefore, a mirror with rounded 135
ribs has been produced having the ~
same main parameters as the
rectangular mirror (Fig. 5). At pre
sent, there is no theory available on
this configuration.Thc measure
ments (Fig. 6) show that the phase
shift is somewhat lower than in the
rectangular case at all angles of
incidence. This can be understood
from the fact that the TE-like
mode will penetrate somewhat
more into the grooves because of
the roundings. One can correct for
this by increasing the groove depth.
High power experiments still must
be done to check if arc breakdown
is prevented by this mirror.
01
4
fig. 4. Measurements for the rectangular grooved mirror. Crosses indicate measurements, while calculations are given by solid lines.
rs 0.4 mm la w>
0.90 mm
'J 0.2 mm v
1.35 mm—•'
1.75 mm
Fig. 5. Dimensions of the mirror with rounded ribs. Fig. 6. Measurements for the mirror with rounded ribs.
IS
Conclusions
1. A method has been developed to produce elliptically polarized waves using a corrugated
mirror at a wide range of total reflection angles. The desired ellipticities can be made by
adjusting the polarization direction of the linearly polarized incident wave and the direction of
the grooves in the plane of the mirror. Arbitrary ellipticiries and orientations of the ellipse can
be produced in the region near perpendicular incidence.
2. A method has been developed to determine the phase shift x of the TM-like mode with
respect to the TE-like mode from reflected field measurements at arbitrary angles of incidence.
The experimental results are in good agreement with theory. Therefore, at low power, the
corrugated mirror is an adequate instrument to produce arbitrary elliptically polarized waves.
3. The mirror dimensions have been optimized for use on RTP. The phase shift x lies within
the required range for most angles of interest for RTP.
4. Measurements are also performed on a mirror with rounded ribs. No theory is available on
this configuration, but from the measurements it is seen that also this mirror can produce the
range of ellipticities required fa RTP if a correction is made on the groove depth.
A cknowledgement
This work was performed under the Euratom-FOM association agreement with financial
support from NWO and Euratom. The author wishes to thank Dr. R.W. Polman for carefully
reading the manuscript.
References
[1] R.W. Polman et aL, Proc. I6th Eur. Conf. on Contr. Fusion and Plasma Phys., Venice (1989) Part III, p. 1139.
[2] Th.H. Stix, "The Theory of Plasma Waves", McGraw-Hill, New York (1962). [3] H.M. Altschuier, L.O. Goldstone, IRE Trans. Microwave Theory Tech., MTT-7 (1959)
213. [4] Y.-L. Kok, N.C. Gallagher, J. Opt. Sue. Am. A5 (1988) 65. [5] R. Petit, ed. Electromagnetic Theory of Gratings, Vol. 22 of Topics in Current Physics,
Springer-VerUg, Berlin (1980). [6] J.D. Hanfling et al., IEEE Trans. Ant. Prop., AP-29 (1981) 622. [7] A.N. Dellis et al., Proc. 6th Joint Workshop on ECE and ECRH, Oxford (1986)
p. 347.
19
ELECTRON CYCLOTRON HEATING OF HIGH DENSITY JET H-MODE DISCHARGES
E. Westerhof, R.W. Polman and TJ. Schep
FOM-Instituut voor Plasmafysica Rijnhuizen, Associatie EURATOM-FOM,
P.O. Box 1207,3430 BE Nieu^-egein, The Netherlands.
Abstract
The potentiality of Electron Cyclotron Heating (ECU) in high performance, high density JET
H-mode discharges is studied. The aim is to show well localized, central heating with EC
waves at densities tie = 1.0 to 1.5 1020 m -3 . The other plasma parameters are take in the range
B T = 3.0 to 3.7 T and Te = 5 to 10 keV. Ray-tracing calculations are used to analyze the
options fen- ECH, which include both first and second harmonic ordinary (O-mode) and
extraordinary (X-mode) waves. The second harmonic X-mode appears to be the best choice,
while the first harmonic O-mode is a good alternative if the central density does not exceed 1.0
1020 m - 3 . Calculations of the power deposition profile for a realistic launching system show
good central heating with second harmonic X-mode waves.
1 Introduction
In most operating regimes the performance of JET is severely limited by the degradation of
confinement with intense additional heating [1]. This phenomenon renders it virtually
impossible to reach conditions as are required for the planned OT operation. An important
improvement in confinement is obtained in X-point discharges with Neutral Beam Heating
(N3H) above a threshold power level when H-mode is achieved [2]. Characteristic of the H-
mode, however, is a rapid density rise which leads to poor beam penetration and to off-axis
peaking of the NBH power deposition profile. Even when the beam energy is upgraded to
140 kV, a sufficient penetration of deuterium beams in high-density discharges (ne2 1.0 102 0
m~3) is not expected. This poor beam penetration may well be the cause of the confinement
degradation with increasing additional power and of the observed quenching of the H-mode at
high density. Recent experiments in D-III-D have demonstrated the possibility of obtaining H-
mode with Electron Cyclotron Heating (ECH) [3J, In these experiments ECH power was
injected in the second harmonic extraordinary mode from the outboard side of the device. H-
mode transitions were observed at lower power levels with ECH than with NBH.

20
This paper presents an analysis of the feasibility of heanng high density JET discharges with
EC wave power. The aim of this analysis is to identify the optimum ECH scenario. We will
define this optimum scenario as the choice of mode, frequency and launching geometry that
results in close to 100% absorption and in power deposition within the q=l surface over he
widest possible range of operating regimes. The operating regimes for JET high performance,
high density H-mode discharges are taken to be 3.0 < B-r<o) < 3.7 T, Ip > 3.0 MA, X-point,
1.0 I020 < nc(o) < 1.5 1020 m~3 and 5 < Te(o) < 10 keV. In this regime the location of the
q=l surface Is typically found at \jr» 0.2, where ijf = (y - Vaxis) / (Vbounday - ¥»is). ¥ ^ing
the poloidal flux function. This position corresponds to the major radii R = 2.55 m and R =
3.40 m in the equatorial plane and to an equivalent minor radius r = \'S/JC = 0.30 m, where S is
the surface enclosed by a poloidal cut of the q=I surface. All options for ECH are analysed
with elaborate parameter scans using the TORA Y ray-tracing code [4] for the injection of both
extraordinary (X-) and ordinary (O-)mode waves at the fundamental as well as at the second
harmonic electron cyclotron frequency. The ray-tracing calculations have been performed in the
magnetic equilibrium as obtained in discharge n° 16708. This is a single null X-point
discharge with a plasma current of lp = 5 MA and a vacuum toroidal field of Bj= 3.16 T at
R = Ro = 2.96 m, typical of future high performance JET H-mode discharges. Further details
for this discharge are given in Table 1. Given the magnetic geometry of this discharge, i.e.
\|r(R,Z), we have varied in our parameter scans the magnetic field on axis and the central
density and temperature. The profile of the paramagnetic function B$R/BTR0 - 1, as holds in
discharge n° 16708 is used in the calculations with the change of a paramagnetic correction on
the magnetic axis of 5%.
Table 1
Plasma parameters of discharge n° 16708
By 3.16 T qv(o) 0.84
*P 5.0 MA qv(a) 4.61
nc(o) 3.0 1019 nr 3 Pp 0.08
Tc(o) 3.0 keV elongation b/a 1.98
The density and temperature profiles used in the ray-tracing calculations, are given by
ne(V) = lnc(o)-nc(a)l[l -y*]m + ne(a), (1)
and
Tc(¥) = (Te(o) - Tc(a)J[ 1 - y)2 + Tc(a), (2)

21
where 1.0 1020 < ne(o) < 2.0 iO20 and Te(o) = 5, or 10 keV. The density and temperature at
the boundary are taken to be ne(a) = 2.0 1018 irr3 and Tc(a) = 3C eV. This yields a flat density
profile with steep edge gradients typical of H-mode operation and a peaked temperature profile.
A pedestal in the temperature profile characteristic of the H-mode has no significant effect on
the results that will be presented below.
The direction of the injected rays is specified by the angles <{> and 0, where 9 is the angle
between the ray and the vertical direction, and 0 is the angle between the projection of the ray
on the equatorial plane and the major radius. For the calculation of the wave damping along the
rays a weakly relativistic approximation of the dielectric tensor including lowest significant
order finite Larmor radius terms is employed. The imaginary part of the wave vector describing
the wave absorption is then obtained from the biquadratic equation for the perpendicular
refractive index [5,6].
A number of conclusions about the applicability of the various modes can be drawn a priori
from considering the cut-off densities. The O-mode has a cut off at the plasma frequency CDp,
whereas the X-mode exhibits a resonance at the upper-hybrid frequency OJIJH = (to + 0) ) , P c
and two cut-offs at co_ and &)+ known as the high- and low-density cut-off, respectively: 1/2
(3) '^T+ <o2
p - ; , x,2
l - N;
The presence of both the upner-hybrid resonance and low-density cut-off has the consequence
that the resonance region where o = cot is inaccessible for the X-mode when injected from the
low magnetic field side. When injected from the high field side, only the high-density cut-off is
relevant to the first harmonic X-mode. The low-density cut-off is of relevance for the second
harmonic X-mode. For a magnetic field of 3.4 T and taking into account the 5% paramagnetic
correction, the electron cyclotron frequency is 100 GHz. With a frequency of nx 100 GHz for
n* harmonic ECH. the cut-off densities n . ' of the X- and O-mode at the harmonics n=l and
n=2 are given by
n° (n=l) = 1.24 102n nr 3 , n° (n=2) = 4.96 1020 nr3 , c
n*(n=l) = n* (n=2) = 2.48 I020(1 - NJ) nr3 . (4)
A first conclusion that can be drawn, is that the cut-off density of the first harmonic O-mode at
100 GHz is not sufficiently high with respect to the considered density range. The cut-off
density of the second harmonic O-mode is by far the highest, while also the cut-off densities of
the first and second harmonic X-mode seem to be sufficient.
A further complication exists for the fundamental X-mode, which at perpendicular propagation
acquires near the resonance plane the wrong polarization with respect to the electron motion.

22
Hence, a finite Nu is required frr absorption. Moreover, as pointed out above, the first
harmonic X-mode must be injected form the high-field side of the resonance. In practice, this
means injection into JET from a top or bottom port, so that the frequency must be reduced to
well below the electron cyclotron frequency on axis at the lowest toroidal field under conside
ration, which for Br = 3.0 T is f = 84 GHz. A lower frequency and a finite N|| both lead to a
reduction of the cut-off density: e.g., for a frequency of 80 GHz the high-density X-mode cut
off density becomes
n*(80GHz) = 1.591020(l-Njf)m-3, (5)
which, even for N|j = 0, is only marginally above the considered maximum density. Conse
quently, the absorption of the fundamental X-mode is strongly reduced at the higher densities.
2 Analysis of options for ECU
2.1 First Harmonic O-Mode
As pointed out above, the O-mode cut-off density at the optimum choice of frequency of 100
GHz is too low, and central power deposition will not be possible at densities above ne(o) =
1.241020 nr3 . In order to obtain absorption at higher densities, one has to resort to higher fre
quencies. A reasonable choice would be 120 GHz having a cut-off density of 1.78 1020m*-3.
This has, of course, the drawback that the electron cyclotron resonance is no longer central as
shown in Fig. 1. For 120 GHz electron cyclotron resonance occurs well outside the q=l
surface except for relatively high values of the vacuum toroidal field on axis. For exactly
perpendicular propagation all power will be deposited on the high-field side of the resonance.
By introducing a finite value of Nn, however, power deposition can be shifted to the low-field
side, but only at the expense of increased refraction effects. This possibility is analysed with
ray-tracing calculations by performing scans in toroidal injection angle <{>, keeping the poloidal
injection angle fixed at Ö = 95°, such that the waves are directed towards the magnetic axis,
which is located 10 cm below the horizontal midplane. The results are summarized in Figs. 2a
to 2e for BT = 3.0, 3.2, 3.4, 3.6, and 3.7 T, respectively, and for the central density
ne(o)= 1.5 1020 n r 3 , by plotting the bands in normalized flux ijj, within which almost all
absorption occurs. The figures show that for By 2 3.4 T the power absorption can be shifted
to within the q=l surface. For lower magnetic fields, higher values of IN||I, i.e., higher values
of IA0I s 10 - 180°! are required. With such large deviations from exactly perpendicular
propagation, the beams are strongly diffracted and do net penetrate to the centre for these high
densities.

23
4 . 5
Fig. 1. The position of the EC resonance in the horizontal midplane for 100 and 120 GHz as a function of BT, the vacuum toroidal field at R = 2.96.
1 .0
0 . 0 s -
2 2 0
220
A
-j q=2 .0
«1=1.5
q.=-1.0
220
Pig. 2. The range in \ji where 80% of the power is deposited as a function of the injection angle $ at fixed 0 = 95° for 0-modc waves at 120 GHz. The plasma parameters are ne(o)= !.5 1020m3, Te(o) = 10 keV, and BT = 3.0, 3.2, 3.4, 3.6, and 3.7 T, respectively. Note, that deposition widiin the q=l surface can be obtained for BT
> 3.4 T.
24
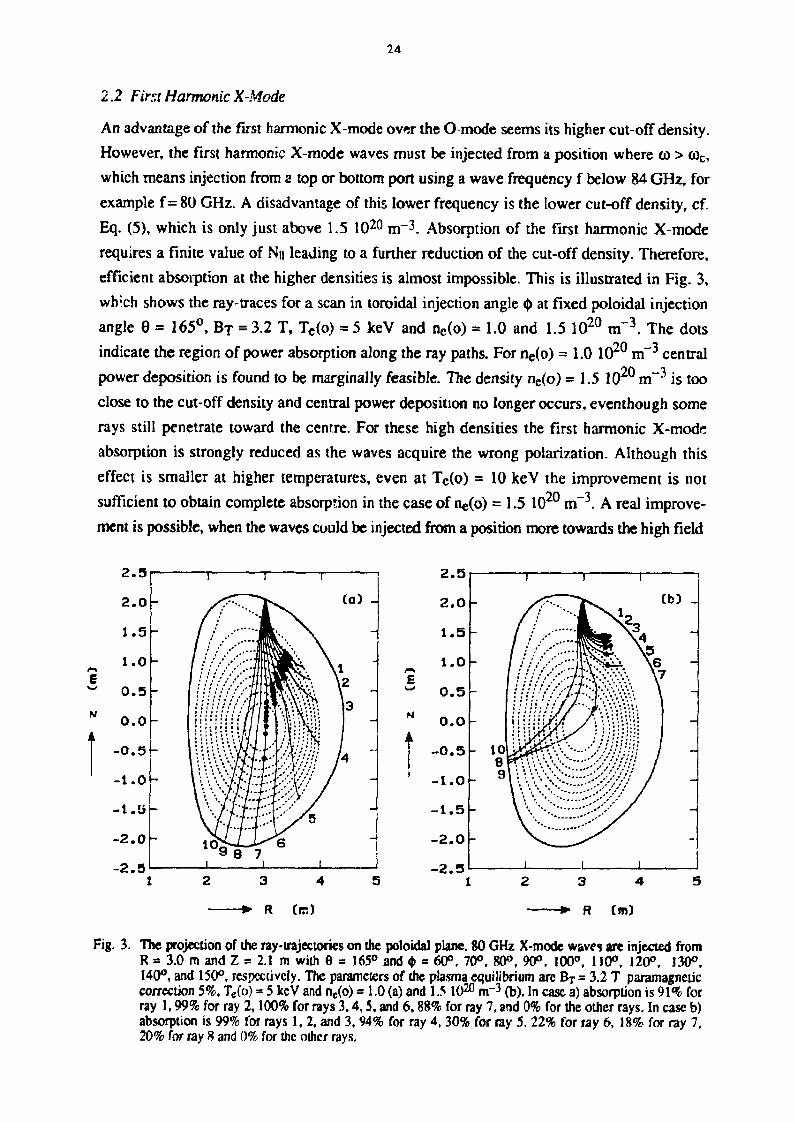
2.2 First Harmonic X-Mode
An advantage of the first harmonic X-mode over the O-mode seems its higher cut-off density.
However, the first harmonic X-mode waves must be injected from a position where (0 > <oc,
which means injection from a top or bottom port using a wave frequency f below 84 GHz, for
example f = 80 GHz. A disadvantage of this lower frequency is the lower cut-off density, cf.
Eq. (5), which is only just above 1.5 1020 m - 3 . Absorption of the first harmonic X-mode
requires a finite value of Nil leading to a further reduction of the cut-off density. Therefore,
efficient absorption at the higher densities is almost impossible. This is illustrated in Fig. 3,
wh'.ch shows me ray-traces for a scan in toroidal injection angle <j> at fixed poloidal injection
angle 8 = 165°, B T = 3.2 T, Tc(o) = 5 keV and nc(o) = 1.0 and 1.5 1020 m~3. The dots
indicate me region of power absorption along the ray paths. For 1^(0) = 1.0 1020 m - 3 central
power deposition is found to be marginally feasible. The density ne(o) = 1.5 102^ m~3 is too
close to the cut-off density and central power deposition no longer occurs, eventhough some
rays still penetrate toward the centre. For these high densities the first harmonic X-mode
absorption is strongly reduced as the waves acquire the wrong polarization. Although this
effect is smaller at higher temperatures, even at Tc(o) = 10 keV the improvement is not
sufficient to obtain complete absorption in the case of ne(o) = 1.5 1020 m - 3 . A real improve
ment is possible, when the waves could be injected from a position more towards the high field
2 . 5
2 . 0
1.5
1.0
0 . 5
0 . 0 -
- 0 . 5 -
- 1 . 0 -
- 1 . 5 -
- 2 . 0 -
- 2 . 5
(a) -
I"
Fig, 3. The projection of the ray-trajectories on the poloidal plane. 80 GHz X-mode waves are injected from R = 3.0 m and Z = 2.1 m with 6 = 165° and <t> = 60°, 70°, 80°, 90°, 100°. 110°, 120°, 130°, 140°, and 150°, respectively. The parameters of the plasma equilibrium are Br = 3.2 T paramagnetic correction 5%. Te(o) = 5 keV and nc(o) = 1.0 (a) and 1.5 1020 m~3 (b). In case a) absorption is 91% for ray 1,99% for ray 2,100% for rays 3,4,5, and 6,88% for ray 7, and 0% for the other rays. In case b) absorption is 99% for rays 1, 2, and 3, 94% for ray 4, 30% for ray 5, 22% for ray 6, 18% for ray 7, 20% for ray 8 and 0% for the oihcr rays.

25
side. In that case, higher frequencies can be used, which allow the use of higher values of N». This would lead to higher absorption level:. An ideal launching position would be from the high-field side in the equatorial plane at R = 1.8 m, which would allow the use of 100 GHz waves.
23 Second Harmonic O-mode
A major problem for second harmonic heating schemes, however, is the availability of high
power sources at the required frequency of 200 GHz. We expect that in the near future the
maximum frequency available from high power gyrotrons is likely to be around 175 GHz, and
restrict our analyses of second harmonic ECH to this frequency. Nevertheless, even for 175
GHz the second harmonic electron cyclotron resonance lies within the q=l surface as long as
By - 3.4 T, as is shown in Fig. 4.
The second harmonic O-mode has the highest cut-off density. A draw back of this mode is the
fact that the absorption generally is low. The optical depth of this mode scales like % ~ neTjf, so
that sufficient absorption can be obtained in case of high Te. Power deposition will then occur
over a relatively broad region. The O-mode cut-off density for me frequency of 175 GHz is 3.8
1020 m-3, so that the effects of wave refraction are small for the densities considered here. In
the ray-tracing calculations, the rays are indeed found to propagate along nearly straight lines.
Further, the results show that the highest absorption is obtained for oblique injection with a
maximum around 15° from perpendicular injection. In this case 90% absorption inside or
around the q=l surface is obtained for Bj 5 3.4 T, Te = 5 keV, and injection from the low-field
side in the equatorial plane. Better results are obtained using vertical injection from a top or
bottom port, which maximizes the arc-length of the ray trajectory in the absorption region. An
example of the results for vertical injection is shown in Fig. 5. This figure shows a scan in
toroidal injection angle <j> at fixed poloidal injection angle 6 = 172.5°, The plasma parameters
are Bj = 3.4 T, ne(o) = 1.5 1020 m~3 and Te(o) = 5 keV. Over 90% absorption is obtained
in a wide range of angles. For $ ~ 110° all power is deposited well within the q = 1 surface.
With vertical injection the waves approach the resonance from the high-field side. As a
consequence the localization of the power absorption shifts considerably along a ray, when the
temperature is increased. Although at higher temperatures central deposition is still possible, it
will be so for widely different injection angles: e.g. <J>« 125° for Tj. = lOkeV. For still higher
temperatures all power is absorbed well before the ray reaches the centre. For higher values of
the magnetic field, central power deposition becomes also more difficult. For example, with the
same parameters as in Fig. 5 but with BT = 3.6 T all power is deposited well outside the q=l
surface. Only in case of Te= 10 keV and with 0 * 100°, over 90% of the power is deposited
just inside the q=l surface.
It is concluded that power in the second harmonic O-mode at 175 GHz can be deposited in the
centre if BT ~ 3.4 T. A draw back of the scheme is the low absorption at low temperatures.

26
cc
4.5r
4 . 0
3 . 5
3 . 0
2 . 5 -
2 . 0
1.5 J ! I L J l_ 3 . 0 3 . 2 3 . 4 3 . 6
»* BT CT]
q=2.0 q=1.5 q=1.0
axis
» q=1.0
q=1.5 q=2.0
3 . 8
Fig. 4. The position of the 2n d harmonic EC resonance in the horizontal midplane for 175 GHz versus Br.
1 .0
- q=2 .0
- q=1.5
- q=1.0
125 150
Fig. 5. Power deposition in y fori 75 GHz O-mode injection from a top port (R=3.0m,Z=2.1m). The shaded region indicates the region where significant power deposition is found. The full lines give the position along the rays at which the 10 and 90% absorption levels arc reached. Over 90% absorption is found up to $ s 120°. The plasma parameters: Bj= 3.4 T, paramagnetic correction 5%, ne(o) = 1.5 1020m-3andTc(o) = 5keV.
2.4 Second Harmonic X-Mode
Power deposition with the second harmonic X-mode is very efficient and high optical depths
are already reached at low temperatures. For perpendicular propagation all power is absorbed
within a very short distance on the high field side of the resonance. Also the cut-off density is
reasonably high. With simple perpendicular launch from the low-field side in the horizontal
mid-plane, central power deposition would be possible over the entire required parameter
regime provided a power source with a frequency of 200 GHz would be available. As
mentioned before, such sources are not likely to become available in the near future and we will
again consider the lower frequency of 175 GHz. Ray-tracing calculations have been performed
over a wide range of parameters. In Fig. 6 an example of a scan in 0 is shown at 0 = 180°
(i.e., perpendicular injection), Br = 3.0 T, nc(o) = 1.5 1020 nr 3 and Tc(o) = 10 keV. Recall,

27
that the low-density cut-off, Eq. (4), depends on cut, leading to lower values of the cut-off
density as the magnetic field increases. For the flat density profiles considered here, one has
effectively a cut-off magnetic field, as can clearly be seen in Fig. 6. In the present case, all
power is absorbed at the resonance position, well before the cut-off is reached. Similar
calculations have been performed for higher values of Br, all showing the same pattern of ray
paths with the cut-off and the resonance both shifting to larger major radii. The results of these
calculations are summarized in Fig. 7 which shows the position of power absorption in \j/ space
for different values of BT as a function of the injection angle 8. When the density is increased
further, the cut-off shifts to larger major radii until the resonance is reached and the waves are
no longer absorbed. Central power deposition is possible up to By = 3.4 T and up to the
relatively high density ne(o) = 1.8 l ö ^ m - 3 .
We do not present cases with injection at a finite N« (i.e., $ * 180°) as this only leads to a
reduction of the cut-off density and an outward shift of the power deposition. To obtain central
power deposition at higher values of B-r, one could consider the down-shifted resonance
scheme with injection from a top or bottom port. In that case, however, the waves do not
penetrate towards the centre for high plasma densities. This is a consequence of the dependence
of the low-density cut-off on the magnetic field leading to a lower cut-off density on the high
field side of the resonance.
In conclusion, it is found that, apart from the higher values of B j <£ 3.5 T), second harmonic
175 GHz X-mode injection from the low-field side appears to be a very attractive option for
ECH in JET. It is not only an efficient method with a high density cut-off but is also technically
the simplest option as simple perpendicular injection from the low field side can be used.
£ . 9 1 2
! 1 3
1
2 . 0 /K —
1 . 5 - [/) w---\« **. '•, J\4 -
1 . 0 1 //'•/ \ -E ':•:'•/ ;.;.;. > w 0 . 5
N 0 . 0
;:::;: : • : • / / /
V*;''^SSO 45 -
w 0 . 5
N 0 . 0 |!:/:'::'
45 -
w 0 . 5
N 0 . 0 :;::::' L->r • I£^
45 -
- 0 . 5 'XO^^v^i^ *yJP: e —
- 1 . 0 f-- 'y^i^j*''-''* -'// / -
- 1 . 5 V\':: f&ïy yi -
- 2 . 0 9
i 1 0 0
i
-
Fig. 6. The projection of the ray-trajectories on the poloidal ptane. 175 GHz X-mode waves arc injected from R = 4.5 m, Z = 0.0 m with 41 = 180° and 6 = 70°, 75°, 80°, 85°, 90°, 050, 100°, 105°, 110°, and 115°, respectively. The equilibrium parameters are Bj = 3.0 T, paramagncüc correction 5%, ne(o) = 1.5 1020 m"3 and Te(o) = 10 kcV. Absorption is 100% for all rays.
R (m)

28
Fig. 7. The position of power deposition in y as a function of
^~ " the injection angle 0 for various values of the toroidal Field. The wave and plasma parameters are the same as for Fig. 7. Heie the location of the power deposition is indicated by one
q=1.0 line only, as the absorption is extremely high and thus very well localized within only a few centimetres along the ray.
"50 60 70 80 90 100 110 120 130
> e
3 Calculation of power deposition profiles
For the calculation of the power deposition profile, a realistic wave launching system is
considered consisting of 5 antennae, which are located at a major radius R = 4.5 m and which
are vertically spaced on equal distances of 15 cm. The middle antenna is centred at the
horizontal mid-plane of the tokamak. From each antenna a 1 MW beam of X-mode waves at
175 GHz is injected. The beams are launched horizontally (9 =90° and <)> = 180°), and are
assumed to be Gaussian with a half width of 3 cm and and a divergence in both injection angles
of 1.3°. The equilibrium and plasma parameters are ne(o) = 1.5 1020 m -3, Tc(o) = 10 keV and
BT = 3.0 T, i.e. on axis EC resonance (cf. Fig. 4). The result of the ray-tracing calculation is
given in Fig. 8a, which shows the integrated power normalized to the total injected power of 5
MW as a function of the normalized minor radius, x. The typical position of the q= 1 surface,
x = 0.35, is also indicated in the figure. Clearly, almost all power is deposited inside the q = 1
surface. An even better localization is obtained when the antennae are slightly tilted such that all
beams are directed towards the plasma centre. This is achieved by choosing injection angles 0
= 82.5°, 87.5°, 95.0°, 100.0°, and 105.0° for the beams centred at Z = -30, -15, 0, 15, and
30 cm, respectively. The result for that case is also given in Fig. 8a, which shows that now all
power is deposited within x = 0.10. In the latter case a local power density of 14 MWirr3 is
found. For comparison also a normalized power deposition profile obtained with NBH is
shown. The result shown is for the 5 MA discharge no. 18333 during the injection of 15MW
of NBH power. At the time in the discharge when the NBH deposition profile was calculated,
the discharge showed H-mode characteristics. A flat density profile with nc(o) = 0.7 lO^m"3
was measured by the LIDAR system. Clearly, most NBH power is located towards the plasma
edge. When the beam energy is doubled with respect to its present value, a similar NBH power
n n

29
deposition profile is expected for the twice higher plasma density considered in the ECH deposition calculation. For the focussed beams system, the power deposition has been calculated for several values of the magnetic field. The results for By = 3.0, 3.2, 3.4, and 3.6 T are shown in Fig. 8b. As expected the power deposition is shifted outwards when B? is increased, but in all cases the power remains very well localized in a narrow region in x. In case of B7 = 3.4 T the power is deposited almost exactly on the q= 1 surface. Even for Bj = 3.6 T all power is still located within half the minor radius. In contrast, in discharge n° 18333 only 13% of the NBH power is deposited within half the minor radius.
0.
A
1 . 0
0 . 8
0 . 6
0 . 4
0 . 2
0 . 0
T^-l—71 T 7 T
±JA U.
q = l
3 4
1—r
(b)
1 1 1
0 . 0 0 . 2 0 . 4 0 . 6 0 . 8 1 . 0
•» X
Fig. 8a. The normalized integrated power deposition profile as a function of the normalized minor ra Jius. The plasma parameters are ne(o) = 1.5 1020 m - 3 , Te(o)= 10 keV and BT = 3.0T. Curve (1): For 5 antennae located at X = 4.5 m and Z = - .30, - .15, .0, .15, and .30 m the central rays of all antennae are launched with 6 = 90° and <t> = 180°. Curve (2) Ibid, but with all antennae directed towards the plasma centre, i.e. 9 = 82.5°, 87.5°, 95.0°, 100.0°, and 105.0°, respectively. Curve (3): NBH deposition profile for discharge no. 18333 at t = 53.80 s.
Fig. 8b. The normalized integrated power deposition profile as a function of the normalized minor radius for various values of the magnetic field: Br = 3.0 (1), 3.2 (2), 3.4 (3), and 3.6 T (4). The antennae are as for Fig. 8a curve (2).

30
4 Conclusions
Our main conclusion is, that the optimum choice of mode and frequency for ECH in high-
density full performance JET discharges is the second harmonic X-mode at 175 GHz (or as
close to 200 GHz as will be available). In this case one can use simple perpendicular injection
from the low-field side which, from the technical point of view, is the easiest to realize. EC
beam deposition calculations have confirmed the good central power deposition. Some
flexibility of the poloidal launch angle 0 of the antennae, will be advantageous in order to focus
all antennae towards the plasma cense and, thus, to obtain an extremely good localization of the
wave power. All power can be deposited close to or inside die q = 1 surface for magnetic fields
up to Bj = 3.4 T. For By = 3.6 T all power is still deposited widiin half die minor radius. The
O-mode at 120 GHz would be a good alternative for the higher values of the magnetic field B?
> 3.4 T. The first harmonic X-mode is only of limited interest, because of the low absorption
in die high density cases, while the second harmonic O-mode has die disadvantage of low
absorption at low temperatures.
The conclusions can be extended to ECH of high density tokamak discharges in general by
considering a family of machines at fixed Murakami parameter M = n"2o R[m] / Bj[T] = 1.0,
where TT20 is the average electron density in units of 1020 m~3. For ECH at a particular mode
and harmonic, we require that the average density remains below =* of die cut-off density: n"e <
5*nc. It is then possible to draw curves in die R-BT space, above which a certain type of mode
and harmonic can be used for ECH. The result of diis procedure are given in Fig. 9, in which
also the position of a number of present and future tokamaks is indicated. The curve limiting
the use of first or second harmonic X-mode is ootained widi NJJ = 0. As noted above, however,
the first harmonic X-mode requires injection with a finite value of Nu from die high-field side
of die resonance. In practice, these requirements will limit die use of first harmonic X-mode
heating to approximately the same parameter regime as die first harmonic O-mode (cf. Section
2.2). In the regime where only second harmonic O-mode heating can be used, die application
of ECH is, of course, limited to plasma's of fairly high temperatures. Note mat all future large
tokamaks (NET/IGNTTOR and JIT) are found in die regime, where first harmonic O-mode
heating is applicable. Also the frequency required for these machines is close to or widiin die
range of presently available high power sources. The planned high-field tokamaks (IGNJTOR
and CIT) are also just widiin die range of first harmonic O-mode heating, but would require
frequencies, which presently are not available. In contrast, most present day experiments
would require second harmonic X-mode heating.

31
t
o i
• TFTR
D NET/ITER
+ JIT
X l
CIT
* IGNITOR
A MTX
•*• R Cm)
Fig. 9. Parameter regimes for the application of 1st and 2 n d harmonie O- and X-mode heating to general tokamak discharges having a fixed Murakami parameter M = ll^RIm] /BrTD = 1.0. On the vertical axis to the right, die required wave frequency f divided by the harmonic number n is given. The curves limiting the various modes and harmonics are given by BrTO = 15.4 / R[m] for the first harmonic O-mode, B^T) = 7.7 / R[mJ for the first and second harmonic X-mode, and BrlT] = 3.85 / R[m] for the second harmonic O-mode. The straight dashed lines indicate the lines of constant average density n a .
Acknowledgements
We thank Dr. A. Tang:: for helpful discussions. One of the authors (E.W.) wishes to thank the
members of the JET staff for their hospitality during a 5 month stay at JET, during which much
of the work presented here was performed. This work was performed under JET article 14
contract no. JB8/9004 with financial support from NWO, EURATOM and JET.
References
[1] JET Team, in Plasma Phys. and Contr. Nucl. Fusion Res. (Proc. 11th Intern. Conf. Kyoto, 13-20 November 1986), IAEA, Vienna (1987) Vol. I, p. 31. Tanga, A. et al., ibid, Vol. I, p. 65. Lohr, J. et al., Phys. Rev. Lett. 60 (1988) 2630. Batchelor, D.B., and Goldfinger, R.C., (1982) ORNJJTM-6844; Kritz, A.H. et al., in Proc. 3rd Intern. Symposium on Heating in Toroidal Plasmas, Grenoble (France), 22-26 March (1982) Vol. II, p. 707. Westerhof, E., (1989) 'Implementation of TORAY at JET' Rijnhuizen Report RR-89-183. Fidone, I., Granata, G., Ramponi, G., Meyer, R.L., Phys. Fluids 21 (1978) 645.
12] [3] [4]
[51 f61

32
ELECTRON CYCLOTRON CURRENT DRIVE AND m = 2 MODE STABILIZATION IN NET
G. Giruzzi, T.J. Schep, E. Westerhof
FOM-Instituut voor Plasmafysica Rijnhuizen, Associatie EURATOM-FOM,
P.O. Box 1207,3430 BE Nieuwegein, The Netherlands.
Abstract
Current drive by electron cyclotron waves (ECCD) in the Next European Torus is investigated.
The profile and the efficiency of the driven current are calculated with a 3-dimensional bounce
averaged Fokker-PIanck code coupled to a toroidal ray-tracing code. This study consists of two
parts. In the first part the application of EC waves to drive the central part of the main plasma
current for steady state operation is studied. It is shown that the highest current drive
efficiencies are obtained using the ordinary wave at up-shifted frequency (co > OJC). The
maximum obtainable efficiency is limited by overlap with the second harmonic resonance and is
given by 11 = 0.3 AW*1 1020 m~2. Off-axis, this efficiency is reduced by a factor of 2 due to
trapped particles. In the second part, the application of ECCD for control of the current profile
around the q=2 surface to prevent growth of the m=2, n=l tearing mode is studied. In all cases
studied, the injection of 10 MW of EC wave power at the appropriate frequency and injection
angle is sufficient to stabilize the m=2, n=l tearing mode.
/ Introduction
The practical use of tokamak fusion-energy reactors requires stable operation in steady state.
Non-inductive current drive (CD) will be essential in achieving this objective and will be an
important part of the research program for the next generation of large tokamaks. In this
context, it is proposed to use a combination of lower-hybrid (LH) and electron cyclotron (EC)
waves for non-inductive current drive to achieve steady state operation in the Next European
Torus [1]. Although, the LH waves have the highest current drive efficiency, their use is
limited to the plasma periphery, because they are strongly damped as a consequence of the high
temperatures in a reactor. In this scenario, the central part of the plasma current is driven by EC
waves. In addition, because of the good localization of the absorption, EC waves are also well
suited for current profile control, which is aimed at maintaining the stability of the discharge.
Both these applications of ECCD are the subject of this paper. The first part addresses the
application of ECCD for bulk current drive in the centre of the plasma. The best options for
33
ECCD are identified and the expected current drive efficiency is evaluated. The CD efficiency is
defined as r\ = IcDRohyPEc (AW*1 1020 nr2), where ICD is the driven current, PEC the dissi
pated wave power, RQ the major radius of the tokamak and ne the average density. In the
second part, the application of ECCD to control the current profile around the q = 2 surface in
order to stabilize the m=2, n=l tearing mode is studied. This mode plays an important role in
the occurrence of major disruptions [2]. The requirements, in terms of wave frequency,
injection angles, and power that must be satisfied to achieve complete stabilization of die m=2
tearing mode, are discussed.
Throughout the paper, the same plasma equilibrium, characteristic of an ignited NET discharge,
is used. The main plasma parameters are given by a major radius RQ = 5.25 m. minor radius in
the equatorial plane a = 1.4 m, elongation K = 2.2, toroidal field on axis Bj = 5.5 T, plasma
current Ip= 10.77 MA, average density ne = 0.75 x 10²⁰ nr3, and average temperature
Tc = 15 keV. The magnetic configuration, which is obtained from an equilibrium code, has
two X-points and is characterized by a relatively flat current density profile with a safety factor
qv(0) = 1.1 on axis and qy(p2=0.9) = 2.9, where p2 = (y - VoVOKb - ¥o)» ¥ i s t n e poloidal
flux function, and \j/0 ȴb *ts values at the plasma axis and boundary, respectively. The q = 2
surface is positioned at p = 0.85. For the density and temperature the following profiles are
used
ne(p) = ne(0) ( 1 - p6) and Te(p) = Tc(0) (1 - p2 ) (1)
where nc(0) = 1.0 1020 m"3 and Te(0) = 30 keV.
2 Theoretical model
The propagation of EC waves is calculated in the geometric optics approximation with the ray-
tracing code TORAY [3]. The ray paths and the effects of dispersion on the beam divergence
are obtained from the ray-tracing and used as input in a 3-D bounce averaged Fokker-Planck
code [4], This code solves the Fokker-Planck equation, which describes the evolution of the
electron distribution function under the influence of collisions and the interaction with EC
waves. Below, we give a short description of the basic ingredients of the Fokker-Planck code.
More details, in particular concerning the bounce averaging, are given in Ref. [4]. Symbolically
the Fokker-Planck equation can be written as
where < > represents the bounce averaging. The distribution function ƒ u, t; p) is solved on
multiple flux surfaces labeled by the flux coordinate p, in the invariant coordinate system (uno,
u±o) which are the parallel and perpendicular momenta normalized to the thermal momentum
(mTg)1/2 at the location % = 0, where % is the poloidal angle on the flux surface. The time is

34
normalized to the collision time of the bulk xe = m1?2 T ^ 2 / (2rc e4 tie A), where A is the
Coulomb logarithm. The collision term is used in the relativistic high velocity limit
?Vcoii »2 du^u ** J) u 3 S i n e de de
where u = !u 1, 6 = arccos( UJI / u) , y = (1 + p2/m2c2)1^2, and Z is the effective ion charge
which is taken to be Z = 1. The phase space diffusion due to EC wave is given by [4]
^ J E C dN|| ^ f t u ± D E c ft/, (4)
w h e r e f t s <*±- + N > l H i - L a n d D E C _ ( P ^ n e ^ e x p r - J ^ a d s l , a) 9u± VjT dun L JO J
P0 being the injected wave power, S the area of a flux surface and |i = mc2 / Te. The absorption
coefficient a along the ray path is calculated selfconsistently using the actual distribution
function as calculated by the Fokker-Planck code. The wave diffusion coefficient DEC is peaked
in phase space along the curve defined by the resonance condition (n = 1,2,...)
T - ^ - ^ = 0 , (5)
whereas its shape is determined mainly by the shape of the injected wave spectrum.
3 Central current drive for steady state operation
Efficient current drive by EC waves requires oblique propagation (Nn * 0) and resonant
interaction with high-energy (thus weakly collisional) electrons. Because of the Doppler and
relativistic detuning mechanisms in the resonance, this can be achieved for (0* cot only. In a 30
keV plasma the mildly suprathermal electrons (u = 3-4) appropriate for current drive have
momenta p > mc. Simple considerations based on the resonance condition (Eq. (5)) then show
that wave absorption for current drive purposes takes place at frequencies either well below or
well above coc- Harmonic overlap, i.e. simultaneous absorption by two different electron
populations, streaming in opposite directions and resonating at two adjacent harmonics, must
be taken into account [7], On this basis, one expects that current drive in NET can be realized in
two well separate frequency ranges, namely for (Oc/2 < co< Cue (downshifted frequencies), and
for (öt < co < 2c0c (upshifted frequencies).
The use of waves at downshifted frequencies requires wave injection from the high-field side
of the resonance. In practice, this is achieved by injection from the top or bottom of the torus.
A favourable aspect of this scheme is, that it allows the use of X-mode waves which for
oblique propagation show the highest absorption. The use of O-mode waves at downshifted

35
frequencies is limited by the lower cut-off density. On the other hand, upshifted frequencies
require O-mode polarization. This scheme has the advantage, that the waves can be injected
from the outside in the equatorial plane.
3.1 Ray-tracing calculations
We have performed extensive ray-tracing calculations to study the localization of the power
deposition at both downshifted and upshifted frequencies. The wave frequency, f, and the
injection angles 6 and $ have been varied over a wide range. Here, 0 is defined as the angle
between the wave vector and the vertical direction at the point of injection, and $ is defined as
the angle between the wave vector and the major radial direction.
An example of the results for the injection of X-mode waves at downshifted frequencies is
given in Fig. 1. In Fig. la the projection of the ray paths on the poloidal plane is given for the
injection of 80 GHz X-mode waves from the top of the vessel with the injection angles $ =
-90° and 0 = 155° (I), 150° (2), 145° (3), and 140° (4). The dots indicate the region of power
absorption. Note that 80 GHz is only slightly higher than half the central cyclotron frequency,
which for By = 5.5 T is fc = 154 GHz. Figure lb gives the transmitted power fraction along
each ray as a function of the flux coordinate p. These results show that the region of power
deposition is easily varied by simply changing the injection angle 9. When the power is to be
N
_L
1 . 2
_L
3 4 5 6 7
• R Cm)
Fig. I. Results of ray-tracing calculations for the injection of 80 GHz X-mode waves from the (op. a) Projection of ray paths on the poloidal plane. The injection angles are $ = -90° and 8 = 155° (1),
150° (2), 145° (3), and 140° (4). The doited lines represent the flux surfaces p = 0.1,0.2,.. . 1.0. b) The transmitted power fractions as a function of p.

36
CD < < M I - N J ) - , / 2 = «*>
deposited more towards the plasma periphery (p > 0.6), also the angle $ must be adjusted to
obtain full absorption.
Inspection of the resonance condition (Eq. 5) shows that upshifted frequencies require
(6)
for resonant particles to be present. This puts a sharp limit to the spatial region in which wave
absorption near the fundamental resonance takes place. Near the point where co = cob the reso
nant velocity and the absorption coefficient vary rapidly in space [5]. Therefore, wave absorp
tion at upshifted frequencies generally leads to a more localized power deposition and to a
lower average resonant velocity then would be the case with downshifted frequencies. For
large Nn the frequency COQ can become close to 2cot and 2nd harmonic absorption can become
significant [7]. This effect is deleterious, since the two resonant parallel velocities for n=l and
n=2 have opposite directions. This puis a constraint on the frequency and injection angle that
can be used. In Fig. 2 the results for the injection of 180 GHz O-mode waves are presented.
The injection angles are 6 = 90° and $ = 135° (1), 145° (2), 155° (3), and 165° (4). The figure
shows that the absorption region can be shifted by varying the injection angle $. A distribution
of wave beams of spread 20° in the angle <(> can cover almost the entire plasma. The deposition
profile can be tailored by varying the power in each beam. Up to frequencies of 249 GHz, ab
sorption at the second harmonic is mainly important for those injection angles for which the
first harmonic absorption occurs on the high field side of the flux surfaces (cf.case (4) in
Fig. 2).
t
f
3
[ 1 1
2
1
0
- 1 I
2
1
0 ~4 BBl-3 rnjj^5^4^i
-t |UWv2%$7* - 2 i'^y -- 3
\ / ' A i i i
a. k
6
(m)
Fig, 2. Results of ray-tracing calculations for the injection of 180 GHz O-mode waves in the equatorial plane.The injection angles are 6 = 90° and 0 = 135° (1), 145° (2), 155° (3), and 165° (4). The open dots in the plot of the transmitted power fractions (b) indicate second harmonic absorption.
37
3.2. Fokker-Planck calculations
For a number of selected cases, we have performed Fokker-Planck calculations to evaluate the
current drive efficiencies. In these calculations a wave beam with a cross-section of 100 cm2
and a divergence of 5° at R = 7m has been used. The results are given in Table I. The first three
columns give the results for the injection of 80 GHz X-mode waves from the top of the torus.
The injection angles 6, and <j>, correspond to the cases (1) and (2) from Fig. 1, which show
central or slightly off-axis deposition, respectively. The other columns give the results for the
equatorial injection of O-mode waves at different frequencies and injection angles. The current
density profiles, which correspond to the cases of the last three columns are given in Fig. 3.
From these results we can draw the following conclusions. The use of downshifted frequencies
yields current drive efficiencies which are well below the best obtained using upshifted
frequencies. The reasons for this result are twofold. Because current drive at downshifted
frequencies requires the opposite value of N|| as compared with the case of upshifted
frequencies, the parallel wave driven flux is in opposite directions for the two cases. For
downshifted frequencies this parallel wave flux drives a current in the opposite direction from
the current driven by the perpendicular flux. Although in many cases the parallel flux is much
smaller than the perpendicular flux, by a factor of N||Ui/VjT, in the present case with a
temperature of 30 keV and resonant velocities of u = 3-4 it is of the same order as the perpen
dicular wave flux. Thus, in the present case direct transfer of momentum from the EC waves to
the plasma is important. Moreover, in case of downshifted frequencies the efficiency drops by
about a factor of three for off-axis deposition as a consequence of trapped particle effects [4,
8], while for upshifted frequencies, the efficiency deterioration due to trapping effects is less
than a factor of 2. This is due to the fact for the downshifted resonance the resonance curve
crosses the trapping region, which is not so for the presented the cases with upshifted
resonance. In the latter cases the efficiency can be significantly improved by increasing the
wave frequency, because this enhances the resonant energy. Howevei, at 220 GHz and central
power deposition about 10% of the wave power will be absorbed due to overlap with the
second harmonic. The current driven by this power will be small and is not accounted for in
Table I. This effect limits the maximum frequency to ~ 240 GHz and the maximum efficiency
to around t| - 0.3 AW-1 1020 m-2. Figure 3 confirms that the driven current profile is easily
varied by changing the injection angle <|>.

38
TABLE I
Results of Fokker-Planck quasi-linear calculations for central current drive.
frequency (GHz) 80 80 80 220 220 18C*) 180°) 180c>
mode X X X 0 0 0 0 0
injection top top top equatorial eq. eq. eq. eq.
-©- -90° -900 -90° 145° 1450 1550 150O 145°
9 1550 145° 145° 90» 90° 90° 900 90° P E C ( M W ) 11 45 90 13 6.5 10 75 75
ICD(MA) 0.34 0.51 0.76 1.12 0.54 0.53 2.45 2.25
n 0.12 0.045 0.035 0.34 0.33 0.21 0.13 0.12
Pabs 0.1 0.4 0.4 0.1 0.1 0.1 0.3 0.5
Fig. 3. Profiles of the driven current density for O-mode beams of frequency 180 GHz. divergence A<|> = A8 = 5°, injected in the equatorial plane. (a)4>=155o,PEC=10MW; (b) 4> = 150°, PEC = 75 MW; (c) 0 = 145°, PEC = 75 MW.
> Q
4. Current profile control
The possibility to tailor the EC driven current profile, as shown in Fig. 3, is of particular
interest for current profile control aimed at stabilizing macroscopic instabilities. As an example
of such an application we study current profile control at the q = 2 surface in order to stabilize
the m=2, n=l resistive tearing mode. This mode is driven unstable by the current gradient
inside the q = 2 surface.
As mentioned in the introduction, the q = 2 surface is positioned at p = 0.85. The density at
this position is ne(q=2) = O.b 102 0 n r 3 . To analyze the consequences of diL;rent
temperatures on the q = 2 surface, the temperature profile is varied keeping Te(o) = 30 keV:
Tc(p) = Te(o) (1 - p2 ) giving Te(q = 2) = 8 keV,
Te(p) = Te(o) (1 - p2 )1.5 g i v i n g Tc(q = 2) = 4 keV, and (7)
Tc(p) = Tc(o) ( 1 - p 2 )2 giving Tc(q = 2) = 2 keV.
U . £ J
7 0.20 o * 0 . 1 5 -
O.lOl -
0 . 0 5 -
O.OO 0 . 0 0 .2 0 . 4 0 . 6 0 . 8 1.0
39
4.1 Requirements for stabilization of the m-2, n-I tearing mode
The stability of the m=2, n=l tearing mode is analyzed in the limit of cylindrical geometry. In
Ref. [9] a systematic study of the effect of local heating and current drive on the m=2, n=l
tearing mode is presented. In this study, a Gaussian profile is used for both the basic current
profile and the locally driven current. The basic current profile is characterized by the peaking
parameter h
j ( r ) = jCoJe-1 - 5 ^ 2 , ( 8 )
where r is the normalized minor radius. The profile of the driven current is characterized by the peakedness p:
JCD( r) = jcD(rcD) e-P('-'cD)2. (9)
The stability of the m=2, n=l mode is determined by the parameter A' (A' < 0 for stability),
which is defined by [10]
A's S3 ( ^ + e > - ^ - £ > ) / v<*> * <10> where rs is the position of the mode rational surface with q(rs) = 2, and y is the perturbed
helical flux. With the normalization ZKBJ/^JRQ one has [10]
d 2 y d y (A ~ d\ 1ZV d \f (A ^ d\ , , r rv> (11)
A complete flattening of the current density profile just inside the q = 2 surface generally is a
sufficient condition for the stabilization of the m=2, n=l tearing mode. With some rough
estimates, this condition leads to the following requirement on the amplitude and localization of
the driven current ICD or, using the definition for the current drive efficiency T], of the wave
power PEC [9]
!fH| . 1 2 or 9 * . 4 (Me) , and (12) *P p lV Tip
r C D - r s - - H C - I c i y v V ^ V v p 7 ,
where H is die Heaviside function. We conclude that, in order to optimize the efficiency of the
current profile control one has to maximize the product of r\ and P, i.e. simultaneous
optimization of the current drive efficiency and the localization of the power deposition.
To obtain a more accurate assessment of the required driven current in the present case, we
repeat the analyses of Ref. [9] for parameters relevant to the NET equilibrium used in this
study. Near the q = 2 surface we identify the flux coordinate p with the normalized minor
radius, so that rs = 0.85. A broad equilibrium current profile A, = 1 is assumed. This yields a
strongly unstable profile with A' = 6.2. The effect on the instability is calculated for a driven

40
current with a peakedness 3 = 400 and for a scan in the driven current ICD and position of this
current TCD- The results are given in Fig. 4 as level curves of A' in the IcDrCD plane. The
shaded areas indicate the stable parameter regime. It is concluded, that less than half the current
estimated from Eq. (12) suffices for stabilization. With Ip = 10.77 MA and P = 400, one needs
to drive only around 125 kA.
-0.025 0.OO0 0,025
*• Ico/I
Fig. 4. Results of stability calculations for 1 = 1 and b = 400. Contours of constant D' are given. The shaded area indicates the stable parameter regime.
4.2 Optimization of the localization and the current drive efficiency
The width and divergence of an injected beam will both affect the localization of the power
deposition. Of course, the localization is also affected by the line width of the absorption
process. This leads to two different approaches to optimize the localization of the power
deposition. First one can minimize the effects of the line width and the width of the N||
spectrum (i.e. the divergence) by launching the waves such that the ray paths are tangential to
the flux surfaces in the absorption region. Then, the localization is limited by the beam width.
The second approach is to minimize the effects of the beam width by using equatorial wave
launch, such that the spatial spread of the beam is tangential to the flux surfaces. Now, the
localization is limited by the natural line width and the width of the Nu spectrum. We have
selected this second approach, because it utilizes an intrinsic property of the wave plasma
interaction to obtain a good localization rather than that it relies on a technical effort to focus the
wave beams. This leads to the choice for the injection of O-mode waves from the low-field side

41
in the equatorial plane using the upshifted resonance scheme, which has been shown also to
yield the highest current drive efficiencies. To optimize the current drive efficiency further, a
large value of IN»! is required. The wave frequency must be chosen such that the power is
deposited near q = 2. An estimate for the wave frequency is obtained from the maximum
upshift of the EC resonance, that can be obtained for a given Nu, f / fc(q=2) = (1-NM )-*& (cf.
Eq. 7). On the low-field side one has fc(q=2) = 138 GHz. When IN||I is increased the
interaction occurs with fewer and fewer particles of increasingly higher energy. This limits the
optimum current drive efficiency that can be obtained.
4.3 Results of ray-tracing calculations
We have performed extensive ray-tracing calculations to study the localization of the power
deposition. A first estimate for the linearized current drive efficiency T\ is obtained from the
Fisch formula generalized to include trapped particle effects [11], The peakedness P of the
deposition profiles is calculated from the width of the profiles at the 1/e level. Only current
drive in th«*- co-direction is considered, which for the present equilibrium and the upshifted
resonance scheme means wave injection with a negative value of Nn, i.e. a toroidal injection
angle <|> > 180°. Apart from effects caused by an electric field or by a non-inductive current
carrying electron tail, when the waves are injected in the equatorial ,,-ane, wave absorption is
exactly symmetric in N||. For stability, the co- or counter driven should be located on or at the
inside of the q = 2 surface, respectively (see Fig. 4).
In the ray-tracing calculations, a Gaussian beam with a divergence of 2.5° is injected from an
antenna at R = 7 m where the half width of the beam is 5 cm. The results for the injection of
first harmonic O-mode waves are presented in Fig. 5 for the case with Tc(q=2) = 8 keV. In
Fig. 5a the peakedness pbeam of the deposition profile of the injected beam is given as a
function of the toroidal injection angle <j>. The peakedness of the power deposition pray along
the central ray of the beam is also given. Since, for finite Nu, the absorption coefficient a of the
first harmonic O-mode is inversely proportional to IN||I, the peakedness prav for individual rays
is a decreasing function of IN||I, Nu ~ sin(<f>). This effect limits the peakedness Pbeam that can
be obtained for <(> > 220°. For <f> < 220° the peakedness pbeam is limited by the spread in N||.
This effect becomes larger when <t> approaches 180°, i.e. when IN||I decreases. A maximum for
Pbeam is found for <j> « 210° where pbeam * 250. Higher values of the peakedness can be
obtained for a beam with a smaller divergence. In Fig. 5b the wave frequency normalized to
f c(q=2) and the estimate for the current drive efficiency TJ are given. A maximum in the
efficiency is found for <J> * 210°, where TI * 0.07 [AW"1 1020 tar2]. For larger $ the
efficiency does not increase further, although IN;;' still increases, because the maximum energy
at which a significant part of the wave power can be absorbed is limited to a few times the local

42
thermal energy. When <j> increases the resonance curve comes closer to the trapping region.
This leads to a further reduction of the efficiency by trapped particle effects.
Similar results are obtained in the ray-tracing calculations for the cases with a temperature of 4
and 2 keV at the q = 2 surface. The current drive efficiency is found to be almost proportional
to the temperature. At 2 keV, however, the maximum current drive efficiency is obtained at
0 = 200°. Because of the lower temperature, the maximum in the current drive efficiency
occurs at a lower value of INiil. When the injection angle is kept fixed, the peakedness of the
deposition profile increases slighdy with decreasing temperature. For a fixed injection angle,
also the wave frequency must be reduced with the temperature to keep the power deposition
around the q = 2 surface.
7 0 0 1 'T F I 1 . 5 'T " "T t 1 0 . 0 8 / CM
6 0 0 "~~"*\ (a) _ (b) ^ - ^ ' 1
E \Pray ^̂ 1 . 4 / r\ \ 7 r* \Pray (M / 'x 0 . 0 6 1
5 0 0
P 4 0 0
t 0»
o 1 . 3 / •* / <
8 A > 0 . 0 4 o
f* * 3 0 0
2 0 0 j/Pbeam \
i l 1 . 2
0 . 0 2
w
C
t 1 0 0
i i i
1 . 1
_.-"r i i t
w
C
t
o - - 1 .U «J . WVP
180 190 2 0 0 2 1 0 2 2 0 2 3 0
> *
180 190 20O 2 1 0 2 2 0 2 3 0
* . <i>
Fig. 5. The results of ray-tracing calculations, (a) the peakedness of the power deposition for the total beam and for the central ray. (b) the normalized wave frequency and the current drive efficiency estimated from the generalized Fisch formula.
4.4 Results of Fokker-Planck calculations
Fokker-Planck calculations are performed to obtain an accurate estimate of the current drive
efficiency. The results for the injection of 10 MW at an angle of 0 = 210° are given in Table II
for each of the three different temperatures. The obtained efficiencies are 75% to 100% better
than those which follow from the generalized Fisch formula. Substituting the obtained values
for the Pbeam into Efl- (12), it is found that the currents that must be driven to obtain a complete
flattening of the current profile are 430 kA in the case with Te(q=2) = 8 keV, 310 kA in the 4
keV case, and 270 kA when Tc(q=2) = 2 keV. As shown before, already half this current is
sufficient for stabilization of the m=2 tearing mode. Thus, when Tc(q=2) = 8 keV, the current

43
driven by 10 MW is more than sufficient for stabilization. In the 4 keV case, the driven current
is slightly less than half the current required for a complete flattening and is marginally
sufficient for stabilization. When the temperature is 2 keV, however, the current drive
efficiency is strongly reduced and only 38 kA is driven by injection at <{> = 210°. This is nearly
an order of magnitude below the current that is required for complete flattening of the current
profile. Unless the current drive efficiency and the peakedness are increased significantly, the
power required for stabilization, is too high for a practical application of this method. In the 2
keV case, better results are obtained for a smaller injection angle, 0 ~ 200°. Also the
peakedness can be improved, when a smaller beam divergence is used. In the last column of
Table II, the results for a calculation for the injection of 10 MW with <(> = 200° and a
divergence of only 1° are presented. Both the current drive efficiency and the peakedness are
increased by a factor of two, so that the driven current is now sufficient for stabilization.
TABLE D Results of tl tie Fokker-Pl anck quasi-linear calculations.
Tc(q=2) 8keV 4keV 2keV 2keV*
4> 210° 210O 2100 2000
f/fc(q=2) 1.108 1.080 1.056 1.033
PEC 10 MW 10 MW 10 MW 10 MW
ICD 308 kA 147 kA 38 kA 83 kA
Tl [AW1 lO^nr2] 0.12 0.06 0.016 0.032
fWl 250 350 400 700
* In this case the divergence of the beam has been reduced to 1° in order to optimize the
localization.
5 Summary and conclusions
Two applications of Electron Cyclotron Current Drive have been studied. One is to drive the
central pan of the main plasma current. The other is the use of ECCD for current profile
control. The results on central current drive are presented in Section 3 and can be summarized
as follows. Current drive by EC waves requires frequencies either well below (downshifted) or
well above (upshifted) the electron cyclotron frequency. The optimum current drive efficiencies
are obtained with upshifted frequencies. In this case the O-mode polarization has to be used.
The waves are injected from the low-field side in the equatorial plane. The localization of the
current determined by the chosen N|| spectrum of the injected waves. A smooth current density
profile can be obtained by appropriately choosing the injection angles for a large number of
44
individual beams so as to generate a smooth N» spectrum. The highest efficiencies are obtained
for the highest frequencies and the highest values of Ng. However, the frequency is limited to -
240 GHz due to overlap with the second harmonic resonance. The optimum efficiency that is
obtained is T) - 0.3 AW"» 102" m"2
In Section 4, we have demonstrated the feasibility of control of the current density profile
around the q = 2 surface. To achieve simultaneously the optimum current drive efficiency and
a good localization of the driven current profile, O-mode waves at upshifted frequencies are
injected from the low-field side in the equatorial plane. The maximum current drive efficiency,
as obtained from Fokker-Planck calculations, is found to be proportional to the temperature at
the q = 2 surface. For equatorial injection as considered here, the peakedness of the driven
current density profile is limited by the divergence of the injected beam. For a temperature at
q = 2 of 4 to 8 keV and using a beam with an injection angle of <|> = 210° and a divergence of
2.5°, around 10 MW of injected power is required to stabilize the m=2, n=l tearing mode. For
lower temperatures higher power levels would be required for stabilization, unless the beam
has a smaller divergence, so that a higher value of the peakedness is obtained. Also the
injection angle of the beam must be changed to optimize the current drive efficiency. A 10 MW
beam injected under 0 = 200° and with a divergence of 1° is sufficient to stabilize the m=2
tearing mode in a plasma with Te(q=2) = 2 keV. The wave frequency required to localize the
driven current at the q = 2 surface is a function of the position of the q = 2 surface, the
temperature, and the injection angles. Therefore, the wave frequency should be tuneable with
an accuracy of around 2 to 1% depending on the peakedness of the profile of the driven
current.
Acknowledgements
Useful discussions with Prof. F. Engelmann are gratefully acknowledged. We thank the NET
team for providing the NET magnetic equilibrium. This work was performed under the
Euratom-FOM association agreement, with financial support from NWO and Euratom (NET
contract no. 88-151).
References
[1] Wegrowe, J.G., et al., Fusion Techn. 14 (1988) 165. [2] Waddell, B.V., et al., Phys. Rev. Lett. 41 (1978) 1386; Turner, M.F., Wesson, J.A.
Nucl. Fusion 22 (1982) 1069; Holmes, J.A., et al., Nucl. Fusion 19 (1979) 1333. [3] Batchelor, D.B., Goldfinger, R.C., Rep. ORNL/TM-6844; Kritz, A.H., et al., (1982) in
Proc. of 3r<* Int. Symp. on Heating in Toroidal Plasmas, Grenoble (France), 22-26 March 1982, Vol. II p. 707.
[4] Giruzzi, G., Phys. Fluids 31 (1988) 3305. [51 Fidone, I., et al., Nuclear Fusion 27 (1987) 579.

45
[6] Bottoli, PT., Porkolab. M., Nucl. Fusion 27 (1987) 1341. [7] Smith, G.R., Cohen, R.H., Mau, T.K., Phys. Fluids 30 (1987) 3633. 18] Chan, VS., et al., Nucl. Fusion 22 (1982) 787; Start, DJF.H., et al., Plasma Phys. 25
(1983) 447; Cohen, R.H., Phys. Fluids 30 (1987) 2442; Yoshioka, K., Antonsen, T.M., Nuc! Fusion 26 (1986) 839.
[9] Westerhof, E., Nucl. Fusion 27 (1987) 1929. [10] Furth, H.R, Rutherford, P.H., Selberg, H., Phys. Fluids 16 (1973) 1054. [11] Giruzzi, G., Nucl. Fusion 27 (1987) 1934.

46
A DOUBLE-HETERODYNE ECE RADIOMETER FOR THE MEASUREMENT OF SMALL
TEMPERATURE FLUCTUATIONS ONRTP
M. Verreck and C.A.J. Hugenholtz
FOM-lnstituut voor Plasmafysica Rijnhuizen, Associatie EURATOM-FOM,
P.O. Box 1207, 3430 BE Nieuwegein, The Netherlands.
Abstract
A 20-channel double-conversion superheterodyne radiometer to diagnose second harmonic X-
mode ECE emission from a new tokamak experiment, the 'Rijnhuizen Tokamak Project'
(RTP), is under development. The main purpose of this diagnostic will be the measurement of
electron-temperature fluctuations, which are suspected to play an important role in anomalous
transport and heat loss effects.
The double-conversion technique is characterized by the application of two frequency
conversion steps for each channel. This approach offers the opportunity to do the main part of
the signal handling, like bandwidth selection and amplification, on a low frequency level
(< 1 GHz) where relative low cost and 'easy to manufacture' components are available. The
application of this technique will increase the flexibility of radiometer systems for ECE
measurements and offers the best resolution properties now possible.
1 Introduction
Studies on anomalous transport in tokamak plasmas have gained in importance over the past
years. The gap between experimental observations of poor energy confinement and
confinement properties calculated on the basis of neoclassical theory is so large, that this forms
a significant uncertainty factor in the development of large scale reactor-type experiments. A
possible cause for this enhanced transport is the occurrence of turbulence in the plasma density
or in the magnetic fieldline structure accompanied by turbulent temperature fluctuations in
which foremost the electrons are involved. The ECE diagnostic described in this short article
will be specially intended for measuring these random and small electron temperature
fluctuations. As such, it forms a part of the whole RTP experiment, which has the study of
anomalous transport as its main research subject. The main parameters of RTP are summarized
in Table I.

47
Table 1. RTP parameters
(Expected maximum values)
Major radius Ro 0.72 m Limiter radius <*Iim 0.185 m Central toroidal field Bo 2-2.6 T Pulse duration t p 250 ms Plasma current Ip 200 kA Central electron
Temperature Te o.s^.s2) keV
1) Ohmic discharge: 2) ECRH discharge.
For heating and for active transport studies, 2 gyrotrons will be installed from 1990 onwards
(2x60 GHz). Looking somewhat closer to the requirements that one has to satisfy to make
adequate fluctuation measurements, one comes to the following observations:
Electron density measurements have shown that turbulent spectral densities can develop up to
500 kHz [1]- It is planned to limit the bandwidth in this experiment to 1 MHz, which should be
sufficient for the study of Tc-fluctuations.
The turbulent modulation depth in density spectra (Ane/nc) is generally more than 1% [2].
Assuming, in first order approximation, constant pressure on a flux surface, this would mean a
AiyT e of > 1% as well. To measure this Te-fluctuation level in the confinement region of the
RTP-plasma (Te = 100-1000 eV) one needs an absolute resolution of 1 eV.
To increase the wavelength-resolving power (or increase thelc-limit) for the determination of
fluctuation spectra, the spatial resolution must be high in all directions (1 and // to the line of
sight).The spatial resolution is determined by two different aspects. First, limits are set to th;
resolution by plasma effects (finite absorption) and geometrical effects (antenna beam width
and flux surface curvature). Second, the resolution is also strongly dependent on the bandwidth
of the channels. Thus, apart from using a narrow beam, a technique is needed with which the
bandwidth of the channels can be lowered independently to a level, such that the resolution
corresponding to the bandwidth (IAR/R! = Af/f) equals more or less the limit set by the other
above mentioned effects. Lowering the bandwidth further does not result in a significantly
better spatial resolution and, moreover, reduces the signal-to-noise ratio as will be shown
below.
Based on this set of requirements, we decided to build a multi-channel double-conversion (or
double-heterodyne) radiometer, as described in the next section, because it is a well suited
ECE-diagnostic for this experiment.

48
2 Experimental set-up
The experiment consists of four distinct parts: the transmission part (antennas, waveguides),
detection part (all analog components), calibration sources and data-acquisition. The measured
radiation is second harmonic X-mode EC-emission. Therefore, all frequencies mentioned
onwards are second harmonic, unless stated otherwise.
2.1 Transmission lines
In the current scheme, two antennas will be used, covering 86-110 GHz (W-band) and 110-
146 GHz (T-band), respectively. Their position will be horizontal in the equatorial midplane.
Because of the deepness of the RTP ports, they have to be mounted inside the vacuum vessel.
Transmission will take part mainly through oversized straight waveguides. Single mode
waveguide will be used directly after the antennas, where a thin \ - 10 |im) dielectric foil serves
as vacuum- and DC-break. Also the iast pan entering the radiometer will be in single mode.
Here the W-band and T-band signals are divided over 2 and 3 frequency down-conveners,
respectively.
2 2 Detection part
In the frequency range of interest on RTP (88-155 GHz for Bo = 2.14 T), a number of
necessary broadband components have become available over the past few years. For our
purpose, 5 down-conveners are used (broadband mixers + local Gunn-oscillators), selecting
bands with a width of 12 GHz from the EC-spectrum (86-98 GHz...l34-146 GHz) and
convening these down to a uniform IF-band of 6-18 GHz, where pre-amplification is applied
(see Fig. 1). This is a single sideband (SSB) conversion. Subsequently, these IF-signals are
mixed with a second set of LO-frequencies at 7.5, 10.5, 13.5 and 16.5 GHz. In that way the
first IF-spectrum is subdivided in sections of 3 GHz wide, each representing one channel. Each
sub-band is folded around its centre frequency and converted to 0.005-1.5 GHz (double
sideband (DSB) convened). The DC lowei bound not exactly DC but typically a few (= 5)
MHz, because of the various DC-decoupling capacitances in the chain of components.
Furthermore, by using components wi\h a bandwidth of 1 GHz, the EC-bandwidth is lowered
to 2 GHz. In the end the signals pass a second amplification stage and will be detected by
power detectors.
Notice, that there is a difference between both conversion steps in the sense that the first
conversion is SSB and the second DSB. This implies, that in the second conversion each
frequency band is effectively halved with respect to the selected band in the RF spectrum.

Waveguide input Down converting front-end»: Double bal. RF Switchable Filter selection transmission lines. - Image rejecting high pass finer. mixers. amplifier RF l o w p a s s ^ ^ 35 m Passive Low Pass
- Double bal. mixer. filter yS^ Calibrated Transmission filters (3 different cut off • Gunn oscillator. n M , jodB '*- DC preamplifier line (coaxial) frequencies selectable)
Broadband 0.05 ' 1 40 dB
ri<SH>H Envelope l
WG27 Single Mode
86-110
8 - channel VM E based ADC - modules
DROa as LO for second stage mixers
Fig. 1. Schematic overview of the 20-channcl double heterodyne radiometer. (Dimensioniess numbers are selected frequency bands in GHz.)

50
With a low-pass filter of which a -3 dB cut-off frequency can be seiected of around 200,400,
600 or 800 MHz, the EC-bandwidth of each channel can be varied in steps between 0.4 and
2 GHz. In RTP this corresponds to a stepwise tunable integration width along the line of sight
of ~ 1-8 mm at the plasma edge on the high field side, ~ 2.5-13 mm in the centre and ~ 4-18
mm at the edge on the low field side. These values are valid for Bo ~ 2 T. The higher Bo, the
smaller will be the integration width.
The application of a low-pass filter is just an example of the increased flexibility gained when
working in this low frequency regime. Other techniques which can be applied are discrete level
control and frequency tuning. The former consists of feeding back the detector signal to control
a step-attenuator at the input of the final amplifier. In this way, the amplifiers can be kept out of
saturation and the dynamic range of the radiometer can be increased considerably. The
application of this technique is currently under study.
Notice however, that the wide selection of parameter configurations given by this increase in
flexibility (i.e. 5 selectable bandwidth values times 20 channels) demands the considerable
effort to recalibrate the channels after each change of the configuration. This recalibration
should be done fast and routinely and at least partly automized.
23 Calibration sources
To calibrate the system as accurately as possible, a set of measures will be taken. A linearity
characteristic will be recorded with the aid of a tunable single frequency source in the RF region
(BWO), the first IF region or the second IF region (Synthesizer,VCO). In the latter case we
assume that the envelope detectors are responsible for the non-linearity of the whole system
(including mixers etc.), which is likely but not at all certain. These linearity curves will be
matched to the spectra accurately recorded from a specially designed low-temperature
broadband calibration source.
This source consists of two cavities covered on the inside with a thin layer of microwave
absorbing material, which is maintained at a constant temperature (77 K and ~ 320 K). A
rotatable chopper blade controls which of the 2 thermal black-body spectra is emitted by the
source. The source is too large to use inside the torus. However, the branch of the transmission
line looking into the source, will be constructed identical to the plasma viewing branch. The
two branches will be calibrated against each other, before installation.
For fast routine calibrations (for example when the filters are switched), we will use gas
discharge tube microwave sources. Nevertheless, these sources have to be calibrated against
the 2-cavity source on a regular timebase.

51
3 Expected performance
In each square law signal detection system, the signal-to-noise ratio (S/N) is strongly
dependent on bandwidth and sampling- (or integration-) time. This is a result of photon
fluctuations and imposes severe limits on the performance of broadband superheterodyne
radiometers, also if they operate in the 'classical' microwave region. S/N is given by the
following fundamental equation [3]:
S/N = V2Af-x; (1)
where Af *' is the bandwidth of the incoming signal and t is the sampling rime.
Apart from the noise level given by Eq.(l) there is also a noise contribution generated by the
various active components (thermal Johnson noise and generation-recombination noise). For
superheterodyne receivers, this contribution is generally much smaller (few tenths of an eV)
than the signal induced fluctuation level. Moreover, since noise powers add up quadratically,
the thermal noise can be neglected easily in most of the cases.
For ECE measurements, S/N, Af and t can be transformed into temperature resolution (ATC),
spatial resolution along the line of sight (AR) and temporal resolution (At), respectively. If
Eq.(l) is expressed in terms of these variables and all spurious sources of uncertainties are
taken into account, the following relation can be derived:
where fee is the Iocs! fundamental cyclotron frequency and n is the harmonic number, which is
2 in this case.
If one fills in the requirements for measuring fluctuations mentioned in the introduction, one
sees that they are not permitted by the criterium Eq. (2). This is a disappointing result. The
more, because the limit set by Eq. (2) is a fundamental one which cannot be avoided. The
various parameters mentioned in die left-hand side of Eq.(2) can, of course, be optimized at the
expense of the others. They all have, however, an absolute lower limit. These limits can be
very low when using a double-conversion radiometer, as will be shown below. Consequently,
measurements can be done in a much wider part of die parameter range.
Strictly speaking, Af is the bandwidth of the signal entering the detector. Consequently this value must be doubled in Eq. (1) for each preceding DSB demodulation stage. For this diagnostic, the second conversion is DSB, i.e. the DC-1 GHz entering the detector gives Af » 2 GHz in Eq. (1). Notice that this has nothing to do with the factor 2 already present in Eq. (1).

52
For ATe, this limit is given by the noise generated by the hardware. For the diagnostic under
description, this value lies between OA and 0.5 eV, as recent measurements have shown.
The minimum value for At is given by the hardware as well. In our case the sampling
frequency will be limited to 2.5 MHz. This enables us to Fourier analyse the signal up to I/At =
1MHz.
For the spatial resolution along the line of sight, the situation is more complicated. The AR
mentioned in Eq. (2) stands for the integration length corresponding to the bandwidth of the
channel, selected by the low-pass filter. There are however also independent contributions from
plasma effects and geometrical effects. First one has to take into account a minimum distance
from the resonance layer in the observers' direction, such that the plasma becomes optically
thick over this distance for the (harmonic of the) local resonance frequency. The second
contribution comes from dispersion and the finite divergence of the antenna beam in
combination with the curvature of the flux surfaces. This causes the spatial integration width
perpendicular to the line of sight to create an enhancement of the integration width along the
viewing line.
Apart from a lower limit for AR, there is also an upper limit corresponding to the maximum
bandwidth of the channels.
4 Status and future extensions
The diagnostic described in this paper will become fully operational in the first half of 1990.
A study will be made of the necessity of the application of optical imaging techniques (lenses)
to increase the perpendicular spatial resolution.
Preparations have started to mount a set of specially designed antennas in the torus on the high
field side. By means of waveguide switches it will then be possible to choose between the two
sets of receiving antennas. The second set is intended to measure the emission of suprathermal
electrons generated by ECRH. The measured spectra will be compared with results from
theoretical predictions. In this way we will make a study of the resistive diffusion of
suprathermal electron populations and the effects on global plasma behaviour.
5 Conclusions
Unfortunately, the resolution requirements made in section 2 cannot be satisfied simultaneously
because of the problem of photon noise. However, the fundamental performance limit (Eq. (2))
can be reached easily by the multichannel double-conversion radiometer. Moreover, the values
for the temperature-, spatial- and -time resolution can be optimized further than with other ECE

53
systems. This makes this diagnostic well suited to perform temperature fluctuation
measurements.
Acknowledgements
The authors would like to thank Dr. J.L. Tauritz and his group of the Technical University of
Delft for the design and the construction of the switchable UHF low-pass filter.
This work was performed as part of the research programme of the association agreement of
Euratom and the 'Stichting voor Fundamenteel Onderzoek der Materie' (FOM) with financial
support from the 'Nederlandse Organisatie voor Wetenschappelijk Onderzoek' (NWO) and
Euratom.
References 11] Brower D.L., Peebles W.A., Luhmann jr., N.C., Nucl. Fusion 27 (1987) 2055. [2] Wootton A.J. et ai, Plasma Phys. and Controlled Fusion 30 (1988) 1479. [3] Ziel, Van der, A., Noise: Sources, Characterization, Measurement, Prentice-Hall, Ine,
N.J. (1970).