FOCUS AREAS ON NATIONAL ROADS Congestion
31
FOCUS AREAS ON NATIONAL ROADS Congestion
-
Upload
ronan-huff -
Category
Documents
-
view
60 -
download
2
description
FOCUS AREAS ON NATIONAL ROADS Congestion. FOCUS AREAS ON NATIONAL ROADS Causes – Traffic Density. Intelligent Transport Systems. SANRAL is in the process to implement Intelligent Transport Systems for freeways in Gauteng. - PowerPoint PPT Presentation
Transcript of FOCUS AREAS ON NATIONAL ROADS Congestion
FOCUS AREAS ON NATIONAL ROADS
Congestion

FOCUS AREAS ON NATIONAL ROADS
Causes – Traffic DensityVehicle Kilometre Travel per 1 Kilometre of Road
0
1
1
2
2
3
1999 2000 2001 2002 2003
Year
Veh
icle
Kilo
met
re T
rave
l (M
illio
n K
m)
RSA SANRAL

Intelligent Transport Systems
• SANRAL is in the process to implement Intelligent Transport Systems for freeways in Gauteng.
• The system utilizes different technologies such as traffic detectors, CCTV and electronic tags in vehicles to collect information about traffic conditions and to detect incidents
• The information collected is processed at the Network Management Centre (NMC) that is located at the Midrand Fire Station. At/from the NMC -– The public is informed about traffic conditions/incidents– Emergency services are informed about incidents and provided with
real time images from the incident– Intelligent decisions to optimise traffic flows are taken.

ITS (continued)
• Information is provided to the public by means of: – Variable (electronic) Message Signs (VMS)– Radio reports – SMS services– A web page
• SANRAL almost completed the first phase of the project for the Ben Schoeman:– The NMC was set up– Fiber optic communication backbone in place– 70 CCTV cameras– 10 Variable Message Signs– Traffic detectors

Construction Price Adjustment Indices Trend
100
110
120
130
140
150
160
170
180
190
200F
eb-0
1
Ap
r-01
Jun-
01
Au
g-01
Oct
-01
Dec
-01
Feb
-02
Ap
r-02
Jun-
02
Au
g-02
Oct
-02
Dec
-02
Feb
-03
Ap
r-03
Jun-
03
Au
g-03
Oct
-03
Dec
-03
Feb
-04
Ap
r-04
Jun-
04
Au
g-04
Oct
-04
Dec
-04
Feb
-05
Ap
r-05
Jun-
05
Au
g-05
Oct
-05
YEAR
Ind
ex V
alu
e (B
ase
100
= 20
00)
Civil Engineering Plant Index Fuel Index Civil Engineering Materials Index Labour Index (Average) CPI

Indices Comparison Trend
100
110
120
130
140
150F
eb-0
1
Ap
r-01
Jun-
01
Au
g-01
Oct
-01
Dec
-01
Feb
-02
Ap
r-02
Jun-
02
Au
g-02
Oct
-02
Dec
-02
Feb
-03
Ap
r-03
Jun-
03
Au
g-03
Oct
-03
Dec
-03
Feb
-04
Ap
r-04
Jun-
04
Au
g-04
Oct
-04
Dec
-04
Feb
-05
Ap
r-05
Jun-
05
Au
g-05
Oct
-05
YEAR
Ind
ex V
alu
e (B
ase
100
= 20
00)
CPI Index PPI Index CPA Index Source: www.statssa.gov.za
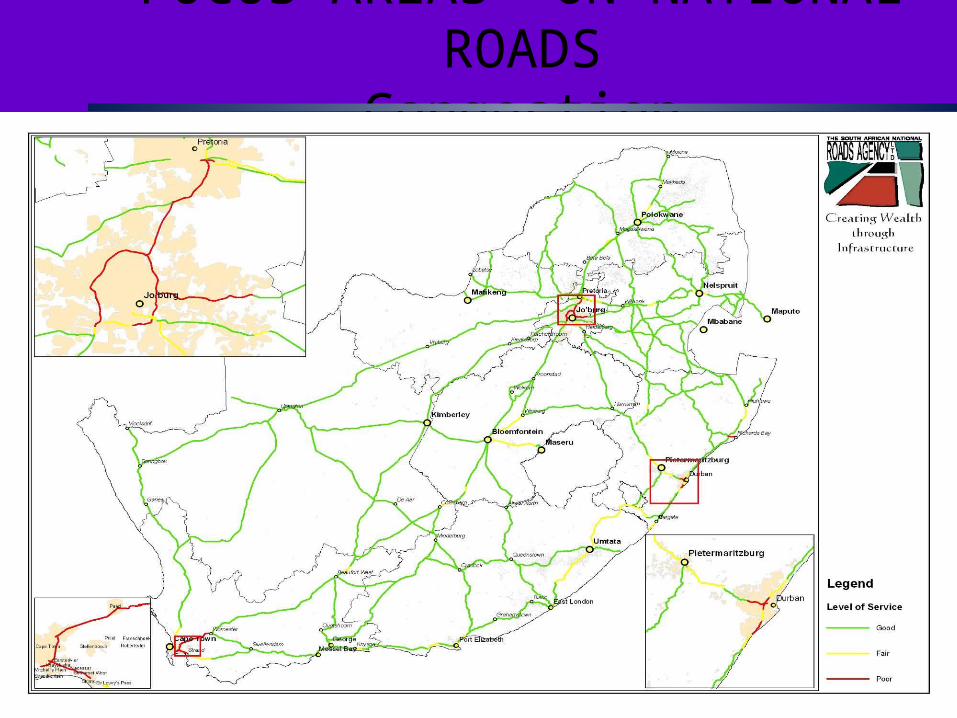
Bitumen Price Trend
R 500.00
R 1,000.00
R 1,500.00
R 2,000.00
R 2,500.00
R 3,000.00
Feb-
01
Apr
-01
Jun-
01
Aug
-01
Oct
-01
Dec
-01
Feb-
02
Apr
-02
Jun-
02
Aug
-02
Oct
-02
Dec
-02
Feb-
03
Apr
-03
Jun-
03
Aug
-03
Oct
-03
Dec
-03
Feb-
04
Apr
-04
Jun-
04
Aug
-04
Oct
-04
Dec
-04
Feb-
05
Apr
-05
Jun-
05
Aug
-05
Oct
-05
Dec
-05
YEAR
Pri
ce @
Du
rban
(Ran
d/T
on
)
Source: www.sabita.co.za

2004/20052005/2006
2006/20072007/2008
2008/2009
Funding Allocation
Funding Need
R 2,551,536
R 4,359,871
R 7,367,882R 8,660,684
R 7,728,890
R 1,440,789 R 1,752,720 R 2,292,075 R 3,041,929R 3,509,964
R 0
R 1,000,000
R 2,000,000
R 3,000,000
R 4,000,000
R 5,000,000
R 6,000,000
R 7,000,000
R 8,000,000
R 9,000,000
Bu
dg
et (R
'000
)
Financial Year
Non-Toll Funding Need versus Allocation (Incl VAT)20,000km Primary Network
Funding Allocation Funding Need

Note: Allocations for 2007/08 and 2008/09 still subject to final adjustments
MTEF Budget Request vs Allocation
R 0
R 5,000,000
R 10,000,000
R 15,000,000
R 20,000,000
R 25,000,000
Financial Year
Ran
ds
(Mill
ion
)
Budget - Request R 1,306,799 R 1,394,686 R 1,854,556 R 2,551,536 R 4,359,871 R 7,367,882 R 8,660,684 R 7,728,890
Budget - Allocation R 873,612 R 1,061,064 R 1,170,556 R 1,440,789 R 1,752,720 R 2,292,075 R 3,041,929 R 3,509,964
Budget - Deficit R 433,187 R 333,622 R 684,000 R 1,110,747 R 2,607,151 R 5,075,807 R 5,618,755 R 4,218,926
Cumulative Deficit - April 1998 R 1,130,349 R 1,463,971 R 2,147,971 R 3,258,718 R 5,865,869 R 10,941,676 R 16,560,430 R 20,779,357
2001/02 2002/03 2003/04 2004/05 2005/06 2006/07 2007/08 2008/09
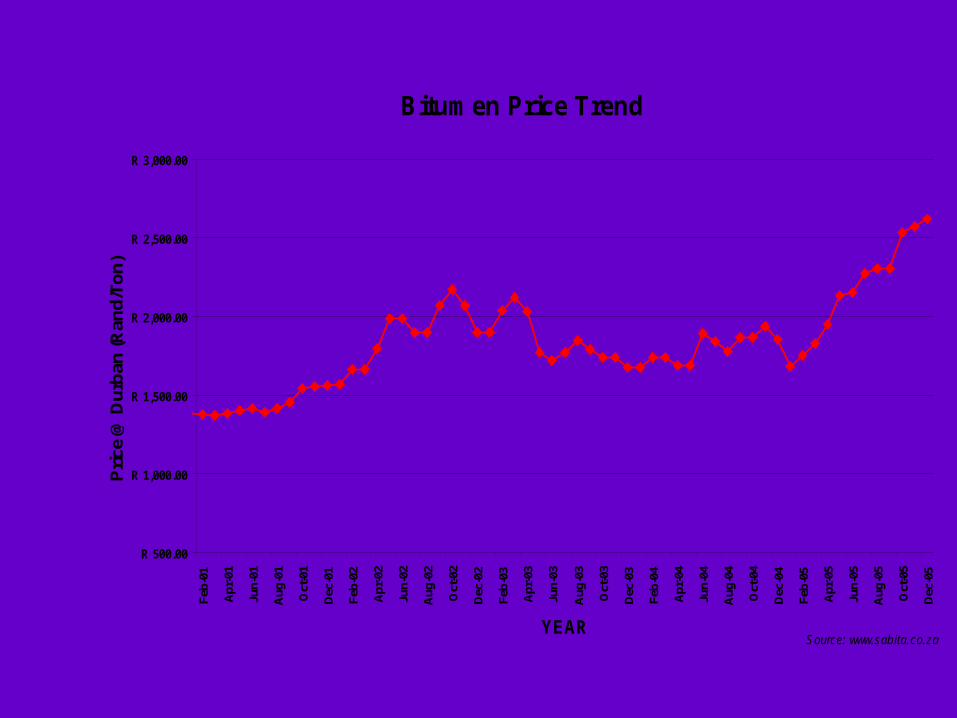
Budget Kilometre Trend (2005 Rands)
0
200,000
400,000
600,000
800,000
1,000,000
1,200,000
1,400,000
1,600,000
1,800,000
1970 1975 1980 1985 1990 1995 2000 2005 2010
Year
Bu
dg
et p
er K
ilom
etre
(Ran
ds)

Excl. Expansions
Sustaining Network: Routine Maintenance = R25 000/km/yearResurfacing = R400 000/km/10 yearsStrengthening = R4 000 000/km/25 years
Budget Requirement Trend (2005 Rands)
R 0
R 500
R 1,000
R 1,500
R 2,000
R 2,500
R 3,000
R 3,500
R 4,000
R 4,500
R 5,000
1970 1975 1980 1985 1990 1995 2000 2005 2010
Year
Ran
ds
(Mill
ion
)
Theoretical Budget Actual Budget

Non-Toll Budget Comparison
R 0
R 5,000,000
R 10,000,000
R 15,000,000
R 20,000,000
R 25,000,000
Required Allocation
Cu
mu
lativ
e M
TE
F B
ud
get
200
6/07
to 2
008/
09 (R
'000
)
New Facilities
Improvements
Strengthening
Special Maintenance
Periodic Maintenance
Routine Operations
Ad Hoc Maintenance
Expropriation Of Land
Sundry Capital Expenditure
Property Management
Technical Support
Administrative Support
Salaries

Non Toll: Operational Expenditure (OPEX)
R 0
R 100,000
R 200,000
R 300,000
R 400,000
R 500,000
R 600,000
2006/2007 2007/2008 2008/2009
YEAR
Exp
end
iture
(R'0
00) Salaries
Administrative Support
Technical Support
Property Management
Ad Hoc Maintenance
Routine Operations
Periodic Maintenance
Special Maintenance

Non Toll: Capital Expenditure (CAPEX)
R 0
R 200,000
R 400,000
R 600,000
R 800,000
R 1,000,000
R 1,200,000
R 1,400,000
R 1,600,000
2006/2007 2007/2008 2008/2009
YEAR
Exp
end
iture
(R'0
00)
Sundry Capital Expenditure
Expropriation Of Land
Strengthening
Improvements
New Facilities
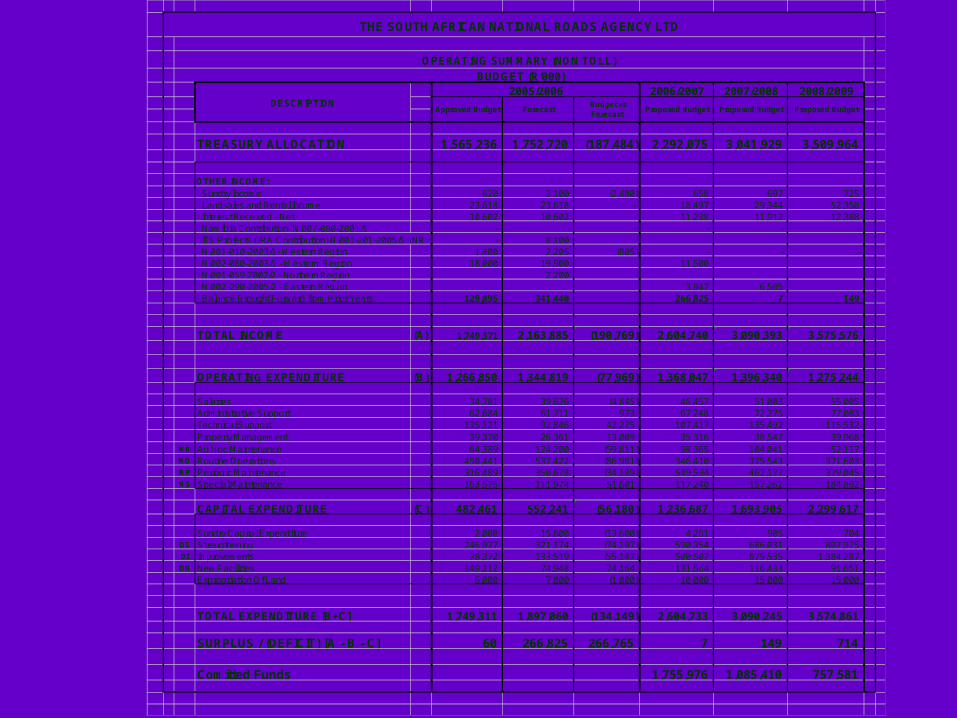
TREASURY ALLOCATION 1,565,236 1,752,720 (187,484) 2,292,075 3,041,929 3,509,964
OTHER INCOME: Sundry Income 620 3,100 (2,480) 658 697 725 Landsales and Rental Income 23,618 23,618 - 18,497 29,344 52,350 Interest Received - Net 10,602 10,602 - 11,238 11,912 12,388 Namibia Contribution- N.007-080-2001/1 - - - - - - ITS Projects (JRA Contribution) N.001-201-2005/5 - NR - 8,100 N.001-010-2003/1- Western Region 1,400 2,205 (805) - - - N.002-080-2003/1 - Western Region 18,000 19,900 11,500 N.001-059.2002/2 - Northern Region 2,200 N.002-290-2005/2 - Eastern Region 3,947 6,505 Balance Brought Forward from Prior Years 129,895 341,440 266,825 7 149
TOTAL INCOME (A) 1,749,371 2,163,885 (190,769) 2,604,740 3,090,393 3,575,576
OPERATING EXPENDITURE (B) 1,266,850 1,344,819 (77,969) 1,368,047 1,396,340 1,275,244
Salaries 34,781 39,626 (4,845) 46,457 51,003 55,005 Administrative Support 62,684 61,711 973 67,248 72,275 77,083 Technical Support 135,121 92,846 42,275 107,417 135,492 115,532 Property Management 39,370 26,361 13,009 35,316 38,547 39,968
MR Ad Hoc Maintenance 64,389 124,200 (59,811) 98,365 104,041 52,117 MO Routine Operations 450,441 537,422 (86,981) 346,410 375,543 371,603 MP Periodic Maintenance 316,489 350,678 (34,189) 549,594 462,177 379,045 MS Special Maintenance 163,575 111,974 51,601 117,240 157,262 184,892
CAPITAL EXPENDITURE (C) 482,461 552,241 (56,180) 1,236,687 1,693,905 2,299,617
Sundry Capital Expenditure 2,000 15,600 (13,600) 4,261 905 704 DS Strengthening 246,977 321,174 (74,197) 590,354 686,031 807,975 DI Improvements 78,372 133,519 (55,147) 500,507 875,535 1,384,287 DN New Facilities 149,112 74,948 74,164 131,564 116,433 91,651
Expropriation Of Land 6,000 7,000 (1,000) 10,000 15,000 15,000
TOTAL EXPENDITURE [B+C] 1,749,311 1,897,060 (134,149) 2,604,733 3,090,245 3,574,861
SURPLUS / (DEFICIT) [A - B - C] 60 266,825 266,765 7 149 714
Comitted Funds 1,755,976 1,085,410 757,581
BUDGET (R'000)
OPERATING SUMMARY (NON TOLL)
THE SOUTH AFRICAN NATIONAL ROADS AGENCY LTD
Forecast Budget vs Forecast
2006/2007 2007/2008
Proposed Budget Proposed BudgetDESCRIPTION
Approved Budget
2005/2006 2008/2009
Proposed Budget

Community Development Programme2006 – 2007 (1)
• PEDESTRIAN FOCUS - R45mil– Pedestrian facilities
• Sidewalks and pedestrian bridges• Public transport facilities e.g. taxi layby’s, access to
market facilities, commuter facilities e.g. truck stops and rest areas
– Traffic safety education programme• Junior Traffic Training Centres• Workshops : National and Provincial focus in
cooperation with all role players• Development of education material and Streetwise
distribution to schools

• UPGRADING OF ROADS AND DRAINAGE – R30mil– In cooperation with Municipalities and District
Councils – Upgrading of rural access road linking to national
and provincial arterials
• WEED ERADICATION – R5mil– Exotic tree removal
Community Development Programme2006 – 2007 (2)

TECHNOLOGY TRANSFER INITIATIVE 2006 -2007
• Gender, Transport And Development Conference In Partnership With DOT, HSRC And CSIR
• TRAC : Sponsorship Of Maths And Science Initiatives
• Development Of Traffic Safety Education Material In Cooperation With DOE

Forecasted Non-Toll National Road Network Length in BacklogVarious Fiscus Funding Levels - No New Toll Roads (Preliminary)
0
500
1000
1500
2000
2500
3000
3500
4000
2002 2004 2006 2008 2010 2012 2014 2016 2018 2020 2022 2024
Year
Le
ng
th (
km
) in
Po
or
to V
ery
Po
or
Co
nd
itio
n R1 400 mill
R1 800 mill
R2 200 mill
R2 800 mill
R3 400 mill
Based on 11,500km of non toll roads
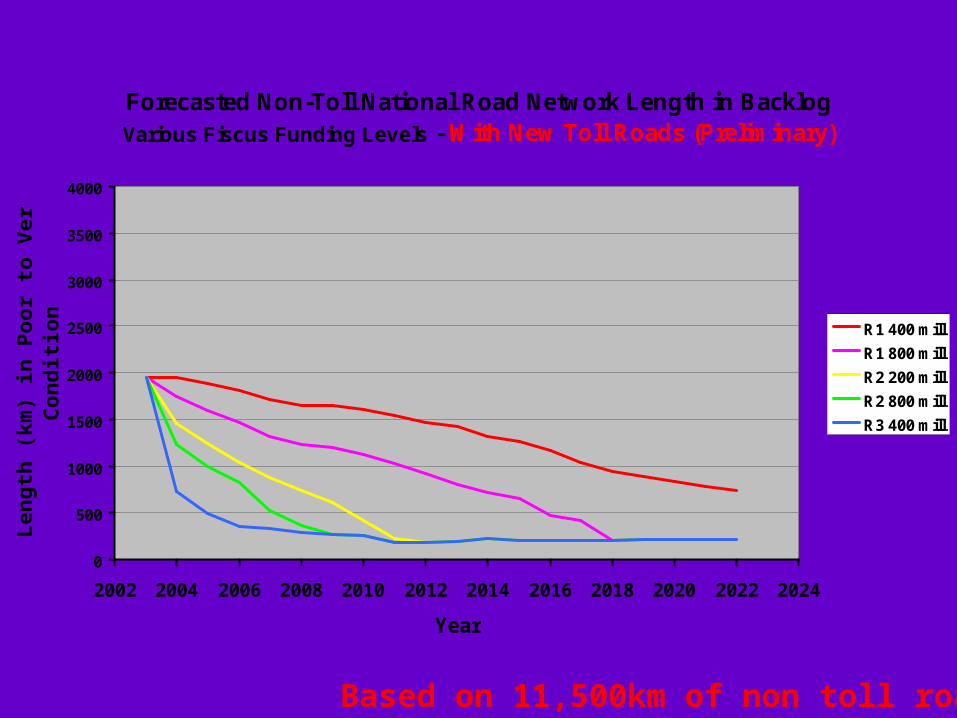
Forecasted Non-Toll National Road Network Length in BacklogVarious Fiscus Funding Levels - With New Toll Roads (Preliminary)
0
500
1000
1500
2000
2500
3000
3500
4000
2002 2004 2006 2008 2010 2012 2014 2016 2018 2020 2022 2024
Year
Le
ng
th (
km
) in
Po
or
to V
ery
Po
or
Co
nd
itio
n R1 400 mill
R1 800 mill
R2 200 mill
R2 800 mill
R3 400 mill
Based on 11,500km of non toll roads
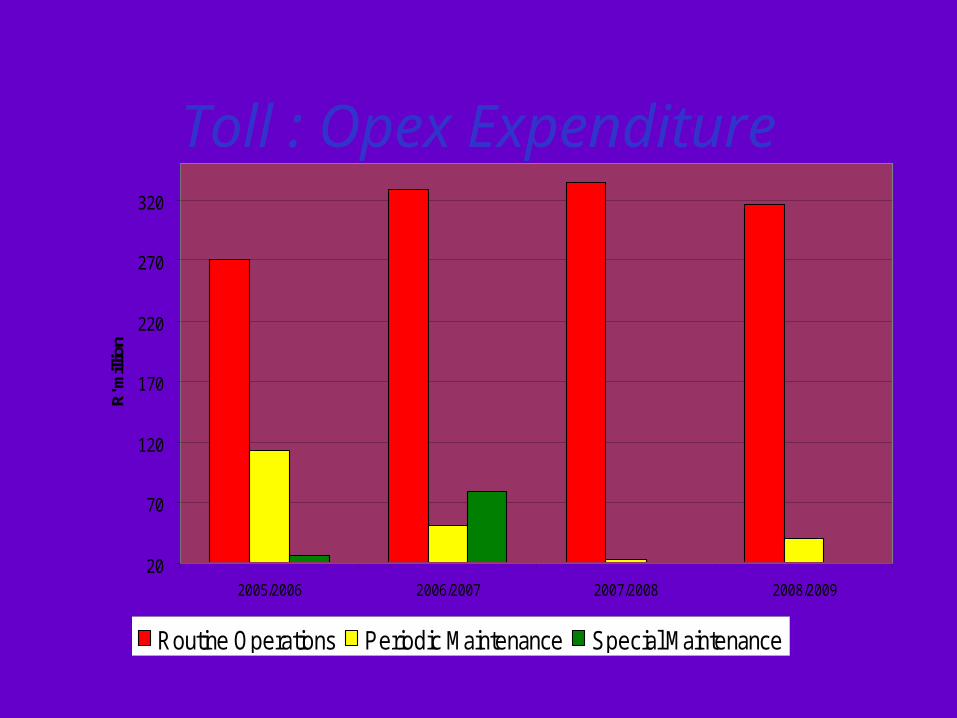
Toll : Opex Expenditure
20
70
120
170
220
270
320
2005/2006 2006/2007 2007/2008 2008/2009
R' m
illio
n
Routine Operations Periodic Maintenance Special Maintenance

Toll : Capex Expenditure
-
500
1,000
1,500
2,000
2,500
3,000
R'm
illio
n
2005/2006 2006/2007 2007/2008
Strengthening Improvements New Facilities
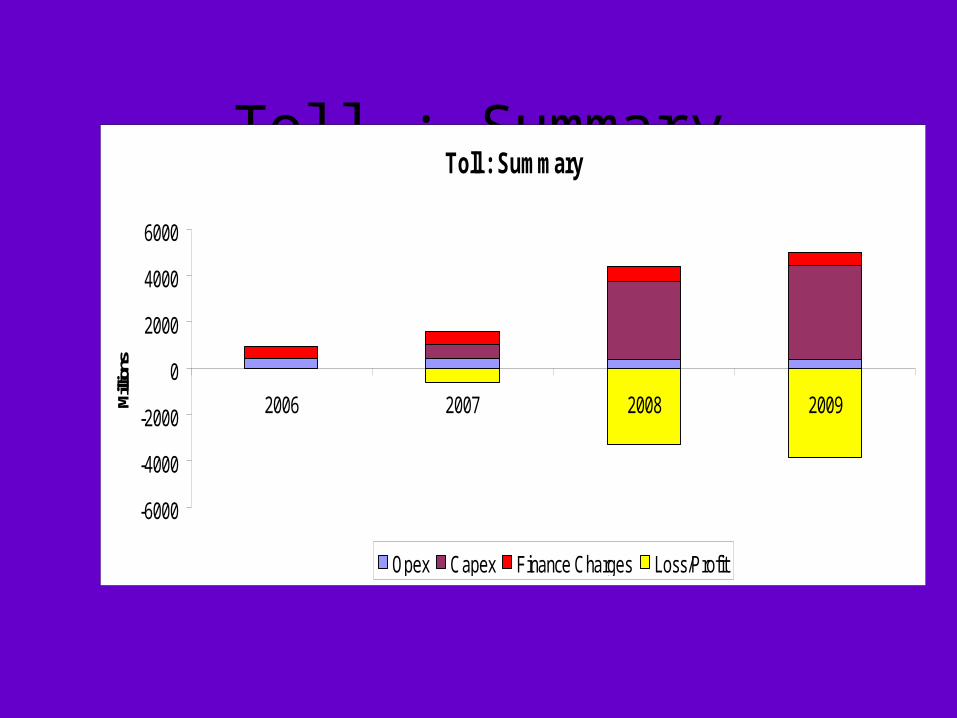
Toll : SummaryToll : Summary
-6000
-4000
-2000
0
2000
4000
6000
2006 2007 2008 2009Milli
ons
Opex Capex Finance Charges Loss/Profit

2005/2006 2005/06 2006/2007 2007/2008 2008/2009
TOTAL INCOME (A) 856,308 896,143 963,906 1,057,614 1,134,134
OPERATING EXPENDITURE (B) 403,808 416,237 466,486 360,929 357,195
Ad Hoc Maintenance - 5,801 6,215 770 646
Routine Operations 221,696 270,494 329,006 334,831 316,667
Periodic Maintenance 161,035 112,981 51,600 23,668 39,882
Special Maintenance 21,076 26,961 79,664 1,660 -
CAPITAL EXPENDITURE (C) 161,428 42,601 536,249 3,401,143 4,054,974
Strengthening 34,201 8,097 61,941 131,117 158,314
Improvements 120,568 16,780 169,208 514,042 478,401
New Facilities 6,659 17,724 305,099 2,755,984 3,418,259
TOTAL EXPENDITURE [B+C] 565,236 458,838 1,002,735 3,762,072 4,412,169
Nett Income 291,072 437,305 (38,829) (2,704,458) (3,278,035)
Finance Charges 450,605 464,000 481,000 563,000 880,000
Cash Surplus / (Deficit) (159,533) (26,695) (519,829) (3,267,458) (4,158,035)
TOLL OPERATING SUMMARY
DESCRIPTION
THE SOUTH AFRICAN NATIONAL ROADS AGENCY LTD
Forecast
Full Year
Approved
Budget
Proposed
Budget
Proposed
Budget
Proposed
Budget
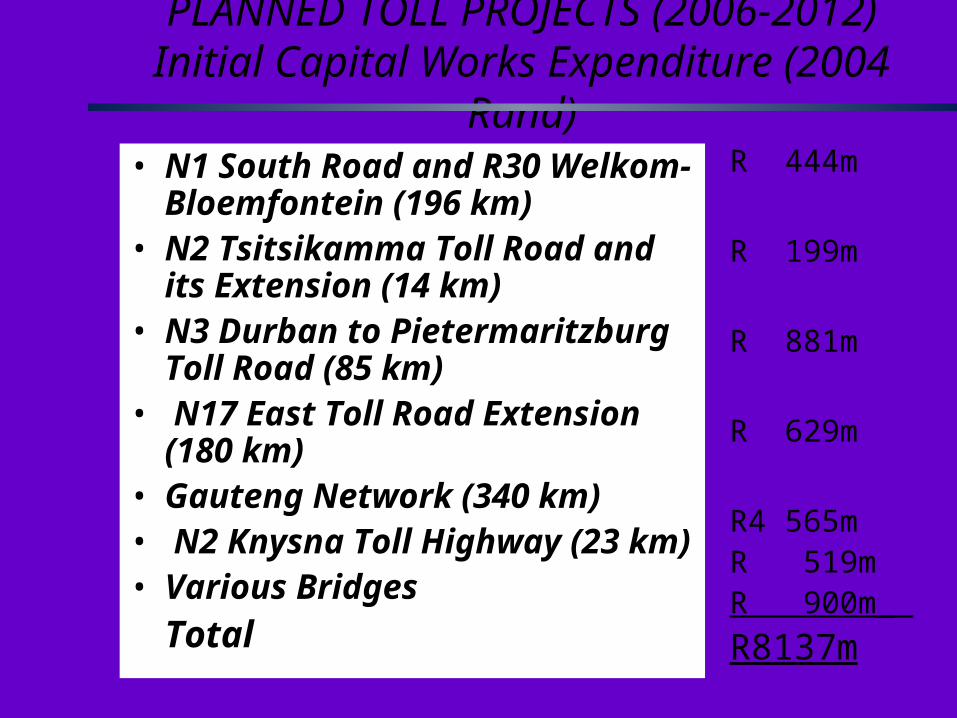
PLANNED TOLL PROJECTS (2006-2012)Initial Capital Works Expenditure (2004 Rand)
• N1 South Road and R30 Welkom-Bloemfontein (196 km)
• N2 Tsitsikamma Toll Road and its Extension (14 km)
• N3 Durban to Pietermaritzburg Toll Road (85 km)
• N17 East Toll Road Extension (180 km)
• Gauteng Network (340 km)• N2 Knysna Toll Highway (23 km)• Various Bridges
Total
R 444m
R 199m
R 881m
R 629m
R4 565mR 519mR 900m_
R8137m

CURRENT CONCESSIONS
• The N4 (East) Maputo Development Corridor: 420 km
• The N3 Cedara – Heidelberg: 512 km
• The N4 (West) Platinum Highway: 484 km
• Total Private Sector Investment: R9 billion

PROPOSED CONCESSION PROJECTS
(2004 Rand)
– N1-N2 Winelands Toll Highway: R2.5 bn
– N2 Wild Coast Toll Highway: R3.5 bn
3. R300 Cape Town Ring Road: R1.6 bn

EMPOWERMENT HISTORICAL
Value of Works R 5 041 370 832
Value of Works to Black
owned companies R 1 221 911 534
Value of Works to SMMEs R 1 432 760 132
Empowerment percentage 52,66%
Nov 2002 to December 2005
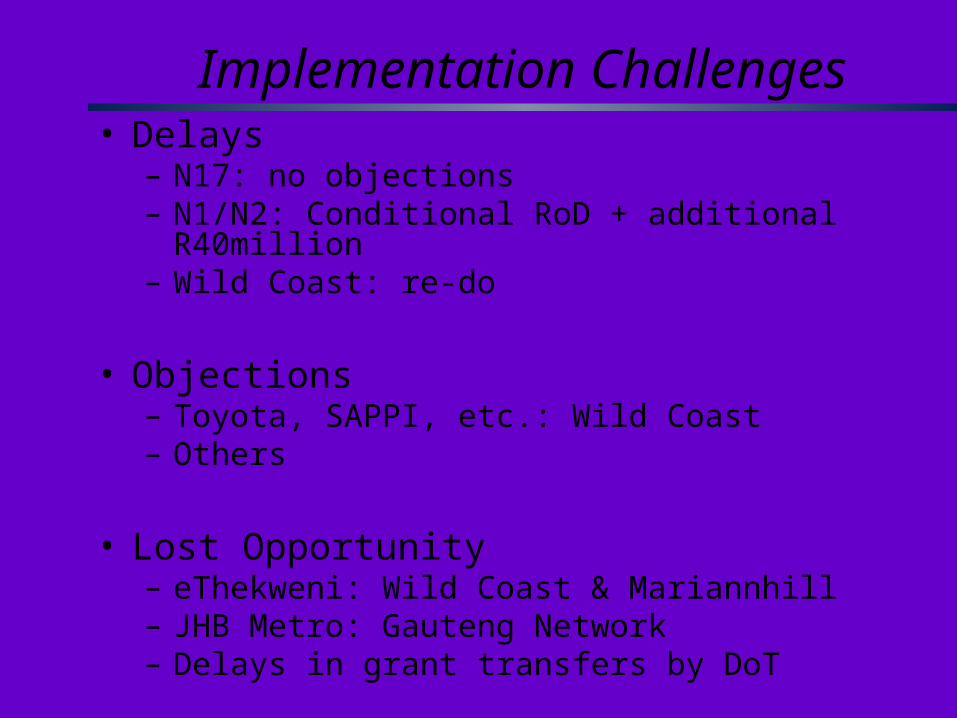
Implementation Challenges• Delays
– N17: no objections– N1/N2: Conditional RoD + additional R40million– Wild Coast: re-do
• Objections– Toyota, SAPPI, etc.: Wild Coast– Others
• Lost Opportunity– eThekweni: Wild Coast & Mariannhill– JHB Metro: Gauteng Network– Delays in grant transfers by DoT

“Poverty of a life lies not merely in the impoverished state which the
person actually lives, but also in the lack of real opportunities.”
Amartya Sen

Thank YouThank You
www.nra.co.za