Fluid Leakage across a Pressure Seal - COMSOL Multiphysics · Fluid Leakage across a Pressure Seal...
7
Fluid Leakage across a Pressure Seal Ruby R. P. *1 , G. Kulkarni 2 , and U. Kanade 1 1 Noumenon Multiphysics, 2 Oneirix Labs *15-1, “Sharman”, Sahajanand Soc, Kothrud, Pune 411038, INDIA. Email: [email protected] Abstract: Seals or gaskets that are compressed between walls of a container are important to many industrial applications. In this paper we present a fluid flow model for predicting the sealing performance of such seals. A computational study using COMSOL® suggests very strong simplifications to the postulated flow equations. Keywords: Sealing and seals, fluid mechanics, COMSOL®, non-linear structural mechanics, homogenization 1. Introduction Sealing of fluids is a very important indus- trial problem. Static and dynamic seals prevent fluids in one compartment from leaking into another compartment or the environment. Sealing techniques are of utmost importance in many engineering disciplines including auto- motive engineering, aeronautics and astronautics, marine engineering, hydraulics and pneumatics, biomedical engineering, building construction, etc. This paper concentrates on seals that act by compression – a piece of material (known in various situations as a gasket, an o-ring, a piston ring, etc.) is compressed between two compara- tively rigid surfaces. This compression causes the piece to press against the rigid surfaces, thus creating a seal for fluids. Such seals are used frequently in all the above disciplines, and there is a lot of information available about the geometries and materials of the seal to be chosen for various applications [1]. But the available information about compression seals is primarily of a heuristic nature. There is a clear need to create a mathematical theory of the performance of seals, to be able to analyze and design better sealing solutions. In this paper we concentrate on the perfor- mance of compression seals for sealing pressur- ized containers. This paper represents one of many steps in a program for creating a theory of seal performance. The envisioned theory is in the form of a partial differential equation (PDE) that predicts the leakage rate of a seal. These equa- tions are anticipated to be homogenized fluid flow equations of the creeping flow through crevices that an actual pressure seal experiences. Section 2 describes the program for creating the theory of seal performance in general. Section 3 describes the seal microgeometry and summarizes a main result of a previous paper by the authors [2]. Section 4 describes the problem tackled in this paper: fluid flow through crevices between abutting sealing surfaces, and a main hypothesis of this paper: that the microgeometric variation due to mechanical and fluid pressure, can be reduced, from a bulk fluid mechanical Figure 1: (a) A seal ring (red) is compressed between two parts of a container. (b) Closeup. (a) (b) Excerpt from the Proceedings of the 2014 COMSOL Conference in Boston
Transcript of Fluid Leakage across a Pressure Seal - COMSOL Multiphysics · Fluid Leakage across a Pressure Seal...

Fluid Leakage across a Pressure Seal
Ruby R. P.*1, G. Kulkarni2, and U. Kanade1
1Noumenon Multiphysics, 2Oneirix Labs*15-1, “Sharman”, Sahajanand Soc, Kothrud, Pune 411038, INDIA. Email: [email protected]
Abstract: Seals or gaskets that are compressed between walls of a container are important to many industrial applications. In this paper we present a fluid flow model for predicting the sealing performance of such seals. A computational study using COMSOL® suggests very strong simplifications to the postulated flow equations.
Keywords: Sealing and seals, fluid mechanics, COMSOL®, non-linear structural mechanics, homogenization
1. Introduction
Sealing of fluids is a very important indus-trial problem. Static and dynamic seals prevent fluids in one compartment from leaking into another compartment or the environment. Sealing techniques are of utmost importance in many engineering disciplines including auto-motive engineering, aeronautics and astronautics, marine engineering, hydraulics and pneumatics, biomedical engineering, building construction, etc.
This paper concentrates on seals that act by compression – a piece of material (known in various situations as a gasket, an o-ring, a piston ring, etc.) is compressed between two compara-tively rigid surfaces. This compression causes
the piece to press against the rigid surfaces, thus creating a seal for fluids. Such seals are used frequently in all the above disciplines, and there is a lot of information available about the geometries and materials of the seal to be chosen for various applications [1]. But the available information about compression seals is primarily of a heuristic nature. There is a clear need to create a mathematical theory of the performance of seals, to be able to analyze and design better sealing solutions.
In this paper we concentrate on the perfor-mance of compression seals for sealing pressur-ized containers. This paper represents one of many steps in a program for creating a theory of seal performance. The envisioned theory is in the form of a partial differential equation (PDE) that predicts the leakage rate of a seal. These equa-tions are anticipated to be homogenized fluid flow equations of the creeping flow through crevices that an actual pressure seal experiences.
Section 2 describes the program for creating the theory of seal performance in general. Section 3 describes the seal microgeometry and summarizes a main result of a previous paper by the authors [2]. Section 4 describes the problem tackled in this paper: fluid flow through crevices between abutting sealing surfaces, and a main hypothesis of this paper: that the microgeometric variation due to mechanical and fluid pressure, can be reduced, from a bulk fluid mechanical
Figure 1: (a) A seal ring (red) is compressed between two parts of a container. (b) Closeup.
(a)(b)
Excerpt from the Proceedings of the 2014 COMSOL Conference in Boston
perspective, to a characterization as a single number. Section 5 describes experiments using COMSOL® to test this hypothesis. Section 6 describes the results of COMSOL® experimentation and Section 7 describes implications of this work in context of the larger program, and suggestions for future extensions.
2. The Theory of Seal Performance – A Program
A seal, as shown in Figure 1 is a piece of elastomeric material compressed between two independently moving parts of a container. If installed correctly, the seal separates the space inside the container from the environment. In this and allied papers, we investigate the perfor-mance of such a seal while sealing a pressurized fluid.
It has been observed by us (to be reported in detail in a subsequent paper), that such a seal can never seal a fluid perfectly, if the fluid is a gas – there will always be some gas leaking out of the container, even if at a very low leakage rate. It is observed (and easy to imagine), that the rate at which a seal leaks is dependent on the pressure of the fluid inside the container – in general, the more the pressure of the fluid inside the con-tainer (relative to the pressure of the environ-ment), the faster the gas leaks. The performance of a seal can thus be described by the sealing characteristic – a plot depicting the leakage rate of the fluid inside the container as a function of the pressure inside the container.
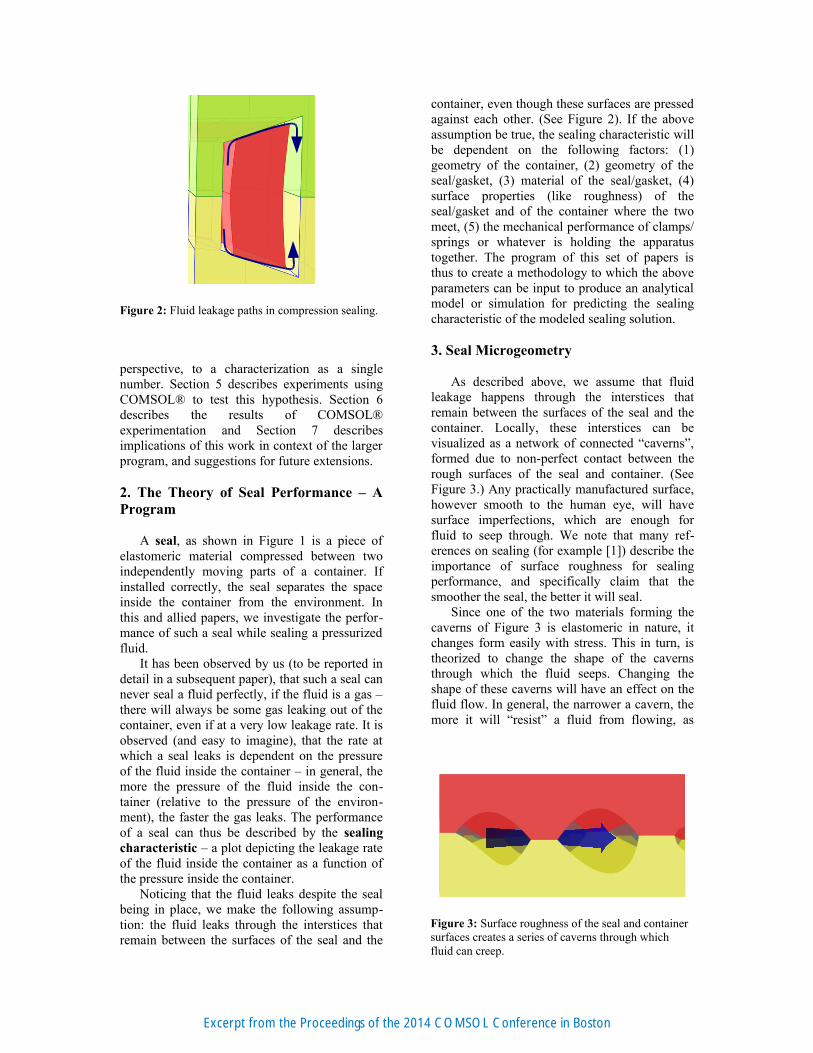
Noticing that the fluid leaks despite the seal being in place, we make the following assump-tion: the fluid leaks through the interstices that remain between the surfaces of the seal and the
container, even though these surfaces are pressed against each other. (See Figure 2). If the above assumption be true, the sealing characteristic will be dependent on the following factors: (1) geometry of the container, (2) geometry of the seal/gasket, (3) material of the seal/gasket, (4) surface properties (like roughness) of the seal/gasket and of the container where the two meet, (5) the mechanical performance of clamps/ springs or whatever is holding the apparatus together. The program of this set of papers is thus to create a methodology to which the above parameters can be input to produce an analytical model or simulation for predicting the sealing characteristic of the modeled sealing solution.
3. Seal Microgeometry
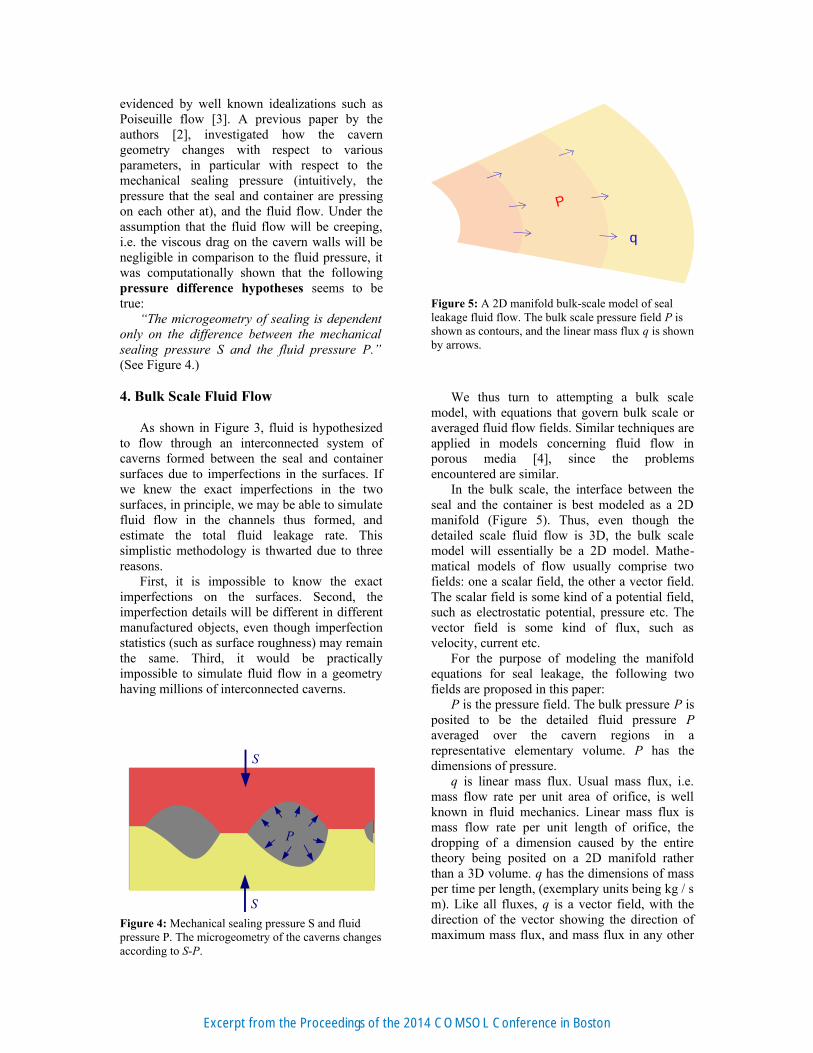
As described above, we assume that fluid leakage happens through the interstices that remain between the surfaces of the seal and the container. Locally, these interstices can be visualized as a network of connected “caverns”, formed due to non-perfect contact between the rough surfaces of the seal and container. (See Figure 3.) Any practically manufactured surface, however smooth to the human eye, will have surface imperfections, which are enough for fluid to seep through. We note that many ref-erences on sealing (for example [1]) describe the importance of surface roughness for sealing performance, and specifically claim that the smoother the seal, the better it will seal.
Since one of the two materials forming the caverns of Figure 3 is elastomeric in nature, it changes form easily with stress. This in turn, is theorized to change the shape of the caverns through which the fluid seeps. Changing the shape of these caverns will have an effect on the fluid flow. In general, the narrower a cavern, the more it will “resist” a fluid from flowing, as
Figure 2: Fluid leakage paths in compression sealing.
Figure 3: Surface roughness of the seal and container surfaces creates a series of caverns through which fluid can creep.
Excerpt from the Proceedings of the 2014 COMSOL Conference in Boston
evidenced by well known idealizations such as Poiseuille flow [3]. A previous paper by the authors [2], investigated how the cavern geometry changes with respect to various parameters, in particular with respect to the mechanical sealing pressure (intuitively, the pressure that the seal and container are pressing on each other at), and the fluid flow. Under the assumption that the fluid flow will be creeping, i.e. the viscous drag on the cavern walls will be negligible in comparison to the fluid pressure, it was computationally shown that the following pressure difference hypotheses seems to be true:
“The microgeometry of sealing is dependent only on the difference between the mechanical sealing pressure S and the fluid pressure P.” (See Figure 4.)
4. Bulk Scale Fluid Flow
As shown in Figure 3, fluid is hypothesized to flow through an interconnected system of caverns formed between the seal and container surfaces due to imperfections in the surfaces. If we knew the exact imperfections in the two surfaces, in principle, we may be able to simulate fluid flow in the channels thus formed, and estimate the total fluid leakage rate. This simplistic methodology is thwarted due to three reasons.
First, it is impossible to know the exact imperfections on the surfaces. Second, the imperfection details will be different in different manufactured objects, even though imperfection statistics (such as surface roughness) may remain the same. Third, it would be practically impossible to simulate fluid flow in a geometry having millions of interconnected caverns.
We thus turn to attempting a bulk scale model, with equations that govern bulk scale or averaged fluid flow fields. Similar techniques are applied in models concerning fluid flow in porous media [4], since the problems encountered are similar.
In the bulk scale, the interface between the seal and the container is best modeled as a 2D manifold (Figure 5). Thus, even though the detailed scale fluid flow is 3D, the bulk scale model will essentially be a 2D model. Mathe-matical models of flow usually comprise two fields: one a scalar field, the other a vector field. The scalar field is some kind of a potential field, such as electrostatic potential, pressure etc. The vector field is some kind of flux, such as velocity, current etc.
For the purpose of modeling the manifold equations for seal leakage, the following two fields are proposed in this paper:
P is the pressure field. The bulk pressure P is posited to be the detailed fluid pressure P averaged over the cavern regions in a representative elementary volume. P has the dimensions of pressure.
q is linear mass flux. Usual mass flux, i.e. mass flow rate per unit area of orifice, is well known in fluid mechanics. Linear mass flux is mass flow rate per unit length of orifice, the dropping of a dimension caused by the entire theory being posited on a 2D manifold rather than a 3D volume. q has the dimensions of mass per time per length, (exemplary units being kg / s m). Like all fluxes, q is a vector field, with the direction of the vector showing the direction of maximum mass flux, and mass flux in any other
Figure 5: A 2D manifold bulk-scale model of seal leakage fluid flow. The bulk scale pressure field P is shown as contours, and the linear mass flux q is shown by arrows.
Figure 4: Mechanical sealing pressure S and fluid pressure P. The microgeometry of the caverns changes according to S-P.
S
S
P
P
q
Excerpt from the Proceedings of the 2014 COMSOL Conference in Boston
direction computed by projecting the mass flux vector q on the direction in question.
Assuming that the microgeometry of the sealing surface caverns, whatever it may be, is isotropic in the bulk, we build the expectation that the directions of q and the gradient of P will match. Furthermore, as in all flux based physics, we expect the flux to increase as the gradient of pressure increases. Thus, a relation between q and P may be expressed as follows:
q = a ∇P (1)
a does not have to be a constant, but will depend in some as yet unspecified way on the local situation. The local situation consists of the local microgeometry (which, as explained in Section 3, has been shown to depend on P–S), the pressure, and the gradient of pressure. Thus:
a = a (S – P, P, |∇P|) (2)
For a given fluid, and sealing surface pair, we may create a large table of values for the equation (2) by conducting lots of experiments. This table will then create a complete equation of fluid leakage (1). The question we tackle in this paper is, can the function in (2) be simplified to an extent that a very few experiments will have to performed to completely characterize a?
5. Microgeometric Fluid Flow
The central question of the present paper is to find a simpler form of equation (2). The equations (1) and (2) themselves were created
from bulk scale considerations. The simplifi-cation of equation (2) can be undertaken from microgeometric fluid flow considerations.
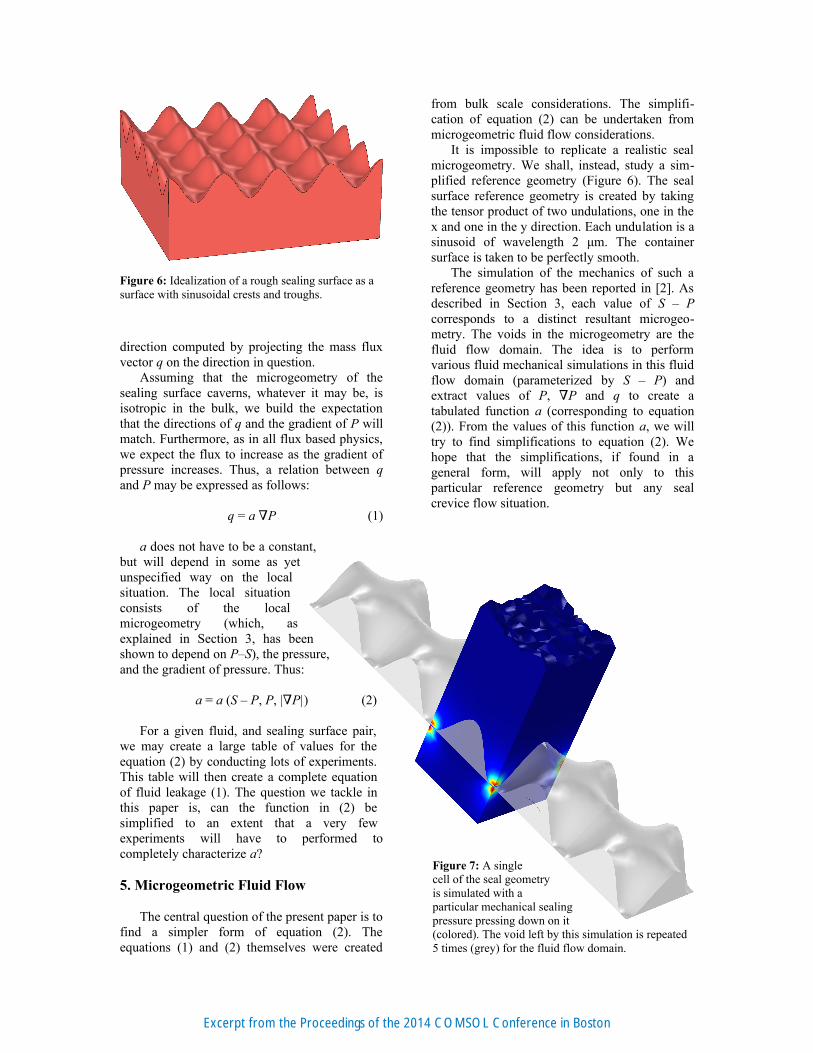
It is impossible to replicate a realistic seal microgeometry. We shall, instead, study a sim-plified reference geometry (Figure 6). The seal surface reference geometry is created by taking the tensor product of two undulations, one in the x and one in the y direction. Each undulation is a sinusoid of wavelength 2 μm. The container surface is taken to be perfectly smooth.
The simulation of the mechanics of such a reference geometry has been reported in [2]. As described in Section 3, each value of S – P corresponds to a distinct resultant microgeo-metry. The voids in the microgeometry are the fluid flow domain. The idea is to perform various fluid mechanical simulations in this fluid flow domain (parameterized by S – P) and extract values of P, ∇P and q to create a tabulated function a (corresponding to equation (2)). From the values of this function a, we will try to find simplifications to equation (2). We hope that the simplifications, if found in a general form, will apply not only to this particular reference geometry but any seal crevice flow situation.
Figure 6: Idealization of a rough sealing surface as a surface with sinusoidal crests and troughs.
Figure 7: A single cell of the seal geometry is simulated with a particular mechanical sealing pressure pressing down on it (colored). The void left by this simulation is repeated 5 times (grey) for the fluid flow domain.
Excerpt from the Proceedings of the 2014 COMSOL Conference in Boston
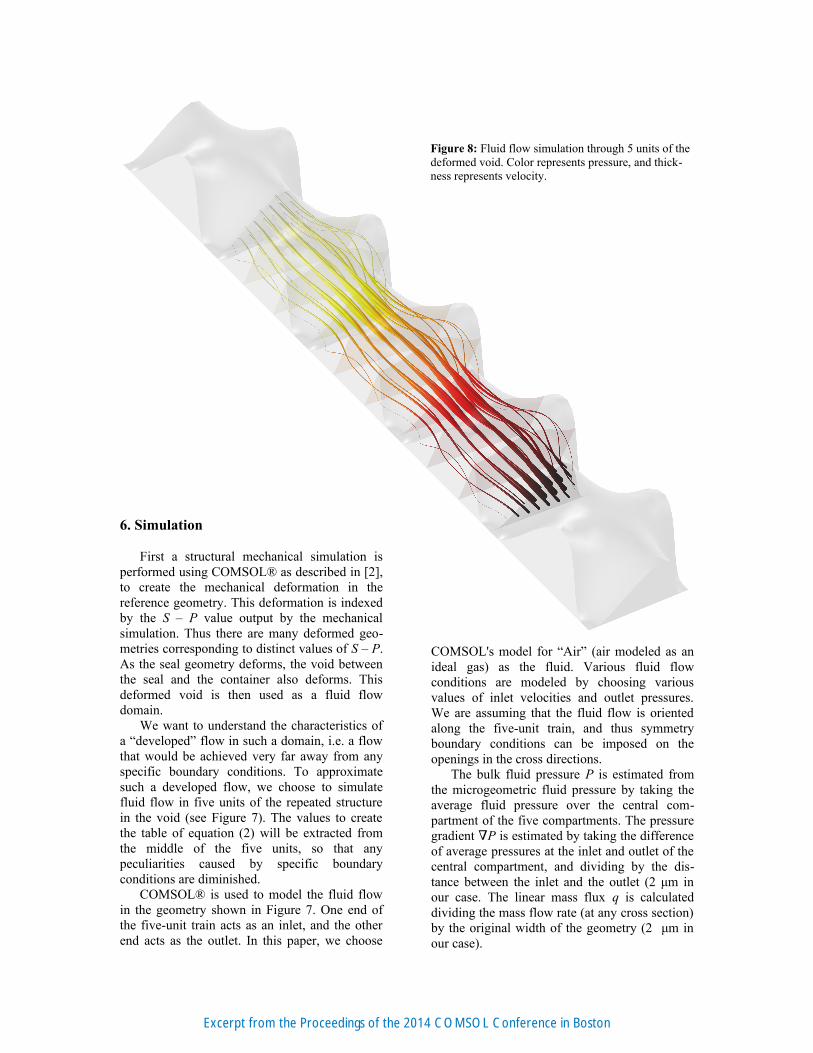
6. Simulation
First a structural mechanical simulation is performed using COMSOL® as described in [2], to create the mechanical deformation in the reference geometry. This deformation is indexed by the S – P value output by the mechanical simulation. Thus there are many deformed geo-metries corresponding to distinct values of S – P. As the seal geometry deforms, the void between the seal and the container also deforms. This deformed void is then used as a fluid flow domain.
We want to understand the characteristics of a “developed” flow in such a domain, i.e. a flow that would be achieved very far away from any specific boundary conditions. To approximate such a developed flow, we choose to simulate fluid flow in five units of the repeated structure in the void (see Figure 7). The values to create the table of equation (2) will be extracted from the middle of the five units, so that any peculiarities caused by specific boundary conditions are diminished.
COMSOL® is used to model the fluid flow in the geometry shown in Figure 7. One end of the five-unit train acts as an inlet, and the other end acts as the outlet. In this paper, we choose
COMSOL's model for “Air” (air modeled as an ideal gas) as the fluid. Various fluid flow conditions are modeled by choosing various values of inlet velocities and outlet pressures. We are assuming that the fluid flow is oriented along the five-unit train, and thus symmetry boundary conditions can be imposed on the openings in the cross directions.
The bulk fluid pressure P is estimated from the microgeometric fluid pressure by taking the average fluid pressure over the central com-partment of the five compartments. The pressure gradient ∇P is estimated by taking the difference of average pressures at the inlet and outlet of the central compartment, and dividing by the dis-tance between the inlet and the outlet (2 μm in our case. The linear mass flux q is calculated dividing the mass flow rate (at any cross section) by the original width of the geometry (2 μm in our case).
Figure 8: Fluid flow simulation through 5 units of the deformed void. Color represents pressure, and thick-ness represents velocity.
Excerpt from the Proceedings of the 2014 COMSOL Conference in Boston
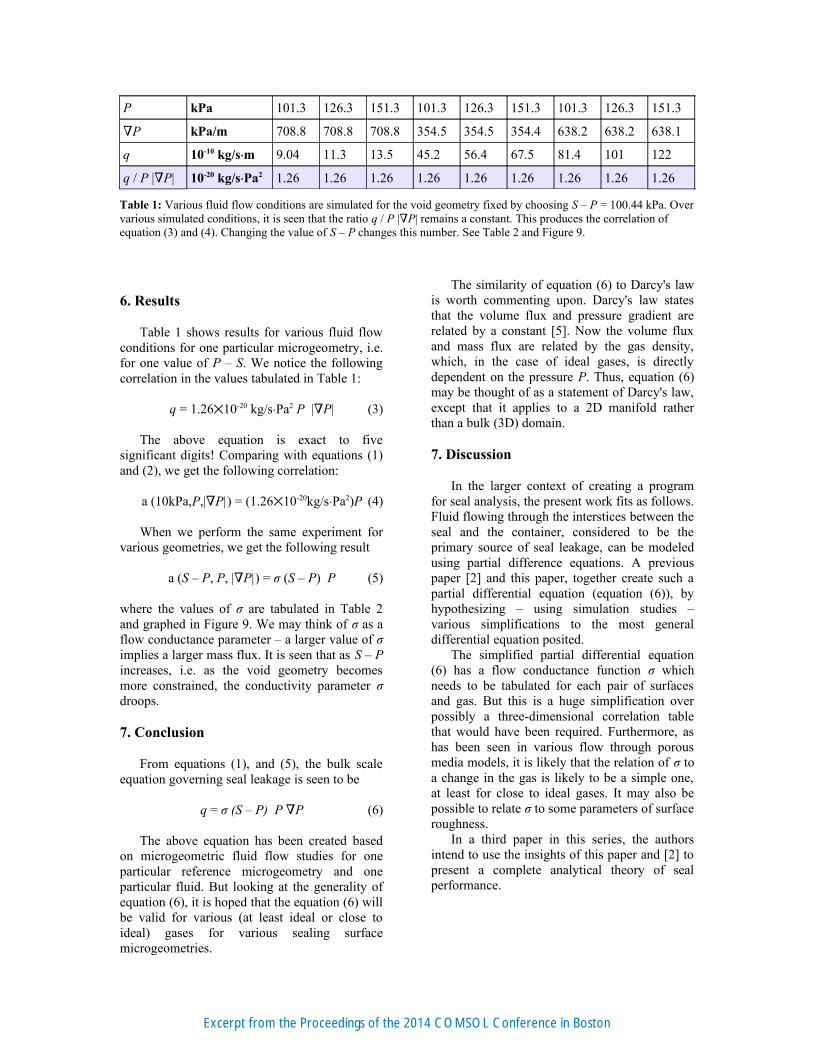
6. Results
Table 1 shows results for various fluid flow conditions for one particular microgeometry, i.e. for one value of P – S. We notice the following correlation in the values tabulated in Table 1:
q = 1.26 10⨉ -20 kg/s Pa‧ 2 P |∇P| (3)
The above equation is exact to five significant digits! Comparing with equations (1) and (2), we get the following correlation:
a (10kPa,P,|∇P|) = (1.26 10⨉ -20kg/s Pa‧ 2)P (4)
When we perform the same experiment for various geometries, we get the following result
a (S – P, P, |∇P|) = σ (S – P) P (5)
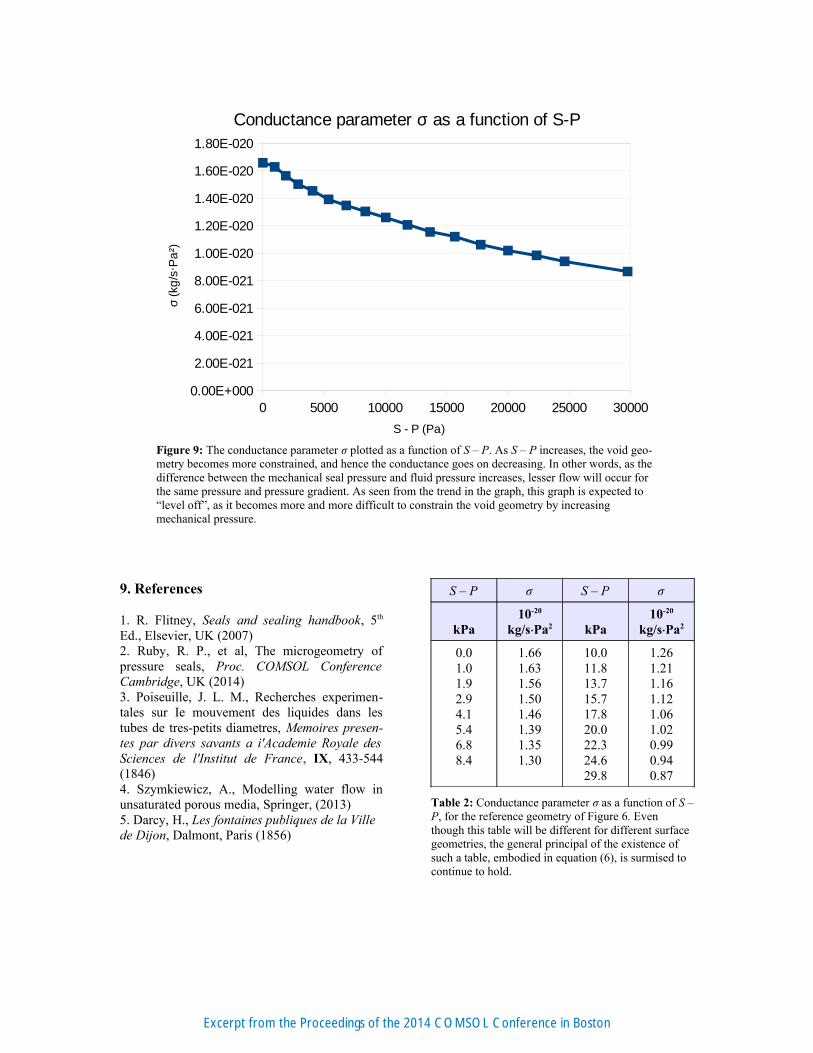
where the values of σ are tabulated in Table 2 and graphed in Figure 9. We may think of σ as a flow conductance parameter – a larger value of σ implies a larger mass flux. It is seen that as S – P increases, i.e. as the void geometry becomes more constrained, the conductivity parameter σ droops.
7. Conclusion
From equations (1), and (5), the bulk scale equation governing seal leakage is seen to be
q = σ (S – P) P ∇P (6)
The above equation has been created based on microgeometric fluid flow studies for one particular reference microgeometry and one particular fluid. But looking at the generality of equation (6), it is hoped that the equation (6) will be valid for various (at least ideal or close to ideal) gases for various sealing surface microgeometries.
The similarity of equation (6) to Darcy's law is worth commenting upon. Darcy's law states that the volume flux and pressure gradient are related by a constant [5]. Now the volume flux and mass flux are related by the gas density, which, in the case of ideal gases, is directly dependent on the pressure P. Thus, equation (6) may be thought of as a statement of Darcy's law, except that it applies to a 2D manifold rather than a bulk (3D) domain.
7. Discussion
In the larger context of creating a program for seal analysis, the present work fits as follows. Fluid flowing through the interstices between the seal and the container, considered to be the primary source of seal leakage, can be modeled using partial difference equations. A previous paper [2] and this paper, together create such a partial differential equation (equation (6)), by hypothesizing – using simulation studies – various simplifications to the most general differential equation posited.
The simplified partial differential equation (6) has a flow conductance function σ which needs to be tabulated for each pair of surfaces and gas. But this is a huge simplification over possibly a three-dimensional correlation table that would have been required. Furthermore, as has been seen in various flow through porous media models, it is likely that the relation of σ to a change in the gas is likely to be a simple one, at least for close to ideal gases. It may also be possible to relate σ to some parameters of surface roughness.
In a third paper in this series, the authors intend to use the insights of this paper and [2] to present a complete analytical theory of seal performance.
P kPa 101.3 126.3 151.3 101.3 126.3 151.3 101.3 126.3 151.3
∇P kPa/m 708.8 708.8 708.8 354.5 354.5 354.4 638.2 638.2 638.1
q 10-10 kg/s m‧ 9.04 11.3 13.5 45.2 56.4 67.5 81.4 101 122
q / P |∇P| 10-20 kg/s Pa‧ 2 1.26 1.26 1.26 1.26 1.26 1.26 1.26 1.26 1.26
Table 1: Various fluid flow conditions are simulated for the void geometry fixed by choosing S – P = 100.44 kPa. Over various simulated conditions, it is seen that the ratio q / P |∇P| remains a constant. This produces the correlation of equation (3) and (4). Changing the value of S – P changes this number. See Table 2 and Figure 9.
Excerpt from the Proceedings of the 2014 COMSOL Conference in Boston
9. References
1. R. Flitney, Seals and sealing handbook, 5th
Ed., Elsevier, UK (2007)2. Ruby, R. P., et al, The microgeometry of pressure seals, Proc. COMSOL Conference Cambridge, UK (2014)3. Poiseuille, J. L. M., Recherches experimen-tales sur Ie mouvement des liquides dans les tubes de tres-petits diametres, Memoires presen-tes par divers savants a i'Academie Royale des Sciences de l'Institut de France, IX, 433-544 (1846)4. Szymkiewicz, A., Modelling water flow in unsaturated porous media, Springer, (2013)5. Darcy, H., Les fontaines publiques de la Ville de Dijon, Dalmont, Paris (1856)
S – P σ S – P σ
kPa10-20
kg/s Pa‧ 2 kPa10-20
kg/s Pa‧ 2
0.01.01.92.94.15.46.88.4
1.661.631.561.501.461.391.351.30
10.011.813.715.717.820.022.324.629.8
1.261.211.161.121.061.020.990.940.87
Table 2: Conductance parameter σ as a function of S – P, for the reference geometry of Figure 6. Even though this table will be different for different surface geometries, the general principal of the existence of such a table, embodied in equation (6), is surmised to continue to hold.
Figure 9: The conductance parameter σ plotted as a function of S – P. As S – P increases, the void geo-metry becomes more constrained, and hence the conductance goes on decreasing. In other words, as the difference between the mechanical seal pressure and fluid pressure increases, lesser flow will occur for the same pressure and pressure gradient. As seen from the trend in the graph, this graph is expected to “level off”, as it becomes more and more difficult to constrain the void geometry by increasing mechanical pressure.
0 5000 10000 15000 20000 25000 300000.00E+000
2.00E-021
4.00E-021
6.00E-021
8.00E-021
1.00E-020
1.20E-020
1.40E-020
1.60E-020
1.80E-020
Conductance parameter σ as a function of S-P
S - P (Pa)
σ (
kg/s
Pa
²)‧
Excerpt from the Proceedings of the 2014 COMSOL Conference in Boston