FLSmidth Annual Report 2014 presentation
58
12 February 2015 Annual Report 2014 1 Annual Report 2014 presentation We manage the cycle and prepare for the upturn
-
Upload
flsmidth-co-as -
Category
Investor Relations
-
view
67 -
download
3
Transcript of FLSmidth Annual Report 2014 presentation

12 February 2015 Annual Report 2014 1
Annual Report 2014 presentation
We manage the cycle and prepare for the upturn

Short Term
Navigate through cyclical downturn
Mid Term
Sustainable profitable growth
Long Term
Full service provider
Strategic management focus
Focus on efficiency: Efficiency programme Business right-sizing Re-organisation
2
Strategy health check
FLSmidth
Customer Services
Minerals Cement Product
Companies
ROCE >20%
12 February 2015 12 February 2015 Annual Report 2014
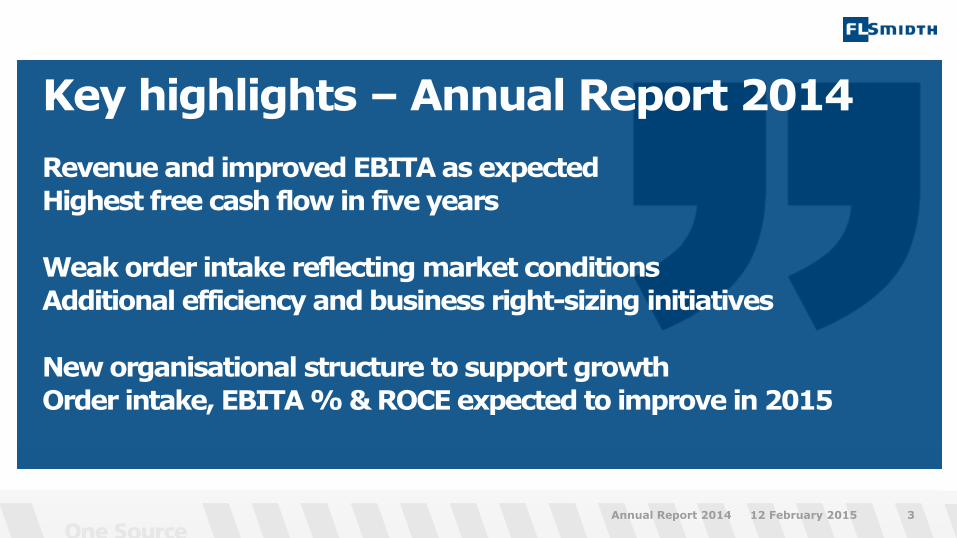
Key highlights – Annual Report 2014
Revenue and improved EBITA as expected
Highest free cash flow in five years
Weak order intake reflecting market conditions
Additional efficiency and business right-sizing initiatives
New organisational structure to support growth
Order intake, EBITA % & ROCE expected to improve in 2015
12 February 2015 Annual Report 2014 3

Safety ambition: No injuries
2015 LTIFR target: <3 achieved in 2014
New 2015 LTIFR target: < 2.6
Strong safety performance in 2014 Lost Time Injury Frequency Rate (LTIFR) 2.7 in 2014
4
Safety
12 February 2015 Annual Report 2014
4.2 4.7
3.9
2.7
0.0
0.5
1.0
1.5
2.0
2.5
3.0
3.5
4.0
4.5
5.0
2011 2012 2013 2014
LTIFR (annually)
-31% vs. 2013
Number of lost time injuries per million working hours

Mining capex
Expected to trough in 2015 Slow growth expected in 2016 Impacted by market uncertainty and declining commodity prices Customer focus on productivity enhancing investments
Cement capex
Moving out of the trough Increasing utilisation rates to underpin growth Customer focus on new capacity, productivity and environment
Customer Services resilient and growing
Customer focus on optimised inventories and productivity Fewer bigger, but more smaller orders
Market trends unchanged from Q3’14
Market update
12 February 2015 Annual Report 2014 5

38%
17% 4% 9%
5%
27%
Order intake declined in Q4’14 - reflecting cyclical downturn and market uncertainty
Annual Report 2014
12 February 2015 Annual Report 2014 6
2014 order intake by industry
Cement
Coal
Iron ore
Other
Copper Gold 0
2,000
4,000
6,000
8,000
10,000
Q42012
Q12013
Q22013
Q32013
Q42013
Q12014
Q22014
Q32014
Q42014
Order intake (quarterly)
-33% vs. Q4 2013 DKKm
Announced O&M orders Announced capital orders Unannounced orders
Lower order intake from projects and services (primarily O&M), but record high services revenue
Order intake decreased 13% in 2014 (currency adjusted)
Order intake expected to grow in 2015

Significant investments in people development
More than 600 managers and specialists participating in leadership development programmes in 2014
New divisional structure implemented
Cembrit sold for DKK 1.1bn on 12 January 2015
Expected positive impact on profit from discontinued
activities in Q1’15 DKK ~100m
Efficiency programme 2014-targets achieved
Additional efficiency and business right-sizing activities initiated
Operational highlights in Q4 2014
Operation highlights
12 February 2015 Annual Report 2014 7
FLSmidth
Customer Services Minerals Cement Product
Companies
New divisional structure 1 January 2015

Old efficiency programme targets achieved
Efficiency Programme
12 February 2015 Annual Report 2014 8
Efficiency programme Impact
Expected full-year EBITA improvement in 2015 DKK +750m p.a.
Estimated EBITA improvement in 2014 DKK~ +505m
Estimated EBITA improvement in Q4’14 DKK~ +150m
Estimated incremental EBITA improvement in 2015 DKK~ +245m
Total costs (booked in 2013-2014) DKK -500m
One-off costs booked in 2014 DKK -72m

Additional efficiency and business right-sizing initiatives - included in guidance for 2015
Additional efficiency initiatives
12 February 2015 Annual Report 2014 9
2015 additional initiatives Impact
Estimated EBITA improvement in 2015 DKK ~ +200m of which DKK 150m are related to Minerals
One-off costs in 2015 DKK ~ -100m of which DKK -90m are related to Minerals
Headcount reductions in H1’15 ~300 of which 250 are related to Minerals
Estimated full-year EBITA improvement in 2016 DKK ~ +300m of which DKK +250m are related to Minerals
Sustainable technology highlights
Technology highlights
12 February 2015 Annual Report 2014 10
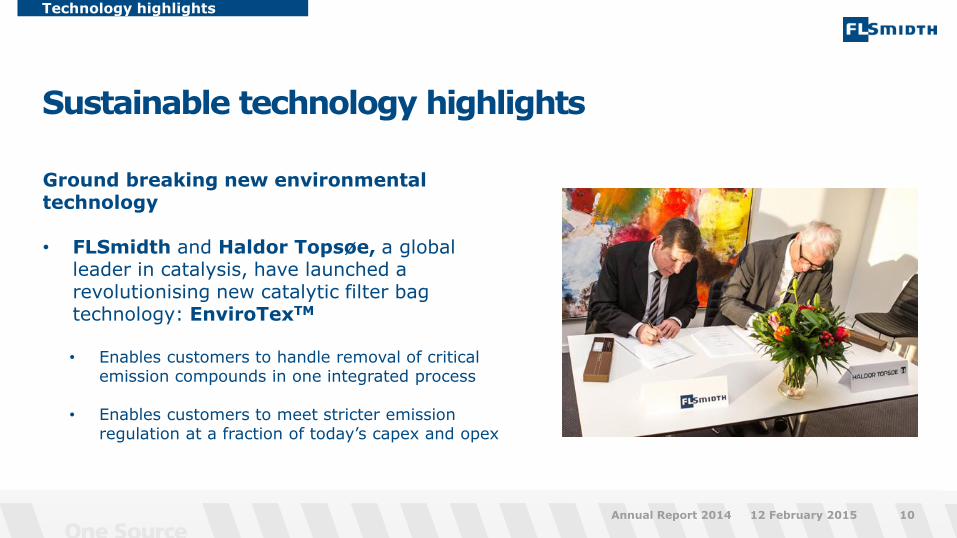
Ground breaking new environmental technology • FLSmidth and Haldor Topsøe, a global
leader in catalysis, have launched a revolutionising new catalytic filter bag technology: EnviroTexTM • Enables customers to handle removal of critical
emission compounds in one integrated process
• Enables customers to meet stricter emission regulation at a fraction of today’s capex and opex

Revenue declined as expected
Delayed start-up on one O&M contract
Negative impact on order intake, revenue and EBITA in Q4
Non-recurring impact on profit in Q4’14 DKK -90m
Other one-off costs DKK -66m
Strong cash flow from operations
Financial performance in Q4 2014
Results Q4 2014
12 February 2015 11 Annual Report 2014
Continuing business*) (DKKm)
Q4 2014
Q4 2013
Change
Order intake 3,775 5,616 -33%
Revenue 5,911 7,046 -16%
Gross % 21.7% 18.3%
EBITA 400 250 60%
EBITA % 6.8% 3.5%
EBITA % underlying 9.4% 8.9%
Net results 255 -143
CFFO 739 77 +860%
*) Cembrit re-classified as discontinued activities

2,000
1,472
2,376
1,496
2,234
1,332 1,445 1,147
Revenue decline expected due to finalisation of orders
Annual Report 2014
12 February 2015 Annual Report 2014 12
0
1,000
2,000
3,000
4,000
5,000
6,000
7,000
8,000
9,000
Q42012
Q12013
Q22013
Q32013
Q42013
Q12014
Q22014
Q32014
Q42014
Revenue (quarterly)
-16% vs. Q4 2013 DKKm
Revenue Q4’14 vs. Q4’13 - by division
Material Handling
Mineral Processing
Cement
Q4’14 Q4’13 Q4’14 Q4’13 Q4’14 Q4’13 Q4’14 Q4’13
Customer Services
Pattern of increasing revenue over the year re-established

24.0%
14.7%
21.6%
6.8%
22.7% 16.7% 20.3%
22.7%
Gross margin increased vs. Q4’13
Annual Report 2014
12 February 2015 Annual Report 2014 13
Gross margin
23.8%
0%
10%
20%
30%
40%
0
500
1,000
1,500
2,000
Q42012
Q12013
Q22013
Q32013
Q42013
Q12014
Q22014
Q32014
Q42014
Gross profit (quarterly)
DKKm
Decline in gross margin attributable to delayed O&M start-up
Gross margin Q4’14 vs. Q4’13 - by division
Customer Services
Material Handling
Mineral Processing
Cement
Q4’14 Q4’13 Q4’14 Q4’13 Q4’14 Q4’13 Q4’14 Q4’13
Q4 2014 underlying

SG&A costs stable at lower level than in 2013
Annual Report 2014
12 February 2015 Annual Report 2014 14
SG&A ratio*
11.4%
14.1% 13.5%
0%
3%
6%
9%
12%
15%
18%
0
200
400
600
800
1,000
1,200
Q42012
Q12013
Q22013
Q32013
Q42013
Q12014
Q22014
Q32014
Q42014
SG&A costs (quarterly)
DKKm
*) SG&A ratio: SG&A costs (Sales, General and Administration) divided by revenue
SG&A ratio declined 1.1%-point sequentially
Adjusted for one-off costs, the SG&A ratio was 13.2% (Q4’13: 12.1%)
Higher share of service business leads to higher SG&A ratio
250 400
315
106
69 250
90
0
100
200
300
400
500
600
700
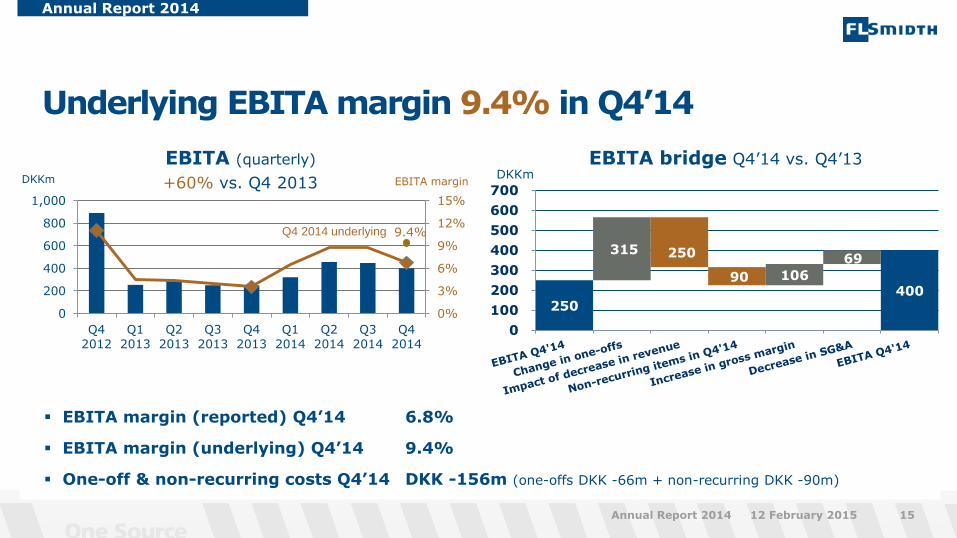
Underlying EBITA margin 9.4% in Q4’14
Annual Report 2014
12 February 2015 Annual Report 2014 15
EBITA margin
EBITA (quarterly)
+60% vs. Q4 2013 DKKm DKKm EBITA bridge Q4’14 vs. Q4’13
9.4%
0%
3%
6%
9%
12%
15%
0
200
400
600
800
1,000
Q42012
Q12013
Q22013
Q32013
Q42013
Q12014
Q22014
Q32014
Q42014
Q4 2014 underlying
EBITA margin (reported) Q4’14 6.8%
EBITA margin (underlying) Q4’14 9.4%
One-off & non-recurring costs Q4’14 DKK -156m (one-offs DKK -66m + non-recurring DKK -90m)

Net working capital developments YoY
Working capital back to end 2013 level
Annual Report 2014
12 February 2015 Annual Report 2014 16
Net working capital (excl. Cembrit) DKKm
0
500
1,000
1,500
2,000
2,500
3,000
Q4
2012
Q1
2013
Q2
2013
Q3
2013
Q4
2013
Q1
2014
Q2
2014
Q3
2014
Q4
2014
DKKm
(excl. Cembrit)
End Q4 2014 End 2013 Change Change in local currencies
Inventories 2,628 2,296 +332 +127
Trade Receivables
5,026 4,892 +134 +188
Trade Payables
-2,736 -3,170 +434 +592
WIP Assets net 66 1,353 -1,287 -1,289
Prepayments net -1,553 -2,545 +992 +1,036
NWC total 2,164 2,137 +27 -253
NWC 10.2% of revenue at the end of 2014 (target over the cycle: <10%)
-1,500
-1,000
-500
0
500
1,000
1,500
Net work-in-progress
0
500
1,000
1,500
2,000
2,500
3,000
3,500
Inventories
0
500
1,000
1,500
2,000
2,500
3,000
3,500
Trade Payables
0
1,000
2,000
3,000
4,000
5,000
6,000
7,000
Trade Receivables
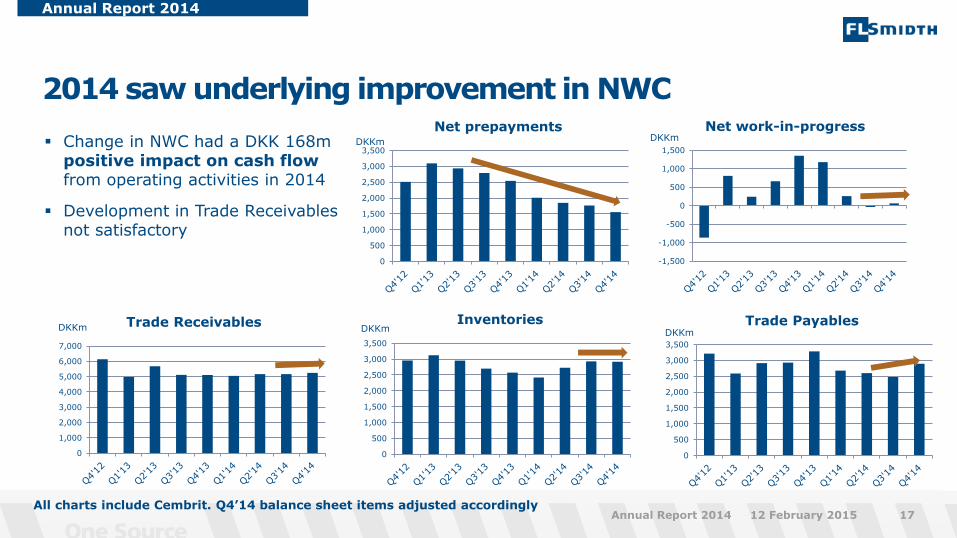
2014 saw underlying improvement in NWC
Annual Report 2014
12 February 2015 Annual Report 2014 17
Change in NWC had a DKK 168m positive impact on cash flow from operating activities in 2014
Development in Trade Receivables not satisfactory
DKKm DKKm DKKm
DKKm
All charts include Cembrit. Q4’14 balance sheet items adjusted accordingly
0
500
1,000
1,500
2,000
2,500
3,000
3,500
Net prepayments DKKm

Financial performance in 2014
Annual Report 2014
12 February 2015 18 Annual Report 2014
Continuing activities (DKKm) 2014 2013 Change
Revenue 21,129 25,482 -17%
Gross margin 23.9% 19.0%
EBITA 1,627 1,042 +56%
EBITA margin 7.7% 4.1%
EBITA margin underlying 8.6% 8.7%
Financial costs net -118 -256 -46%
Tax -333 -202 +65%
Profit, discontinued activities 44 -56
Profit for the year, Group 813 -784
ROCE 11% 7%
Employees 13,723 14,248 -4%
Revenue decreased as expected 15% in local currencies due to finalisation of orders
Underlying EBITA margin 8.6% (2013: 8.7%) excl. one-off costs of DKK 196m
Tax rate 30.2% (2013: 35% estimated)
Headcount decreased 10% excluding O&M

Cash flow statement in 2014
Annual Report 2014
12 February 2015 19 Annual Report 2014
Continuing activities 2014 2013
EBITDA adjusted 2,058 1,338
Change in provisions (431) 203
Change in NWC 168 (893)
Financial payments (86) (123)
Taxes paid (411) (682)
CFFO 1,298 -157
CFFI excl. acquisitions & disposals -414 -594
Acquisitions & disposals -184 27
CFFI -598 -567
Free cash flow 700 -724
Significant improvement in free cash flow attributable to:
Higher EBITDA
Positive impact from NWC and financial payments
Lower cash tax rate
Reduced operational investments
…despite:
Cash outflow from provisions
Deferred payments on acquisitions

Free cash flow highest in five years
Annual Report 2014
12 February 2015 Annual Report 2014 20
CFFO (annual) DKKm
Free cash flow(annual) DKKm
654 415
830
-751
884
-2000
-1500
-1000
-500
0
500
1000
1500
2010 2011 2012 2013 2014
FCF FCF excl. acquisitions and disposals
1335 1148
1720
-157
1298
-500
0
500
1000
1500
2000
2010 2011 2012 2013 2014

Capital structure - equity ratio and gearing normalised during 2014
Annual Report 2014
12 February 2015 Annual Report 2014 21
NIBD (quarterly) DKKm
-
1.0
2.0
3.0
4.0
5.0
6.0
0
1,000
2,000
3,000
4,000
5,000
6,000
Q42012
Q12013
Q22013
Q32013
Q42013
Q12014
Q22014
Q32014
Q42014
Gearing 2.3x EBITDA Gearing target (self-imposed)
0%
10%
20%
30%
40%
50%
0
2,000
4,000
6,000
8,000
10,000
Q4
2012
Q1
2013
Q2
2013
Q3
2013
Q4
2013
Q1
2014
Q2
2014
Q3
2014
Q4
2014
Equity (quarterly)
DKKm Equity ratio Equity ratio 29%
Equity ratio target (self-imposed)
Gearing expected to meet target (NIBD/EBITDA < 2 times) in early 2015
NIBD / EBITDA

ROCE increased as a result of higher EBITA
(last 12 months)
Guidance for 2015: ROCE 12-14%
Reaching the 20% ROCE target requires an increase in EBITA to around DKK 3bn through a combination of top-line growth and margin expansion
Return on capital employed increased to 11%
Annual Report 2014
12 February 2015 Annual Report 2014 22
ROCE* (quarterly) Average capital employed
DKKm
0%
5%
10%
15%
20%
25%
30%
0
3,000
6,000
9,000
12,000
15,000
18,000
Q42012
Q12013
Q22013
Q32013
Q42013
Q12014
Q22014
Q32014
Q42014
ROCE
11% in Q4 2014
*) ROCE: Return on capital employed calculated on a before tax basis, including goodwill and based on last 12 months’ EBITA and average capital employed
ROCE target
0%
1%
2%
3%
4%
5%
6%
0
2
4
6
8
10
12
2010 2011 2012 2013 2014
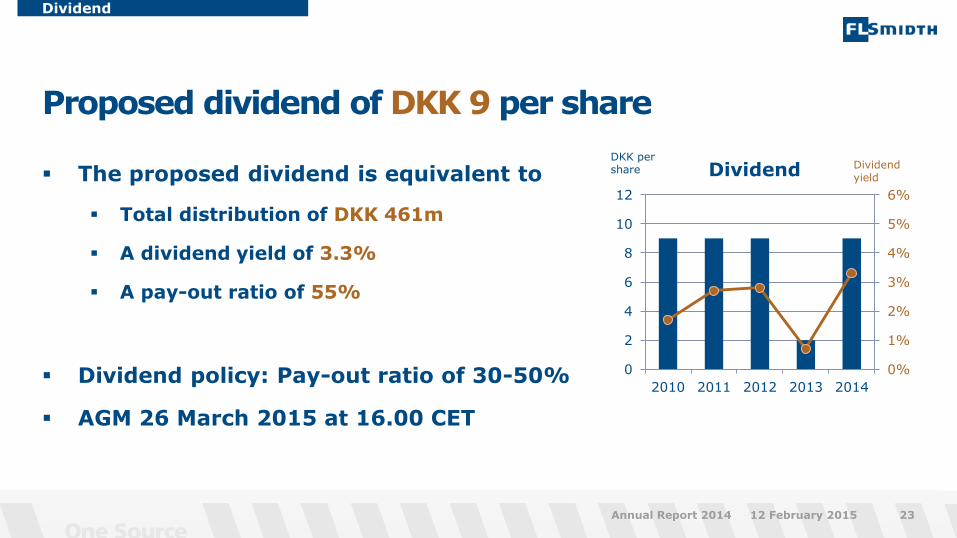
Proposed dividend of DKK 9 per share
Dividend
12 February 2015 Annual Report 2014 23
The proposed dividend is equivalent to
Total distribution of DKK 461m
A dividend yield of 3.3%
A pay-out ratio of 55%
Dividend policy: Pay-out ratio of 30-50%
AGM 26 March 2015 at 16.00 CET
Dividend DKK per share Dividend
yield

Long-term financial targets unchanged
Long-term financial targets
12 February 2015 Annual Report 2014 24
Group long-term financial targets
Annual revenue growth Above market average
EBITA margin 10-13%
ROCE* > 20%
Tax rate 32-34%
Equity ratio >30%
Financial gearing (NIBD/EBITDA) <2
Pay-out ratio 30-50%
*) ROCE: Return on capital employed calculated on a before tax basis as EBITA divided by average Capital Employed including goodwill

Fit for cycle navigation in new divisional structure - attractive growth potential in healthy, but cyclical industries
Long-term financial targets
12 February 2015 Annual Report 2014 25
Divisional long-term financial targets
Growth (over the cycle)
EBITA% (over the cycle)
Net working capital (as pct. of revenue)
Customer Services 5-10% >15% 15-20%
Product Companies 5-10% 12-15% ~15%
Minerals 5-6% 3-8% Negative
Cement 3-5% 3-8% Negative

Guidance
12 February 2015 Annual Report 2014 26
Group Guidance 2015 2014 Guidance 2014
Revenue1) DKK 19-21bn DKK 21.1bn DKK 19.5-22.52)
EBITA margin 9-10% 7.7% 7-9%
ROCE 12-14% 11% 11-13%
Tax rate 31-33% 30.2% 33-35%
CFFI (excl. acquisitions) ~DKK -0.4bn DKK -0.4bn DKK -0.4bn
Group guidance 2015
1) At prevailing currency exchange rates 2) Technically adjusted to reflect sale of Cembrit (previous guidance DKK 21-24bn)

Key highlights – Annual Report 2014
Revenue and improved EBITA as expected
Highest free cash flow in five years
Weak order intake reflecting market conditions
Additional efficiency and business right-sizing initiatives
New organisational structure to support growth
Order intake, EBITA % & ROCE expected to improve in 2015
12 February 2015 Annual Report 2014 27

12 February 2015 Annual Report 2014 28
QUESTIONS
We manage the cycle and prepare for the upturn
Forward-looking statements
Annual Report 2014
12 February 2015 Annual Report 2014 29
FLSmidth & Co. A/S’ financial reports, whether in the form of annual reports or interim reports, filed with the Danish Business Authority and/or announced via the company’s website and/or NASDAQ OMX Copenhagen, as well as any presentations based on such financial reports, and any other written information released, or oral statements made, to the public based on this interim report or in the future on behalf of FLSmidth & Co. A/S, may contain forward-looking statements. Words such as ‘believe’, ‘expect’, ‘may’, ‘will’, ‘plan’, ‘strategy’, ‘prospect’, ‘foresee’, ‘estimate’, ‘project’, ‘anticipate’, ‘can’, ‘intend’, ‘target’ and other words and terms of similar meaning in connection with any discussion of future operating or financial performance identify forward-looking statements. Examples of such forward-looking statements include, but are not limited to: • statements of plans, objectives or goals for future operations, including those related to FLSmidth & Co. A/S markets, products, product research and product
development • statements containing projections of or targets for revenues, profit (or loss), capital expenditures, dividends, capital structure or other net financial items • statements regarding future economic performance, future actions and outcome of contingencies such as legal proceedings and statements regarding the underlying
assumptions or relating to such statements • statements regarding potential merger & acquisition activities. These forward-looking statements are based on current plans, estimates and projections. By their very
nature, forward-looking statements involve inherent risks and uncertainties, both general and specific, which may be outside FLSmidth & Co. A/S’s influence, and which could materially affect such forward-looking statements.
FLSmidth & Co. A/S cautions that a number of important factors, including those described in this presentation, could cause actual results to differ materially from those contemplated in any forward-looking statements. Factors that may affect future results include, but are not limited to, global as well as local political and economic conditions, including interest rate and exchange rate fluctuations, delays or faults in project execution, fluctuations in raw material prices, delays in research and/or development of new products or service concepts, interruptions of supplies and production, unexpected breach or termination of contracts, market-driven price reductions for FLSmidth & Co. A/S’ products and/or services, introduction of competing products, reliance on information technology, FLSmidth & Co. A/S’ ability to successfully market current and new products, exposure to product liability and legal proceedings and investigations, changes in legislation or regulation and interpretation thereof, intellectual property protection, perceived or actual failure to adhere to ethical marketing practices, investments in and divestitures of domestic and foreign enterprises, unexpected growth in costs and expenses, failure to recruit and retain the right employees and failure to maintain a culture of compliance. Unless required by law FLSmidth & Co. A/S is under no duty and undertakes no obligation to update or revise any forward-looking statement after the distribution of this presentation.

Back-up slides Next update: AGM: 26 March 2015 Q1 Interim Report: 8 May 2015 Follow us on Twitter
and LinkedIn
12 February 2015 Annual Report 2014 30

Customer Services
Customer Services
12 February 2015 Annual Report 2014 31
(DKKm) Q4
2014 Q4
2013 Change 2014 2013 Change
Expected 2014
Order intake 1,639 2,032 -19% 7,386 8,005 -8%
Order backlog 7,130 8,046 -11% 7,130 8,046 -11%
Revenue 2,234 2,000 +12% 8,039 7,565 +6% DKK 7.5-8.5bn
EBITDA 272 200 +36% 1,162 768 +51%
EBITA 242 195 +24% 1,058 691 +53%
EBITA margin 10.8% 9.8% 13.2% 9.1% 13-15%
EBIT 195 151 +29% 916 411) +2,134%
EBIT margin 8.7% 7.6% 11.4% 0.5%1)
1) Including Ludowici impairment loss of DKK -539

Decrease in order intake mainly related to operation and maintenance. However, all other activities also saw a minor decline vs. Q4’13
Strong revenue and significant margin improvement
Customer Services
12 February 2015 Annual Report 2014 32
0
500
1,000
1,500
2,000
2,500
3,000
Q42012
Q12013
Q22013
Q32013
Q42013
Q12014
Q22014
Q32014
Q42014
Order intake (quarterly)
-19% vs. Q4 2013 DKKm
Announced O&M orders Announced capital orders Unannounced orders
Revenue (quarterly)
DKKm EBITA margin +12% vs. Q4 2013
0%
4%
8%
12%
16%
20%
0
500
1,000
1,500
2,000
2,500
Q42012
Q12013
Q22013
Q32013
Q42013
Q12014
Q22014
Q32014
Q42014

Material Handling
Material Handling
12 February 2015 Annual Report 2014 33
(DKKm) Q4
2014 Q4
2013 Change 2014 2013 Change
Expected 2014
Order intake 702 1,655 -58% 3,676 4,937 -26%
Order backlog 3,861 4,465 -14% 3,861 4,465 -14%
Revenue 1,332 1,472 -9% 4,379 4,552 -4% DKK 3.5-4.5bn
EBITDA 46 -15 134 -455
EBITA 26 -29 63 -511
EBITA margin 2.0% -2.0% 1.4% -11.2% 0-2%
EBIT 22 -67 0 -598
EBIT margin 1.7% -4.6% 0.0% -13.1%

-50%-40%-30%-20%-10%0%10%20%30%40%50%
-2,500-2,000-1,500-1,000
-5000
5001,0001,5002,0002,500
Q42012
Q12013
Q22013
Q32013
Q42013
Q12014
Q22014
Q32014
Q42014
No large announced orders in Q4’14. Slight increase in unannounced orders
Third consecutive quarter with positive EBITA margin
Stable unannounced orders
Material Handling
12 February 2015 Annual Report 2014 34
0
500
1,000
1,500
2,000
2,500
Q42012
Q12013
Q22013
Q32013
Q42013
Q12014
Q22014
Q32014
Q42014
Order intake (quarterly)
-58% vs. Q4 2013 DKKm
Announced orders Unannounced orders
Revenue (quarterly)
DKKm EBITA margin -9% vs. Q4 2013

No new problematic projects identified
9 projects out of a total portfolio of 175 projects in
the Material Handling Business Unit are currently
regarded as risky (end of Q3 2014: 12 projects)
These projects accounted for DKK 208m or 5%
of the backlog at the end of Q4 (end of Q3 2014: DKK
251m or 6%)
The one-off costs of DKK 323m realised in Q2 2013 still expected to cover completion of the legacy projects
Status on legacy projects in Material Handling
Material Handling
12 February 2015 Annual Report 2014 35

Mineral Processing
Mineral Processing
12 February 2015 Annual Report 2014 36
(DKKm) Q4
2014 Q4
2013 Change 2014 2013 Change
Expected 2014
Order intake 877 1,025 -14% 4,048 5,559 -27%
Order backlog 3,710 4,993 -26% 3,710 4,993 -26%
Revenue 1,445 2,376 -39% 5,396 9,256 -42% DKK 5.5-6.5bn
EBITDA 92 174 -47% 361 850 -58%
EBITA 69 153 -55% 273 757 -64%
EBITA margin 4.8% 6.4% 5.1% 8.2% 6-8%
EBIT -10 88 102 2111) -52%
EBIT margin -0.7% 3.7% 1.9% 2.3%1)
1) Including Ludowici impairment loss of DKK -362

Did not meet divisional guidance for 2014
Unannounced orders down from Q4’13 but stable vs. Q3’14
EBITA margin impacted by declining revenue
Weak order intake and earnings
Mineral Processing
12 February 2015 Annual Report 2014 37
Revenue (quarterly)
DKKm EBITA margin -39% vs. Q4 2013
0%
3%
6%
9%
12%
15%
18%
21%
0
500
1,000
1,500
2,000
2,500
3,000
3,500
Q42012
Q12013
Q22013
Q32013
Q42013
Q12014
Q22014
Q32014
Q42014
0
500
1,000
1,500
2,000
2,500
3,000
Q42012
Q12013
Q22013
Q32013
Q42013
Q12014
Q22014
Q32014
Q42014
Order intake (quarterly)
-14% vs. Q4 2013 DKKm
Announced orders Unannounced orders
Cement
Cement
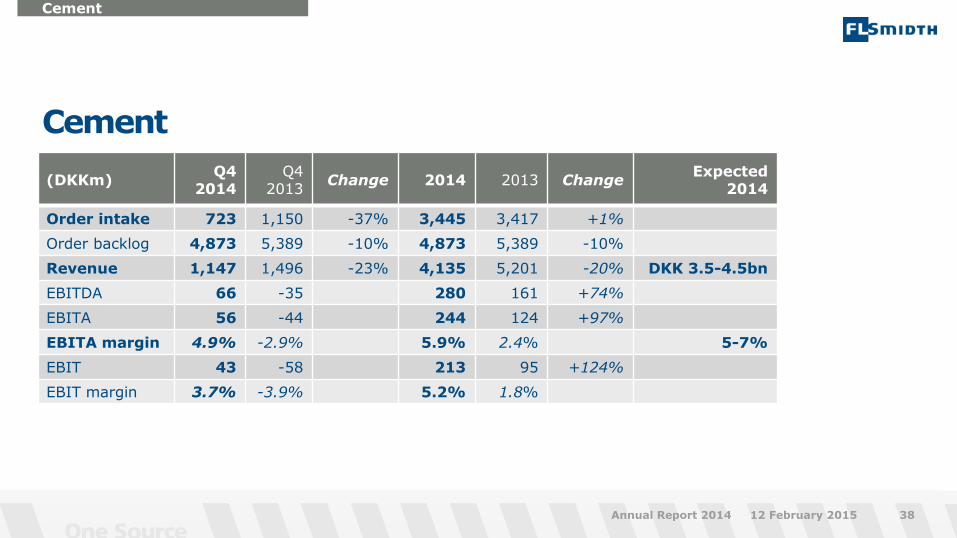
12 February 2015 Annual Report 2014 38
(DKKm) Q4
2014 Q4
2013 Change 2014 2013 Change
Expected 2014
Order intake 723 1,150 -37% 3,445 3,417 +1%
Order backlog 4,873 5,389 -10% 4,873 5,389 -10%
Revenue 1,147 1,496 -23% 4,135 5,201 -20% DKK 3.5-4.5bn
EBITDA 66 -35 280 161 +74%
EBITA 56 -44 244 124 +97%
EBITA margin 4.9% -2.9% 5.9% 2.4% 5-7%
EBIT 43 -58 213 95 +124%
EBIT margin 3.7% -3.9% 5.2% 1.8%

0
500
1,000
1,500
2,000
2,500
Q42012
Q12013
Q22013
Q32013
Q42013
Q12014
Q22014
Q32014
Q42014
Decline in both announced and unannounced order intake
Revenue and EBITA margin as expected
Soft order intake despite two announced orders
Cement
12 February 2015 Annual Report 2014 39
Revenue (quarterly)
DKKm EBITA margin -23% vs. Q4 2013
-5%
0%
5%
10%
15%
20%
25%
-500
-
500
1,000
1,500
2,000
2,500
Q42012
Q12013
Q22013
Q32013
Q42013
Q12014
Q22014
Q32014
Q42014
Order intake (quarterly)
-37% vs. Q4 2013 DKKm
Announced orders Unannounced orders

Minerals EBITA improvement programme initiated
Minerals EBITA improvement
12 February 2015 Annual Report 2014 40
Efficiency programme Impact
Estimated EBITA improvement in 2015 DKK ~ +150m
Estimated full-year EBITA improvement in 2016 DKK ~ +250m
Expected one-off costs in H1’15 DKK ~ -90m
Headcount reductions ~250
The programme aims at reaching minimum 3% EBITA margin in 2016
The programme will mostly be business right-sizing and some efficiency improvements
Headcount reductions expected to take place in the first half of 2015

Annual Report 2014
12 February 2015 Annual Report 2014 41
Industry Country/ Region
Value DKK
Booked by (Division)
Cement USA Not disclosed Cement
Cement Colombia Not disclosed Cement
Announced orders in Q4’14
Order intake Q4 2014
60%
40%
Service business Capital business
Q4 2013: 45%
Order intake growth by segment

Annual Report 2014
12 February 2015 Annual Report 2014 42
Growth Customer Services
Material Handling
Mineral Processing
Cement Group
Growth (currency adj.)
-23% -59% -19% -40% -37%
Currency effect
4% 1% 5% 3% 4%
Total -19% -58% -14% -37% -33%
Order intake growth Q4’14 vs. Q4’13
Order intake growth by segment
Growth Customer Services
Material Handling
Mineral Processing
Cement Group
Growth (currency adj.)
-6% -24% -25% 2% -13%
Currency effect
-2% -2% -2% -1% -2%
Total -8% -26% -27% 1% -15%
Order intake growth 2014 vs. 2013

Order backlog and backlog conversion to revenue
Annual Report 2014
12 February 2015 Annual Report 2014 43
0.90
0.70
0.80
0.90
1.00
1.10
1.20
1.30
1.40
0
5,000
10,000
15,000
20,000
25,000
30,000
35,000
Q42012
Q12013
Q22013
Q32013
Q42013
Q12014
Q22014
Q32014
Q42014
Order backlog (quarterly)
-15% vs. Q4 2013 DKKm Book-to-bill ratio*
*Order backlog divided by last 12 months revenue (excl. Cembrit)
Expected backlog conversion to revenue:
71% in 2015
18% in 2016
11% in 2017 and beyond
O&M contracts accounted for DKK 4.4bn (23%) of the order backlog at the end of Q4

Revenue growth by segment
Annual Report 2014
12 February 2015 Annual Report 2014 44
Growth Customer Services
Material Handling
Mineral Processing
Cement Group
Growth (currency adj.)
9% -10% -41% -25% -18%
Currency effect
3% 1% 2% 2% +2%
Total 12% -9% -39% -23% -16%
Revenue growth Q4’14 vs. Q4’13
Growth Customer Services
Material Handling
Mineral Processing
Cement Group
Growth (currency adj.)
9% -1% -40% -19% -15%
Currency effect
-3% -3% -2% -1% -2%
Total 6% -4% -42% -20% -17%
Revenue growth 2014 vs. 2013

Emerging markets 66% of revenue in 2014
12%
21%
16% 18%
8%
25%
Asia
Africa
Australia
Annual Report 2014
12 February 2015 Annual Report 2014 45
Revenue 2014 – classified by geography
16%
50%
34%
BRIC countries (Brazil, Russia, India, China)
Revenue 2014 – classified by country category
Developing countries (Exclusive of BRIC)
High-income countries (Cf. World Bank’s definition)
South America
North America
Europe

Revenue and order intake by segment
42%
18%
22%
18%
Annual Report 2014
12 February 2015 Annual Report 2014 46
Order intake Q4 2014 – classified by segment
Customer Services
Material Handling
Cement
36%
22%
23%
19%
Material Handling
Mineral Processing
Revenue Q4 2014 – classified by segment
Customer Services Cement
Mineral Processing

Currency effects on net working capital (Q/Q)
Net working capital
12 February 2015 Annual Report 2014 47
DKKm End Q4 2014 (excl. Cembrit)
End Q3 2014
Cembrit (end Q3 2014)
End Q3 2014 (excl. Cembrit)
Change Currency effect
Change in local currencies
Inventories 2,628 2,930 288 2,642 -14 +36 -50
Trade Receivables
5,026 5,164 318 4,846 +180 +54 +126
Trade Payables
2,736 2,478 144 2,334 +402 +31 +371
WIP net 66 -34 0 -34 +100 -16 +116
Prepayments net 1,553 1,760 -2 1,758 -205 0 -205
NWC total 2,164 2,761 321 2,440 -276 +36 -312
Currency effect Q4’14 vs. Q3’14

Currency effects on net working capital (YoY)
Net working capital
12 February 2015 Annual Report 2014 48
DKKm End 2014 (excl. Cembrit)
End 2013 Cembrit (end 2013)
End 2013 (excl. Cembrit
Change Currency effect
Change in local currencies
Inventories 2,628 2,575 279 2,296 +332 +205 +127
Trade Receivables
5,026 5,099 207 4,892 +134 +322 -188
Trade Payables
2,736 3,283 113 3,170 -434 +158 -592
WIP net 66 1,353 0 1,353 -1,287 +2 -1,289
Prepayments net 1,553 2,545 0 2,545 -992 +44 -1,036
NWC total 2,164 2,382 245 2,137 +27 +280 -253
Currency effect 2014 vs. 2013

Significant free cash flow in Q4 and for the full year
Acquisitions are currently on hold and other investments are managed closely
Strong cash flow from operations in Q4 2014
Annual Report 2014
12 February 2015 Annual Report 2014 49
CFFO (quarterly) DKKm
CFFI (quarterly)
DKK -217m in Q4 2014 DKKm DKK 739m in Q4 2014
(101)
(217) (300)(200)(100)
0100200300
77
739
(1,000)(500)
0500
1,0001,5002,000

Number of employees decreasing
Annual Report 2014
12 February 2015 Annual Report 2014 50
Number of employees Q4’14 vs. Q4’13 - by segment
5,847
3,306 2,840
2,251
6,527
2,948
2,221 2,020
Customer Services
Material Handling
Mineral Processing
Cement
Q4’14 Q4’13
Total number of employees Q4’14: 14,765
Number of employees decreased by 552 vs. Q4’13 and decreased by 96 vs. Q3’14
Decline explained by efficiency programme and business right-sizing
Increase in Customer Services primarily related to blue-collar workers on O&M contracts
Q4’14 Q4’13 Q4’14 Q4’13 Q4’14 Q4’13

New Customer Services Division (restated)
Customer Services
12 February 2015 Annual Report 2014 51
(DKKm) Q4
2014 Q4
2013 Change 2014 2013 Change
Order intake 1618 2,016 -20% 7,239 7,838 -8%
Order backlog 6,881 7,699 -11% 6,881 7,699 -11%
Revenue 2,156 1,910 +13% 7,804 7,201 +8%
EBITDA 257 194 +32% 1,141 742 +54%
EBITA 227 188 +21% 1,038 664 +56%
EBITA margin 10.5% 9.8% 13.3% 9.2%
EBIT 180 145 +24% 896 15 +5,873%
EBIT margin 8.3% 7.6% 11.5% 0.2%

Decrease in order intake related mainly to O&M
Margin decline in Q4’14 vs. Q3’14 attributable to delayed start-up in O&M, DKK -90m impact in Q4’14
New Customer Services Division (restated)
Customer Services
12 February 2015 Annual Report 2014 52
0
500
1,000
1,500
2,000
2,500
3,000
Q42012
Q12013
Q22013
Q32013
Q42013
Q12014
Q22014
Q32014
Q42014
Order intake (quarterly)
-20% vs. Q4 2013 DKKm
Announced O&M orders Announced capital orders Unannounced orders
Revenue (quarterly)
DKKm EBITA margin +13% vs. Q4 2013
0%
4%
8%
12%
16%
20%
0
500
1,000
1,500
2,000
2,500
Q42012
Q12013
Q22013
Q32013
Q42013
Q12014
Q22014
Q32014
Q42014

New Product Companies Division (restated)
Product Companies
12 February 2015 Annual Report 2014 53
(DKKm) Q4
2014 Q4
2013 Change 2014 2013 Change
Order intake 1,178 1,191 -1% 5,201 5,411 -4%
Order backlog 2,705 2,981 -9% 2,705 2,981 -9%
Revenue 1,463 1,608 -9% 5,538 5,957 -7%
EBITDA 158 174 -9% 767 700 +10%
EBITA 134 151 -11% 664 610 +9%
EBITA margin 9.2% 9.4% 12.0% 10.2%
EBIT 116 129 -10% 589 529) +11%
EBIT margin 7.9% 8.0% 10.6% 8.9%

Stable order intake vs. Q4’13 and sequentially
Margin variability in 2014 mainly related to other income and lower SG&A in Q2’14 and Q3’14
New Product Companies Division (restated)
Product Companies
12 February 2015 Annual Report 2014 54
Revenue (quarterly)
DKKm EBITA margin -9% vs. Q4 2013
0%
5%
10%
15%
20%
0
500
1,000
1,500
2,000
Q42012
Q12013
Q22013
Q32013
Q42013
Q12014
Q22014
Q32014
Q42014
0
500
1,000
1,500
2,000
Q42012
Q12013
Q22013
Q32013
Q42013
Q12014
Q22014
Q32014
Q42014
Order intake (quarterly)
-1% vs. Q4 2013 DKKm
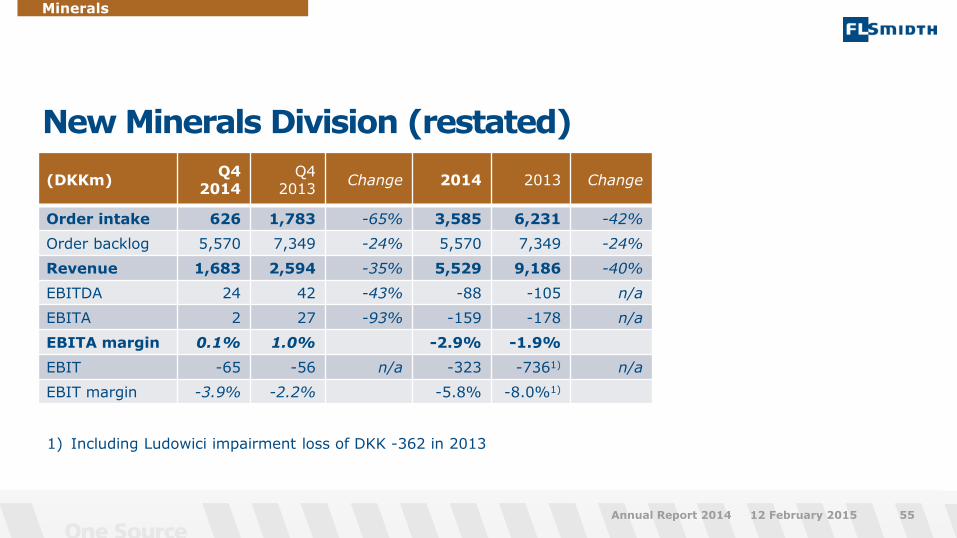
New Minerals Division (restated)
Minerals
12 February 2015 Annual Report 2014 55
(DKKm) Q4
2014 Q4
2013 Change 2014 2013 Change
Order intake 626 1,783 -65% 3,585 6,231 -42%
Order backlog 5,570 7,349 -24% 5,570 7,349 -24%
Revenue 1,683 2,594 -35% 5,529 9,186 -40%
EBITDA 24 42 -43% -88 -105 n/a
EBITA 2 27 -93% -159 -178 n/a
EBITA margin 0.1% 1.0% -2.9% -1.9%
EBIT -65 -56 n/a -323 -7361) n/a
EBIT margin -3.9% -2.2% -5.8% -8.0%1)
1) Including Ludowici impairment loss of DKK -362 in 2013

Unannounced orders slightly down reflection mining CAPEX downcycle
Minerals efficiency programme initiated to reach EBITA margin target of minimum 3% in 2016
New Minerals Division (restated)
Minerals
12 February 2015 Annual Report 2014 56
Revenue (quarterly)
DKKm EBITA margin -35% vs. Q4 2013
0
500
1,000
1,500
2,000
2,500
Q42012
Q12013
Q22013
Q32013
Q42013
Q12014
Q22014
Q32014
Q42014
Order intake (quarterly)
-65% vs. Q4 2013 DKKm
Announced orders Unannounced orders
-15%
-10%
-5%
0%
5%
10%
-12,000
-8,000
-4,000
0
4,000
8,000
Q42012
Q12013
Q22013
Q32013
Q42013
Q12014
Q22014
Q32014
Q42014

New Cement Division (restated)
Cement
12 February 2015 Annual Report 2014 57
(DKKm) Q4
2014 Q4
2013 Change 2014 2013 Change
Order intake 547 954 -43% 2,630 2,586 +2%
Order backlog 4,546 4,990 -9% 4,546 4,990 -9%
Revenue 894 1,272 -30% 3,250 4,397 -26%
EBITDA 37 -86 n/a 115 -14 n/a
EBITA 31 -91 n/a 95 -35 n/a
EBITA margin 3.5% -7.2% 2.9% -0.8%
EBIT 19 -103 n/a 69 -57 n/a
EBIT margin 2.1% -8.1% 2.1% -1.3%

Unannounced orders down from Q4’13 but stable vs. Q4’14
Revenue and margin reflecting low point of cycle
New Cement Division (restated)
Cement
12 February 2015 Annual Report 2014 58
Revenue (quarterly)
DKKm EBITA margin -30% vs. Q4 2013
-10%
-5%
0%
5%
10%
15%
20%
-1,000
-500
0
500
1,000
1,500
2,000
Q42012
Q12013
Q22013
Q32013
Q42013
Q12014
Q22014
Q32014
Q42014
0
200
400
600
800
1,000
1,200
Q42012
Q12013
Q22013
Q32013
Q42013
Q12014
Q22014
Q32014
Q42014
Order intake (quarterly)
-43% vs. Q4 2013 DKKm
Announced orders Unannounced orders