Flow Rate Equation for Suppressed and Submerged Sluice …
18
Flow Rate Equation for Suppressed and Submerged Sluice Gates www.itrc.org/reports/sluicegate.htm ITRC Report No. R 20-001 Flow Rate Equation for Suppressed and Submerged Sluice Gates IRRIGATION TRAINING & RESEARCH CENTER California Polytechnic State University San Luis Obispo, CA 93407-0730 Office Phone: (805) 756-2434 FAX: (805) 756-2433 www.itrc.org Prepared by Charles M. Burt Albert J. Clemmens Kyle Feist May 2020 Reference to any specific process, product or service by manufacturer, trade name, trademark or otherwise does not necessarily imply endorsement or recommendation of use by either California Polytechnic State University, the Irrigation Training & Research Center, or any other party mentioned in this document. No party makes any warranty, express or implied and assumes no legal liability or responsibility for the accuracy or completeness of any apparatus, product, process or data described. This report was prepared by ITRC as an account of work done to date. All designs and cost estimates are subject to final confirmation.
Transcript of Flow Rate Equation for Suppressed and Submerged Sluice …
Flow Rate Equation for Suppressed and Submerged Sluice Gates www.itrc.org/reports/sluicegate.htm ITRC Report No. R 20-001
Flow Rate Equation for Suppressed and Submerged Sluice Gates
IRRIGATION TRAINING & RESEARCH CENTER California Polytechnic State University San Luis Obispo, CA 93407-0730 Office Phone: (805) 756-2434 FAX: (805) 756-2433 www.itrc.org
Prepared by Charles M. Burt Albert J. Clemmens Kyle Feist May 2020
Reference to any specific process, product or service by manufacturer, trade name, trademark or otherwise does not necessarily imply endorsement or recommendation of use by either California Polytechnic State University, the Irrigation Training & Research Center, or any other party mentioned in this document. No party makes any warranty, express or implied and assumes no legal liability or responsibility for the accuracy or completeness of any apparatus, product, process or data described. This report was prepared by ITRC as an account of work done to date. All designs and cost estimates are subject to final confirmation.
Flow Rate Equation for Suppressed and Submerged Sluice Gates www.itrc.org/reports/sluicegate.htm ITRC Report No. R 20-001
Irrigation Training & Research Center i
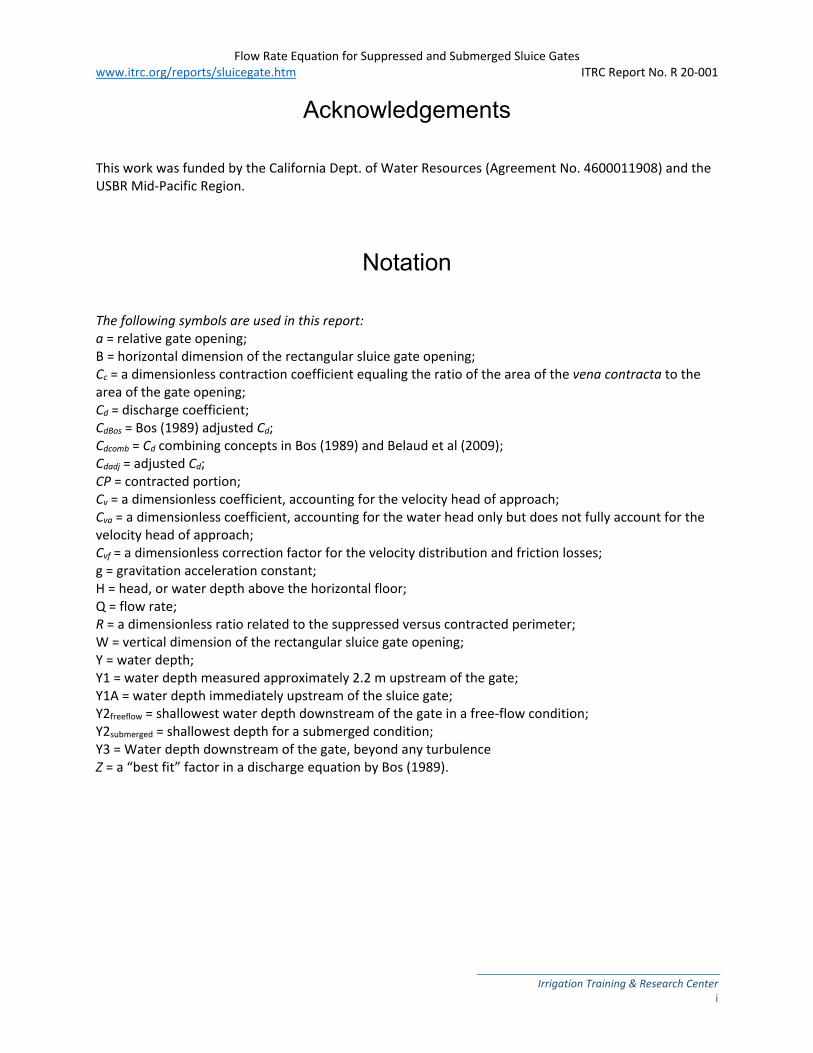
Acknowledgements This work was funded by the California Dept. of Water Resources (Agreement No. 4600011908) and the USBR Mid-Pacific Region.
Notation The following symbols are used in this report: a = relative gate opening; B = horizontal dimension of the rectangular sluice gate opening; Cc = a dimensionless contraction coefficient equaling the ratio of the area of the vena contracta to the area of the gate opening; Cd = discharge coefficient; CdBos = Bos (1989) adjusted Cd; Cdcomb = Cd combining concepts in Bos (1989) and Belaud et al (2009); Cdadj = adjusted Cd; CP = contracted portion; Cv = a dimensionless coefficient, accounting for the velocity head of approach; Cva = a dimensionless coefficient, accounting for the water head only but does not fully account for the velocity head of approach; Cvf = a dimensionless correction factor for the velocity distribution and friction losses; g = gravitation acceleration constant; H = head, or water depth above the horizontal floor; Q = flow rate; R = a dimensionless ratio related to the suppressed versus contracted perimeter; W = vertical dimension of the rectangular sluice gate opening; Y = water depth; Y1 = water depth measured approximately 2.2 m upstream of the gate; Y1A = water depth immediately upstream of the sluice gate; Y2freeflow = shallowest water depth downstream of the gate in a free-flow condition; Y2submerged = shallowest depth for a submerged condition; Y3 = Water depth downstream of the gate, beyond any turbulence Z = a “best fit” factor in a discharge equation by Bos (1989).
Flow Rate Equation for Suppressed and Submerged Sluice Gates www.itrc.org/reports/sluicegate.htm ITRC Report No. R 20-001
Irrigation Training & Research Center ii
Table of Contents
Introduction ............................................................................................................................ 1 Theory ...................................................................................................................................................... 2
Experiment .............................................................................................................................. 5 Test Conditions ........................................................................................................................................ 5 Data Analysis ............................................................................................................................................ 7 Submerged Discharge Coefficient Determination ................................................................................. 10
Conclusions ........................................................................................................................... 14
References............................................................................................................................. 15
List of Figures Figure 1. Profile view of a sluice gate – horizontal floor .............................................................................. 2 Figure 2. Contraction coefficient as a function of relative gate opening. Submerged sluice gate ............. 4 Figure 3. Plan view of 374 mm wide sluice gate dimensions. All dimensions are mm. Flow is from
left to right. ................................................................................................................................. 5 Figure 4. Side view of 374 mm wide sluice gate dimensions. All dimensions are mm. .............................. 5 Figure 5. Cd for submerged conditions where Q = Cd A (2gΔH)0.5 .............................................................. 10 Figure 6. Predicted flow rates versus measured (actual), using CdBos ........................................................ 11 Figure 7. Cdadj versus a for submerged sluice gates, where Cdadj = Cd /(1 + .9 B/(B+W)) ............................ 12 Figure 8. Predicted flow rates versus actual, using the new Cdcomb ........................................................... 13 Figure 9. Comparison of predicted versus measured submerged sluice gate flows using three
techniques for estimating a discharge coefficient ................................................................... 13
List of Tables Table 1. Data from submerged sluice gates .................................................................................................. 8
Flow Rate Equation for Suppressed and Submerged Sluice Gates www.itrc.org/reports/sluicegate.htm ITRC Report No. R 20-001
Irrigation Training & Research Center 1
Flow Rate Equation for Suppressed and Submerged Sluice Gates
Introduction
In irrigation projects, the control and measurement of flow rates at key bifurcation points is essential. Flumes in canals can be excellent measurement devices, but in some cases, they can be expensive and can have maintenance issues. A key limitation is that they require enough head (difference in water level across the flume) for accuracy. Acoustic Doppler flow meters and other similar devices can have problems including high cost, the need for excellent calibration, the need to average data for at least 30 minutes, and early failures. Sluice gates are often used at the heads of canals and at turnouts (offtakes) in irrigation districts to control flows, and sometimes to estimate flow rates. They are also increasingly used as combination flow control and flow measurement structures, for which programmable logic controllers (PLCs) measure upstream and downstream water levels and gate openings, and automatically adjust gate openings to maintain a constant target flow rate. Using sluice gates for accurate flow measurement has proven to be problematic because of the uncertainty regarding what discharge coefficient to use in the flow rate equation. There are numerous entrance and exit conditions of sluice gates in the field, including how far side gate frames extend into the flow path, floor steps (either up or down), length of upstream walls, orientation of the gates to the main canal flow, and exit conditions. Upstream and downstream water levels are measured in a wide variety of locations; some automated gate manufacturers attach upstream and downstream water level sensors to the gate frame itself, while other engineers specify water level sensors completely upstream and/or downstream of gate entrance sections. The differences result in theoretical and practical differences between the constants that must be used in any flow rate equation. Furthermore, there are submerged, free flow, and “uncertain” or “transition” hydraulic conditions as related to downstream water levels. Belaud et al (2009) noted that there can be large deviations between models and discharge measurements. Although a wide range of entrance and exit conditions can exist in the field, the specific condition of rectangular sluice gates with suppressed sides and bottom is of interest because ITRC frequently designs gates with those configurations and has felt that existing formulas were inadequate based on occasional comparisons with current meters and various acoustic doppler flow meters. Furthermore, there are many large-scale installations, such as in Sindh Province of Pakistan that have suppressed sluice gates already installed. An empirical understanding of what conditions gave predictable results was pursued. This empirical approach, obtained without a complete organization of the theory behind the answers, has provided long-standing hydraulics solutions using dimensionless variables such as the Moody diagram, which describes (but does not explain) pipe friction.
Flow Rate Equation for Suppressed and Submerged Sluice Gates www.itrc.org/reports/sluicegate.htm ITRC Report No. R 20-001
Irrigation Training & Research Center 2
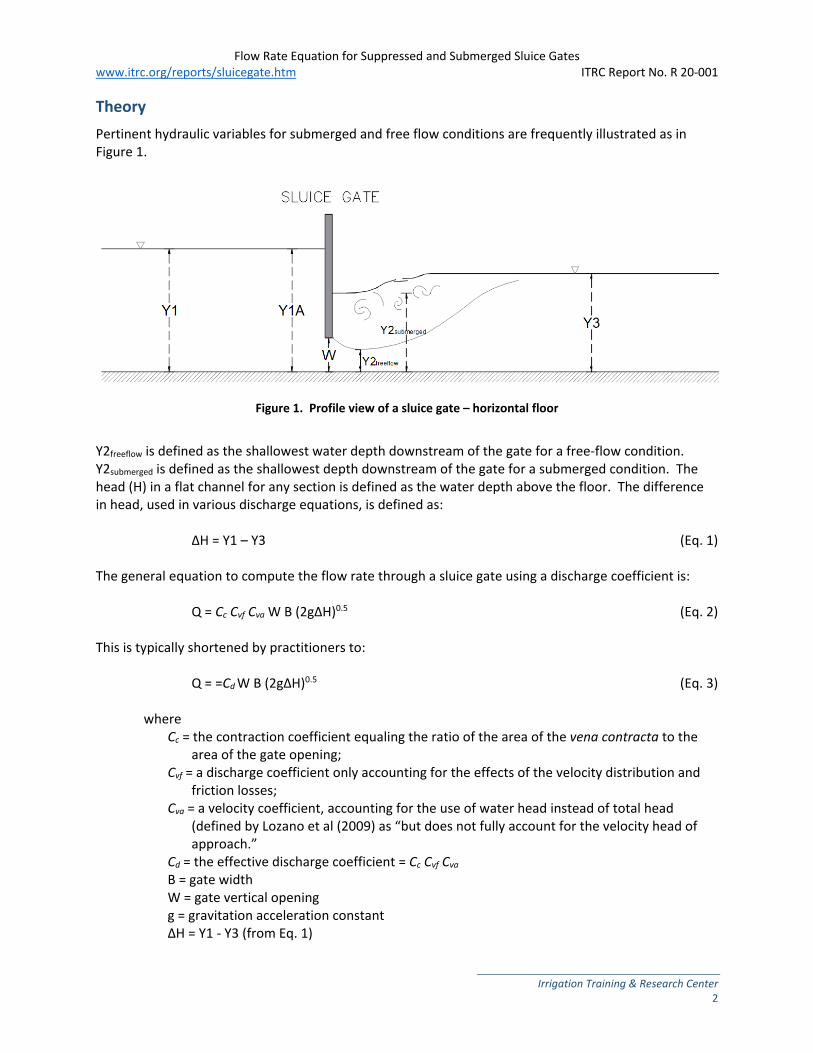
Theory Pertinent hydraulic variables for submerged and free flow conditions are frequently illustrated as in Figure 1.
Figure 1. Profile view of a sluice gate – horizontal floor
Y2freeflow is defined as the shallowest water depth downstream of the gate for a free-flow condition. Y2submerged is defined as the shallowest depth downstream of the gate for a submerged condition. The head (H) in a flat channel for any section is defined as the water depth above the floor. The difference in head, used in various discharge equations, is defined as: ΔH = Y1 – Y3 (Eq. 1) The general equation to compute the flow rate through a sluice gate using a discharge coefficient is: Q = Cc Cvf Cva W B (2gΔH)0.5 (Eq. 2) This is typically shortened by practitioners to: Q = =Cd W B (2gΔH)0.5 (Eq. 3)
where Cc = the contraction coefficient equaling the ratio of the area of the vena contracta to the
area of the gate opening; Cvf = a discharge coefficient only accounting for the effects of the velocity distribution and
friction losses; Cva = a velocity coefficient, accounting for the use of water head instead of total head
(defined by Lozano et al (2009) as “but does not fully account for the velocity head of approach.”
Cd = the effective discharge coefficient = Cc Cvf Cva B = gate width W = gate vertical opening g = gravitation acceleration constant ΔH = Y1 - Y3 (from Eq. 1)

Flow Rate Equation for Suppressed and Submerged Sluice Gates www.itrc.org/reports/sluicegate.htm ITRC Report No. R 20-001
Irrigation Training & Research Center 3
In practice, most field engineers combine Cc, Cvf, and Cva and use the effective discharge coefficient of Cd as: Q = Cd W B (2gΔH)0.5 (Eq. 4) Most practicing irrigation engineers in the United States use a constant Cd value such as 0.61 - 0.63 for all submerged sluice gates, regardless of entrance conditions and relative openings and gate sizes. The HEC-RAS default value for Cd is 0.8 (Brunner 2016). However, various researchers have found that the Cd value is not constant but is a function of various parameters. Henry (1950) generated a plot of dimensionless variable of (Y1/W) on the horizontal axis, with curves of (Y2/W). The Cd he used was plotted on the vertical axis and varied from 0.0 to 0.60. Henry’s formula is interesting in that he only used the upstream head (Y1) rather than (Y1-Y2) or (Y1-Y3) in his equation of: Q = Cd W B SQRT(2gY1) (Eq. 5) Henry’s data are unavailable, but his graphs have been used by many researchers as the basis for further theoretical research. Swamee (1992) converted those graphics into formulas. Two other papers applied one adjustment factor in estimating the Cd or Cc. Bos (1989) notes that the Cd value depends upon entrance conditions and provides the following equation for a submerged orifice with the bottom and sides being fully suppressed: Q = CdBos Cv W B (2gΔH)0.5 (Eq. 6)
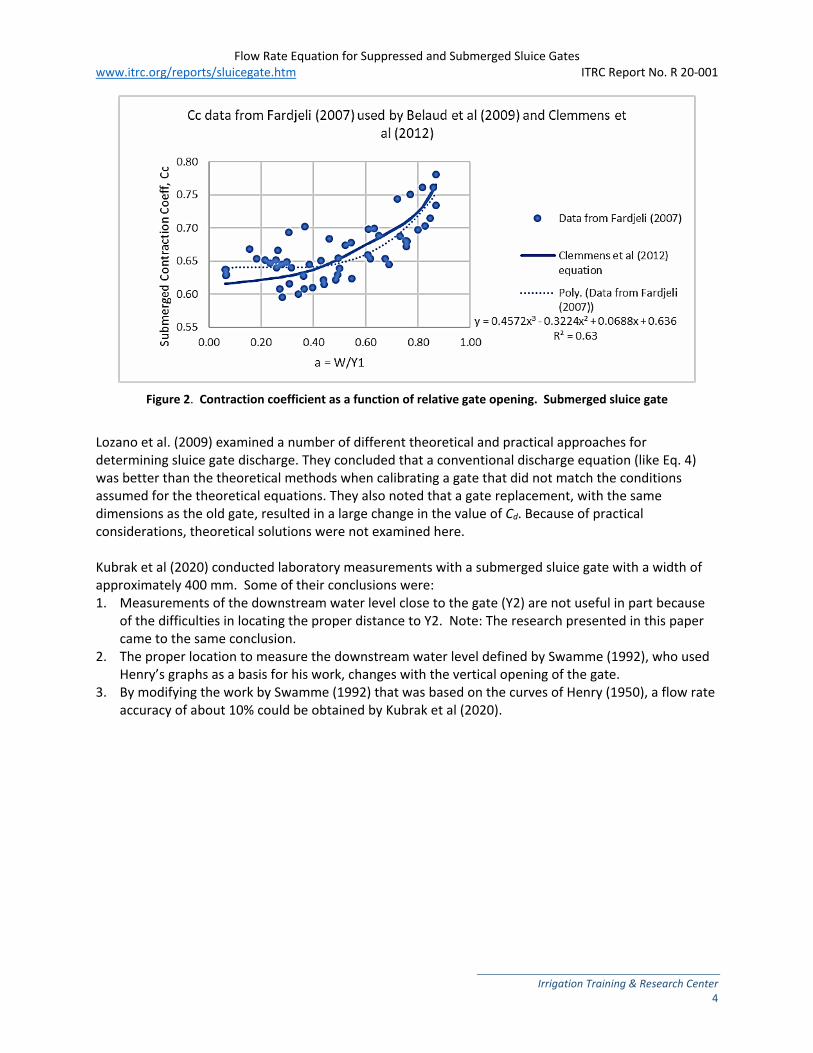
where CdBos = 0.61(1+ ZR) (Eq. 7) R = (B+2W)/(2B+2W) (Eq. 8) The recommended Z value from Bos (1989) is 0.15. Cv is the velocity coefficient (ratio of total head to water depth raised to the 0.5 power). Cv is typically assumed to equal 1.0 if the approach velocity is negligible. The Water Measurement Manual (USBR, 1997) uses the equation recommended by Bos (1989) with Z = 0.15. The second general modification was proposed by Belaud et al (2009). They examined an earlier data set of sluice gate measurements from an MS thesis by Fardjeli (2007). Those experiments were conducted on a small laboratory canal of 30 cm width with a maximum depth of 45 cm, using five gate openings and two flow rates. Belaud et al (2009) noted that the contraction coefficient Cc for submerged flow depends upon the relative gate opening, a, where: a = W/Y1 (Eq. 9) The data are reproduced in Figure 2.
Flow Rate Equation for Suppressed and Submerged Sluice Gates www.itrc.org/reports/sluicegate.htm ITRC Report No. R 20-001
Irrigation Training & Research Center 4
Figure 2. Contraction coefficient as a function of relative gate opening. Submerged sluice gate
Lozano et al. (2009) examined a number of different theoretical and practical approaches for determining sluice gate discharge. They concluded that a conventional discharge equation (like Eq. 4) was better than the theoretical methods when calibrating a gate that did not match the conditions assumed for the theoretical equations. They also noted that a gate replacement, with the same dimensions as the old gate, resulted in a large change in the value of Cd. Because of practical considerations, theoretical solutions were not examined here. Kubrak et al (2020) conducted laboratory measurements with a submerged sluice gate with a width of approximately 400 mm. Some of their conclusions were: 1. Measurements of the downstream water level close to the gate (Y2) are not useful in part because
of the difficulties in locating the proper distance to Y2. Note: The research presented in this paper came to the same conclusion.
2. The proper location to measure the downstream water level defined by Swamme (1992), who used Henry’s graphs as a basis for his work, changes with the vertical opening of the gate.
3. By modifying the work by Swamme (1992) that was based on the curves of Henry (1950), a flow rate accuracy of about 10% could be obtained by Kubrak et al (2020).
Flow Rate Equation for Suppressed and Submerged Sluice Gates www.itrc.org/reports/sluicegate.htm ITRC Report No. R 20-001
Irrigation Training & Research Center 5
Experiment
Tests evaluated measured hydraulic variables to develop an improved equation for the discharge coefficient for suppressed sluice gates, where the vertical gate opening is coincident with the canal bottom and the gate opening width is the same as the canal both upstream and downstream. Two different gate widths were tested to be sure the discharge coefficient did not vary with gate size.
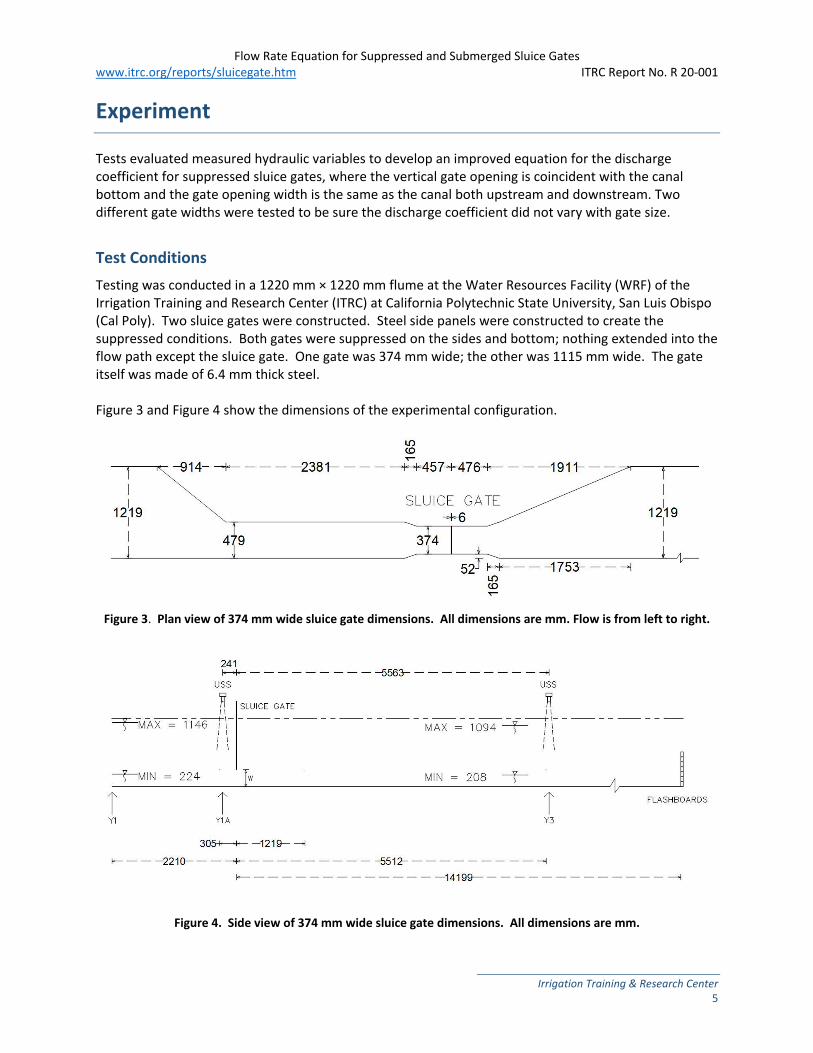
Test Conditions Testing was conducted in a 1220 mm × 1220 mm flume at the Water Resources Facility (WRF) of the Irrigation Training and Research Center (ITRC) at California Polytechnic State University, San Luis Obispo (Cal Poly). Two sluice gates were constructed. Steel side panels were constructed to create the suppressed conditions. Both gates were suppressed on the sides and bottom; nothing extended into the flow path except the sluice gate. One gate was 374 mm wide; the other was 1115 mm wide. The gate itself was made of 6.4 mm thick steel. Figure 3 and Figure 4 show the dimensions of the experimental configuration.
Figure 3. Plan view of 374 mm wide sluice gate dimensions. All dimensions are mm. Flow is from left to right.
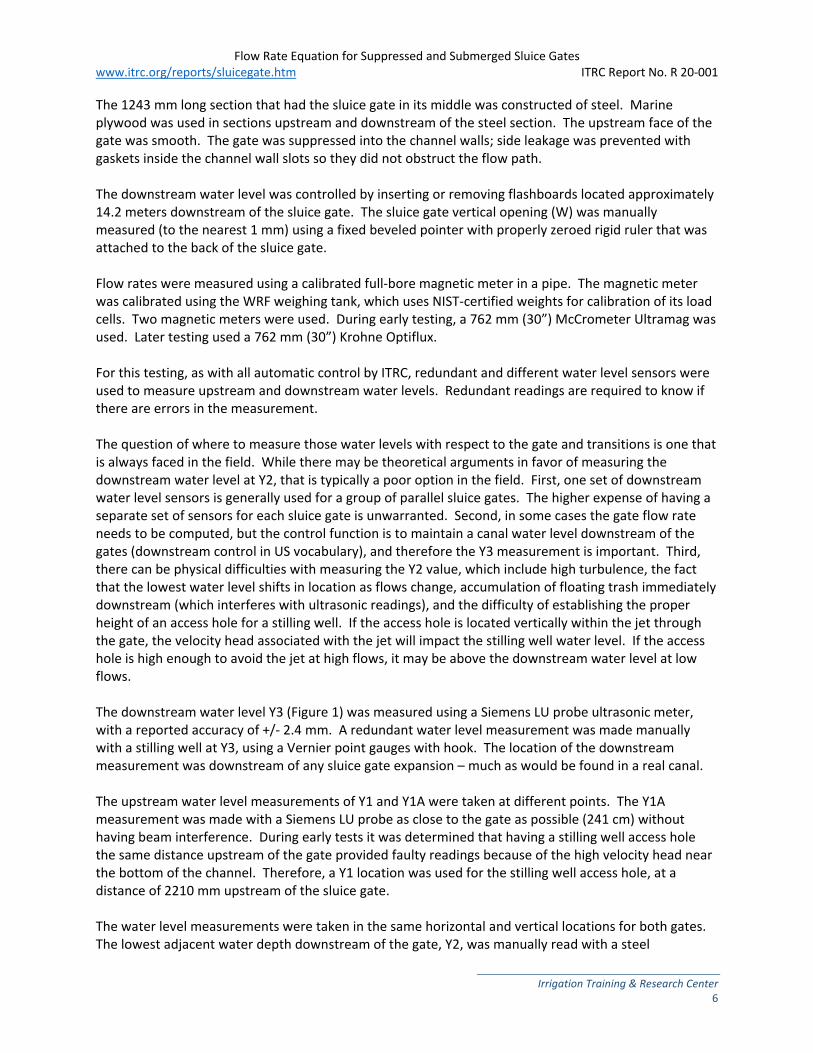
Figure 4. Side view of 374 mm wide sluice gate dimensions. All dimensions are mm.
Flow Rate Equation for Suppressed and Submerged Sluice Gates www.itrc.org/reports/sluicegate.htm ITRC Report No. R 20-001
Irrigation Training & Research Center 6
The 1243 mm long section that had the sluice gate in its middle was constructed of steel. Marine plywood was used in sections upstream and downstream of the steel section. The upstream face of the gate was smooth. The gate was suppressed into the channel walls; side leakage was prevented with gaskets inside the channel wall slots so they did not obstruct the flow path. The downstream water level was controlled by inserting or removing flashboards located approximately 14.2 meters downstream of the sluice gate. The sluice gate vertical opening (W) was manually measured (to the nearest 1 mm) using a fixed beveled pointer with properly zeroed rigid ruler that was attached to the back of the sluice gate. Flow rates were measured using a calibrated full-bore magnetic meter in a pipe. The magnetic meter was calibrated using the WRF weighing tank, which uses NIST-certified weights for calibration of its load cells. Two magnetic meters were used. During early testing, a 762 mm (30”) McCrometer Ultramag was used. Later testing used a 762 mm (30”) Krohne Optiflux. For this testing, as with all automatic control by ITRC, redundant and different water level sensors were used to measure upstream and downstream water levels. Redundant readings are required to know if there are errors in the measurement. The question of where to measure those water levels with respect to the gate and transitions is one that is always faced in the field. While there may be theoretical arguments in favor of measuring the downstream water level at Y2, that is typically a poor option in the field. First, one set of downstream water level sensors is generally used for a group of parallel sluice gates. The higher expense of having a separate set of sensors for each sluice gate is unwarranted. Second, in some cases the gate flow rate needs to be computed, but the control function is to maintain a canal water level downstream of the gates (downstream control in US vocabulary), and therefore the Y3 measurement is important. Third, there can be physical difficulties with measuring the Y2 value, which include high turbulence, the fact that the lowest water level shifts in location as flows change, accumulation of floating trash immediately downstream (which interferes with ultrasonic readings), and the difficulty of establishing the proper height of an access hole for a stilling well. If the access hole is located vertically within the jet through the gate, the velocity head associated with the jet will impact the stilling well water level. If the access hole is high enough to avoid the jet at high flows, it may be above the downstream water level at low flows. The downstream water level Y3 (Figure 1) was measured using a Siemens LU probe ultrasonic meter, with a reported accuracy of +/- 2.4 mm. A redundant water level measurement was made manually with a stilling well at Y3, using a Vernier point gauges with hook. The location of the downstream measurement was downstream of any sluice gate expansion – much as would be found in a real canal. The upstream water level measurements of Y1 and Y1A were taken at different points. The Y1A measurement was made with a Siemens LU probe as close to the gate as possible (241 cm) without having beam interference. During early tests it was determined that having a stilling well access hole the same distance upstream of the gate provided faulty readings because of the high velocity head near the bottom of the channel. Therefore, a Y1 location was used for the stilling well access hole, at a distance of 2210 mm upstream of the sluice gate. The water level measurements were taken in the same horizontal and vertical locations for both gates. The lowest adjacent water depth downstream of the gate, Y2, was manually read with a steel
Flow Rate Equation for Suppressed and Submerged Sluice Gates www.itrc.org/reports/sluicegate.htm ITRC Report No. R 20-001
Irrigation Training & Research Center 7
measurement ruler. Its specific location varied depending upon the flow rate, submergence, and gate opening. Y2 was not used in any of the computations but provides additional knowledge that may be useful for a more theoretical approach by others. The magnetic meter and ultrasonic meter readings were recorded in a PLC and displayed real-time on a laptop screen. The entrance to the test flume is designed so that any change in water level upstream of the sluice gate did not influence the facility’s recirculating pump flow rate, and there was a relatively short upstream distance that was needed to stabilize its depth. Water level readings were not recorded until they stabilized after a flow rate, gate movement, or downstream level change was made. The experimental procedure consisted of setting a flow rate and gate position and downstream water level. The downstream water level would then be varied. Then either the flow rate or gate position would be changed, again testing with various downstream water levels. A range of submerged, transition, and free flow hydraulic conditions was obtained.
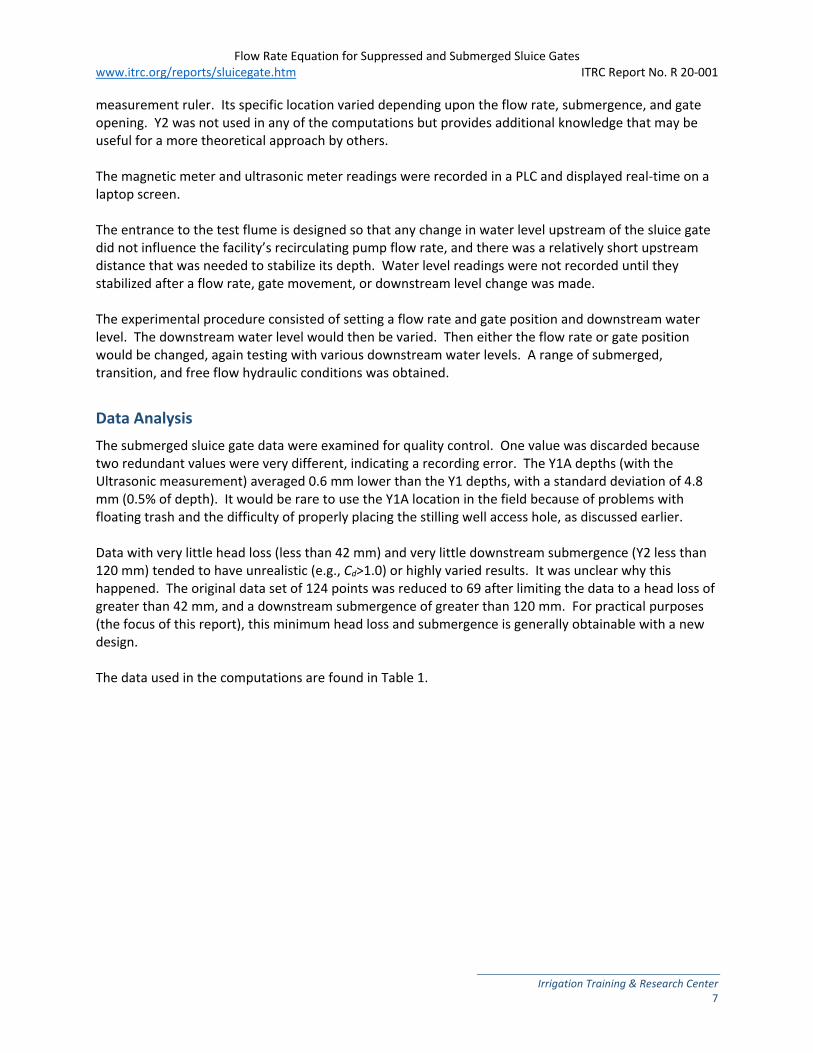
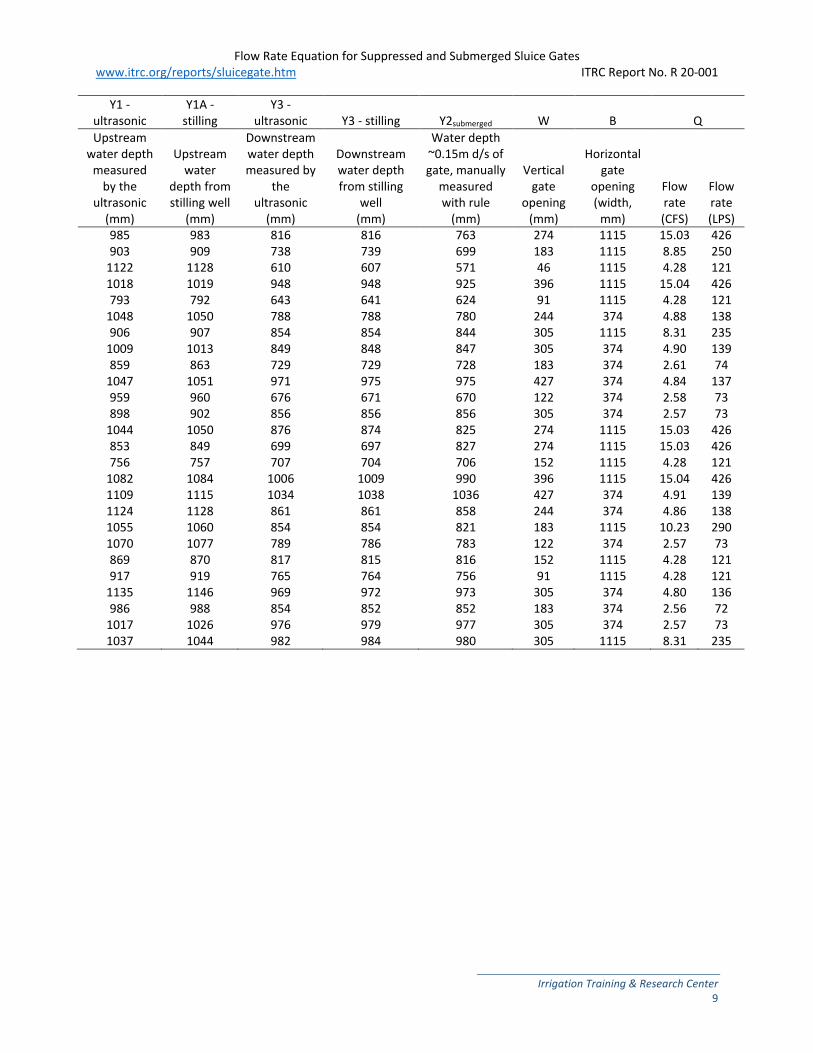
Data Analysis The submerged sluice gate data were examined for quality control. One value was discarded because two redundant values were very different, indicating a recording error. The Y1A depths (with the Ultrasonic measurement) averaged 0.6 mm lower than the Y1 depths, with a standard deviation of 4.8 mm (0.5% of depth). It would be rare to use the Y1A location in the field because of problems with floating trash and the difficulty of properly placing the stilling well access hole, as discussed earlier. Data with very little head loss (less than 42 mm) and very little downstream submergence (Y2 less than 120 mm) tended to have unrealistic (e.g., Cd>1.0) or highly varied results. It was unclear why this happened. The original data set of 124 points was reduced to 69 after limiting the data to a head loss of greater than 42 mm, and a downstream submergence of greater than 120 mm. For practical purposes (the focus of this report), this minimum head loss and submergence is generally obtainable with a new design. The data used in the computations are found in Table 1.

Flow Rate Equation for Suppressed and Submerged Sluice Gates www.itrc.org/reports/sluicegate.htm ITRC Report No. R 20-001
Irrigation Training & Research Center 8
Table 1. Data from submerged sluice gates
Y1 - ultrasonic
Y1A - stilling
Y3 - ultrasonic Y3 - stilling Y2submerged W B Q
Upstream water depth
measured by the
ultrasonic (mm)
Upstream water
depth from stilling well
(mm)
Downstream water depth measured by
the ultrasonic
(mm)
Downstream water depth from stilling
well (mm)
Water depth ~0.15m d/s of gate, manually
measured with rule
(mm)
Vertical gate
opening (mm)
Horizontal gate
opening (width,
mm)
Flow rate (CFS)
Flow rate (LPS)
976 965 852 849 807 671 374 12.27 347 397 395 279 276 227 91 1115 4.28 121 784 781 418 424 265 122 1115 10.12 286 599 599 487 487 450 305 374 4.86 138 830 825 728 731 700 549 374 8.94 253 455 460 362 362 335 183 374 2.61 74 914 907 854 853 836 671 374 8.99 255 650 651 602 602 595 427 374 4.87 138
1064 1057 923 919 895 671 374 12.09 342 713 707 580 578 503 274 1115 15.03 426 852 854 360 363 280 46 1115 4.28 121 628 626 490 488 429 183 1115 8.85 250 851 841 789 787 749 488 1115 18.49 524 751 746 698 697 660 396 1115 15.04 426 970 965 843 846 823 549 374 9.07 257 542 537 404 400 369 91 1115 4.28 121 693 694 428 427 405 122 374 2.60 74
1039 1040 968 969 960 671 374 8.87 251 604 608 488 487 480 183 374 2.60 74 763 759 616 618 603 305 374 4.87 138 503 504 459 459 453 152 1115 4.28 121 956 960 547 546 425 122 1115 10.12 286 800 800 735 736 734 427 374 4.92 139 967 960 914 912 885 549 1115 18.49 524
1106 1106 1026 1030 1020 671 374 8.92 253 991 994 483 480 421 46 1115 4.28 121
1046 1052 601 601 560 183 374 4.82 136 762 762 610 607 563 183 1115 8.85 250 984 975 907 908 872 488 1115 18.49 524 889 884 824 822 792 396 1115 15.04 426
1030 1024 971 973 950 549 1115 18.49 524 662 661 520 516 493 91 1115 4.28 121
1109 1111 853 851 830 427 374 8.98 254 1030 1039 612 611 525 122 1115 10.12 286 926 925 672 672 654 244 374 4.94 140 776 776 730 730 716 305 1115 8.31 235 727 732 605 602 599 183 374 2.61 74
1113 1117 971 977 965 549 374 8.98 254 823 827 548 550 538 122 374 2.60 74 628 626 580 577 571 152 1115 4.28 121 766 769 728 726 726 305 374 2.57 73 919 920 849 850 849 427 374 4.83 137 893 890 734 735 732 305 374 4.96 141
Flow Rate Equation for Suppressed and Submerged Sluice Gates www.itrc.org/reports/sluicegate.htm ITRC Report No. R 20-001
Irrigation Training & Research Center 9
Y1 - ultrasonic
Y1A - stilling
Y3 - ultrasonic Y3 - stilling Y2submerged W B Q
Upstream water depth
measured by the
ultrasonic (mm)
Upstream water
depth from stilling well
(mm)
Downstream water depth measured by
the ultrasonic
(mm)
Downstream water depth from stilling
well (mm)
Water depth ~0.15m d/s of gate, manually
measured with rule
(mm)
Vertical gate
opening (mm)
Horizontal gate
opening (width,
mm)
Flow rate (CFS)
Flow rate (LPS)
985 983 816 816 763 274 1115 15.03 426 903 909 738 739 699 183 1115 8.85 250
1122 1128 610 607 571 46 1115 4.28 121 1018 1019 948 948 925 396 1115 15.04 426 793 792 643 641 624 91 1115 4.28 121
1048 1050 788 788 780 244 374 4.88 138 906 907 854 854 844 305 1115 8.31 235
1009 1013 849 848 847 305 374 4.90 139 859 863 729 729 728 183 374 2.61 74
1047 1051 971 975 975 427 374 4.84 137 959 960 676 671 670 122 374 2.58 73 898 902 856 856 856 305 374 2.57 73
1044 1050 876 874 825 274 1115 15.03 426 853 849 699 697 827 274 1115 15.03 426 756 757 707 704 706 152 1115 4.28 121
1082 1084 1006 1009 990 396 1115 15.04 426 1109 1115 1034 1038 1036 427 374 4.91 139 1124 1128 861 861 858 244 374 4.86 138 1055 1060 854 854 821 183 1115 10.23 290 1070 1077 789 786 783 122 374 2.57 73 869 870 817 815 816 152 1115 4.28 121 917 919 765 764 756 91 1115 4.28 121
1135 1146 969 972 973 305 374 4.80 136 986 988 854 852 852 183 374 2.56 72
1017 1026 976 979 977 305 374 2.57 73 1037 1044 982 984 980 305 1115 8.31 235
Flow Rate Equation for Suppressed and Submerged Sluice Gates www.itrc.org/reports/sluicegate.htm ITRC Report No. R 20-001
Irrigation Training & Research Center 10
Submerged Discharge Coefficient Determination The first step was to compute an effective Cd from Eq. (4).
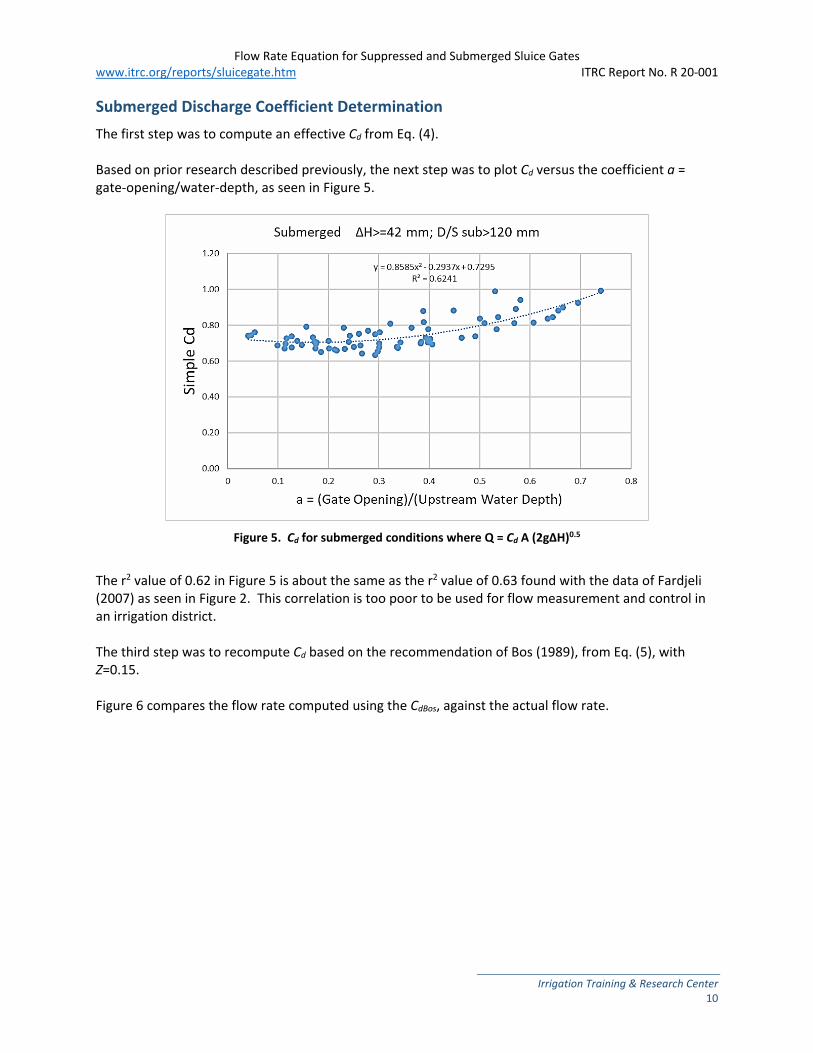
Based on prior research described previously, the next step was to plot Cd versus the coefficient a = gate-opening/water-depth, as seen in Figure 5.
Figure 5. Cd for submerged conditions where Q = Cd A (2gΔH)0.5
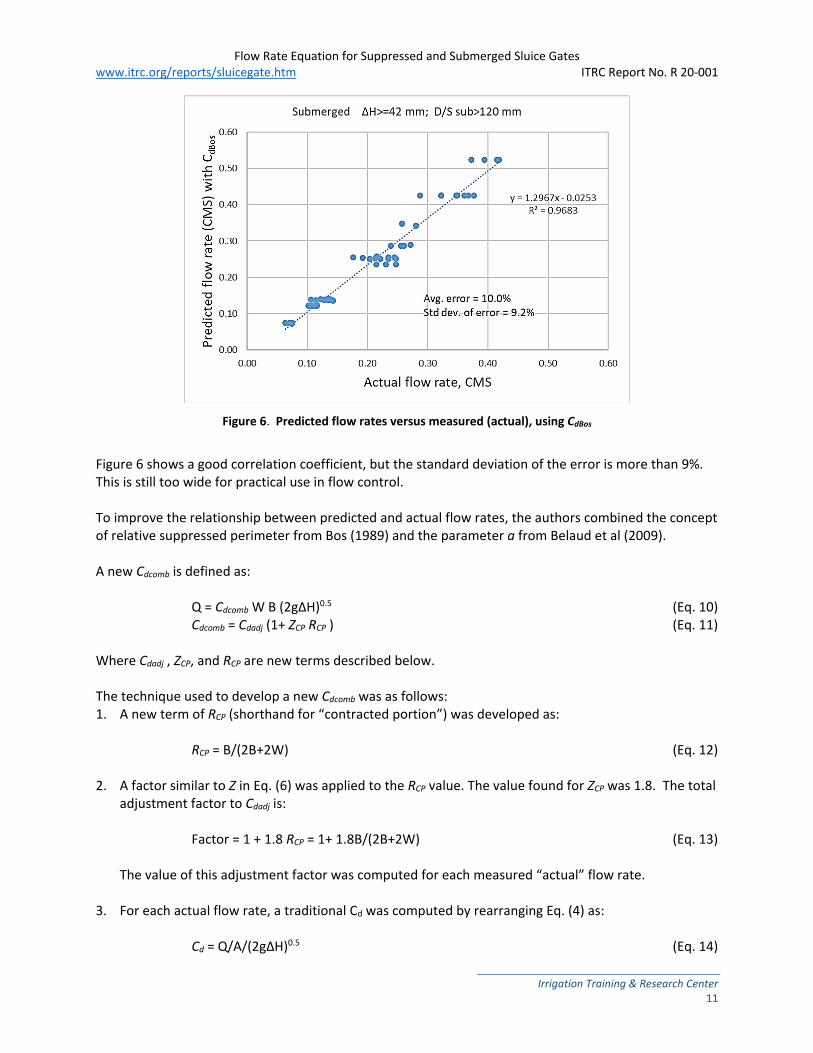
The r2 value of 0.62 in Figure 5 is about the same as the r2 value of 0.63 found with the data of Fardjeli (2007) as seen in Figure 2. This correlation is too poor to be used for flow measurement and control in an irrigation district. The third step was to recompute Cd based on the recommendation of Bos (1989), from Eq. (5), with Z=0.15. Figure 6 compares the flow rate computed using the CdBos, against the actual flow rate.
Flow Rate Equation for Suppressed and Submerged Sluice Gates www.itrc.org/reports/sluicegate.htm ITRC Report No. R 20-001
Irrigation Training & Research Center 11
Figure 6. Predicted flow rates versus measured (actual), using CdBos
Figure 6 shows a good correlation coefficient, but the standard deviation of the error is more than 9%. This is still too wide for practical use in flow control. To improve the relationship between predicted and actual flow rates, the authors combined the concept of relative suppressed perimeter from Bos (1989) and the parameter a from Belaud et al (2009). A new Cdcomb is defined as: Q = Cdcomb W B (2gΔH)0.5 (Eq. 10) Cdcomb = Cdadj (1+ ZCP RCP ) (Eq. 11) Where Cdadj , ZCP, and RCP are new terms described below. The technique used to develop a new Cdcomb was as follows: 1. A new term of RCP (shorthand for “contracted portion”) was developed as:
RCP = B/(2B+2W) (Eq. 12)
2. A factor similar to Z in Eq. (6) was applied to the RCP value. The value found for ZCP was 1.8. The total
adjustment factor to Cdadj is: Factor = 1 + 1.8 RCP = 1+ 1.8B/(2B+2W) (Eq. 13)
The value of this adjustment factor was computed for each measured “actual” flow rate.
3. For each actual flow rate, a traditional Cd was computed by rearranging Eq. (4) as:
Cd = Q/A/(2gΔH)0.5 (Eq. 14)
Flow Rate Equation for Suppressed and Submerged Sluice Gates www.itrc.org/reports/sluicegate.htm ITRC Report No. R 20-001
Irrigation Training & Research Center 12
4. A new adjusted Cd, labeled Cdadj, was computed for each actual flow rate as: Cdadj = Cd/(1+ ZCP RCP ) (Eq. 15)
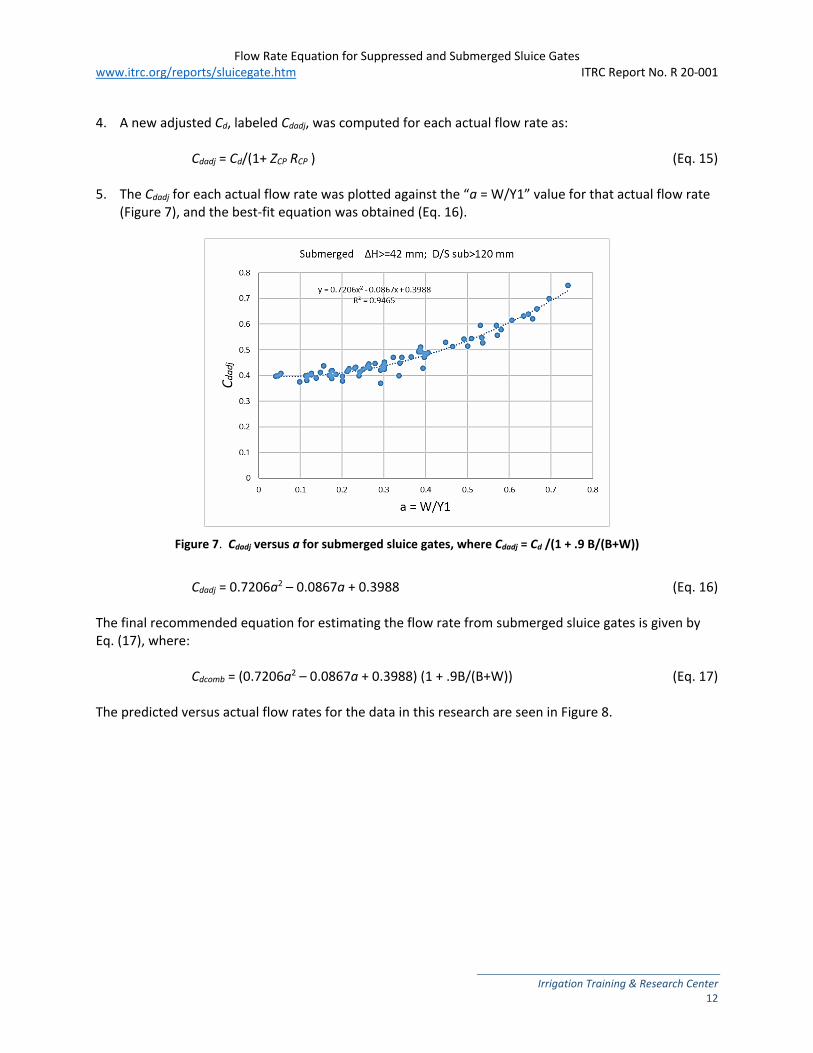
5. The Cdadj for each actual flow rate was plotted against the “a = W/Y1” value for that actual flow rate
(Figure 7), and the best-fit equation was obtained (Eq. 16).
Figure 7. Cdadj versus a for submerged sluice gates, where Cdadj = Cd /(1 + .9 B/(B+W))
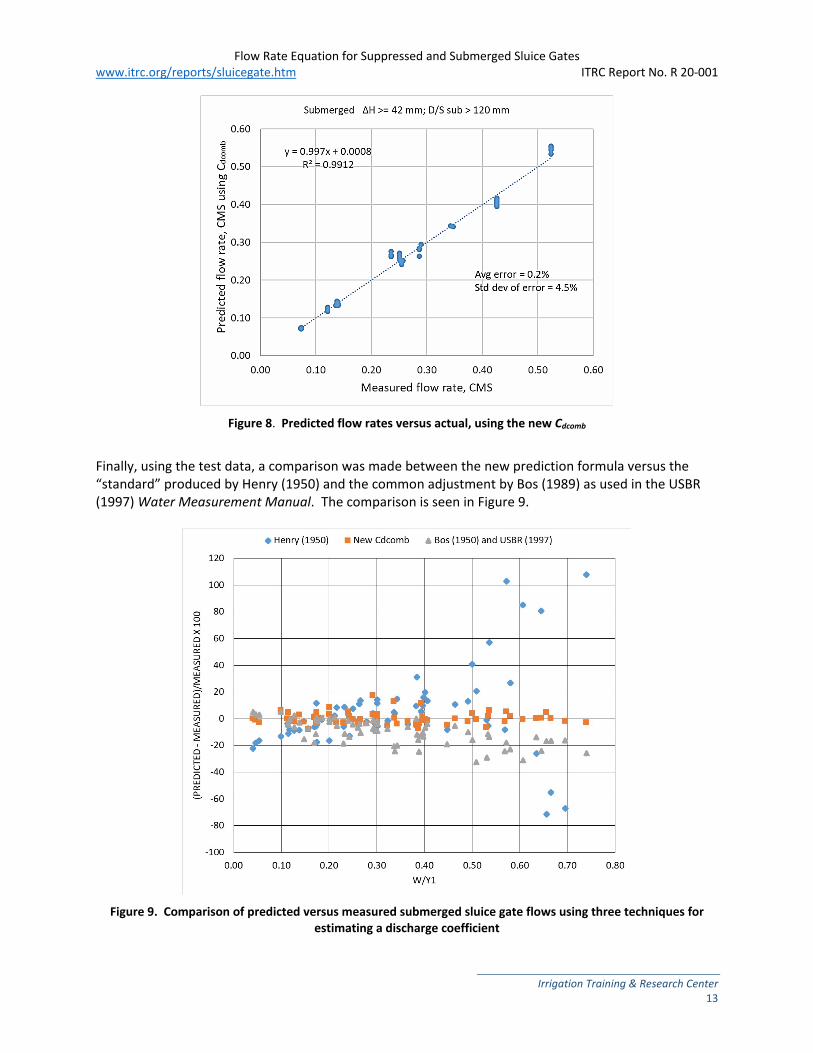
Cdadj = 0.7206a2 – 0.0867a + 0.3988 (Eq. 16) The final recommended equation for estimating the flow rate from submerged sluice gates is given by Eq. (17), where: Cdcomb = (0.7206a2 – 0.0867a + 0.3988) (1 + .9B/(B+W)) (Eq. 17) The predicted versus actual flow rates for the data in this research are seen in Figure 8.
Flow Rate Equation for Suppressed and Submerged Sluice Gates www.itrc.org/reports/sluicegate.htm ITRC Report No. R 20-001
Irrigation Training & Research Center 13
Figure 8. Predicted flow rates versus actual, using the new Cdcomb
Finally, using the test data, a comparison was made between the new prediction formula versus the “standard” produced by Henry (1950) and the common adjustment by Bos (1989) as used in the USBR (1997) Water Measurement Manual. The comparison is seen in Figure 9.
Figure 9. Comparison of predicted versus measured submerged sluice gate flows using three techniques for
estimating a discharge coefficient
Flow Rate Equation for Suppressed and Submerged Sluice Gates www.itrc.org/reports/sluicegate.htm ITRC Report No. R 20-001
Irrigation Training & Research Center 14
Conclusions
An improved discharge coefficient has been developed for vertical sluice gates that are suppressed and submerged. The improvement built upon work by earlier researchers who recognized the discharge coefficient was not a constant value such as 0.61. Rather, two factors impacted the value: 1. Bos (1989) recognized that some ratio of suppressed versus contracted orifice perimeter was
important. 2. Belaud et al (2009) and Henry (1950) recognized that the discharge coefficient will vary depending
upon the relative upstream depth of water above the orifice. Usage of the Cdcomb equation (Eq. 17) requires that the following conditions be met: 1. The vertical walls are parallel at the entrance of and downstream of the gate. 2. The vertical walls are suppressed. 3. If a stilling well is used, its access tube must not be close to the jetting action immediately upstream
of, or downstream of, the gate. 4. The downstream water level should be measured downstream of the turbulent area. 5. The difference in head across the gate must be greater than 42 mm. 6. The water level immediately downstream of the gate must provide at least 120 mm of submergence
over the top of the gate opening. 7. Limit the Cd value to a maximum value of 0.85.
Flow Rate Equation for Suppressed and Submerged Sluice Gates www.itrc.org/reports/sluicegate.htm ITRC Report No. R 20-001
Irrigation Training & Research Center 15
References
Belaud, G., Cassan, L., and Baume, J.-P. (2009). Calculation of Contraction Coefficient under Sluice Gates and Application to Discharge Measurement. Journal of Hydraulic Engineering, Vol. 135, No. 12. Pp 1086-1091.
Bos, M. G., ed. (1989). Discharge Measurement Structures. 3rd Edition. Publication 20. International Institute for Land Reclamation and Improvement/ILRI. Wageningen, The Netherlands.
Brunner, G.B. (2016). HEC-RAS, River Systems Analysis Hydraulic Reference Manual, U.S. Army Corps of Engineers, Davis, CA. 538 p.
Fardjeli, N. (2007). Modélisation d’ouvrages de régulation pour l’aide à la gestion des canaux. MS thesis. Montpellier Supagro, France, 57.
Henry, H. R. (1950). Portion of a discussion of “On Submerged Jets.” Trans. ASCE. (115): 687-694. Kubrak, E., J. Kubrak, A. Kiczo, and M. Kubrak. (2020). Flow Measurements Using a Sluice Gate; Analysis
of Applicability. Water 2020,12, 819; doi:103390/w12030819 Lozano, D., Mateos, L., Merkley, G.P., and Clemmens, A.J. (2009). Field Calibration of Submerged Sluice
Gates in Irrigation Canals. Journal of Irrigation and Drainage Engineering, Vol. 135, No. 6. Pp 763-772.
Swamee, P.K. (1992). Sluice Gate Discharge Equations. J. Irrig. Drain. Engr of ASCE (93):167-186. USBR. (1997). Water Measurement Manual: A Water Resources Technical Publication. Third edition.
U.S. Dept. of the Interior. U.S. Bureau of Reclamation.