Florida TaxWatch is a 501(c)(3) nonprofit organization ... MASTERCARD AMEX ... Have you ever...
25
Transcript of Florida TaxWatch is a 501(c)(3) nonprofit organization ... MASTERCARD AMEX ... Have you ever...

I WO
ULD
LIK
E T
O H
ELP
SU
PP
OR
T TH
E V
ALU
AB
LE W
OR
K O
F FL
OR
IDA
TA
XW
ATC
H
Enc
lose
d is
a g
ift
to e
nsur
e th
at I
rece
ive
the
2016
ed
itio
n o
f H
ow F
lori
da
Co
mp
ares
: Tax
es
$10
0 (
min
)$
250
$50
0$
1,00
0O
ther
Enc
lose
d is
my
chec
k, m
ade
pay
able
to
: F
lori
da
TaxW
atch
, 10
6 N
. Bro
noug
h S
t., T
alla
hass
ee, F
L 32
301
Ple
ase
char
ge
the
amo
unt
ind
icat
ed a
bov
e to
my:
VIS
AM
AS
TE
RC
AR
DA
ME
XD
ISC
OV
ER
Car
d #
:E
xp. D
ate:
CC
V #
:
Nam
e:
Ad
dre
ss:
Cit
y:
Sta
te:
Z
ip:
PLE
AS
E S
EN
D M
E E
MA
ILS
AB
OU
T N
EW
RE
SE
AR
CH
I wo
uld
like
to
ord
er a
dd
itio
nal c
op
ies
of
this
ed
itio
n o
f H
ow F
lori
da
Co
mp
ares
$30
fo
r 10
co
pie
s$
125
for
50 c
op
ies
$20
0 f
or
100
co
pie
s
Flo
rid
a Ta
xWat
ch is
a 5
01(
c)(3
) no
npro
fit
org
aniz
atio
n. Y
our
gif
t is
tax
-ded
ucti
ble
to
the
max
imum
allo
wed
by
law
.
106 N. BRONOUGH ST., TALLAHASSEE, FL 32301
P: 850.222.5052 F: 850.222.7476
COPYRIGHT © APRIL 2015, FLORIDA TAXWATCH RESEARCH INSTITUTE, INC.
ALL RIGHTS RESERVED.

- 2 - - 1 -
Have you ever wondered how Florida’s taxes stack
up against the taxes in other states? If so, this
report is for you.
The annual Florida TaxWatch How Florida Compares:
Taxes report ranks Florida’s state and local taxes
against those levied around the nation. The nearly
50 tables, charts, and graphs in this report provide
comprehensive information on state and local
tax rates, tax collections, and other government
revenues for all 50 states, and historical information
for Florida.
TaxWatch provides this report each year as a
reference tool for Florida’s taxpayers, policymakers,
and elected officials.
This report is part of our larger How Florida
Compares series, which is intended to help
Floridians better understand their state through
data. This report, like each report in this series,
provides neutral, nonpartisan information on where
Florida ranks compared to our 49 sister states and
the national average.
I hope that you will use this guide as a resource to
better understand the cost of your state and local
governments and how those costs stack up at local
and state levels.
Sincerely,
Dominic M. Calabro President and CEO Florida TaxWatch
dear fellow taxpayersKurt Wenner, Vice President
of Research, is a mainstay on
the Tallahassee state budget
watchdog scene and is the
second-longest serving staff
member of Florida TaxWatch
(32 years). Kurt has authored all of the major tax publications
produced by Florida TaxWatch, including pieces on Florida’s
Intangibles Tax, and general sales, property, and business tax
issues. Kurt is the author of TaxWatch staples “How Florida
Compares,” the annual “Taxpayer Independence Day” report on tax
burdens, and the annual “Budget Turkey Watch.”
ABOUT THE AUTHOR
FLORIDA TAXWATCH VOLUNTEER LEADERSHIP
Michelle Robinson Chairman of the Board of Trustees
David Mann Chairman-Elect
FLORIDA TAXWATCH RESEARCH LEADERSHIP
Dominic M. Calabro President & CEO
Robert Weissert, Esq. Sr. VP for Research & General Counsel
RESEARCH PROJECT TEAM
Kurt Wenner VP of Research Lead Researcher
Chris Barry Director of Publications Design, Layout, Publication
All Florida TaxWatch research done under the direction of
Dominic M. Calabro, President, CEO, Publisher & Editor.
FOR MORE INFORMATION: WWW.FLORIDATAXWATCH.ORG
The findings in this Report are based on the data and sources referenced. Florida TaxWatch research is conducted with every reasonable attempt to verify the accuracy and reliability of the data, and the calculations and assumptions made herein. Please feel free to contact us if you feel that this paper is factually inaccurate.
The research findings and recommendations of Florida TaxWatch do not necessarily reflect the view of its members, staff, Executive Committee, or Board of Trustees; and are not influenced by the individuals or organizations who may have sponsored the research.
106 N. Bronough St., Tallahassee, FL 32301 p: 850.222.5052 f: 850.222.7476
Copyright © April 2015, Florida TaxWatch Research Institute, Inc. All Rights Reserved.
ABOUT TAXWATCHAs an independent, nonpartisan,
nonprofit taxpayer research institute
and government watchdog, it is the
mission of Florida TaxWatch to provide
the citizens of Florida and public
officials with high quality, independent
research and analysis of issues related
to state and local government taxation,
expenditures, policies, and programs.
Florida TaxWatch works to improve
the productivity and accountability
of Florida government. Its research
recommends productivity enhancements
and explains the statewide impact
of fiscal and economic policies and
practices on citizens and businesses.
Florida TaxWatch is supported by
voluntary, tax-deductible memberships
and private grants, and does not accept
government funding. Memberships
provide a solid, lasting foundation that
has enabled Florida TaxWatch to bring
about a more effective, responsive
government that is accountable to the
citizens it serves since 1979.
THE PRINTING OF THIS POCKET GUIDE MADE POSSIBLE BY THE GENEROUS CONTRIBUTION OF
- 2 - - 3 -
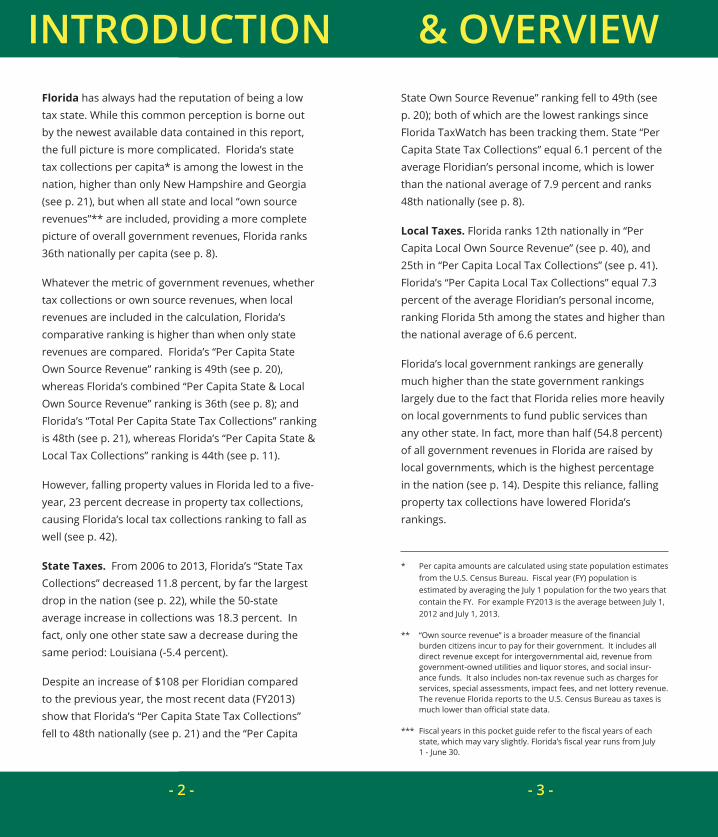
Florida has always had the reputation of being a low tax state. While this common perception is borne out by the newest available data contained in this report, the full picture is more complicated. Florida’s state tax collections per capita* is among the lowest in the nation, higher than only New Hampshire and Georgia (see p. 21), but when all state and local “own source revenues”** are included, providing a more complete picture of overall government revenues, Florida ranks 36th nationally per capita (see p. 8).
Whatever the metric of government revenues, whether tax collections or own source revenues, when local revenues are included in the calculation, Florida’s comparative ranking is higher than when only state revenues are compared. Florida’s “Per Capita State Own Source Revenue” ranking is 49th (see p. 20), whereas Florida’s combined “Per Capita State & Local Own Source Revenue” ranking is 36th (see p. 8); and Florida’s “Total Per Capita State Tax Collections” ranking is 48th (see p. 21), whereas Florida’s “Per Capita State & Local Tax Collections” ranking is 44th (see p. 11).
However, falling property values in Florida led to a five-year, 23 percent decrease in property tax collections, causing Florida’s local tax collections ranking to fall as well (see p. 42).
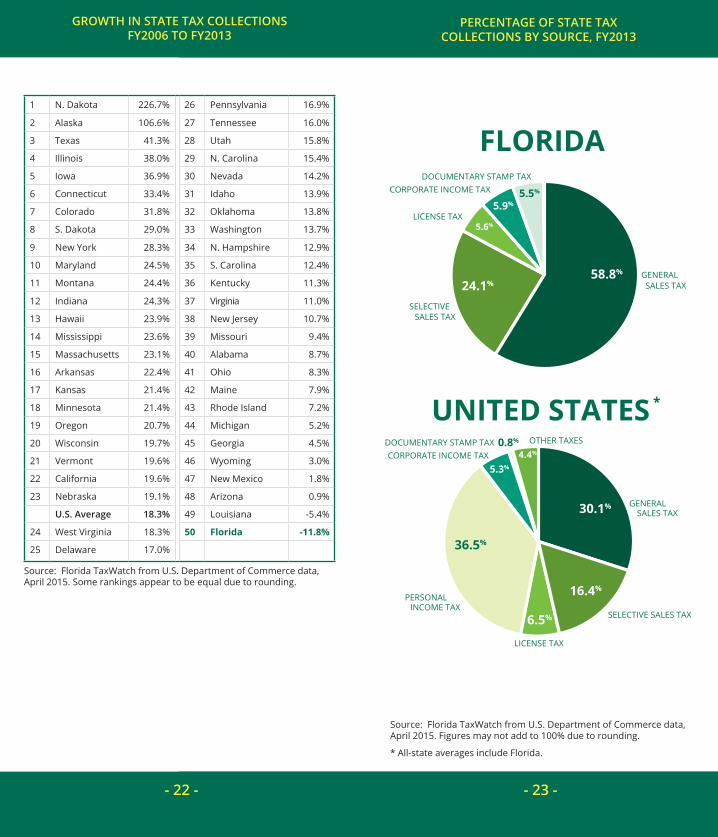
State Taxes. From 2006 to 2013, Florida’s “State Tax Collections” decreased 11.8 percent, by far the largest drop in the nation (see p. 22), while the 50-state average increase in collections was 18.3 percent. In fact, only one other state saw a decrease during the same period: Louisiana (-5.4 percent).
Despite an increase of $108 per Floridian compared to the previous year, the most recent data (FY2013) show that Florida’s “Per Capita State Tax Collections” fell to 48th nationally (see p. 21) and the “Per Capita
State Own Source Revenue” ranking fell to 49th (see p. 20); both of which are the lowest rankings since Florida TaxWatch has been tracking them. State “Per Capita State Tax Collections” equal 6.1 percent of the average Floridian’s personal income, which is lower than the national average of 7.9 percent and ranks 48th nationally (see p. 8).
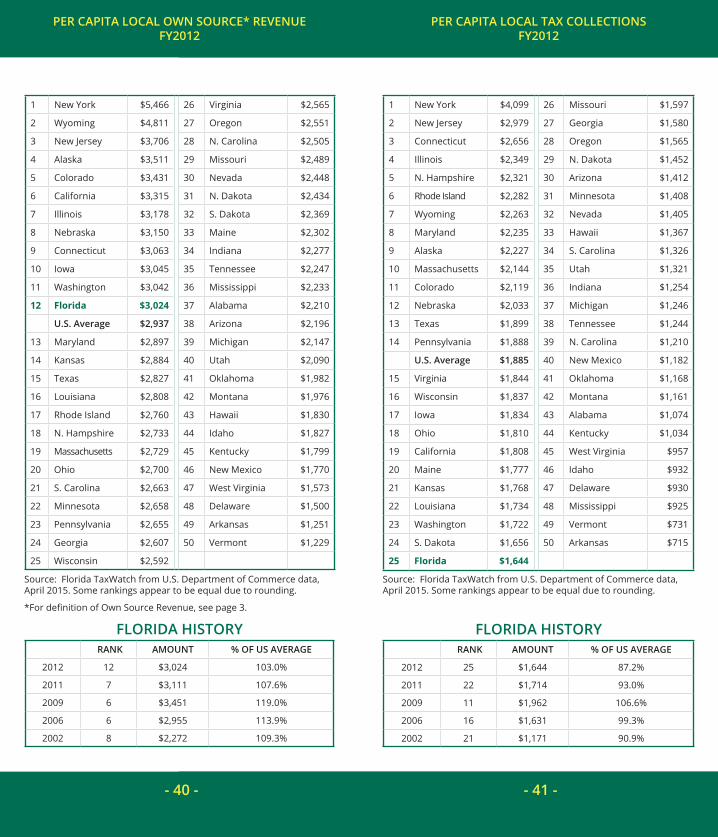
Local Taxes. Florida ranks 12th nationally in “Per Capita Local Own Source Revenue” (see p. 40), and 25th in “Per Capita Local Tax Collections” (see p. 41). Florida’s “Per Capita Local Tax Collections” equal 7.3 percent of the average Floridian’s personal income, ranking Florida 5th among the states and higher than the national average of 6.6 percent.
Florida’s local government rankings are generally much higher than the state government rankings largely due to the fact that Florida relies more heavily on local governments to fund public services than any other state. In fact, more than half (54.8 percent) of all government revenues in Florida are raised by local governments, which is the highest percentage in the nation (see p. 14). Despite this reliance, falling property tax collections have lowered Florida’s rankings.
introduction & overview
* Per capita amounts are calculated using state population estimates from the U.S. Census Bureau. Fiscal year (FY) population is estimated by averaging the July 1 population for the two years that contain the FY. For example FY2013 is the average between July 1, 2012 and July 1, 2013.
** “Own source revenue” is a broader measure of the financial burden citizens incur to pay for their government. It includes all direct revenue except for intergovernmental aid, revenue from government-owned utilities and liquor stores, and social insur-ance funds. It also includes non-tax revenue such as charges for services, special assessments, impact fees, and net lottery revenue. The revenue Florida reports to the U.S. Census Bureau as taxes is much lower than official state data.
*** Fiscal years in this pocket guide refer to the fiscal years of each state, which may vary slightly. Florida’s fiscal year runs from July 1 - June 30.
- 4 - - 5 -
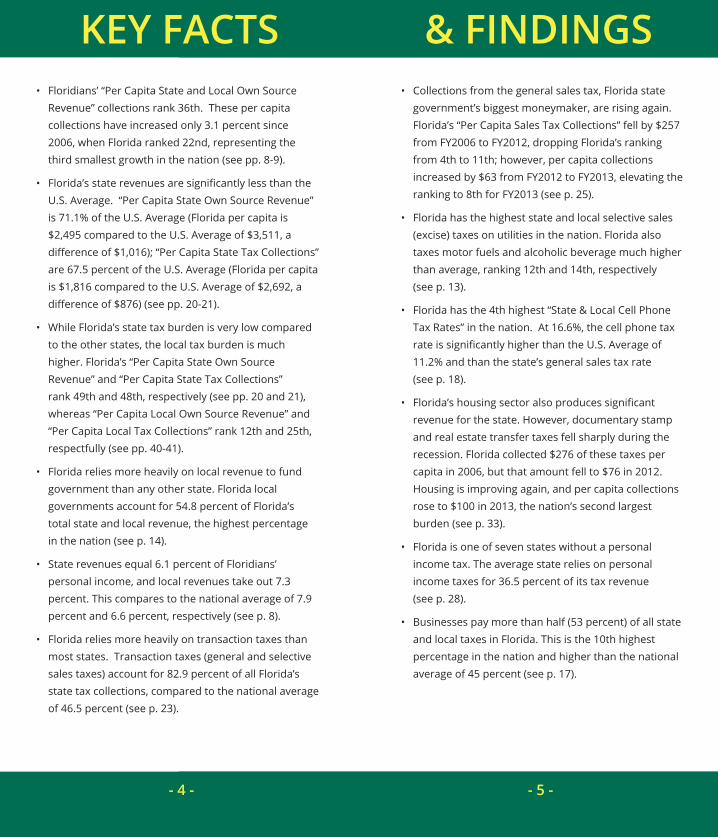
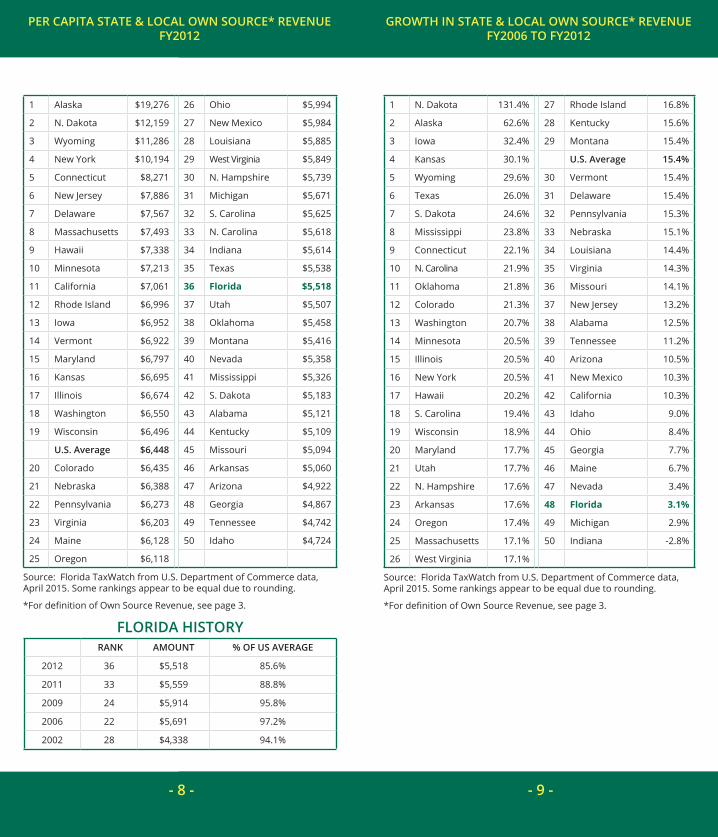
• Floridians’ “Per Capita State and Local Own Source Revenue” collections rank 36th. These per capita collections have increased only 3.1 percent since 2006, when Florida ranked 22nd, representing the third smallest growth in the nation (see pp. 8-9).
• Florida’s state revenues are significantly less than the U.S. Average. “Per Capita State Own Source Revenue” is 71.1% of the U.S. Average (Florida per capita is $2,495 compared to the U.S. Average of $3,511, a difference of $1,016); “Per Capita State Tax Collections” are 67.5 percent of the U.S. Average (Florida per capita is $1,816 compared to the U.S. Average of $2,692, a difference of $876) (see pp. 20-21).
• While Florida’s state tax burden is very low compared to the other states, the local tax burden is much higher. Florida’s “Per Capita State Own Source Revenue” and “Per Capita State Tax Collections” rank 49th and 48th, respectively (see pp. 20 and 21), whereas “Per Capita Local Own Source Revenue” and “Per Capita Local Tax Collections” rank 12th and 25th, respectfully (see pp. 40-41).
• Florida relies more heavily on local revenue to fund government than any other state. Florida local governments account for 54.8 percent of Florida’s total state and local revenue, the highest percentage in the nation (see p. 14).
• State revenues equal 6.1 percent of Floridians’ personal income, and local revenues take out 7.3 percent. This compares to the national average of 7.9 percent and 6.6 percent, respectively (see p. 8).
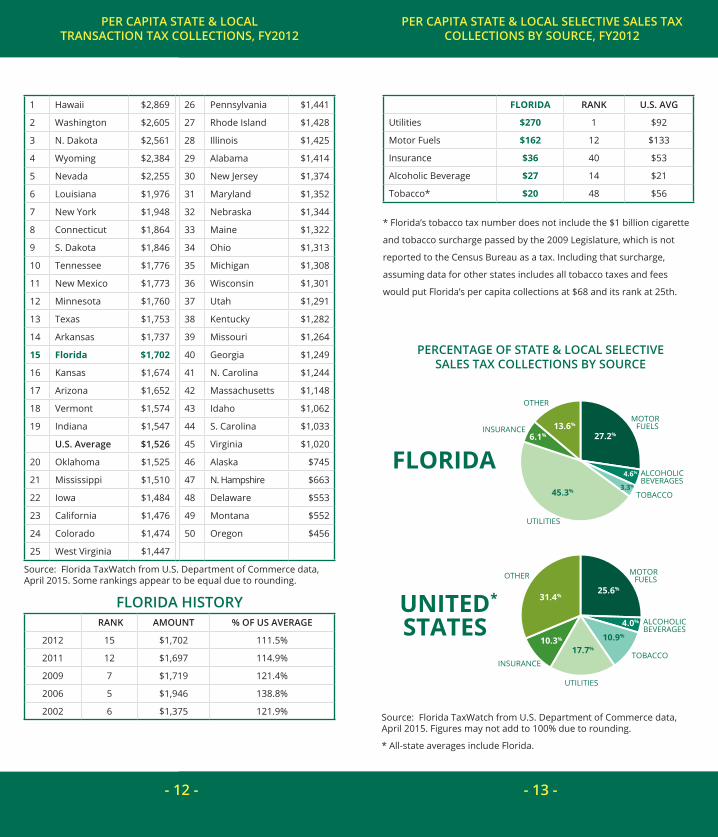
• Florida relies more heavily on transaction taxes than most states. Transaction taxes (general and selective sales taxes) account for 82.9 percent of all Florida’s state tax collections, compared to the national average of 46.5 percent (see p. 23).
Key facts• Collections from the general sales tax, Florida state
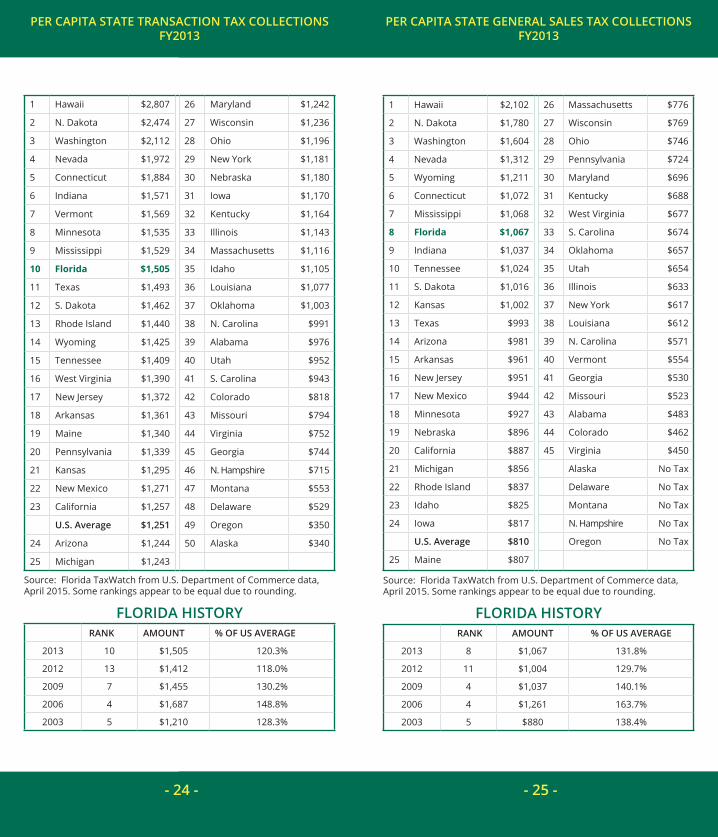
government’s biggest moneymaker, are rising again. Florida’s “Per Capita Sales Tax Collections” fell by $257 from FY2006 to FY2012, dropping Florida’s ranking from 4th to 11th; however, per capita collections increased by $63 from FY2012 to FY2013, elevating the ranking to 8th for FY2013 (see p. 25).
• Florida has the highest state and local selective sales (excise) taxes on utilities in the nation. Florida also taxes motor fuels and alcoholic beverage much higher than average, ranking 12th and 14th, respectively (see p. 13).
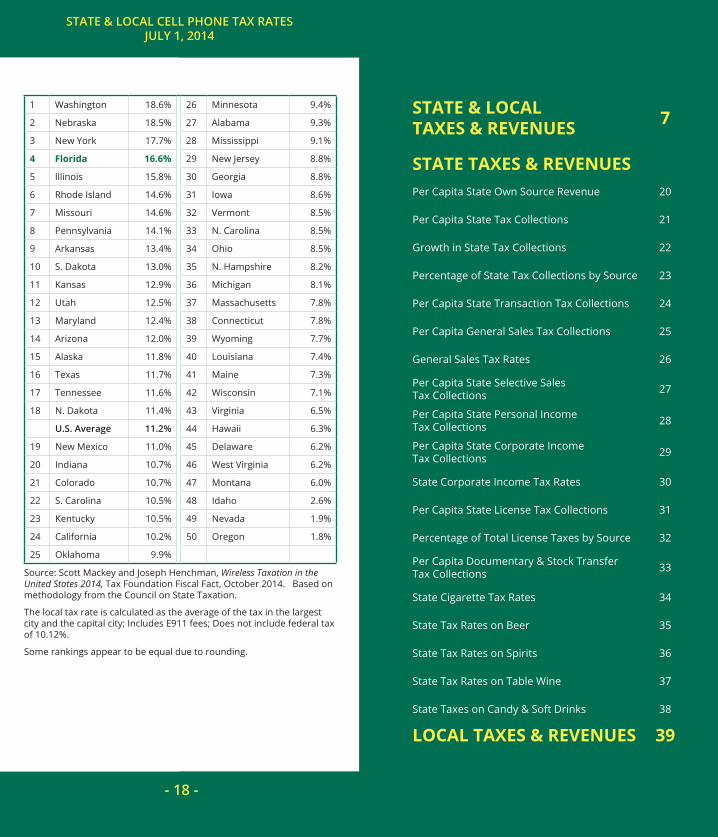
• Florida has the 4th highest “State & Local Cell Phone Tax Rates” in the nation. At 16.6%, the cell phone tax rate is significantly higher than the U.S. Average of 11.2% and than the state’s general sales tax rate (see p. 18).
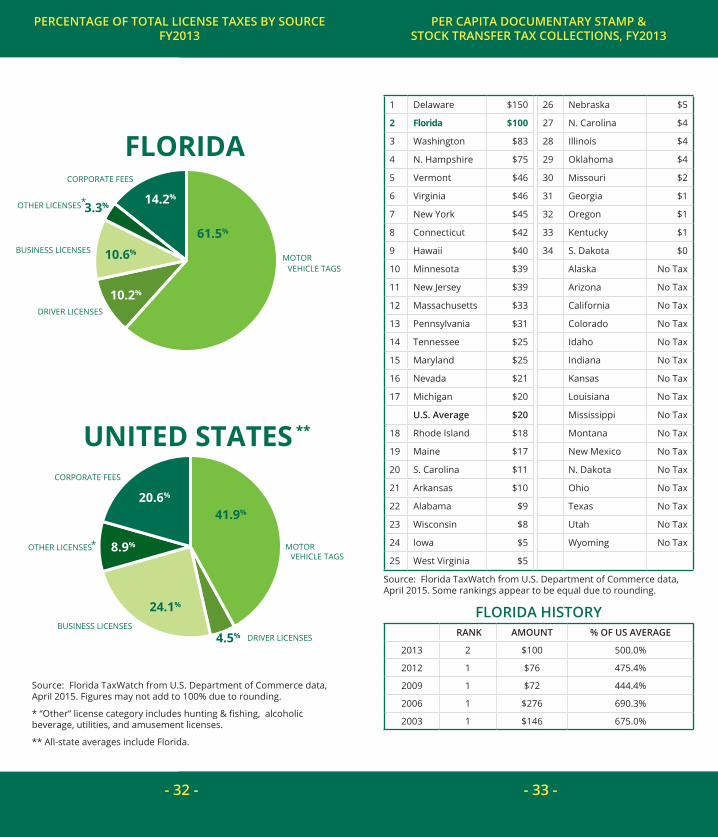
• Florida’s housing sector also produces significant revenue for the state. However, documentary stamp and real estate transfer taxes fell sharply during the recession. Florida collected $276 of these taxes per capita in 2006, but that amount fell to $76 in 2012. Housing is improving again, and per capita collections rose to $100 in 2013, the nation’s second largest burden (see p. 33).
• Florida is one of seven states without a personal income tax. The average state relies on personal income taxes for 36.5 percent of its tax revenue (see p. 28).
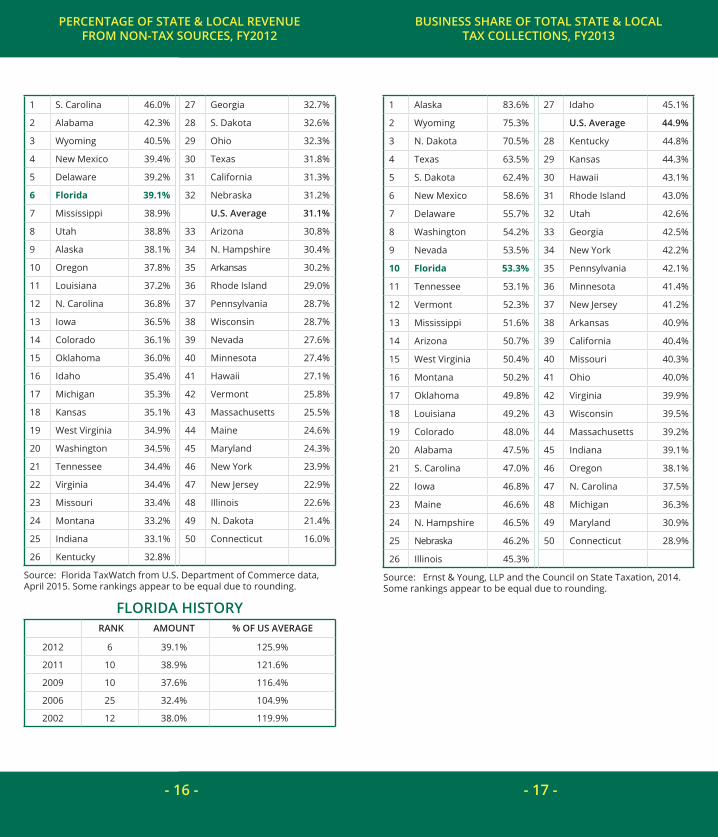
• Businesses pay more than half (53 percent) of all state and local taxes in Florida. This is the 10th highest percentage in the nation and higher than the national average of 45 percent (see p. 17).
& findings

- 6 - - 7 -
state and local (fy2012)florida ranK1 u.s.
avg.
Own Source Revenue2 $5,518 36 $6,448
Total Taxes $3,360 44 $4,445
Transaction Taxes3 $1,702 15 $1,526
state (fy2013)
Own Source Revenue4 $2,495 49 $3,511
Total Taxes $1,816 48 $2,692
General Sales Taxes $1,067 8 $810
Selective Taxes $438 27 $442
Transaction Taxes $1,505 10 $1,251
Documentary Stamp Taxes $100 2 $20
License Taxes $102 39 $176
Corporate Income Taxes $106 35 $143
Personal Income Taxes No Tax No Tax $984
local (fy2012)
Own Source Revenue $3,024 12 $2,937
Taxes $1,644 25 $1,885
Property Taxes $1,279 22 $1,386
Transaction Taxes $284 24 $314
percentage of state & local revenue from local sources 54.8% 1 45.5%
revenue per $1000 personal income
State and Local $13.38 39 $14.51
State $6.05 48 $7.90
Local $7.33 5 $6.61
Source: Florida TaxWatch from U.S. Department of Commerce data, April 2015.
Figures are per capita except where noted. Per capita amounts are calculated using state population estimates from the U.S. Census Bureau. Fiscal year (FY) population is estimated by averaging the July 1 population for the two years that contain the FY. For example FY2013 is the average between July 1, 2012 and July 1, 2013.
1 Rankings out of 50 states, does not include the District of Columbia.
2 See definition of “Own Source Revenue” on page 3.
3 Transaction taxes are the total of general sales and selective sales (excise) taxes.
4 State Own Source Revenue data is for FY2012, all state tax data is FY2013.
summary of tax ranKings
STaTe & LocaL TaxeS & revenuePer Capita State & Local Own Source Revenue 8
Growth in State & Local Own Source Revenue 9
State & Local Revenue by Source 10
Per Capita State & Local Tax Collections 11
Per Capita State & Local Transaction Tax Collections 12
State & Local Selective Sales Tax Collectionsby Source 13
Percentage of State & Local Revenue from Local Sources 14
Percentage of State & Local Tax Collections from Local Sources 15
Percentage of State & Local Revenue from Non-Tax Sources 16
Business Share of Total State & Local Tax Collections 17
State & Local Cell Phone Tax Rates 18
STaTe TaxeS & revenueS 19
LocaL TaxeS & revenueS 39
- 8 - - 9 -
1 Alaska $19,276 26 Ohio $5,994
2 N. Dakota $12,159 27 New Mexico $5,984
3 Wyoming $11,286 28 Louisiana $5,885
4 New York $10,194 29 West Virginia $5,849
5 Connecticut $8,271 30 N. Hampshire $5,739
6 New Jersey $7,886 31 Michigan $5,671
7 Delaware $7,567 32 S. Carolina $5,625
8 Massachusetts $7,493 33 N. Carolina $5,618
9 Hawaii $7,338 34 Indiana $5,614
10 Minnesota $7,213 35 Texas $5,538
11 California $7,061 36 Florida $5,518
12 Rhode Island $6,996 37 Utah $5,507
13 Iowa $6,952 38 Oklahoma $5,458
14 Vermont $6,922 39 Montana $5,416
15 Maryland $6,797 40 Nevada $5,358
16 Kansas $6,695 41 Mississippi $5,326
17 Illinois $6,674 42 S. Dakota $5,183
18 Washington $6,550 43 Alabama $5,121
19 Wisconsin $6,496 44 Kentucky $5,109
u.s. average $6,448 45 Missouri $5,094
20 Colorado $6,435 46 Arkansas $5,060
21 Nebraska $6,388 47 Arizona $4,922
22 Pennsylvania $6,273 48 Georgia $4,867
23 Virginia $6,203 49 Tennessee $4,742
24 Maine $6,128 50 Idaho $4,724
25 Oregon $6,118
Source: Florida TaxWatch from U.S. Department of Commerce data, April 2015. Some rankings appear to be equal due to rounding.
*For definition of Own Source Revenue, see page 3.
florida History ranK amount % of us average
2012 36 $5,518 85.6%
2011 33 $5,559 88.8%
2009 24 $5,914 95.8%
2006 22 $5,691 97.2%
2002 28 $4,338 94.1%
per capita state & local own source* revenue fy2012
1 N. Dakota 131.4% 27 Rhode Island 16.8%
2 Alaska 62.6% 28 Kentucky 15.6%
3 Iowa 32.4% 29 Montana 15.4%
4 Kansas 30.1% u.s. average 15.4%
5 Wyoming 29.6% 30 Vermont 15.4%
6 Texas 26.0% 31 Delaware 15.4%
7 S. Dakota 24.6% 32 Pennsylvania 15.3%
8 Mississippi 23.8% 33 Nebraska 15.1%
9 Connecticut 22.1% 34 Louisiana 14.4%
10 N. Carolina 21.9% 35 Virginia 14.3%
11 Oklahoma 21.8% 36 Missouri 14.1%
12 Colorado 21.3% 37 New Jersey 13.2%
13 Washington 20.7% 38 Alabama 12.5%
14 Minnesota 20.5% 39 Tennessee 11.2%
15 Illinois 20.5% 40 Arizona 10.5%
16 New York 20.5% 41 New Mexico 10.3%
17 Hawaii 20.2% 42 California 10.3%
18 S. Carolina 19.4% 43 Idaho 9.0%
19 Wisconsin 18.9% 44 Ohio 8.4%
20 Maryland 17.7% 45 Georgia 7.7%
21 Utah 17.7% 46 Maine 6.7%
22 N. Hampshire 17.6% 47 Nevada 3.4%
23 Arkansas 17.6% 48 Florida 3.1%
24 Oregon 17.4% 49 Michigan 2.9%
25 Massachusetts 17.1% 50 Indiana -2.8%
26 West Virginia 17.1%
Source: Florida TaxWatch from U.S. Department of Commerce data, April 2015. Some rankings appear to be equal due to rounding.
*For definition of Own Source Revenue, see page 3.
growtH in state & local own source* revenue fy2006 to fy2012

- 10 - - 11 -
TOTAL STATE AND LOCAL REVENUE BY SOURCE
state & local revenue by sourcefy2012
1 Alaska $11,926 26 N. Hampshire $3,994
2 N. Dakota $9,556 27 Nevada $3,880
3 New York $7,756 28 West Virginia $3,806
4 Connecticut $6,949 29 Oregon $3,805
5 Wyoming $6,720 30 Texas $3,777
6 New Jersey $6,078 31 Indiana $3,756
7 Massachusetts $5,584 32 Louisiana $3,693
8 Hawaii $5,349 33 Michigan $3,667
9 Minnesota $5,240 34 New Mexico $3,629
10 Illinois $5,167 35 Montana $3,617
11 Maryland $5,148 36 N. Carolina $3,552
12 Vermont $5,134 37 Arkansas $3,531
13 Rhode Island $4,969 38 Oklahoma $3,493
14 California $4,848 39 S. Dakota $3,491
15 Wisconsin $4,635 40 Kentucky $3,434
16 Maine $4,621 41 Arizona $3,407
17 Delaware $4,599 42 Missouri $3,392
18 Pennsylvania $4,471 43 Utah $3,371
u.s. average $4,445 44 Florida $3,360
19 Iowa $4,417 45 Georgia $3,275
20 Nebraska $4,395 46 Mississippi $3,257
21 Kansas $4,346 47 Tennessee $3,108
22 Washington $4,291 48 Idaho $3,054
23 Colorado $4,109 49 S. Carolina $3,037
24 Virginia $4,070 50 Alabama $2,956
25 Ohio $4,055
Source: Florida TaxWatch from U.S. Department of Commerce data, April 2015. Some rankings appear to be equal due to rounding.
florida History ranK amount % of us average
2012 44 $3,360 75.6%
2011 37 $3,420 79.8%
2009 30 $3,691 88.4%
2006 22 $3,850 95.2%
2002 34 $2,691 85.4%
per capita state & local tax collections fy2012
Source: Florida TaxWatch from U.S. Department of Commerce data, April 2015. Figures may not add to 100% due to rounding.
* All-state averages include Florida.
*
- 12 - - 13 -
1 Hawaii $2,869 26 Pennsylvania $1,441
2 Washington $2,605 27 Rhode Island $1,428
3 N. Dakota $2,561 28 Illinois $1,425
4 Wyoming $2,384 29 Alabama $1,414
5 Nevada $2,255 30 New Jersey $1,374
6 Louisiana $1,976 31 Maryland $1,352
7 New York $1,948 32 Nebraska $1,344
8 Connecticut $1,864 33 Maine $1,322
9 S. Dakota $1,846 34 Ohio $1,313
10 Tennessee $1,776 35 Michigan $1,308
11 New Mexico $1,773 36 Wisconsin $1,301
12 Minnesota $1,760 37 Utah $1,291
13 Texas $1,753 38 Kentucky $1,282
14 Arkansas $1,737 39 Missouri $1,264
15 Florida $1,702 40 Georgia $1,249
16 Kansas $1,674 41 N. Carolina $1,244
17 Arizona $1,652 42 Massachusetts $1,148
18 Vermont $1,574 43 Idaho $1,062
19 Indiana $1,547 44 S. Carolina $1,033
u.s. average $1,526 45 Virginia $1,020
20 Oklahoma $1,525 46 Alaska $745
21 Mississippi $1,510 47 N. Hampshire $663
22 Iowa $1,484 48 Delaware $553
23 California $1,476 49 Montana $552
24 Colorado $1,474 50 Oregon $456
25 West Virginia $1,447
Source: Florida TaxWatch from U.S. Department of Commerce data, April 2015. Some rankings appear to be equal due to rounding.
florida History ranK amount % of us average
2012 15 $1,702 111.5%
2011 12 $1,697 114.9%
2009 7 $1,719 121.4%
2006 5 $1,946 138.8%
2002 6 $1,375 121.9%
per capita state & local transaction tax collections, fy2012
PERCENTAGE OF STATE & LOCAL SELECTIVE SALES TAXES BY SOURCE
per capita state & local selective sales tax collections by source, fy2012
FLorida ranK u.s. avg
Utilities $270 1 $92
Motor Fuels $162 12 $133
Insurance $36 40 $53
Alcoholic Beverage $27 14 $21
Tobacco* $20 48 $56
* Florida’s tobacco tax number does not include the $1 billion cigarette
and tobacco surcharge passed by the 2009 Legislature, which is not
reported to the Census Bureau as a tax. Including that surcharge,
assuming data for other states includes all tobacco taxes and fees
would put Florida’s per capita collections at $68 and its rank at 25th.
percentage of state & local selective sales tax collections by source
Source: Florida TaxWatch from U.S. Department of Commerce data, April 2015. Figures may not add to 100% due to rounding.
* All-state averages include Florida.
*

- 14 - - 15 -
1 Florida 54.8% 26 Pennsylvania 42.3%
2 New York 53.6% 27 Mississippi 41.9%
3 Georgia 53.6% 28 Oregon 41.7%
4 Colorado 53.3% 29 Virginia 41.3%
5 Texas 51.0% 30 Indiana 40.6%
6 Nebraska 49.3% 31 Wisconsin 39.9%
7 Missouri 48.9% 32 Rhode Island 39.5%
8 Louisiana 47.7% 33 Idaho 38.7%
9 N. Hampshire 47.6% 34 Utah 38.0%
10 Illinois 47.6% 35 Michigan 37.9%
11 Tennessee 47.4% 36 Maine 37.6%
12 S. Carolina 47.3% 37 Connecticut 37.0%
13 New Jersey 47.0% 38 Minnesota 36.9%
14 California 46.9% 39 Montana 36.5%
15 Washington 46.4% 40 Massachusetts 36.4%
16 S. Dakota 45.7% 41 Oklahoma 36.3%
17 Nevada 45.7% 42 Kentucky 35.2%
u.s. average 45.5% 43 New Mexico 29.6%
18 Ohio 45.0% 44 West Virginia 26.9%
19 Arizona 44.6% 45 Hawaii 24.9%
20 N. Carolina 44.6% 46 Arkansas 24.7%
21 Iowa 43.8% 47 N. Dakota 20.0%
22 Alabama 43.2% 48 Delaware 19.8%
23 Kansas 43.1% 49 Alaska 18.2%
24 Wyoming 42.6% 50 Vermont 17.8%
25 Maryland 42.6%
Source: Florida TaxWatch from U.S. Department of Commerce data, April 2015. Some rankings appear to be equal due to rounding.
florida History ranK amount % of us average
2012 1 54.8% 120.3%
2011 2 55.6% 121.2%
2009 1 58.4% 124.3%
2006 3 51.9% 117.2%
2002 4 52.4% 116.2%
percentage of state & local revenue from local sources, fy2012
1 N. Hampshire 58.1% 26 Utah 39.2%
2 New York 52.8% 27 Maine 38.5%
3 Colorado 51.6% 28 Massachusetts 38.4%
4 Texas 50.3% 29 Connecticut 38.2%
5 New Jersey 49.0% 30 California 37.3%
6 Florida 48.9% 31 Alabama 36.3%
7 Georgia 48.3% 32 Nevada 36.2%
8 S. Dakota 47.4% 33 N. Carolina 34.1%
9 Missouri 47.1% 34 Michigan 34.0%
10 Louisiana 47.0% 35 Wyoming 33.7%
11 Nebraska 46.3% 36 Oklahoma 33.4%
12 Rhode Island 45.9% 37 Indiana 33.4%
13 Illinois 45.5% 38 New Mexico 32.6%
14 Virginia 45.3% 39 Montana 32.1%
15 Ohio 44.6% 40 Idaho 30.5%
16 S. Carolina 43.7% 41 Kentucky 30.1%
17 Maryland 43.4% 42 Mississippi 28.4%
u.s. average 42.4% 43 Minnesota 26.9%
18 Pennsylvania 42.2% 44 Hawaii 25.6%
19 Iowa 41.5% 45 West Virginia 25.1%
20 Arizona 41.4% 46 Arkansas 20.3%
21 Oregon 41.1% 47 Delaware 20.2%
22 Kansas 40.7% 48 Alaska 18.7%
23 Washington 40.1% 49 N. Dakota 15.2%
24 Tennessee 40.0% 50 Vermont 14.2%
25 Wisconsin 39.6%
Source: Florida TaxWatch from U.S. Department of Commerce data, April 2015. Some rankings appear to be equal due to rounding.
florida History ranK amount % of us average
2012 6 48.9% 115.36%
2011 5 50.1% 116.6%
2009 3 53.2% 120.6%
2006 13 42.4% 104.4%
2002 12 43.5% 106.4%
percentage of state & local tax collectionsfrom local sources, fy2012
- 16 - - 17 -
1 S. Carolina 46.0% 27 Georgia 32.7%
2 Alabama 42.3% 28 S. Dakota 32.6%
3 Wyoming 40.5% 29 Ohio 32.3%
4 New Mexico 39.4% 30 Texas 31.8%
5 Delaware 39.2% 31 California 31.3%
6 Florida 39.1% 32 Nebraska 31.2%
7 Mississippi 38.9% u.s. average 31.1%
8 Utah 38.8% 33 Arizona 30.8%
9 Alaska 38.1% 34 N. Hampshire 30.4%
10 Oregon 37.8% 35 Arkansas 30.2%
11 Louisiana 37.2% 36 Rhode Island 29.0%
12 N. Carolina 36.8% 37 Pennsylvania 28.7%
13 Iowa 36.5% 38 Wisconsin 28.7%
14 Colorado 36.1% 39 Nevada 27.6%
15 Oklahoma 36.0% 40 Minnesota 27.4%
16 Idaho 35.4% 41 Hawaii 27.1%
17 Michigan 35.3% 42 Vermont 25.8%
18 Kansas 35.1% 43 Massachusetts 25.5%
19 West Virginia 34.9% 44 Maine 24.6%
20 Washington 34.5% 45 Maryland 24.3%
21 Tennessee 34.4% 46 New York 23.9%
22 Virginia 34.4% 47 New Jersey 22.9%
23 Missouri 33.4% 48 Illinois 22.6%
24 Montana 33.2% 49 N. Dakota 21.4%
25 Indiana 33.1% 50 Connecticut 16.0%
26 Kentucky 32.8%
Source: Florida TaxWatch from U.S. Department of Commerce data, April 2015. Some rankings appear to be equal due to rounding.
florida History ranK amount % of us average
2012 6 39.1% 125.9%
2011 10 38.9% 121.6%
2009 10 37.6% 116.4%
2006 25 32.4% 104.9%
2002 12 38.0% 119.9%
percentage of state & local revenuefrom non-tax sources, fy2012
1 Alaska 83.6% 27 Idaho 45.1%
2 Wyoming 75.3% u.s. average 44.9%
3 N. Dakota 70.5% 28 Kentucky 44.8%
4 Texas 63.5% 29 Kansas 44.3%
5 S. Dakota 62.4% 30 Hawaii 43.1%
6 New Mexico 58.6% 31 Rhode Island 43.0%
7 Delaware 55.7% 32 Utah 42.6%
8 Washington 54.2% 33 Georgia 42.5%
9 Nevada 53.5% 34 New York 42.2%
10 Florida 53.3% 35 Pennsylvania 42.1%
11 Tennessee 53.1% 36 Minnesota 41.4%
12 Vermont 52.3% 37 New Jersey 41.2%
13 Mississippi 51.6% 38 Arkansas 40.9%
14 Arizona 50.7% 39 California 40.4%
15 West Virginia 50.4% 40 Missouri 40.3%
16 Montana 50.2% 41 Ohio 40.0%
17 Oklahoma 49.8% 42 Virginia 39.9%
18 Louisiana 49.2% 43 Wisconsin 39.5%
19 Colorado 48.0% 44 Massachusetts 39.2%
20 Alabama 47.5% 45 Indiana 39.1%
21 S. Carolina 47.0% 46 Oregon 38.1%
22 Iowa 46.8% 47 N. Carolina 37.5%
23 Maine 46.6% 48 Michigan 36.3%
24 N. Hampshire 46.5% 49 Maryland 30.9%
25 Nebraska 46.2% 50 Connecticut 28.9%
26 Illinois 45.3%
Source: Ernst & Young, LLP and the Council on State Taxation, 2014. Some rankings appear to be equal due to rounding.
business sHare of total state & local tax collections, fy2013
- 18 - - 19 -
1 Washington 18.6% 26 Minnesota 9.4%
2 Nebraska 18.5% 27 Alabama 9.3%
3 New York 17.7% 28 Mississippi 9.1%
4 Florida 16.6% 29 New Jersey 8.8%
5 Illinois 15.8% 30 Georgia 8.8%
6 Rhode Island 14.6% 31 Iowa 8.6%
7 Missouri 14.6% 32 Vermont 8.5%
8 Pennsylvania 14.1% 33 N. Carolina 8.5%
9 Arkansas 13.4% 34 Ohio 8.5%
10 S. Dakota 13.0% 35 N. Hampshire 8.2%
11 Kansas 12.9% 36 Michigan 8.1%
12 Utah 12.5% 37 Massachusetts 7.8%
13 Maryland 12.4% 38 Connecticut 7.8%
14 Arizona 12.0% 39 Wyoming 7.7%
15 Alaska 11.8% 40 Louisiana 7.4%
16 Texas 11.7% 41 Maine 7.3%
17 Tennessee 11.6% 42 Wisconsin 7.1%
18 N. Dakota 11.4% 43 Virginia 6.5%
u.s. average 11.2% 44 Hawaii 6.3%
19 New Mexico 11.0% 45 Delaware 6.2%
20 Indiana 10.7% 46 West Virginia 6.2%
21 Colorado 10.7% 47 Montana 6.0%
22 S. Carolina 10.5% 48 Idaho 2.6%
23 Kentucky 10.5% 49 Nevada 1.9%
24 California 10.2% 50 Oregon 1.8%
25 Oklahoma 9.9%
Source: Scott Mackey and Joseph Henchman, Wireless Taxation in the United States 2014, Tax Foundation Fiscal Fact, October 2014. Based on methodology from the Council on State Taxation.
The local tax rate is calculated as the average of the tax in the largest city and the capital city; Includes E911 fees; Does not include federal tax of 10.12%.
Some rankings appear to be equal due to rounding.
state & local cell pHone tax ratesjuly 1, 2014
STaTe & LocaL TaxeS & revenueS 7
STaTe TaxeS & revenueSPer Capita State Own Source Revenue 20
Per Capita State Tax Collections 21
Growth in State Tax Collections 22
Percentage of State Tax Collections by Source 23
Per Capita State Transaction Tax Collections 24
Per Capita General Sales Tax Collections 25
General Sales Tax Rates 26
Per Capita State Selective Sales Tax Collections 27
Per Capita State Personal Income Tax Collections 28
Per Capita State Corporate Income Tax Collections 29
State Corporate Income Tax Rates 30
Per Capita State License Tax Collections 31
Percentage of Total License Taxes by Source 32
Per Capita Documentary & Stock Transfer Tax Collections 33
State Cigarette Tax Rates 34
State Tax Rates on Beer 35
State Tax Rates on Spirits 36
State Tax Rates on Table Wine 37
State Taxes on Candy & Soft Drinks 38
LocaL TaxeS & revenueS 39

- 20 - - 21 -
per capita state own source* revenue fy2012
1 Alaska $15,764 26 Washington $3,508
2 N. Dakota $9,725 27 Illinois $3,497
3 Wyoming $6,474 28 Oklahoma $3,476
4 Delaware $6,068 29 Montana $3,440
5 Vermont $5,693 30 Utah $3,417
6 Hawaii $5,508 31 Indiana $3,338
7 Connecticut $5,208 32 Kentucky $3,310
8 Massachusetts $4,764 33 Ohio $3,294
9 New York $4,728 34 Nebraska $3,238
10 Minnesota $4,555 35 N. Carolina $3,114
11 West Virginia $4,276 36 Mississippi $3,093
12 Rhode Island $4,236 37 Louisiana $3,077
13 New Mexico $4,214 38 N. Hampshire $3,006
14 New Jersey $4,180 39 Colorado $3,004
15 Iowa $3,907 40 S. Carolina $2,962
16 Wisconsin $3,905 41 Alabama $2,911
17 Maryland $3,900 42 Nevada $2,910
18 Maine $3,826 43 Idaho $2,898
19 Kansas $3,811 44 S. Dakota $2,814
20 Arkansas $3,810 45 Arizona $2,726
21 California $3,747 46 Texas $2,711
22 Virginia $3,638 47 Missouri $2,604
23 Pennsylvania $3,619 48 Tennessee $2,495
24 Oregon $3,567 49 Florida $2,495
25 Michigan $3,524 50 Georgia $2,260
u.s. average $3,511
Source: Florida TaxWatch from U.S. Department of Commerce data, April 2015. Some rankings appear to be equal due to rounding.
* For definition of “Own Source Revenue” see p. 3.
florida History ranK amount % of us average
2012 49 $2,495 71.1%
2011 48 $2,489 72.9%
2009 46 $2,463 75.3%
2006 41 $2,736 83.9%
2002 45 $2,065 81.6%
1 N. Dakota $7,434 26 Nebraska $2,534
2 Alaska $6,991 27 Nevada $2,534
3 Vermont $4,595 28 Michigan $2,521
4 Connecticut $4,501 29 New Mexico $2,494
5 Hawaii $4,349 30 Mississippi $2,477
6 Minnesota $3,894 31 Kentucky $2,463
7 Wyoming $3,769 32 N. Carolina $2,426
8 New York $3,749 33 Ohio $2,380
9 Delaware $3,633 34 Oregon $2,341
10 Massachusetts $3,577 35 Virginia $2,331
11 California $3,482 36 Oklahoma $2,319
12 New Jersey $3,269 37 Idaho $2,231
13 Maryland $3,063 38 Utah $2,197
14 Illinois $3,006 39 Colorado $2,149
15 Maine $2,924 40 Arizona $2,043
16 Arkansas $2,907 41 Louisiana $1,998
17 West Virginia $2,899 42 Texas $1,966
18 Wisconsin $2,880 43 Alabama $1,920
19 Rhode Island $2,792 44 Tennessee $1,910
20 Iowa $2,715 45 Missouri $1,846
u.s. average $2,692 46 S. Carolina $1,837
21 Washington $2,692 47 S. Dakota $1,826
22 Pennsylvania $2,659 48 Florida $1,816
23 Kansas $2,636 49 Georgia $1,787
24 Montana $2,618 50 N. Hampshire $1,777
25 Indiana $2,583
Source: Florida TaxWatch from U.S. Department of Commerce data, April 2015. Some rankings appear to be equal due to rounding.
florida History ranK amount % of us average
2013 48 $1,816 67.5%
2012 47 $1,708 67.3%
2009 41 $1,729 74.3%
2006 31 $2,219 92.3%
2003 40 $1,588 83.9%
per capita state tax collections fy2013
- 22 - - 23 -
1 N. Dakota 226.7% 26 Pennsylvania 16.9%
2 Alaska 106.6% 27 Tennessee 16.0%
3 Texas 41.3% 28 Utah 15.8%
4 Illinois 38.0% 29 N. Carolina 15.4%
5 Iowa 36.9% 30 Nevada 14.2%
6 Connecticut 33.4% 31 Idaho 13.9%
7 Colorado 31.8% 32 Oklahoma 13.8%
8 S. Dakota 29.0% 33 Washington 13.7%
9 New York 28.3% 34 N. Hampshire 12.9%
10 Maryland 24.5% 35 S. Carolina 12.4%
11 Montana 24.4% 36 Kentucky 11.3%
12 Indiana 24.3% 37 Virginia 11.0%
13 Hawaii 23.9% 38 New Jersey 10.7%
14 Mississippi 23.6% 39 Missouri 9.4%
15 Massachusetts 23.1% 40 Alabama 8.7%
16 Arkansas 22.4% 41 Ohio 8.3%
17 Kansas 21.4% 42 Maine 7.9%
18 Minnesota 21.4% 43 Rhode Island 7.2%
19 Oregon 20.7% 44 Michigan 5.2%
20 Wisconsin 19.7% 45 Georgia 4.5%
21 Vermont 19.6% 46 Wyoming 3.0%
22 California 19.6% 47 New Mexico 1.8%
23 Nebraska 19.1% 48 Arizona 0.9%
u.s. average 18.3% 49 Louisiana -5.4%
24 West Virginia 18.3% 50 Florida -11.8%
25 Delaware 17.0%
Source: Florida TaxWatch from U.S. Department of Commerce data, April 2015. Some rankings appear to be equal due to rounding.
growtH in state tax collectionsfy2006 to fy2013
percentage of state tax collections by source, fy2013
Source: Florida TaxWatch from U.S. Department of Commerce data, April 2015. Figures may not add to 100% due to rounding.
* All-state averages include Florida.
*
- 24 - - 25 -
1 Hawaii $2,807 26 Maryland $1,242
2 N. Dakota $2,474 27 Wisconsin $1,236
3 Washington $2,112 28 Ohio $1,196
4 Nevada $1,972 29 New York $1,181
5 Connecticut $1,884 30 Nebraska $1,180
6 Indiana $1,571 31 Iowa $1,170
7 Vermont $1,569 32 Kentucky $1,164
8 Minnesota $1,535 33 Illinois $1,143
9 Mississippi $1,529 34 Massachusetts $1,116
10 Florida $1,505 35 Idaho $1,105
11 Texas $1,493 36 Louisiana $1,077
12 S. Dakota $1,462 37 Oklahoma $1,003
13 Rhode Island $1,440 38 N. Carolina $991
14 Wyoming $1,425 39 Alabama $976
15 Tennessee $1,409 40 Utah $952
16 West Virginia $1,390 41 S. Carolina $943
17 New Jersey $1,372 42 Colorado $818
18 Arkansas $1,361 43 Missouri $794
19 Maine $1,340 44 Virginia $752
20 Pennsylvania $1,339 45 Georgia $744
21 Kansas $1,295 46 N. Hampshire $715
22 New Mexico $1,271 47 Montana $553
23 California $1,257 48 Delaware $529
u.s. average $1,251 49 Oregon $350
24 Arizona $1,244 50 Alaska $340
25 Michigan $1,243
Source: Florida TaxWatch from U.S. Department of Commerce data, April 2015. Some rankings appear to be equal due to rounding.
florida History ranK amount % of us average
2013 10 $1,505 120.3%
2012 13 $1,412 118.0%
2009 7 $1,455 130.2%
2006 4 $1,687 148.8%
2003 5 $1,210 128.3%
per capita state transaction tax collections fy2013
1 Hawaii $2,102 26 Massachusetts $776
2 N. Dakota $1,780 27 Wisconsin $769
3 Washington $1,604 28 Ohio $746
4 Nevada $1,312 29 Pennsylvania $724
5 Wyoming $1,211 30 Maryland $696
6 Connecticut $1,072 31 Kentucky $688
7 Mississippi $1,068 32 West Virginia $677
8 Florida $1,067 33 S. Carolina $674
9 Indiana $1,037 34 Oklahoma $657
10 Tennessee $1,024 35 Utah $654
11 S. Dakota $1,016 36 Illinois $633
12 Kansas $1,002 37 New York $617
13 Texas $993 38 Louisiana $612
14 Arizona $981 39 N. Carolina $571
15 Arkansas $961 40 Vermont $554
16 New Jersey $951 41 Georgia $530
17 New Mexico $944 42 Missouri $523
18 Minnesota $927 43 Alabama $483
19 Nebraska $896 44 Colorado $462
20 California $887 45 Virginia $450
21 Michigan $856 Alaska No Tax
22 Rhode Island $837 Delaware No Tax
23 Idaho $825 Montana No Tax
24 Iowa $817 N. Hampshire No Tax
u.s. average $810 Oregon No Tax
25 Maine $807
Source: Florida TaxWatch from U.S. Department of Commerce data, April 2015. Some rankings appear to be equal due to rounding.
florida History ranK amount % of us average
2013 8 $1,067 131.8%
2012 11 $1,004 129.7%
2009 4 $1,037 140.1%
2006 4 $1,261 163.7%
2003 5 $880 138.4%
per capita state general sales tax collections fy2013

- 26 - - 27 -
state general sales tax ratesjanuary 2015
1 Vermont $1,015 u.s. average $442
2 Connecticut $812 27 Florida $438
3 N. Hampshire $715 28 New Jersey $421
4 West Virginia $714 29 N. Carolina $421
5 Hawaii $705 30 Arkansas $400
6 N. Dakota $694 31 Michigan $387
7 Nevada $660 32 Tennessee $386
8 Pennsylvania $615 33 California $370
9 Minnesota $607 34 Colorado $356
10 Rhode Island $603 35 Iowa $353
11 New York $565 36 Oregon $350
12 Montana $553 37 Oklahoma $347
13 Maryland $547 38 Alaska $340
14 Indiana $535 39 Massachusetts $340
15 Maine $533 40 New Mexico $327
16 Delaware $529 41 Virginia $302
17 Illinois $509 42 Utah $297
18 Washington $508 43 Kansas $293
19 Texas $500 44 Nebraska $284
20 Alabama $493 45 Idaho $280
21 Kentucky $476 46 Missouri $271
22 Wisconsin $467 47 S. Carolina $269
23 Louisiana $465 48 Arizona $263
24 Mississippi $462 49 Georgia $214
25 Ohio $449 50 Wyoming $213
26 S. Dakota $446
Source: Florida TaxWatch from U.S. Department of Commerce data, April 2015. Some rankings appear to be equal due to rounding.
florida History ranK amount % of us average
2013 27 $438 99.1%
2012 27 $407 96.6%
2009 22 $418 110.6%
2006 19 $426 117.1%
2003 22 $330 107.4%
per capita state selective sales tax collections, fy2013
Source: National Federation of Tax Administrators and Florida TaxWatch, April 2015.

- 28 - - 29 -
1 Connecticut $2,172 26 Arkansas $897
2 New York $2,047 27 Missouri $892
3 Massachusetts $1,927 28 Georgia $881
4 California $1,747 29 Ohio $854
5 Minnesota $1,657 30 Kentucky $848
6 Oregon $1,600 31 Pennsylvania $844
7 New Jersey $1,361 32 Michigan $822
8 Virginia $1,324 33 Idaho $806
9 Maryland $1,301 34 Oklahoma $761
10 Illinois $1,284 35 Indiana $759
11 Wisconsin $1,261 36 S. Carolina $707
12 Hawaii $1,239 37 Alabama $664
13 Delaware $1,227 38 New Mexico $595
14 Maine $1,153 39 Louisiana $593
15 N. Carolina $1,130 40 Mississippi $587
16 Nebraska $1,129 41 Arizona $515
17 Iowa $1,114 42 N. Hampshire $75
18 Vermont $1,058 43 Tennessee $41
19 Colorado $1,057 Alaska No Tax
20 Montana $1,035 Florida no Tax
21 Rhode Island $1,034 Nevada No Tax
22 Kansas $1,023 S. Dakota No Tax
23 Utah $991 Texas No Tax
u.s. average $984 Washington No Tax
24 West Virginia $968 Wyoming No Tax
25 N. Dakota $900
Source: Florida TaxWatch from U.S. Department of Commerce data, April 2015. Some rankings appear to be equal due to rounding.
per capita state personal income tax collections, fy2013
1 Alaska $859 26 N. Carolina $131
2 N. Hampshire $418 27 West Virginia $131
3 Illinois $346 28 Maine $129
4 Delaware $336 29 New Mexico $128
5 N. Dakota $317 30 Idaho $125
6 Massachusetts $283 31 Colorado $125
7 New Jersey $257 32 Indiana $119
8 Minnesota $252 33 Oregon $117
9 New York $250 34 Utah $115
10 California $195 35 Florida $106
11 Tennessee $194 36 Arizona $100
12 Pennsylvania $173 37 Virginia $94
13 Montana $169 38 Michigan $91
14 Vermont $169 39 Hawaii $88
15 Wisconsin $167 40 S. Carolina $81
16 Maryland $161 41 Georgia $80
17 Connecticut $159 42 Alabama $79
18 Oklahoma $153 43 Missouri $63
19 Nebraska $148 44 Louisiana $55
20 Kentucky $147 45 S. Dakota $44
u.s. average $143 46 Ohio $23
21 Mississippi $139 Nevada No Tax
22 Iowa $139 Texas No Tax
23 Rhode Island $137 Washington No Tax
24 Arkansas $136 Wyoming No Tax
25 Kansas $133
Source: Florida TaxWatch from U.S. Department of Commerce data, April 2015. Some rankings appear to be equal due to rounding.
florida History ranK amount % of us average
2013 35 $106 74.1%
2012 32 $104 77.8%
2009 28 $99 77.3%
2006 31 $133 83.5%
2003 21 $72 73.8%
per capita state corporate income tax collections, fy2013

- 30 - - 31 -
state corporate income tax ratesjanuary 2015
1 Delaware $1,367 26 Hawaii $164
2 Montana $318 27 N. Carolina $157
3 S. Dakota $306 28 Michigan $148
4 Ohio $298 29 Massachusetts $142
5 Texas $296 30 Maryland $136
6 N. Dakota $291 31 Kansas $132
7 Wyoming $268 32 Rhode Island $132
8 Oklahoma $263 33 Connecticut $126
9 Iowa $259 34 New Mexico $123
10 Oregon $236 35 Colorado $122
11 California $229 36 Arkansas $121
12 Tennessee $219 37 Indiana $107
13 Minnesota $219 38 Kentucky $105
14 Nevada $212 39 Florida $102
15 Pennsylvania $202 40 Alabama $102
16 Illinois $201 41 Utah $101
17 Maine $196 42 New York $99
18 Washington $196 43 Virginia $98
19 Idaho $191 44 S. Carolina $93
20 N. Hampshire $191 45 Missouri $91
21 Alaska $185 46 Louisiana $80
22 Wisconsin $179 47 Georgia $75
23 Mississippi $177 48 West Virginia $74
u.s. average $176 49 Nebraska $70
24 New Jersey $171 50 Arizona $63
25 Vermont $170
Source: Florida TaxWatch from U.S. Department of Commerce data, April 2015. Some rankings appear to be equal due to rounding.
florida History ranK amount % of us average
2013 39 $102 58.0%
2012 34 $114 66.2%
2009 42 $98 61.3%
2006 37 $105 69.6%
2003 31 $103 83.6%
per capita state license tax collections, fy2013
Source: National Federation of Tax Administrators, Tax Foundation, and Florida TaxWatch, April 2015.
Ohio, Texas and Washington do not levy a coprorate income tax but do levy a gross receipts tax. Delaware and Virginia levy both a corporate income tax and a gross receipts tax.
- 32 - - 33 -
PERCENTAGE OF TOTAL LICENSE TAXES BY SOURCE
percentage of total license taxes by sourcefy2013
1 Delaware $150 26 Nebraska $5
2 Florida $100 27 N. Carolina $4
3 Washington $83 28 Illinois $4
4 N. Hampshire $75 29 Oklahoma $4
5 Vermont $46 30 Missouri $2
6 Virginia $46 31 Georgia $1
7 New York $45 32 Oregon $1
8 Connecticut $42 33 Kentucky $1
9 Hawaii $40 34 S. Dakota $0
10 Minnesota $39 Alaska No Tax
11 New Jersey $39 Arizona No Tax
12 Massachusetts $33 California No Tax
13 Pennsylvania $31 Colorado No Tax
14 Tennessee $25 Idaho No Tax
15 Maryland $25 Indiana No Tax
16 Nevada $21 Kansas No Tax
17 Michigan $20 Louisiana No Tax
u.s. average $20 Mississippi No Tax
18 Rhode Island $18 Montana No Tax
19 Maine $17 New Mexico No Tax
20 S. Carolina $11 N. Dakota No Tax
21 Arkansas $10 Ohio No Tax
22 Alabama $9 Texas No Tax
23 Wisconsin $8 Utah No Tax
24 Iowa $5 Wyoming No Tax
25 West Virginia $5
Source: Florida TaxWatch from U.S. Department of Commerce data, April 2015. Some rankings appear to be equal due to rounding.
florida History ranK amount % of us average
2013 2 $100 500.0%
2012 1 $76 475.4%
2009 1 $72 444.4%
2006 1 $276 690.3%
2003 1 $146 675.0%
per capita documentary stamp & stocK transfer tax collections, fy2013
Source: Florida TaxWatch from U.S. Department of Commerce data, April 2015. Figures may not add to 100% due to rounding.
* “Other” license category includes hunting & fishing, alcoholic beverage, utilities, and amusement licenses.
** All-state averages include Florida.
**
*
*

- 34 - - 35 -
state cigarette tax ratescents per pacK, january 2015
1 New York 435 26 Florida 133.9
2 Massachusetts 351 27 Oregon 131
3 Rhode Island 350 28 Ohio 125
4 Connecticut 340 29 Arkansas 115
5 Hawaii 320 30 Oklahoma 103
6 Washington 302.5 31 Indiana 99.5
7 Minnesota 290 32 California 87
8 Vermont 275 33 Colorado 84
9 New Jersey 270 34 Nevada 80
10 Wisconsin 252 35 Kansas 79
11 Alaska 200 36 Mississippi 68
11 Arizona 200 37 Nebraska 64
11 Maine 200 38 Tennessee 62
11 Maryland 200 39 Kentucky 60
11 Michigan 200 39 Wyoming 60
16 Illinois 198 41 Idaho 57
17 N. Hampshire 178 41 S. Carolina 57
18 Montana 170 43 West Virginia 55
18 Utah 170 44 N. Carolina 45
20 New Mexico 166 45 N. Dakota 44
21 Delaware 160 46 Alabama 42.5
21 Pennsylvania 160 47 Georgia 37
23 S. Dakota 153 48 Louisiana 36
24 Texas 141 49 Virginia 30
25 Iowa 136 50 Missouri 17
u.s. median 136
Source: Florida TaxWatch from Federation of Tax Administrators and U.S. Department of Commerce data, April 2015.
Tax rates based on a standard 20 cigarette pack. Alabama, Alaska, Illinois, Missouri, New York City, Ohio, Tennessee and Virginia have some local cigarette taxes.
state tax rates on beerdollars per gallon, january 2015
1 Tennessee2 $1.29 26 Connecticut $0.23
2 Alaska $1.07 27 Illinois $0.23
3 Alabama $1.05 28 Michigan $0.20
4 Georgia $1.01 29 California $0.20
5 Hawaii $0.93 30 Texas $0.20
6 Kentucky $0.83 31 Iowa $0.19
7 South Carolina $0.77 32 Kansas $0.18
8 North Carolina $0.62 33 Ohio $0.18
9 Maryland3 $0.49 34 West Virginia $0.18
10 Florida $0.48 35 Arizona $0.16
11 Minnesota3 $0.47 36 Nevada $0.16
12 Mississippi $0.43 37 Delaware $0.16
13 Utah $0.41 38 Idaho $0.15
14 New Mexico $0.41 39 New York $0.14
15 Oklahoma $0.40 40 Montana $0.14
16 North Dakota $0.39 41 New Jersey $0.12
17 Maine $0.35 42 Rhode Island1 $0.12
u.s. average $0.35 43 Indiana $0.12
18 Arkansas1,3 $0.34 44 Massachusetts $0.11
19 Louisiana $0.32 45 Oregon $0.08
20 Nebraska $0.31 46 Colorado $0.08
21 New Hampshire $0.30 47 Pennsylvania $0.08
22 South Dakota $0.27 48 Wisconsin $0.06
23 Vermont $0.27 49 Missouri $0.06
24 Washington $0.26 50 Wyoming $0.02
25 Virginia $0.26
Source: Distilled Spirits Council of the US, Tax Foundation, and Florida TaxWatch, April 2015.
Rates are those applicable to off-premises sales of 4.7% alcohol by volume distilled in 12 ounce containers.
1 Includes case fees and/or bottle fees which may vary with the size of container.
2 Includes the wholesale tax rate of 17%, converted into a gallonage excise tax rate.
3 Includes sales taxes specific to alcoholic beverage.

- 36 - - 37 -
state tax rates on spiritsdollars per gallon, january 2015
1 Kentucky2 $3.18 26 Arizona $0.84
2 Alaska $2.50 27 Connecticut $0.72
3 Florida $2.25 28 Oklahoma $0.72
4 Iowa $1.75 29 Nevada $0.70
5 Alabama $1.70 30 Oregon $0.67
6 New Mexico $1.70 31 Maine $0.60
7 Georgia $1.51 32 Massachusetts $0.55
8 Virginia $1.51 33 Vermont $0.55
9 Arkansas1,3 $1.42 34 Michigan $0.51
10 Rhode Island $1.40 35 Indiana $0.47
11 Illinois $1.39 36 Idaho $0.45
12 Hawaii $1.38 37 Missouri $0.42
13 Maryland3 $1.35 38 Ohio $0.32
14 Tennessee1 $1.27 39 Colorado $0.32
15 S. Dakota3 $1.27 40 Kansas $0.30
16 Minnesota1,3 $1.17 41 New York $0.30
17 S. Carolina $1.08 42 Wisconsin $0.25
18 N. Dakota $1.06 43 Texas $0.20
19 Montana $1.06 44 California $0.20
20 West Virginia $1.00 45 Louisiana $0.11
21 N. Carolina $1.00 Mississippi N/A
22 Delaware $0.97 N. Hampshire N/A
u.s. average $0.97 Pennsylvania N/A
23 Nebraska $0.95 Utah N/A
24 New Jersey $0.88 Wyoming N/A
25 Washington $0.87
Source: Distilled Spirits Council of the US, Tax Foundation and Florida TaxWatch, April 2015.
Rates are those applicable to off-premises sales of 11% alcohol by volume distilled in 750ml containers.
1 Includes case fees and/or bottle fees, which may vary with the size of container.
2 Includes the wholesale tax rate of 11%, converted into a gallonage excise tax rate.
3 Includes sales taxes specific to alcohol beverages.
N/A - Control states, where products may be subject to ad valorem markup and excise taxes.
1 Washington5,6 $35.22 1 Oregon $22.72
2 Alaska2 $12.80 2 Virginia $19.18
3 Minnesota3,5 $8.59 3 Alabama $18.22
4 Illinois2 $8.55 4 Iowa $12.49
5 Kentucky4 $7.35 5 N. Carolina $12.30
6 Arkansas3,5 $6.57 6 Utah $12.18
7 Florida2 $6.50 7 Michigan $11.90
8 New York2 $6.44 control avg. $11.27
9 New Mexico $6.06 8 Idaho $10.90
10 Hawaii $5.98 9 Montana $9.74
license avg. $5.84 10 Ohio $9.34
11 Oklahoma $5.56 11 Vermont $7.68
12 New Jersey $5.50 12 Mississippi $7.46
13 S. Carolina3 $5.42 13 Pennsylvania $7.20
14 Connecticut2 $5.40 14 Maine $5.79
15 Rhode Island2 $5.40 15 West Virginia $1.89
16 N. Dakota2,5 $4.66 16 N. Hampshire $0.00
17 S. Dakota2,5 $4.63 17 Wyoming $0.00
18 Maryland2,5 $4.62 Source: Distilled Spirits Council of the US, Tax Foundation and Florida TaxWatch, April 2015.
Rates are those applicable to off-premise sales of 40% alcohol by volume distilled spirits in 750ml containers.
1 In control states (where government controls sales) products are subject to ad valorem and excise taxes.
2 Different rates also applicable according to alcohol content, place of production, size of container, and place purchased.
3 Includes case fees and/or bottle fees which may vary with the size of container.
4 Includes the wholesale tax rate of 11%, converted into a gallonage excise tax rate.
5 Includes sales taxes specific to alcoholic beverage.
6 Includes the retail (17%) and distributor (10%) license fees, converted into a gallonage excise tax rate.
19 Tennessee3 $4.46
20 Massachusetts2 $4.05
21 Georgia2 $3.79
22 Delaware2 $3.75
23 Nebraska $3.75
24 Nevada2 $3.60
25 California2 $3.30
26 Wisconsin $3.25
27 Arizona $3.00
28 Indiana2 $2.68
29 Kansas $2.50
30 Louisiana2 $2.50
31 Texas2 $2.40
32 Colorado $2.28
33 Missouri $2.00
license states control states1
state tax rates on table winedollars per gallon, january 2015
- 38 - - 39 -
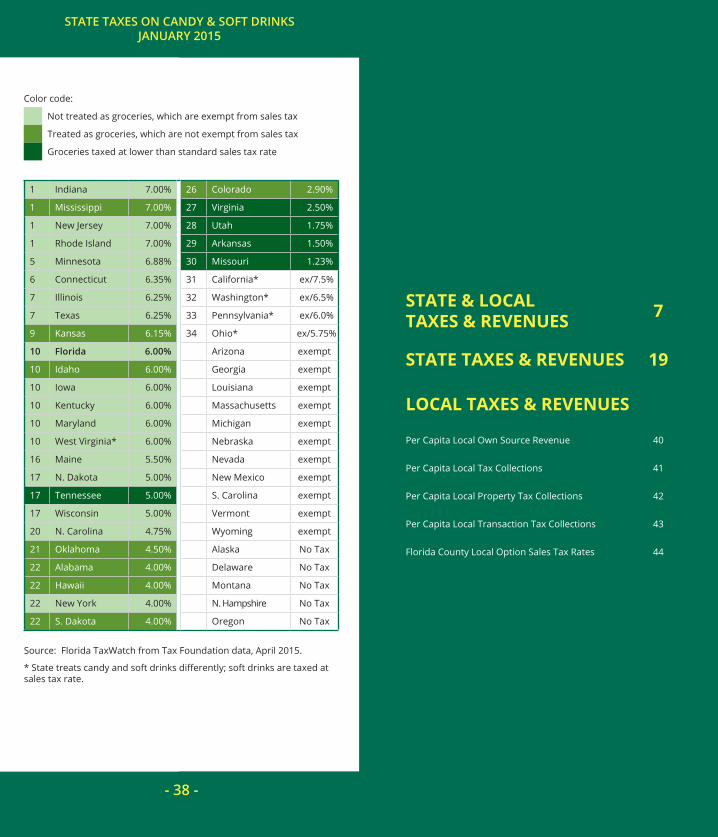
state taxes on candy & soft drinKsjanuary 2015
Color code:
Not treated as groceries, which are exempt from sales tax
Treated as groceries, which are not exempt from sales tax
Groceries taxed at lower than standard sales tax rate
1 Indiana 7.00% 26 Colorado 2.90%
1 Mississippi 7.00% 27 Virginia 2.50%
1 New Jersey 7.00% 28 Utah 1.75%
1 Rhode Island 7.00% 29 Arkansas 1.50%
5 Minnesota 6.88% 30 Missouri 1.23%
6 Connecticut 6.35% 31 California* ex/7.5%
7 Illinois 6.25% 32 Washington* ex/6.5%
7 Texas 6.25% 33 Pennsylvania* ex/6.0%
9 Kansas 6.15% 34 Ohio* ex/5.75%
10 florida 6.00% Arizona exempt
10 Idaho 6.00% Georgia exempt
10 Iowa 6.00% Louisiana exempt
10 Kentucky 6.00% Massachusetts exempt
10 Maryland 6.00% Michigan exempt
10 West Virginia* 6.00% Nebraska exempt
16 Maine 5.50% Nevada exempt
17 N. Dakota 5.00% New Mexico exempt
17 Tennessee 5.00% S. Carolina exempt
17 Wisconsin 5.00% Vermont exempt
20 N. Carolina 4.75% Wyoming exempt
21 Oklahoma 4.50% Alaska No Tax
22 Alabama 4.00% Delaware No Tax
22 Hawaii 4.00% Montana No Tax
22 New York 4.00% N. Hampshire No Tax
22 S. Dakota 4.00% Oregon No Tax
Source: Florida TaxWatch from Tax Foundation data, April 2015.
* State treats candy and soft drinks differently; soft drinks are taxed at sales tax rate.
STaTe & LocaL TaxeS & revenueS 7
STaTe TaxeS & revenueS 19
LocaL TaxeS & revenueS
Per Capita Local Own Source Revenue 40
Per Capita Local Tax Collections 41
Per Capita Local Property Tax Collections 42
Per Capita Local Transaction Tax Collections 43
Florida County Local Option Sales Tax Rates 44
- 40 - - 41 -
1 New York $5,466 26 Virginia $2,565
2 Wyoming $4,811 27 Oregon $2,551
3 New Jersey $3,706 28 N. Carolina $2,505
4 Alaska $3,511 29 Missouri $2,489
5 Colorado $3,431 30 Nevada $2,448
6 California $3,315 31 N. Dakota $2,434
7 Illinois $3,178 32 S. Dakota $2,369
8 Nebraska $3,150 33 Maine $2,302
9 Connecticut $3,063 34 Indiana $2,277
10 Iowa $3,045 35 Tennessee $2,247
11 Washington $3,042 36 Mississippi $2,233
12 Florida $3,024 37 Alabama $2,210
u.s. average $2,937 38 Arizona $2,196
13 Maryland $2,897 39 Michigan $2,147
14 Kansas $2,884 40 Utah $2,090
15 Texas $2,827 41 Oklahoma $1,982
16 Louisiana $2,808 42 Montana $1,976
17 Rhode Island $2,760 43 Hawaii $1,830
18 N. Hampshire $2,733 44 Idaho $1,827
19 Massachusetts $2,729 45 Kentucky $1,799
20 Ohio $2,700 46 New Mexico $1,770
21 S. Carolina $2,663 47 West Virginia $1,573
22 Minnesota $2,658 48 Delaware $1,500
23 Pennsylvania $2,655 49 Arkansas $1,251
24 Georgia $2,607 50 Vermont $1,229
25 Wisconsin $2,592
Source: Florida TaxWatch from U.S. Department of Commerce data, April 2015. Some rankings appear to be equal due to rounding.
*For definition of Own Source Revenue, see page 3.
florida History ranK amount % of us average
2012 12 $3,024 103.0%
2011 7 $3,111 107.6%
2009 6 $3,451 119.0%
2006 6 $2,955 113.9%
2002 8 $2,272 109.3%
per capita local own source* revenue fy2012
1 New York $4,099 26 Missouri $1,597
2 New Jersey $2,979 27 Georgia $1,580
3 Connecticut $2,656 28 Oregon $1,565
4 Illinois $2,349 29 N. Dakota $1,452
5 N. Hampshire $2,321 30 Arizona $1,412
6 Rhode Island $2,282 31 Minnesota $1,408
7 Wyoming $2,263 32 Nevada $1,405
8 Maryland $2,235 33 Hawaii $1,367
9 Alaska $2,227 34 S. Carolina $1,326
10 Massachusetts $2,144 35 Utah $1,321
11 Colorado $2,119 36 Indiana $1,254
12 Nebraska $2,033 37 Michigan $1,246
13 Texas $1,899 38 Tennessee $1,244
14 Pennsylvania $1,888 39 N. Carolina $1,210
u.s. average $1,885 40 New Mexico $1,182
15 Virginia $1,844 41 Oklahoma $1,168
16 Wisconsin $1,837 42 Montana $1,161
17 Iowa $1,834 43 Alabama $1,074
18 Ohio $1,810 44 Kentucky $1,034
19 California $1,808 45 West Virginia $957
20 Maine $1,777 46 Idaho $932
21 Kansas $1,768 47 Delaware $930
22 Louisiana $1,734 48 Mississippi $925
23 Washington $1,722 49 Vermont $731
24 S. Dakota $1,656 50 Arkansas $715
25 Florida $1,644
Source: Florida TaxWatch from U.S. Department of Commerce data, April 2015. Some rankings appear to be equal due to rounding.
florida History ranK amount % of us average
2012 25 $1,644 87.2%
2011 22 $1,714 93.0%
2009 11 $1,962 106.6%
2006 16 $1,631 99.3%
2002 21 $1,171 90.9%
per capita local tax collections fy2012

- 42 - - 43 -
1 New Jersey $2,921 26 Michigan $1,151
2 Connecticut $2,624 27 N. Dakota $1,139
3 New York $2,432 28 Montana $1,121
4 N. Hampshire $2,297 29 Washington $1,068
5 Rhode Island $2,228 30 Georgia $1,043
6 Massachusetts $2,058 31 S. Carolina $1,037
7 Illinois $1,979 32 Indiana $993
8 Alaska $1,776 33 Nevada $953
9 Maine $1,760 34 Missouri $952
10 Wyoming $1,753 35 Hawaii $946
11 Wisconsin $1,731 36 Utah $945
12 Nebraska $1,598 37 Arizona $935
13 Texas $1,558 38 N. Carolina $917
14 Iowa $1,478 39 Idaho $876
15 Virginia $1,387 40 Mississippi $862
u.s. average $1,386 41 Tennessee $799
16 Colorado $1,348 42 Louisiana $781
17 Kansas $1,338 43 West Virginia $770
18 Pennsylvania $1,335 44 Delaware $763
19 Minnesota $1,315 45 Vermont $686
20 California $1,306 46 New Mexico $656
21 Oregon $1,292 47 Oklahoma $603
22 Florida $1,279 48 Kentucky $594
23 Maryland $1,244 49 Alabama $464
24 S. Dakota $1,216 50 Arkansas $320
25 Ohio $1,174
Source: Florida TaxWatch from U.S. Department of Commerce data, April 2015. Some rankings appear to be equal due to rounding.
florida History ranK amount % of us average
2012 22 $1,279 92.3%
2011 18 $1,359 98.9%
2009 12 $1,600 117.3%
2006 13 $1,269 107.4%
2003 20 $922 98.3%
per capita local property tax collections, fy2012
1 Louisiana $911 26 N. Dakota $261
2 New York $779 27 N. Carolina $260
3 Colorado $681 28 Nebraska $211
4 Oklahoma $545 29 Ohio $176
5 Washington $539 30 S. Carolina $139
6 Georgia $499 31 Kentucky $131
7 New Mexico $498 32 Maryland $130
8 Missouri $472 33 Pennsylvania $96
9 Alabama $452 34 Oregon $96
10 Wyoming $427 35 Wisconsin $75
11 Arizona $414 36 West Virginia $67
12 S. Dakota $403 37 Minnesota $57
13 Alaska $403 38 Massachusetts $46
14 Kansas $394 39 Mississippi $35
15 California $385 40 Indiana $33
16 Arkansas $384 41 Vermont $28
17 Tennessee $382 42 Michigan $27
18 Nevada $344 43 Rhode Island $24
19 Utah $331 44 New Jersey $18
20 Illinois $314 45 Delaware $15
u.s. average $314 46 Idaho $15
21 Texas $307 47 Montana $8
22 Virginia $301 48 Maine $5
23 Iowa $301 Connecticut No Tax
24 Florida $284 N. Hampshire No Tax
25 Hawaii $284
Source: Florida TaxWatch from U.S. Department of Commerce data, April 2015. Some rankings appear to be equal due to rounding.
florida History ranK amount % of us average
2012 24 $284 90.4%
2011 24 $274 91.6%
2009 25 $263 88.9%
2006 23 $259 96.6%
2003 22 $209 97.2%
per capita local transaction tax collections, fy2012
- 44 - - 45 -
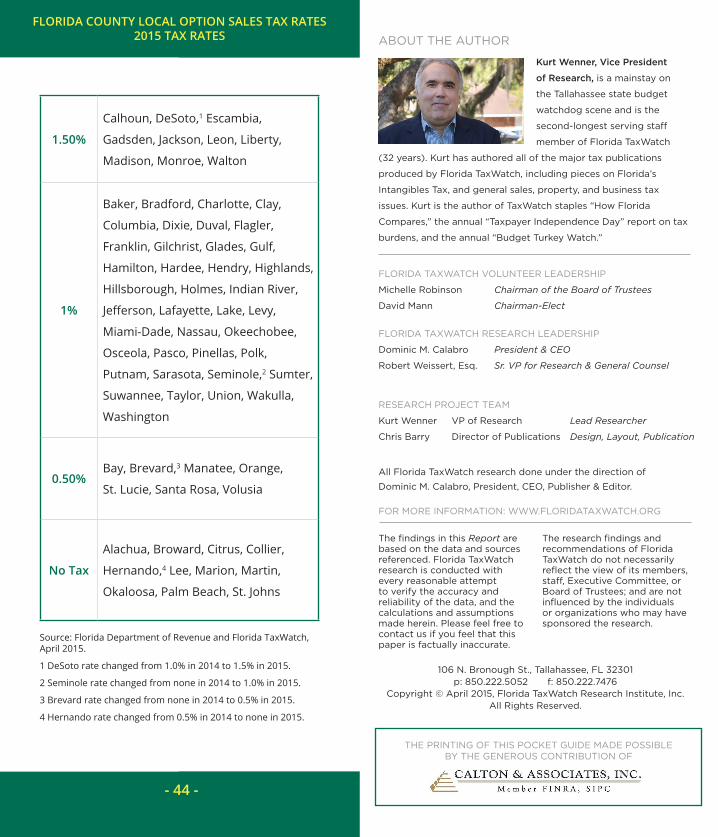
1.50%
Calhoun, DeSoto,1 Escambia,
Gadsden, Jackson, Leon, Liberty,
Madison, Monroe, Walton
1%
Baker, Bradford, Charlotte, Clay,
Columbia, Dixie, Duval, Flagler,
Franklin, Gilchrist, Glades, Gulf,
Hamilton, Hardee, Hendry, Highlands,
Hillsborough, Holmes, Indian River,
Jefferson, Lafayette, Lake, Levy,
Miami-Dade, Nassau, Okeechobee,
Osceola, Pasco, Pinellas, Polk,
Putnam, Sarasota, Seminole,2 Sumter,
Suwannee, Taylor, Union, Wakulla,
Washington
0.50%Bay, Brevard,3 Manatee, Orange,
St. Lucie, Santa Rosa, Volusia
no tax
Alachua, Broward, Citrus, Collier,
Hernando,4 Lee, Marion, Martin,
Okaloosa, Palm Beach, St. Johns
florida county local option sales tax rates 2015 tax rates
Source: Florida Department of Revenue and Florida TaxWatch, April 2015.
1 DeSoto rate changed from 1.0% in 2014 to 1.5% in 2015.
2 Seminole rate changed from none in 2014 to 1.0% in 2015.
3 Brevard rate changed from none in 2014 to 0.5% in 2015.
4 Hernando rate changed from 0.5% in 2014 to none in 2015.
Kurt Wenner, Vice President
of Research, is a mainstay on
the Tallahassee state budget
watchdog scene and is the
second-longest serving staff
member of Florida TaxWatch
(32 years). Kurt has authored all of the major tax publications
produced by Florida TaxWatch, including pieces on Florida’s
Intangibles Tax, and general sales, property, and business tax
issues. Kurt is the author of TaxWatch staples “How Florida
Compares,” the annual “Taxpayer Independence Day” report on tax
burdens, and the annual “Budget Turkey Watch.”
ABOUT THE AUTHOR
FLORIDA TAXWATCH VOLUNTEER LEADERSHIP
Michelle Robinson Chairman of the Board of Trustees
David Mann Chairman-Elect
FLORIDA TAXWATCH RESEARCH LEADERSHIP
Dominic M. Calabro President & CEO
Robert Weissert, Esq. Sr. VP for Research & General Counsel
RESEARCH PROJECT TEAM
Kurt Wenner VP of Research Lead Researcher
Chris Barry Director of Publications Design, Layout, Publication
All Florida TaxWatch research done under the direction of
Dominic M. Calabro, President, CEO, Publisher & Editor.
FOR MORE INFORMATION: WWW.FLORIDATAXWATCH.ORG
The findings in this Report are based on the data and sources referenced. Florida TaxWatch research is conducted with every reasonable attempt to verify the accuracy and reliability of the data, and the calculations and assumptions made herein. Please feel free to contact us if you feel that this paper is factually inaccurate.
The research findings and recommendations of Florida TaxWatch do not necessarily reflect the view of its members, staff, Executive Committee, or Board of Trustees; and are not influenced by the individuals or organizations who may have sponsored the research.
106 N. Bronough St., Tallahassee, FL 32301 p: 850.222.5052 f: 850.222.7476
Copyright © April 2015, Florida TaxWatch Research Institute, Inc. All Rights Reserved.
ABOUT TAXWATCHAs an independent, nonpartisan,
nonprofit taxpayer research institute
and government watchdog, it is the
mission of Florida TaxWatch to provide
the citizens of Florida and public
officials with high quality, independent
research and analysis of issues related
to state and local government taxation,
expenditures, policies, and programs.
Florida TaxWatch works to improve
the productivity and accountability
of Florida government. Its research
recommends productivity enhancements
and explains the statewide impact
of fiscal and economic policies and
practices on citizens and businesses.
Florida TaxWatch is supported by
voluntary, tax-deductible memberships
and private grants, and does not accept
government funding. Memberships
provide a solid, lasting foundation that
has enabled Florida TaxWatch to bring
about a more effective, responsive
government that is accountable to the
citizens it serves since 1979.
THE PRINTING OF THIS POCKET GUIDE MADE POSSIBLE BY THE GENEROUS CONTRIBUTION OF

I WO
ULD
LIK
E T
O H
ELP
SU
PP
OR
T TH
E V
ALU
AB
LE W
OR
K O
F FL
OR
IDA
TA
XW
ATC
H
Enc
lose
d is
a g
ift
to e
nsur
e th
at I
rece
ive
the
2016
ed
itio
n o
f H
ow F
lori
da
Co
mp
ares
: Tax
es
$10
0 (
min
)$
250
$50
0$
1,00
0O
ther
Enc
lose
d is
my
chec
k, m
ade
pay
able
to
: F
lori
da
TaxW
atch
, 10
6 N
. Bro
noug
h S
t., T
alla
hass
ee, F
L 32
301
Ple
ase
char
ge
the
amo
unt
ind
icat
ed a
bov
e to
my:
VIS
AM
AS
TE
RC
AR
DA
ME
XD
ISC
OV
ER
Car
d #
:E
xp. D
ate:
CC
V #
:
Nam
e:
Ad
dre
ss:
Cit
y:
Sta
te:
Z
ip:
PLE
AS
E S
EN
D M
E E
MA
ILS
AB
OU
T N
EW
RE
SE
AR
CH
I wo
uld
like
to
ord
er a
dd
itio
nal c
op
ies
of
this
ed
itio
n o
f H
ow F
lori
da
Co
mp
ares
$30
fo
r 10
co
pie
s$
125
for
50 c
op
ies
$20
0 f
or
100
co
pie
s
Flo
rid
a Ta
xWat
ch is
a 5
01(
c)(3
) no
npro
fit
org
aniz
atio
n. Y
our
gif
t is
tax
-ded
ucti
ble
to
the
max
imum
allo
wed
by
law
.
106 N. BRONOUGH ST., TALLAHASSEE, FL 32301
P: 850.222.5052 F: 850.222.7476
COPYRIGHT © APRIL 2015, FLORIDA TAXWATCH RESEARCH INSTITUTE, INC.
ALL RIGHTS RESERVED.