FLORIDA DEPARTMENT OF TRANSPORTATION LIMITED ENGLISH ... · PDF file1 FLORIDA DEPARTMENT OF...
14
1 FLORIDA DEPARTMENT OF TRANSPORTATION LIMITED ENGLISH PROFICIENCY (LEP) GUIDANCE Title VI of the Civil Rights Act of 1964, The Civil Rights Restoration Act of 1987; 42 USC 2000(d) to 2000-4; and Executive Order 13166 prohibit recipients of federal financial assistance from discriminating against individuals based on race, color and national origin. Other federal and state nondiscrimination regulations prohibit discrimination against individuals based on age, sex, disability, religion, and family or income status. The Florida Department of Transportation (FDOT), as a recipient of federal financial assistance, takes reasonable steps to ensure meaningful access to its programs, services and activities for all citizens including those individuals with limited English proficiency. Individuals who do not speak English as their primary language and who have a limited ability to read, speak, write, or understand English may be considered Limited English Proficient (LEP). The FDOT interacts with persons who may be LEP in the administration of its programs, services and activities. This guidance ensures that LEP individuals are provided meaningful access to the FDOT’s programs, services and activities. LEP services can be provided in two ways: verbal interpretation and written translation of vital documents. Florida is a richly diverse state with residents and visitors from all over the world. FDOT’s own staff is representative of that diversity and has competent language speakers of a variety of languages. FDOT does provide verbal interpretation with reasonable notice, regardless of the LEP language. FDOT’s public advertisements clearly state that language services are available with specified notice. These advertisements are also routinely translated and posted both in minority publications and at public forums. FDOT also utilizes ‘I Speak’ cards to help identify language needs and match them to LEP services. Finally, most of FDOT’s public meetings have staff members available who are competent speakers of the most frequently encountered languages in the FDOT district where the meeting is being held. Written translation of vital documents is handled somewhat differently. The Department of Justice (DOJ) LEP Guidance requires that four (4) factors be considered when deciding whether written LEP services are required: The number or proportion of LEP persons in the eligible service population; The frequency with which LEP individuals come into contact with the program or activity; The importance of the service provided by the program; and The resources available.
Transcript of FLORIDA DEPARTMENT OF TRANSPORTATION LIMITED ENGLISH ... · PDF file1 FLORIDA DEPARTMENT OF...
1
FLORIDA DEPARTMENT OF TRANSPORTATION
LIMITED ENGLISH PROFICIENCY (LEP) GUIDANCE
Title VI of the Civil Rights Act of 1964, The Civil Rights Restoration Act of 1987; 42 USC
2000(d) to 2000-4; and Executive Order 13166 prohibit recipients of federal financial
assistance from discriminating against individuals based on race, color and national
origin. Other federal and state nondiscrimination regulations prohibit discrimination
against individuals based on age, sex, disability, religion, and family or income status.
The Florida Department of Transportation (FDOT), as a recipient of federal financial
assistance, takes reasonable steps to ensure meaningful access to its programs,
services and activities for all citizens including those individuals with limited English
proficiency. Individuals who do not speak English as their primary language and who
have a limited ability to read, speak, write, or understand English may be considered
Limited English Proficient (LEP).
The FDOT interacts with persons who may be LEP in the administration of its programs,
services and activities. This guidance ensures that LEP individuals are provided
meaningful access to the FDOT’s programs, services and activities.
LEP services can be provided in two ways: verbal interpretation and written translation
of vital documents. Florida is a richly diverse state with residents and visitors from all
over the world. FDOT’s own staff is representative of that diversity and has competent
language speakers of a variety of languages. FDOT does provide verbal interpretation
with reasonable notice, regardless of the LEP language. FDOT’s public
advertisements clearly state that language services are available with specified notice.
These advertisements are also routinely translated and posted both in minority
publications and at public forums. FDOT also utilizes ‘I Speak’ cards to help identify
language needs and match them to LEP services. Finally, most of FDOT’s public
meetings have staff members available who are competent speakers of the most
frequently encountered languages in the FDOT district where the meeting is being held.
Written translation of vital documents is handled somewhat differently. The
Department of Justice (DOJ) LEP Guidance requires that four (4) factors be considered
when deciding whether written LEP services are required:
The number or proportion of LEP persons in the eligible service population;
The frequency with which LEP individuals come into contact with the program or
activity;
The importance of the service provided by the program; and
The resources available.
2
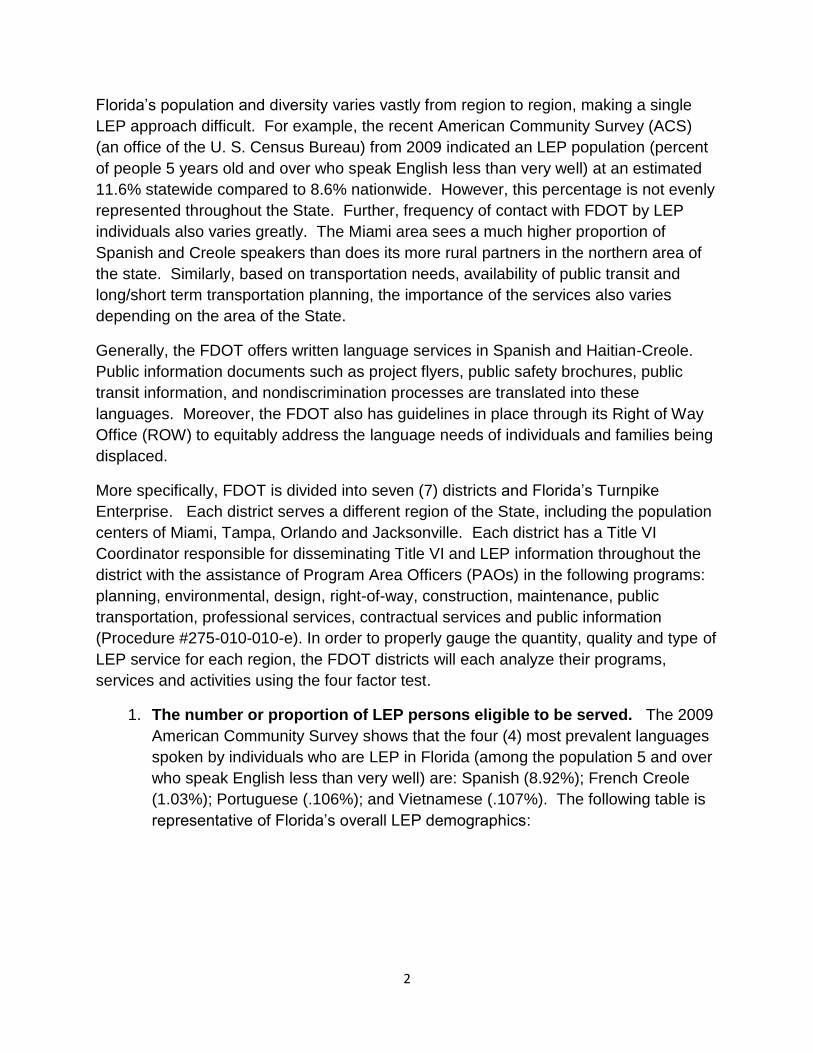
Florida’s population and diversity varies vastly from region to region, making a single
LEP approach difficult. For example, the recent American Community Survey (ACS)
(an office of the U. S. Census Bureau) from 2009 indicated an LEP population (percent
of people 5 years old and over who speak English less than very well) at an estimated
11.6% statewide compared to 8.6% nationwide. However, this percentage is not evenly
represented throughout the State. Further, frequency of contact with FDOT by LEP
individuals also varies greatly. The Miami area sees a much higher proportion of
Spanish and Creole speakers than does its more rural partners in the northern area of
the state. Similarly, based on transportation needs, availability of public transit and
long/short term transportation planning, the importance of the services also varies
depending on the area of the State.
Generally, the FDOT offers written language services in Spanish and Haitian-Creole.
Public information documents such as project flyers, public safety brochures, public
transit information, and nondiscrimination processes are translated into these
languages. Moreover, the FDOT also has guidelines in place through its Right of Way
Office (ROW) to equitably address the language needs of individuals and families being
displaced.
More specifically, FDOT is divided into seven (7) districts and Florida’s Turnpike
Enterprise. Each district serves a different region of the State, including the population
centers of Miami, Tampa, Orlando and Jacksonville. Each district has a Title VI
Coordinator responsible for disseminating Title VI and LEP information throughout the
district with the assistance of Program Area Officers (PAOs) in the following programs:
planning, environmental, design, right-of-way, construction, maintenance, public
transportation, professional services, contractual services and public information
(Procedure #275-010-010-e). In order to properly gauge the quantity, quality and type of
LEP service for each region, the FDOT districts will each analyze their programs,
services and activities using the four factor test.
1. The number or proportion of LEP persons eligible to be served. The 2009
American Community Survey shows that the four (4) most prevalent languages
spoken by individuals who are LEP in Florida (among the population 5 and over
who speak English less than very well) are: Spanish (8.92%); French Creole
(1.03%); Portuguese (.106%); and Vietnamese (.107%). The following table is
representative of Florida’s overall LEP demographics:
3
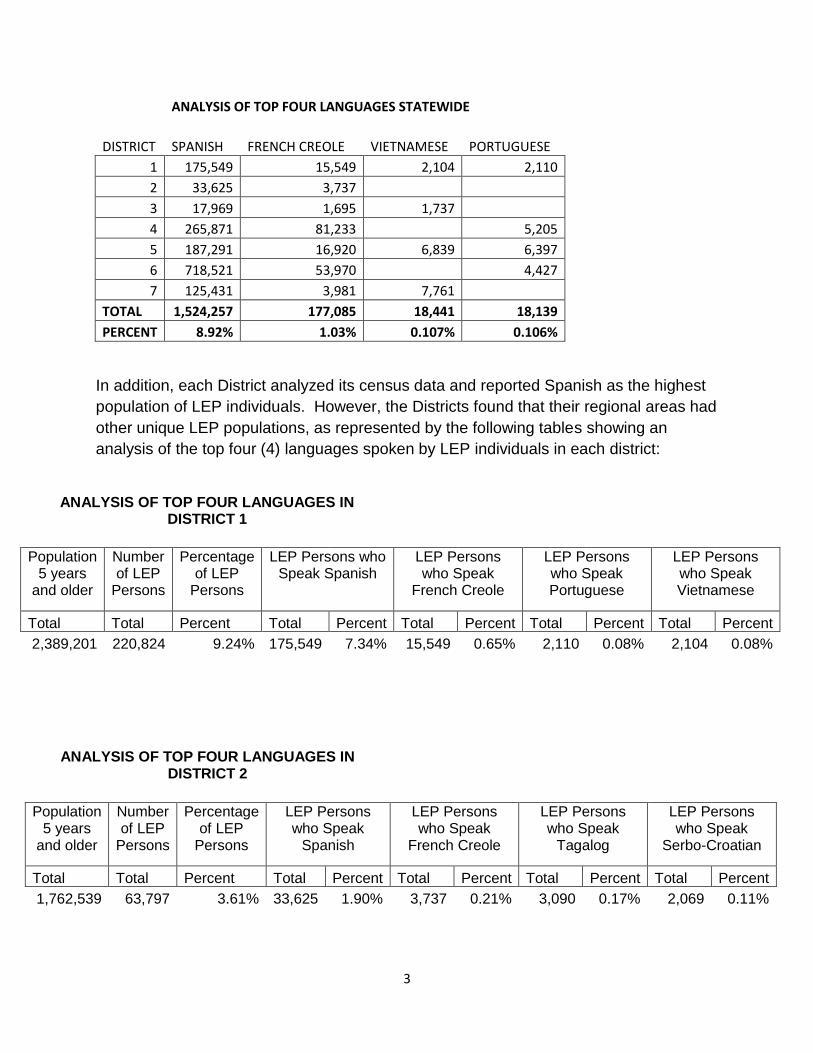
ANALYSIS OF TOP FOUR LANGUAGES STATEWIDE
DISTRICT SPANISH FRENCH CREOLE VIETNAMESE PORTUGUESE
1 175,549 15,549 2,104 2,110
2 33,625 3,737
3 17,969 1,695 1,737
4 265,871 81,233 5,205
5 187,291 16,920 6,839 6,397
6 718,521 53,970 4,427
7 125,431 3,981 7,761
TOTAL 1,524,257 177,085 18,441 18,139
PERCENT 8.92% 1.03% 0.107% 0.106%
In addition, each District analyzed its census data and reported Spanish as the highest
population of LEP individuals. However, the Districts found that their regional areas had
other unique LEP populations, as represented by the following tables showing an
analysis of the top four (4) languages spoken by LEP individuals in each district:
ANALYSIS OF TOP FOUR LANGUAGES IN DISTRICT 1
Population 5 years
and older
Number of LEP
Persons
Percentage of LEP
Persons
LEP Persons who Speak Spanish
LEP Persons who Speak
French Creole
LEP Persons who Speak Portuguese
LEP Persons who Speak Vietnamese
Total Total Percent Total Percent Total Percent Total Percent Total Percent
2,389,201 220,824 9.24% 175,549 7.34% 15,549 0.65% 2,110 0.08% 2,104 0.08%
ANALYSIS OF TOP FOUR LANGUAGES IN DISTRICT 2
Population 5 years
and older
Number of LEP
Persons
Percentage of LEP
Persons
LEP Persons who Speak
Spanish
LEP Persons who Speak
French Creole
LEP Persons who Speak
Tagalog
LEP Persons who Speak
Serbo-Croatian
Total Total Percent Total Percent Total Percent Total Percent Total Percent
1,762,539 63,797 3.61% 33,625 1.90% 3,737 0.21% 3,090 0.17% 2,069 0.11%

4
ANALYSIS OF TOP FOUR LANGUAGES IN DISTRICT 3
Population 5 years
and older
Number of LEP
Persons
Percentage of LEP
Persons
LEP Persons who Speak
Spanish
LEP Persons who Speak Vietnamese
LEP Persons who Speak
Tagalog
LEP Persons who Speak
French Creole
Total Total Percent Total Percent Total Percent Total Percent Total Percent
1,253,205 34,074 2.71% 17,969 1.43% 1,737 0.13% 1,709 0.13% 1,695 0.13%
ANALYSIS OF TOP FOUR LANGUAGES IN DISTRICT 4
Population 5 years
and older
Number of LEP
Persons
Percentage of LEP
Persons
LEP Persons who Speak Spanish
LEP Persons who Speak
French Creole
LEP Persons who Speak
Chinese
LEP Persons who Speak Portuguese
Total Total Percent Total Percent Total Percent Total Percent Total Percent
3,332,712 423,794 12.71% 265,871 7.97% 81,233 2.43% 6,361 0.19% 5,205 0.15%
ANALYSIS OF TOP FOUR LANGUAGES IN DISTRICT 5
Population 5 years
and older
Number of LEP
Persons
Percentage of LEP
Persons
LEP Persons who Speak Spanish
LEP Persons who Speak
French Creole
LEP Persons who Speak Vietnamese
LEP Persons who Speak Portuguese
Total Total Percent Total Percent Total Percent Total Percent Total Percent
3,309,395 259,078 7.82% 187,291 5.65% 16,920 0.51% 6,839 0.20% 6,397 0.19%
ANALYSIS OF TOP FOUR LANGUAGES IN DISTRICT 6
Population 5 years
and older
Number of LEP
Persons
Percentage of LEP
Persons
LEP Persons who Speak Spanish
LEP Persons who Speak
French Creole
LEP Persons who Speak Portuguese
LEP Persons who Speak
Chinese
Total Total Percent Total Percent Total Percent Total Percent Total Percent
2,358,564 800,348 33.93% 718,521 30.46% 53,970 2.28% 4,427 0.18% 3,568 0.15%
5
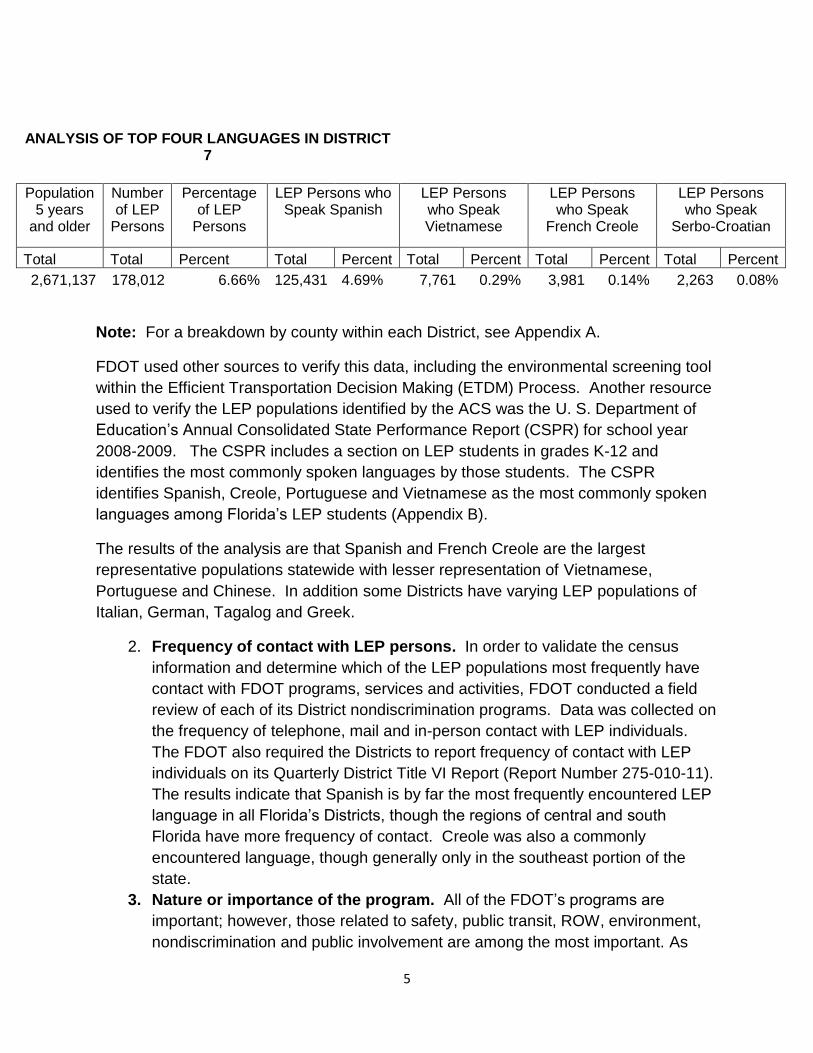
ANALYSIS OF TOP FOUR LANGUAGES IN DISTRICT 7
Population 5 years
and older
Number of LEP
Persons
Percentage of LEP
Persons
LEP Persons who Speak Spanish
LEP Persons who Speak Vietnamese
LEP Persons who Speak
French Creole
LEP Persons who Speak
Serbo-Croatian
Total Total Percent Total Percent Total Percent Total Percent Total Percent
2,671,137 178,012 6.66% 125,431 4.69% 7,761 0.29% 3,981 0.14% 2,263 0.08%
Note: For a breakdown by county within each District, see Appendix A.
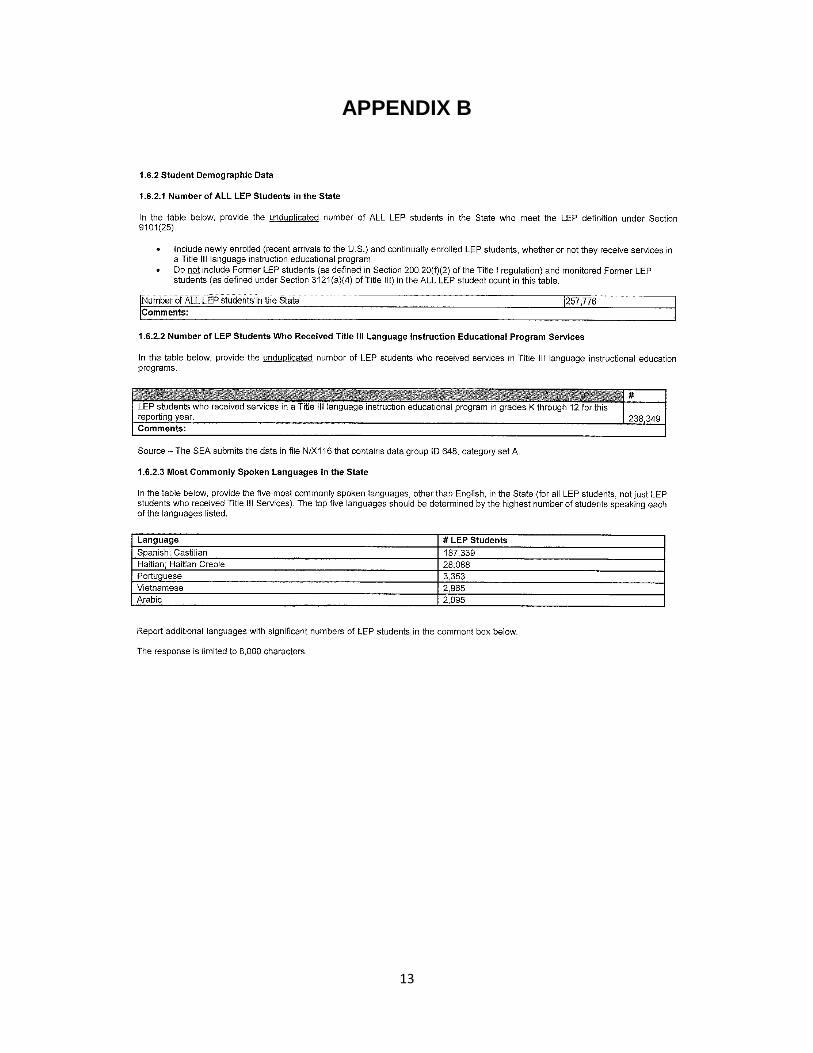
FDOT used other sources to verify this data, including the environmental screening tool
within the Efficient Transportation Decision Making (ETDM) Process. Another resource
used to verify the LEP populations identified by the ACS was the U. S. Department of
Education’s Annual Consolidated State Performance Report (CSPR) for school year
2008-2009. The CSPR includes a section on LEP students in grades K-12 and
identifies the most commonly spoken languages by those students. The CSPR
identifies Spanish, Creole, Portuguese and Vietnamese as the most commonly spoken
languages among Florida’s LEP students (Appendix B).
The results of the analysis are that Spanish and French Creole are the largest
representative populations statewide with lesser representation of Vietnamese,
Portuguese and Chinese. In addition some Districts have varying LEP populations of
Italian, German, Tagalog and Greek.
2. Frequency of contact with LEP persons. In order to validate the census
information and determine which of the LEP populations most frequently have
contact with FDOT programs, services and activities, FDOT conducted a field
review of each of its District nondiscrimination programs. Data was collected on
the frequency of telephone, mail and in-person contact with LEP individuals.
The FDOT also required the Districts to report frequency of contact with LEP
individuals on its Quarterly District Title VI Report (Report Number 275-010-11).
The results indicate that Spanish is by far the most frequently encountered LEP
language in all Florida’s Districts, though the regions of central and south
Florida have more frequency of contact. Creole was also a commonly
encountered language, though generally only in the southeast portion of the
state.
3. Nature or importance of the program. All of the FDOT’s programs are
important; however, those related to safety, public transit, ROW, environment,
nondiscrimination and public involvement are among the most important. As
6
such, publications and other material disseminated regarding these programs
are routinely available in both Spanish and French Creole. Nevertheless, the
FDOT is committed to providing meaningful access and will provide written
translation for any of its documents, when reasonable, effective and within the
available resources. In other cases, the FDOT will strive to provide alternative
but meaningful accessibility. Moreover, the FDOT continually evaluates its
programs, services and activities to ensure that persons who may be LEP are
always provided with meaningful access. For a list of publications/documents in
Spanish and French Creole, see Appendix C.
4. Resources available. The FDOT understands that it is a large entity serving a
potentially large number of Spanish and French Creole speaking individuals.
The FDOT makes every effort to make its programs, services and activities
accessible to LEP individuals. In addition to documents that are routinely
published in the most frequently encountered languages, the FDOT will use
available resources, both internal and external, to accommodate reasonable
requests for translation. Further, the FDOT’s policies require free oral
interpretation services, regardless of the language, with seven (7) days notice.
In addition, the FDOT has identified, developed and uses the following:
a. District lists of staff who volunteers to assist as interpreters and/or
translators if needed. Lists are verified and updated annually by the
District Title VI Coordinators and provided to the Statewide Title VI
Coordinator.
b. Individuals who have contact with the public are provided with “I Speak”
language cards to identify language needs in order to match them with
available services. Language cards are verified and distributed annually
by the District Title VI Coordinators.
c. The FDOT through the District Offices have developed partnerships with
local agencies, organizations, law enforcement, colleges/universities,
local school districts and social service agencies that are available to
assist with its LEP responsibilities.
d. A list of web based translation services for use, when required.
e. A list of telephone translation services for use, when required.
Safe Harbor Stipulation
Federal law provides a “Safe Harbor” stipulation so that recipients such as FDOT can
ensure with greater certainty that they comply with their obligations to provide written
translations in languages other than English. A “safe harbor” means that if a recipient
(FDOT) provides written translations in certain circumstances; such action will be
7
considered strong evidence of compliance with the FDOT’s written-translation
obligations under Title VI.
The failure to provide written translations under the circumstances does not mean there
is noncompliance, but rather provides a guide for recipients that would like greater
certainty of compliance that can be provided by a fact-intensive, four factor analysis.
For example, even if a safe harbor is not used, if written translation of a certain
document(s) would be so burdensome as to defeat the legitimate objectives of its
program, it is not necessary. Other ways of providing meaningful access, such as
effective oral interpretation of certain vital documents, might be acceptable under such
circumstances.
Strong evidence of compliance with the recipient’s written-translation obligations under
‘safe harbor’ includes providing written translations of vital documents for each eligible
LEP language group that constitutes 5% or 1,000, whichever is less, of the population of
person’s eligible to be served or likely to be affected or encountered. FDOT’s
translation of other documents, if needed, can be provided orally.
This safe harbor provision applies to the translation of written documents only. It does
not affect the requirement to provide meaningful access to LEP individuals through
competent oral interpreters where oral language services are needed and are
reasonable.
CONCLUSION:
FDOT recognizes that language needs will change as Florida’s population changes.
Further, FDOT is required to assess its programs and services each year to determine
compliance with various nondiscrimination regulations. As such, FDOT will revisit the
LEP plan each year and make appropriate changes, as needed. For questions or
concerns regarding the FDOT’s commitment to nondiscrimination or to request LEP
services, contact Michael Klump, Interim FDOT Statewide Title VI Coordinator at (850)
414-4764 or by email [email protected] .
8
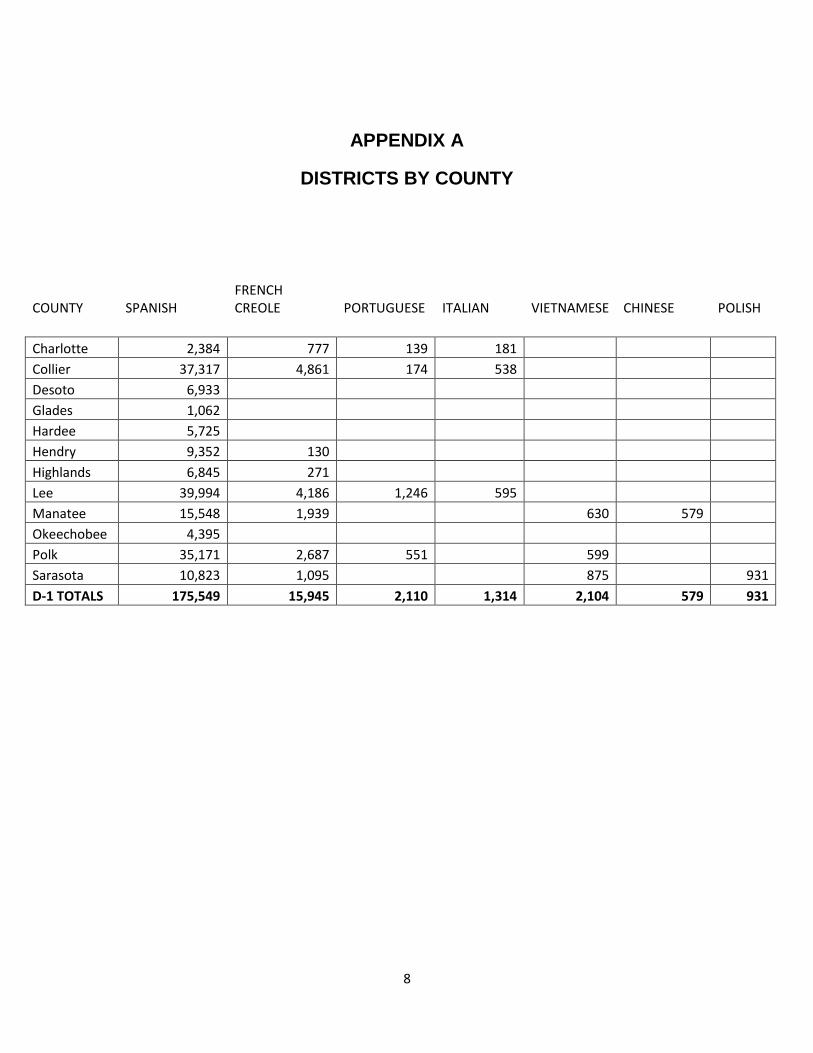
APPENDIX A
DISTRICTS BY COUNTY
COUNTY SPANISH FRENCH CREOLE PORTUGUESE ITALIAN VIETNAMESE CHINESE POLISH
Charlotte 2,384 777 139 181
Collier 37,317 4,861 174 538
Desoto 6,933
Glades 1,062
Hardee 5,725
Hendry 9,352 130
Highlands 6,845 271
Lee 39,994 4,186 1,246 595
Manatee 15,548 1,939 630 579
Okeechobee 4,395
Polk 35,171 2,687 551 599
Sarasota 10,823 1,095 875 931
D-1 TOTALS 175,549 15,945 2,110 1,314 2,104 579 931
9
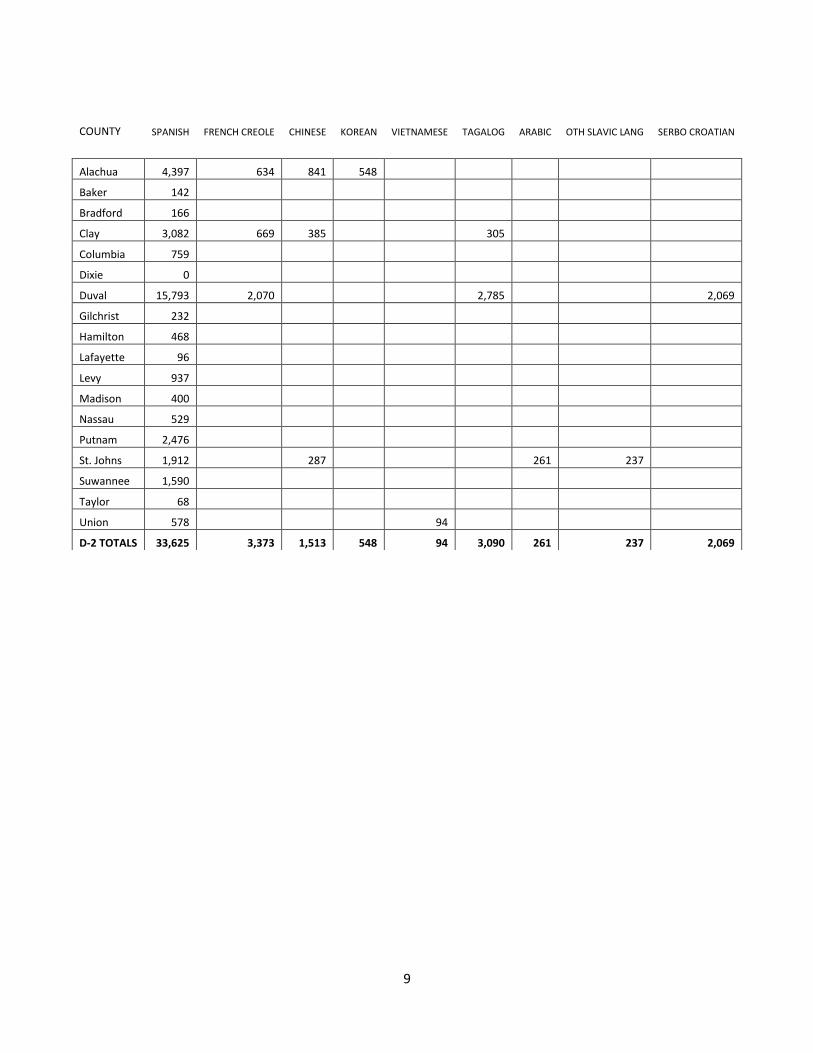
COUNTY SPANISH FRENCH CREOLE CHINESE KOREAN VIETNAMESE TAGALOG ARABIC OTH SLAVIC LANG SERBO CROATIAN
Alachua 4,397 634 841 548
Baker 142
Bradford 166
Clay 3,082 669 385 305
Columbia 759
Dixie 0
Duval 15,793 2,070 2,785 2,069
Gilchrist 232
Hamilton 468
Lafayette 96
Levy 937
Madison 400
Nassau 529
Putnam 2,476
St. Johns 1,912 287 261 237
Suwannee 1,590
Taylor 68
Union 578 94
D-2 TOTALS 33,625 3,373 1,513 548 94 3,090 261 237 2,069
10
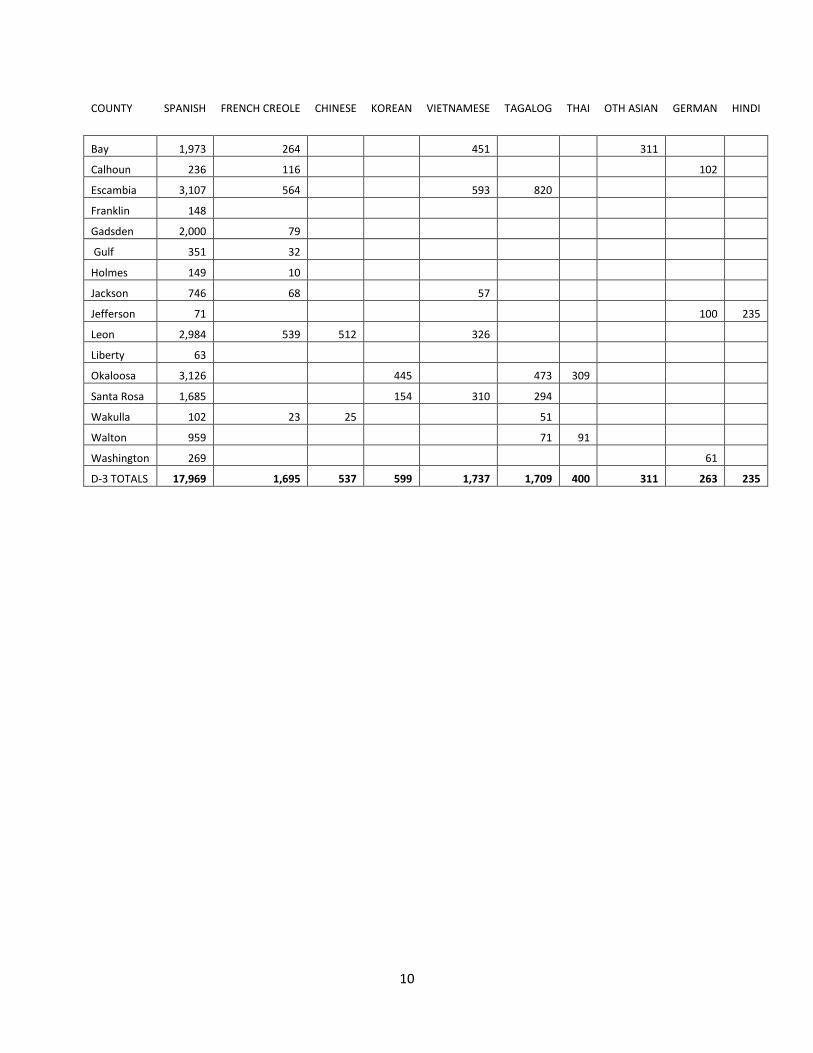
COUNTY SPANISH FRENCH CREOLE CHINESE KOREAN VIETNAMESE TAGALOG THAI OTH ASIAN GERMAN HINDI
Bay 1,973 264 451 311
Calhoun 236 116 102
Escambia 3,107 564 593 820
Franklin 148
Gadsden 2,000 79
Gulf 351 32
Holmes 149 10
Jackson 746 68 57
Jefferson 71 100 235
Leon 2,984 539 512 326
Liberty 63
Okaloosa 3,126 445 473 309
Santa Rosa 1,685 154 310 294
Wakulla 102 23 25 51
Walton 959 71 91
Washington 269 61
D-3 TOTALS 17,969 1,695 537 599 1,737 1,709 400 311 263 235
11
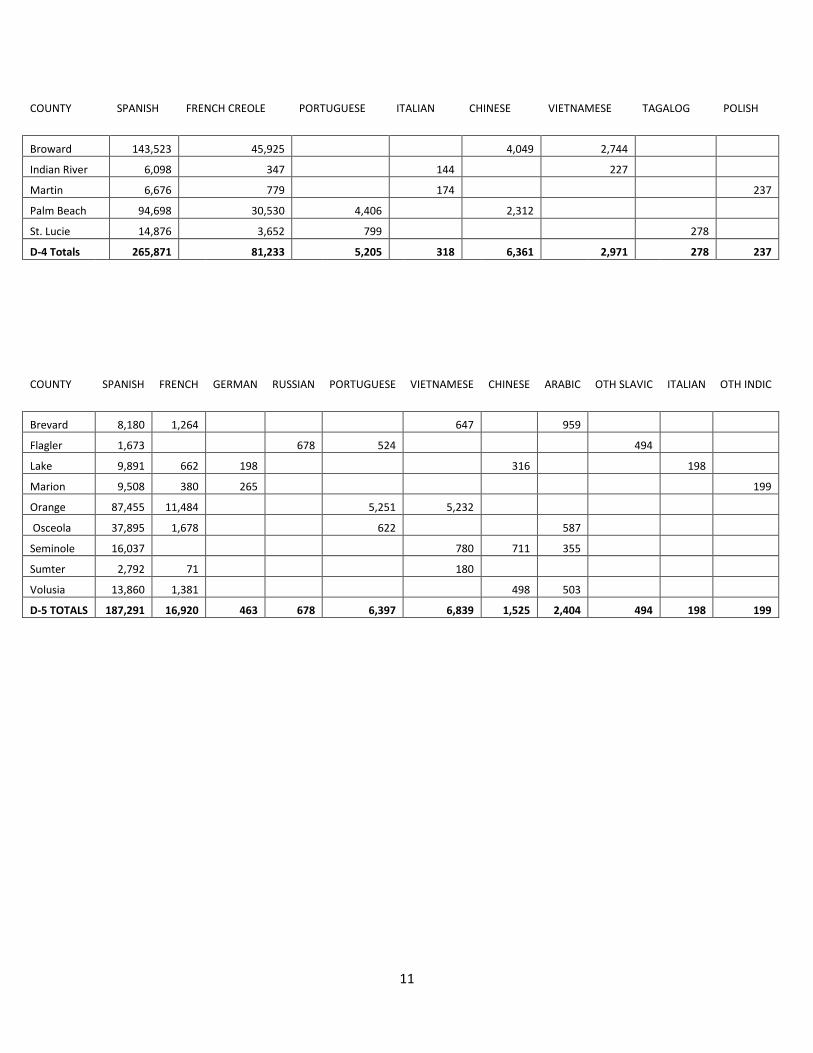
COUNTY SPANISH FRENCH CREOLE PORTUGUESE ITALIAN CHINESE VIETNAMESE TAGALOG POLISH
Broward 143,523 45,925 4,049 2,744
Indian River 6,098 347 144 227
Martin 6,676 779 174 237
Palm Beach 94,698 30,530 4,406 2,312
St. Lucie 14,876 3,652 799 278
D-4 Totals 265,871 81,233 5,205 318 6,361 2,971 278 237
COUNTY SPANISH FRENCH GERMAN RUSSIAN PORTUGUESE VIETNAMESE CHINESE ARABIC OTH SLAVIC ITALIAN OTH INDIC
Brevard 8,180 1,264 647 959
Flagler 1,673 678 524 494
Lake 9,891 662 198 316 198
Marion 9,508 380 265 199
Orange 87,455 11,484 5,251 5,232
Osceola 37,895 1,678 622 587
Seminole 16,037 780 711 355
Sumter 2,792 71 180
Volusia 13,860 1,381 498 503
D-5 TOTALS 187,291 16,920 463 678 6,397 6,839 1,525 2,404 494 198 199
12
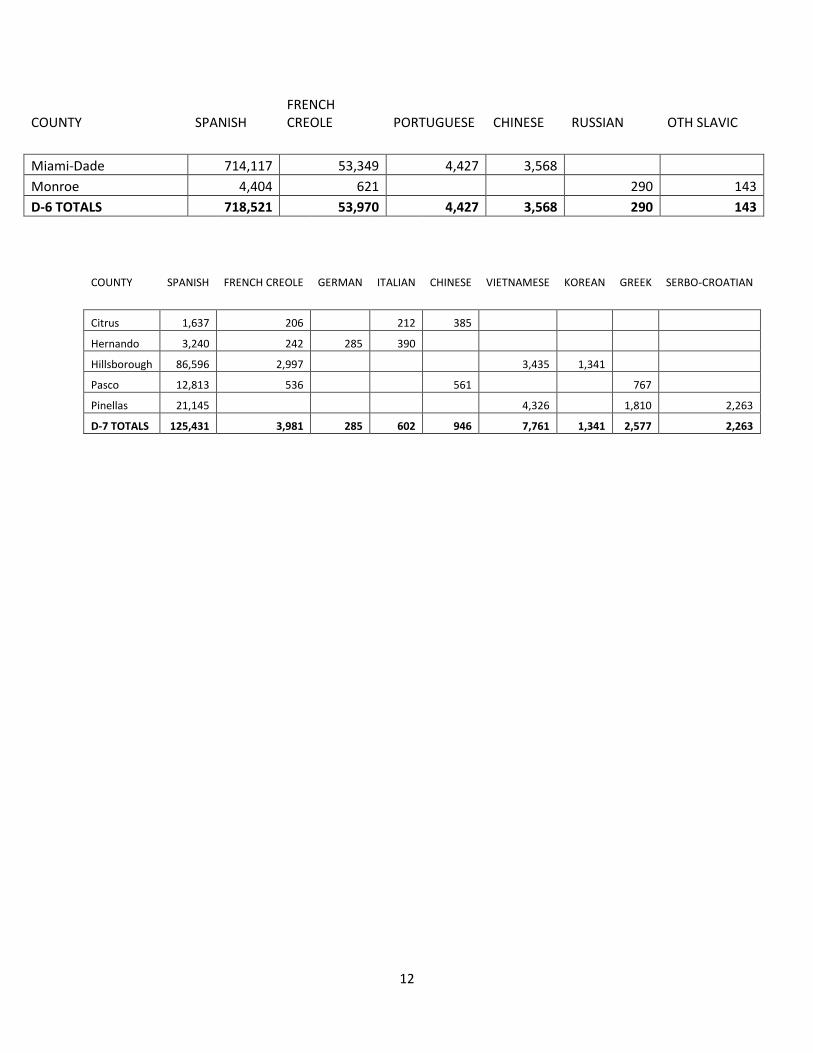
COUNTY SPANISH FRENCH CREOLE PORTUGUESE CHINESE RUSSIAN OTH SLAVIC
Miami-Dade 714,117 53,349 4,427 3,568
Monroe 4,404 621 290 143
D-6 TOTALS 718,521 53,970 4,427 3,568 290 143 COUNTY SPANISH FRENCH CREOLE GERMAN ITALIAN CHINESE VIETNAMESE KOREAN GREEK SERBO-CROATIAN
Citrus 1,637 206 212 385
Hernando 3,240 242 285 390
Hillsborough 86,596 2,997 3,435 1,341
Pasco 12,813 536 561 767
Pinellas 21,145 4,326 1,810 2,263
D-7 TOTALS 125,431 3,981 285 602 946 7,761 1,341 2,577 2,263
13
APPENDIX B
14
APPENDIX C
FDOT DOCUMENTS THAT HAVE BEEN TRANSLATED INTO OTHER
LANGUAGES
1. Title VI Policy (Spanish and Haitian Creole)
2. Title VI Complaint Form (Spanish and Haitian Creole)
3. Essential Right of Way Documents (Forms Library)